1. Introduction
Active remote sensing using differential absorption LIDAR (DIAL) [
1,
2,
3,
4] and integrated path differential absorption LIDAR (IP-DIAL) [
5,
6,
7,
8,
9] provides the necessary measurement precision and accuracy to study greenhouse gas (GHG) concentrations in the atmosphere. Of particular importance, the dry-air mixing ratios of the GHGs, CO
2 and CH
4, can be monitored on a global scale using satellites for climate studies [
10,
11,
12,
13] and with ground-based systems for local and large city emission studies [
14]. Airborne systems have been used to develop spaceborne platforms and to later calibrate ground-based and spaceborne sensors [
7,
15,
16,
17]. Largely overcoming the inherent limitations of passive systems [
18,
19], DIAL and IP-DIAL systems can provide the measurement data to study and assess the current state and dynamics of Earth’s ecosystem under GHG fluctuations.
Current DIAL and IP-DIAL system development for remote sensing of CO
2 and CH
4 focuses on the NIR (near infrared) spectral regions (1572 nm (CO
2), 1602 nm (CO
2), 1645 nm (CH
4), 2050 nm (CO
2)). The main technological challenges are the selection of a suitable laser source and detector, both of which have been the subject of numerous studies for current research systems over the past decade (see the overview given in [
9]). The latest developments for DIAL [
4] and IP-DIAL [
7,
9] systems make use of multiple frequencies to sample the absorption line profile and use subsequent spectral line shape fitting to obtain the GHG mixing ratios. This method is found here to be particularly suitable for complicated line shapes consisting of multiple underlying transitions (e.g., CH
4) and/or multi-species determinations (e.g., CH
4 or CO
2 and H
2O). Additional advantages have been realized in studies to and through clouds to enhance sensitivity. For example, previous IP-DIAL studies from aircraft measured 30 points across the CO
2 line shape to perform studies to cloud tops and through clouds to the surface [
7]. Cloud targets have also found importance in the specification of the overall spectral purity of the DIAL frequency converter from comparisons of the online and offline frequency returns [
20].
The work presented here demonstrates the application of a 10-frequency DIAL system to study GHG mixing ratios of CO
2 and H
2O (denoted CO
2/H
2O) and CH
4/H
2O from aerosol and cloud aerosol returns using an optical parametric oscillator (OPO) [
21]. We present the data processing and mixing ratios obtained from IP-DIAL retrievals to clouds and make comparisons to the column averaged DIAL mixing ratios to validate the methods and potentially identify disagreements with currently available line shape models.
This paper is structured as follows:
Section 2.1 presents the experimental 10-frequency OPO transmitter and movable transceiver platform used to perform DIAL and IP-DIAL studies of CO
2/H
2O and CH
4/H
2O.
Section 2.2 discusses the DIAL and IP-DIAL data processing including the line shape fitting procedure to obtain GHG concentrations and mixing ratios.
Section 2.3 reviews the latest spectroscopic improvements to the CH
4 line shape near 1645 nm.
Section 3 presents the data processing for IP-DIAL retrievals from diffuse clouds (
Section 3.1), the IP-DIAL results for CO
2/H
2O and CH
4/H
2O (
Section 3.2), the DIAL results for CO
2/H
2O and CH
4/H
2O (
Section 3.2), and an overall comparison of the mixing ratios obtained from IP-DIAL, DIAL and a (cavity ringdown) point sensor. A discussion of the uncertainties relative to satellite calibration requirements is given in
Section 4. The paper closes with conclusions and outlook in
Section 5.
4. Discussion
The measurement uncertainties of the IP-DIAL mixing ratios from cloud aerosol retrievals shown in
Figure 7 approach the stringent requirements specified for global satellite measurements to accurately quantify the global changes in GHG mixing ratios and to adequately characterize sources and sinks. However, a few sources of systematic uncertainty (biases) remain in our ground-based spectroscopic studies that prevents us from assigning them as absolute mixing ratio uncertainties.
As mentioned in
Section 2.3, systematic errors in the form of repeating patterns in the residuals from fits of the CH
4 data to the HITRAN database required us to implement the more refined Hartmann-Tran profile (HTP) [
33]. From comparisons of the HTP CH
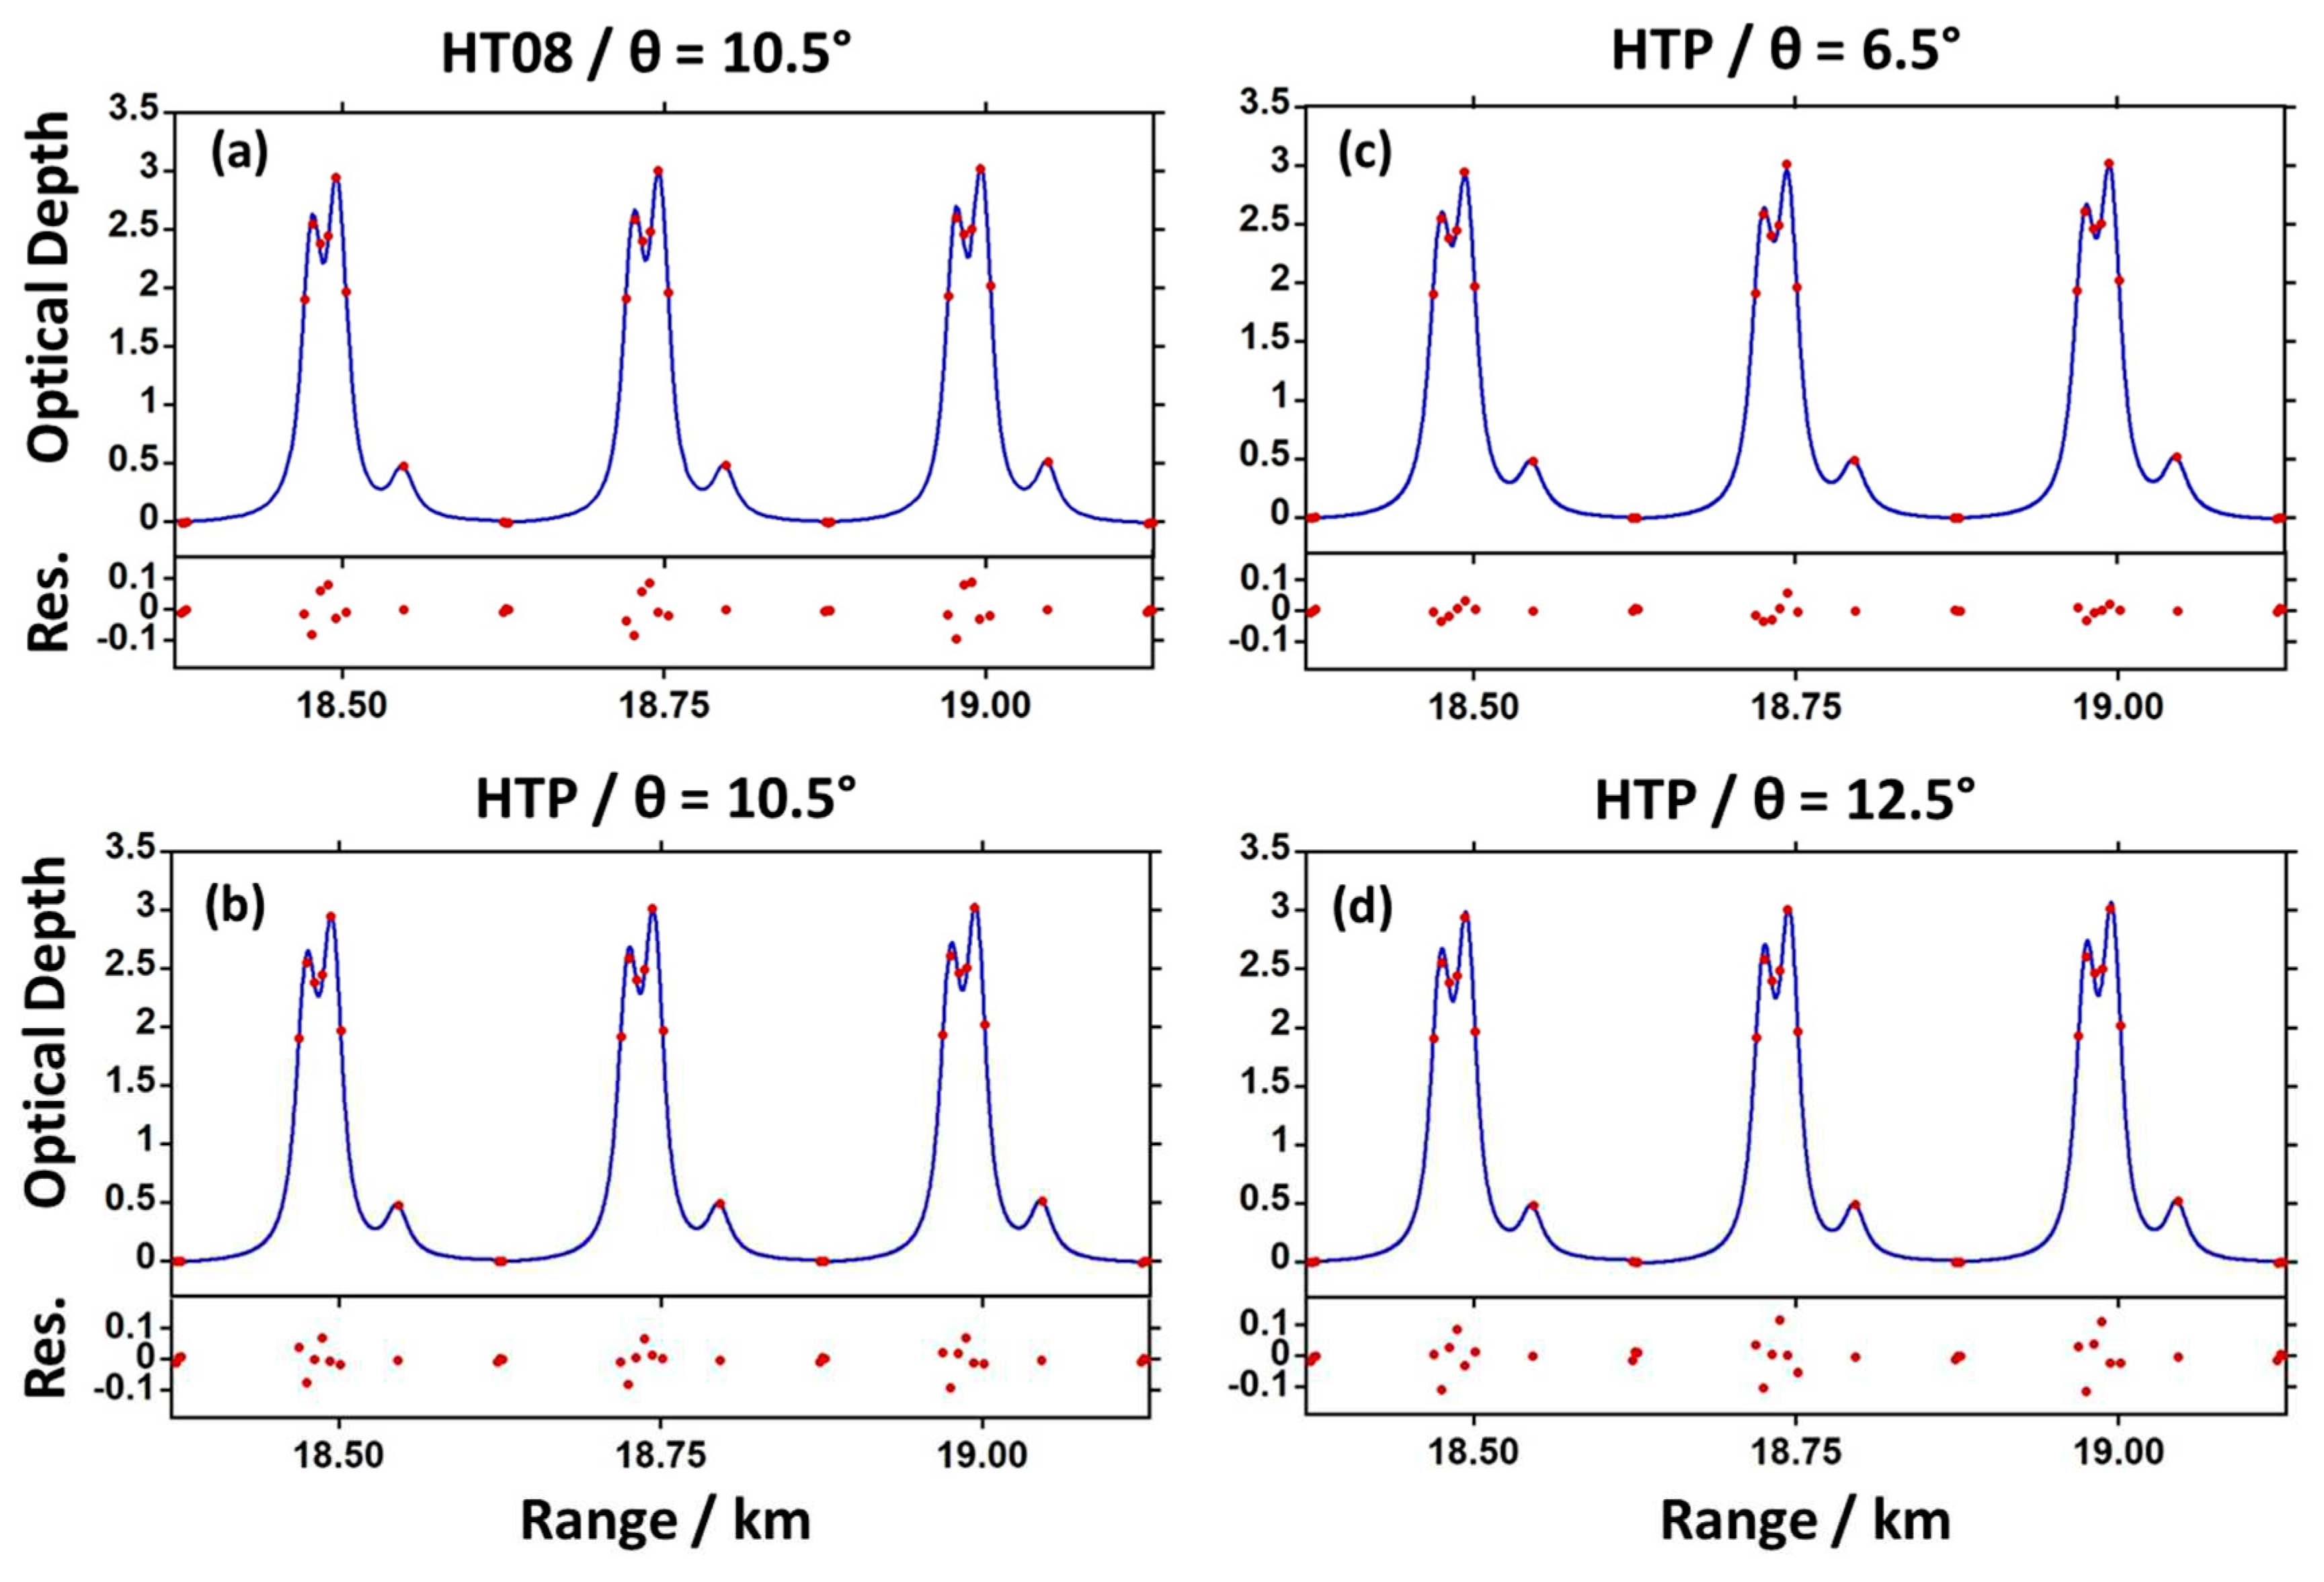
4 line shape with the HITRAN 2008, 2012, 2016 and 2020, the overall best shape relative to HTP was found for HITRAN 2008 (after scaling the overall peak intensity by 0.98). It is clear from the fit residuals to HITRAN 2008 shown in
Figure 10a that the systematic errors are even more pronounced relative to those for HTP in
Figure 10b. The HTP integrated line intensity in Ref. [
33] was adjusted to that of HITRAN 2020 database which corresponds to a peak intensity reduction of ≈ 0.91 of the HITRAN 2020 profile because of the reduced line broadening in HTP. Since our fits are to peak intensity, this led to > 8 % increase in the best fit mixing ratios of CH
4 relative to HTP. From these comparisons, there is a clear need for an SI standard that is traceable to the World Meteorological Organization (WMO) scale for the absolute intensities of the CH
4 lines. We again note that while the CO
2 profile is also impacted by line mixing and speed dependent effects, the effects on the profile are much smaller relative to CH
4 and are not revealed in the residuals in this study because of the smaller spectral coverage of the online CO
2 measurements.
Another unknown that impacts the absolute uncertainties, particularly for the IP-DIAL results of CH
4 at an altitude of ≈ 3.5 km, is in the calculated temperature and pressure (T&P) profile using the U.S. Standard Atmosphere model [
29]. While the CO
2 study was performed over a nearly horizontal path where T&P changes along the column are expected to be minimal, some evidence for systematic residuals in the CH
4 line shape residuals remain in
Figure 10b. To investigate the impact the T&P profile, we have refitted this data using two different inclination angles, θ, of 6.5° and 12.5°. The results are shown in
Figure 10c,d, respectively. In contrast to the substantial increase in residuals for θ=12.5°, the reduction seen for θ=6.5° is significant. This angle difference of 4° corresponds to an altitude difference of ≈ 1.4 km at a range of 20 km.
Given the strong pressure dependence of the shape of the CH
4 doublet on the residuals, we have performed pressure fits over two series of IP-DIAL line shape profiles. The 10 min intervals chosen are shown in
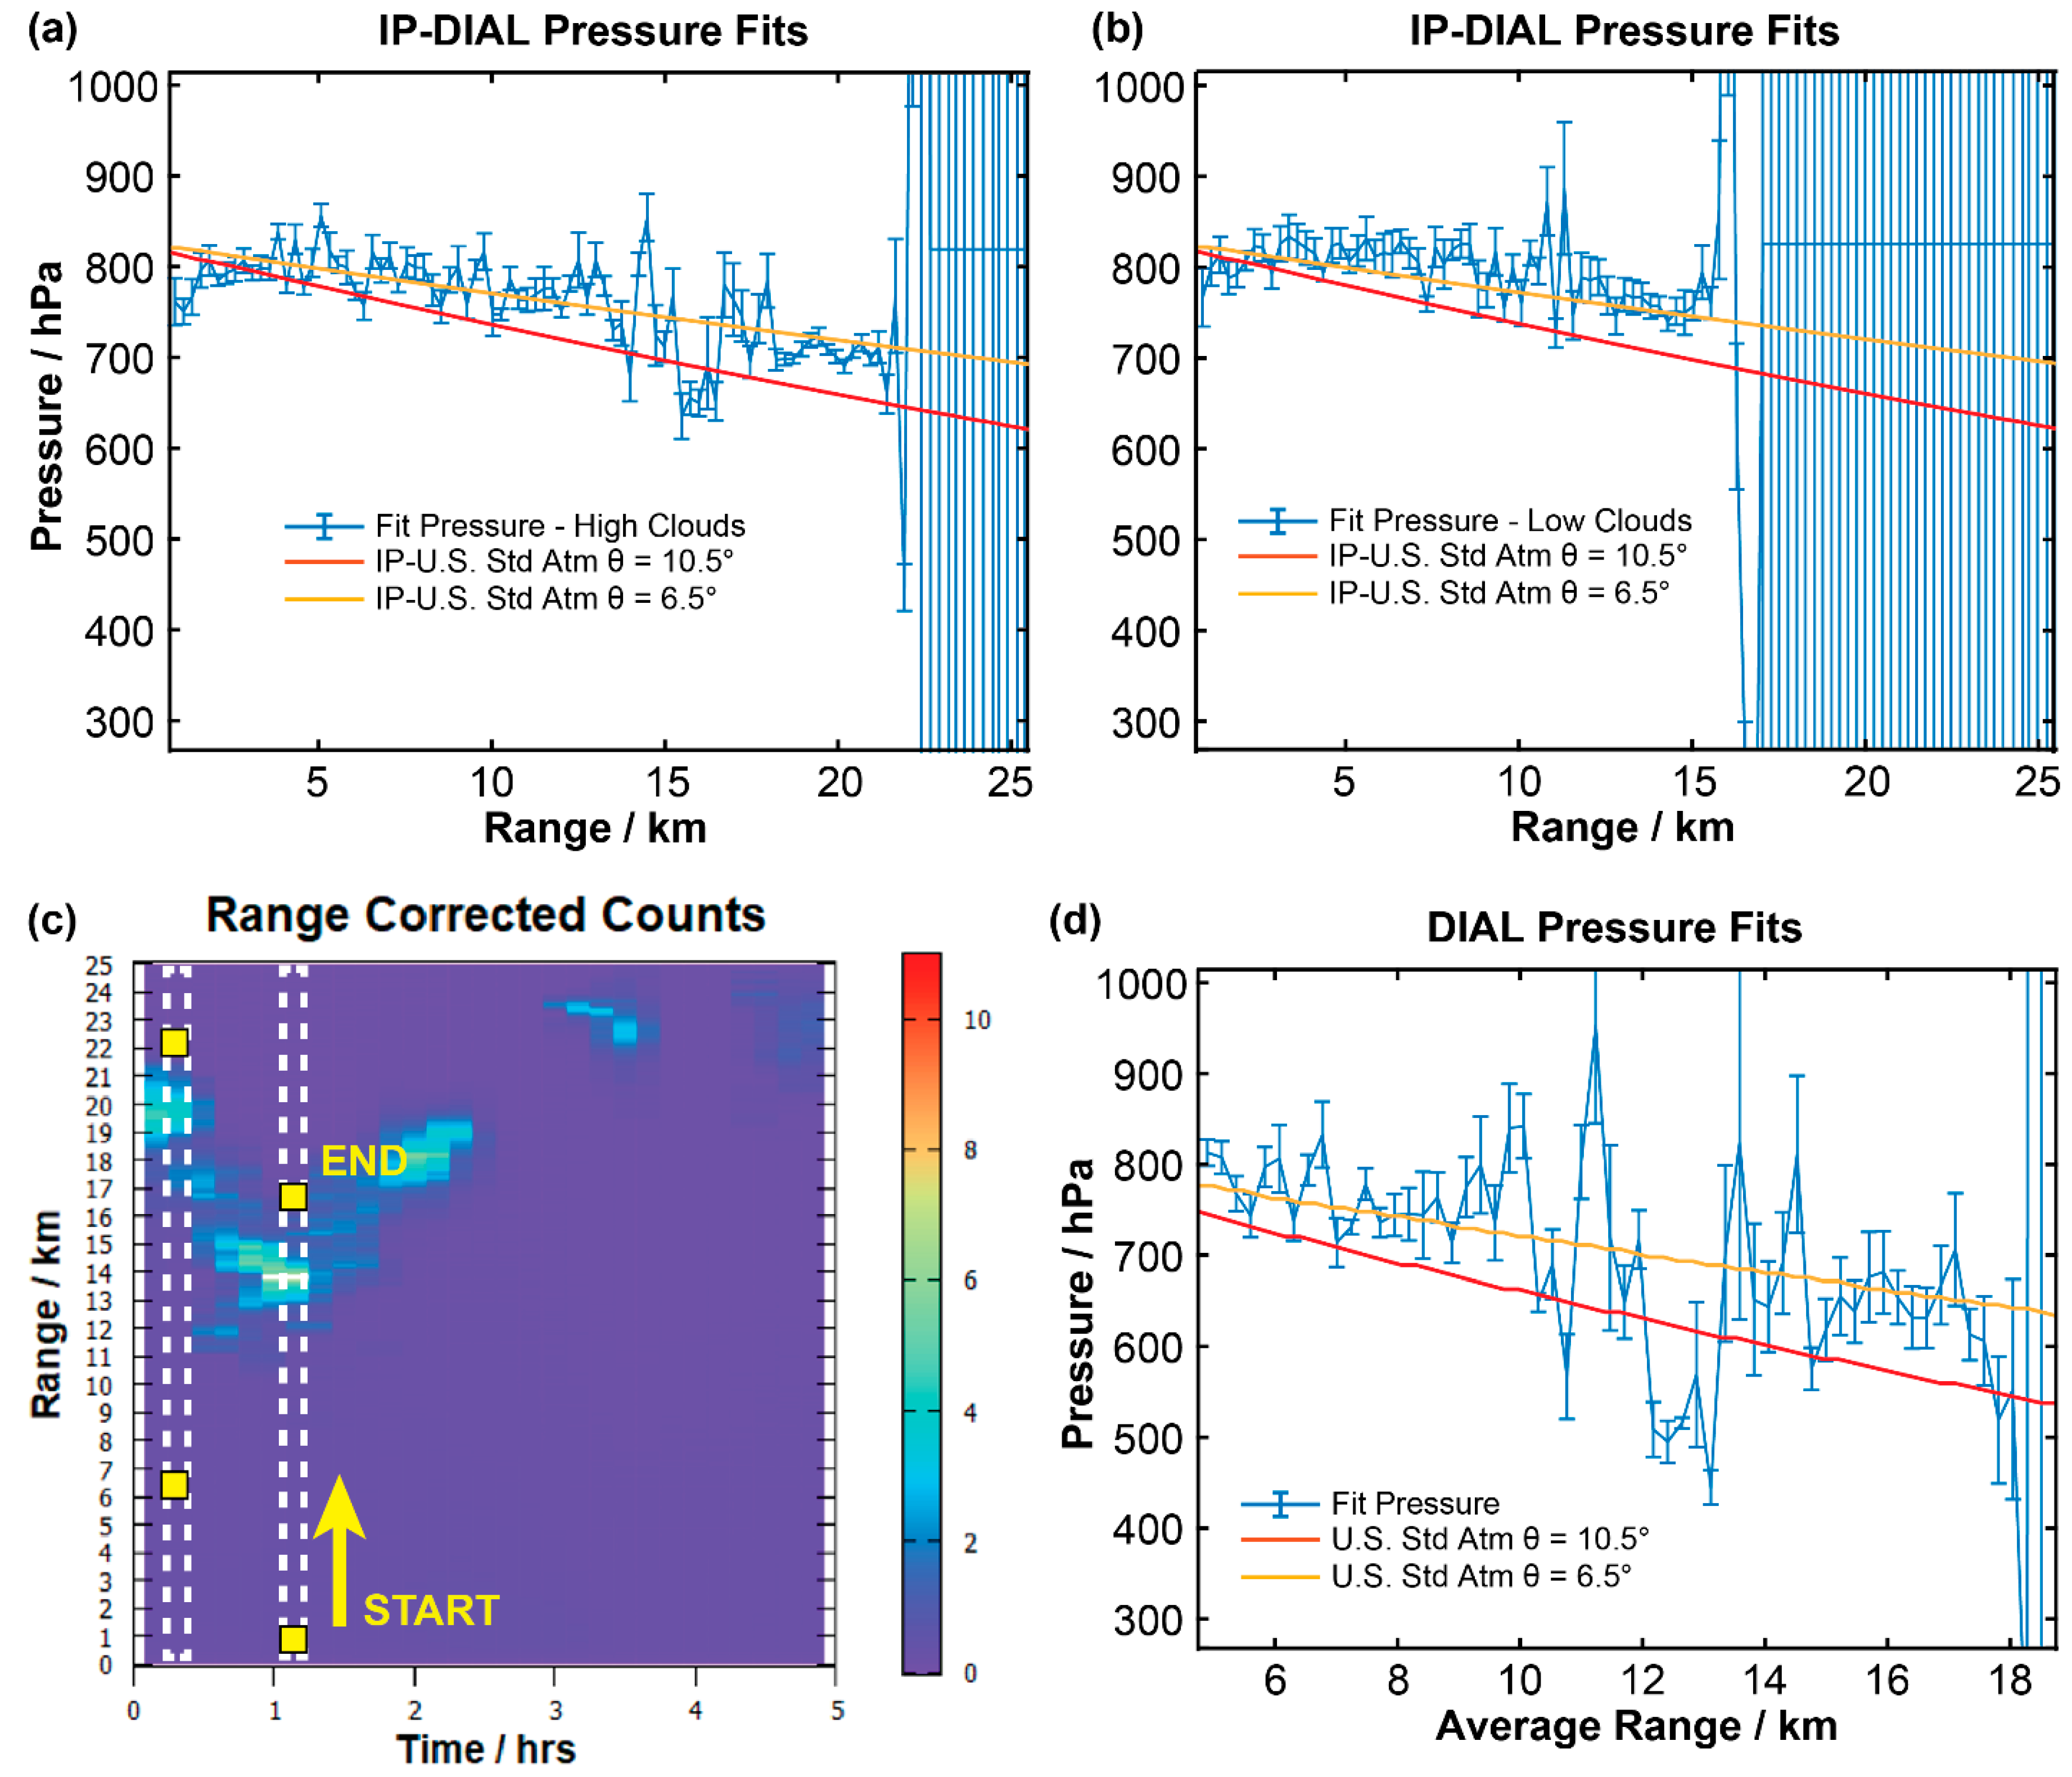
Figure 11c as vertical white lines superimposed on the LIDAR map. The best-fit path-averaged pressures and uncertainties (1σ or Type A, k=1) are shown in
Figure 11a,b for the 2
nd and 7
th intervals, which represent high and low altitude cloud aerosol regions, respectively. The trends expected for the path-averaged T&P profile of the U.S. Standard Atmosphere are superimposed on the plots with yellow and red lines for inclination angles, θ=6.5° and 10.5°, respectively. As found above, the profile for θ=6.5° is in much better agreement with the observed pressure changes. Finally, we also perform pressure fits to profile differences that are separated by 6 km as illustrated by the yellow boxes in
Figure 11c. This 6 km separation corresponds to the difference between the cloud ranges in the two columns. We note that as a result of the reduced uncertainties in the cloud regions at 19 km and 13 km in
Figure 11a,b, respectively, the relative uncertainties of the pressure fits near the 16 km average range in
Figure 11d are significantly reduced. The results shown in
Figure 11d are again in much better agreement with the T&P profile at an inclination angle of θ=6.5°.
There may be several possible reasons why the predicted inclination angle from the pressure fits in
Figure 11 is about 4° less than the actual inclination angle determined from the platform pitch sensor (which has a confirmed accuracy of ±0.5°). Any effect on the CH
4 line shape that tends to fill in the central dip region will result in fits to higher pressures that will correlate to a lower inclination angle (and lower altitude). One possible mechanism that will fill in the dip region is from additional line broadening by H
2O vapor. The pressure broadening in the HTP model used here is from dry air only. Previous studies [
37] have found that CH
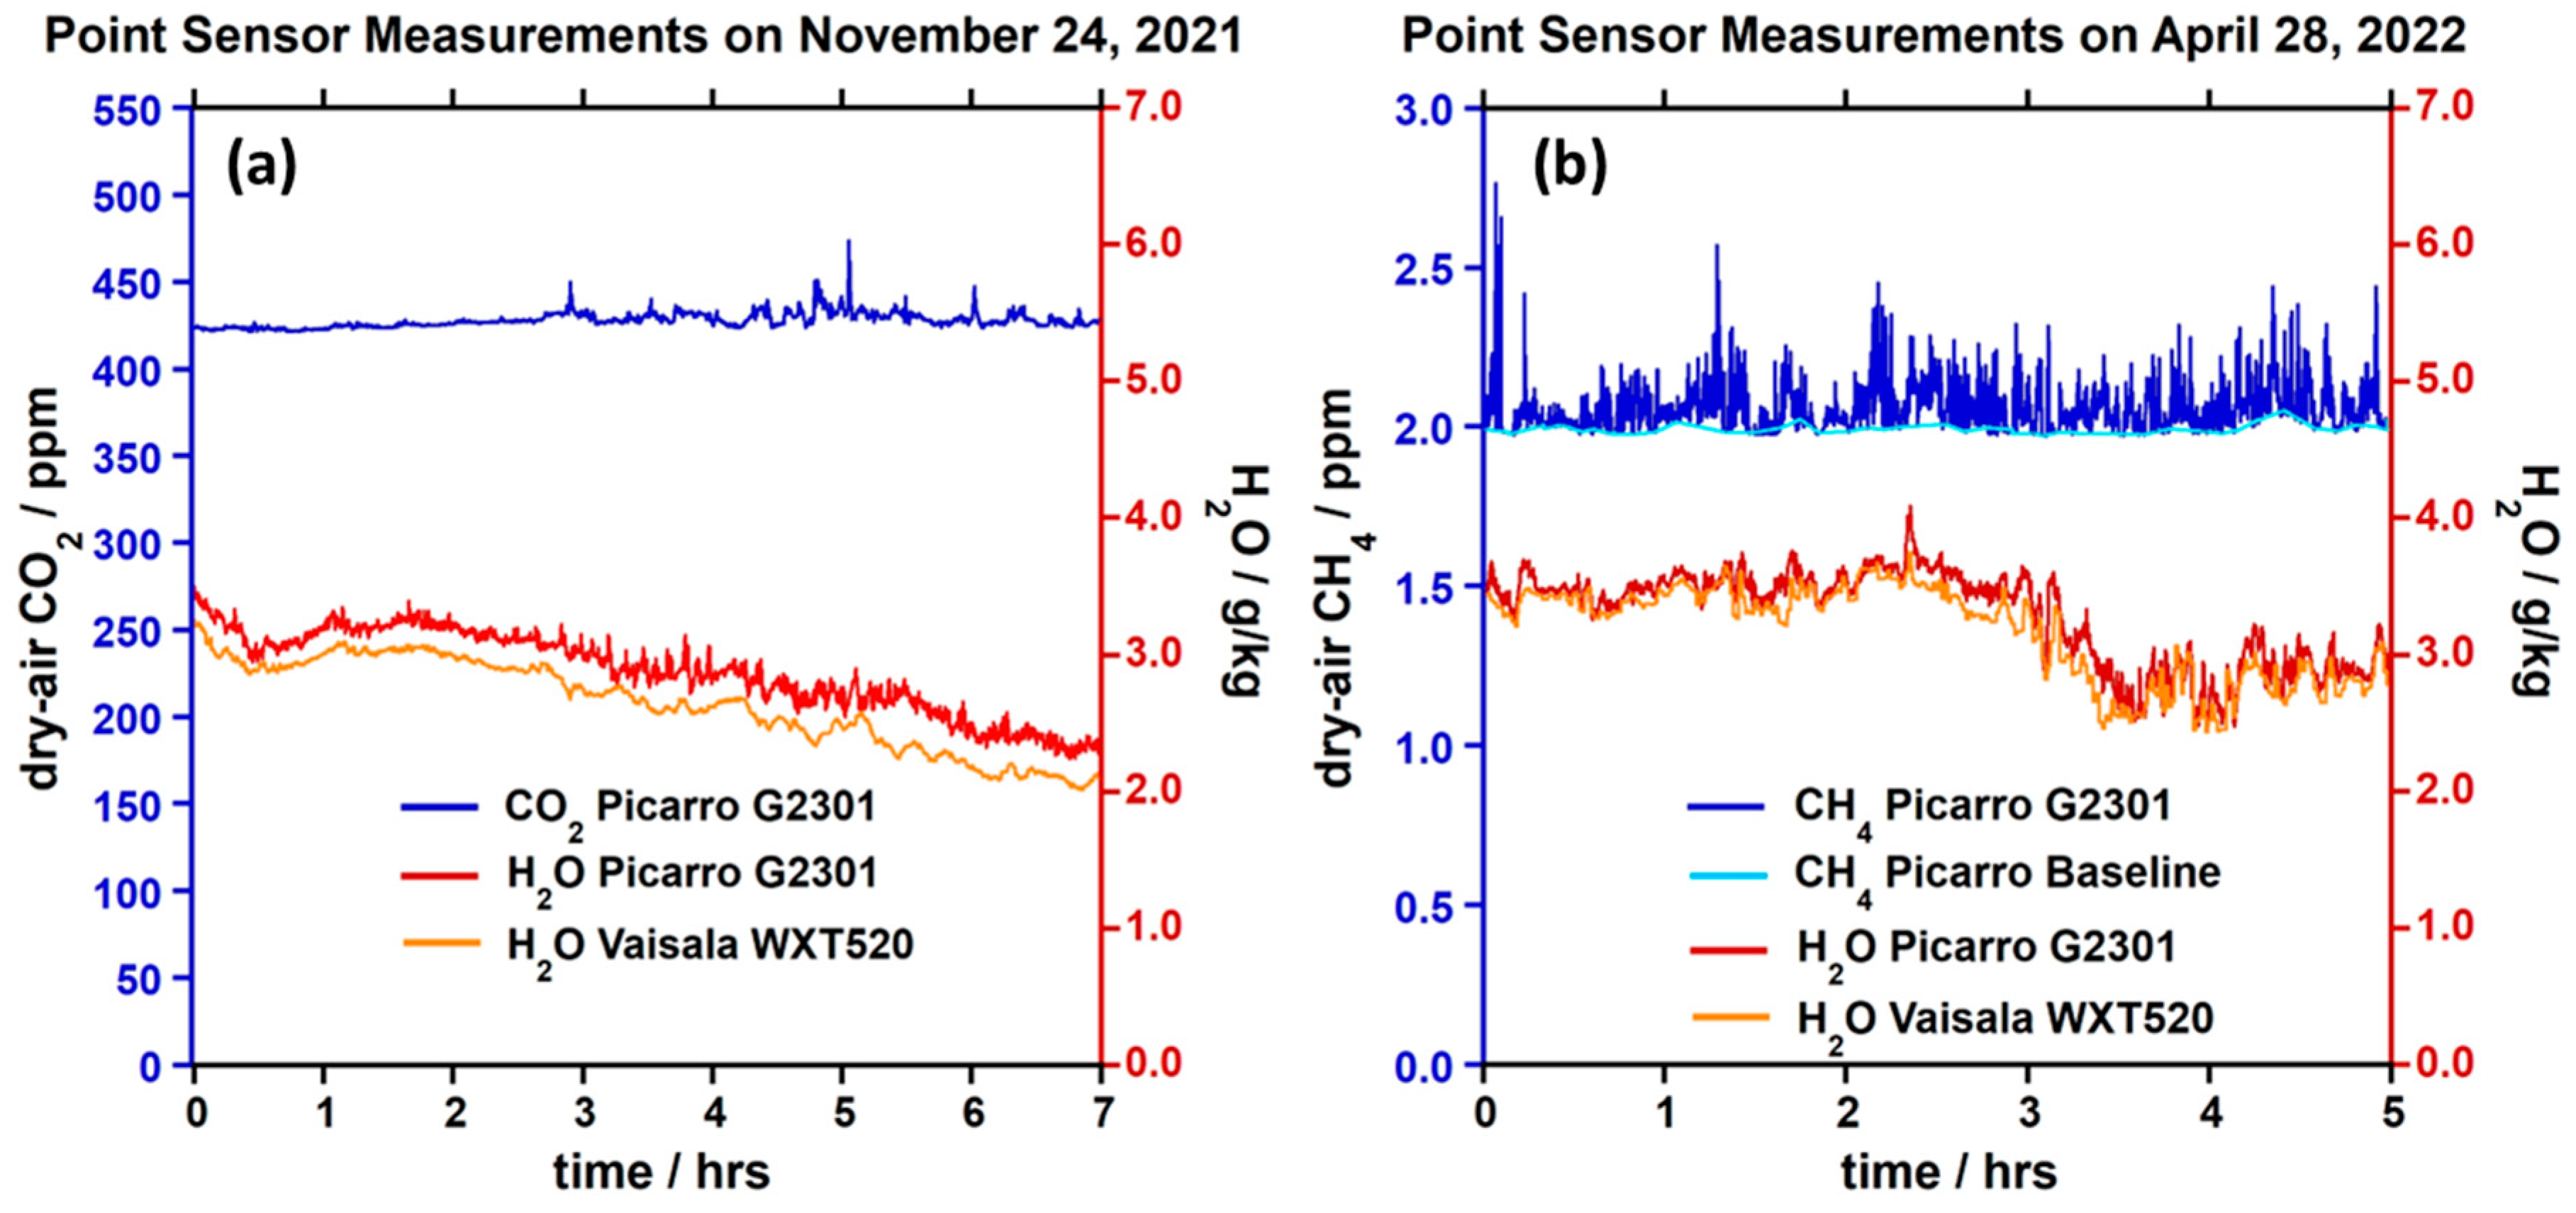
4 line widths are, on average, 34 % larger than for dry air under humid conditions (> 5 % relative humidity). However, the relative humidity in this study was relatively low (≈ 1 %) as seen in
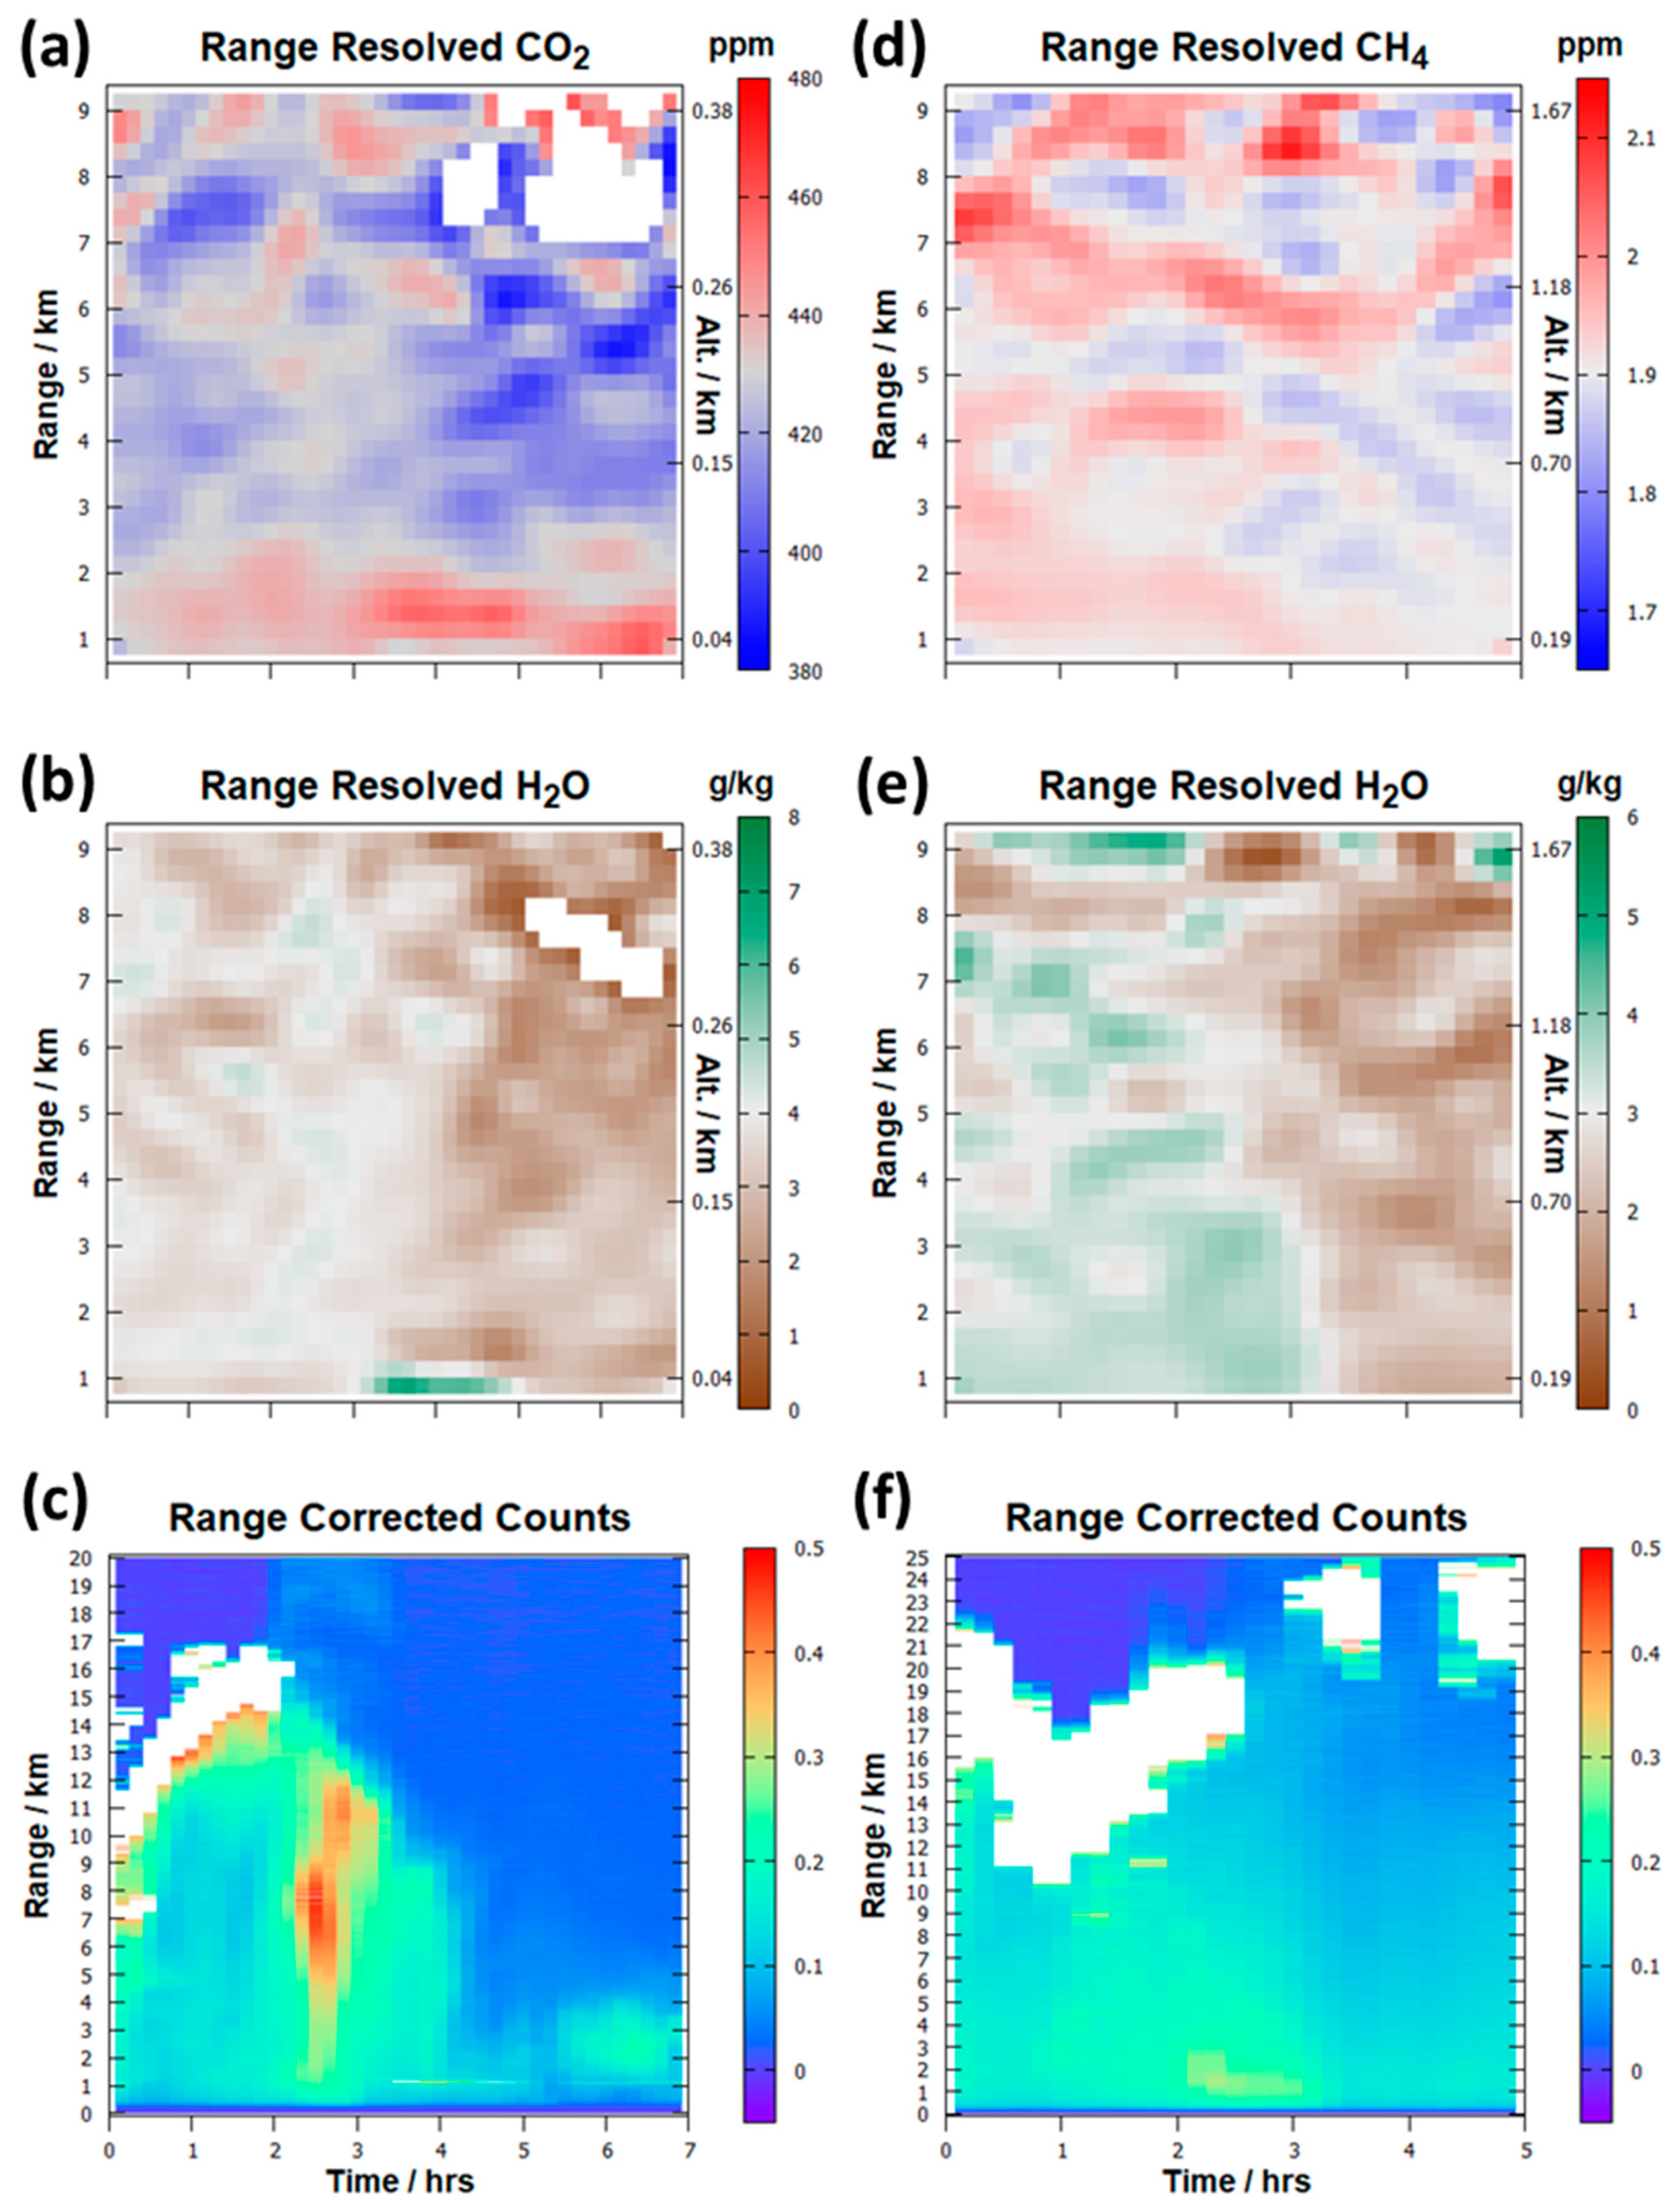
Figure 8e, and while some additional broadening by H
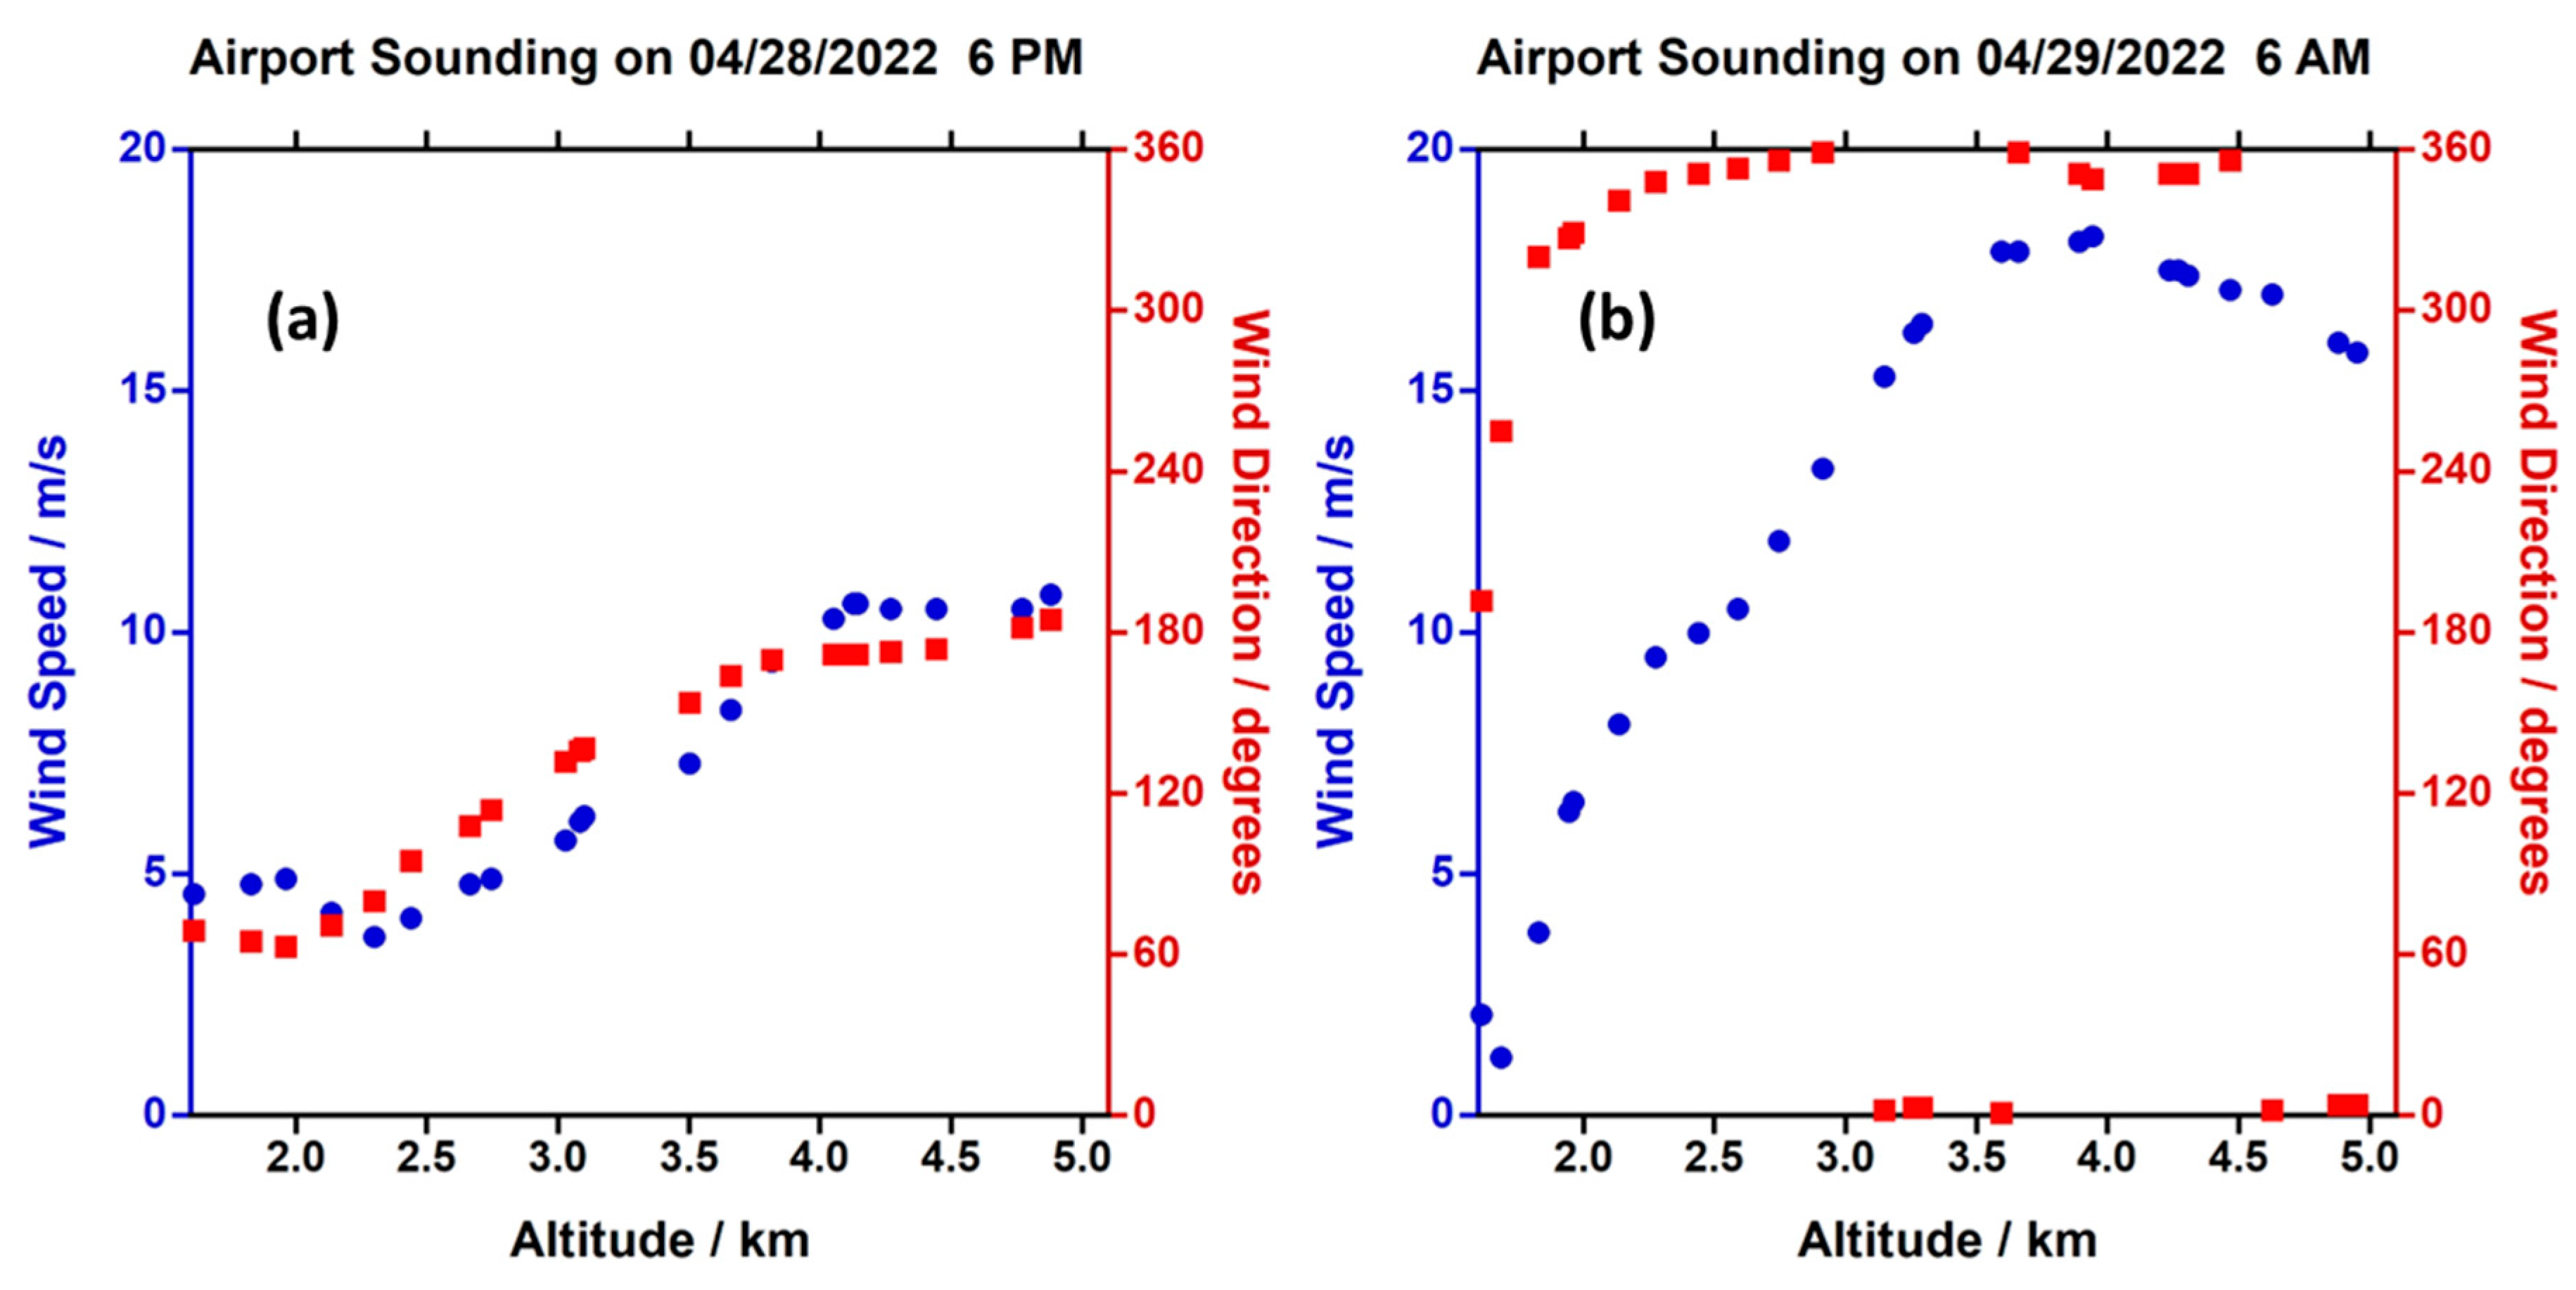
2O is expected, it is unlikely to account for the observed angle difference of ≈ 4°. A second possibility that will decrease the dip depth is from averaging over the Doppler line shifts associated with changes in wind shear over the integrated path. While a Doppler wind LIDAR system is planned for future measurement campaigns, the only atmospheric wind profile measurements available in this study are from two Denver International Airport (DIA) soundings performed several hours before and after the IP-DIAL study. The wind profile measurements, shown in
Appendix B,
Figure A1a,b, vary between 11 m/s and 18 m/s at altitudes > 4 km relative to near ground level speeds between 1 m/s and 5 m/s. Over this range, the predicted Doppler frequency shifts for winds parallel to the beam path (i.e., worst case scenario) would be in the range from ±3 MHz to ±10 MHz. Tests on the integrated HTP line shapes over the largest of these shifts indicates the impact on the CH
4 dip depth is small. We also note that the maximum laser frequency shift from the thermal drift the filter cavity over periods longer than these 10 min averaging times is expected to be of this magnitude or less [
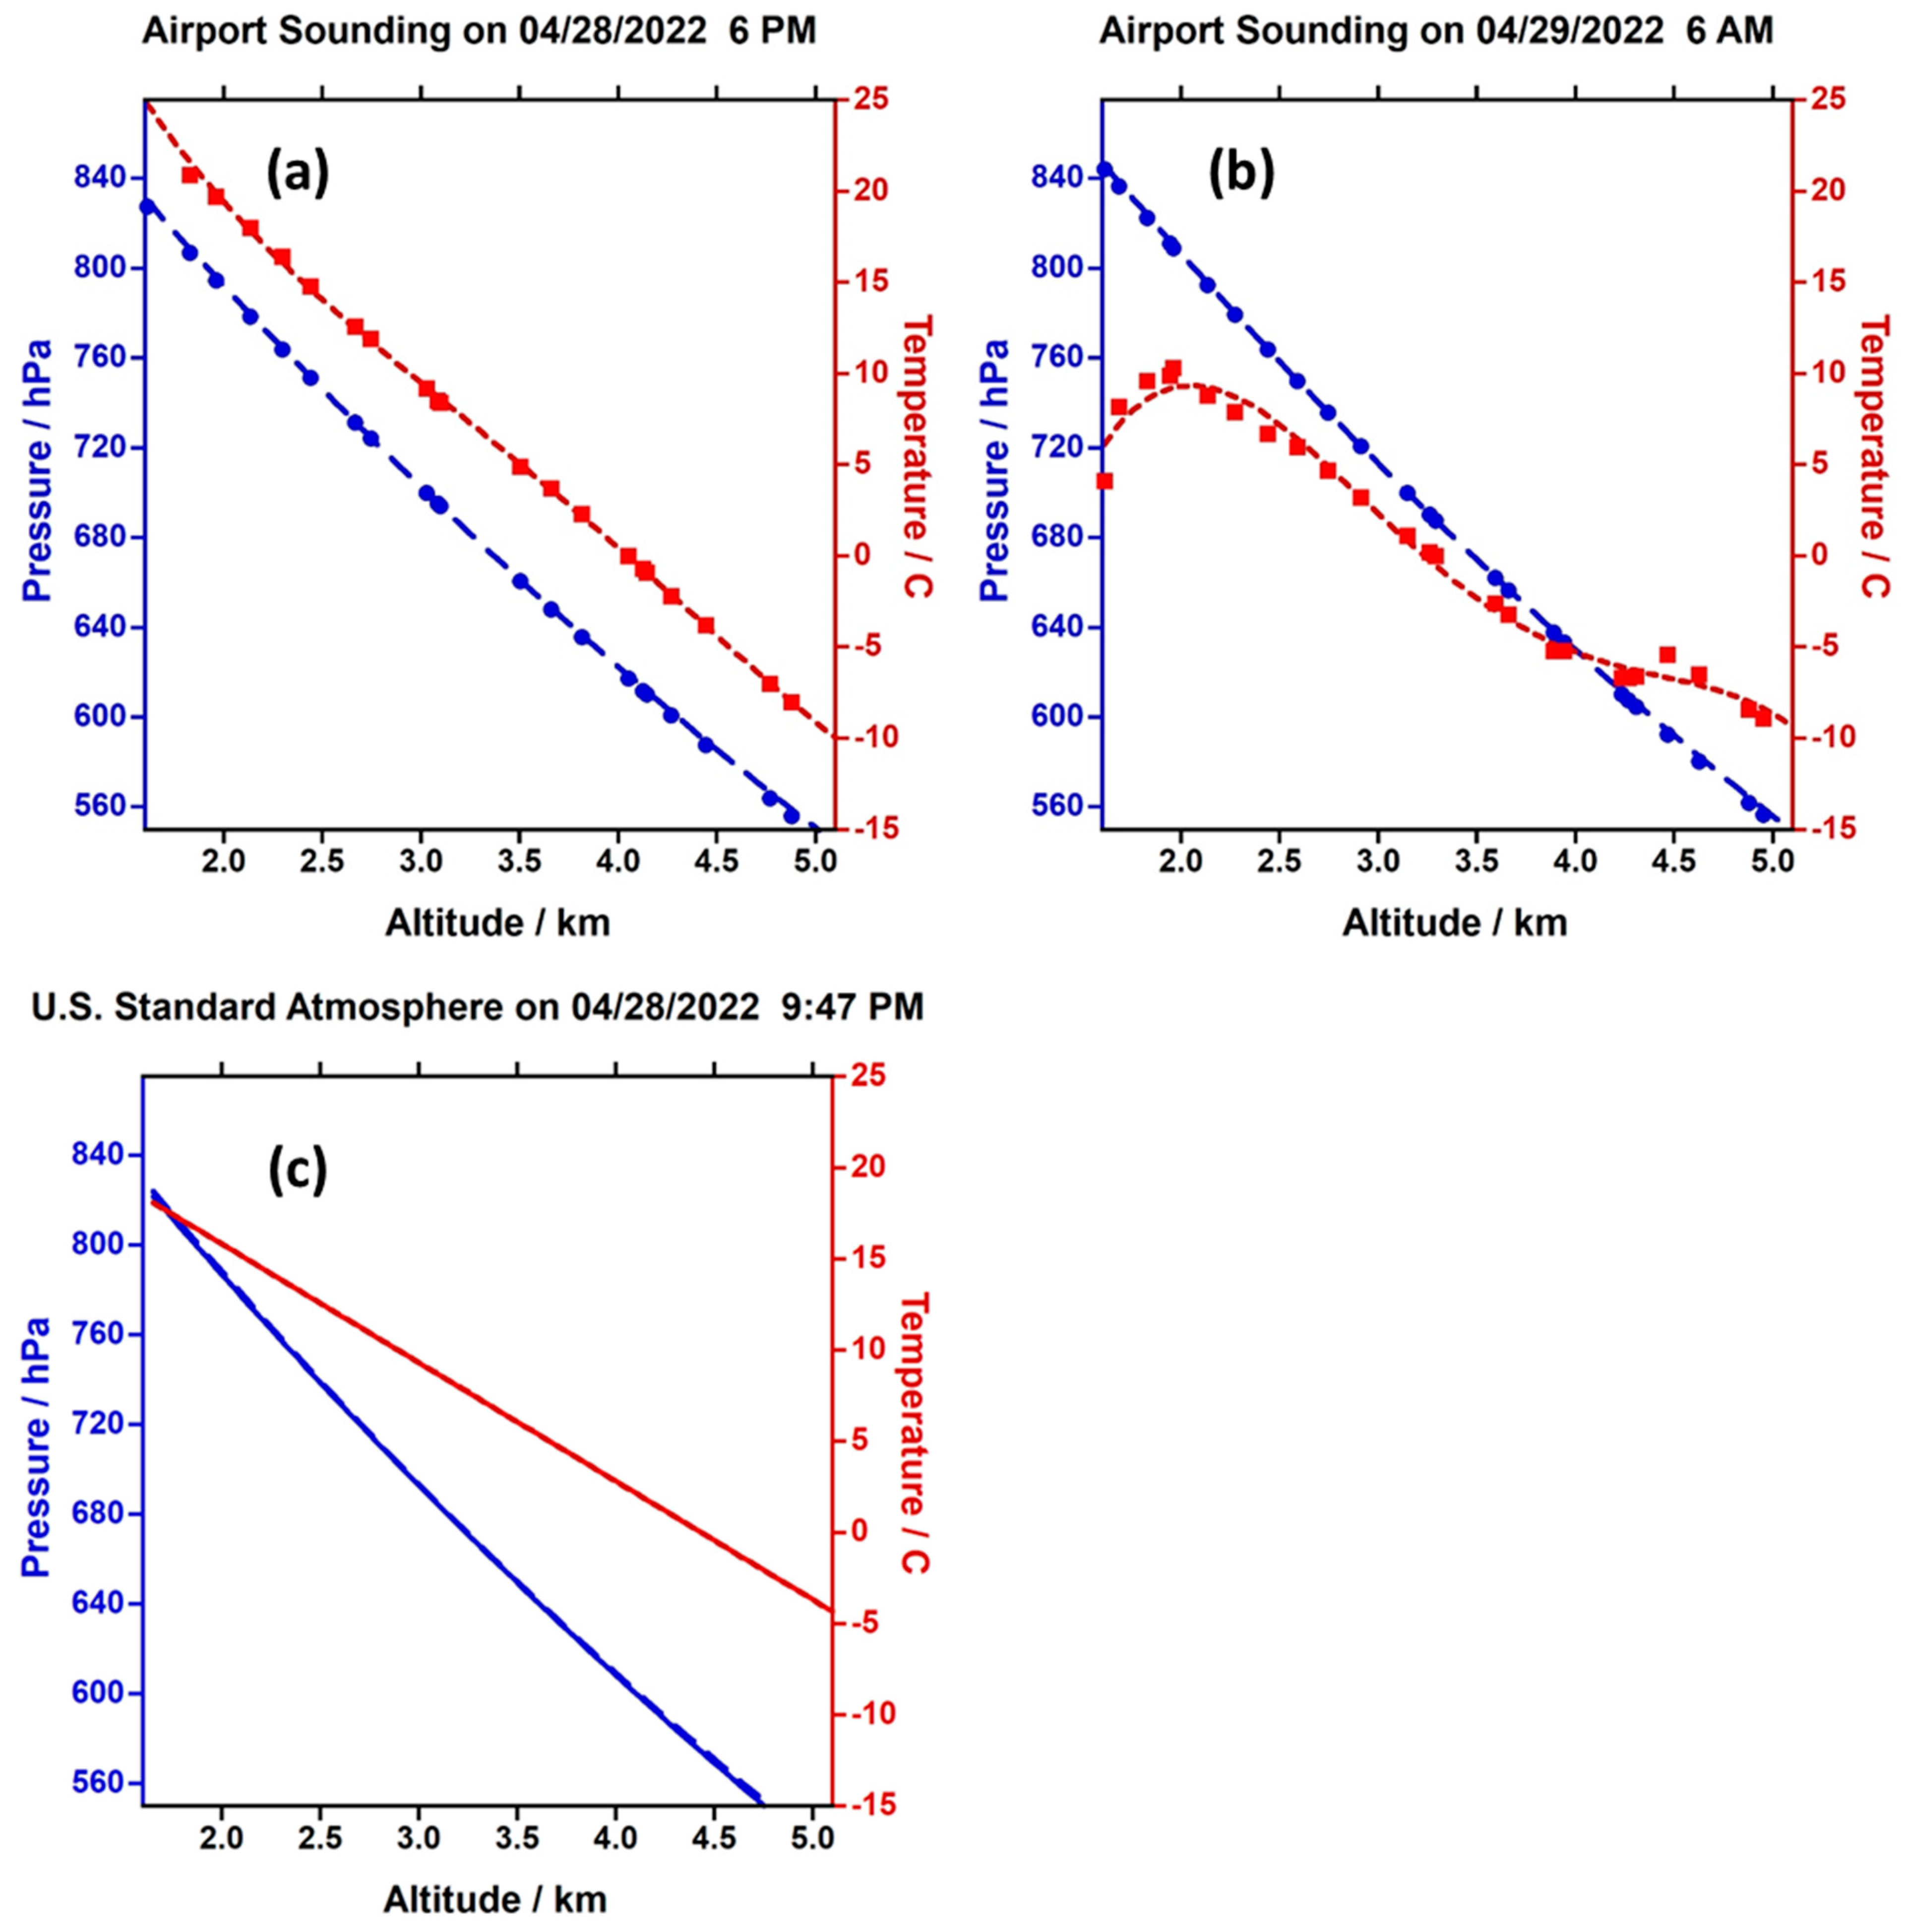
4]. A final possible reason is the U.S. Standard Atmosphere T&P profile is not a good approximation in this study. Some evidence for this is found from comparisons between the two DIA soundings shown in
Appendix B,
Figure A3a,b. We note especially the large differences in temperature profiles and an overall pressure shift of ≈ 15 hPa over this 12 h period. Significant differences are also seen relative to the T&P profile of the U.S Standard Atmosphere shown in
Figure A3c. Given the impact of a such factors on the online/offline measurements planned for the MERLIN mission [
10,
11] where such effects will not be evident in the data, current efforts are underway to preform simultaneous 3D wind profile measurements using a Doppler wind LIDAR system and to measure the individual T&P profiles based on the intensity ratio and widths of two nearby water lines.
Finally, we note that while the position of the transceiver platform is controllable, active feedback to track the optimal location for the transmit beam through a cloud region has yet to be implemented. Consequently, the cloud backscatter returns in
Figure 3b,d were limited in duration (i.e., 2 h for CO
2 and 2.5 h for CH
4). More importantly, the overall backscatter signal returns were far from optimal; in the CO
2/H
2O region, the offline returns were near the saturation limit of the PMT detection system, which is in sharp contrast to the online returns in the CH
4/H
2O region that were near the noise floor of the detection system. It would clearly be advantageous to work well between these two limiting cases. We expect the SNR ratios will improve significantly once an independent active tracking system under development is completed.
5. Conclusions and Outlook
In this work, we have demonstrated a combined DIAL/IP-DIAL system to measure range-resolved and integrated path mixing ratios of dry-air CO2 and CH4 above the city of Boulder, Colorado. The integrated path measurements are performed to cloud targets up to 20 km in range and 3.5 km in altitude. The technique uses 10 frequencies to sample across ≈ 1.5 cm-1 spectral regions and to measure the absorption line shapes of CO2, CH4 and H2O as a continuous function of range. A hybrid photon counting/current detection system enhanced the dynamic range to measure range-resolved backscatter signals from aerosols as well as from distant cloud targets.
The DIAL/IP-DIAL multi-frequency method overcomes two challenging tasks associated with standoff methods. For IP-DIAL, one task is the measurement of the pulse energies with high accuracy at each of the transmitted frequencies. This challenge is overcome through fitting the range resolved DIAL data to extrapolate pulse energies back to the time of emission thereby eliminating the difficulties associated with the uniform unbiased sampling of the transmitted pulses and with the calibration of multiple detectors’ responsivities [
35]. A second challenge of two-point online/offline DIAL and IP-DIAL systems is with the stringent frequency stabilization of the frequency converter. Because of the multi-frequency sampling and line shape fits performed here, direct determinations of the center frequencies were obtained thereby eliminating systematic errors associated with the OPO seed-signal frequency shift and other thermal drift factors.
Two independent studies were performed in the CO2/H2O and CH4/H2O regions to simultaneously measure both DIAL and IP-DIAL mixing ratios. Over the cloud aerosol regions, the uncertainties in the IP-DIAL retrievals were found to vary between and 0.2 to 1.0 % for CO2 and 0.1 % and 1 % for CH4 while the uncertainties in the range-resolved DIAL measurements varied between 1 % and 2 % in both regions. From a comparison of both techniques, the mixing ratios for the IP-DIAL measurements were found to be well-centered and within the error bars of the DIAL data. Finally, we note that because of the current inability to adjust in real time the transmitter location, the overall signal returns were found to be far from optimal; the backscatter signal intensities were near the detector saturation level in the CO2/H2O region while the online returns in the CH4/H2O region approached the detector noise floor. Current efforts are directed towards the development of a higher pulse repetition rate LIDAR system operating at 1.6 μm to survey the cloud base and provide active feedback for better positioning of the DIAL/IP-DIAL transceiver system.
Figure 1.
DIAL/IP-DIAL system overview. The ECDL output is split into two legs for frequency offset locking the laser to the filter cavity (10 % leg) and for fast 2nd-order EOM sideband tuning through the filter cavity (90 % leg).The filter cavity output seeds an image rotating OPO to generate ≈ 5 mJ pulses at 100 Hz PRF. The free spaced beam is actively locked to a movable platform (0°-30° in inclination and ±30° laterally) and transmitted from a beam expanding telescope (Tx). The receiver setup (Rx) consists of near-field and far-field (FF) telescopes (although only the FF data is discussed for these studies). Both receivers are fiber coupled to photomultiplier tubes (PMT) housed in a temperature-cooled box. Optical bandpass filters (not shown) for CO2/H2O and CH4/H2O are centered at 1602.2 nm and 1645.5 nm have peak transmission of >90 % and a full width at half maximum (FWHM) of 2 nm. The NF and FF channels are amplified with a transimpedance gain of 5 kV/A (AMP) and digitized (ADC) at 2 × 10⁹ samples per second with 8-bit resolution. The photon counts and current for each receiver are co-added separately for each transmitted frequency resulting in 40 data segments that are stored every 10 seconds in Network Common Data Form file format (NetCDF). (ECDL: external cavity diode laser, PID: proportional-integral-differential controller, VCO: voltage-controlled oscillator, RISTRA OPO: KTA: potassium titanyl arsenate, MW: microwave synthesizer, BOA: booster optical amplifier, EOM: electro-optic modulator, AOM: acousto-optic modulator, ADC: analog-to-digital converter, PBS: polarizing beam splitter, AMP: electronic amplifier.
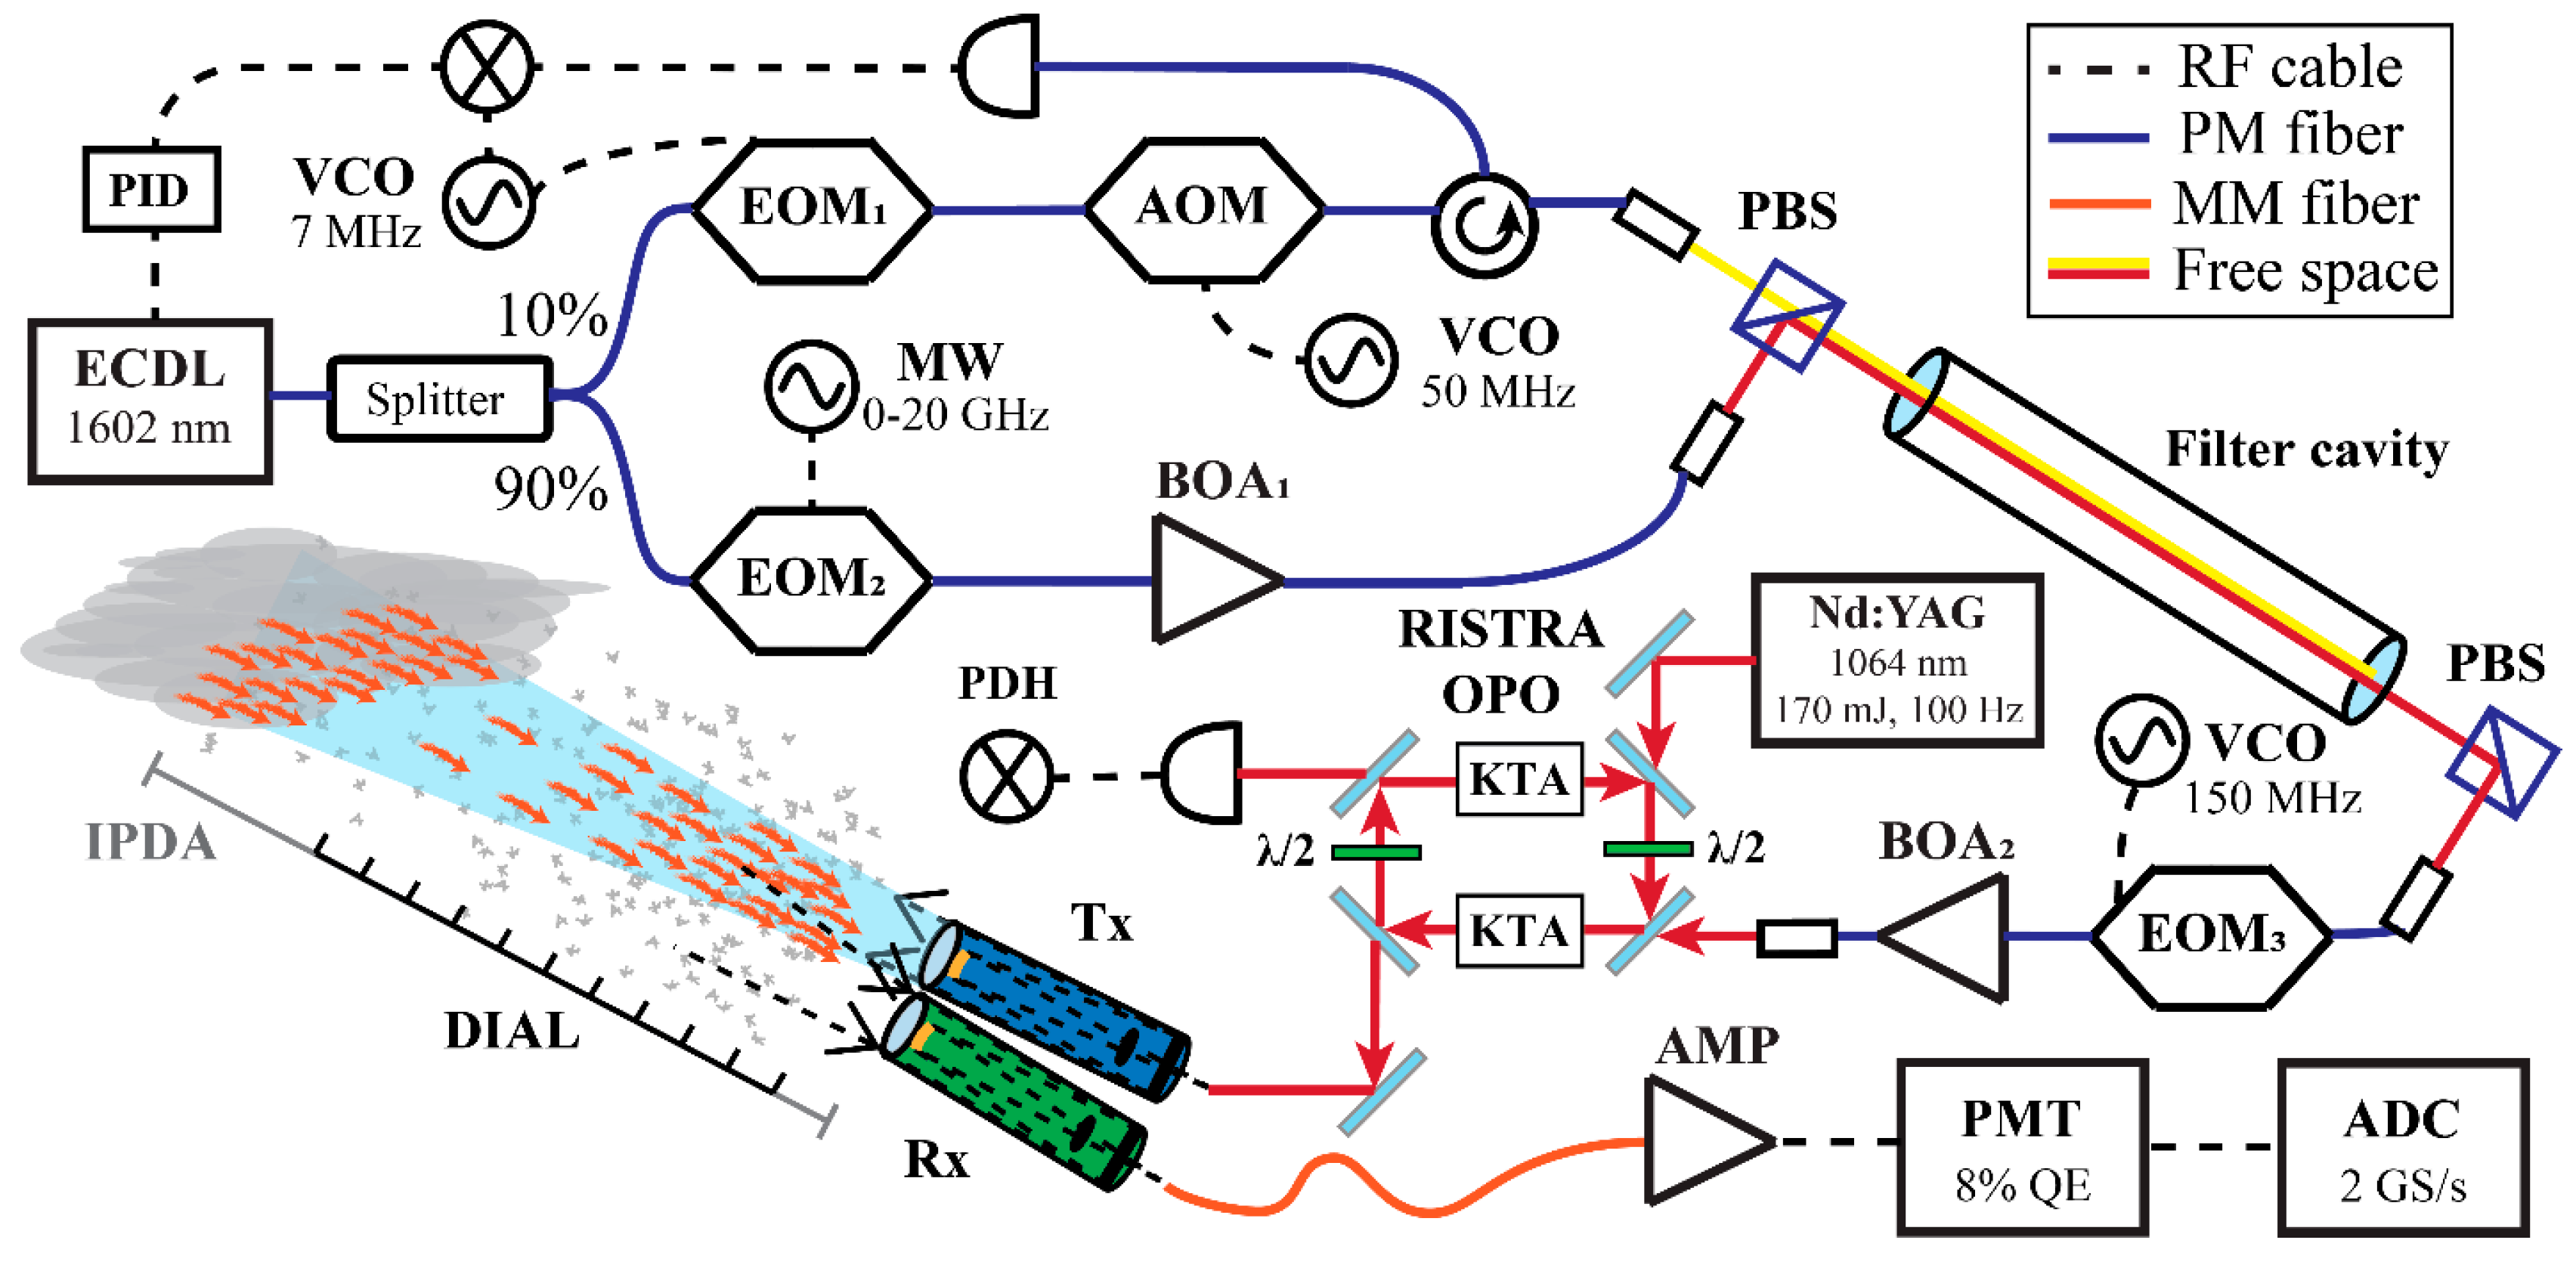
Figure 2.
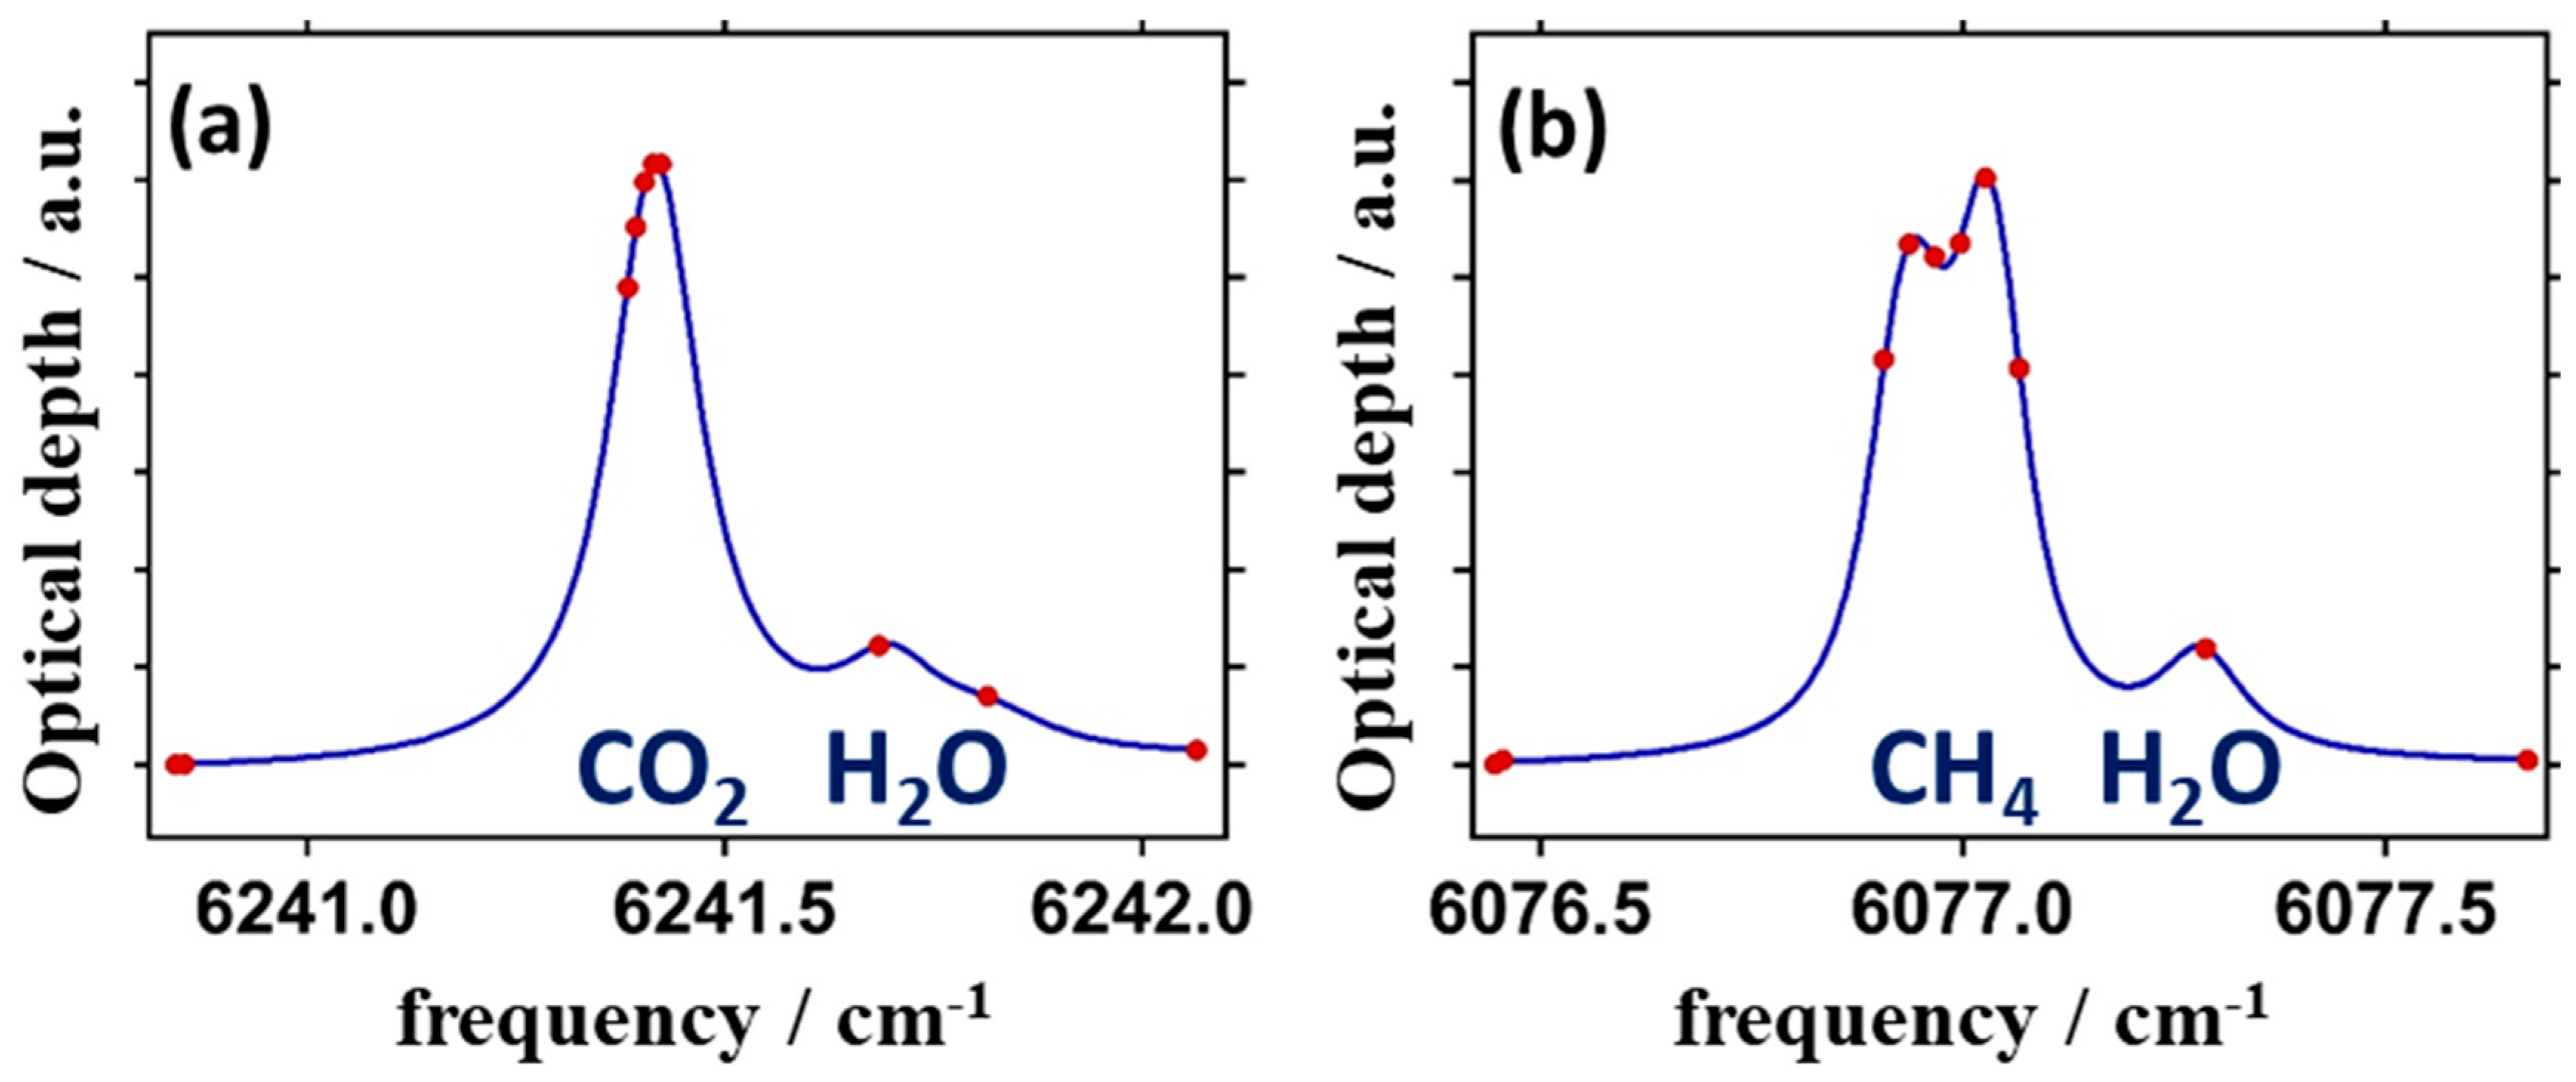
The spectral regions selected to measure the mixing ratios of (a) CO2 and H2O and (b) CH4 and H2O. The ten frequencies used to probe the lines are shown with solid (red) dots where the first two frequencies are nearly on top of one another.
Figure 2.
The spectral regions selected to measure the mixing ratios of (a) CO2 and H2O and (b) CH4 and H2O. The ten frequencies used to probe the lines are shown with solid (red) dots where the first two frequencies are nearly on top of one another.
Figure 3.
(a) The unscaled range-resolved signal returns from natural aerosols for the CO2 region out to 10 km and from cloud aerosols from 10 km to 12 km. The inclination of the receiver was 2.5° off the horizon. The data were obtained on Nov. 24, 2021. The 5 darker colors are from the offline regions (blue) and the 5 lighter colors are from the online CO2 (red) and H2O (green) returns. (b) The range and background corrected LIDAR map for the first offline frequency is shown for the full measurement period. (c) Unscaled range-resolved signal returns from natural aerosols are shown for the CH4 region out to 15 km and from cloud aerosols from 14 km to 22 km. The inclination of the receiver was 10.5° off the horizon. The data were obtained on Apr. 28, 2022. The 3 darker colors are from the offline regions (blue), and the 6 lighter colors are from the online CH4 (red) and H2O (green) returns. (d) The range and background corrected LIDAR map for the first offline frequency is shown for the full measurement period.
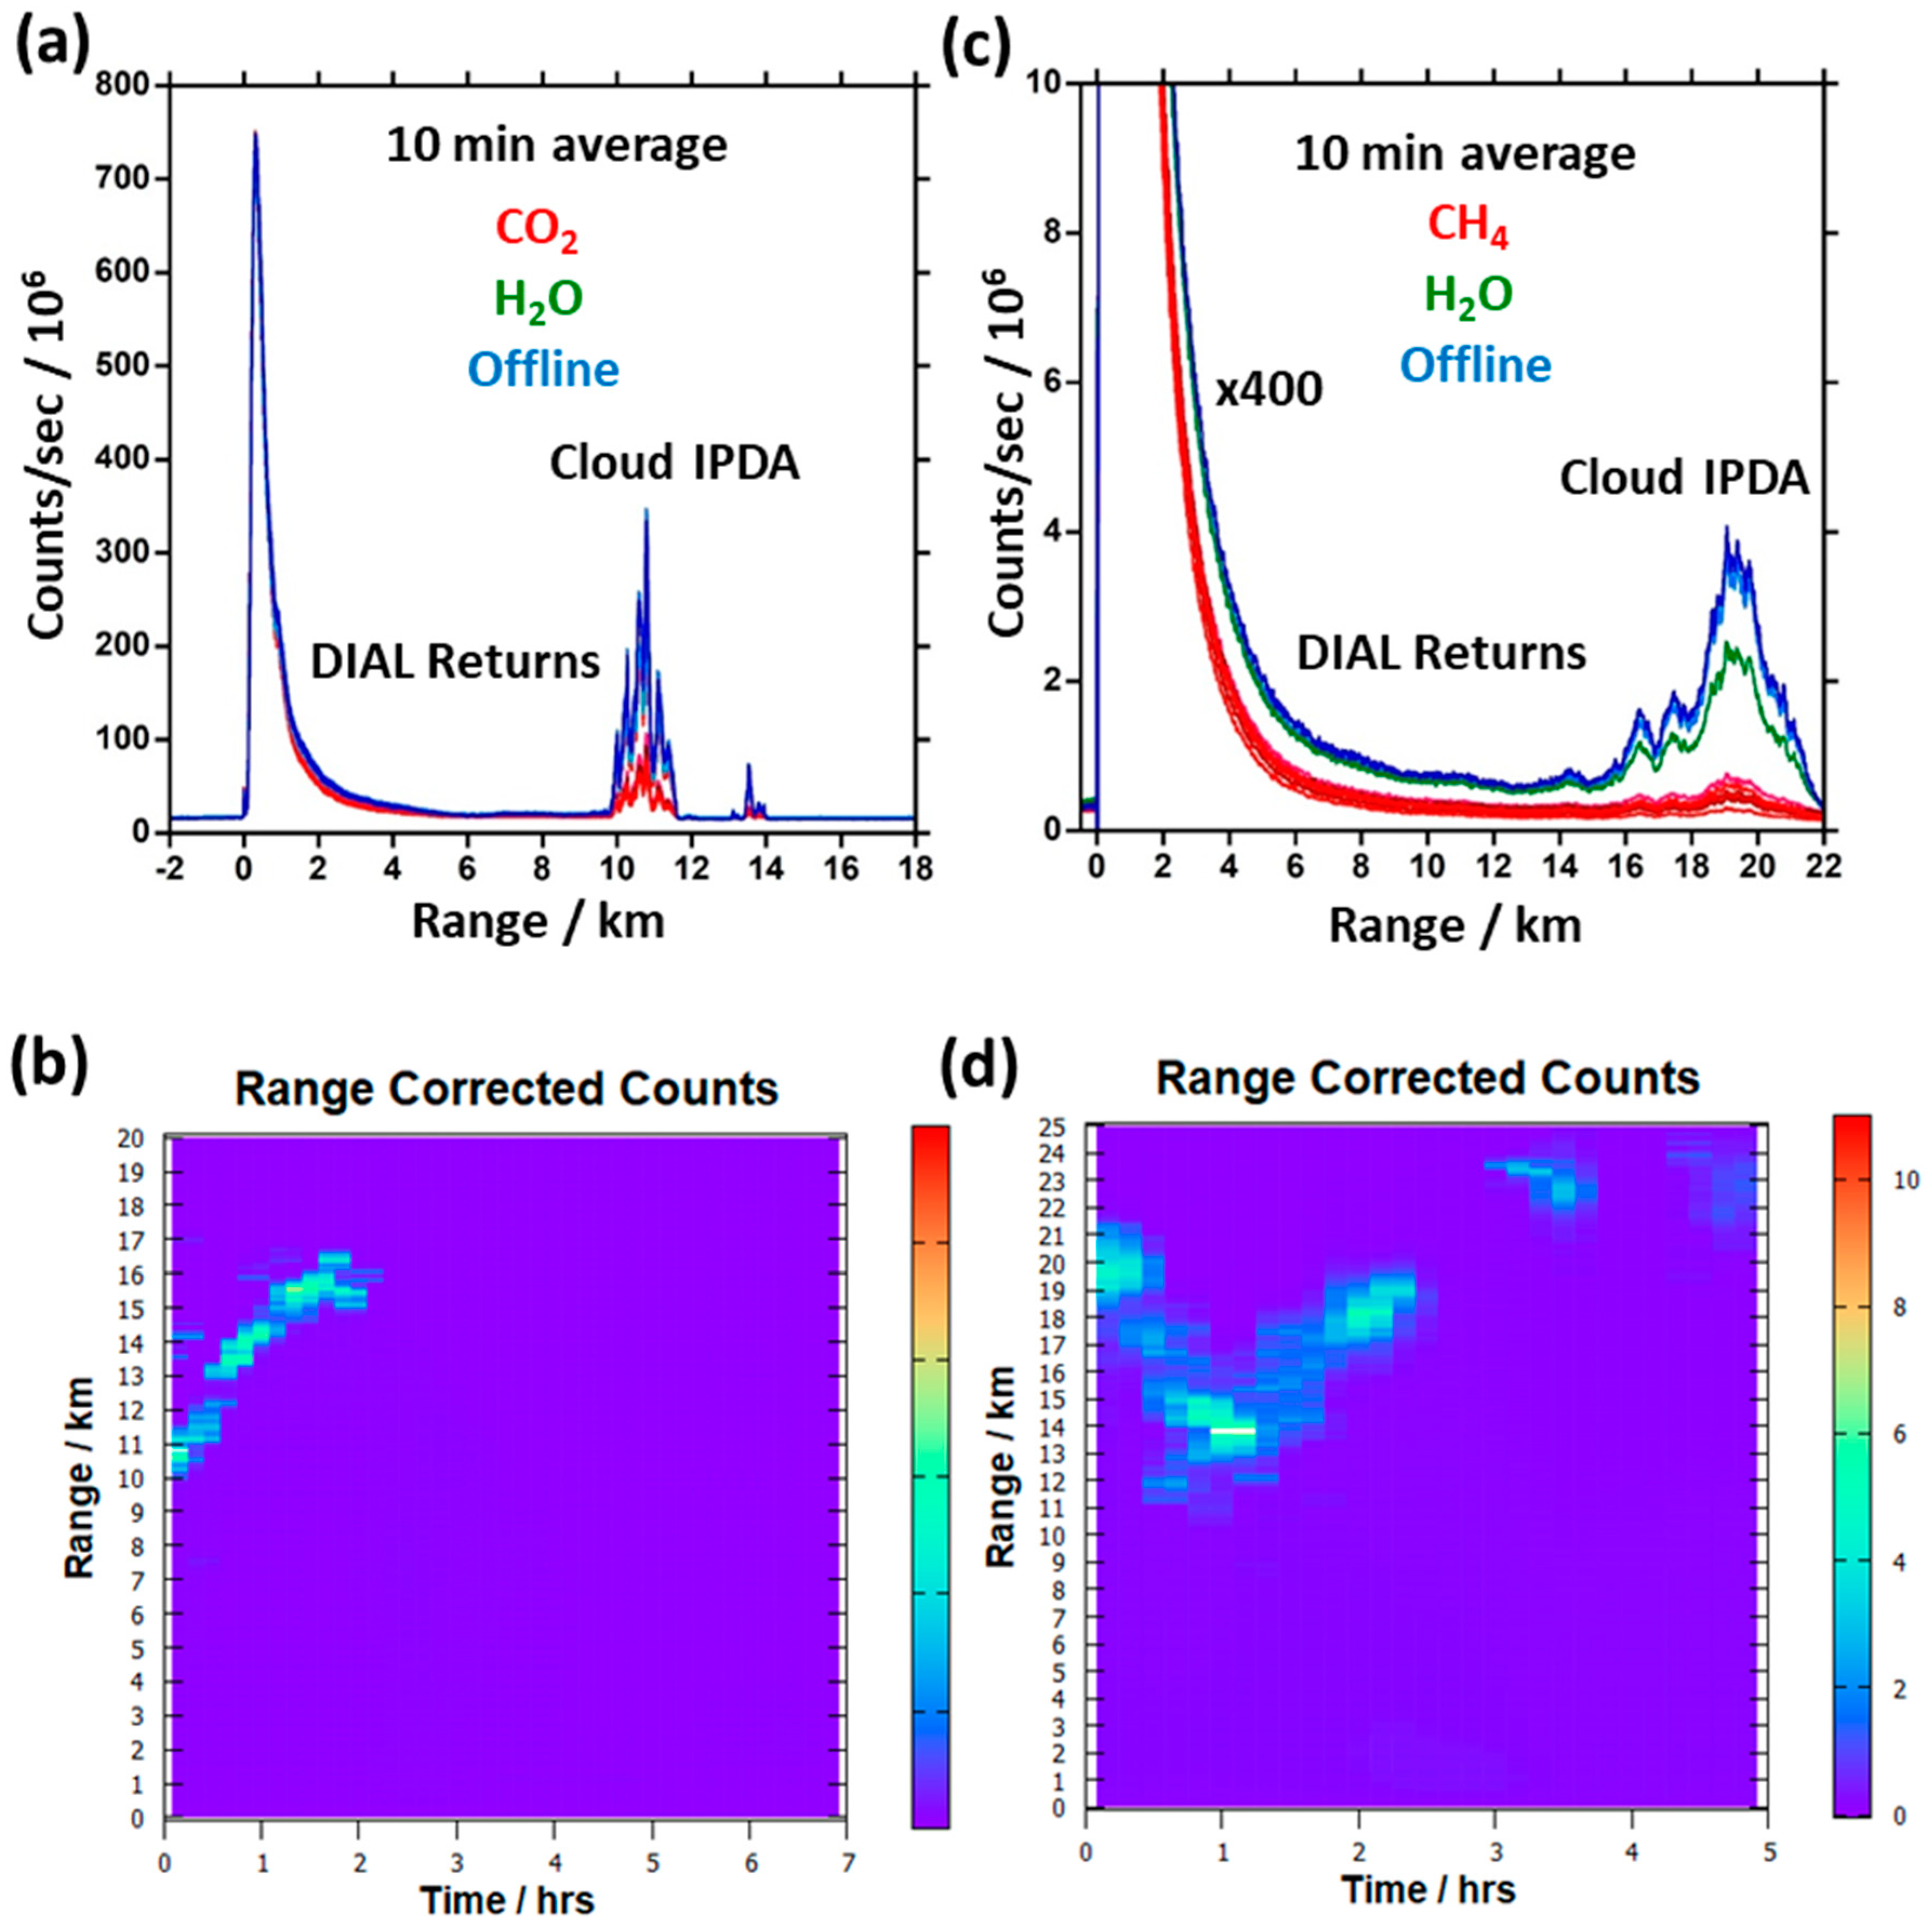
Figure 4.
(a) The log ratios, , (optical depth) for CO2/H2O as a function of range, illustrating their near linear increases up to and through the cloud (online CO2 or CH4: red, online H2O: green, offline: blue). The enhanced SNRs after 10 km are from the more than 100-fold increase in back scattered counts from the cloud aerosol signal returns. b) The near linear optical depth increases for CH4/H2O are shown as a function of range. The enhanced SNRs from 14 km to 22 km are from the >10-fold increase in back scattered counts from the cloud aerosol signal returns. The solid black lines overlaying the data are from linear fits of the data between the vertical dashed lines (0.625 km to 5 km) after correction for small variations in concentration and line shape. The line intercepts for each color at the solid vertical line (i.e., R=0) are proportional to the initial laser pulse energies of the laser. The vertical dashed lines in the lower right corners serve to illustrate how the processed data are binned over the enhanced backscatter regions.
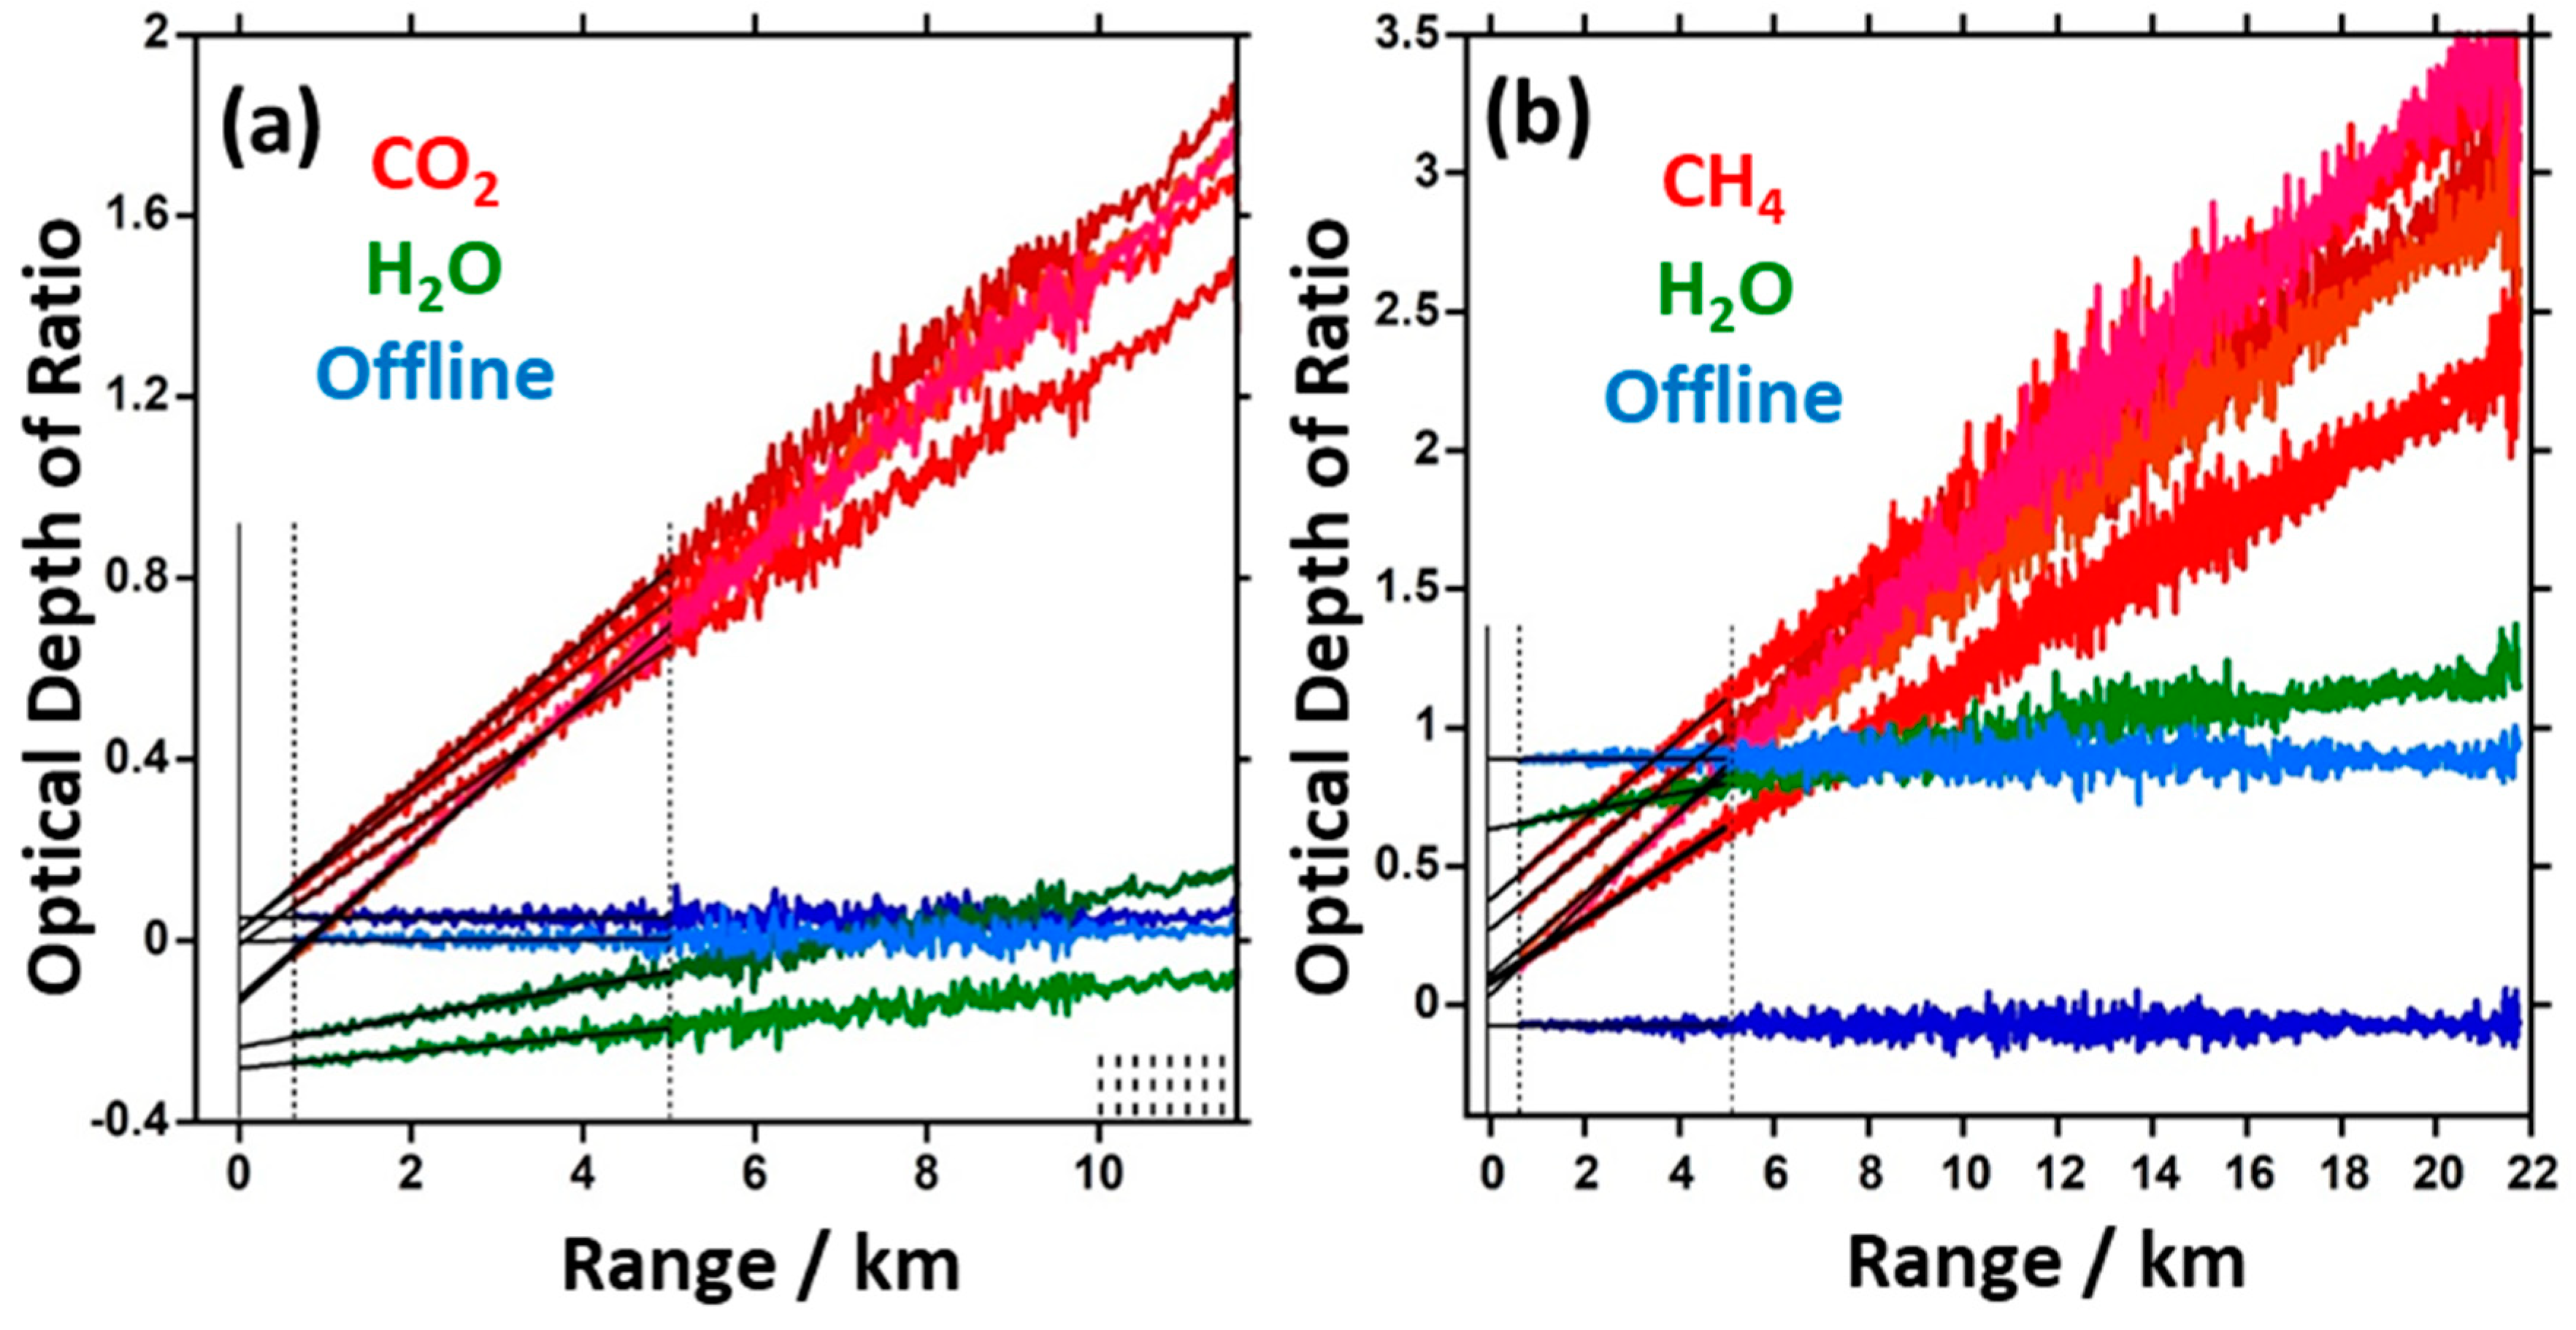
Figure 5.
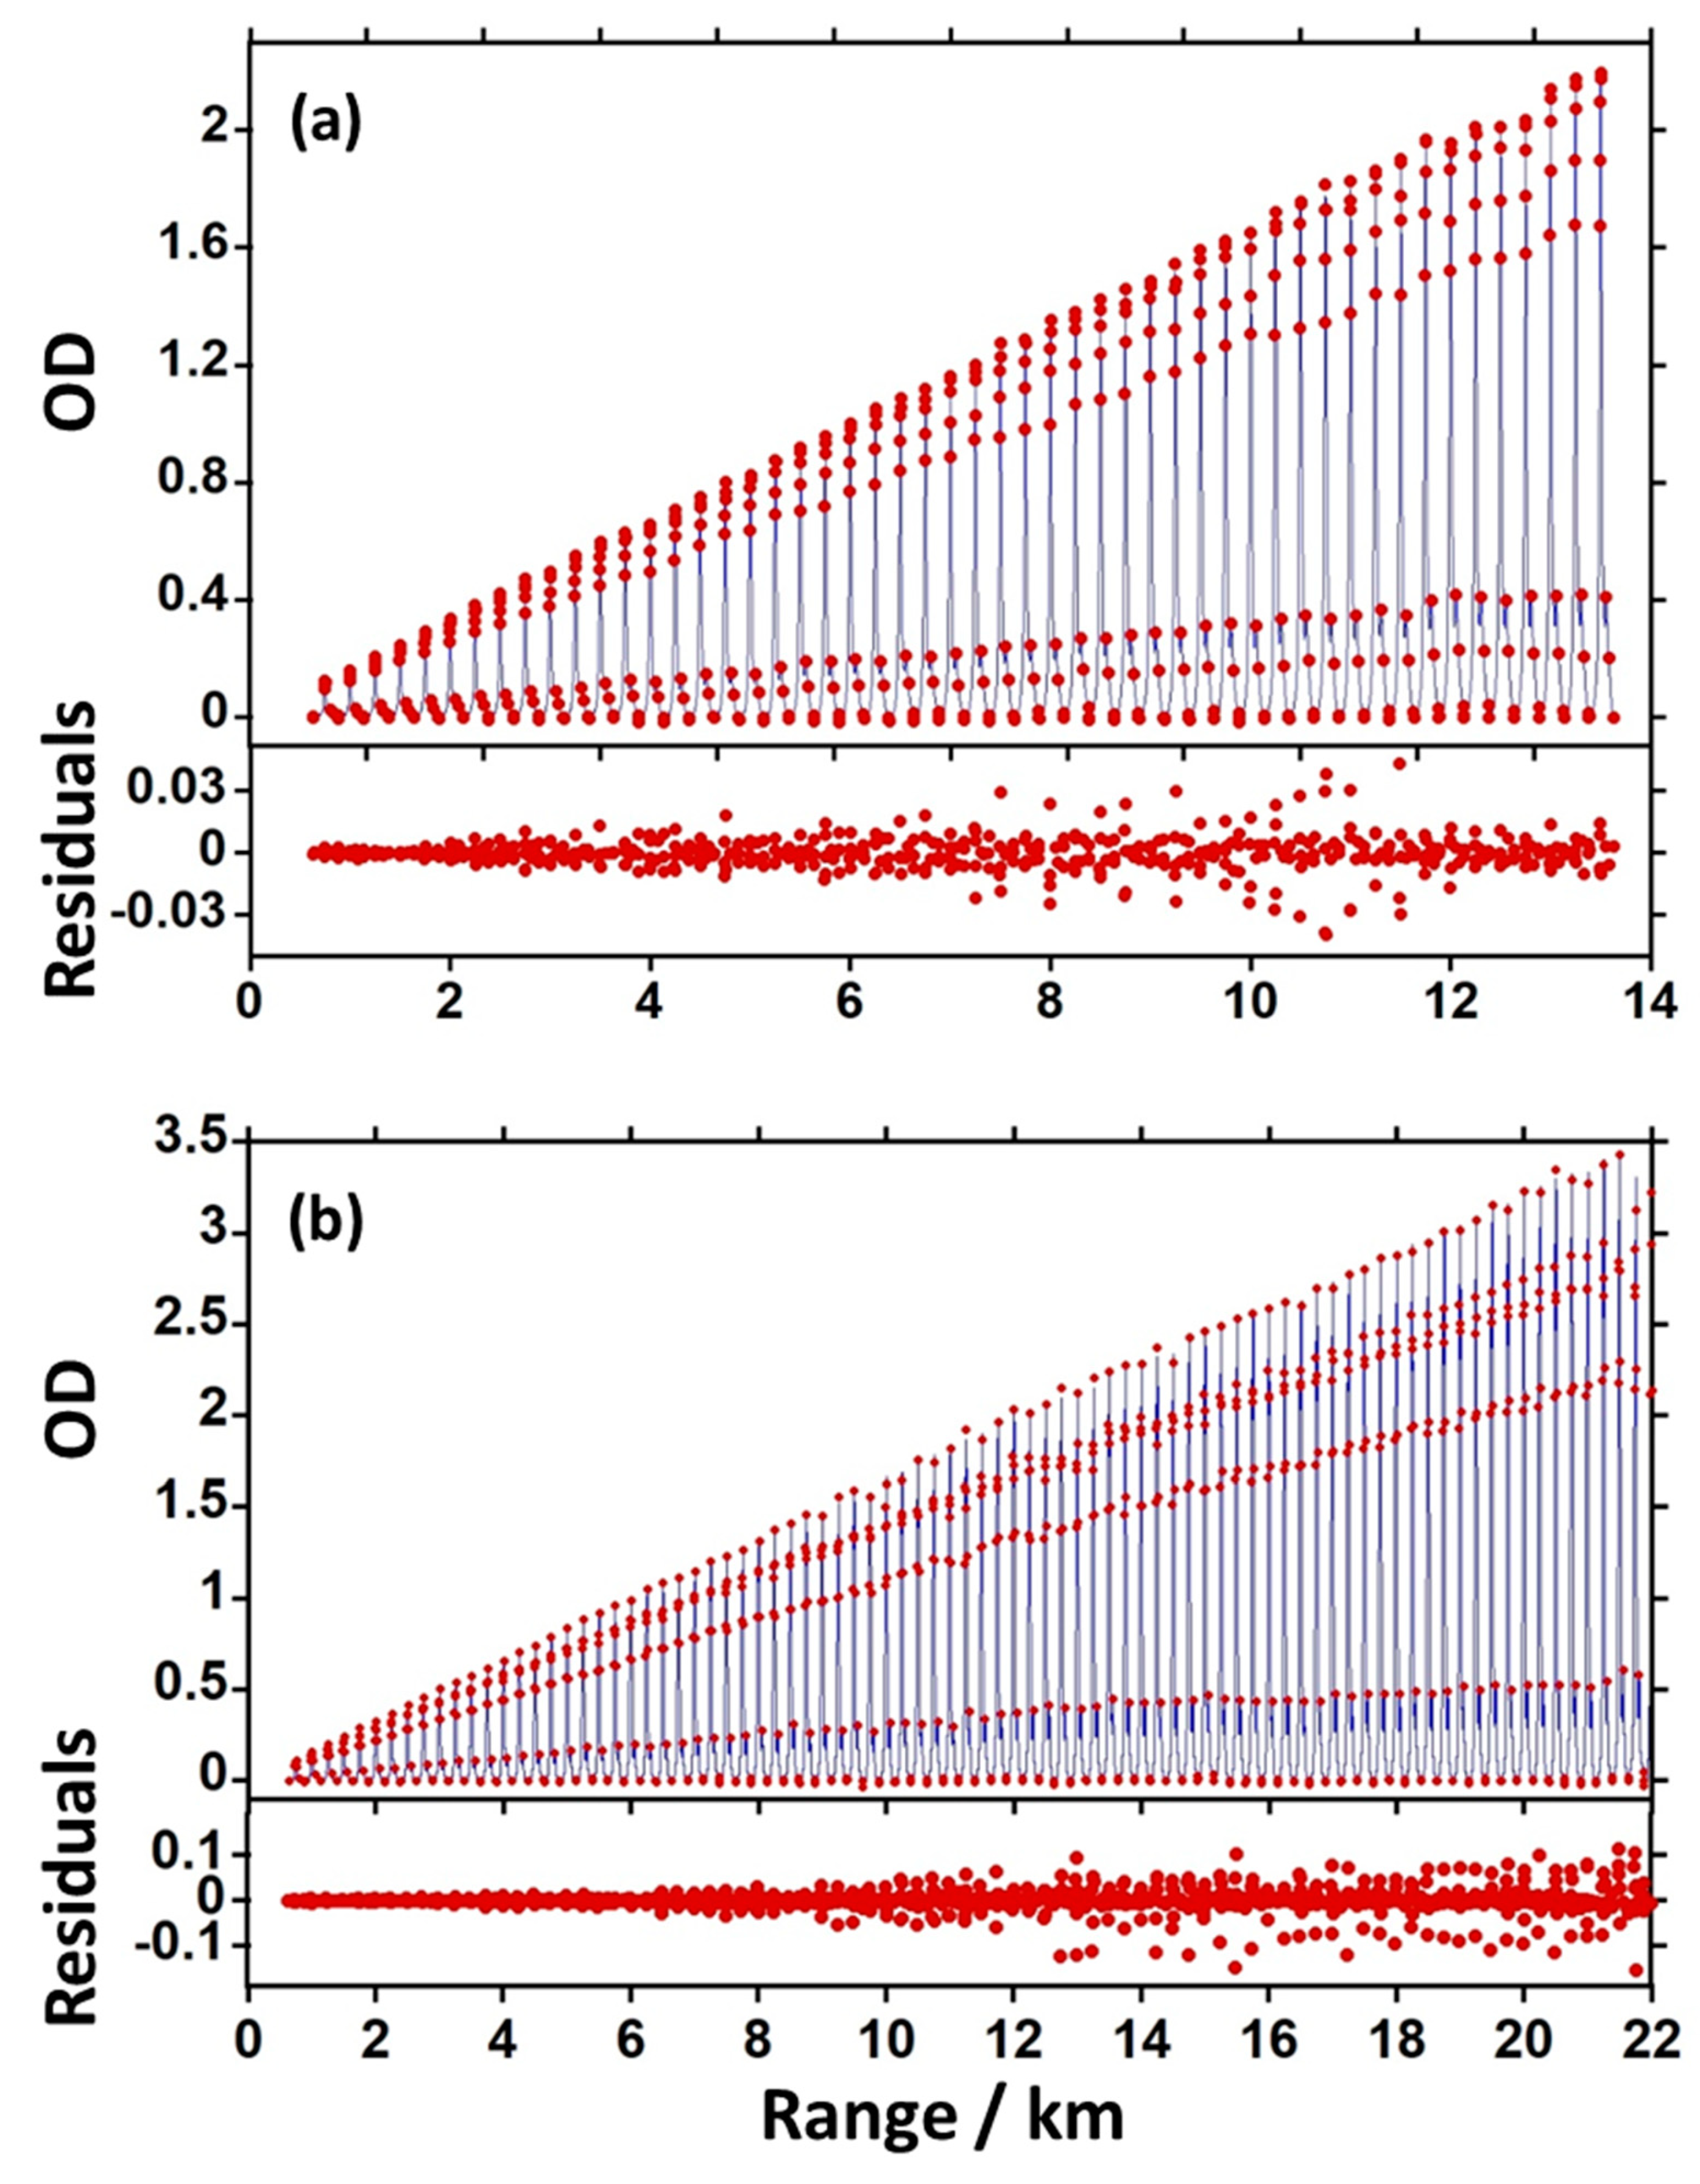
Integrated path (IP-DIAL) line shape fits as a function of range over a single 10 min interval of the (a) CO2/H2O region and (b) CH4/H2O region. Residuals from the fits are shown in the lower panels. The reduction in the residuals in (a) from 12 km to 13.5 km results from large enhancement in backscatter from cloud aerosols. For the CH4/H2O fits in (b), the reduction in the residuals is not as obvious c returns.
Figure 6.
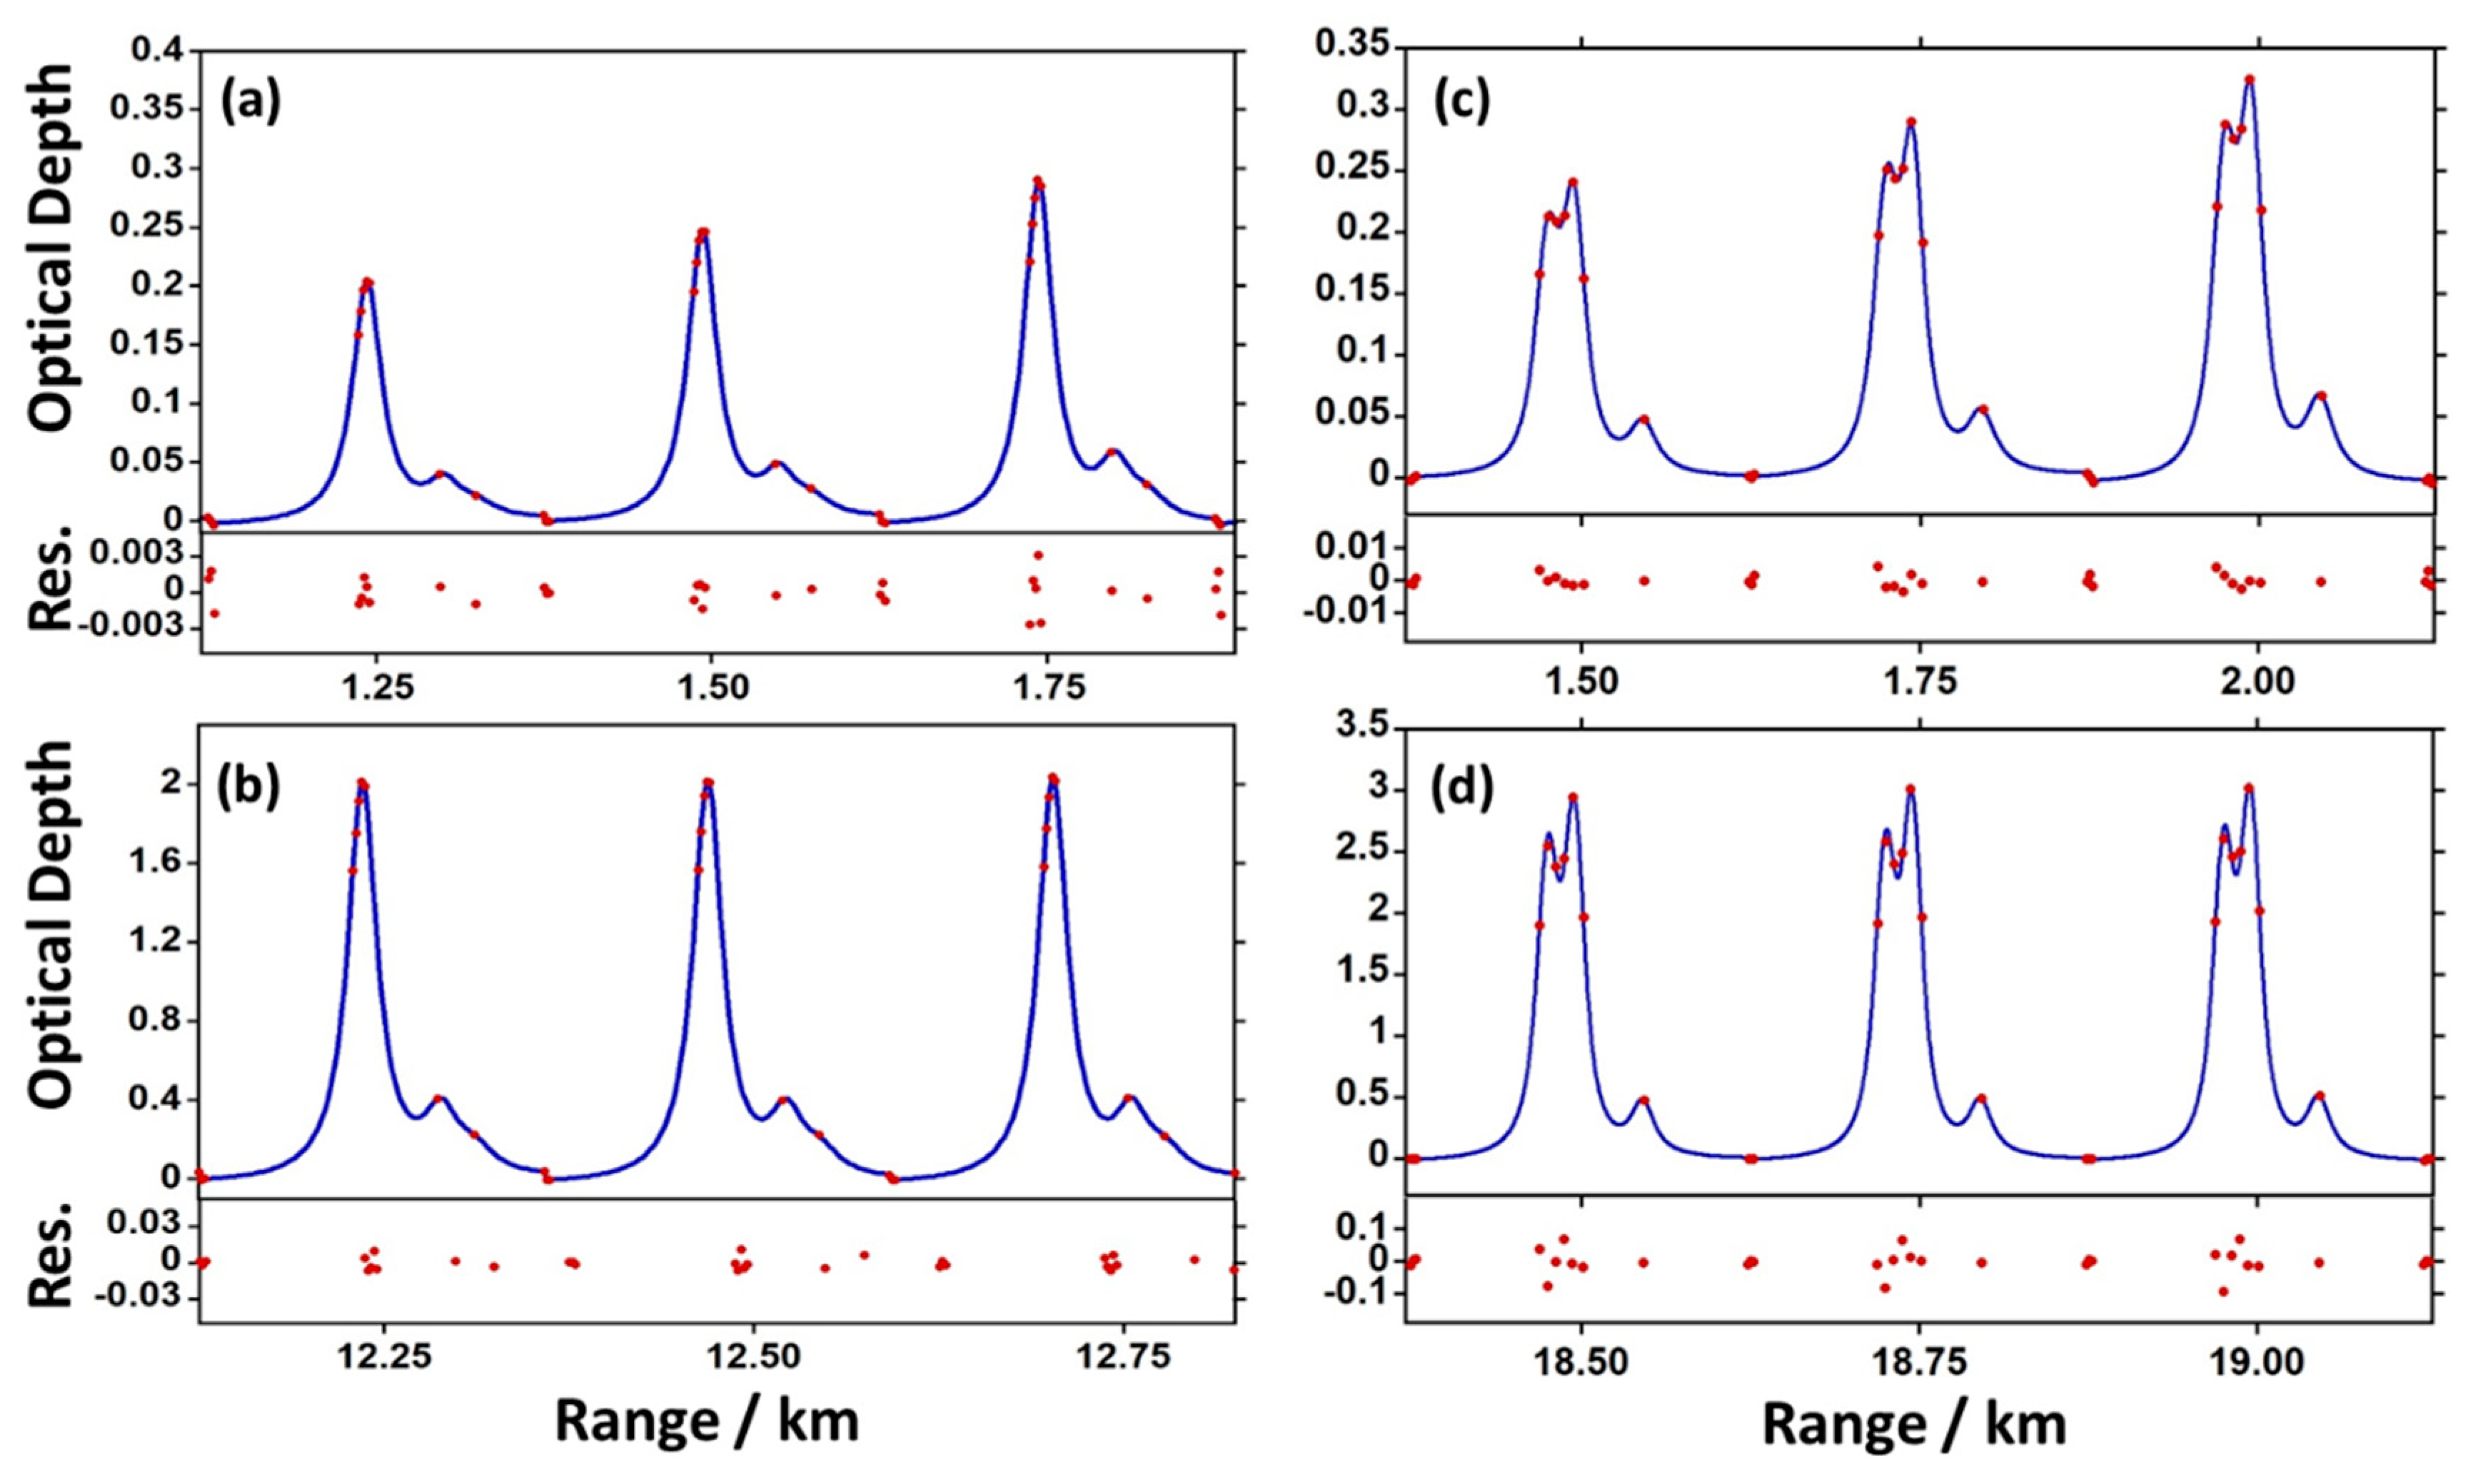
The IP-DIAL data (red dots) and best-fit profiles in the CO2/H2O region shown at different ranges centered at (a) 1.5 km and (b) 12.5 km and in the CH4/H2O region shown at ranges centered at (c) 1.75 km and (d) 18.75 km. The frequency axes of each profile (not shown) span about 1.5 cm-1. The residuals are shown below each profile relative to calculated line shapes (blue) from HITRAN 2020 for the CO2/H2O regions and from HTP for CH4/H2O regions.
Figure 7.
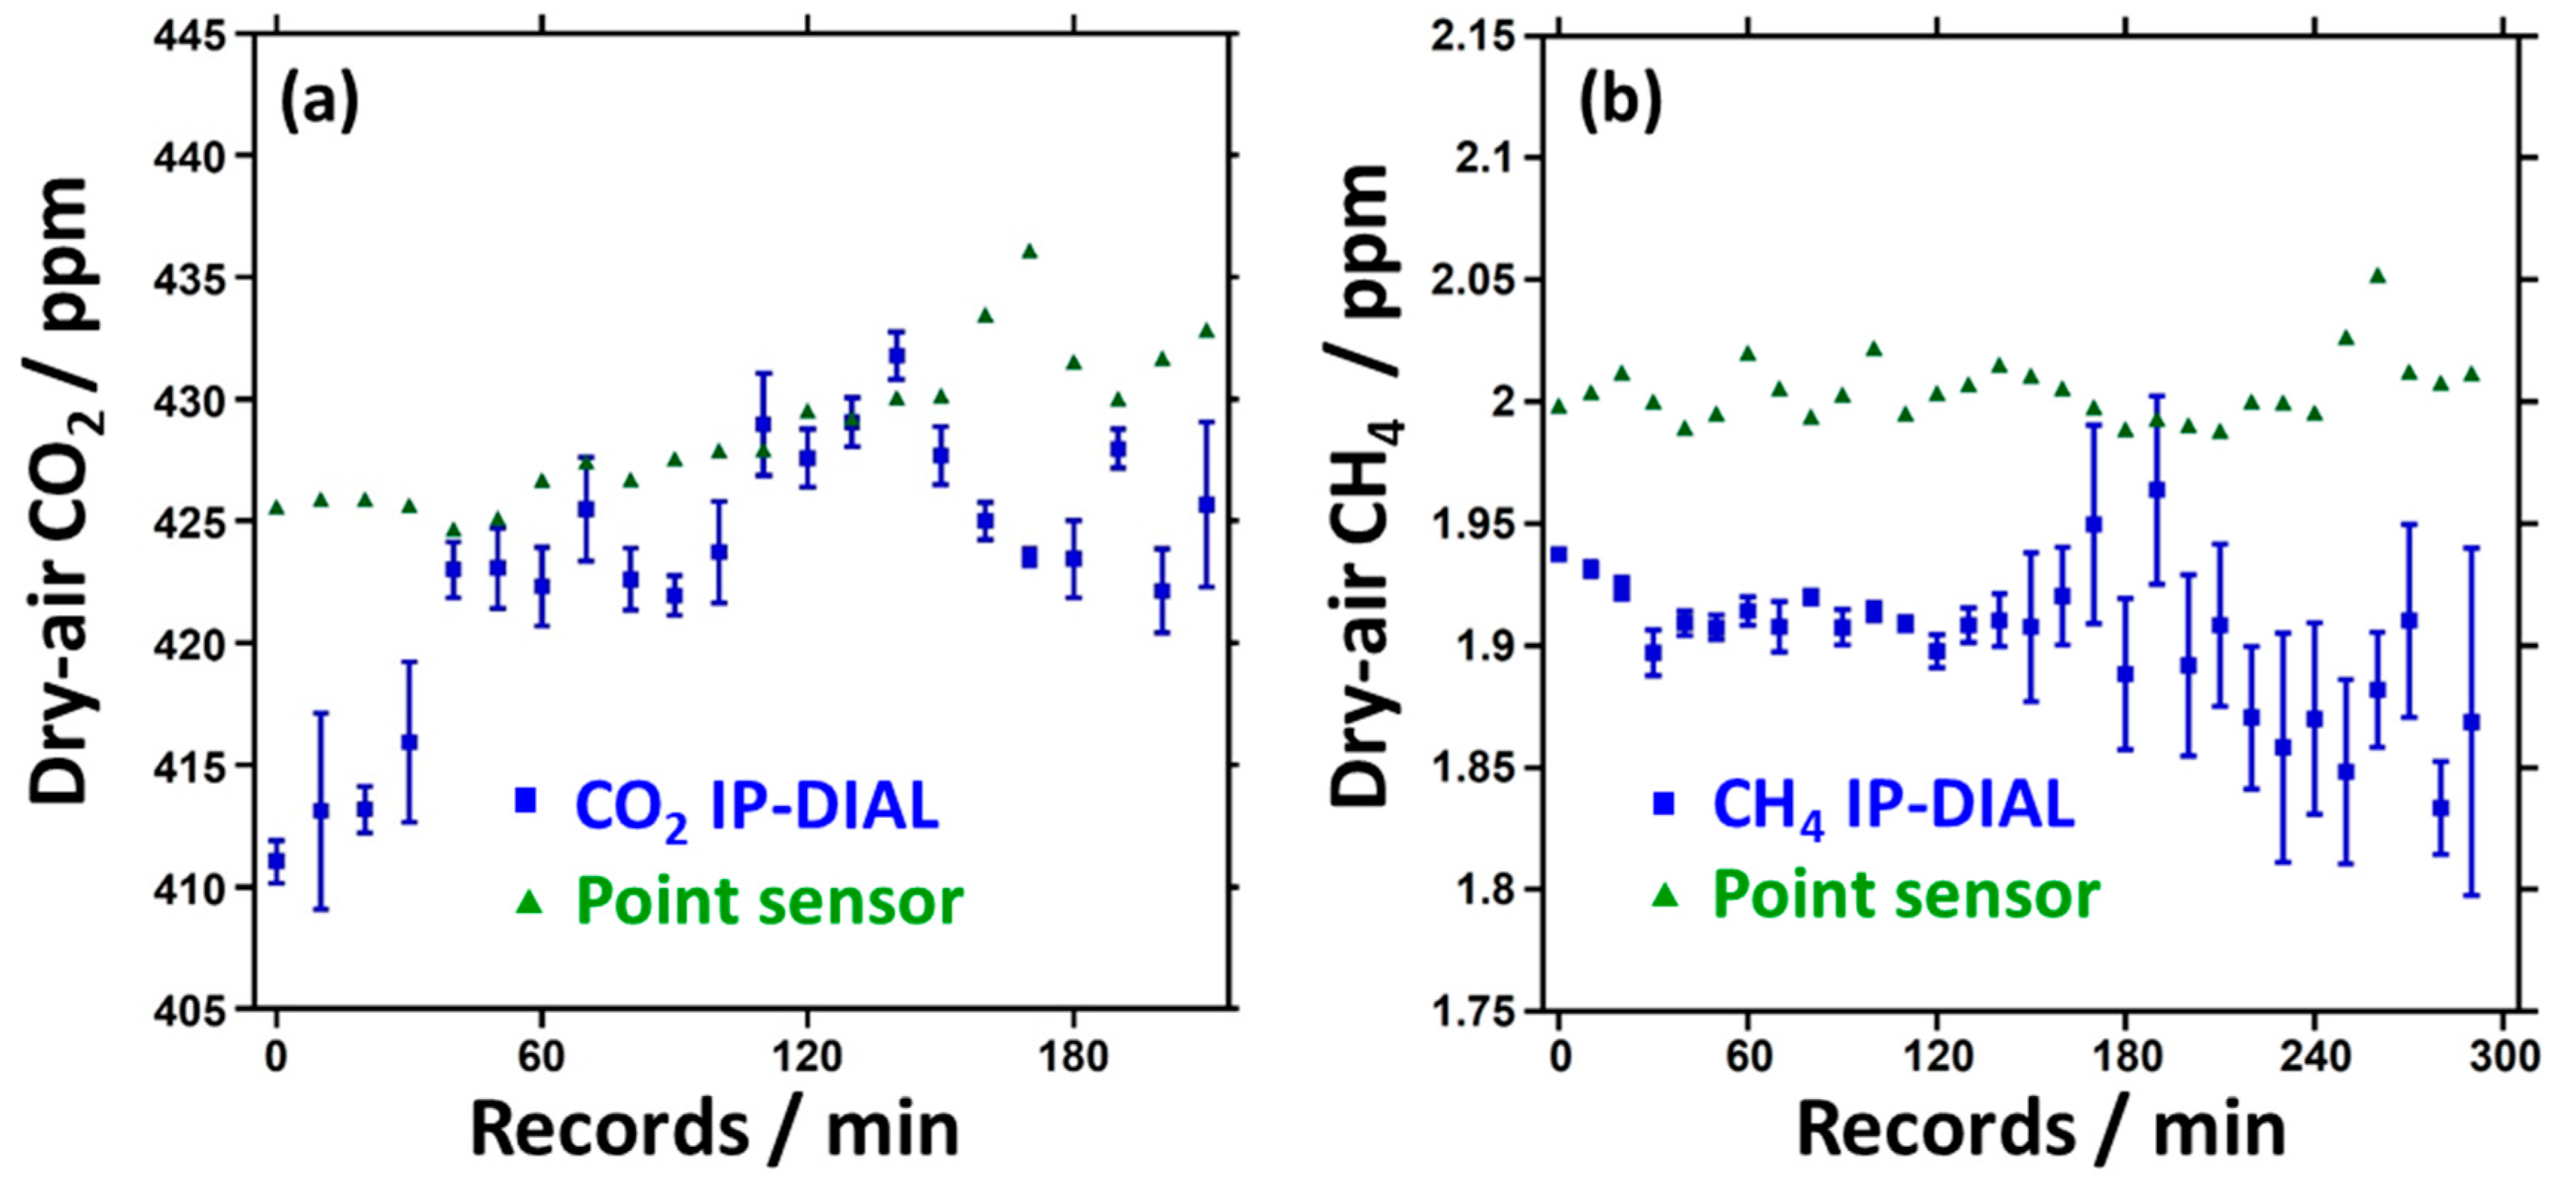
(a) Comparison of the dry-air CO
2 mixing ratios obtained from the slice averaged IPDA data, column averaged DIAL data and the point sensor data over a 3.8 h period on 11/21/2021 and (b) comparison of the dry-air CH
4 mixing ratios obtained from the slice averaged IPDA data, column averaged DIAL data and the point sensor data over a 5 h period on 04/28/2022 (see text for details). Because of the numerous transient emissions likely from a nearby utility plant, the point sensor data in (b) are determined from the baseline values (see
Appendix A).
Figure 8.
DIAL measurement beginning at 20:32 MST on 11/24/2021 consisting of (a) range-resolved dry-air mixing ratios of CO2, (b) H2O near 6241.4 cm-1 from 0.75 km to 10 km and (c) range and background corrected offline LIDAR signal returns. DIAL measurements beginning at 21:50 MST on 04/28/2022 consisting of (d) range-resolved dry-air mixing ratios of CH4, (e) H2O near 6077.0 cm-1 from 0.75 km to 10 km and (f) range and background corrected offline LIDAR signal returns. Missing data are shown as a white background because of very low signal returns.
Figure 9.
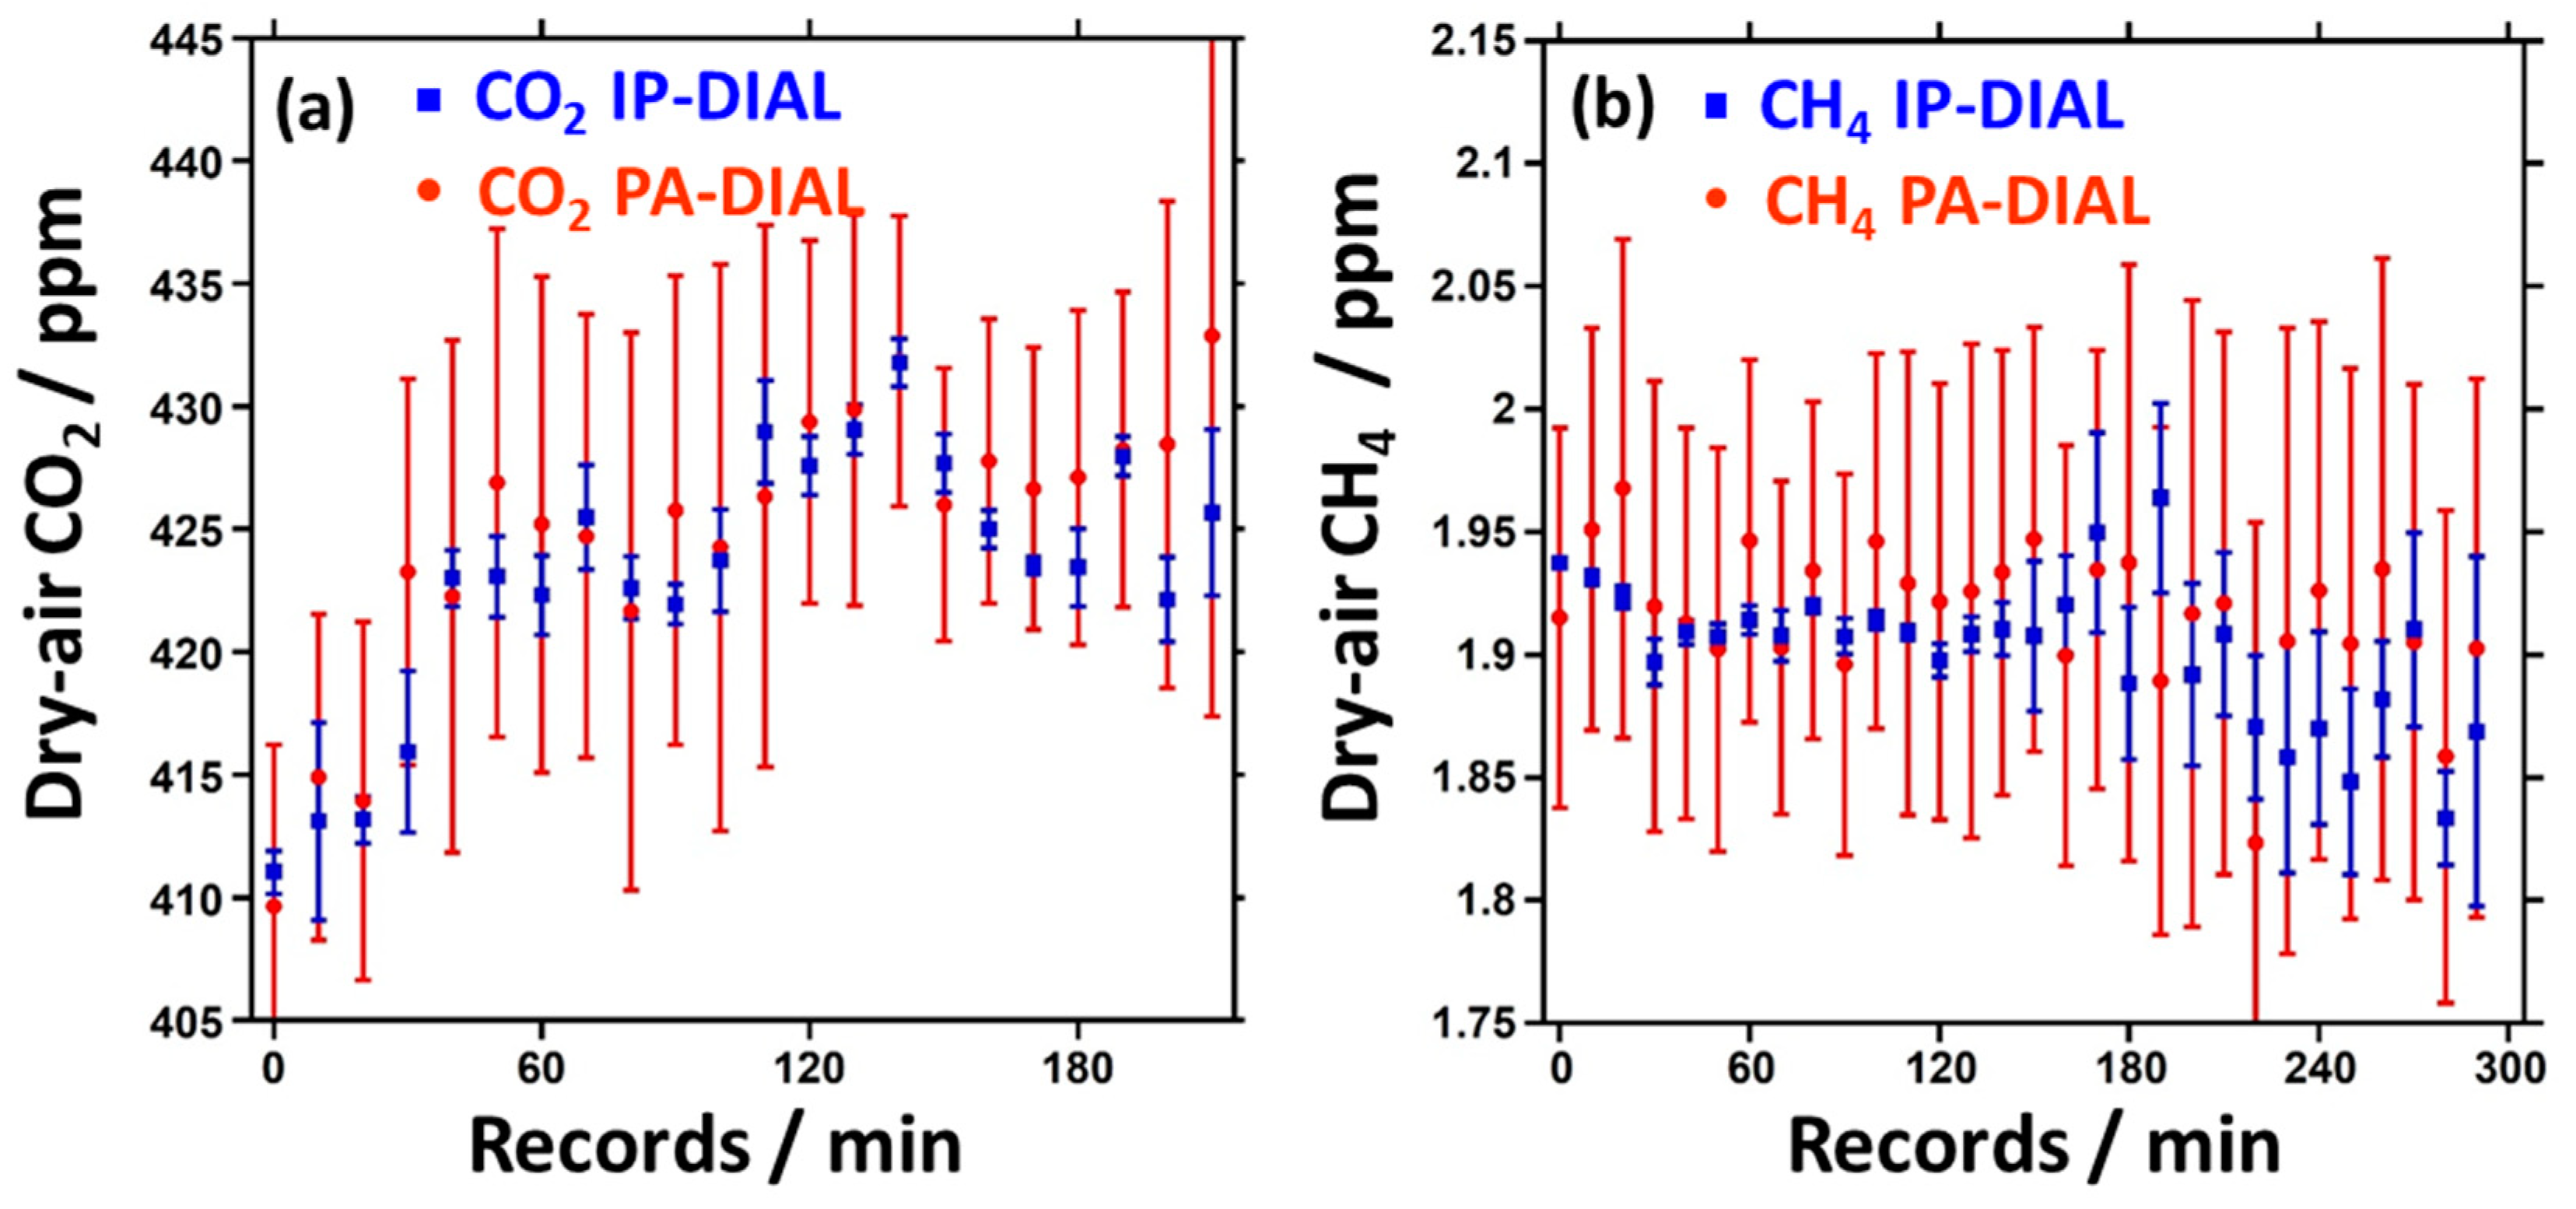
(a) Comparison of the dry-air CO2 mixing ratios obtained from the slice averaged IP-DIAL data (blue squares) and column averaged DIAL data (C-DIAL) (red dots) over a 3.8 h period on 11/21/2021 and (b) comparison of the dry-air CH4 concentrations obtained from the slice averaged IP-DIAL data and column averaged DIAL data (red dots) over a 5 h period on 04/28/2022 (see text for details).
Figure 10.
The best-fit CH4 line shapes using (a) HT08 at the inclination angle, θ = 10.5° (3.4 km in altitude) (b) HTP at θ = 10.5° (3.4 km in altitude), (c) HTP at θ = 6.5° (2.1 km in altitude) and (d) HTP at θ = 12.5° (4.1 km in altitude).
Figure 10.
The best-fit CH4 line shapes using (a) HT08 at the inclination angle, θ = 10.5° (3.4 km in altitude) (b) HTP at θ = 10.5° (3.4 km in altitude), (c) HTP at θ = 6.5° (2.1 km in altitude) and (d) HTP at θ = 12.5° (4.1 km in altitude).
Figure 11.
The best-fit path-averaged pressures to a continual IP-DIAL series of line shape profiles for (a) the 2nd 10 min interval and (b) the 7th 10 min interval that sample high and low altitude cloud aerosol regions, respectively. These column intervals are indicated on the LIDAR map in (c) with white dashed vertical lines and the yellow squares indicate the 250 m range bin profiles used as the start and end positions for the pressure fits. The best-fit path-averaged pressures are shown in (d) for a series of DIAL-like profile differences taken between 250 m range bin profiles spaced by 6 km and shown as a function of the average range defined by the midpoints of these 6 km spacings. In all cases, the error bars represent the 1σ (Type A, k=1) uncertainties obtained directly from the fits. The yellow and red lines in each plot represent the pitch angles (θ) for the path-averaged T&P profiles based on the U.S. Standard Atmosphere.
Table 1.
Specifications of the OPO based DIAL/IP-DIAL system
a [
22].
Table 1.
Specifications of the OPO based DIAL/IP-DIAL system
a [
22].
| Frequency Converter: |
|
|
| Wavelength coverage |
1600 nm to 1647 nm |
New Focus, ECDL |
| Number of frequencies |
10 |
Spectral coverage ≈ 80 GHz |
| PRF, SRF |
100 Hz, 10 Hz |
1064 nm, Coherent Infinity |
| Pulse energy |
7 mJ |
at Ep=175 mJ |
| Microwave Synthesizer |
20 GHz bandwidth |
MW, Anritsu, MG37022A |
| Electro-optic modulator |
10 GHz bandwidth |
EOM1, Thorlabs |
| Acousto-optic modulator |
50 MHz |
Brimrose |
| Electro-optic modulator |
20 GHz bandwidth |
EOM2, EOSpace |
| Invar filter cavity |
300 MHz free spectral range |
Burleigh, CFP-500, l = 0.5 m |
| Spectral purity |
>99.9% |
Filter cavity finesse ≈ 500 |
| Booster optical amplifier |
20 mW, <20 dB gain |
BOA, Thorlabs, S9FC1082P |
| Pulse length (FWHM) |
< 3 ns |
Pump pulse ≈ 3 ns FWHM |
| Spectral linewidth (FWHM) |
190 MHz |
Near transform limited |
| Two OPO KTA Crystals |
10x10x15 mm3, θ=67.4°, φ=0° |
Optical Platz, Inc |
| OPO |
RISTRA, twisted rectangle |
AS Photonics, Inc |
| Tx/Rx optics and detectors: |
|
|
| Tx beam diameter |
127 mm |
Ritchey-Chrétien, Orion |
| NF Rx telescope diameter |
279.4 mm |
Schmidt-Cassegrain, Celestron |
| FF Rx telescope diameter |
406.5 mm |
Schmidt-Cassegrain, Meade |
| Bandpass filter, 1645.5 nm |
1.9 nm (FWHM), T>90% |
> 5 OD rejection, Alluxa |
| Bandpass filter, 1602.2 nm |
2.0 nm (FWHM), T>90% |
> 5 OD rejection, Materion |
| Neutral density filter |
0.1, 0.3, 0.6, and 1 OD |
Thorlabs |
| Fiber coupled |
300 μm aperture |
1 m cable length |
| PMT detection |
~2% QE |
Hamamatsu H12397-75 |
| PMT detection |
~8% QE |
Hamamatsu H12397-75 SEL |
| Data acquisition: |
|
|
| Transimpedance amp |
5 kV/A, τ3dB ≈ 1 ns |
Femto HCA-400M-5K-C |
| Digitizer |
8 bits, 2 GS/s, 2 channels |
GaGe CobraMax CSE24G8 |
| Raw data storage |
10 s accumulation |
NetCDF4 file format |
| Range bin resolution |
250 m to 500 m |
Defined in post-processing |
| Temporal resolution |
5 min |
DIAL concentration average |
