Submitted:
03 October 2023
Posted:
03 October 2023
You are already at the latest version
Abstract
Keywords:
1. Introduction
2. Results
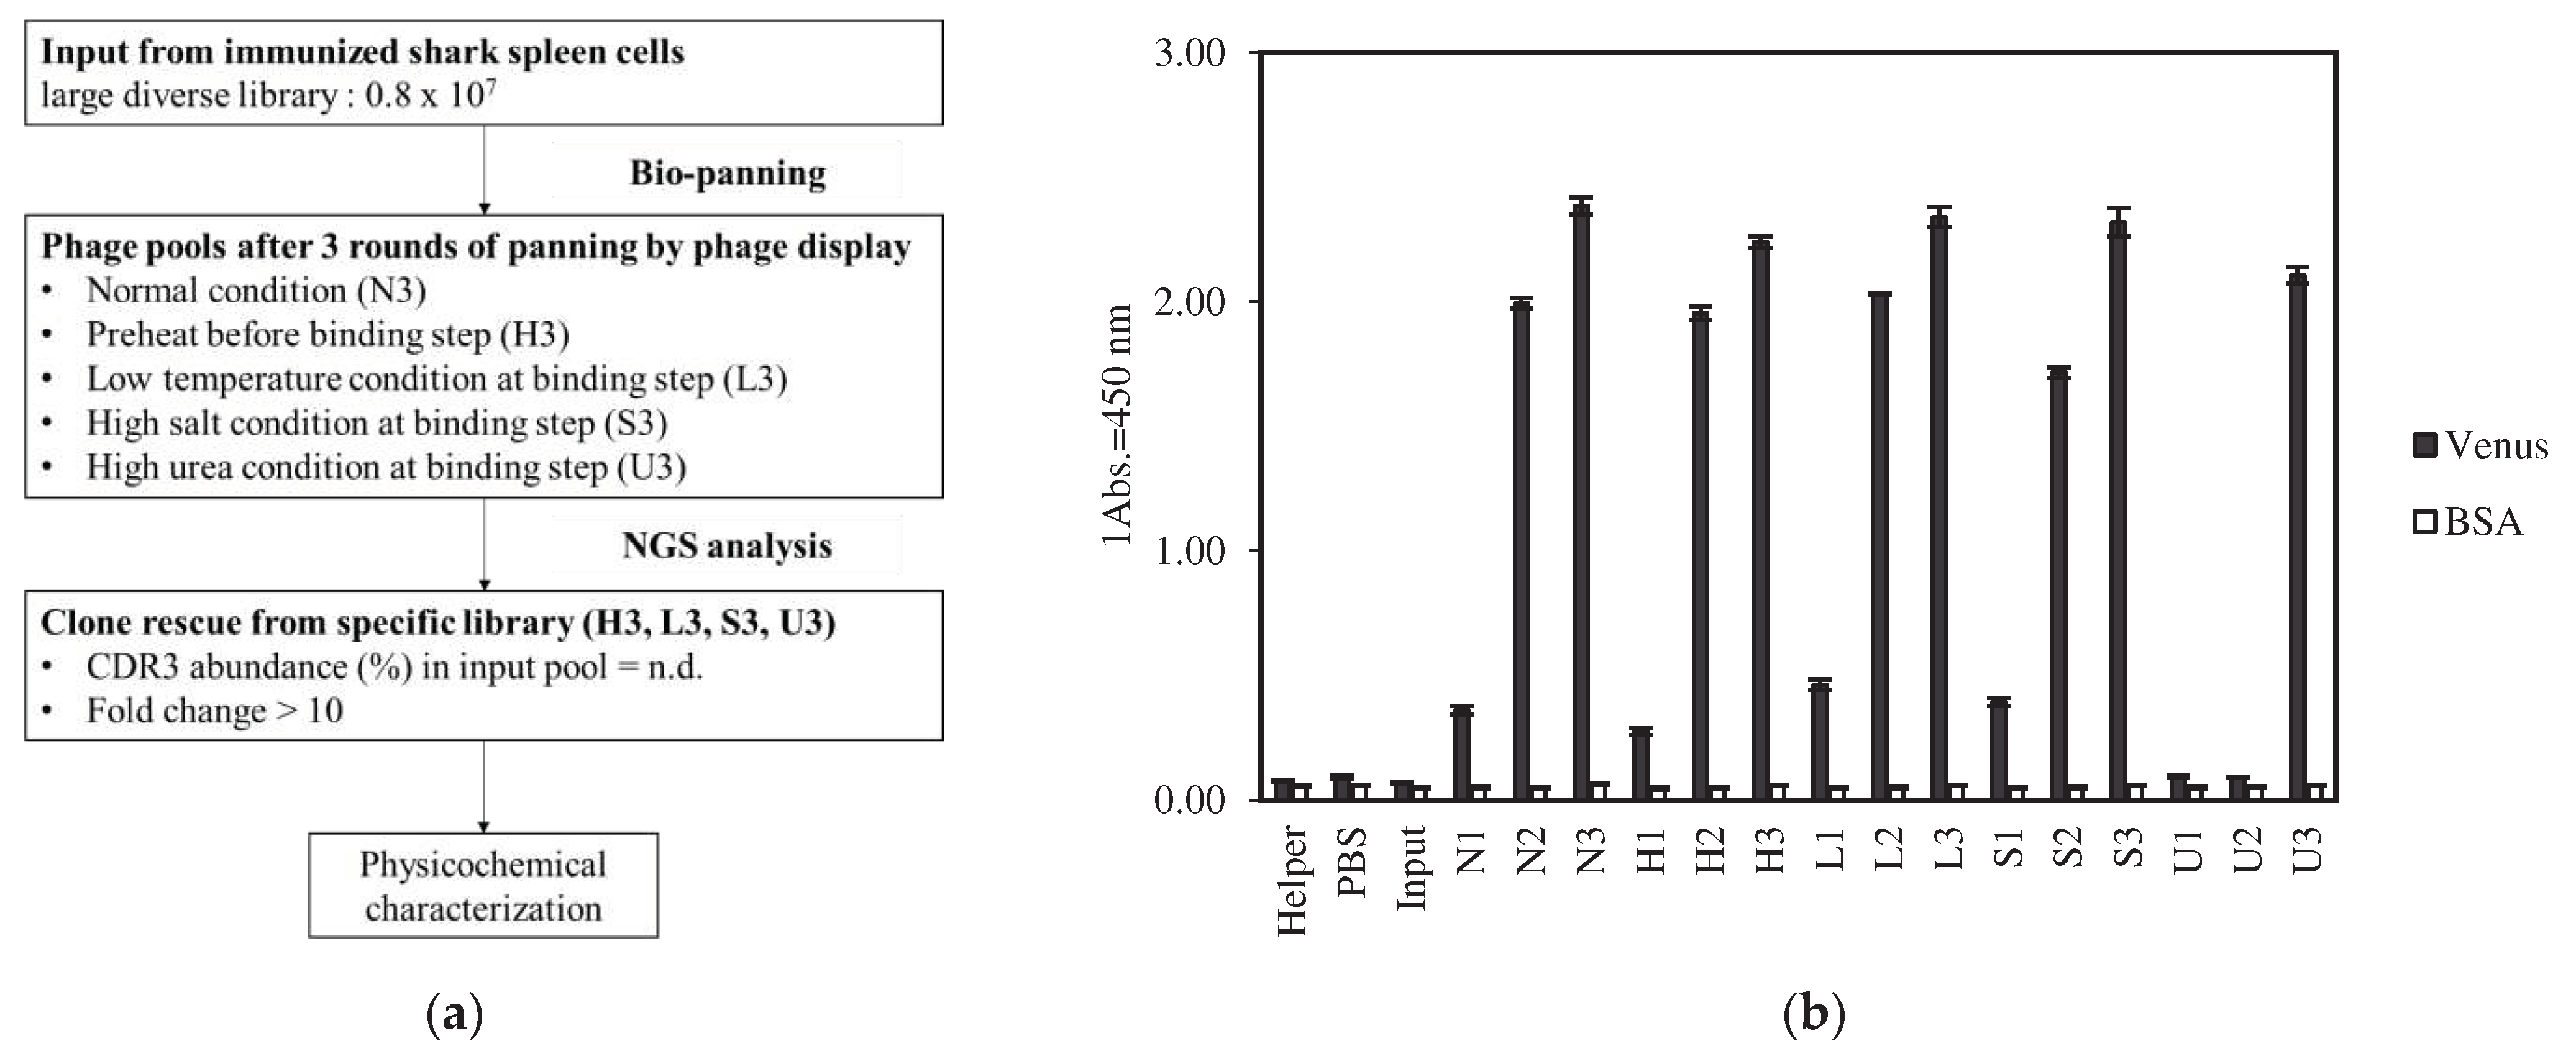
2.1. Identification of Various Kinds of VNAR under Different Panning Condition
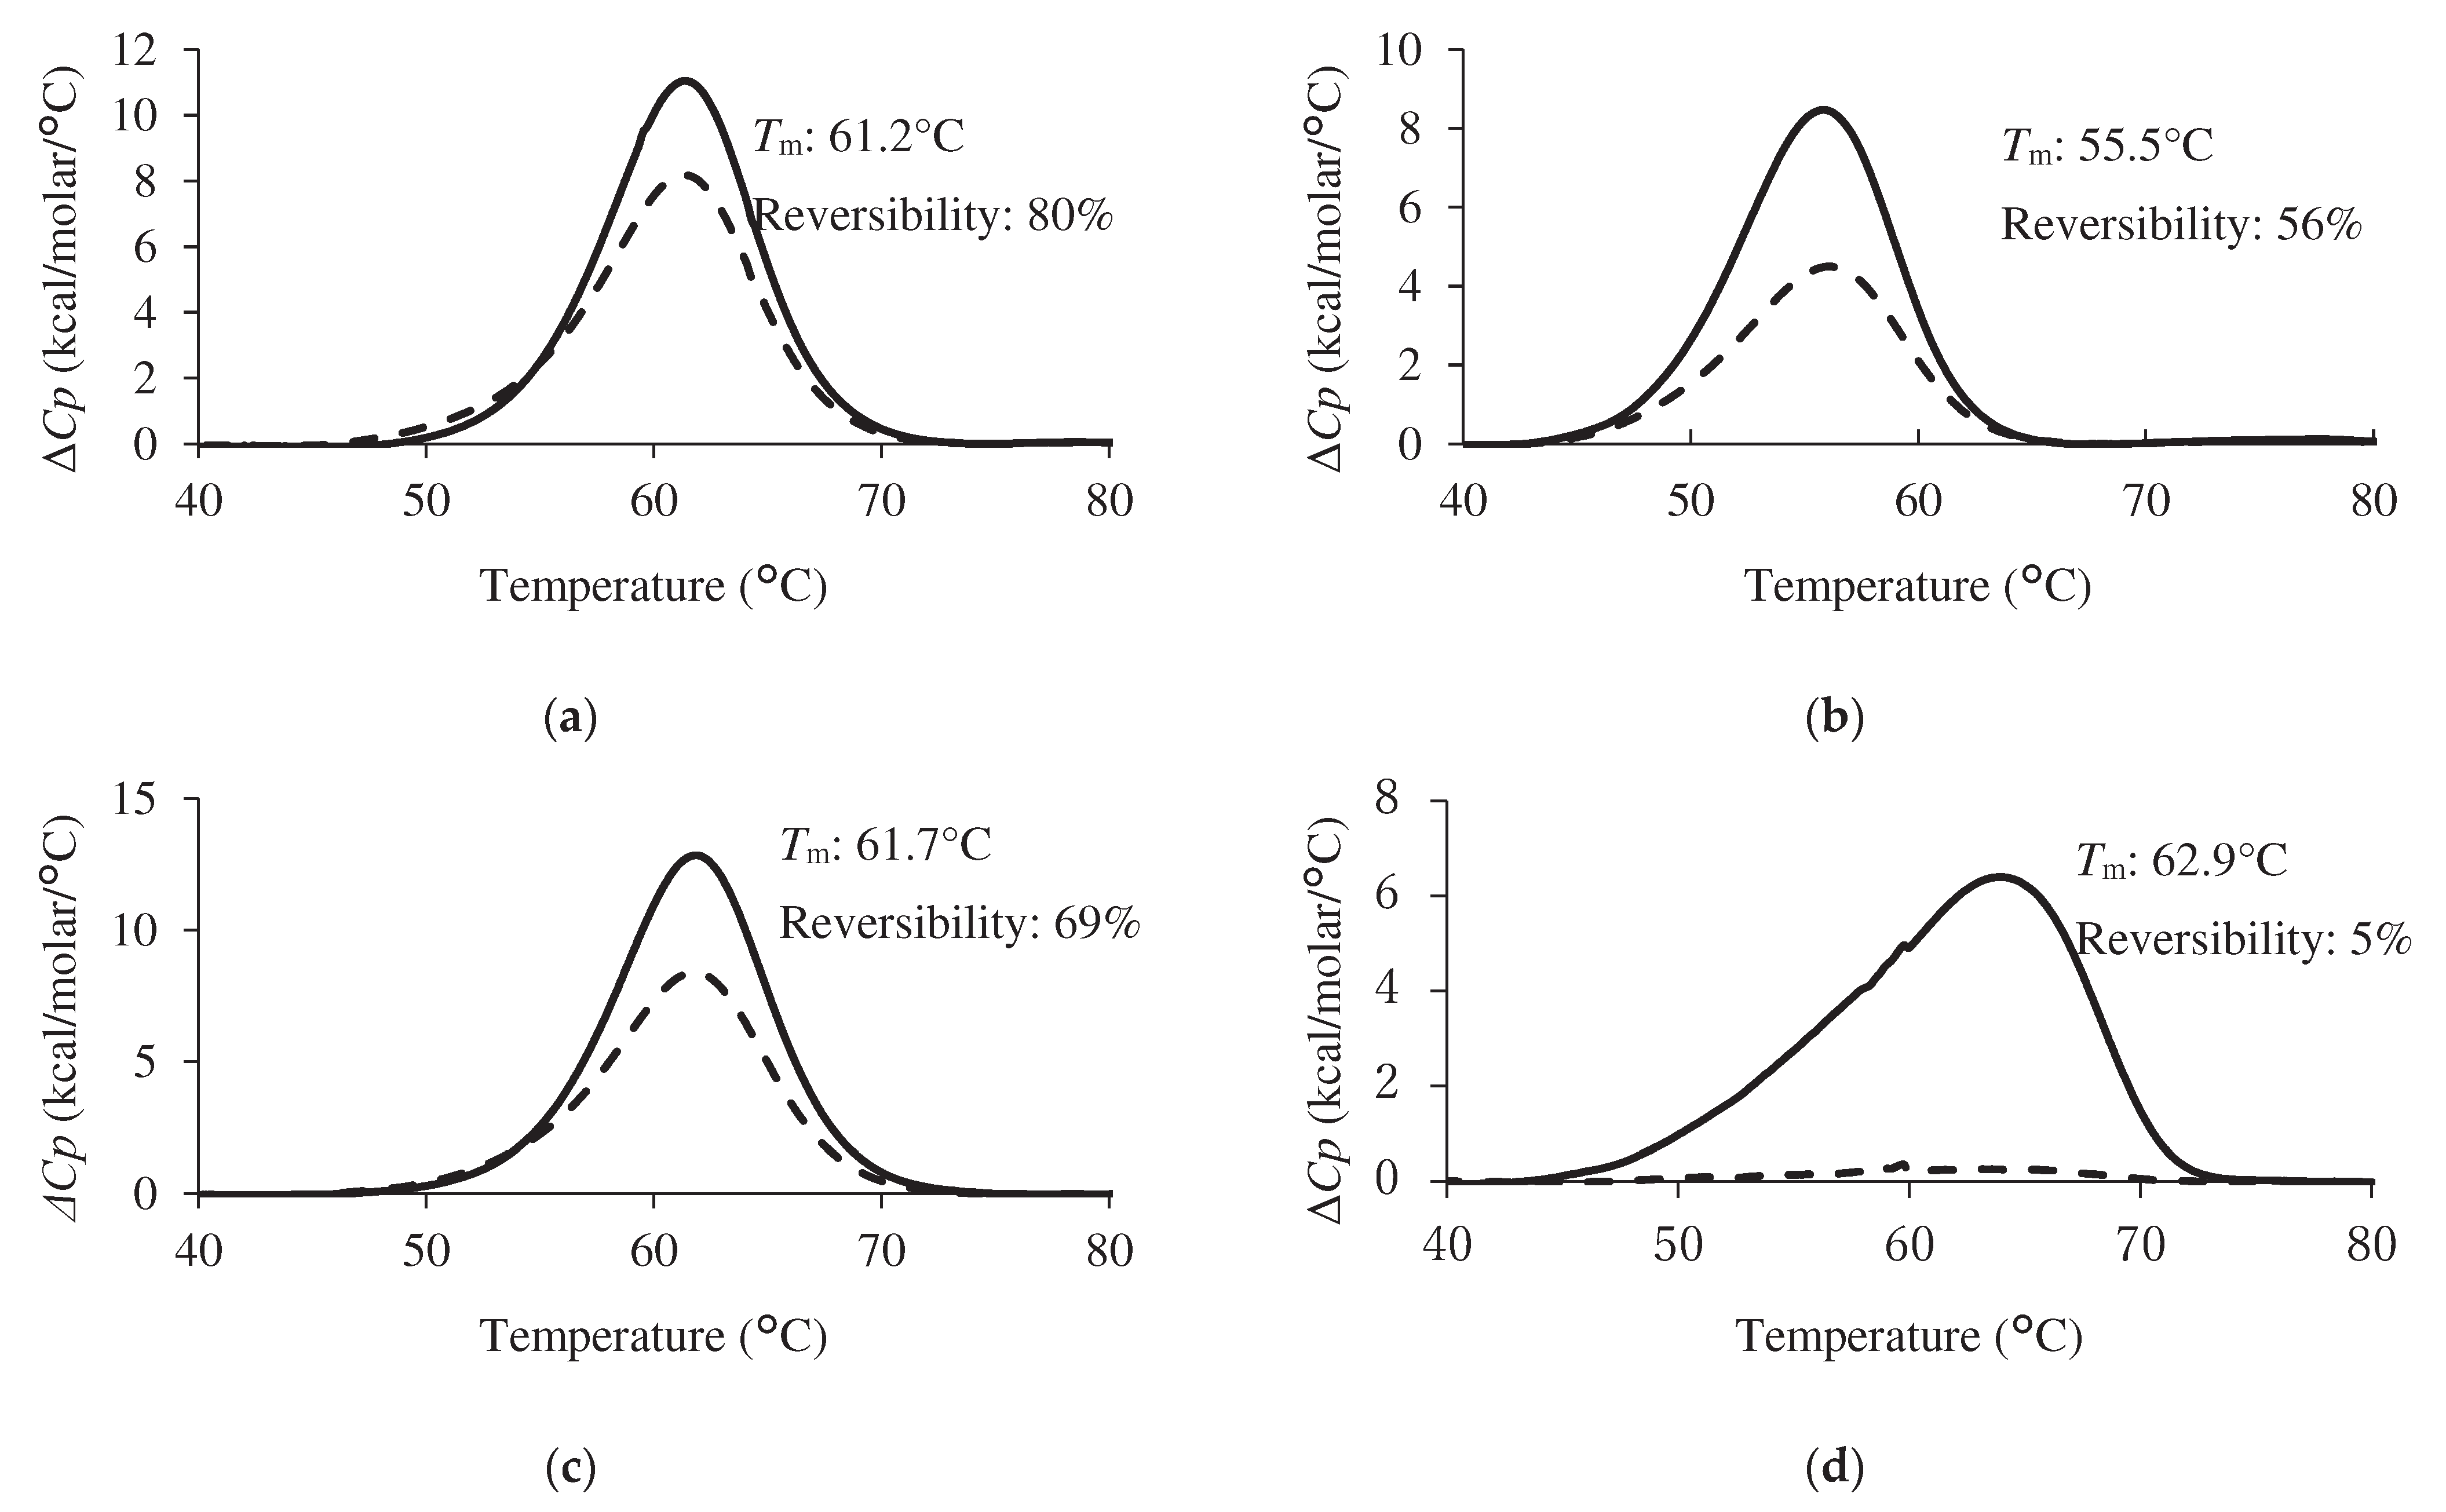
2.3. Analysis of Thermal Stability and Reversibility
3. Discussion
4. Materials and Methods
4.1. Phage Display and Panning Method
4.2. Phage ELISA
4.3. NGS Analysis of VNAR Phage Pool and Clone Selection
4.4. Expression and Purification of VNAR
4.5. Evaluation of Purity by SDS-PAGE
4.6. Evaluation of the Reactivity under each Condition by ELISA
4.7. Differential Scanning Calorimetry (DSC)
4.8. Isothermal Titration Calorimetry (ITC)
4.9. Surface Plasmon Response (SPR)
5. Conclusions
Supplementary Materials
Author Contributions
Funding
Institutional Review Board Statement
Data Availability Statement
Acknowledgments
Conflicts of Interest
References
- Griffiths, K.; Dolezal, O.; Parisi, K.; Angerosa, J.; Dogovski, C.; Barraclough, M.; Sanalla, A.; Casey, J.; González, I.; Perugini, M.; et al. Shark variable new antigen receptor (VNAR) single domain antibody fragments: stability and diagnostic applications. Antibodies 2013, 2, 66–81. [CrossRef]
- Liu, J.L.; Anderson, G.P.; Delehanty, J.B.; Baumann, R.; Hayhurst, A.; Goldman, E.R. Selection of cholera toxin specific IgNAR single-domain antibodies from a naive shark library. Mol. Immunol. 2007, 44, 1775–1783. [CrossRef]
- Wesolowski, J.; Alzogaray, V.; Reyelt, J.; Unger, M.; Juarez, K.; Urrutia, M.; Cauerhff, A.; Danquah, W.; Rissiek, B.; Scheuplein, F.; et al. Single domain antibodies: promising experimental and therapeutic tools in infection and immunity. Med. Microbiol. Immunol. 2009, 198, 157–174. [CrossRef]
- Feng, M.; Bian, H.; Wu, X.; Fu, T.; Fu, Y.; Hong, J.; Fleming, B.D.; Flajnik, M.F.; Ho, M. Construction and next-generation sequencing analysis of a large phage-displayed VNAR single-domain antibody library from six naïve nurse sharks. Antib. Ther. 2019, 2, 1–11. [CrossRef]
- Barelle, C.; Gill, D.S.; Charlton, K. Shark novel antigen receptors—the next generation of biologic therapeutics? Adv. Exp. Med. Biol. 2009, 655, 49–62. [CrossRef]
- Cheong, W.S.; Leow, C.Y.; Abdul Majeed, A.B.A.; Leow, C.H. Diagnostic and therapeutic potential of shark variable new antigen receptor (VNAR) single domain antibody. Int. J. Biol. Macromol. 2020, 147, 369–375. [CrossRef]
- Zielonka, S.; Weber, N.; Becker, S.; Doerner, A.; Christmann, A.; Christmann, C.; Uth, C.; Fritz, J.; Schäfer, E.; Steinmann, B.; et al. Shark Attack: high affinity binding proteins derived from shark vNAR domains by stepwise in vitro affinity maturation. J. Biotechnol. 2014, 191, 236–245. [CrossRef]
- Zielonka, S.; Empting, M.; Grzeschik, J.; Könning, D.; Barelle, C.J.; Kolmar, H. Structural insights and biomedical potential of IgNAR scaffolds from sharks. mAbs 2015, 7, 15–25. Available online: http://www.ncbi.nlm.nih.gov/pubmed/25523873. [CrossRef]
- Cabanillas-Bernal, O.; Dueñas, S.; Ayala-Avila, M.; Rucavado, A.; Escalante, T.; Licea-Navarro, A.F. Synthetic libraries of shark vNAR domains with different cysteine numbers within the CDR3. PLOS ONE 2019, 14, e0213394. [CrossRef]
- Dooley, H.; Flajnik, M.F.; Porter, A.J. Selection and characterization of naturally occurring single-domain (IgNAR) antibody fragments from immunized sharks by phage display. Mol. Immunol. 2003, 40, 25–33. [CrossRef]
- Turner, K.B.; Naciri, J.; Liu, J.L.; Anderson, G.P.; Goldman, E.R.; Zabetakis, D. Next-generation sequencing of a single domain antibody repertoire reveals quality of phage display selected candidates. PLOS ONE 2016, 11, e0149393. [CrossRef]
- Ljungars, A.; Svensson, C.; Carlsson, A.; Birgersson, E.; Tornberg, U.C.; Frendéus, B.; Ohlin, M.; Mattsson, M. Deep mining of complex antibody phage pools generated by cell panning enables discovery of rare antibodies binding new targets and epitopes. Front. Pharmacol. 2019, 10, 847. [CrossRef]
- Pershad, K.; Kay, B.K. Generating thermal stable variants of protein domains through phage display. Methods 2013, 60, 38–45. [CrossRef]
- Igawa, T.; Ishii, S.; Tachibana, T.; Maeda, A.; Higuchi, Y.; Shimaoka, S.; Moriyama, C.; Watanabe, T.; Takubo, R.; Doi, Y.; et al. Antibody recycling by engineered pH-dependent antigen binding improves the duration of antigen neutralization. Nat. Biotechnol. 2010, 28, 1203–1207. [CrossRef]
- Luciani, F.; Bull, R.A.; Lloyd, A.R. Next generation deep sequencing and vaccine design: today and tomorrow. Trends Biotechnol. 2012, 30, 443–452. [CrossRef]
- Zeidel, J.D.; Mathai, J.C.; Campbell, J.D.; Ruiz, W.G.; Apodaca, G.L.; Riordan, J.; Zeidel, M.L. Selective permeability barrier to urea in shark rectal gland. Am. J. Physiol. Ren. Physiol. 2005, 289, 83–89. [CrossRef]
- Nagai, T.; Ibata, K.; Park, E.S.; Kubota, M.; Mikoshiba, K.; Miyawaki, A. A variant of yellow fluorescent protein with fast and efficient maturation for cell-biological applications. Nat. Biotechnol. 2002, 20, 87–90. [CrossRef]
- Compagno, L.J.V.; Niem, S., J.D. Hemitriakis falcata n.sp. and H. abdita n.sp., two new houndsharks (Carcharhiniformes: Triakidae) from Australia. Rec. Aust. Museum 1993, 45, 195–220. [CrossRef]
- Honda, Y.; Kondo, H.; Caipang, C.M.; Hirono, I.; Aoki, T. cDNA cloning of the immunoglobulin heavy chain genes in banded houndshark Triakis scyllium. Fish Shellfish Immunol. 2010, 29, 854–861. [CrossRef]
- Ohtani, M.; Hikima, J.; Jung, T.S.; Kondo, H.; Hirono, I.; Aoki, T. Construction of an artificially randomized IgNAR phage display library: screening of variable regions that bind to hen egg white lysozyme. Mar. Biotechnol. (NY) 2013, 15, 56–62. [CrossRef]
- Ohtani, M.; Hikima, J.; Jung, T.S.; Kondo, H.; Hirono, I.; Takeyama, H.; Aoki, T. Variable domain antibodies specific for viral hemorrhagic septicemia virus (VHSV) selected from a randomized IgNAR phage display library. Fish Shellfish Immunol. 2013, 34, 724–728. [CrossRef]
- Kim, W.S.; Chae, H.D.; Jung, I.; Lee, W.K.; Lee, W.J.; Lee, J.; Gong, Y.; Lee, D.; Kim, B.W.; Kim, J.K.; et al. Isolation and characterization of single domain antibodies from banded houndshark (Triakis scyllium) targeting SARS-CoV-2 spike RBD protein. Fish Shellfish Immunol. 2023, 138, 108807. [CrossRef]
- Takeda, H.; Ozawa, T.; Zenke, H.; Ohnuki, Y.; Umeda, Y.; Zhou, W.; Tomoda, H.; Takechi, A.; Narita, K.; Shimizu, T.; et al. VNAR development through antigen immunization of Japanese topeshark (Hemitriakis japanica). Front. Bioeng. Biotechnol. 2023, 11. [CrossRef]
- O’Connell, M.A.; Belanger, B.A.; Haaland, P.D. Calibration and assay development using the four-parameter logistic model. Intell. Lab. Syst. 1993, 20, 97–114. [CrossRef]
- Kim, D.Y.; To, R.; Kandalaft, H.; Ding, W.; van Faassen, H.; Luo, Y.; Schrag, J.D.; St-Amant, N.; Hefford, M.; Hirama, T.; et al. Antibody light chain variable domains and their biophysically improved versions for human immunotherapy. mAbs 2014, 6, 219–235. [CrossRef]
- Joshi, V.; Shivach, T.; Yadav, N.; Rathore, A.S. Circular dichroism spectroscopy as a tool for monitoring aggregation in monoclonal antibody therapeutics. Anal. Chem. 2014, 86, 11606–11613. [CrossRef]
- Brader, M.L.; Estey, T.; Bai, S.; Alston, R.W.; Lucas, K.K.; Lantz, S.; Landsman, P.; Maloney, K.M. Examination of thermal unfolding and aggregation profiles of a series of developable therapeutic monoclonal antibodies. Mol. Pharm. 2015, 12, 1005–1017. [CrossRef]
- Navratilova, I.; Papalia, G.A.; Rich, R.L.; Bedinger, D.; Brophy, S.; Condon, B.; Deng, T.; Emerick, A.W.; Guan, H.W.; Hayden, T.; et al. Thermodynamic benchmark study using Biacore technology. Anal. Biochem. 2007, 364, 67–77. [CrossRef]
- Prévost, J.; Richard, J.; Gasser, R.; Ding, S.; Fage, C.; Anand, S.P.; Adam, D.; Gupta Vergara, N.G.; Tauzin, A.; Benlarbi, M.; et al. Impact of temperature on the affinity of SARS-CoV-2 Spike glycoprotein for host ACE2. J. Biol. Chem. 2021, 297, 101151. [CrossRef]
- Leonard, P.; Hayes, C.J.; O’Kennedy, R. Rapid temperature-dependent antibody ranking using Biacore A100. Anal. Biochem. 2011, 409, 290–292. [CrossRef]
- Feige, M.J.; Gräwert, M.A.; Marcinowski, M.; Hennig, J.; Behnke, J.; Ausländer, D.; Herold, E.M.; Peschek, J.; Castro, C.D.; Flajnik, M.; et al. The structural analysis of shark IgNAR antibodies reveals evolutionary principles of immunoglobulins. Proc. Natl Acad. Sci. U. S. A. 2014, 111, 8155–8160. [CrossRef]
- Jung, S.; Honegger, A.; Plückthun, A. Selection for improved protein stability by phage display. J. Mol. Biol. 1999, 294, 163–180. [CrossRef]
- Bemporad, F.; Taddei, N.; Stefani, M.; Chiti, F. Assessing the role of aromatic residues in the amyloid aggregation of human muscle acylphosphatase. Protein Sci. 2006, 15, 862–870. [CrossRef]
- Curtis, R.A.; Prausnitz, J.M.; Blanch, H.W. Protein-protein and protein–salt interactions in aqueous protein solutions containing concentrated electrolytes. Biotechnol. Bioeng. 1998, 57, 11–21. [CrossRef]
- Valente, J.J.; Verma, K.S.; Manning, M.C.; Wilson, W.W.; Henry, C.S. Second virial coefficient studies of cosolvent-induced protein self-interaction. Biophys. J. 2005, 89, 4211–4218. [CrossRef]
- Fellouse, F.A.; Wiesmann, C.; Sidhu, S.S. Synthetic antibodies from a four-amino-acid code: a dominant role for tyrosine in antigen recognition. Proc. Natl Acad. Sci. U. S. A. 2004, 101, 12467–12472. [CrossRef]
- Ito, W.; Iba, Y.; Kurosawa, Y. Effects of substitutions of closely related amino acids at the contact surface in an antigen-antibody complex on thermodynamic parameters. J. Biol. Chem. 1993, 268, 16639–16647. [CrossRef]
- Tzang, B.S.; Tsay, G.J.; Lee, Y.J.; Li, C.; Sun, Y.S.; Hsu, T.C. The association of VP1 unique region protein in acute parvovirus B19 infection and anti-phospholipid antibody production. Clin. Chim. Acta 2007, 378, 59–65. [CrossRef]
- Katoh, K.; Rozewicki, J.; Yamada, K.D. MAFFT online service: multiple sequence alignment, interactive sequence choice and visualization. Brief. Bioinform. 2019, 20, 1160–1166. [CrossRef]
- Larkin, M.A.; Blackshields, G.; Brown, N.P.; Chenna, R.; McGettigan, P.A.; McWilliam, H.; Valentin, F.; Wallace, I.M.; Wilm, A.; Lopez, R.; et al. Clustal W and Clustal X version 2.0. Bioinformatics 2007, 23, 2947–2948. [CrossRef]


Disclaimer/Publisher’s Note: The statements, opinions and data contained in all publications are solely those of the individual author(s) and contributor(s) and not of MDPI and/or the editor(s). MDPI and/or the editor(s) disclaim responsibility for any injury to people or property resulting from any ideas, methods, instructions or products referred to in the content. |
© 2023 by the authors. Licensee MDPI, Basel, Switzerland. This article is an open access article distributed under the terms and conditions of the Creative Commons Attribution (CC BY) license (http://creativecommons.org/licenses/by/4.0/).


