Submitted:
03 October 2023
Posted:
04 October 2023
You are already at the latest version
Abstract
Keywords:
1. Introduction
2. Aim
3. Patients, Materials and Methods
4. Results
5. Discussion
Metastases of Clear Cell Renal Carcinoma
Jaw Bone Metastasis of Hepatocellular Carcinoma
6. Conclusions
Author Contributions
Funding
Institutional Review Board Statement
Informed Consent Statement
Acknowledgments
Conflicts of Interest
References
- Lenkeit:, C.; Bank, J.; Shirazi, M. Renal Cell Carcinoma in the Head and Neck: Case Presentation of a Patient With a Rare Metastatic Pattern. Curēus 2020, 12, e11894. [Google Scholar] [CrossRef]
- Lieder, A.; Guenzel, T.; Lebentrau, S.; Schneider, C.; Franzen, A. Diagnostic relevance of metastatic renal cell carcinoma in the head and neck: An evaluation of 22 cases in 671 patients. Int Braz J Urol 2017, 43, 202–208. [Google Scholar] [CrossRef]
- Remenschneider, A.K.; Sadow, P.M.; Lin, D.T.; Gray, S.T. Metastatic Renal Cell Carcinoma to the Sinonasal Cavity: A Case Series. J. Neurol. Surg. Rep. 2013, 74, 67–72. [Google Scholar]
- Ali, R.A.; Mohamed, K.E. Metastatic Clear Cell Renal Cell Carcinoma Presenting with a Gingival Metastasis. Clin Pract. 2016, 10, 847. [Google Scholar] [CrossRef]
- Morita, Y.; Kashima, K.; Suzuki, M.; Kinosada, H.; Teramoto, A.; Matsumiya, Y.; Uzawa, N. Differential Diagnosis between Oral Metastasis of Renal Cell Carcinoma and Salivary Gland Cancer. Diagnostics 2021, 11, 506. [Google Scholar] [CrossRef]
- Yu, S.; Estess, A.; Harris, W.; Dillon, J. A rare occurrence of hepatocellular carcinoma metastasis to the mandible: report of a case and review of the literature. J. Oral Maxillofac. Surg. 2012, 70, 1219–1223. [Google Scholar] [CrossRef]
- Pesis, M.; Taicher, S.; Greenberg, G.; Hirshberg, A. Metastasis to the jaws as a first manifestation of hepatocellular carcinoma: report of a case and analysis of 41 cases. J Craniomaxillofac Surg 2014, 42, 1997–2001. [Google Scholar] [CrossRef]
- Dick, A.; Mead, S.G.; Mensh, M.; Schatten, W.E. Primary hepatoma with metastasis to the mandible. Am. J. Surg. 1957, 94, 846–850. [Google Scholar] [CrossRef]
- Capitanio, U.; Bensalah, K.; Bex, A.; Boorjian, S.A.; Bray, F.; Coleman, J.; Gore, J.L.; Sun, M.; Wood, C.; Russo, P. Epidemiology of Renal Cell Carcinoma. Eur. Urol. 2019, 75, 74–84. [Google Scholar] [CrossRef]
- Sarău, C.A.; Poenaru, M.; Balica, N.C.; Baderca, F. Rare sinonasal lesions. Rom J Morphol Embryol. 2017, 58, 1541–1547. [Google Scholar]
- Trandafir, C.M.; Tischer, A.A.; Horhat, I.D.; Balica, N.C.; Sitaru, A.M.; Guran, K.; Morar, R.; Baderca, F.; Jifcu, E.M.; Moţ, I.C.; Burlacu, O.N.; Poenaru, M.; Sarău, C.A. Fortuitous discovery of melanomas in the ENT Department - a histopathological and immunohistochemical study. Rom J Morphol Embryol. 2020, 6, 1163–1171. [Google Scholar] [CrossRef] [PubMed]
- Baderca, F.; Vincze, D.; Balica, N.; Solovan, C. Mucosal melanomas in the elderly: challenging cases and review of the literature. Clin Interv Aging. 2014, 9, 929–937. [Google Scholar] [CrossRef] [PubMed]
- Rakitovan, M.; Nicoara, A.; Closca, R.M.; Balica, N.C.; Stefanescu, E.H.; Baderca, F. Leiomyoma with Uncommon Localization-Incisive Papilla and Palatal Fibromucosa: A Case Report. Medicina (Kaunas) 2023, 59, 1346. [Google Scholar] [CrossRef] [PubMed]
- Zhao, W.; Yangi, L.; Wang, L.; Zuo, W.; Shuanghu Yuan, S.; Yu, J.; Yu, Q.; Xudong Hu, X.; Wang, S.; Liu, N.; Zhang, H.; Yuchun Wei, Y. Primary clear cell carcinoma of nasal cavity: report of six cases and review of literature. Int. J. Clin. Exp. Med. 2014, 7, 5469–5476. [Google Scholar] [PubMed]
- Zur, K.B.; Brandwein, M.; Wang, B.; et al. Primary description of a new entity, renal cell-like carcinoma of the nasal cavity: van Meegeren in the house of Vermeer. Arch Otolaryngol Head Neck Surg 2002, 128, 441–447. [Google Scholar] [CrossRef]
- El-Naggar, A.K.; Chan, J.K.C.; Grandis, J.R.; Takata, T.; Slootweg, P.J. WHO Classification of Head and Neck Tumours, 4th ed.; International Agency for Research on Cancer: Lyon, France, 2017; pp. 24–26. [Google Scholar]
- Chen, Z.; Wang, Z.; Shi, H.; Liu, Q. Renal cell -like carcinoma of the nasal cavity: a case report and review of the literature. Diagnostic Pathol 2017, 12. [Google Scholar]
- Morvan, J.B.; Veyrières, J.B.; Mimouni, O.; Cathelinaud, O.; Allali, L.; Verdalle, P. Clear-cell renal carcinoma metastasis to the base of the tongue and sphenoid sinus: two very rare atypical ENT locations. Eur Ann Otorhinolaryngol Head Neck Dis. 2011, 128, 91–94. [Google Scholar] [CrossRef]
- Sikka, S.; Sikka, P.; Kaur, G.; Shetty, D.C. A review of histopathological and immunohistochemical parameters in diagnosis of metastatic renal cell carcinoma with a case of gingival metastasis. J Cancer Res Ther 2013, 9, 105–107. [Google Scholar] [CrossRef]
- Du, C.; Feng, Y.; Li, N.; Wang, K.; Wang, S.; Gao, Z. Mandibular metastasis as an initial manifestation of hepatocellular carcinoma: A report of two cases. Oncol. Lett. 2015, 9, 1213–1216. [Google Scholar] [CrossRef]
- Piccirillo, M.; Granata, V.; Albino, V.; et al. Can hepatocellular carcinoma (HCC) produce unconventional metastases? Four cases of extrahepatic HCC. Tumori J. 2013, 99, 19–23. [Google Scholar] [CrossRef]
- Yu, S.; Estess, A.; Harris, W.; Dillon, J. A rare occurrence of hepatocellular carcinoma metastasis to the mandible: report of a case and review of the literature. J. Oral Maxillofac. Surg. 2012, 70, 1219–1223. [Google Scholar] [CrossRef] [PubMed]
- Nawale, K.K.; Vyas, M.; Kane, S.; Patil, A. Metastatic tumors in the jaw bones: A retrospective clinicopathological study of 12 cases at Tertiary Cancer Center. J Oral Maxillofac Pathol 2016, 20, 252–255. [Google Scholar]
- Miller, M.E.; McCall, A.A.; Juillard, G.F.; et al. Hepatocellular carcinoma metastatic to the mandible. Ear Nose Throat J 2013, 92, 17–19. [Google Scholar]
- Van der Waal, R.I.; Buter, J.; van der Waal, I. Oral metastases: report of 24 cases. Br J Oral Maxillofac Surg 2003, 41, 3–6. [Google Scholar] [CrossRef] [PubMed]
- Chen, D.; Li, Z.; Song, Q.; Qian, L.; Xie, B.; Zhu, J. Clinicopathological features and differential diagnosis of hepatocellular carcinoma in extrahepatic metastases. Medicine (Baltimore) 2018, 97. [Google Scholar] [CrossRef] [PubMed]
- Ruiz-Morales, J.M.; Dorantes-Heredia, R.; Chable-Montero, F.; Vazquez-Manjarrez, S.; Méndez-Sánchez, N.; Motola-Kuba, D. Bone metastases as the initial presentation of hepatocellular carcinoma. Two case reports and a literature review. Ann Hepatol 2014, 13, 838–842. [Google Scholar] [CrossRef]
- Dabbs, D.J. Diagnostic immunohistochemistry: theranostic and genomic applications, 5th ed.; Elsevier: Philadelphia, PA, 2019; pp. 576–582. [Google Scholar]
- Hong, J.H.; Lee, K.; Kim, J.; Ahn, K.M. Prognosis of hepatocellular carcinoma metastasizing to the oral cavity. Maxillofac. Plast. Reconstr. Surg. 2021, 43. [Google Scholar] [CrossRef]
- Hongwei, Liu.; Qingxia, Xu.; Fanzhong, Lin.; Jianjun, Ma. Hepatocellular carcinoma metastasis to the mandibular ramus: a case report. Int. J. Clin. Exp. Pathol. 2019, 12, 1047–1051.

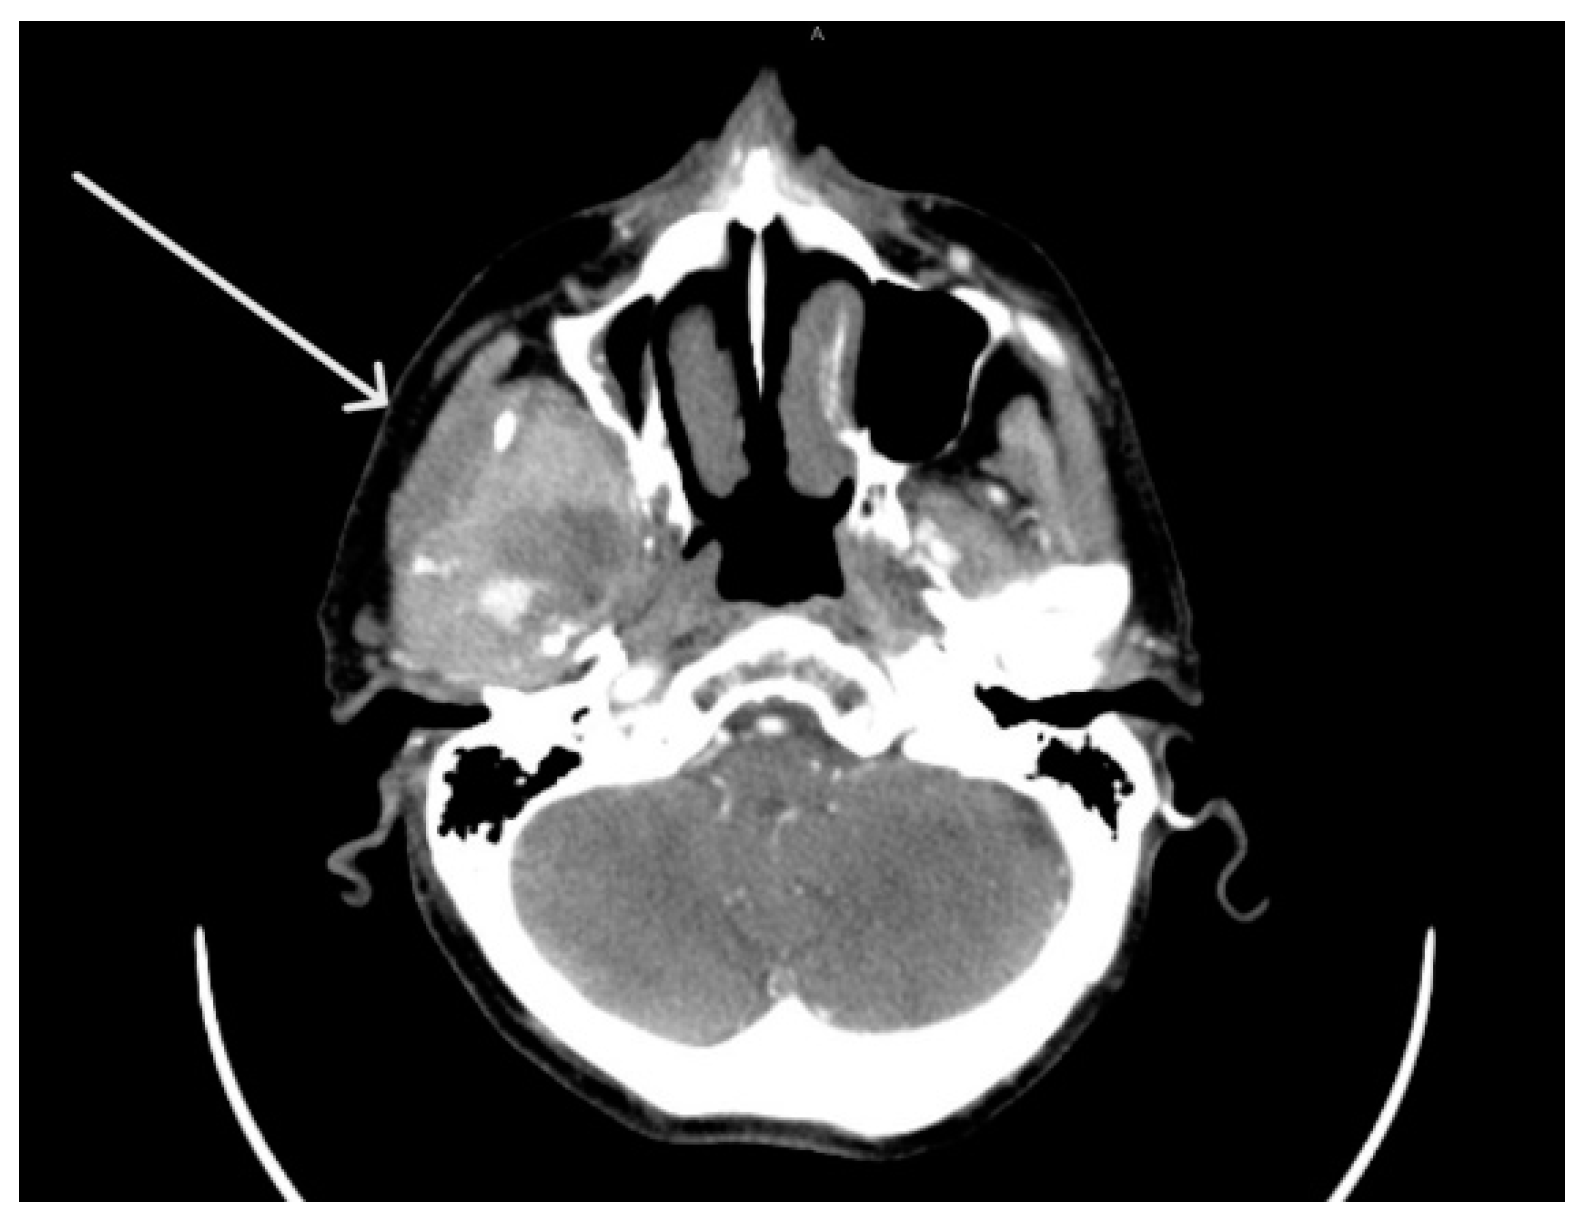
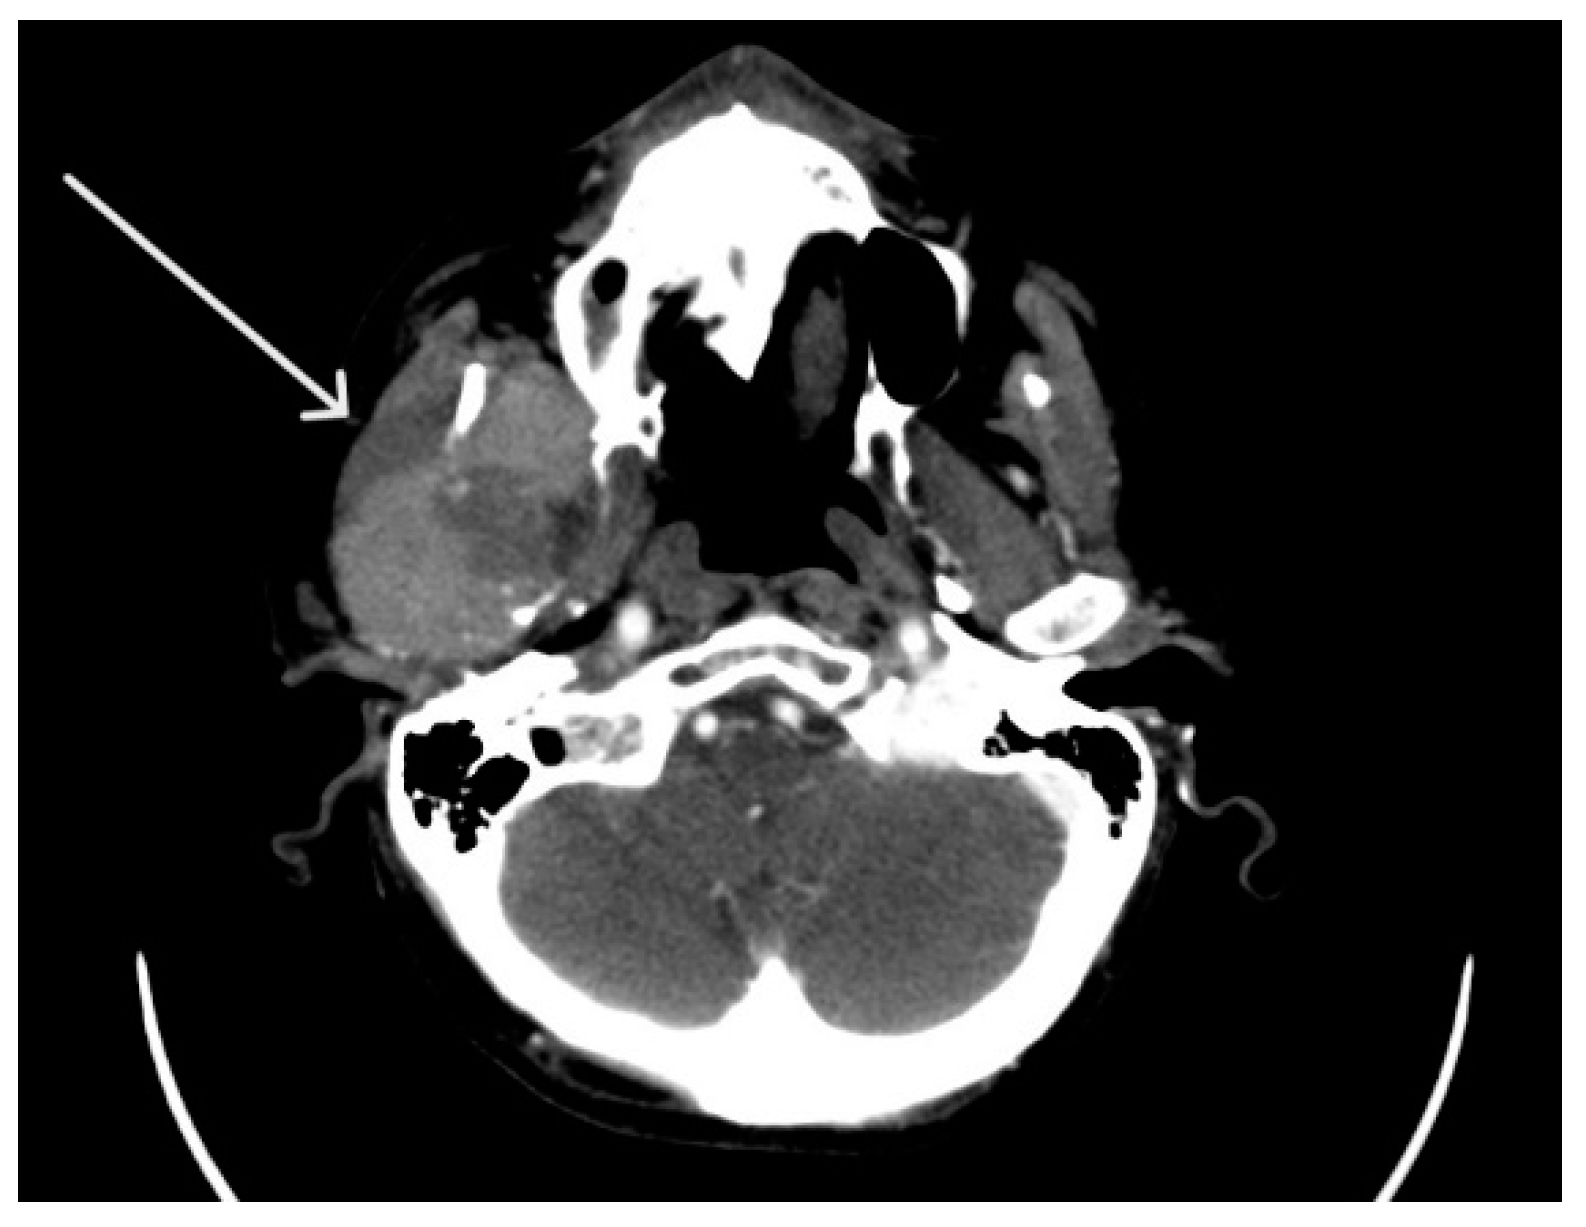
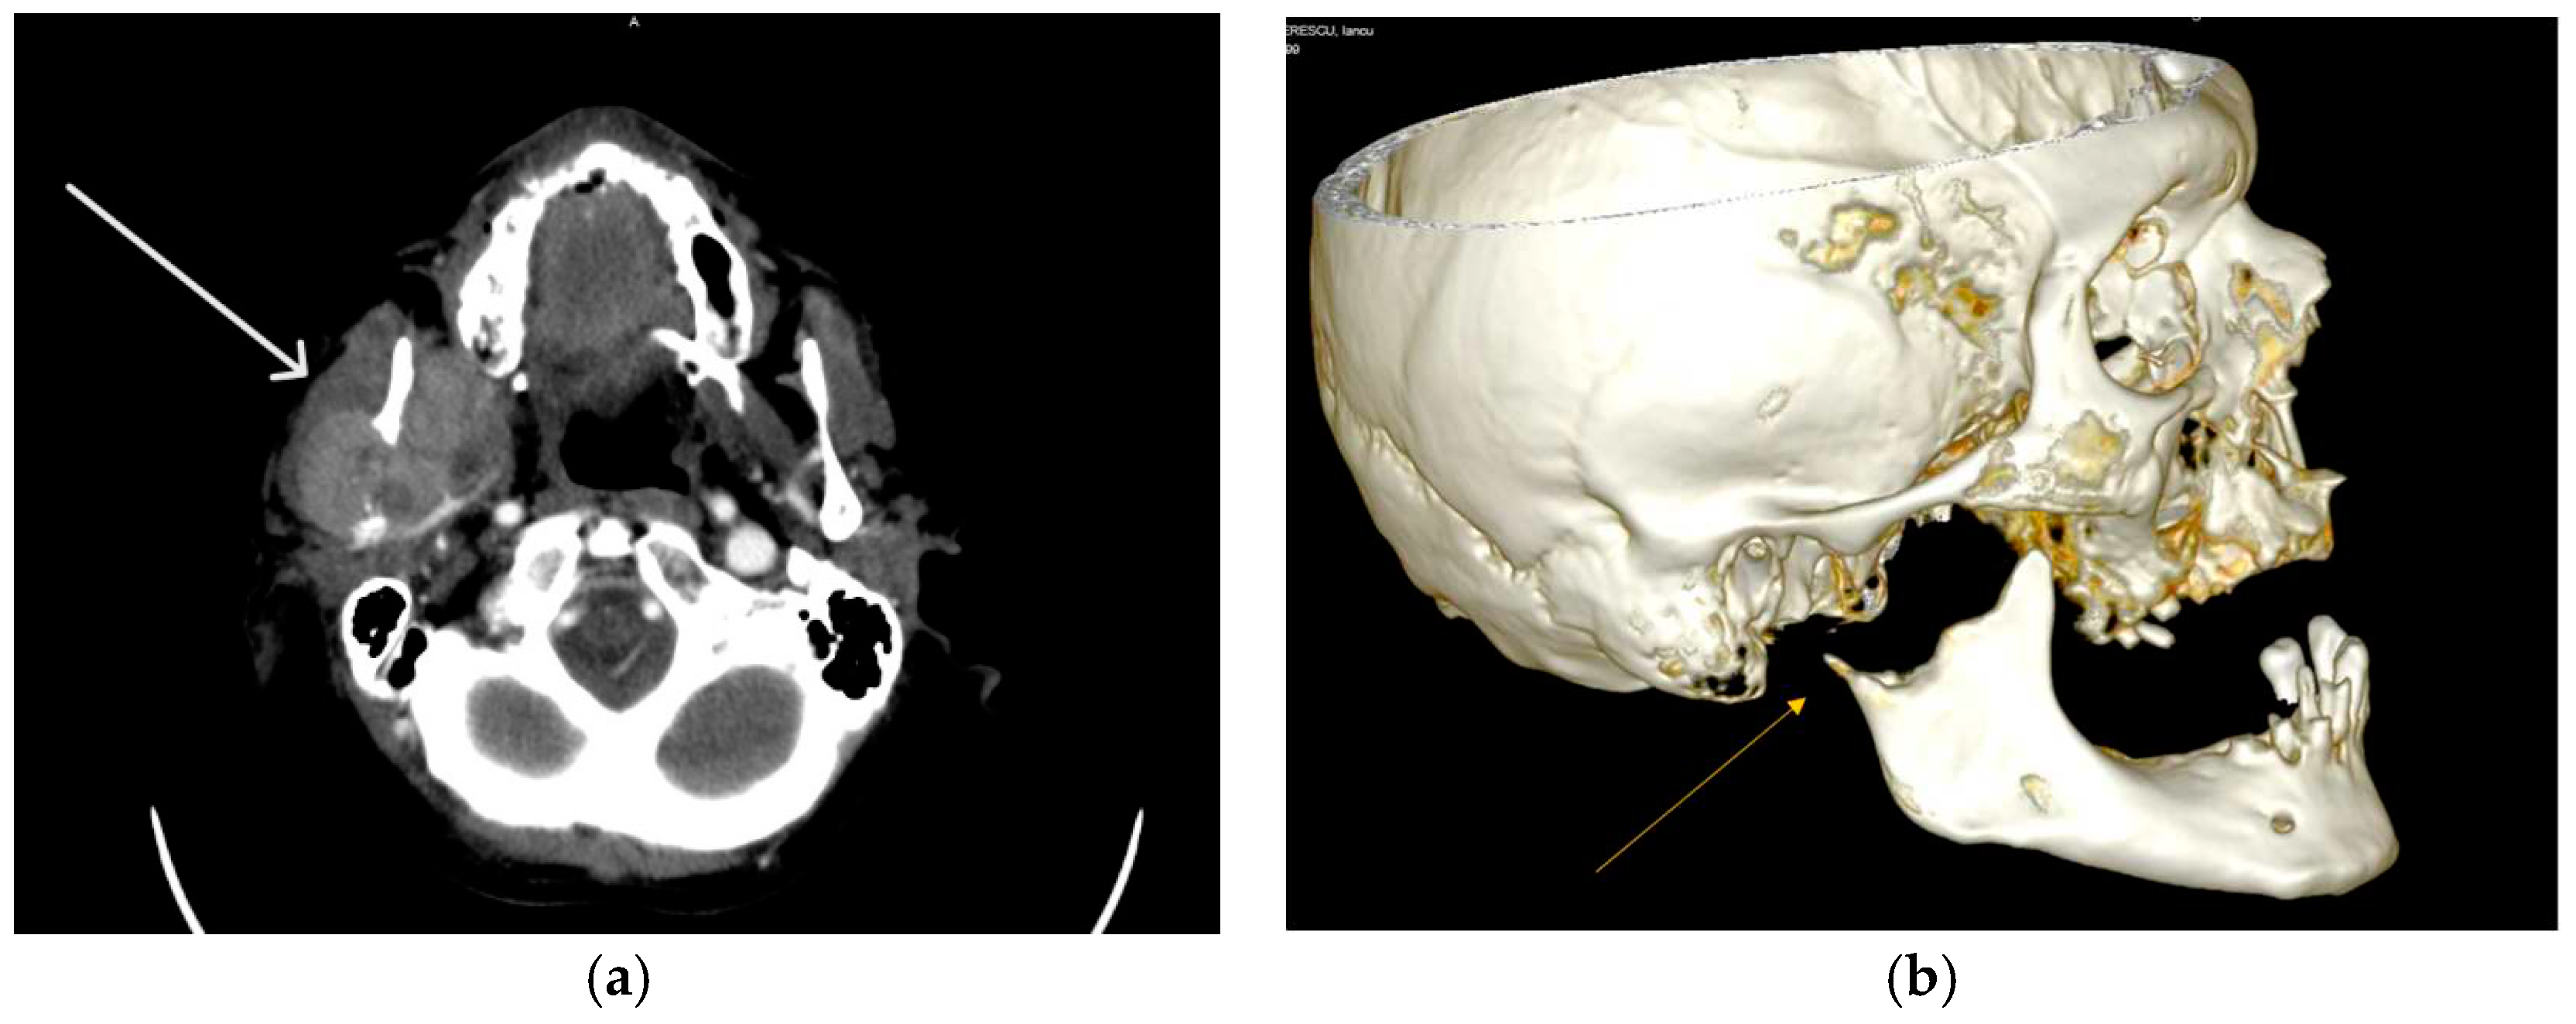
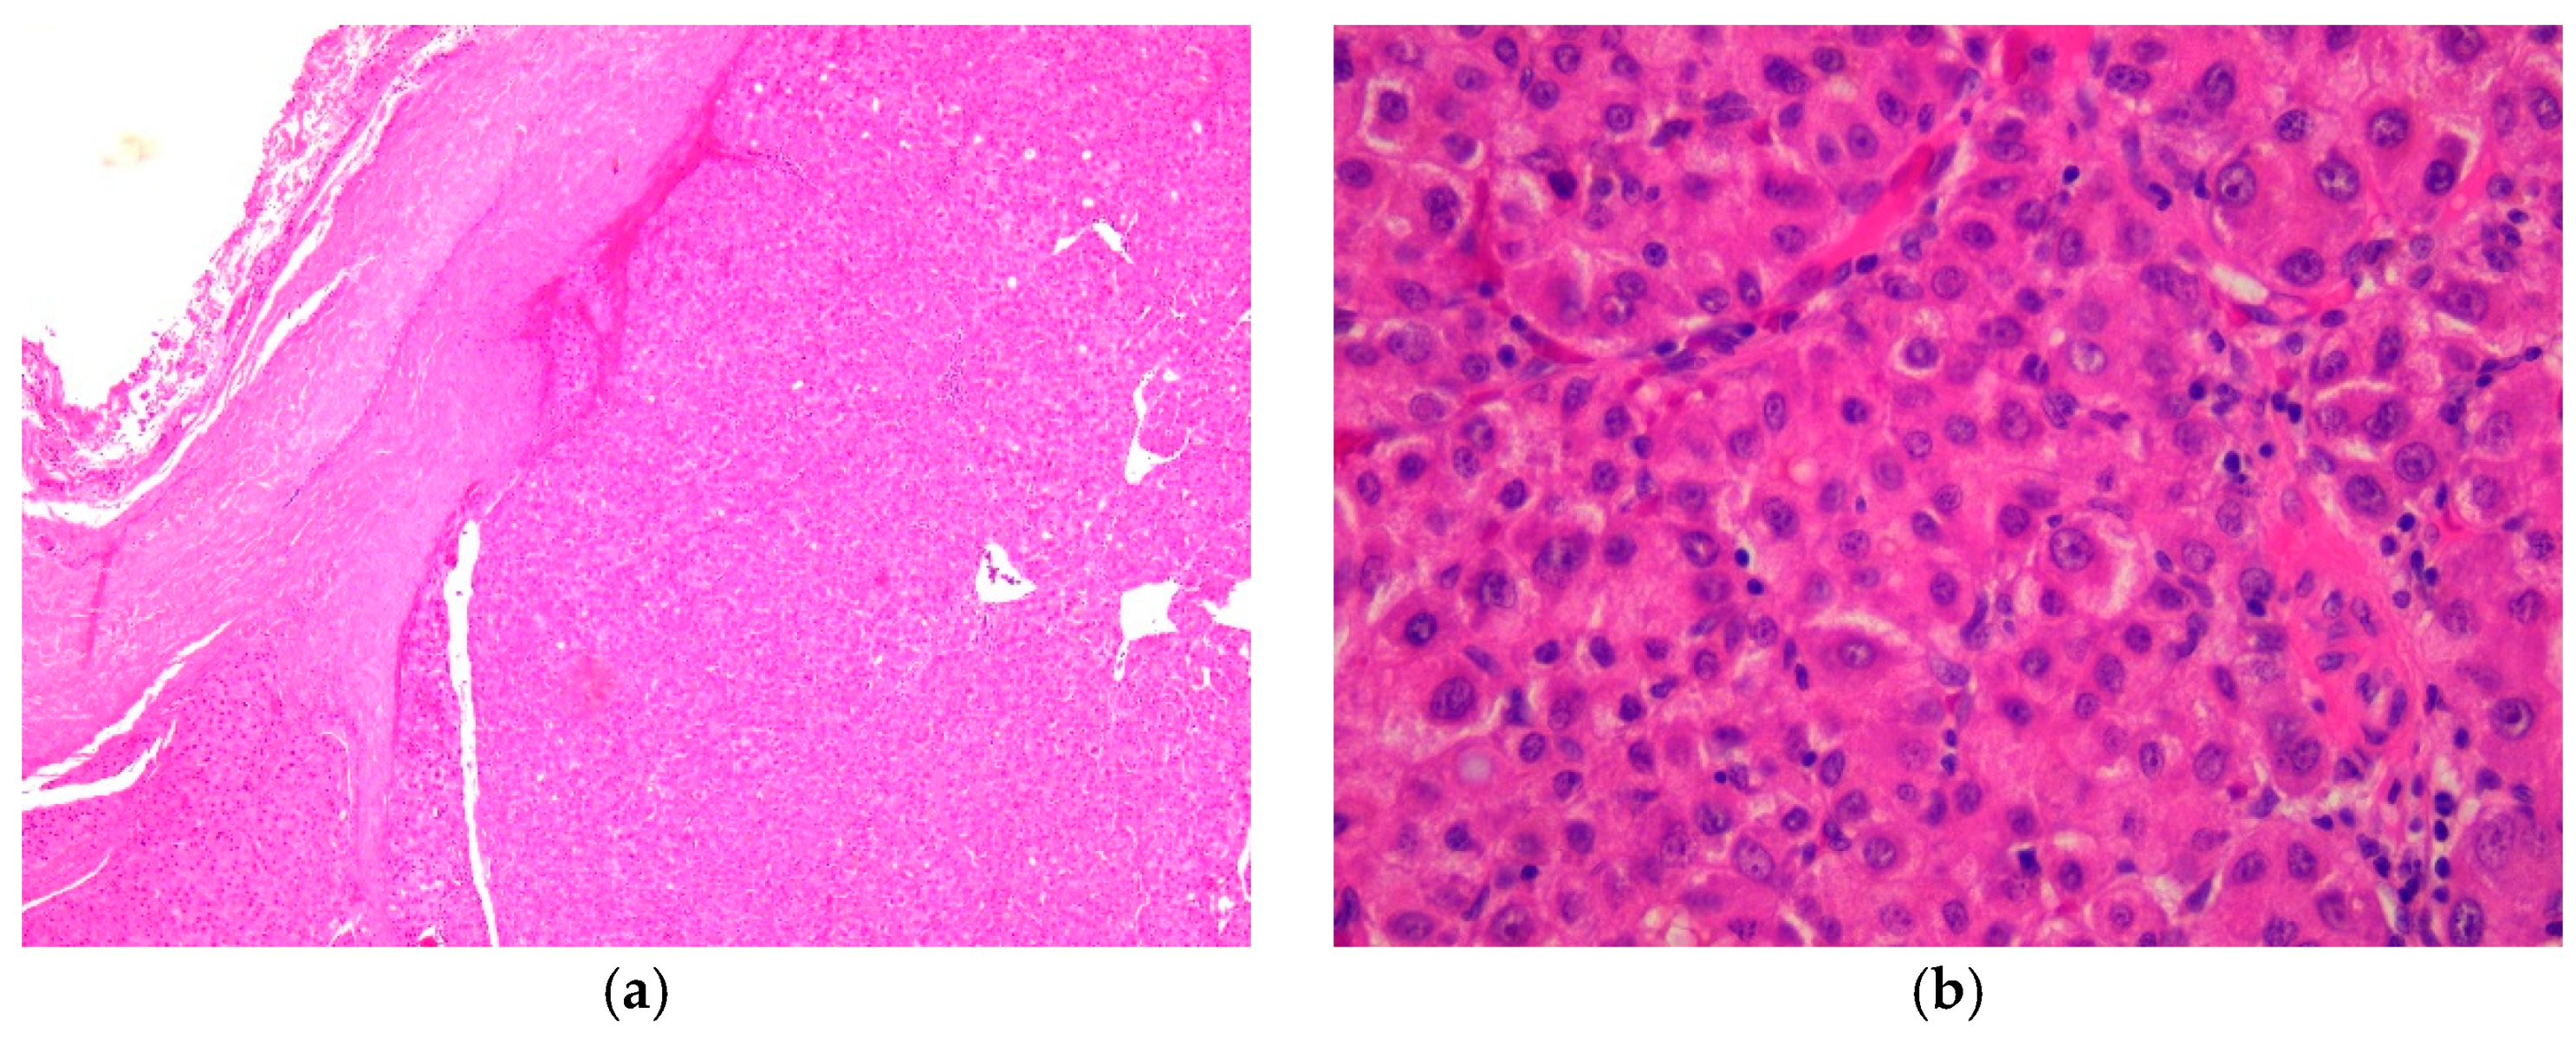
| ANTIBODY | SUBSTRATE | CLONE | DILUTION |
|---|---|---|---|
| CK AE1/AE3 1 | Mouse, Monoclonal | AE1/AE3 | 1:100 |
| EMA 2 | Mouse, Monoclonal | GP1.4 | 1:300 |
| CK8/18 3 | Mouse, Monoclonal | 5D3 | 1:100 |
| CK5 4 | Mouse, Monoclonal | XM26 | 1:100 |
| CK7 5 CK20 6 CEA 7 CD10 9 |
Mouse, Monoclonal Mouse, Monoclonal Mouse, Monoclonal Mouse, Monoclonal |
307M-94 L26 II-7 56C6 |
1:100 1:150 RTU 8 RTU |
| AFP 10 HepPar-1 11 S100 protein |
Mouse, Monoclonal Mouse, Monoclonal Rabbit, Polyclonal |
C3 OCH1ES EP32 |
1:100 RTU 1:100 |
| HMB45 12 | Mouse, Monoclonal | HMB45 | 1:60 |
| Melan-A | Mouse, Monoclonal | A103 | 1:50 |
| CD34 13 CD31 14 |
Mouse, Monoclonal Mouse, Monoclonal |
QBEnd/10 1A10 |
RTU 1:75 |
| SMA 15 | Mouse, Monoclonal | asn-1 | 1:50 |
| Desmin | Mouse, Monoclonal | DE-R-11 | 1:75 |
| Vimentin | Mouse, Monoclonal | V9 | 1:800 |
| Ki67 index HHV8 16 RCC 17 |
Mouse, Monoclonal Mouse, Monoclonal Mouse, Monoclonal |
MM1 13B10 66.4.C2 |
1:200 RTU RTU |
Disclaimer/Publisher’s Note: The statements, opinions and data contained in all publications are solely those of the individual author(s) and contributor(s) and not of MDPI and/or the editor(s). MDPI and/or the editor(s) disclaim responsibility for any injury to people or property resulting from any ideas, methods, instructions or products referred to in the content. |
© 2023 by the authors. Licensee MDPI, Basel, Switzerland. This article is an open access article distributed under the terms and conditions of the Creative Commons Attribution (CC BY) license (https://creativecommons.org/licenses/by/4.0/).


