Submitted:
05 October 2023
Posted:
06 October 2023
You are already at the latest version
Abstract
Keywords:
1. Introduction
2. Materials and Experimental Methods
2.1. Materials
2.2. Methods
2.2.1. Chemical composition
2.2.2. Mineralogical composition of raw materials and reacted mixes
2.2.3. Mixture design
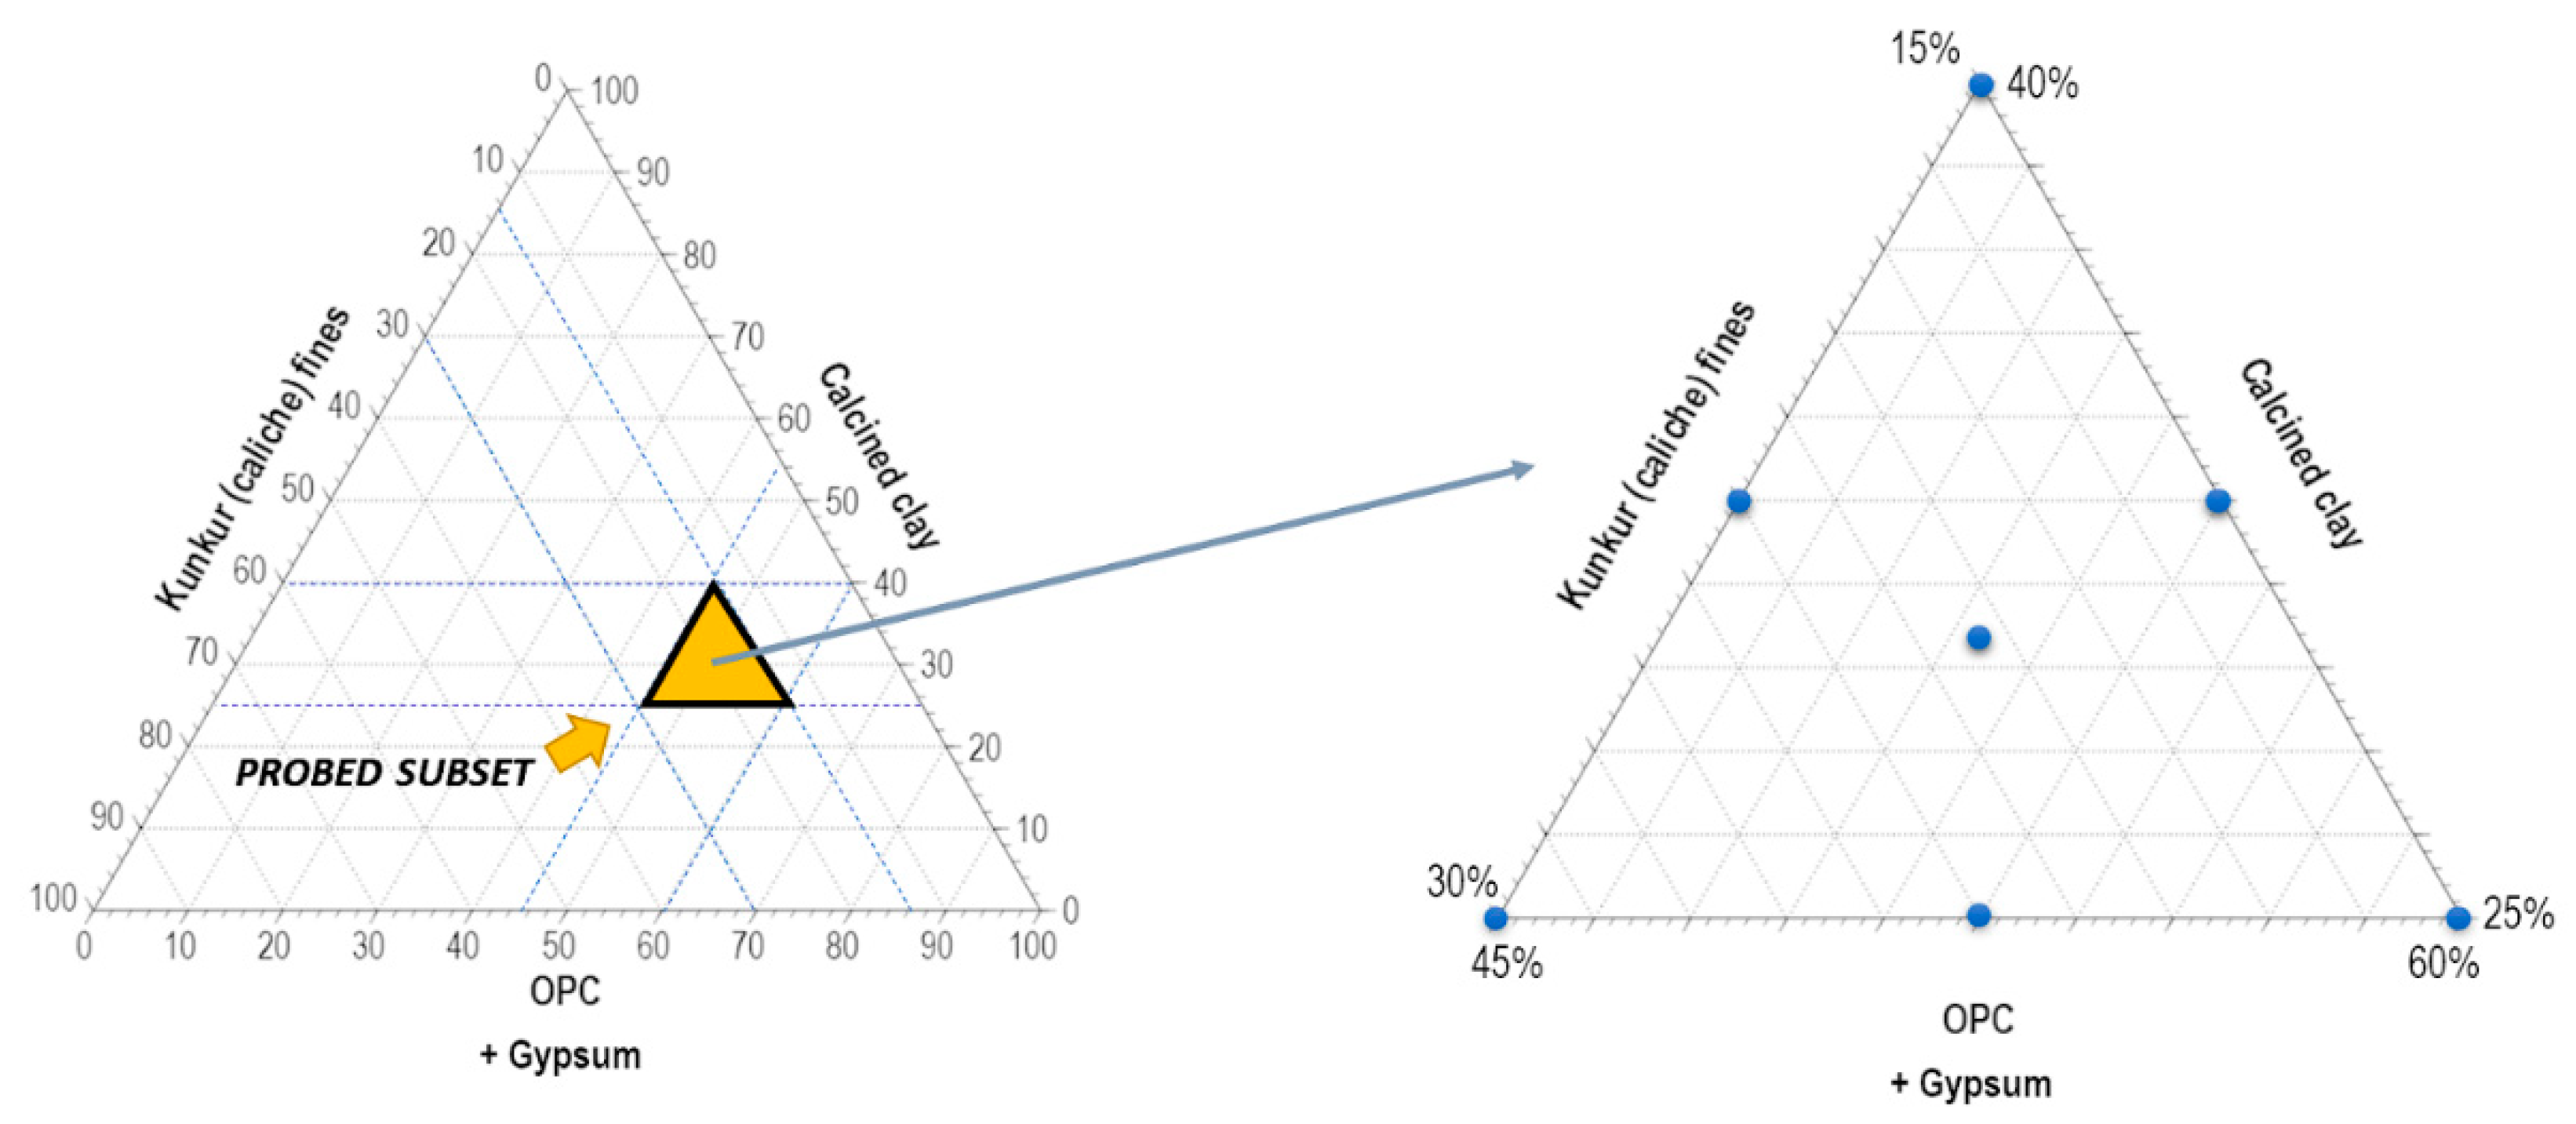
2.2.4. Compressive strength
2.2.5. DoE model validation
2.2.6. Scanning Electron Microscopy (SEM)
3. Results and Discussion
3.1. Charachterization of the starting materials
3.2. Compressive strength
3.3. DoE model validation
3.4. XRD analysis of the hardened pastes
3.5. Microstructure and microchemical analysis of hardened pastes
4. Conclusions
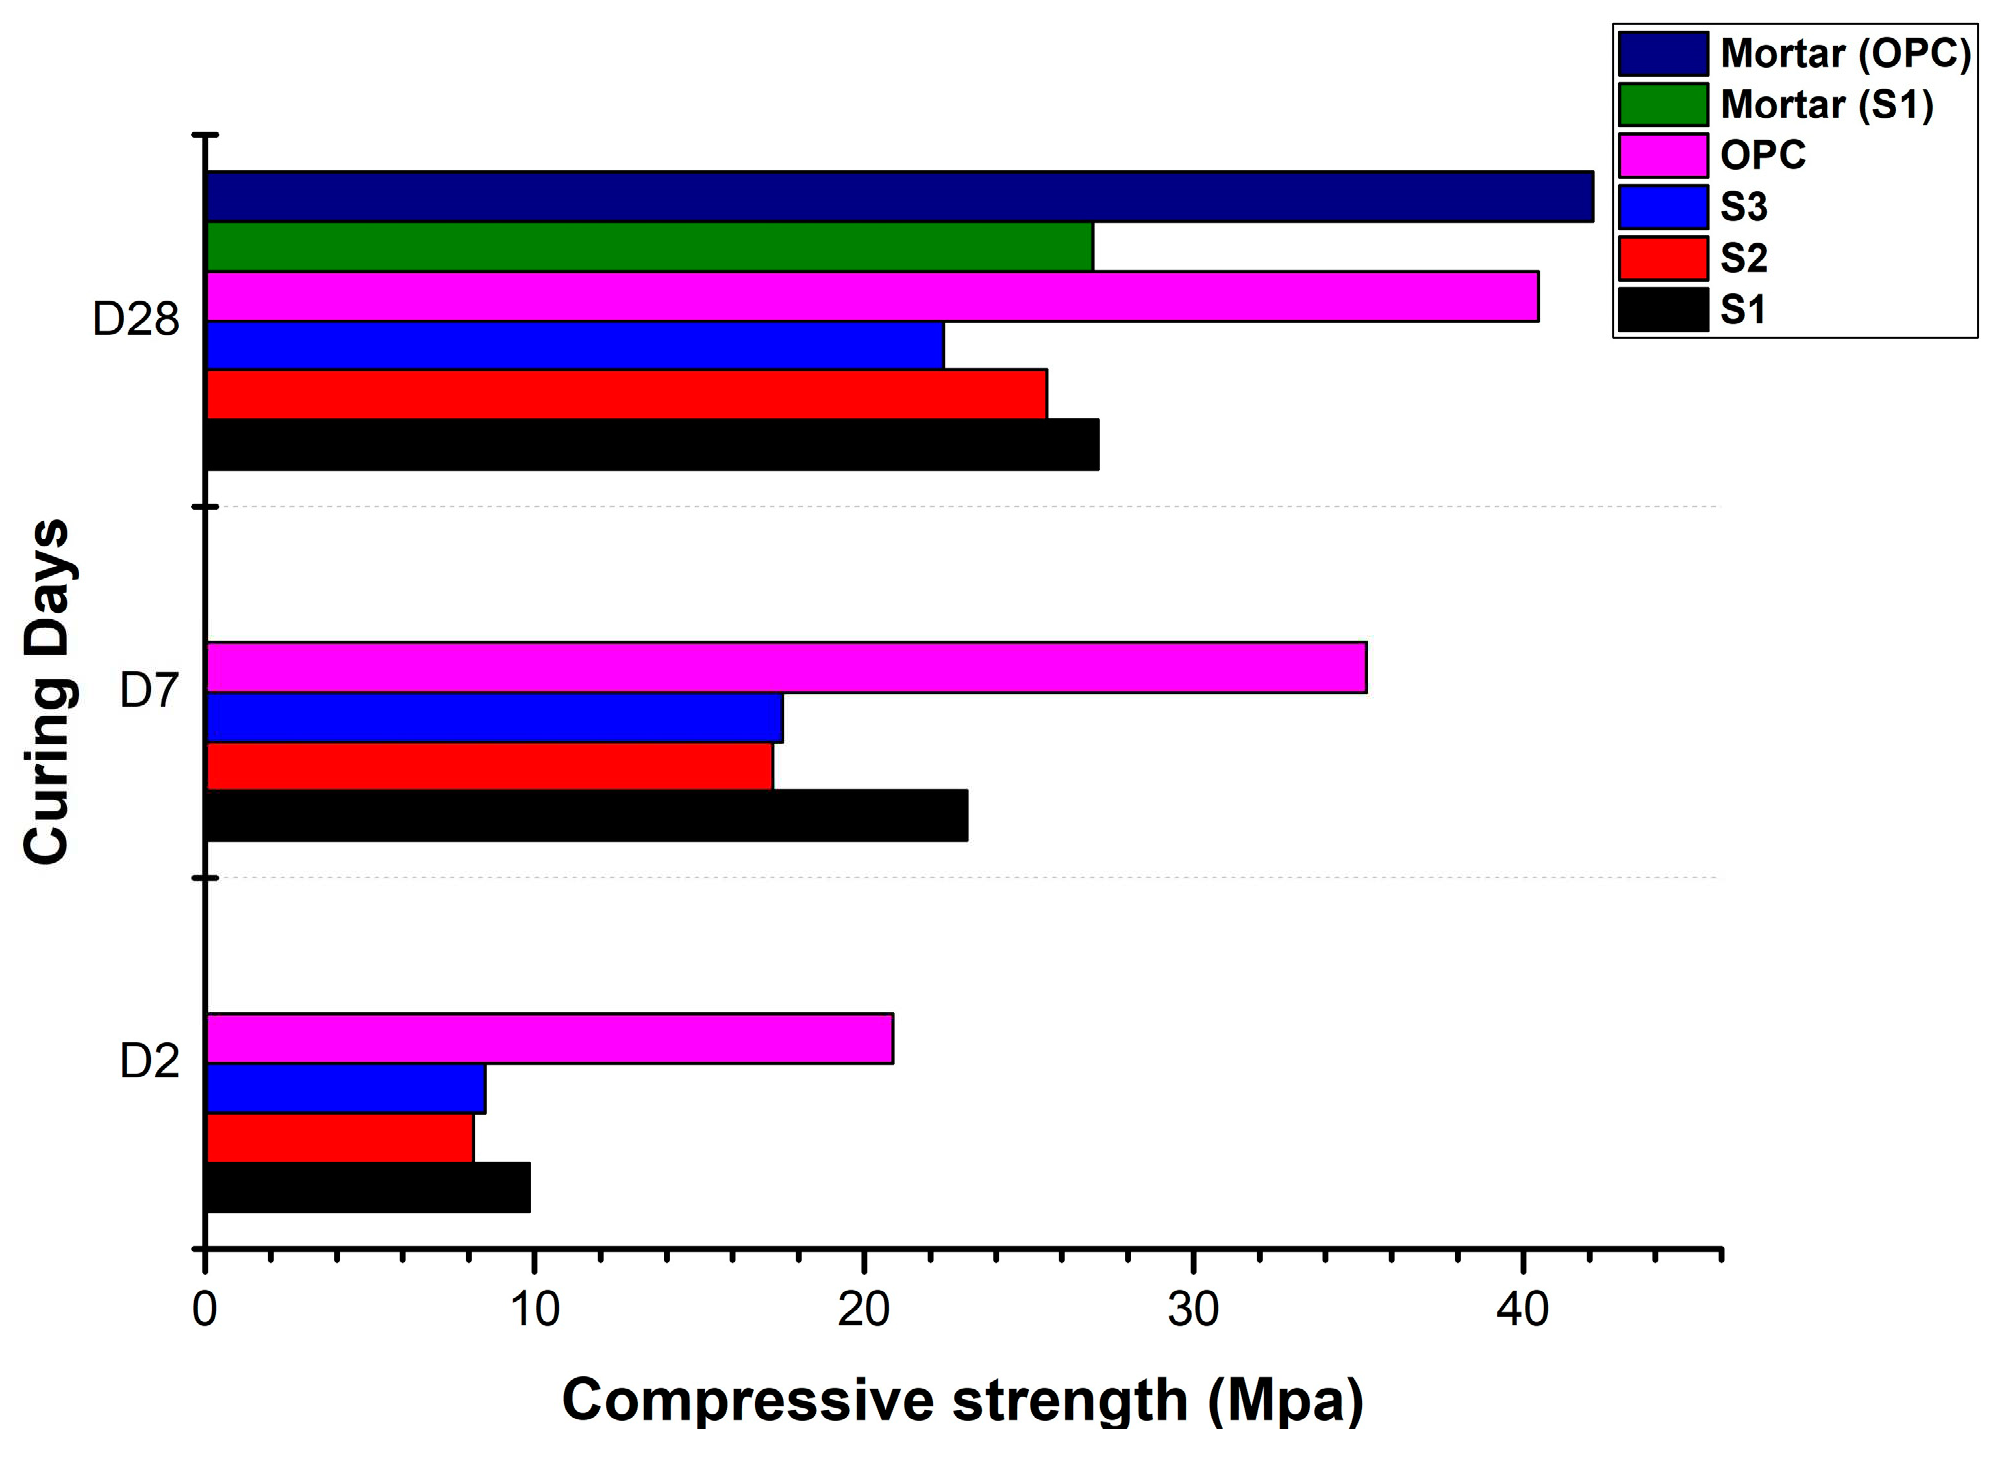
- High level of clinker substitution with calcined clay and kunkur fines was studied. The highest 28 days compressive strength for the blended cements was 30 MPa. This was a cement blend with composition consisting of 40% clinker + 5% gypsum + 40% calcined clay + 15% kunkur fines.
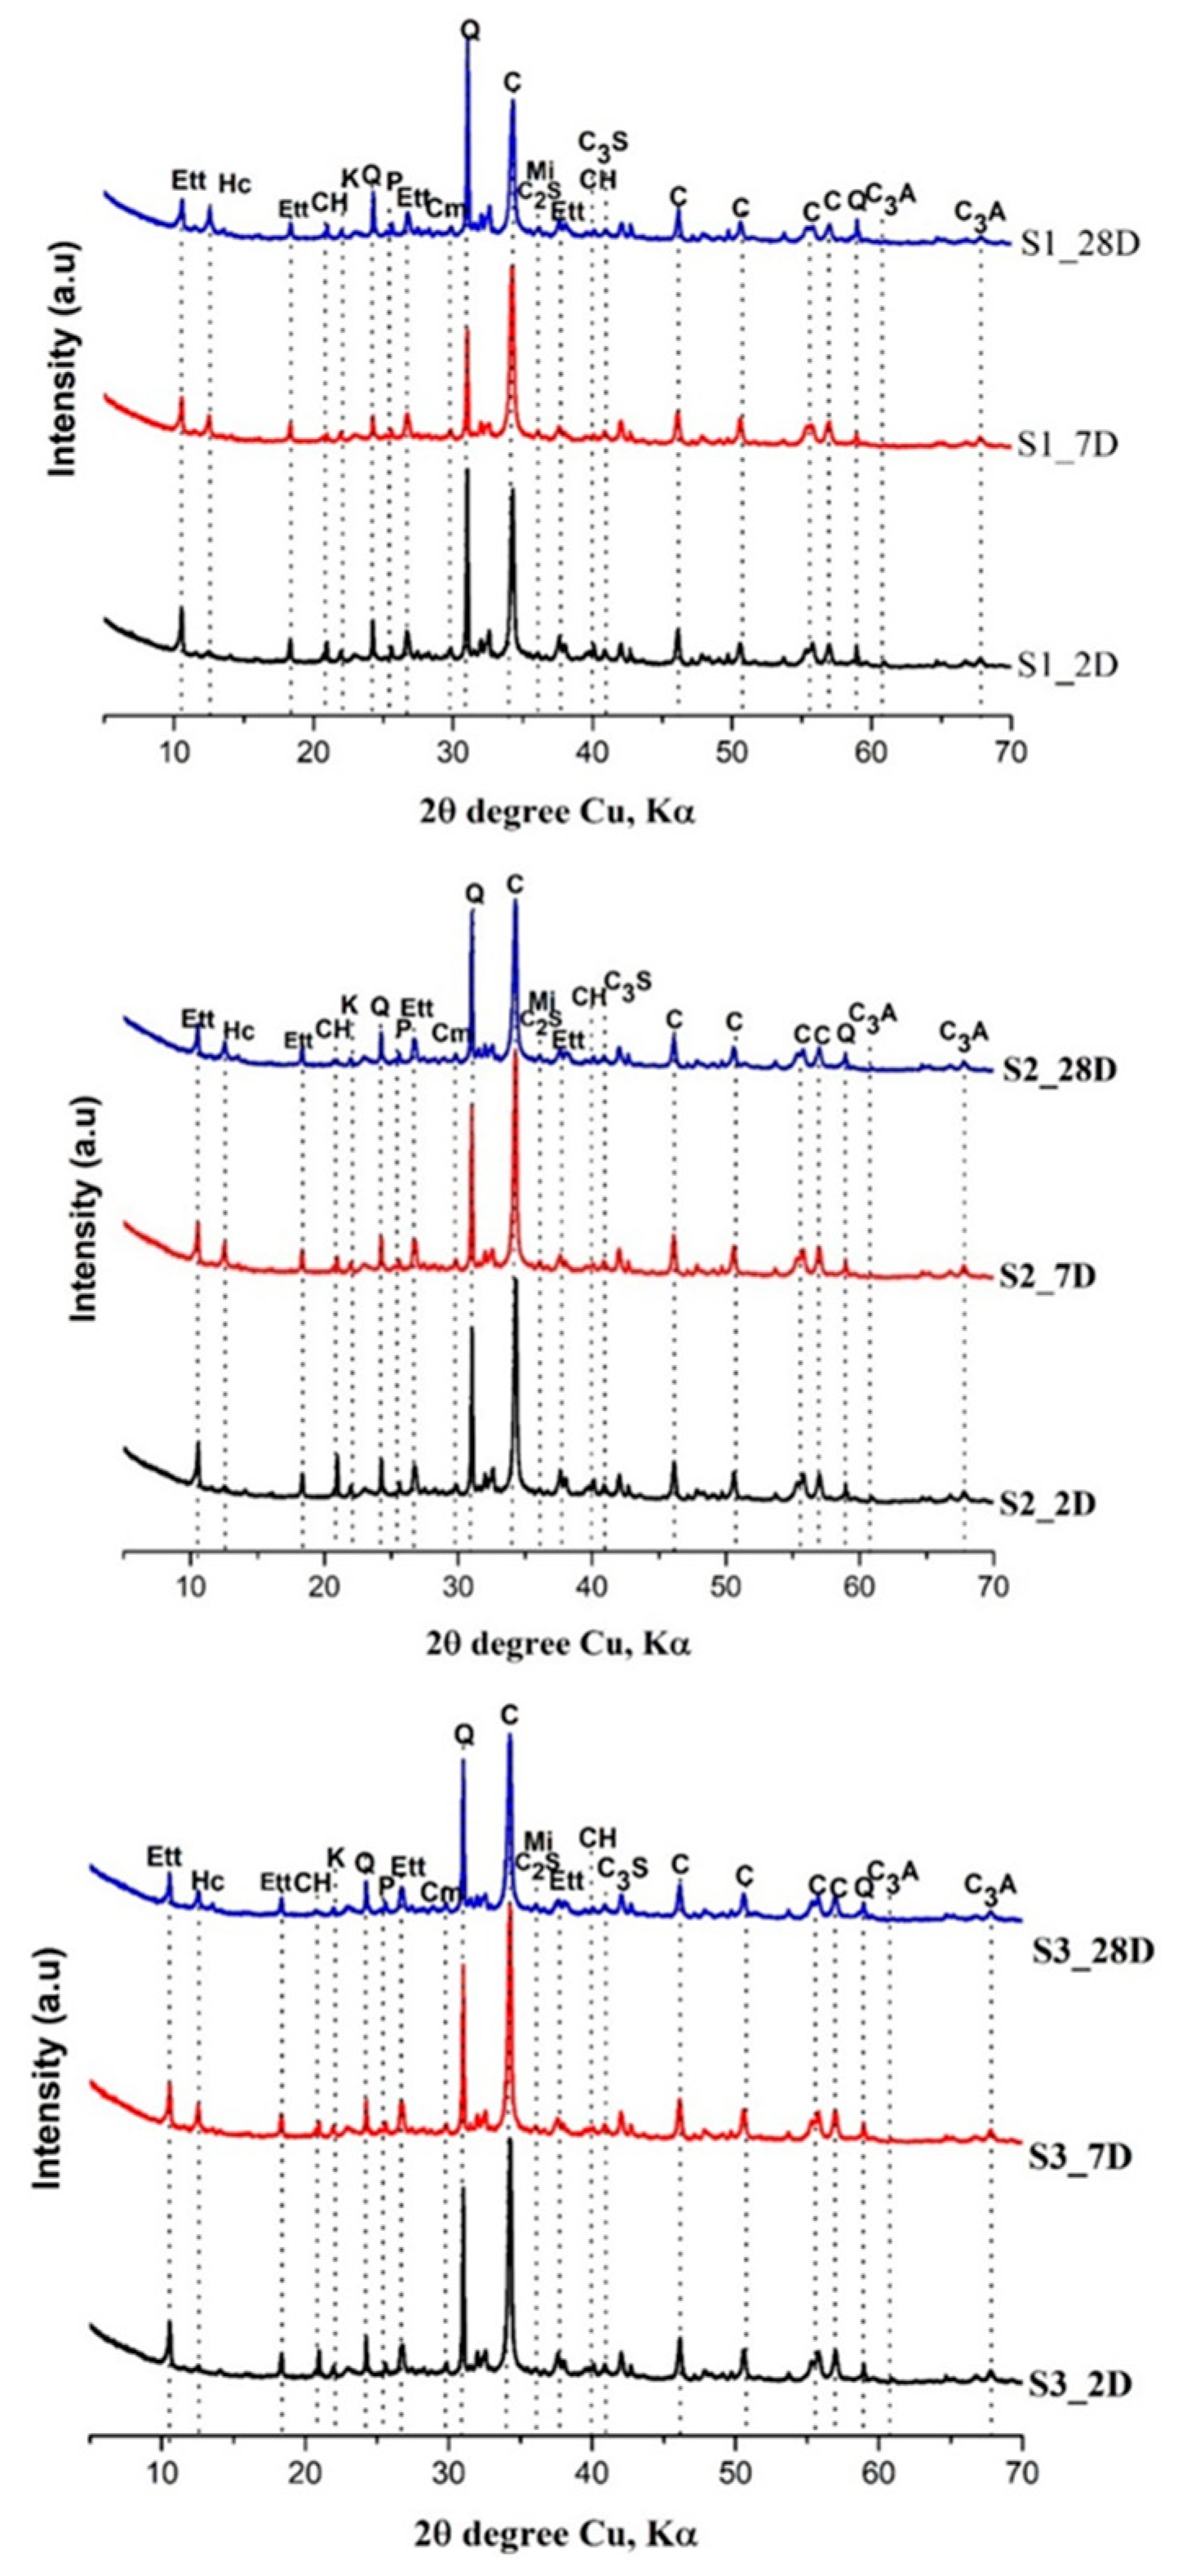
- Kunkur fines can possibly substitute primary limestone in ternary blends, owing to their relatively high calcite content. The partial reactivity of this material is testified by the formation of hemicarboaluminate. However, the presence of kaolinite in the fines may hinder the overall performance, e.g. by increasing the water demand in the mix.
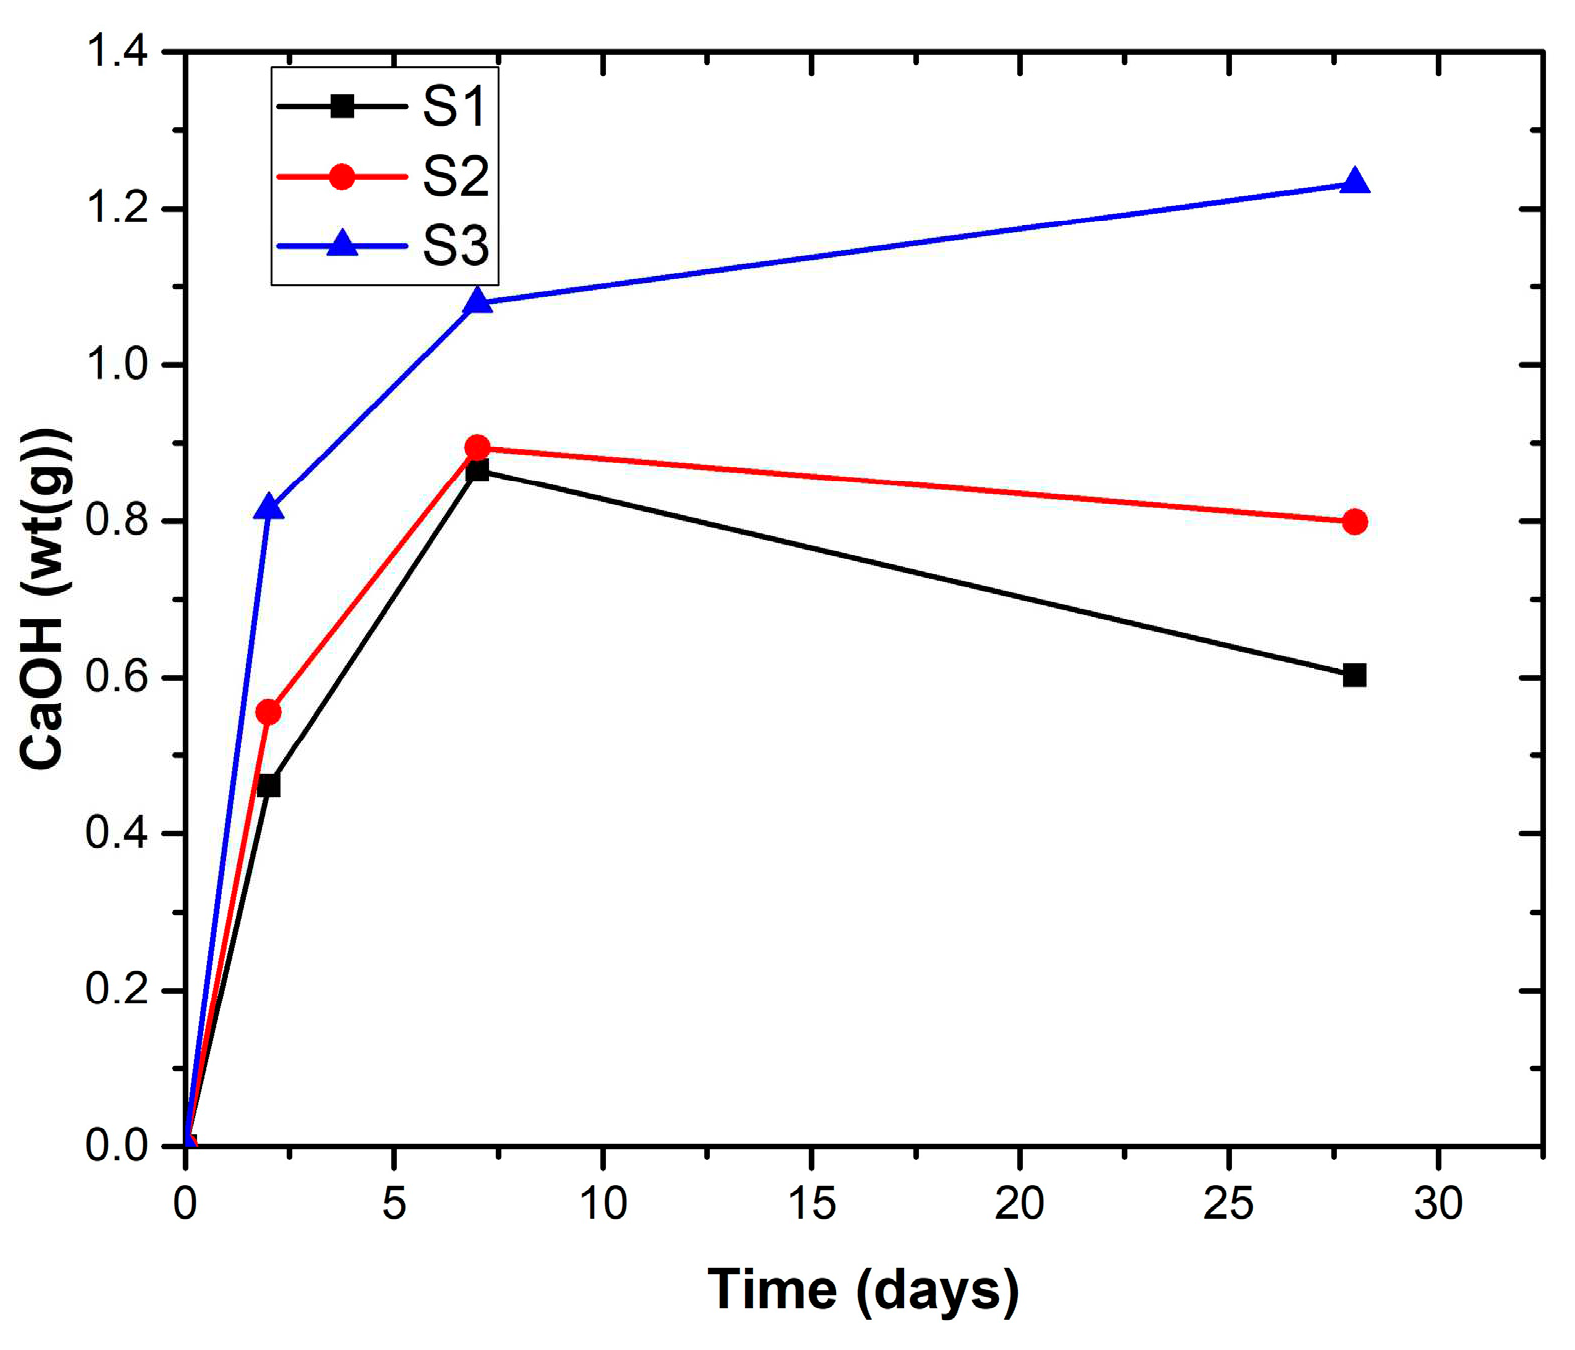
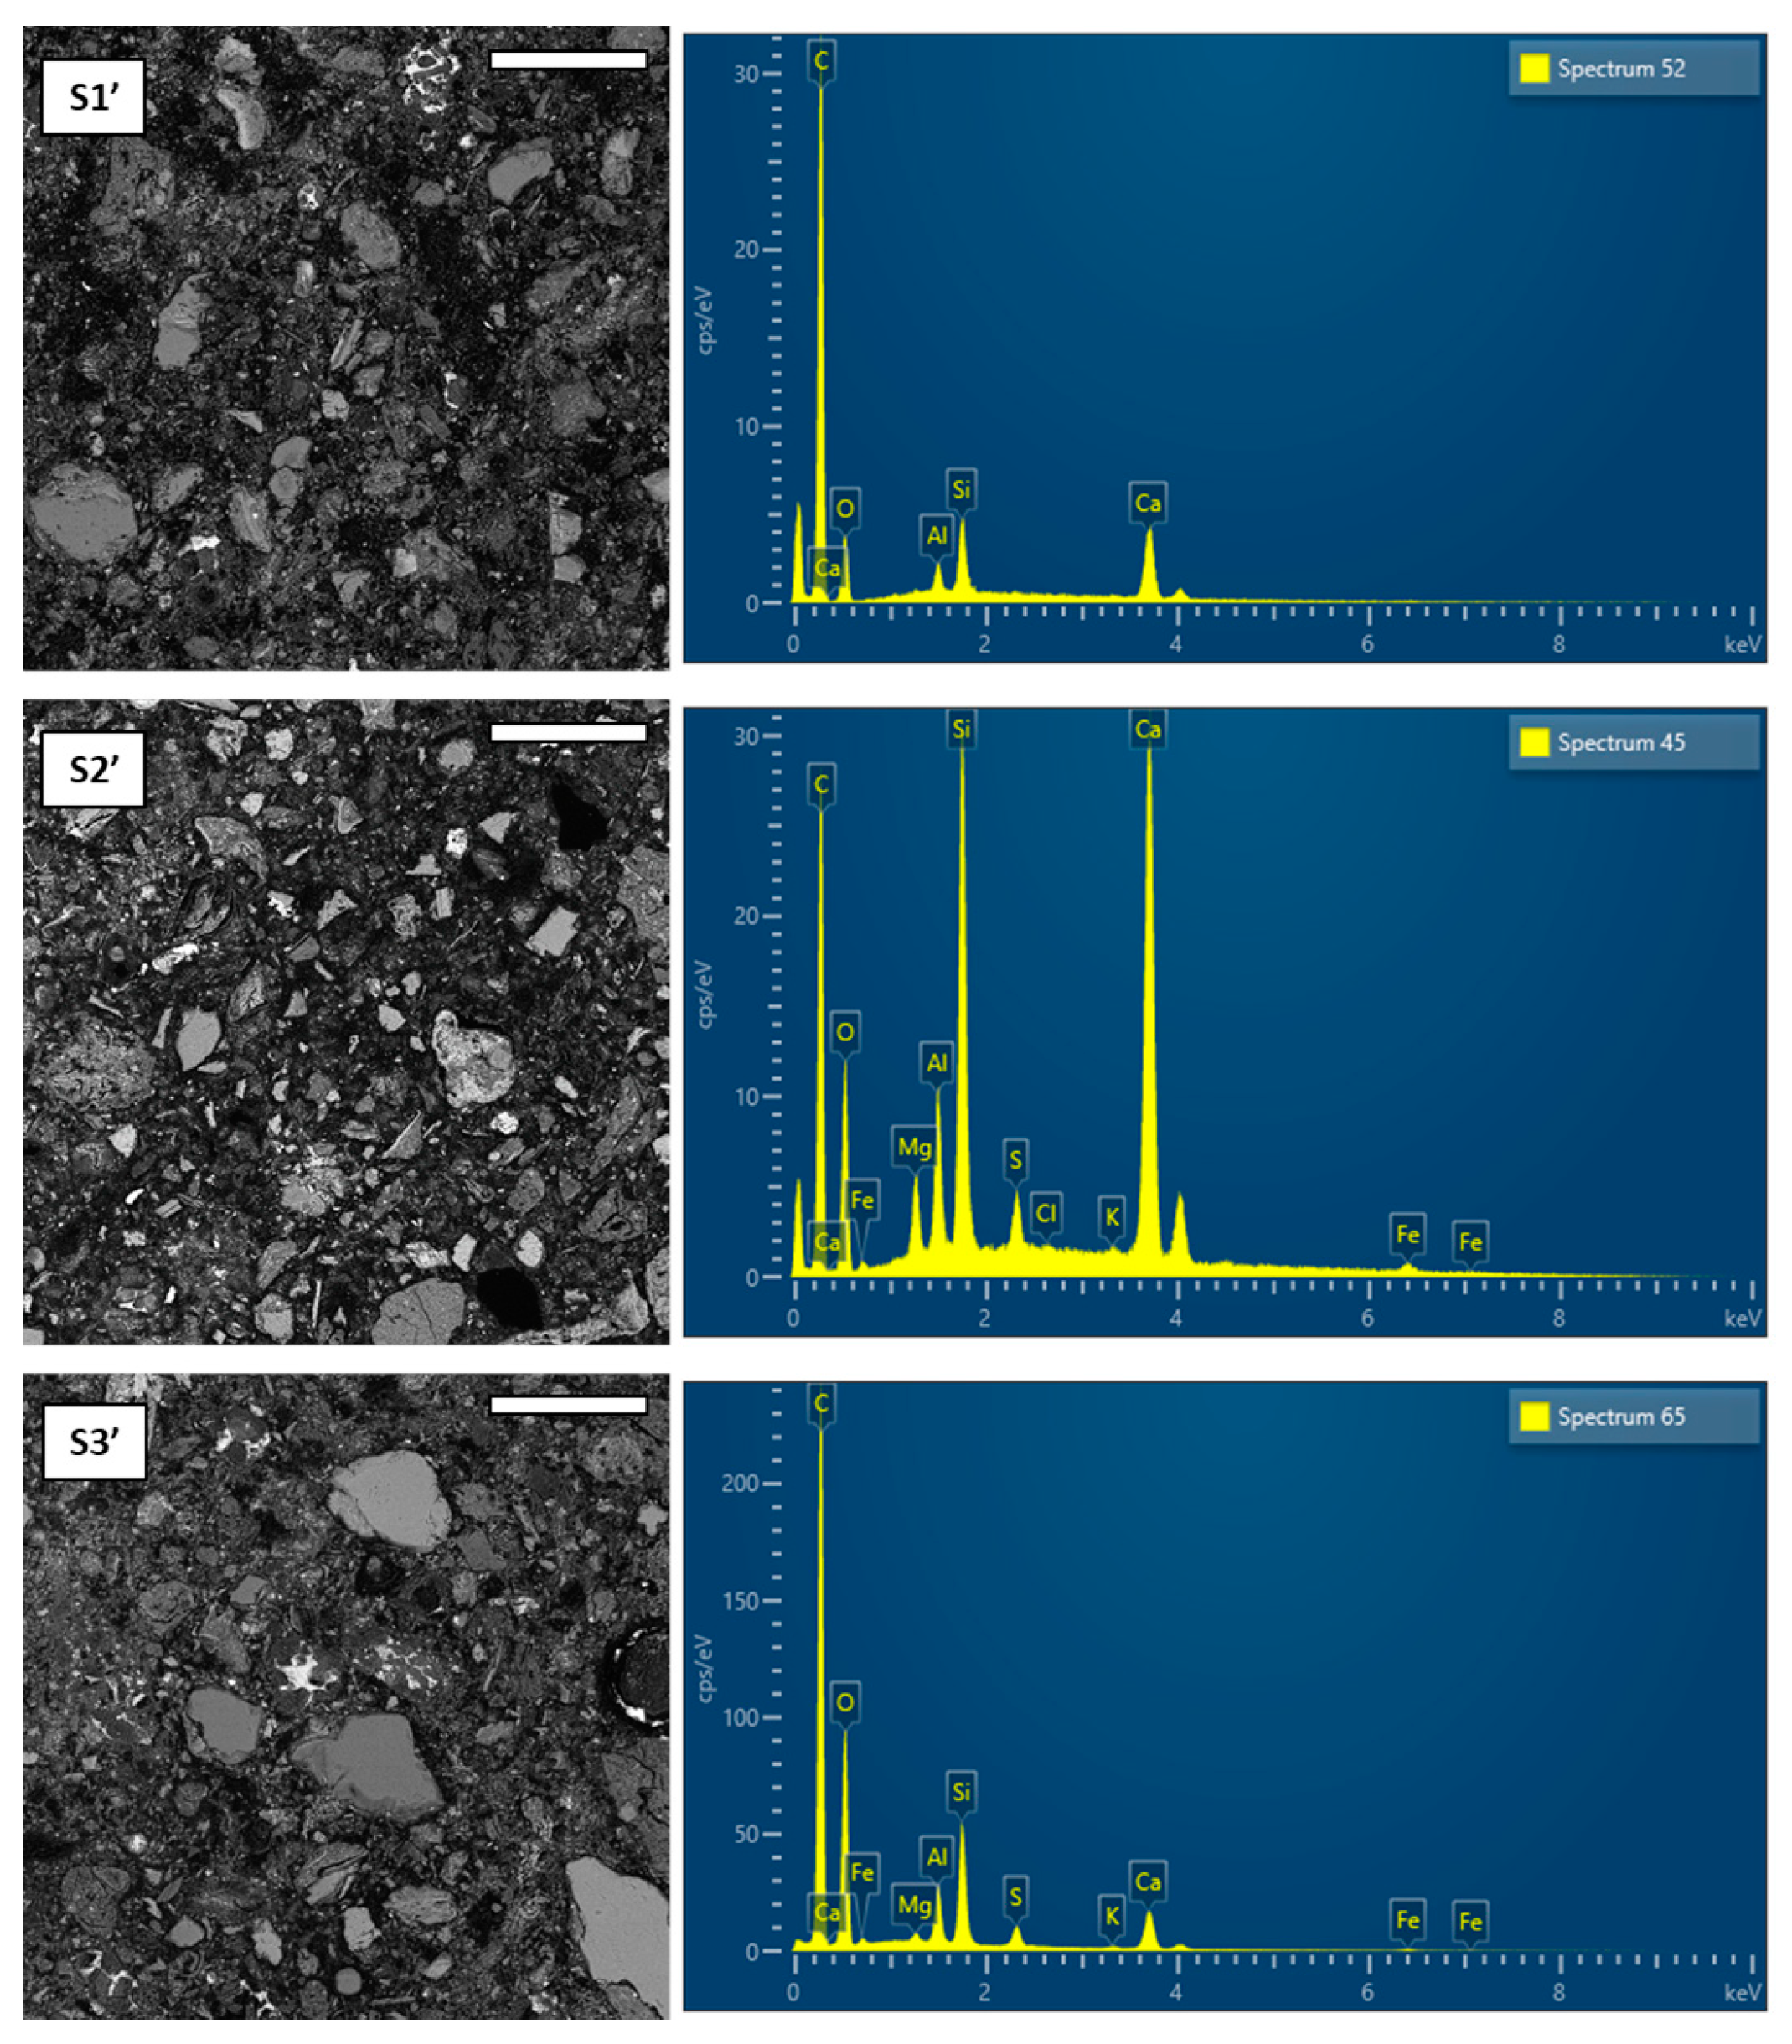
- The presence of kunkur fines in the ternary blends leads to similar hydration products as those occurring in LC3 containing limestone.
Author Contributions
Funding
Institutional Review Board Statement
Informed Consent Statement
Data Availability Statement
Conflicts of Interest
References
- Ansari, Y.; Husain, D.; Das, U. K.; Haloi, J.; Khan, N. A.; Prakash, R.; Husain, M. Ecological Footprint Assessment of Concrete: Partial Replacement of Cement by Water Treatment Sludge and Stone Dust. Sustainability, 2023, 15 (9), 7512. [CrossRef]
- Tennis, P. D.; Thomas, M. D. A.; Weiss, W. J. State-of-the-Art Report on Use of Limestone in Cements at Levels of up to 15%. PCA RD SN3148 Portland Cem. Assoc. Skokie IL, 2011.
- Scrivener, K. L. Options for the Future of Cement. Indian Concr J, 2014, 88 (7), 11–21.
- Machner, A.; Zajac, M.; Haha, M. B.; Kjellsen, K. O.; Geiker, M. R.; De Weerdt, K. Limitations of the Hydrotalcite Formation in Portland Composite Cement Pastes Containing Dolomite and Metakaolin. Cem. Concr. Res., 2018, 105, 1–17. [CrossRef]
- Oey, T.; Kumar, A.; Bullard, J. W.; Neithalath, N.; Sant, G. The Filler Effect: The Influence of Filler Content and Surface Area on Cementitious Reaction Rates. J. Am. Ceram. Soc., 2013, 96 (6), 1978–1990. [CrossRef]
- Imbabi, M. S.; Carrigan, C.; McKenna, S. Trends and Developments in Green Cement and Concrete Technology. Int. J. Sustain. Built Environ., 2012, 1 (2), 194–216. [CrossRef]
- Błaszczyński, T.; Król, M. Usage of Green Concrete Technology in Civil Engineering. Procedia Eng., 2015, 122, 296–301. [CrossRef]
- Habert, G.; Miller, S. A.; John, V. M.; Provis, J. L.; Favier, A.; Horvath, A.; Scrivener, K. L. Environmental Impacts and Decarbonization Strategies in the Cement and Concrete Industries. Nat. Rev. Earth Environ., 2020, 1 (11), 559–573. [CrossRef]
- Scrivener, K.; Martirena, F.; Bishnoi, S.; Maity, S. Calcined Clay Limestone Cements (LC3). Cem. Concr. Res., 2018, 114, 49–56. [CrossRef]
- Krishnan, S.; Emmanuel, A. C.; Shah, V.; Parashar, A.; Mishra, G.; Maity, S.; Bishnoi, S. Industrial Production of Limestone Calcined Clay Cement: Experience and Insights. Green Mater., 2019, 7 (1), 15–27. [CrossRef]
- Bishnoi, S.; Maity, S.; Mallik, A.; Joseph, S.; Krishnan, S. Pilot Scale Manufacture of Limestone Calcined Clay Cement: The Indian Experience. Indian Concr J, 2014, 88 (6), 22–28.
- Emmanuel, A. C.; Haldar, P.; Maity, S.; Bishnoi, S. Second Pilot Production of Limestone Calcined Clay Cement in India: The Experience. Indian Concr J, 2016, 90 (5), 57–63.
- Dhandapani, Y.; Sakthivel, T.; Santhanam, M.; Gettu, R.; Pillai, R. G. Mechanical Properties and Durability Performance of Concretes with Limestone Calcined Clay Cement (LC3). Cem. Concr. Res., 2018, 107, 136–151. [CrossRef]
- Hanein, T.; Thienel, K.-C.; Zunino, F.; Marsh, A.; Maier, M.; Wang, B.; Canut, M.; Juenger, M. C.; Ben Haha, M.; Avet, F. Clay Calcination Technology: State-of-the-Art Review by the RILEM TC 282-CCL. Mater. Struct., 2022, 55 (1), 1–29. [CrossRef]
- Medepalli, S.; Shah, V.; Bishnoi, S. Production of Lab Scale Limestone Calcined Clay Cements Using Low Grade Limestone. 2016.
- Zolfagharnasab, A.; Ramezanianpour, A. A.; Bahman-Zadeh, F. Investigating the Potential of Low-Grade Calcined Clays to Produce Durable LC3 Binders against Chloride Ions Attack. Constr. Build. Mater., 2021, 303, 124541. [CrossRef]
- Krishnan, S.; Gopala Rao, D.; Bishnoi, S. Why Low-Grade Calcined Clays Are the Ideal for the Production of Limestone Calcined Clay Cement (LC3). In Calcined Clays for Sustainable Concrete; Springer, 2020; pp 125–130.
- Krishnan, S.; Emmanuel, A. C.; Shah, V.; Parashar, A.; Mishra, G.; Maity, S.; Bishnoi, S. Industrial Production of Limestone Calcined Clay Cement: Experience and Insights. Green Mater., 2018, 7 (1), 15–27. [CrossRef]
- Danner, T.; Justnes, H.; Norden, G.; Østnor, T. Feasibility of Calcined Marl as an Alternative Pozzolanic Material. In Calcined Clays for Sustainable Concrete; Springer, 2015; pp 67–73.
- Beuntner, N.; Thienel, K. C. Properties of Calcined Lias Delta Clay—Technological Effects, Physical Characteristics and Reactivity in Cement. In Calcined Clays for Sustainable Concrete; Springer, 2015; pp 43–50.
- Bullerjahn, F.; Zajac, M.; Pekarkova, J.; Nied, D. Novel SCM Produced by the Co-Calcination of Aluminosilicates with Dolomite. Cem. Concr. Res., 2020, 134, 106083. [CrossRef]
- Marangu, J. M. Physico-Chemical Properties of Kenyan Made Calcined Clay-Limestone Cement (LC3). Case Stud. Constr. Mater., 2020, 12, e00333. [CrossRef]
- Marangu, J. M.; Latif, E.; Maddalena, R. Evaluation of the Reactivity of Selected Rice Husk Ash-Calcined Clay Mixtures for Sustainable Cement Production. Ed. R Maddalena M Wright-Syed, 2021, 81.
- Rahhal, V.; Pavlík, Z.; Trezza, M.; Castellano, C.; Tironi, A.; Kulovaná, T.; Pokorný, J.; Černý, R.; Irassar, E. F. Red Ceramic Wastes: A Calcined Clay Pozzolan. In Calcined Clays for Sustainable Concrete; Springer, 2015; pp 179–187.
- Bentz, D. P.; Ferraris, C. F. Rheology and Setting of High Volume Fly Ash Mixtures. Cem. Concr. Compos., 2010, 32 (4), 265–270. [CrossRef]
- Castellano, C. C.; Bonavetti, V. L.; Donza, H. A.; Irassar, E. F. The Effect of w/b and Temperature on the Hydration and Strength of Blastfurnace Slag Cements. Constr. Build. Mater., 2016, 111, 679–688. [CrossRef]
- Bonavetti, V. L.; Rahhal, V. F.; Irassar, E. F. Studies on the Carboaluminate Formation in Limestone Filler-Blended Cements. Cem. Concr. Res., 2001, 31 (6), 853–859. [CrossRef]
- De Weerdt, K.; Kjellsen, K. O.; Sellevold, E.; Justnes, H. Synergy between Fly Ash and Limestone Powder in Ternary Cements. Cem. Concr. Compos., 2011, 33 (1), 30–38. [CrossRef]
- Moesgaard, M.; Herfort, D.; Steenberg, M.; Kirkegaard, L. F.; Yue, Y. Physical Performances of Blended Cements Containing Calcium Aluminosilicate Glass Powder and Limestone. Cem. Concr. Res., 2011, 41 (3), 359–364. [CrossRef]
- Cost, V. T.; Aci, F. Concrete Sustainability versus Constructability—Closing the Gap. In 2011 international concrete sustainability conference, Boston; 2011.
- Costa, E. B. C.; Cardoso, F. A.; John, V. M. Influence of High Contents of Limestone Fines on Rheological Behaviour and Bond Strength of Cement-Based Mortars. Constr. Build. Mater., 2017, 156, 1114–1126. [CrossRef]
- Sato, T.; Beaudoin, J. J. Effect of Nano-CaCO3 on Hydration of Cement Containing Supplementary Cementitious Materials. Adv. Cem. Res., 2011, 23 (1), 33–43.
- Ferrari, G.; Brocchi, A.; Castiglioni, F.; Bravo, A.; Moretti, E.; Salvioni, D.; Squinzi, M.; Artioli, G.; Dalconi, M.; Valentini, L.; et al. A New Multifunctional Additive for Blended Cements. Constr. Build. Mater., 2022, 354, 129086. [CrossRef]
- Nair, N.; Haneefa, K. M.; Santhanam, M.; Gettu, R. A Study on Fresh Properties of Limestone Calcined Clay Blended Cementitious Systems. Constr. Build. Mater., 2020, 254, 119326. [CrossRef]
- Sposito, R.; Beuntner, N.; Thienel, K.-C. Characteristics of Components in Calcined Clays and Their Influence on the Efficiency of Superplasticizers. Cem. Concr. Compos., 2020, 110, 103594. [CrossRef]
- Zhang, J.; Wang, Q.; Wang, Z. Optimizing Design of High Strength Cement Matrix with Supplementary Cementitious Materials. Constr. Build. Mater., 2016, 120, 123–136. [CrossRef]
- Fernández, Á.; Calvo, J. G.; Alonso, M. C. Ordinary Portland Cement Composition for the Optimization of the Synergies of Supplementary Cementitious Materials of Ternary Binders in Hydration Processes. Cem. Concr. Compos., 2018, 89, 238–250. [CrossRef]
- Eren, M. Caliche Formation and Features. Jeol. Muhendisligi Derg., 2006, 30, 1–8.
- Gareth, H. Mapping calcretes in Inhambane province, Mozambique, for use in road construction | SpringerLink https://link.springer.com/article/10.1007/s10064-014-0688-3 (accessed Feb 19, 2023). [CrossRef]
- Netterberg, F. Low-Cost Local Road Materials in Southern Africa. Geotech. Geol. Eng., 1994, 12, 35–42. [CrossRef]
- Reeves, C. C.; Suggs, J. D. Caliche of Central and Southern Llano Estacado, Texas. J. Sediment. Res., 1964, 34 (3), 669–672. [CrossRef]
- Mutua, M. G. Investigation of Matisaa Gray Rock as a Potential Raw Material for the Manufacture of Cement, 2020.
- Geoffrey, M.; Isaac, M.; Fredrick, O. Parametric Study of Matisaa Gray Rock as a Potential Clinker Material. 2020. [CrossRef]
- KS EAS 148-2: KS EAS 148-2: 2017 Cement - Test Methods Part 2: Chemical Composition. 2017.
- Leardi, R. Experimental Design in Chemistry: A Tutorial. Anal. Chim. Acta, 2009, 652 (1–2), 161. [CrossRef]
- KS EAS 18-1: KS EAS 18-1: 2017, Cement Part 1: Composition, Specification and Conformity Criteria for Common Cements. 2017.
- KS EAS 18-2: KS EAS 18-2: 2017: Cement Part 2: Conformity Evaluation. 2017.
- Sui, H.; Hou, P.; Liu, Y.; Sagoe-Crentsil, K.; Basquiroto de Souza, F.; Duan, W. Limestone Calcined Clay Cement: Mechanical Properties, Crystallography, and Microstructure Development. J. Sustain. Cem.-Based Mater., 2022, 1–14. [CrossRef]
- Gameiro, A.; Silva, A. S.; Faria, P.; Grilo, J.; Branco, T.; Veiga, R.; Velosa, A. Physical and Chemical Assessment of Lime–Metakaolin Mortars: Influence of Binder: Aggregate Ratio. Cem. Concr. Compos., 2014, 45, 264–271. [CrossRef]
- Feng, Y.; Zhang, Q.; Chen, Q.; Wang, D.; Guo, H.; Liu, L.; Yang, Q. Hydration and Strength Development in Blended Cement with Ultrafine Granulated Copper Slag. PLoS One, 2019, 14 (4), e0215677. [CrossRef]
- Zunino, F.; Scrivener, K. The Reaction between Metakaolin and Limestone and Its Effect in Porosity Refinement and Mechanical Properties. Cem. Concr. Res., 2021, 140, 106307. [CrossRef]
- Sui, H.; Hou, P.; Liu, Y.; Sagoe-Crentsil, K.; Basquiroto de Souza, F.; Duan, W. Limestone Calcined Clay Cement: Mechanical Properties, Crystallography, and Microstructure Development. J. Sustain. Cem.-Based Mater., 2022, 1–14. [CrossRef]

| Mix | Clinker % | KF % | CC % | GY % |
| S1 | 55.0 | 15.0 | 25.0 | 5.0 |
| S2 | 40.0 | 15.0 | 40.0 | 5.0 |
| S3 | 40.0 | 30.0 | 25.0 | 5.0 |
| S4 | 40.0 | 22.5 | 32.5 | 5.0 |
| S5 | 47.5 | 22.5 | 25.0 | 5.0 |
| S6 | 47.5 | 15.0 | 32.5 | 5.0 |
| S7 | 45.0 | 20.0 | 30.0 | 5.0 |
| S8 | 95.0 | - | - | 5.0 |
| Mix | Clinker % | KF % | CC % | GY % |
|---|---|---|---|---|
| S1’ | 41.0 | 16.0 | 38.0 | 5.0 |
| S2’ | 42.0 | 26.0 | 27.0 | 5.0 |
| S3’ | 45.0 | 18.0 | 32.0 | 5.0 |
| OPC | 95.0 | 5.0 |
| Chemical composition (w%) | Clinker | Calcined clay | Gypsum | Kunkur fines |
|---|---|---|---|---|
| SiO2 | 21.3 | 59.26 | 7.2 | 52.32 |
| Al2O3 | 6.3 | 29.49 | 1.26 | 9.55 |
| Fe2O3 | 3.7 | 4.79 | 0.83 | 7.87 |
| CaO | 62.2 | 0.74 | 29.54 | 14.49 |
| SO3 | 1.5 | - | 40.48 | 0.16 |
| MgO | 3.9 | 2.13 | 0.28 | 3.22 |
| K2 O | 1.0 | 2.37 | 0.31 | 1.13 |
| Na2O | 0.4 | 1.21 | - | - |
| Cl | - | - | - | 0.01 |
| L.O. I | 0.8 |
Disclaimer/Publisher’s Note: The statements, opinions and data contained in all publications are solely those of the individual author(s) and contributor(s) and not of MDPI and/or the editor(s). MDPI and/or the editor(s) disclaim responsibility for any injury to people or property resulting from any ideas, methods, instructions or products referred to in the content. |
© 2023 by the authors. Licensee MDPI, Basel, Switzerland. This article is an open access article distributed under the terms and conditions of the Creative Commons Attribution (CC BY) license (http://creativecommons.org/licenses/by/4.0/).


