Submitted:
04 October 2023
Posted:
06 October 2023
You are already at the latest version
Abstract
Keywords:
1. Introduction
2. Materials and Methods
2.1. Materials

2.2. Methods
2.2.1. Image Acquisition

2.2.2. Images Processing
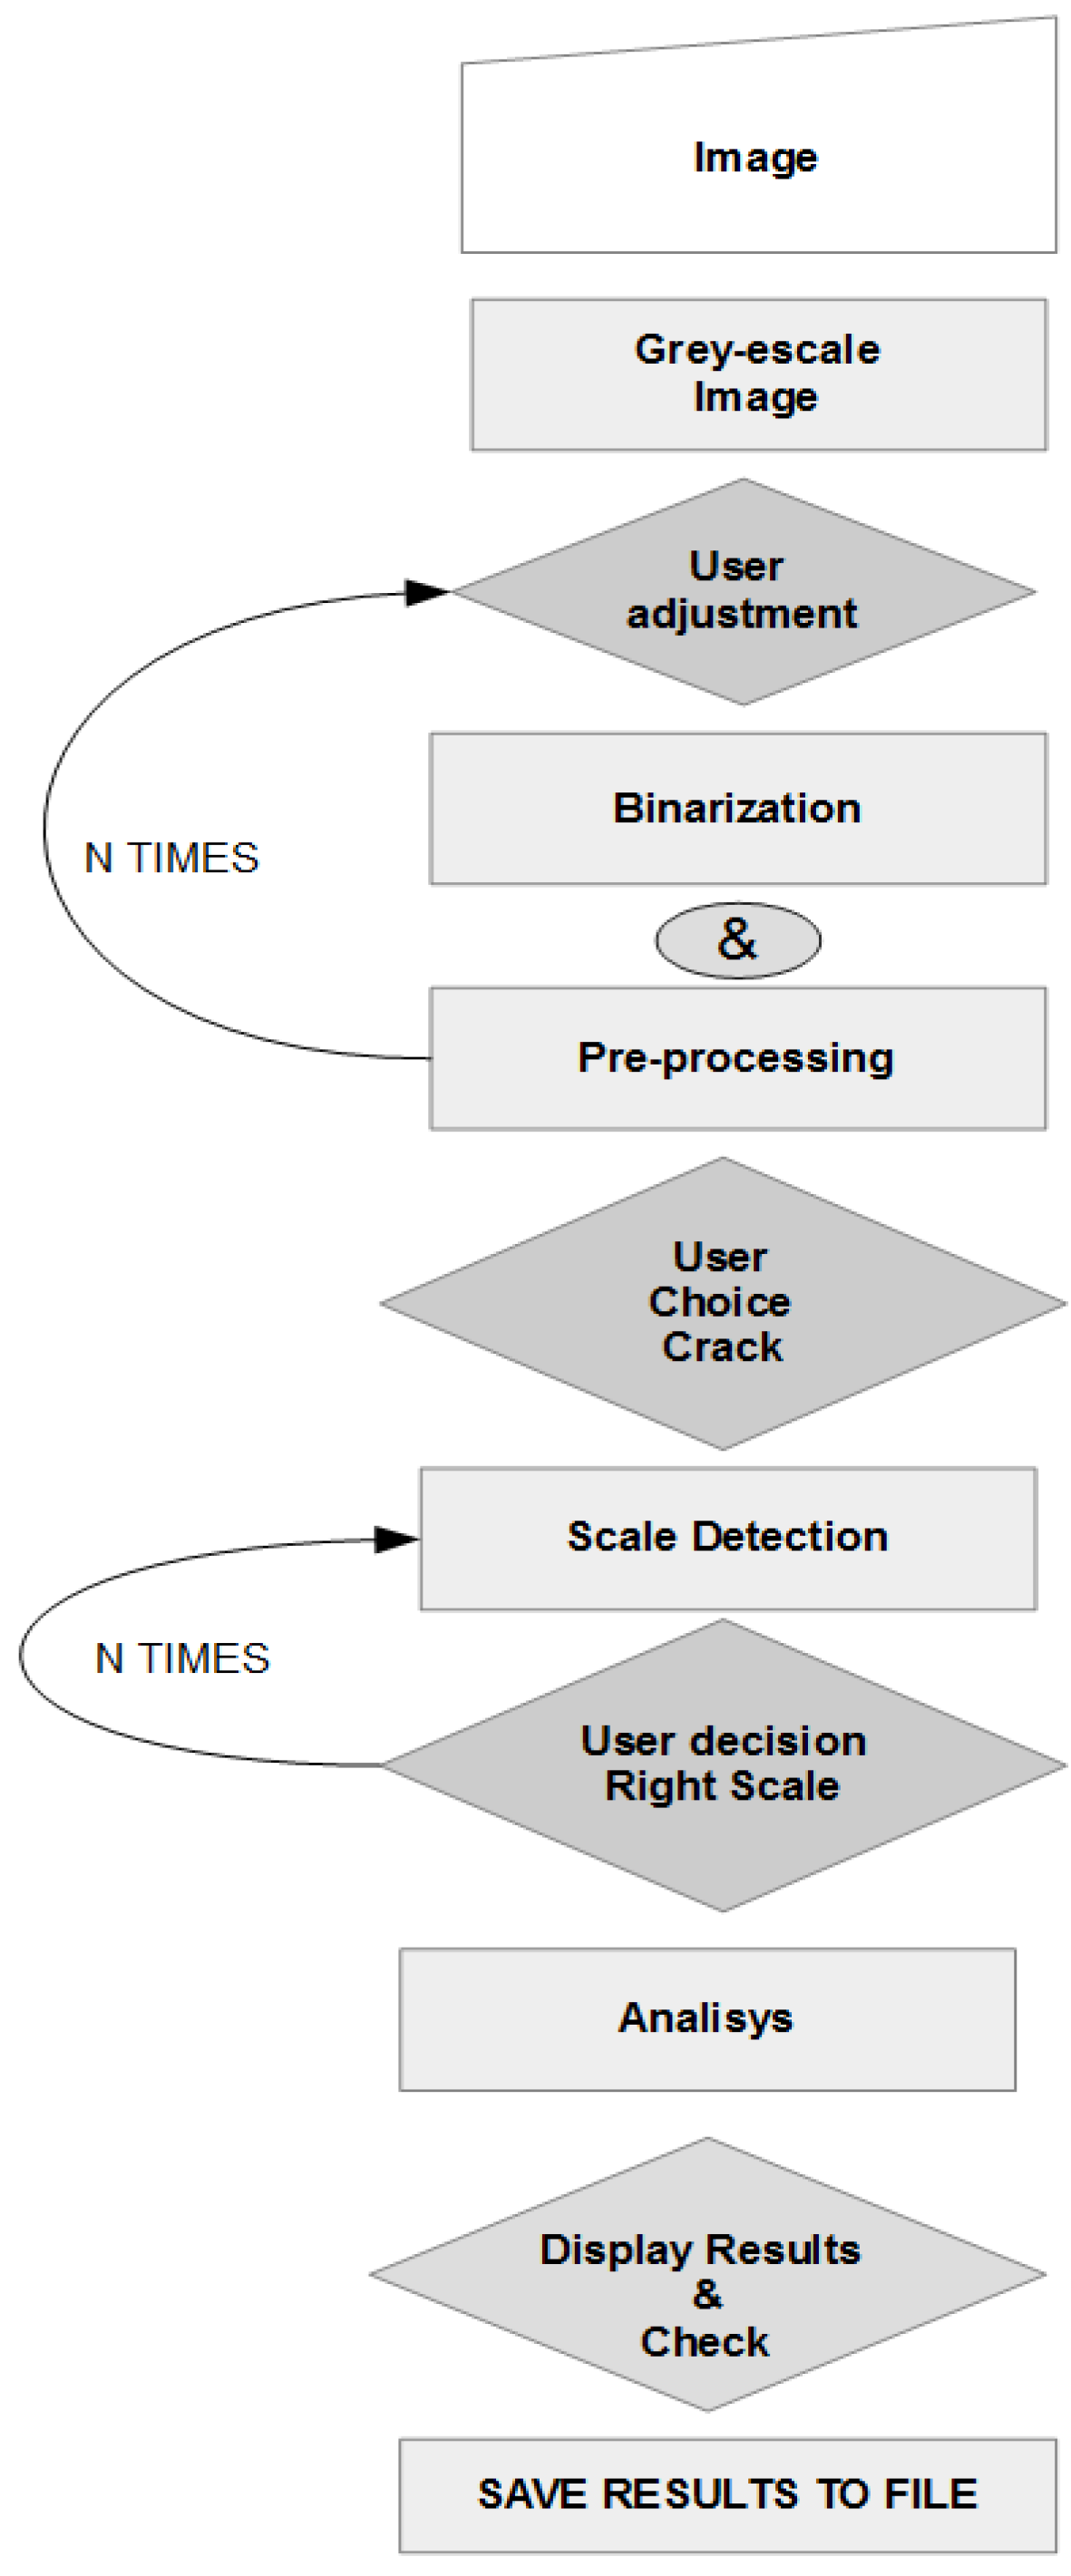
Binarizing and Pre-Processing

Analysis
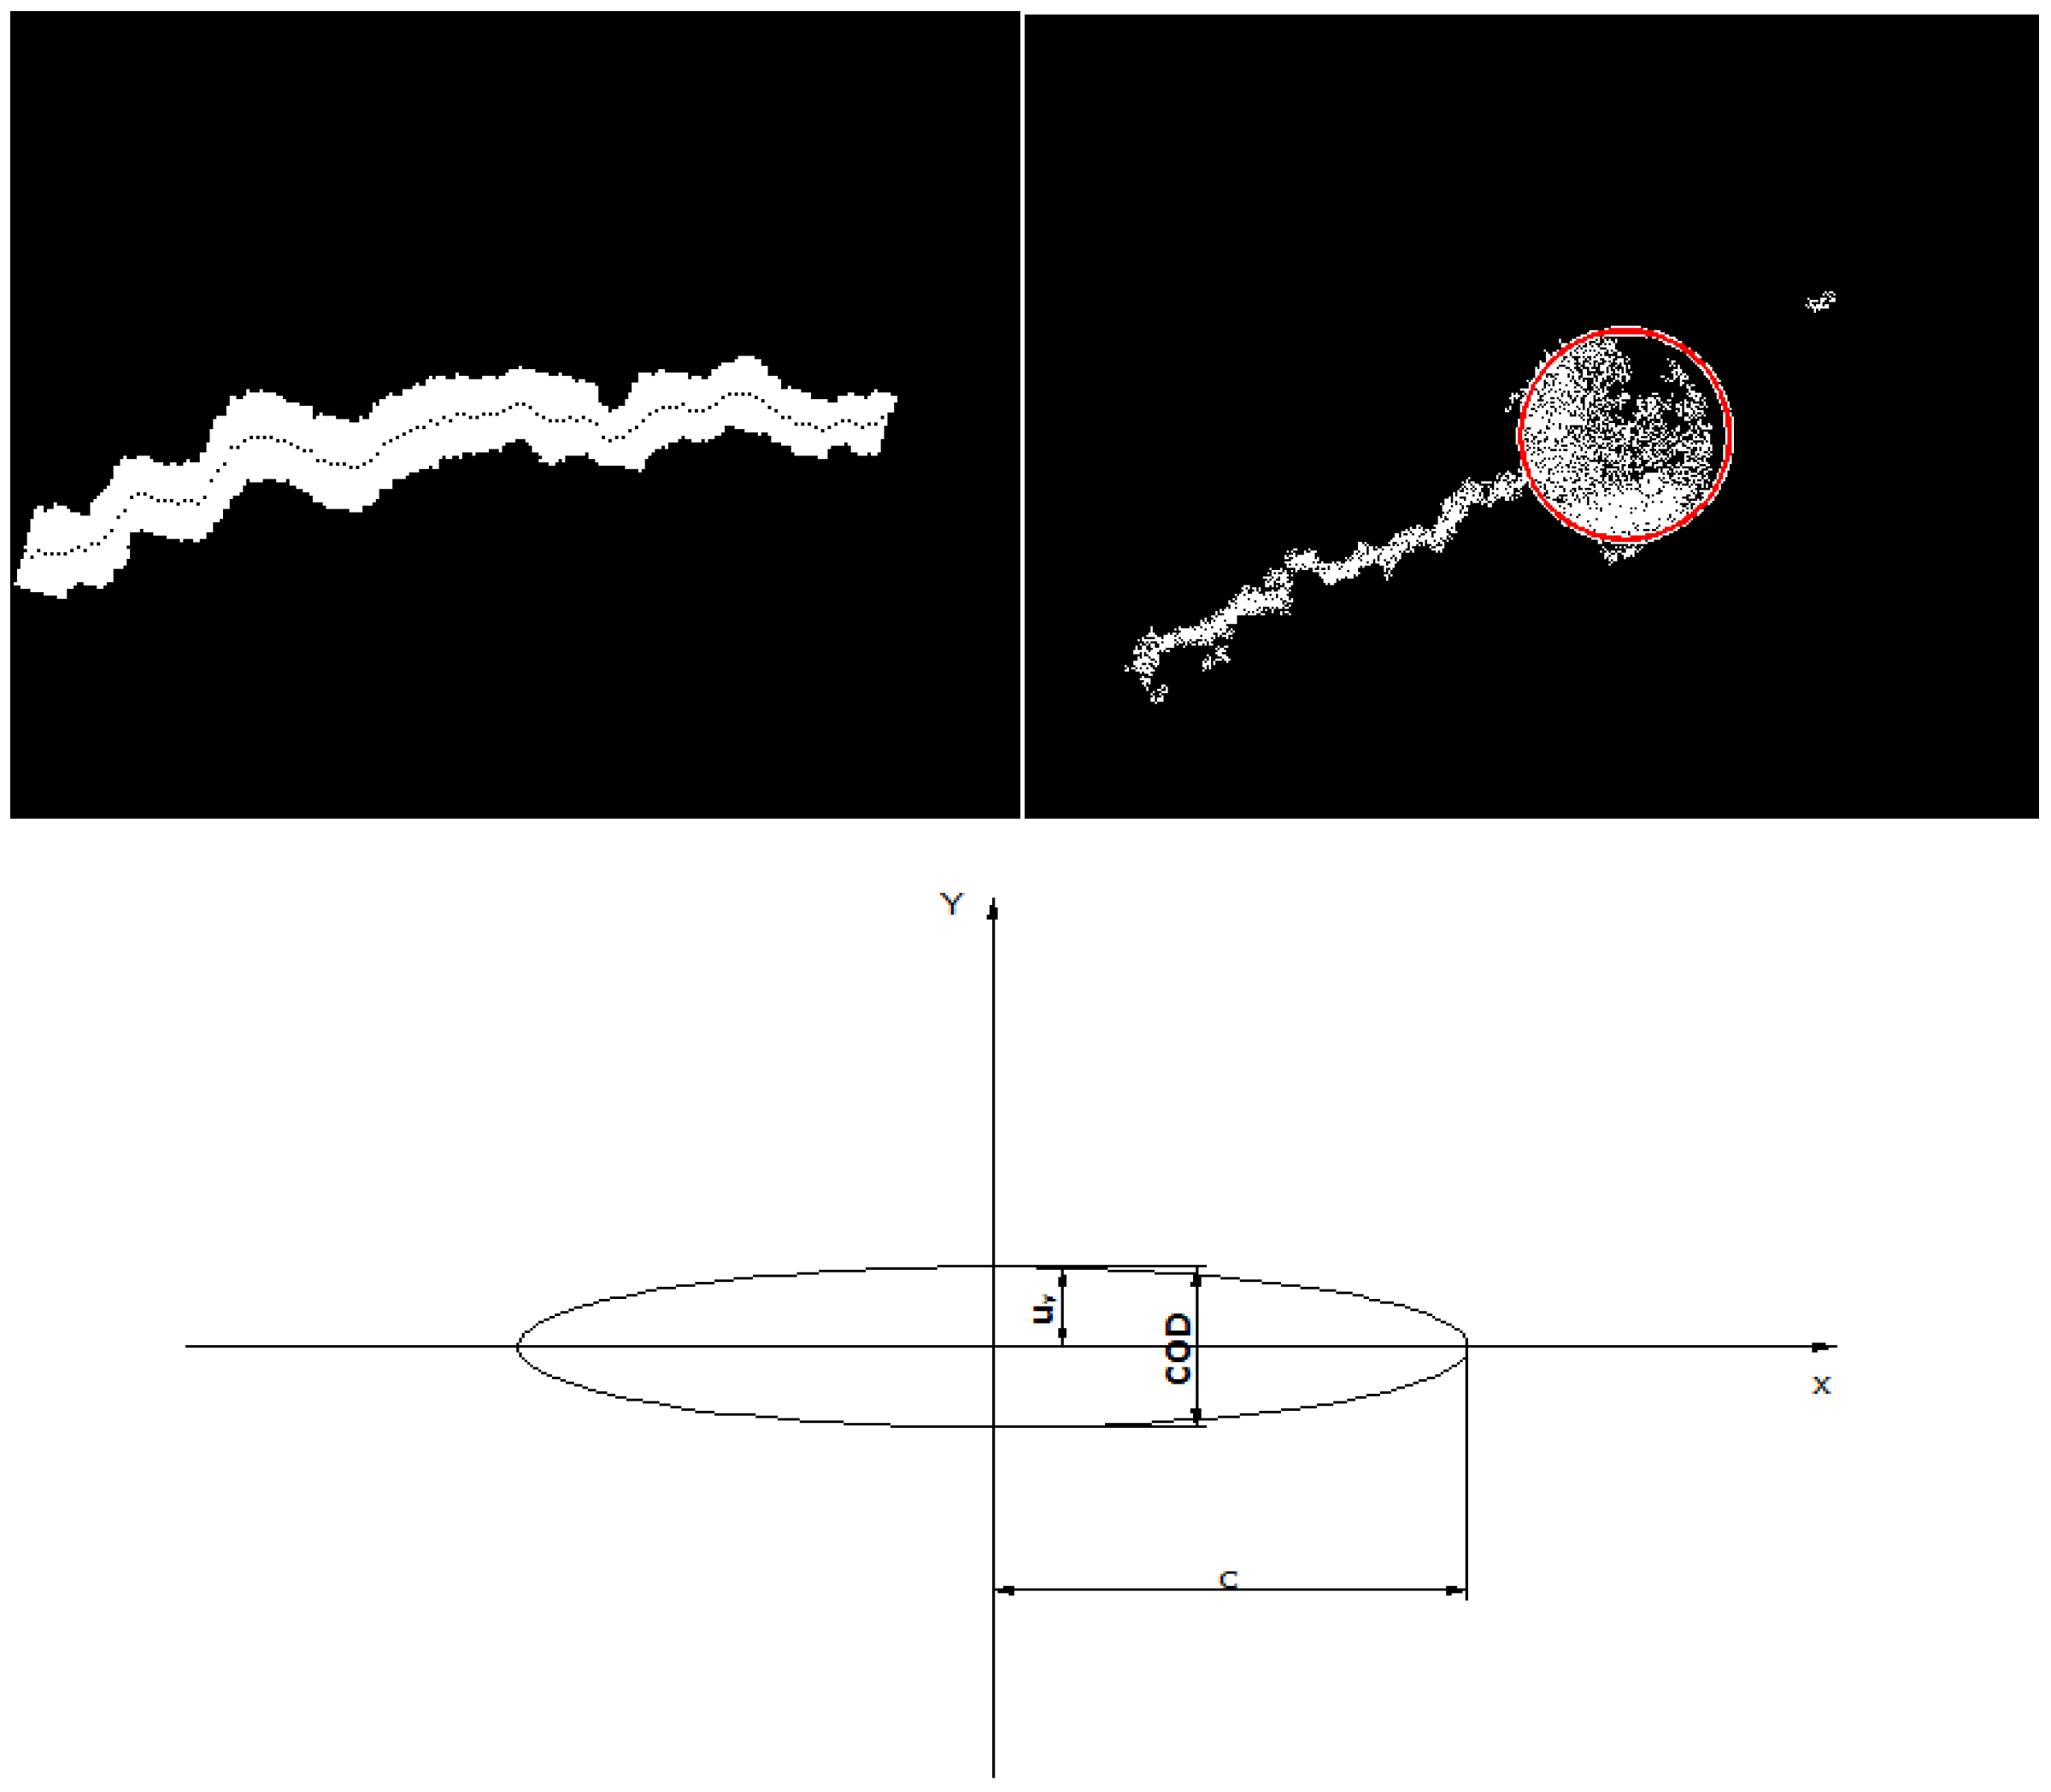
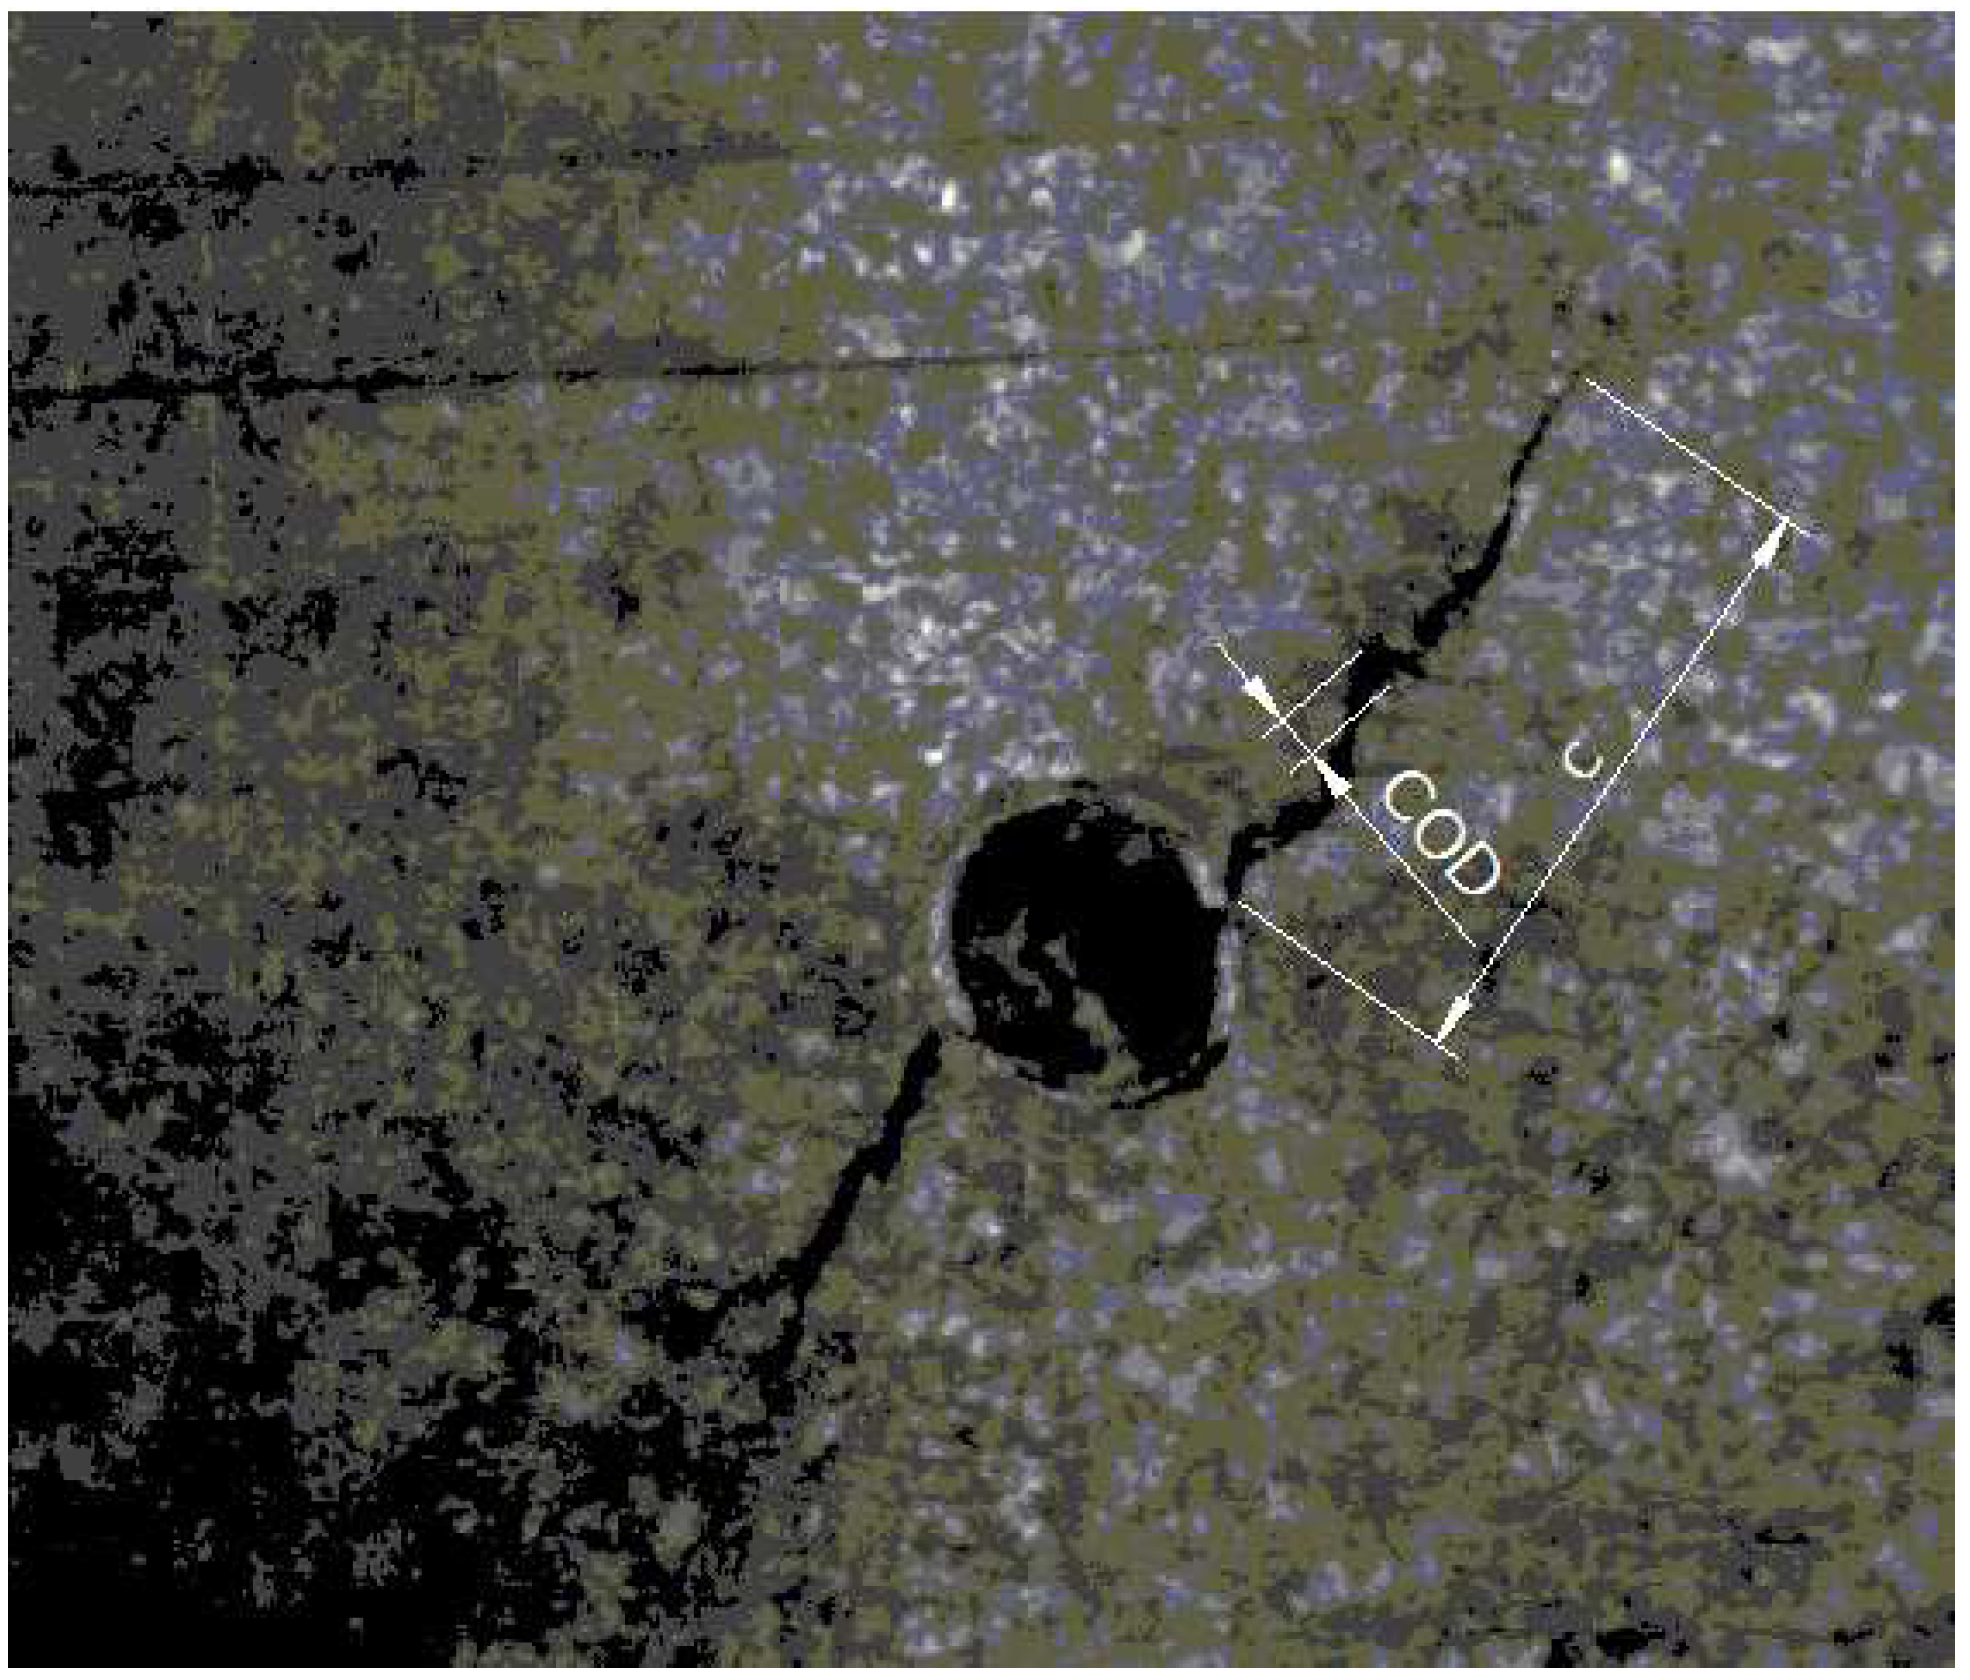
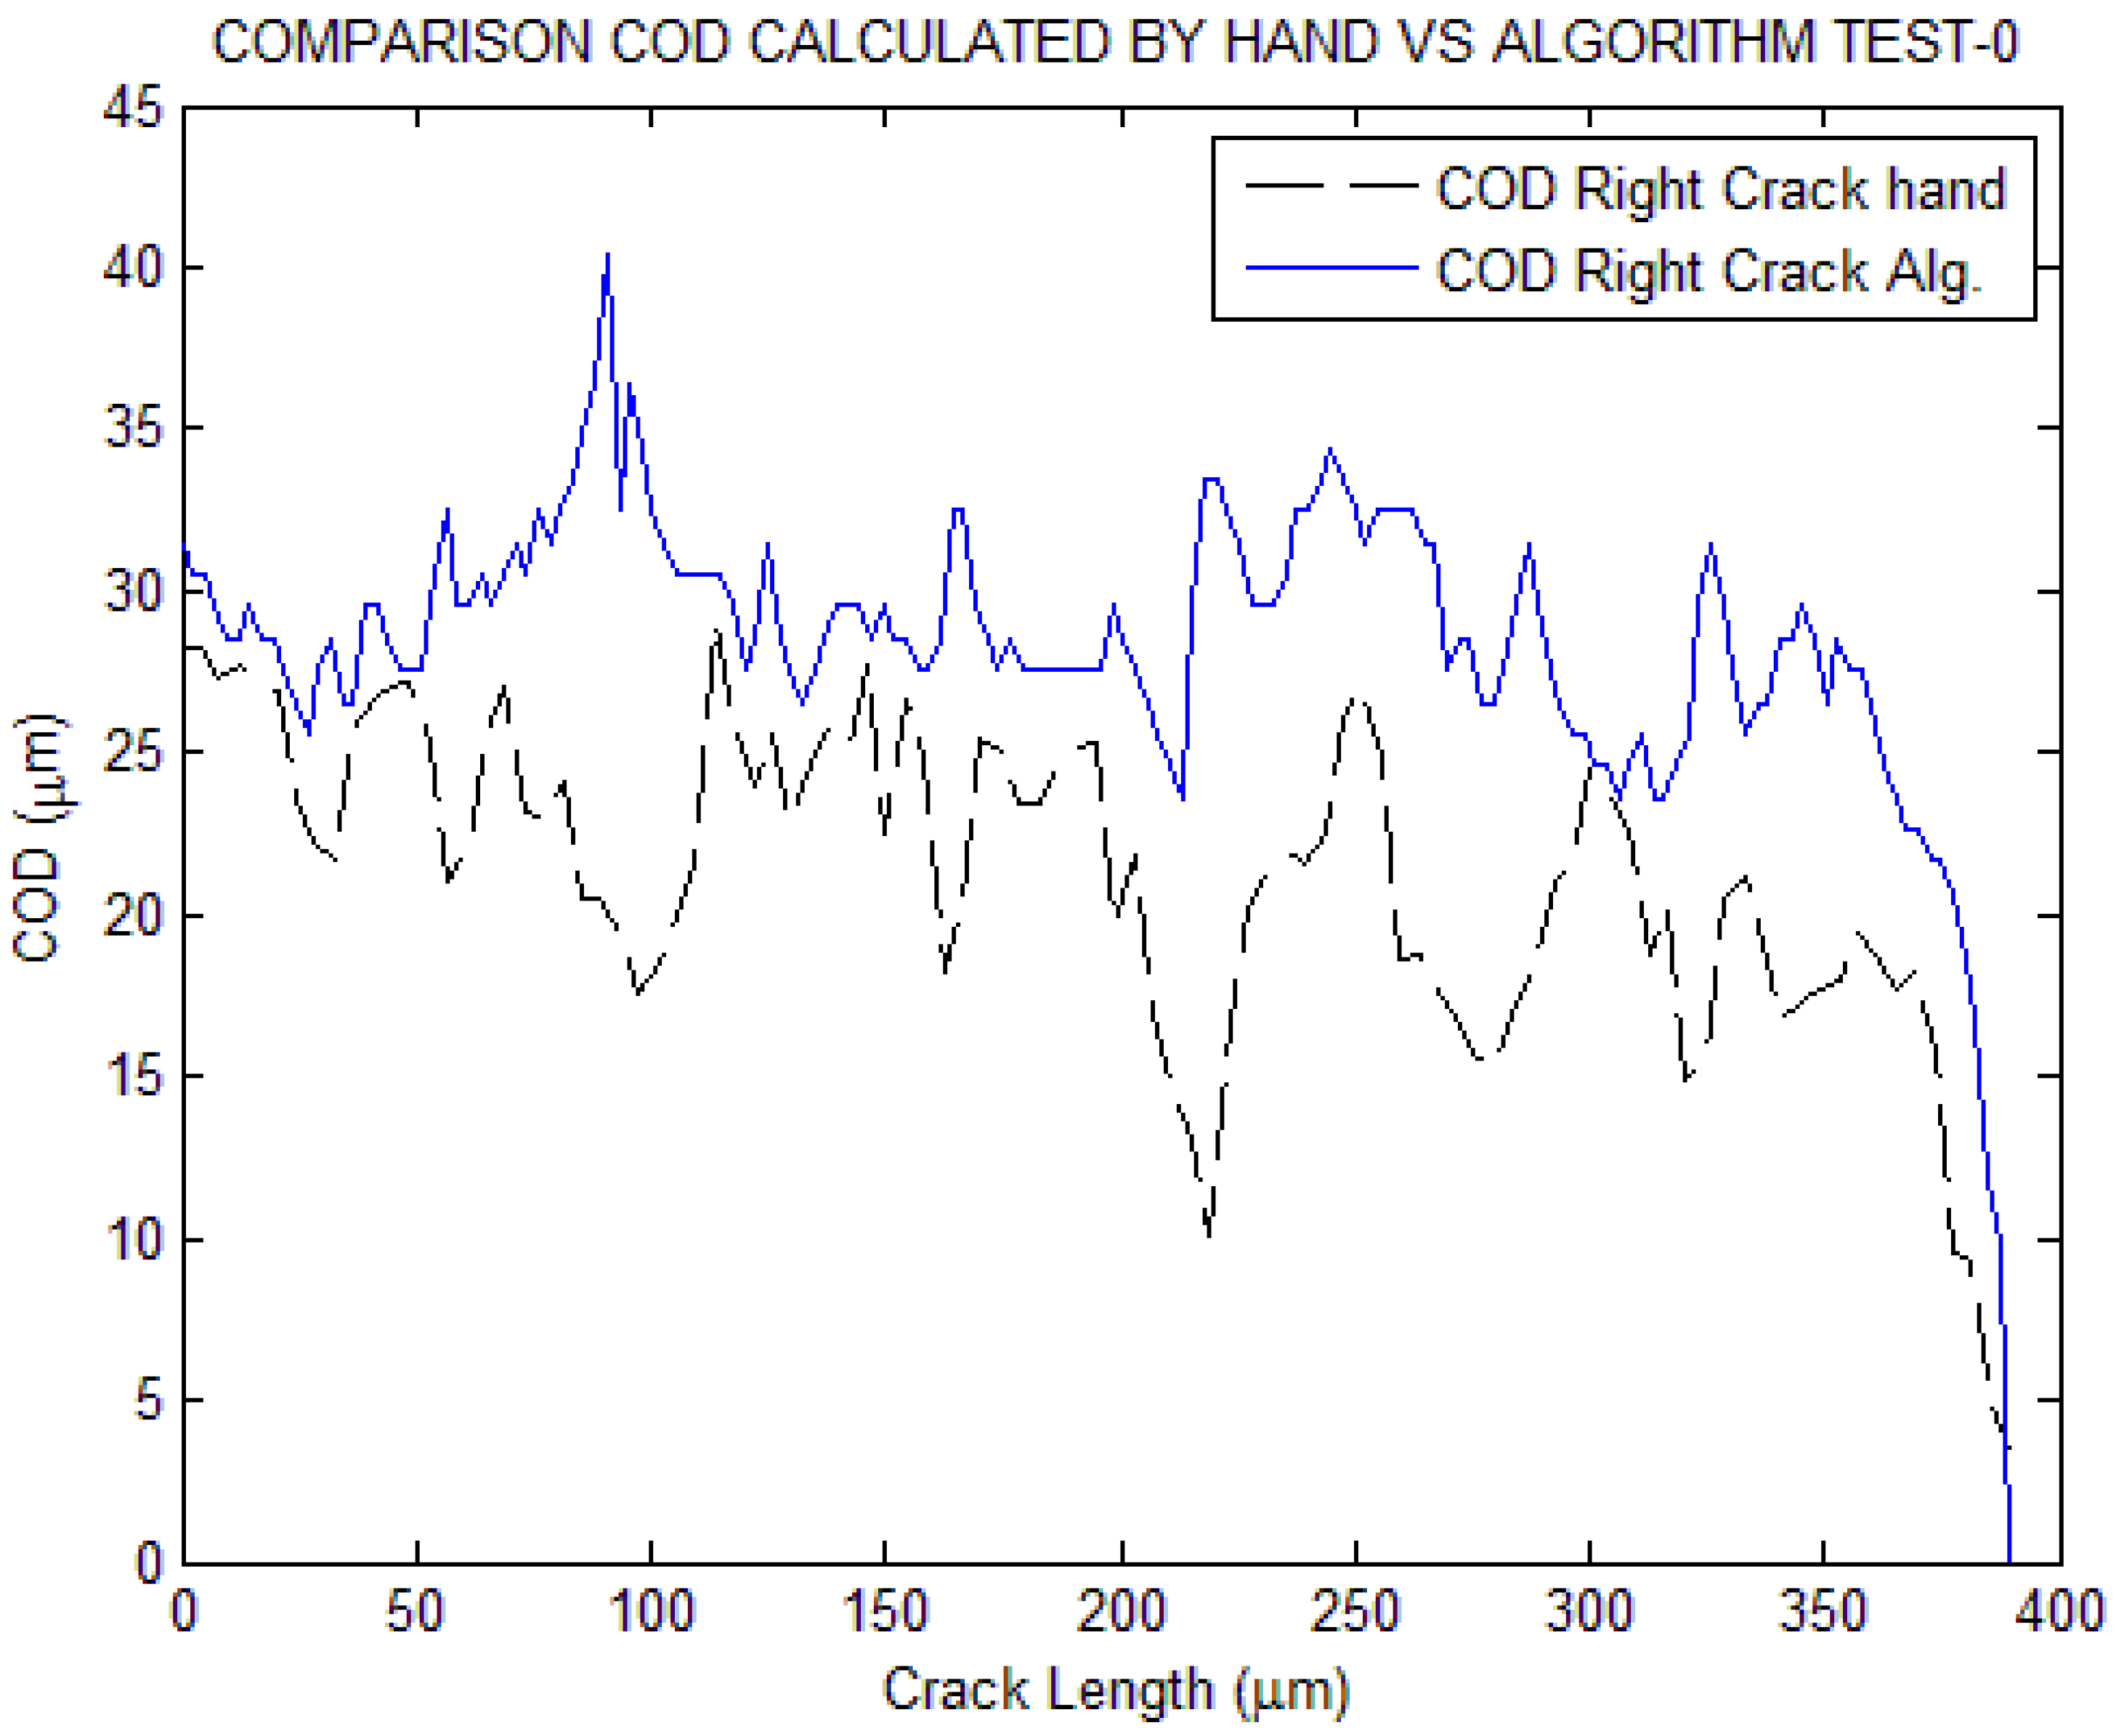
3. Results Discussion
| Right crack | Left crack | Cycle | Factor | |||
| Lineal length (µm) |
Real length (µm) |
Lineal length (µm) |
Real length (µm) |
|||
| Test-0° | 346.3178 | 453.4994 | 329.8621 | 453.38 | 825 | 0.9533 |
| Test-15° | 258.062 | 404.2203 | 317.3452 | 492.2306 | 875 | 1.1463 |
| Test-30° | 563.0178 | 812.8901 | 437.127 | 612.7134 | 1400 | 1.0461 |
| Test-45° | 657.1362 | 869.9099 | 562.0036 | 859.2285 | 1975 | 1.0774 |
| Right crack | Left crack | Factor | |
| Length (µm) (by Hand) |
Length (µm) (by Hand) |
||
| Test-0° | 425.5912 | 438.2894 | 1.1292 |
| Test-15° | 408.8691 | 565.7139 | 1.1559 |
| Test-30° | 795.8696 | 559.5837 | 1.1853 |
| Test-45° | 594.5870 | 599.7877 | 0.9016 |
| Standard deviation | ||||
| Right crack | Left crack | |||
| Lineal length (µm) |
Real length (µm) |
Lineal length (µm) |
Real length (µm) |
|
| Test-0° | 2.994009675 | 2.50368766 | 2.186817385 | 7.298339817 |
| Test-15° | 2.065488871 | 5.238372848 | 2.226731313 | 8.001147359 |
| Test-30° | 1.392092394 | 9.684152475 | 2.961942653 | 6.554759513 |
| Test-45° | 3.235506587 | 5.826145377 | 0.565502651 | 3.667433013 |
| Variance | ||||
| Right crack | Left crack | |||
| Lineal length (µm) |
Real length (µm) |
Lineal length (µm) |
Real length (µm) |
|
| Test-0° | 7.171275146 | 5.014761518 | 3.825736222 | 42.61261127 |
| Test-15° | 3.412995422 | 21.95244007 | 3.966665874 | 51.21468724 |
| Test-30° | 1.550336986 | 75.02624732 | 7.018483422 | 34.37189782 |
| Test-45° | 8.374802298 | 27.15517597 | 0.255834598 | 10.76005192 |
| Mean | ||
| Right crack | Left crack | |
| COD | COD | |
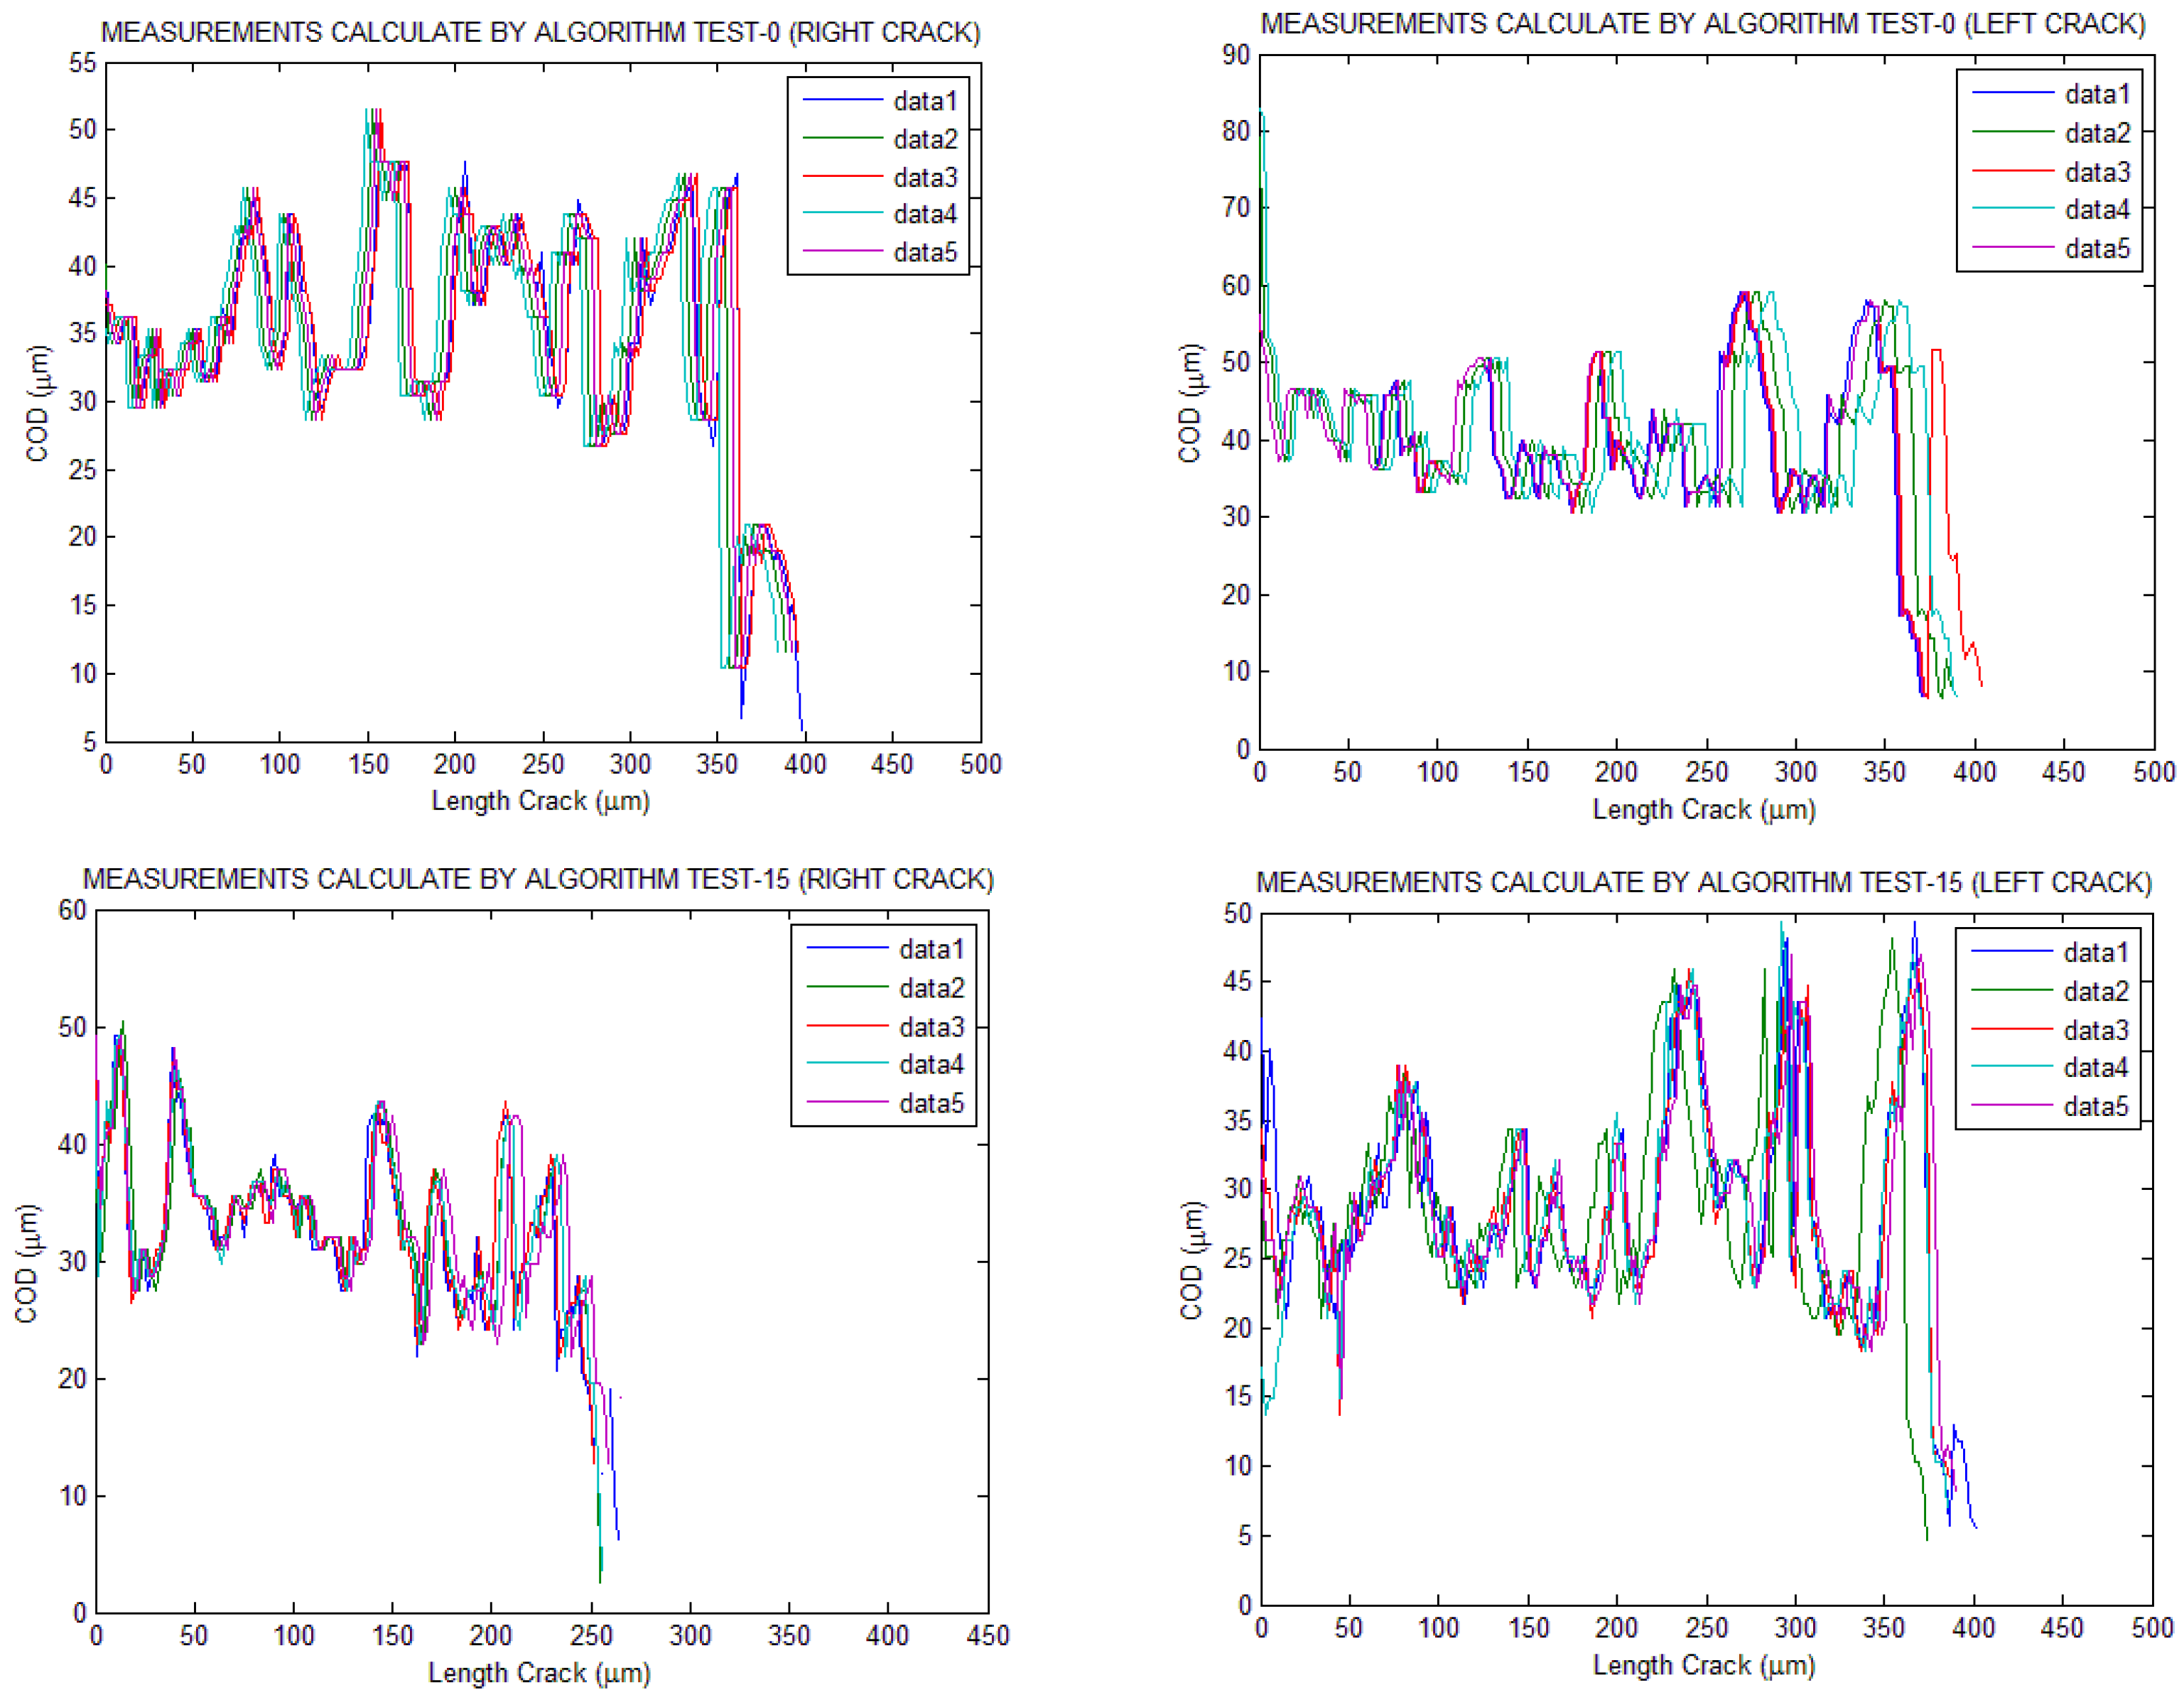
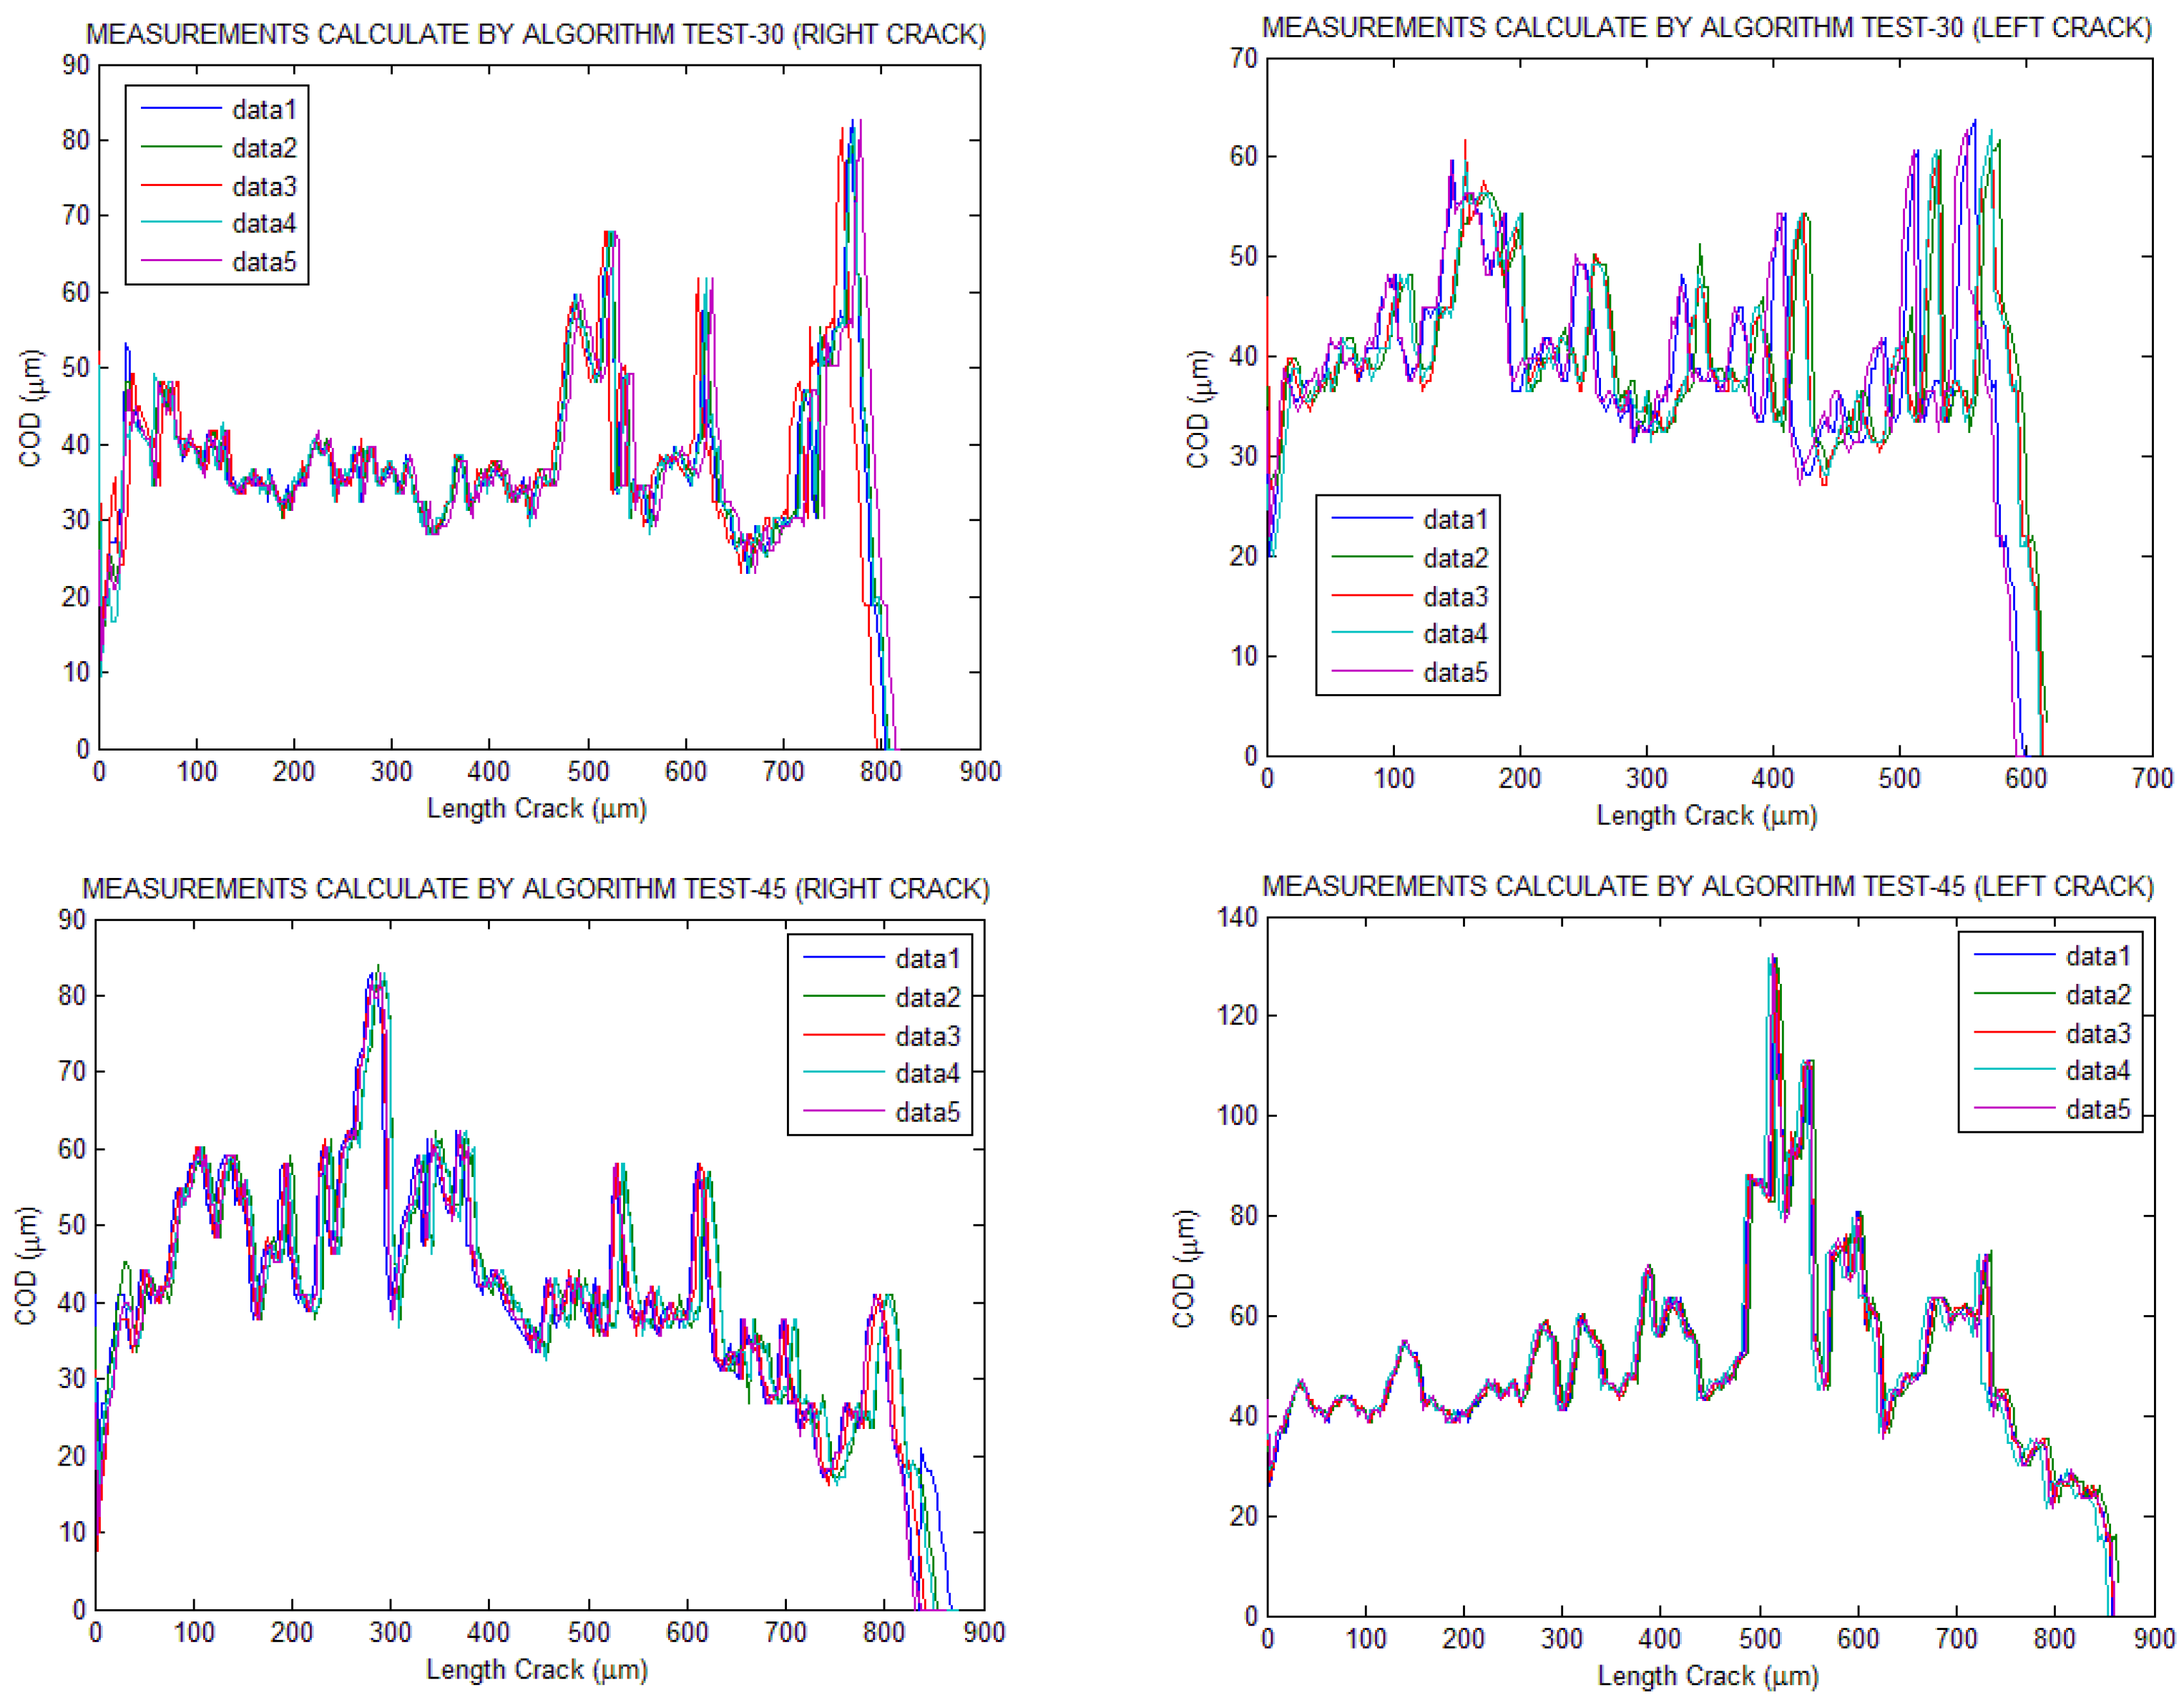
| Test-0° | 30.4514 | 34.1000 |
| Test-15° | 20.8312 | 22.8107 |
| Test-30° | 37.4639 | 39.5683 |
| Test-45° | 40.5614 | 50.7675 |
| Standard deviation | ||
| Right crack | Left crack | |
| COD (µm) | COD (µm) | |
| Test-0° | 2.3069 | 2.7625 |
| Test-15° | 1.1773 | 2.0918 |
| Test-30° | 2.6022 | 3.2553 |
| Test-45° | 2.3468 | 1.2570 |
| Right crack | |||
|
Length (µm) (Hand) |
Length (µm) ALG. | RD (%) | |
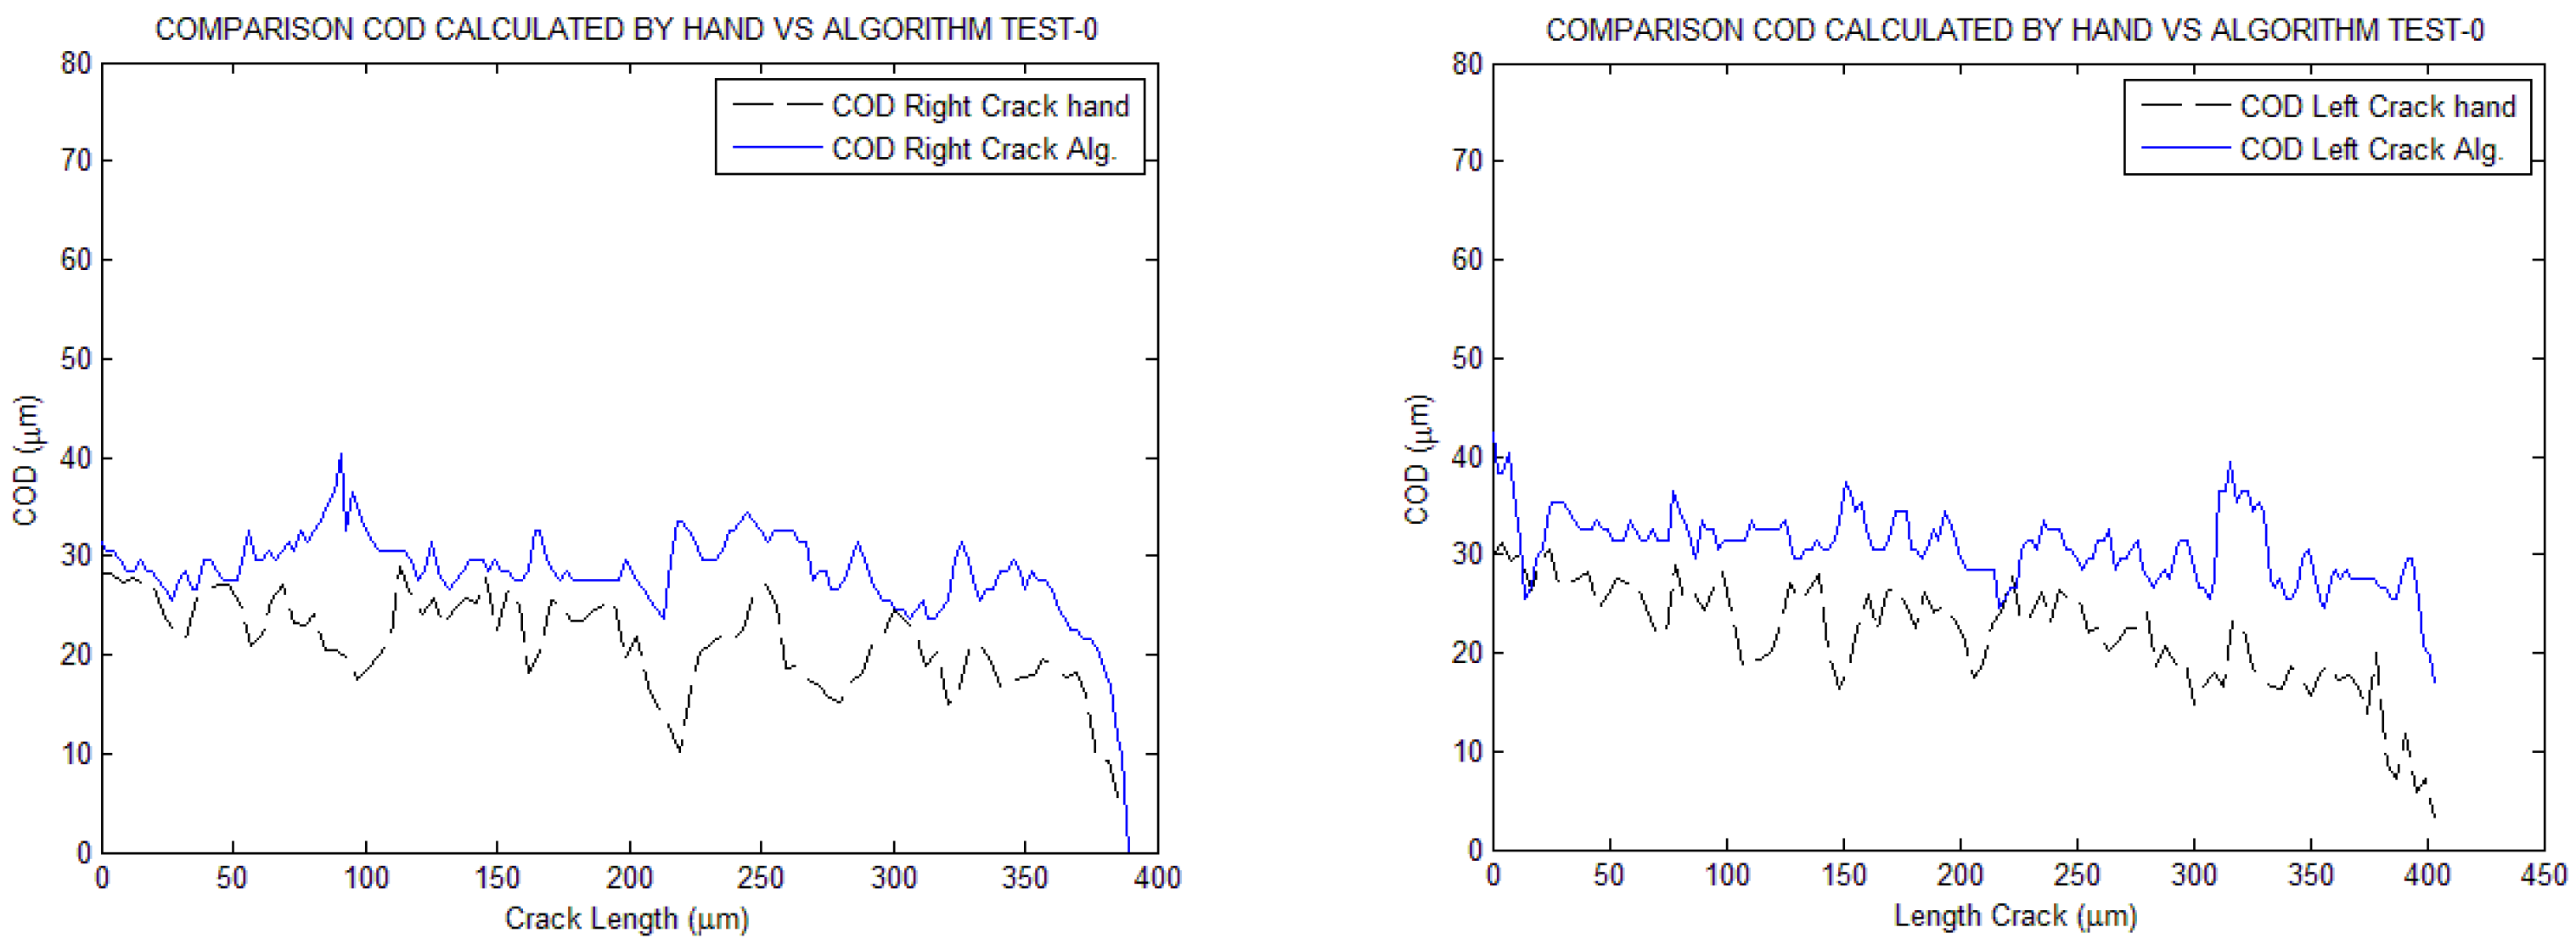
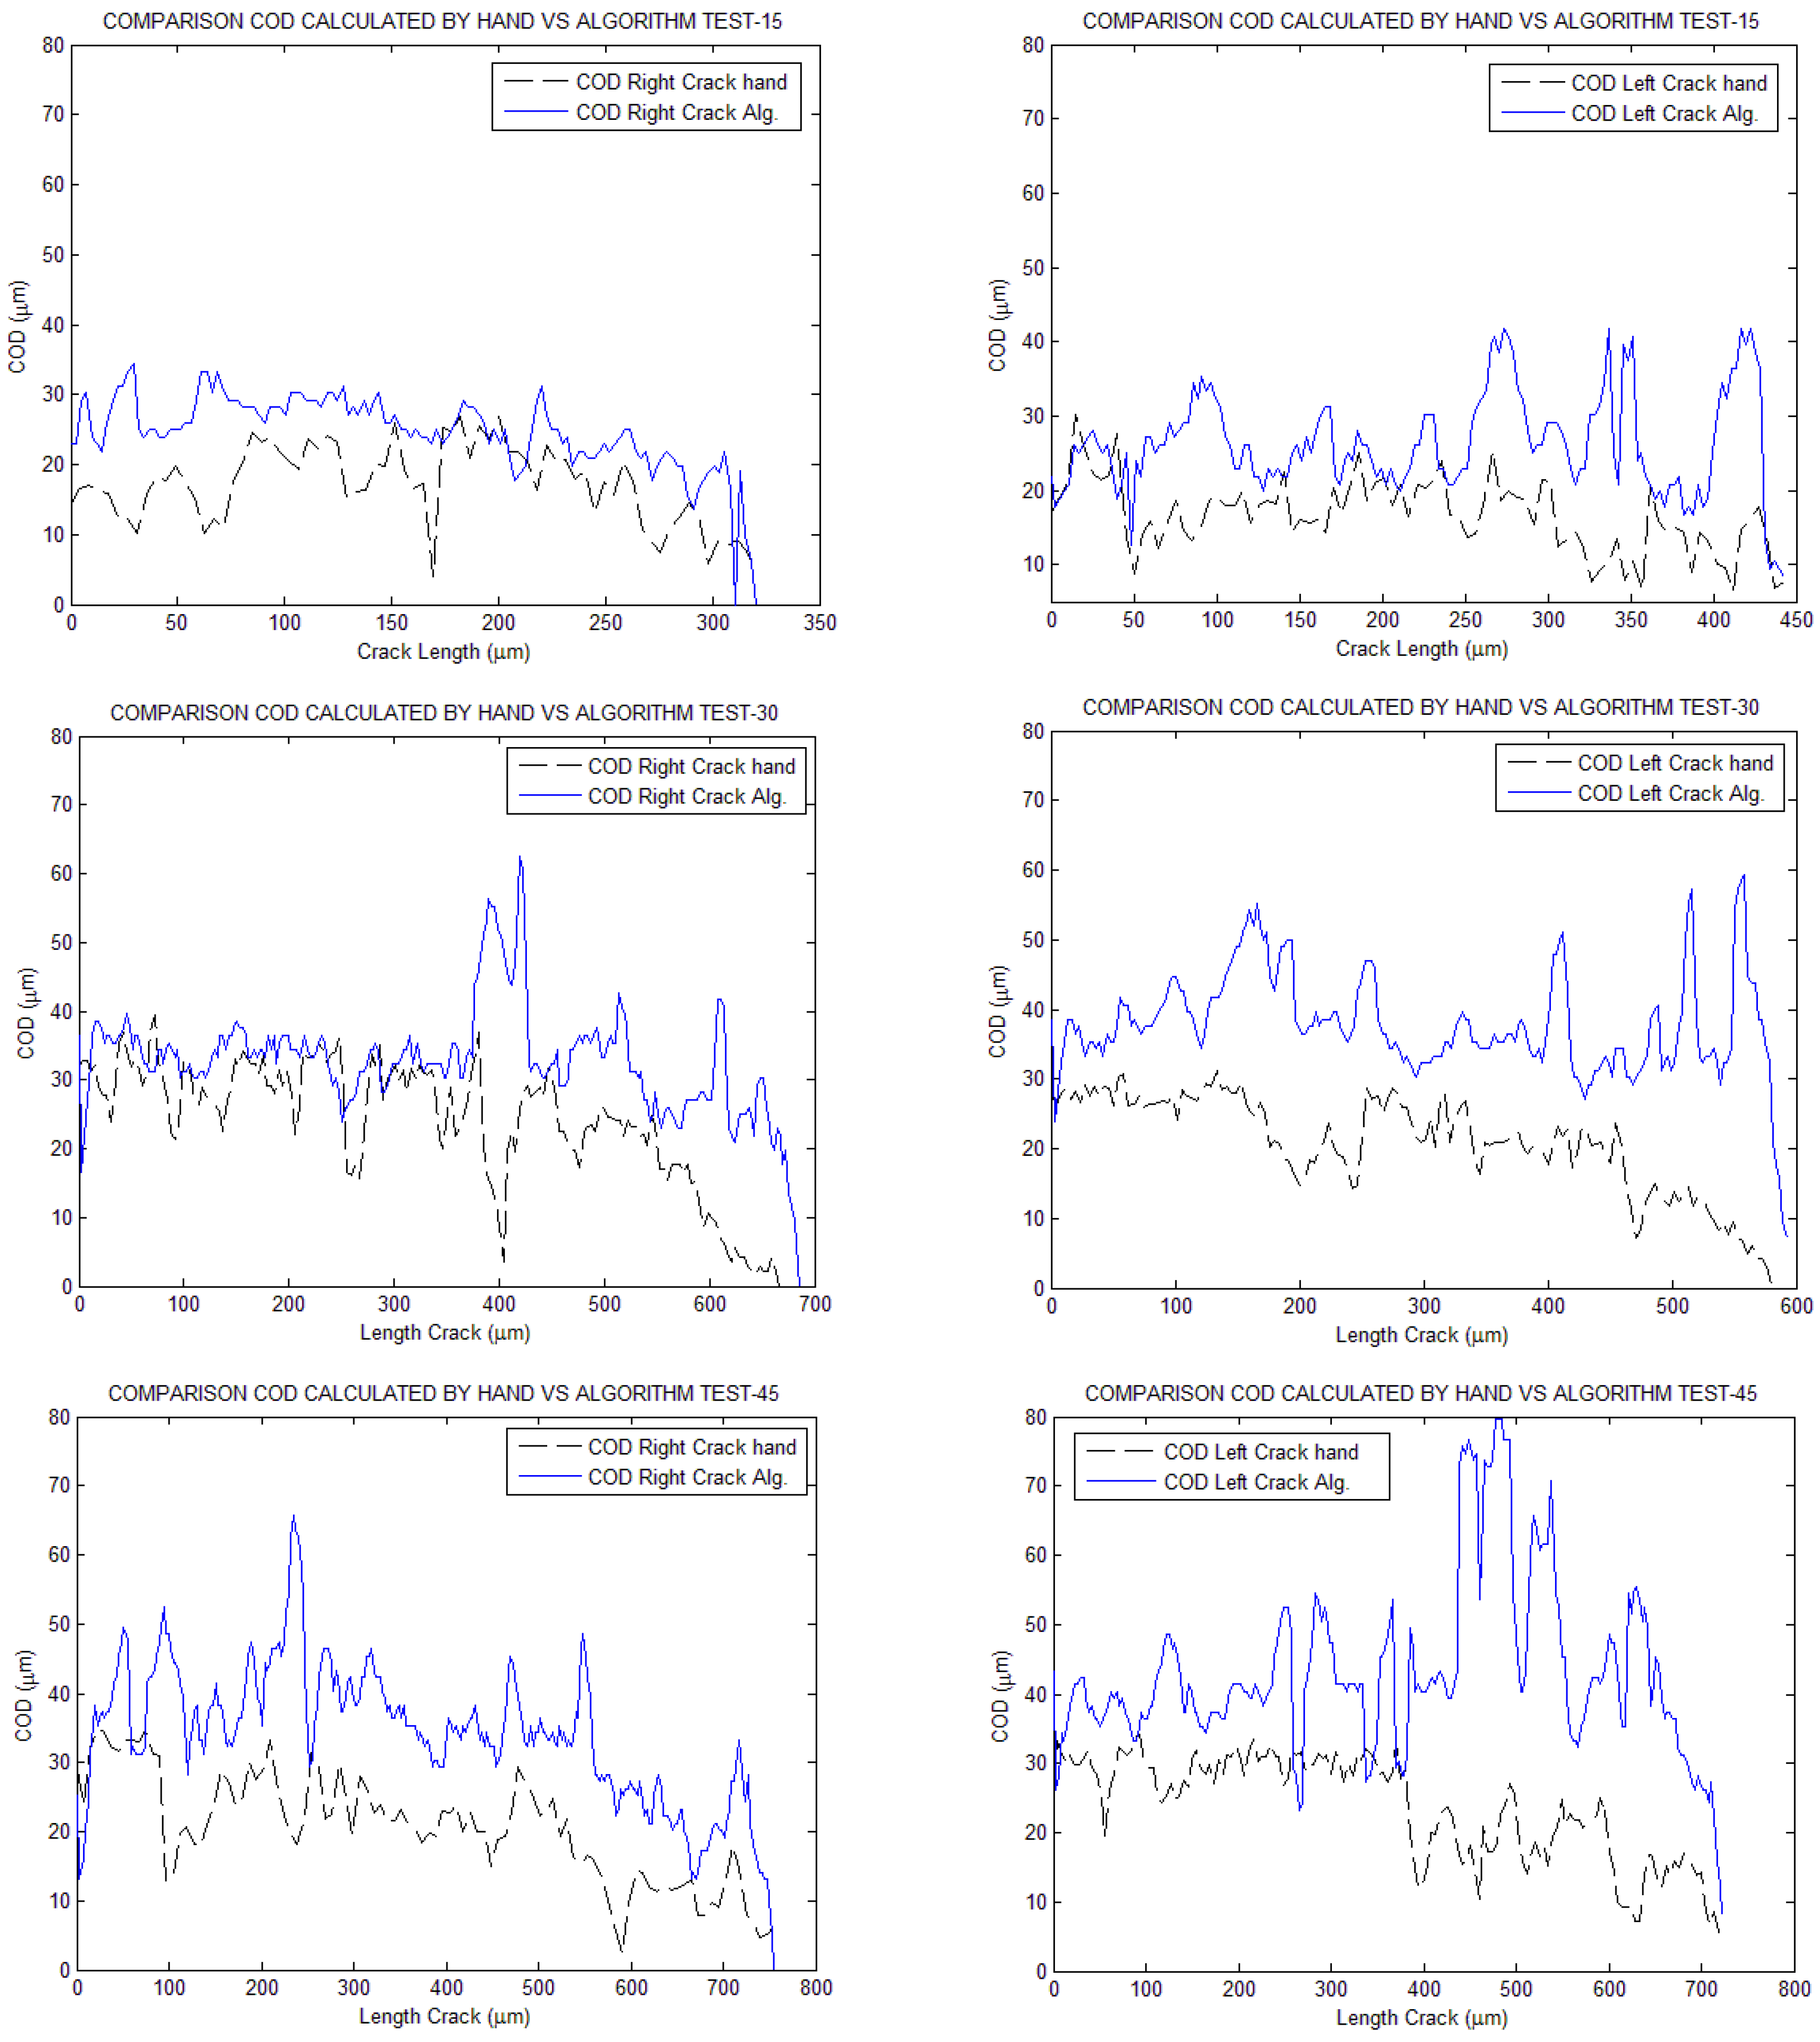
| Test-0° | 425.5912 | 453.4994 | 6.153973167 |
| Test-15° | 408.8691 | 404.2203 | 1.150067136 |
| Test-30° | 795.8696 | 812.8901 | 2.093828079 |
| Test-45° | 594.5870 | 869.9099 | 31.64958808 |
| Left crack | |||
| Length (µm) (Hand) | Length (µm) ALG. | RD (%) | |
| Test-0° | 438.2894 | 453.38 | 3.443064456 |
| Test-15° | 565.7139 | 492.2306 | 12.98948066 |
| Test-30° | 559.5837 | 612.7134 | 9.494509636 |
| Test-45° | 599.7877 | 859.2285 | 43.25543855 |
4. Conclusions
- It calculates the crack’s length along its path, or neutral line, instead of calculating it as a linear distance from the origin to the tip, as in traditional methods. This provides a better approximation of its actual length. It also calculates the linear distance as an interesting data point.
- It calculates both the total slope of the crack, from origin to tip, and the point-to-point slope along the centreline. This allows for a better approximation of COD at each point along the crack by applying it perpendicularly.
- It allows for separate analysis of cracks, treating them as different images. This enables the application of different preprocessing and binarization treatments to each one for accurate analysis. This is primarily due to differences in illumination in different parts of the image.
Author Contributions
Funding
Institutional Review Board Statement
Informed Consent Statement
Data Availability Statement
Conflicts of Interest
References
- Lyngbye, J.; Brincker, R. Aalborg Universitet Crack Detection by Digital Image Processing; Department of Building Technology and Structural Engineering, Aalborg University: Aalborg, Denmark, 1990. [Google Scholar]
- Savary, G.; Cans, M.; Luiz Bastian, F. Characterization of optical, electronic and topographic images in fatigue research. Image Vis. Comput. 1995, 13, 609–622. [Google Scholar] [CrossRef]
- Lauschmann, H.; Nedbal, I. Applications of Image Analysis in Fractography of Fatigue Failures. Mater. Sci. 2013. [Google Scholar]
- Krause, M.; Hausherr, J.M.; Krenkel, W. (Micro)-Crack detection using local Radon transform. Mater. Sci. Eng. A 2010, 527, 7126–7131. [Google Scholar] [CrossRef]
- Rannou, J.; Limodin, N.; Réthoré, J.; Gravouil, A.; Ludwig, W.; Baïetto-Dubourg, M.C.; Buffiere, J.-Y.; Combescure, A.; Hild, F.; Roux, S. Three dimensional experimental and numerical multiscale analysis of a fatigue crack. Comput. Methods Appl. Mech. Eng. 2010, 199, 1307–1325. [Google Scholar] [CrossRef]
- John, M.; Prakash, R.V. Quantification of Fatigue Damage in Carbon Fiber Composite Laminates through Image Processing. Materials Today: Proceedings. Volume 5. 2018. Available online: www.sciencedirect.comwww.materialstoday.com/proceedings2214-7853 (accessed on).
- Zhu, Z.; German, S.; Brilakis, I. Visual retrieval of concrete crack properties for automated post-earthquake structural safety evaluation. Autom. Constr. 2011, 20, 874–883. [Google Scholar] [CrossRef]
- Lee, B.Y.; Kim, Y.Y.; Yi, S.T.; Kim, J.K. Automated image processing technique for detecting and analysing concrete surface cracks. Struct. Infrastruct. Eng. 2013, 9, 567–577. [Google Scholar] [CrossRef]
- Arena, A.; Delle Piane, C.; Sarout, J. A new computational approach to cracks quantification from 2D image analysis: Application to micro-cracks description in rocks. Comput. Geosci. 2014, 66, 106–120. [Google Scholar] [CrossRef]
- Bazaron, S.A.; Damdinova, T.T.; Bochektueva, E.B. Determination of the geometric characteristics of fatigue cracks by digital image processing method. In IOP Conference Series: Materials Science and Engineering; IOP Publishing Ltd.: Bristol, UK, 2019. [Google Scholar]
- Gonabadi, H.; Oila, A.; Yadav, A.; Bull, S. Fatigue damage analysis of GFRP composites using digital image correlation. J. Ocean. Eng. Mar. Energy. 2021, 7, 25–40. [Google Scholar] [CrossRef]
- Lin, Z.; Shang, H.; Gao, H.; Huang, X. In Situ Measurement of the Strain Field at the Fatigue Crack Tip Based on Sub-Image Stitching and Matching DIC. Materials 2022, 15, 5150. [Google Scholar] [CrossRef] [PubMed]
- Strohmann, T.; Starostin-Penner, D.; Breitbarth, E.; Requena, G. Automatic detection of fatigue crack paths using digital image correlation and convolutional neural networks. Fatigue Fract. Eng. Mater. Struct. 2021, 44, 1336–1348. [Google Scholar] [CrossRef]
- Wang, S.Y.; Guo, T. Transfer Learning-Based Algorithms for the Detection of Fatigue Crack Initiation Sites: A Comparative Study. Front. Mater. 2021, 8, 756798. [Google Scholar] [CrossRef]
- Li, C.; Wen, Y.; Shi, Q.; Yang, F.; Ma, H.; Tian, X. A Pavement Crack Detection Method Based on Multiscale Attention and HFS. Comput. Intell. Neurosci. 2022, 2022, 1822585. [Google Scholar] [CrossRef] [PubMed]
- Li, H.; Song, D.; Liu, Y.; Li, B. Automatic Pavement Crack Detection by Multi-Scale Image Fusion. IEEE Trans. Intell. Transp. Syst. 2019, 20, 2025–2036. [Google Scholar] [CrossRef]
- Li, Q.; Zou, Q.; Zhang, D.; Mao, Q. FoSA: F* Seed-growing Approach for crack-line detection from pavement images. Image Vis. Comput. 2011, 29, 861–872. [Google Scholar] [CrossRef]
- Zou, Q.; Cao, Y.; Li, Q.; Mao, Q.; Wang, S. CrackTree: Automatic crack detection from pavement images. Pattern Recognit. Lett. 2012, 33, 227–238. [Google Scholar] [CrossRef]
- Matarneh, S.; Elghaish, F.; Al-Ghraibah, A.; Abdellatef, E.; Edwards, D.J. An automatic image processing based on Hough transform algorithm for pavement crack detection and classification. Smart Sustain. Built Environ. 2023. ahead-of-print. [Google Scholar] [CrossRef]
- Maruschak, P.; Vorobel, R.; Student, O.; Ivasenko, I.; Krechkovska, H.; Berehulyak, O.; Mandziy, T.; Svirska, L.; Prentkovskis, O. Estimation of Fatigue Crack Growth Rate in Heat-Resistant Steel by Processing of Digital Images of Fracture Surfaces. Metals 2021, 11, 1776. [Google Scholar] [CrossRef]
- Linda, C.H.; Jiji, G.W. Crack detection in X-ray images using fuzzy index measure. Appl. Soft Comput. 2011, 11, 3571–3579. [Google Scholar] [CrossRef]
- Nashat, S.; Abdullah, A.; Abdullah, M.Z. Machine vision for crack inspection of biscuits featuring pyramid detection scheme. J. Food Eng. 2014, 120, 233–247. [Google Scholar] [CrossRef]
- Newman, J.C.; James, M.A.; Zerbst, U. A review of the CTOA/CTOD fracture criterion. Eng. Fract. Mech. 2003, 70, 371–385. Available online: www.elsevier.com/locate/engfracmech (accessed on). [CrossRef]
Disclaimer/Publisher’s Note: The statements, opinions and data contained in all publications are solely those of the individual author(s) and contributor(s) and not of MDPI and/or the editor(s). MDPI and/or the editor(s) disclaim responsibility for any injury to people or property resulting from any ideas, methods, instructions or products referred to in the content. |
© 2023 by the authors. Licensee MDPI, Basel, Switzerland. This article is an open access article distributed under the terms and conditions of the Creative Commons Attribution (CC BY) license (http://creativecommons.org/licenses/by/4.0/).


