1. Introduction
Calcium phosphates (CaP) are the main inorganic component of bone and dental tissue [
1]. Materials based on CaPs – powders, ceramics, cements, coatings, and composites - are widely used for various applications, especially in medicine for replacement and restoration of damaged bone tissues. The most widespread representative of CaPs is hydroxyapatite (HA, Ca
10(PO
4)
6(OH)
2,
Figure 1), which is present in bone tissue in the form of nanocrystals. HA is known to be biocompatible, non-toxic, non-disinfectant, and the most important mineral that constitutes bones and teeth [
2].
It is known that synthesis of calcium phosphates in the presence of polymers (collagen, gelatin, starch, chitosan, etc.) leads to the formation of CaP nanocrystals with controlled size, morphology, and improved mechanical properties [
3]. Currently, 3D printing technologies are rapidly developing in medicine, in particular, printing of bone implants [
4]. The standard technology for creating such objects is 3D printing with a composite of a biodegradable polymer with a calcium-containing filler using layer-by-layer deposition of the material [
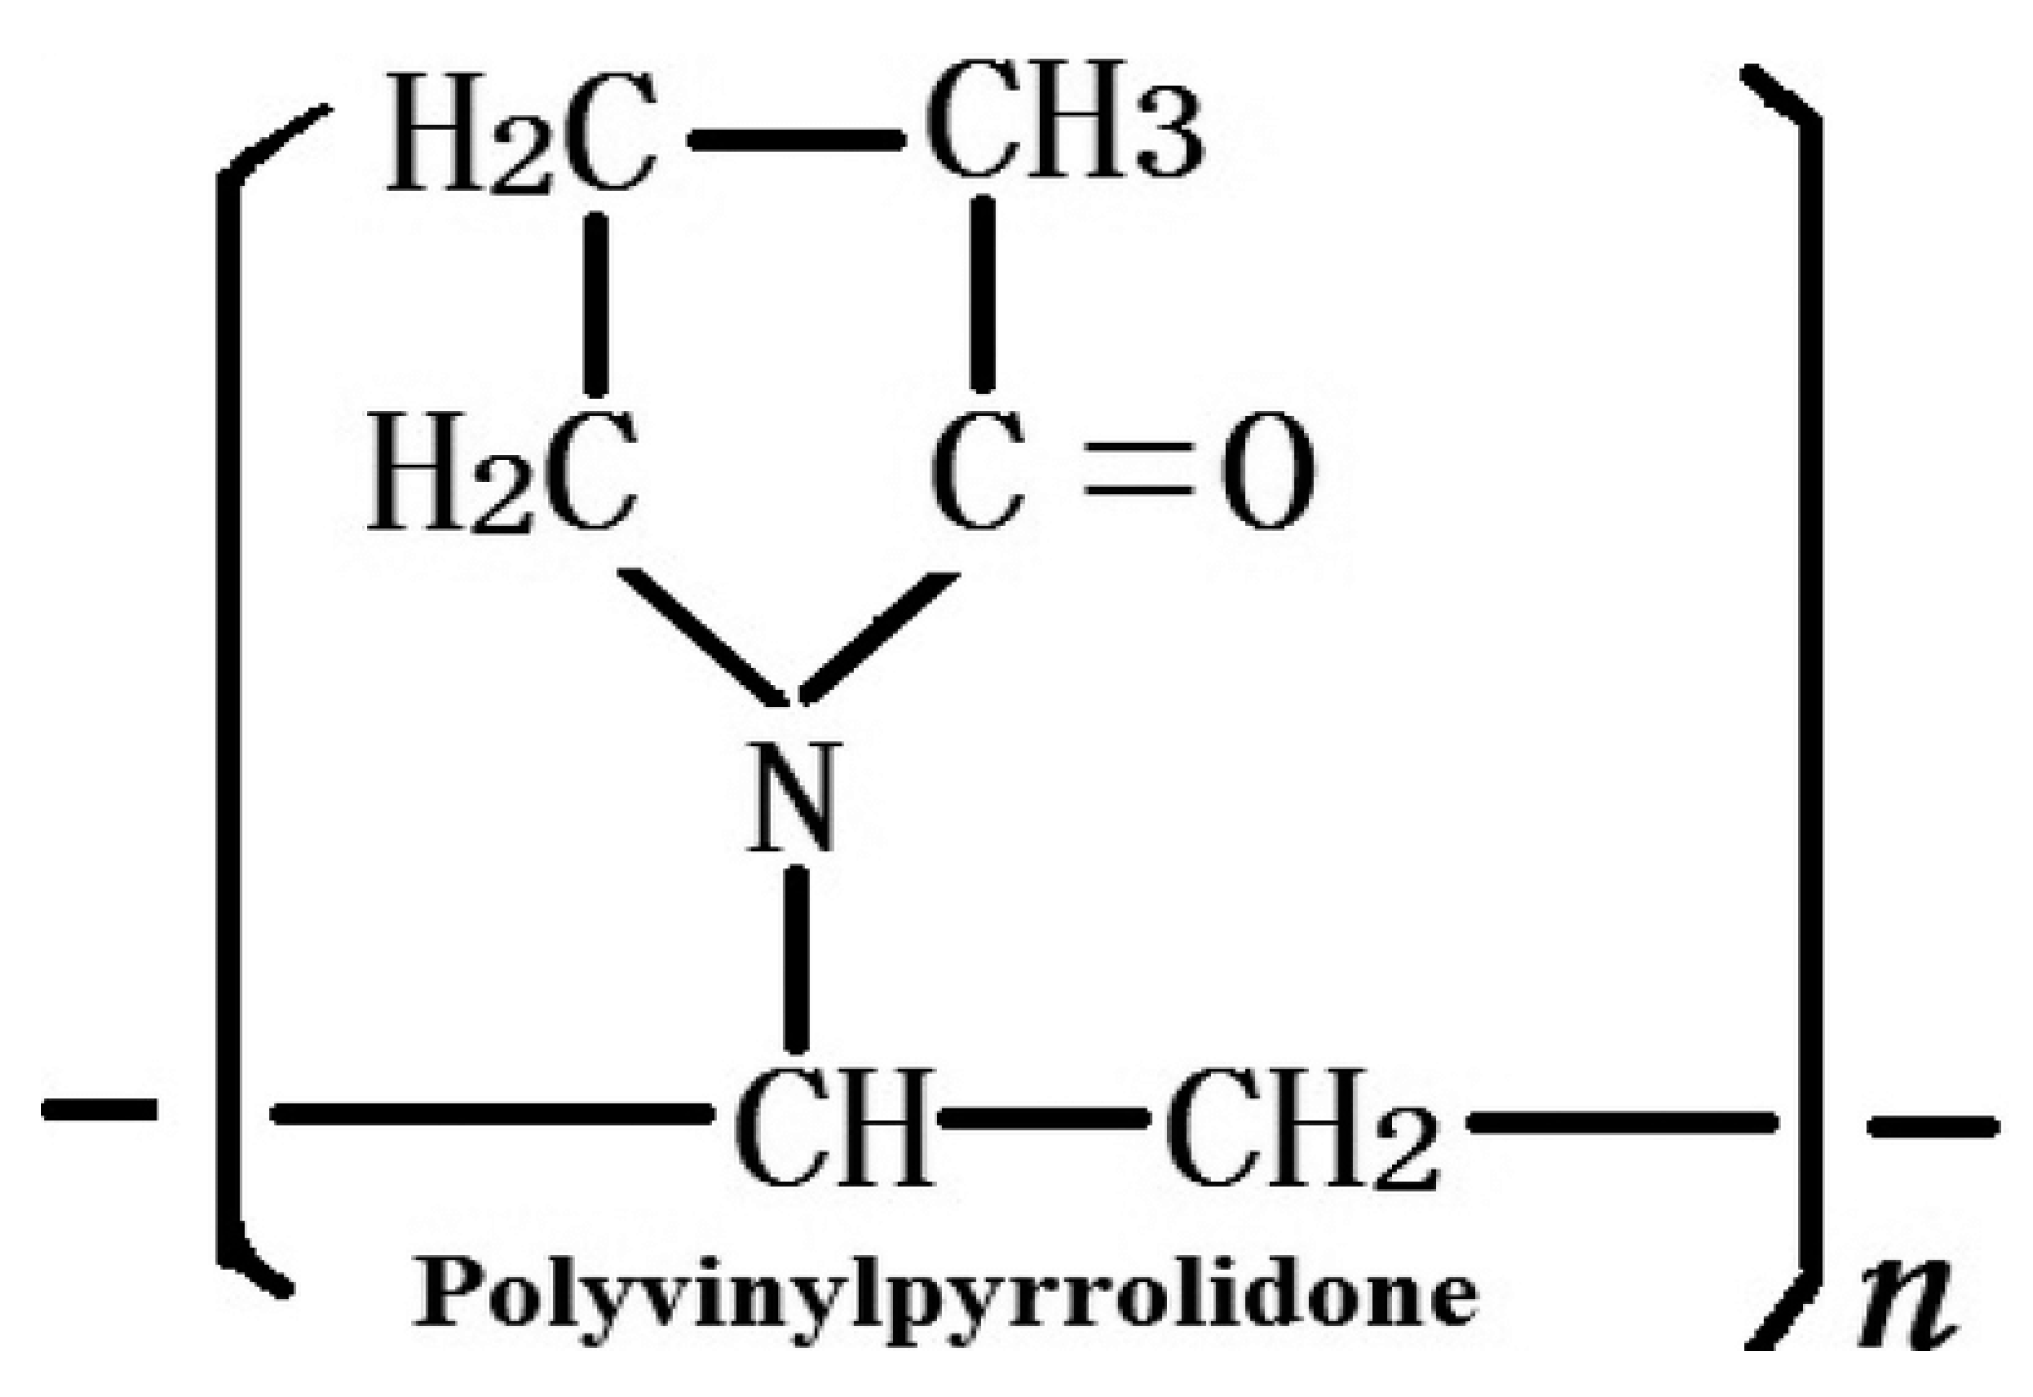
5]. Polyvinylpyrrolidone (PVP,
Figure 2) is widely employed as a synthetic polymer for various biomedical purposes in material engineering due to its diverse properties including solubility in water and in a broad range of liquid media [
6].
Morejón et al. [
7] studied polymer particles with particle size distribution and molecular weight that allows the formulation of bone cement according to the international standards. Needle-shaped crystals of HA in aqueous solution of PVP were obtained by precipitation from solutions of calcium nitrate and orthophosphoric acid at 60 °C [
8,
9]. It was shown that the number of HA crystals formed on the polymer surface depends on the number of negative charges on this surface and the pH of the reaction medium [
10]. Therefore, polymer - CaPs nanocrystals composites can be obtained in situ, without mixing the components, similar to the process happening in the body during bone remodeling. In the ref. [
11], a similar composite was obtained by biomimetic deposition of HA on the PVP matrix. A colorimetric test to assess the metabolic activity of cells (MTT-test) showed that composites were biocompatible and can be used to fill bone defects. Guesmi Y. et al [
12] investigated the material obtained by grafting PVP onto the surface of HA microcrystals, suitable for bone tissue engineering. Based on the results of studying the bioactivity of the composites, it was concluded that the seeded cells had a higher viability compared to those that were cultivated on the HA crystals.
Obviously, the properties of polymer- CaP composites depend on the chemical interaction of the components. It is supposed that the inorganic particles interact with the organic component by inter- and intramolecular hydrogen bonds, and by ion-dipole forces formed, for example, between the calcium ions of CaPs and the functional groups of polymers [
13]. However, the interaction of PVP with microcrystals of the calcium phosphate group has not been sufficiently studied.
In the present work, the PVP-HA composites were investigated by electron paramagnetic resonance (EPR) and nuclear magnetic resonance (NMR) techniques. Both the analytical methods are non-invasive, widely applied in material science, polymer research and for the biomedical purposes, but very rare were exploited for the polymer-CaPs studies.
Pure HA is EPR silent, however, impurity ions and paramagnetic centers formed by X-ray irradiation, for example, are exploited as paramagnetic probes to study the local environment, structure of the material and changes in the local environment in the lattice [14-16]. The chemical complexity of polymer-CaPs composites makes hyperfine EPR and NMR to be engaged because different nuclei, such as
31P (I = 1/2), 1H (I = 1/2), 13C (I = 1/2),
14N (I = 1) can act as nuclear spectroscopic probes. Since HA is practically insoluble in liquid media, the magic angle spinning (MAS) NMR techniques are used to investigate materials containing hydroxyapatite with NMR [17-23]. The effect of PVP on the morphology and size of nanocomposites was studied by NMR in the ref. [
24,
25]. HoweverBut, to the best of our knowledge, no comprehensive analysis of the PVP-HA composites synthesized in situ bywith EPR and NMR techniques is present in literature.
2. Materials and Methods
2.1. Synthesis of Composite Materials Based on Polyvinylpyrrolidone with Hydroxyapatite
Solutions of Ca(NO
3)
2×4H
2O (chemical grade, PanReacAppliChem, Barcelona, Spain), (NH
4)
2HPO
4 (chemical grade, Chimmed, Moscow, Russia) and (PVP) Mw = 12 kDa (Boai NKY Pharmaceuticals Ltd., Tianjin, China) were used for the in situ synthesis of HA powders in the PVP solution. Precipitation of calcium phosphates was performed at room temperature (20–25 °C) at a pH of ~11.5, in accordance with the Equation (1). [
25]:
The in situ synthesis of the PVP with HA composite was carried out according to the procedure described in [
25]. Briefly, an aqueous PVP solution was prepared by dissolving 14.35 g of PVP in 200 mL of distilled water by stirring, in order to obtain 5.52 wt % concentration. After the formation of a homogeneous water-polymer mixture, 20 mL of 0.1 mol/L calcium nitrate solution was added to it. To regulate the reaction acidity, 20 mL of 25% NH
4OH aqueous solution was added. Then, by stirring using a stirrer at 500 rpm, 20 mL of 0.06 mol/L diammonium phosphate solution was added drop by drop.To remove the by-products of the HA formation reaction (1) (i.e. nitrate ions) from the composite, the composite was washed using dialysis.
Scanning electron microscopy (SEM) was performed using a Tescan VEGA3 scanning electron microscope. Samples were coated with a thin layer of aurum for SEM examinations. SEM images were acquired using secondary electron (SE) imaging and backscattered electron (BSE) imaging techniques.
2.2 EPR
The EPR measurements were performed in two microwave ranges: X-band (with the microwave frequency νMW = 9 GHz), and W-band (νMW = 94 GHz) by exploiting Bruker Elexsys E580/E680 spectrometer in conventional (cw) and pulsed modes. In the pulsed mode, the Hahn sequence was applied: π/2 – τ – π – τ – electron spin echo (ESE), where the duration of π/2 was equal to 64 ns and τ = 250 ns. Registration of the EPR spectra was performed by detecting of the ESE integral intensity depending on the magnetic field value B0. The choice of the W-band was justified by the need to achieve a higher spectroscopic resolution (that allows to identify distinct EPR signals with close g-factors) and high sensitivity (to register weak EPR signals). The spectra were recorded at room temperature (T = 297 K) as well as at lower temperatures (T = 200 K). Stable paramagnetic centers were formed under X-ray irradiation of synthesized powders using the URS-55 source (G = 55 kV, I = 16 mA, W-anticathode) at room temperature for 30 min with an estimated dose of 5 kGy and by illuminating the samples in the EPR cavity by laser sources with different wavelengths of λ from 266 nm up to 355 nm.
Details of the EPR measurements including electronic relaxation times for HA were given in the ref.[
26]. Simulations of the EPR spectra were performed by means of theEasySpin package [
27]).
2.3 Nuclear magnetic resonance
For all the samples, the MAS-NMR spectra, the times of spin-lattice and spin-spin relaxation on phosphorus (31P) nuclei, hydrogen (1H) were measured. For measurements, an AVANCE400WB NMR spectrometer with a MAS 4BL CP BB DVT sensor was exploited. The resonant frequency on protons was about 400.27 MHz, and on 31P nuclei of 162.034 MHz. The duration of a π/2 pulse on protons was 2.5 µs (output power of 94 W), for 31P nuclei was 3.4 µs at a power of 50 W. The standard pulse programs onepulseq, hpdec, cp, inversion-recovery, and cpmg were used to obtain NMR spectra and relaxation on 1Н, 31Р and 13C. The spectrum width for all measurements was 100 kHz. Powder samples were densely packed in a 4 mm zirconium oxide rotor and spun up to a rotation frequency of 7 kHz. The measurements were carried out at a temperature of 295 K. The chemical phenomena of NMR signals were calibrated by measuring the signal of water (δ = 4.67 ppm) for protons and 85% phosphoric acid for phosphorus (δ = 0 ppm).
3. Results
3.1. SEM 3.2. EPR
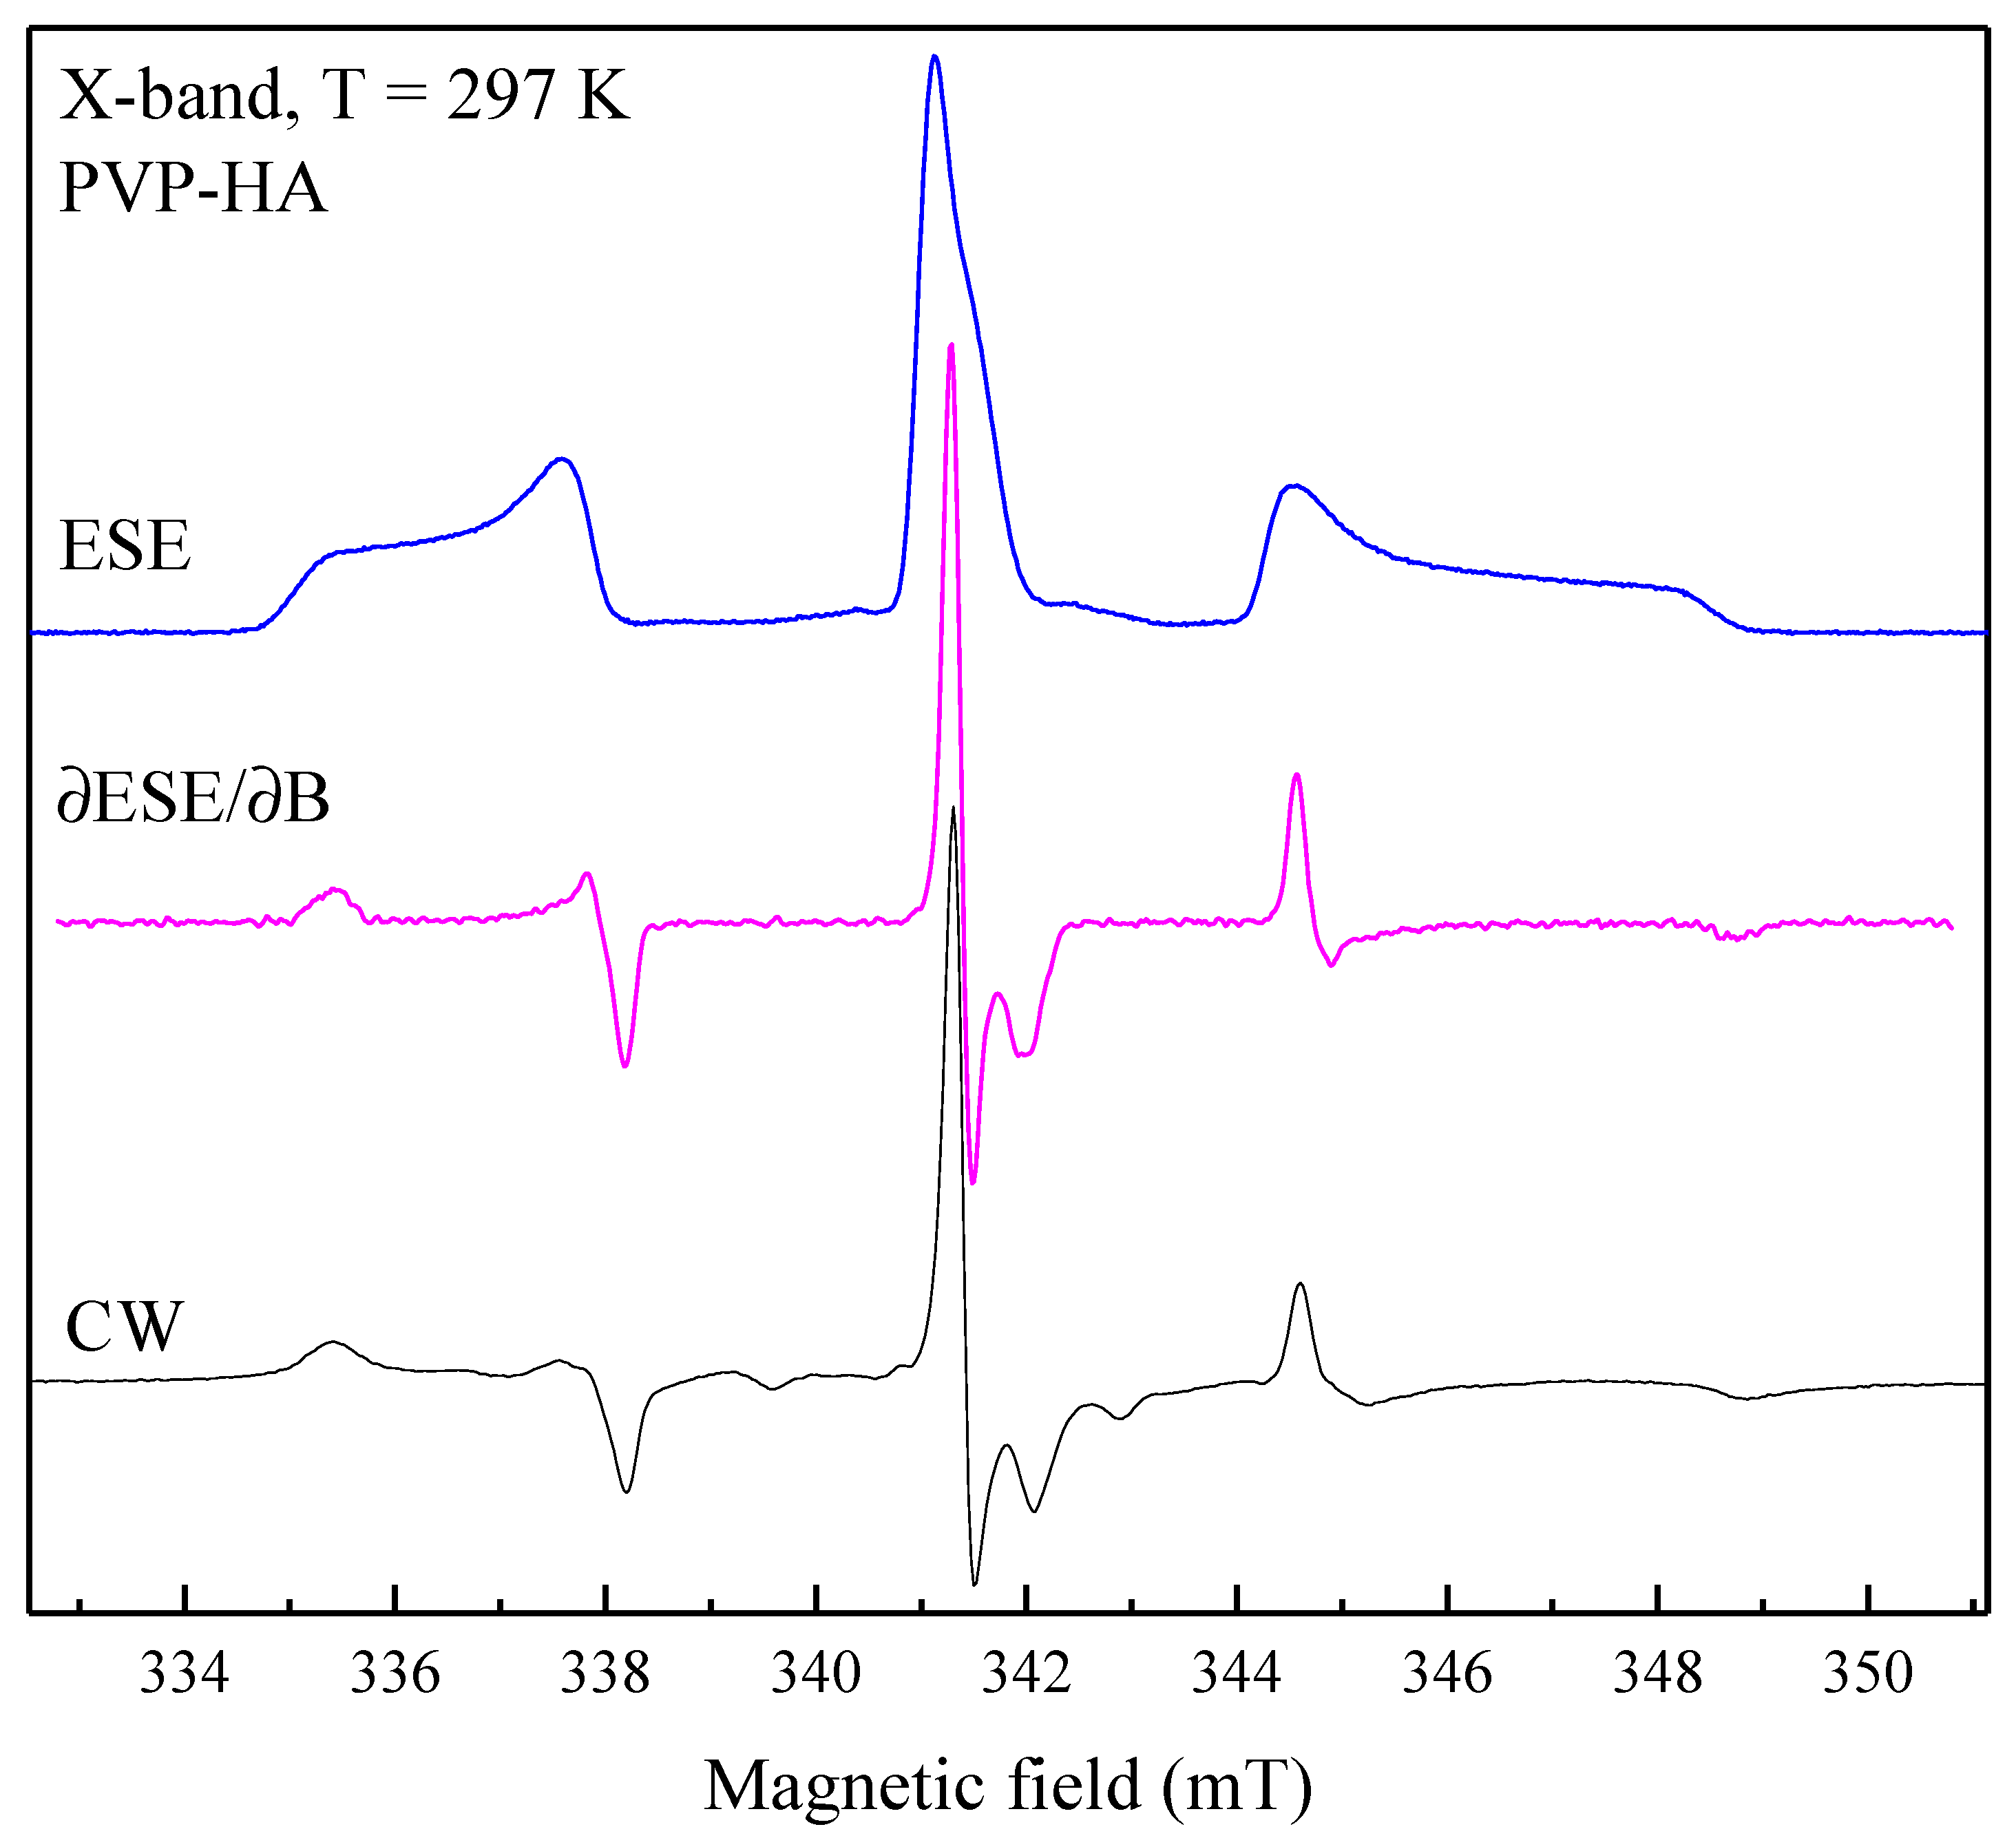
For HA, PVP, and PVP-HA the EPR signal was not observed due to the absence of paramagnetic centers in the structure of the materials. It additionally proveds the purity of the initial materials and their product. After X-ray irradiation of HA powders in the X-band, the EPR spectrum containing three lines was registered (
Figure 3). The spectroscopic parameters of the EPR spectrum allowed to refer the detected signal to the well-studied NO32- stable species in HA [
28,
29] (see
Table 1), due to the hyperfine interaction (A) with the
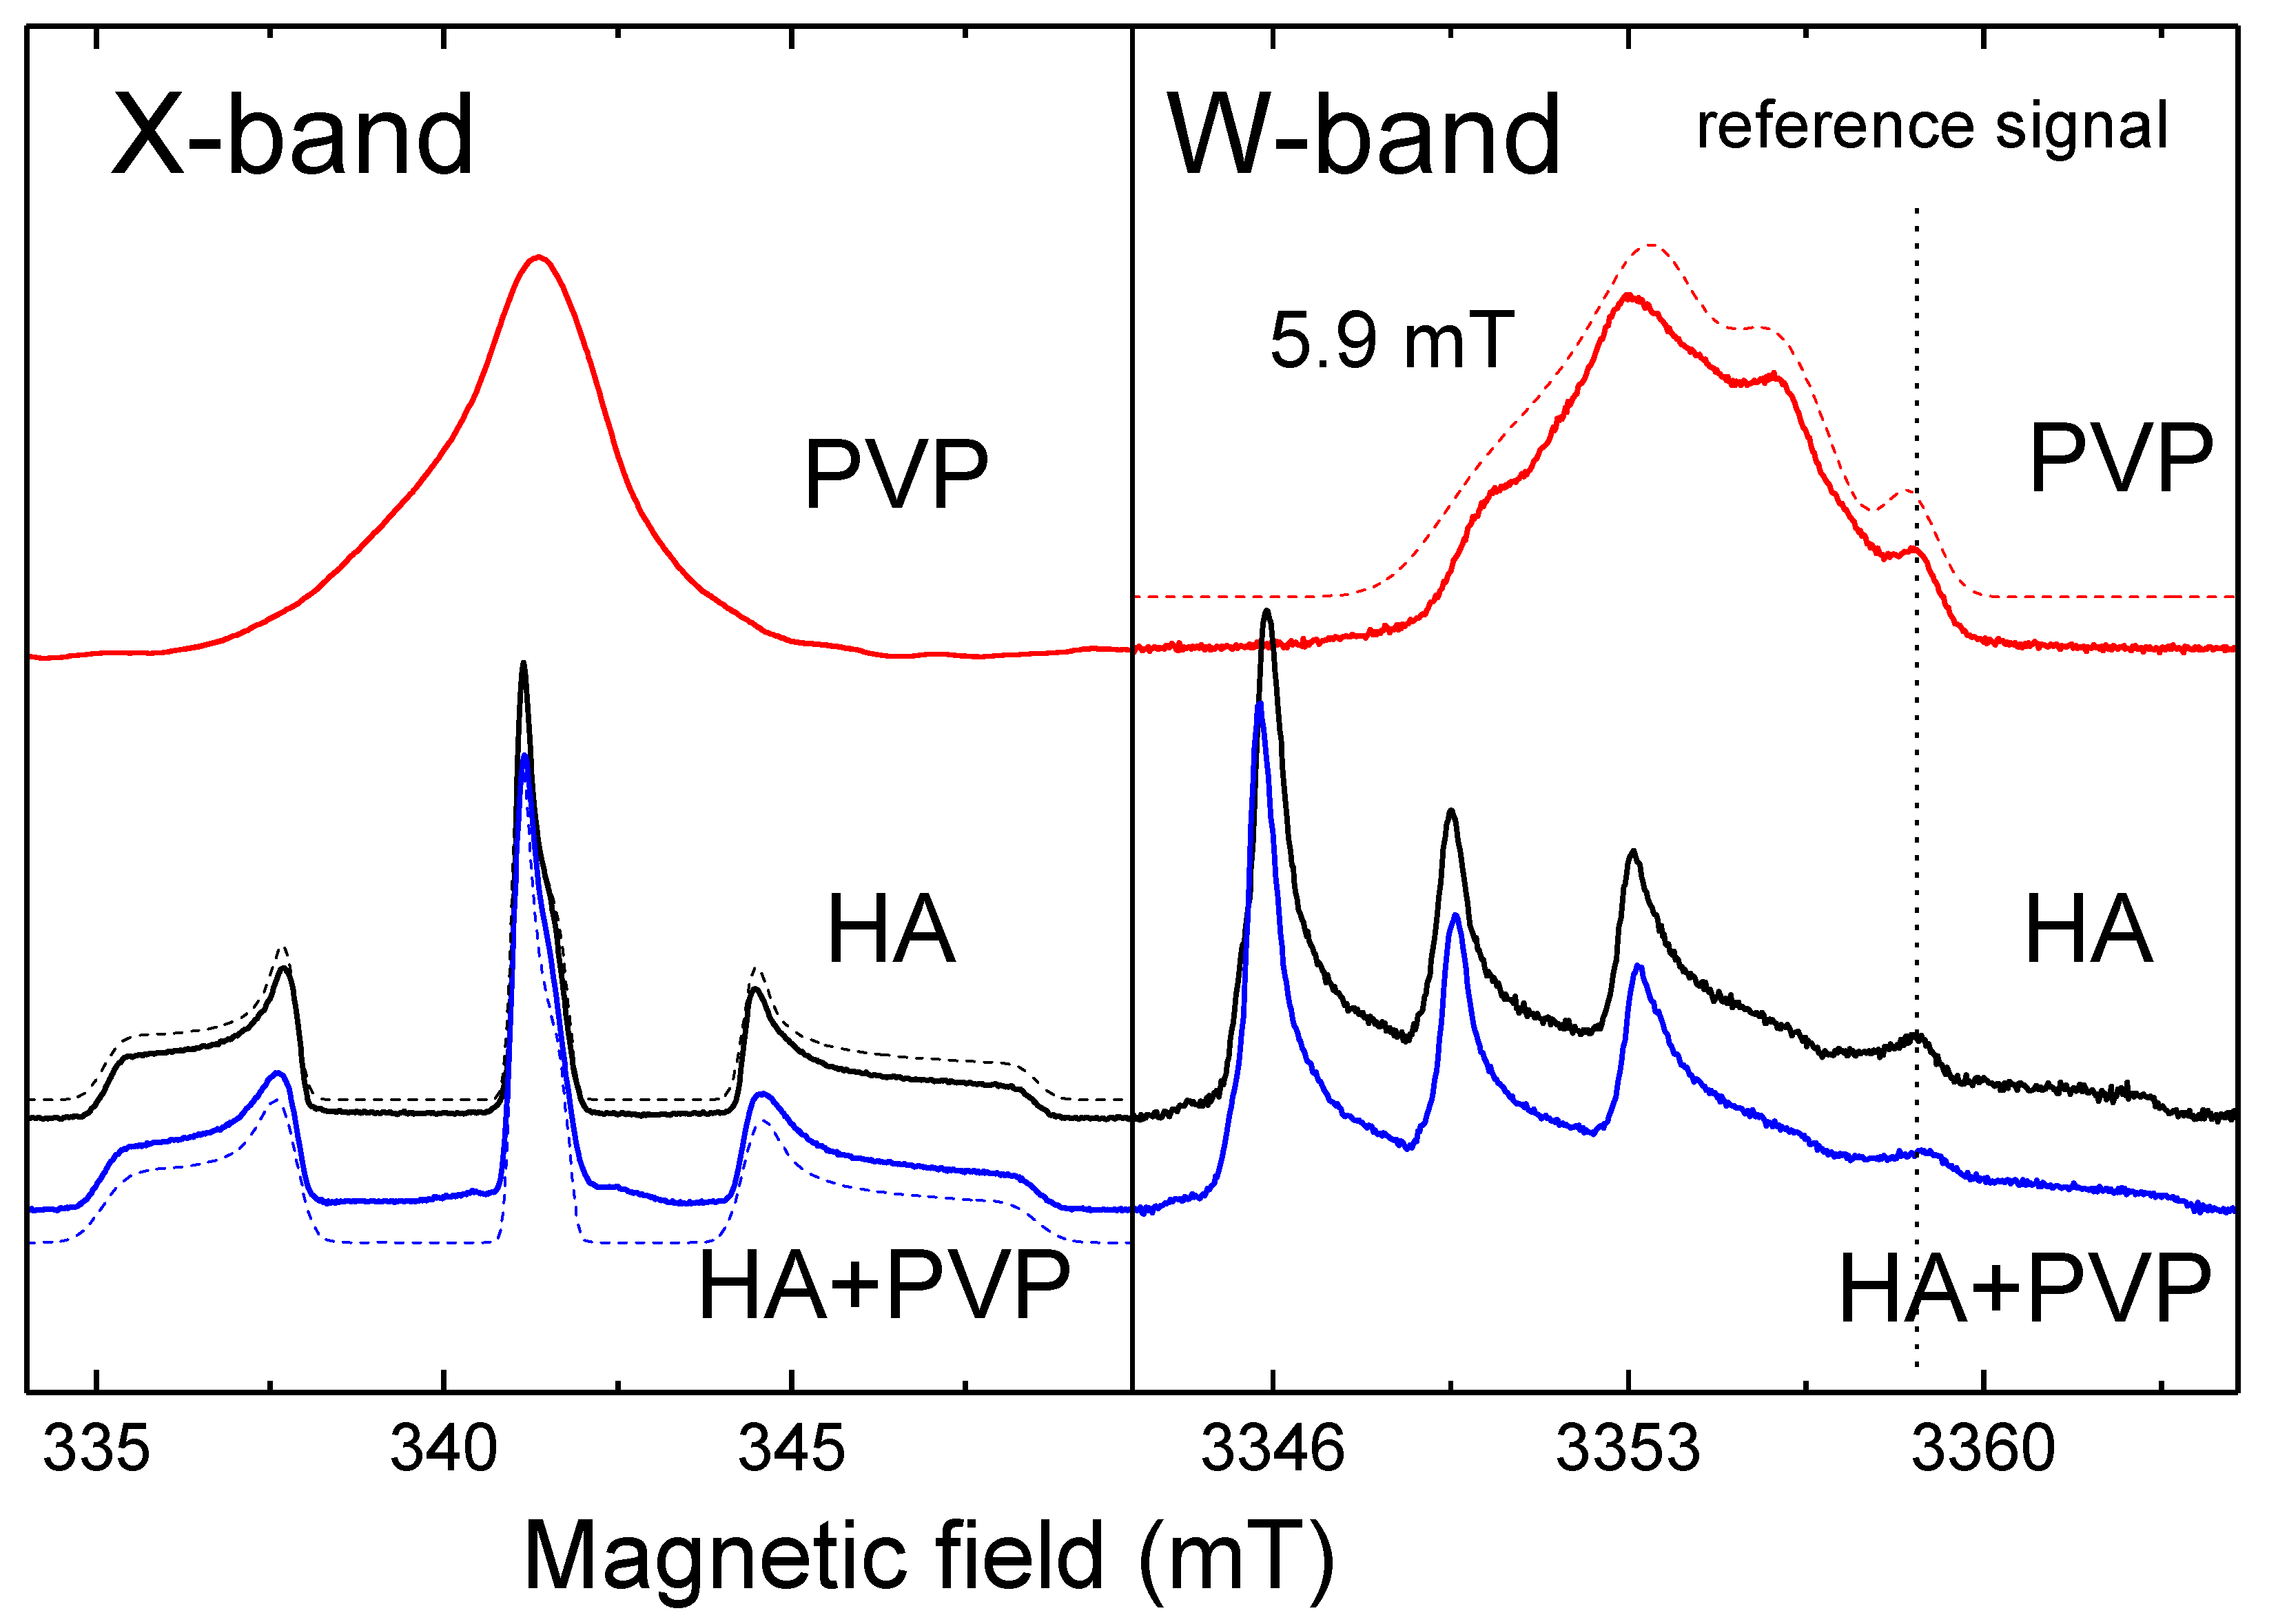
14N nuclei (I= 1). The PVP samples were also studied after the X-ray irradiation (
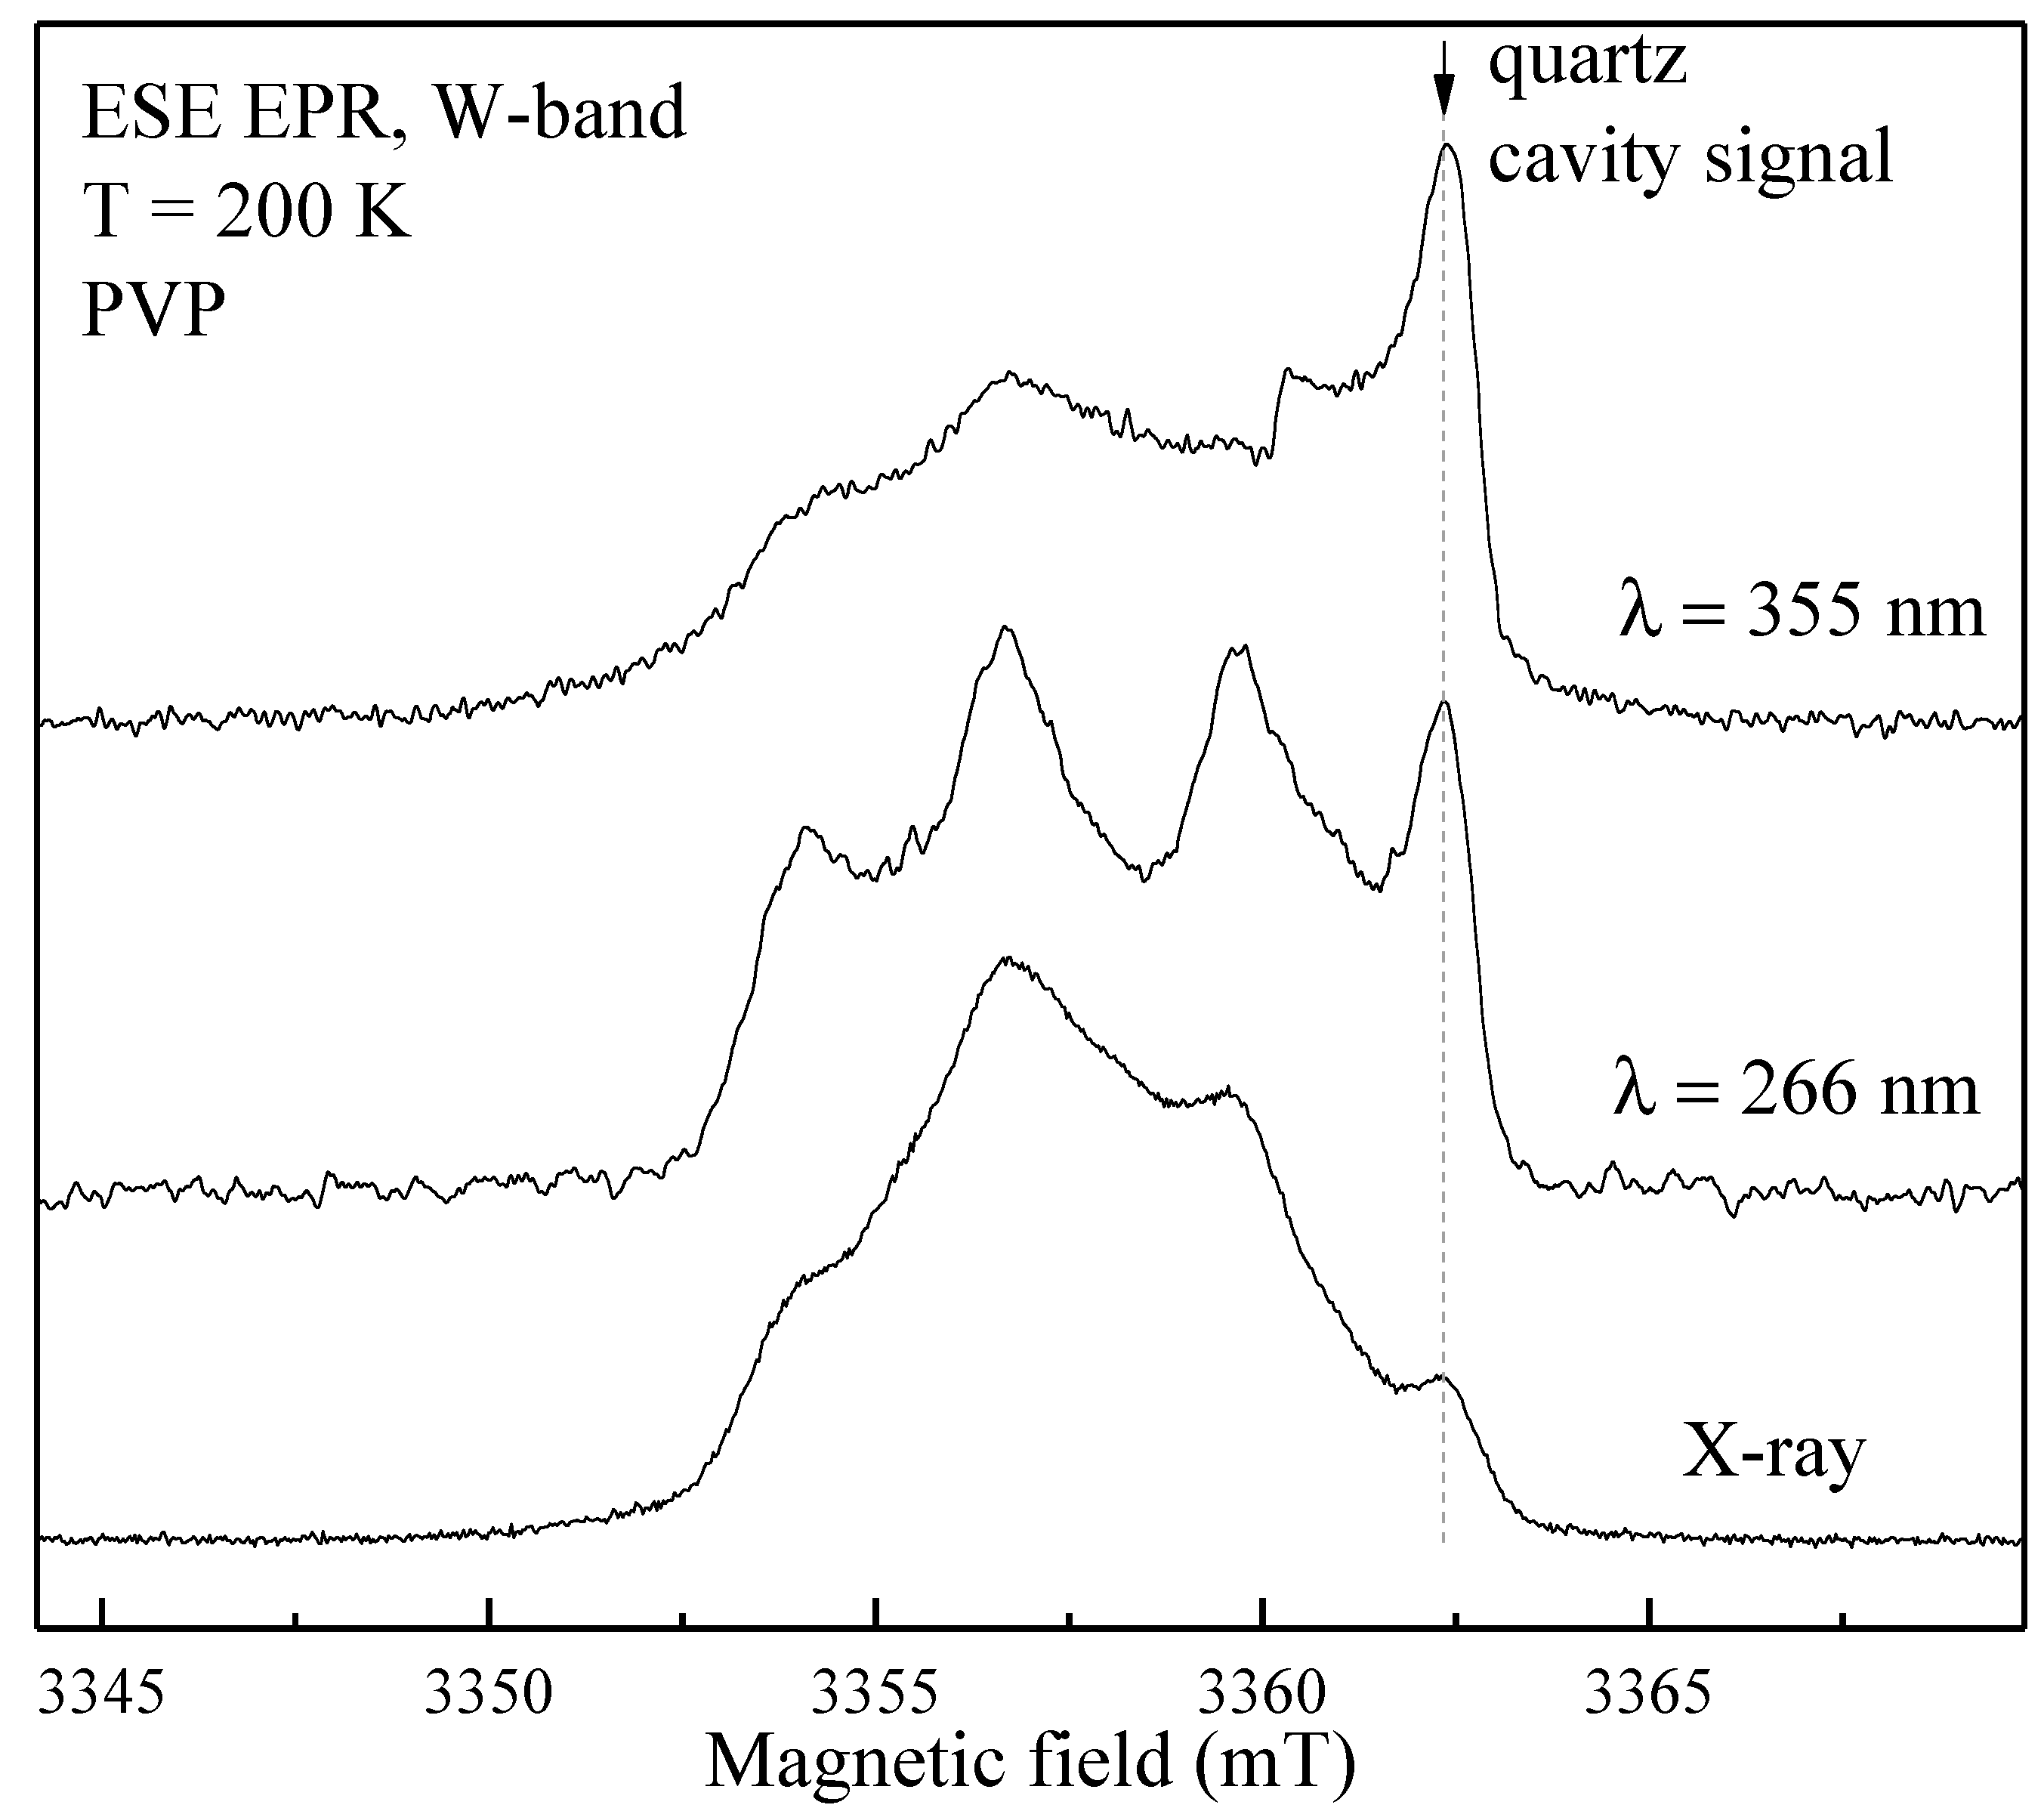
Figure 4, red lines) and photo-induced EPR at low temperatures (
Figure 5), since it is known that exposure to the visible light does not lead to the formation of stable radicals in HA [
30], but in the PVP polymer chain [
31]. In the W-band, due to the better spectral resolution, a three-line pattern of PVP was observed (
Figure 4). It showed the localization of an unpaired electron on the PVP nitrogen atom (
Figure 2) with a constant A
||=106 ± 10 MHz. In the X-band three-line pattern for PVP is not resolved.
As can be seen from
Figure 4 (blue lines), the EPR spectrum of the PVP-HA containeds only the spectrum of NO
32- radicals in HA, and the EPR spectrum component from the PVP wais not observed. It can be supposed that in a mixture with HA, the radiation-induced centers in PVP have a competitive electron trap channel, which is possible only in the presence of a chemical bond between the components. In the ref. [
32], we also showed that for the PVP-HA samples obtained ex
situ the values of A-components and distribution of A components for the electron-
14N interaction were growing with the increase in the PVP amount. Change of the crystal structure of HA in the reaction with PVP is unlikely. Therefore, so we can assume that during the formation of chemical bonds the PVP molecules create a positively charged layer around the HA particle, which increases the electron density in the near-surface layer of the HA particle.
Electronic spin-lattice relaxation measurements did not reveal the influence of PVP on the relaxation parameters of the radiation-induced NO
32- radicals in HA, as it is demonstrated in
Table 2 for the X-band experiments. It correlates with the tiny influence of PVP on the EPR spectra of HA, as described above.
3.3. NMR
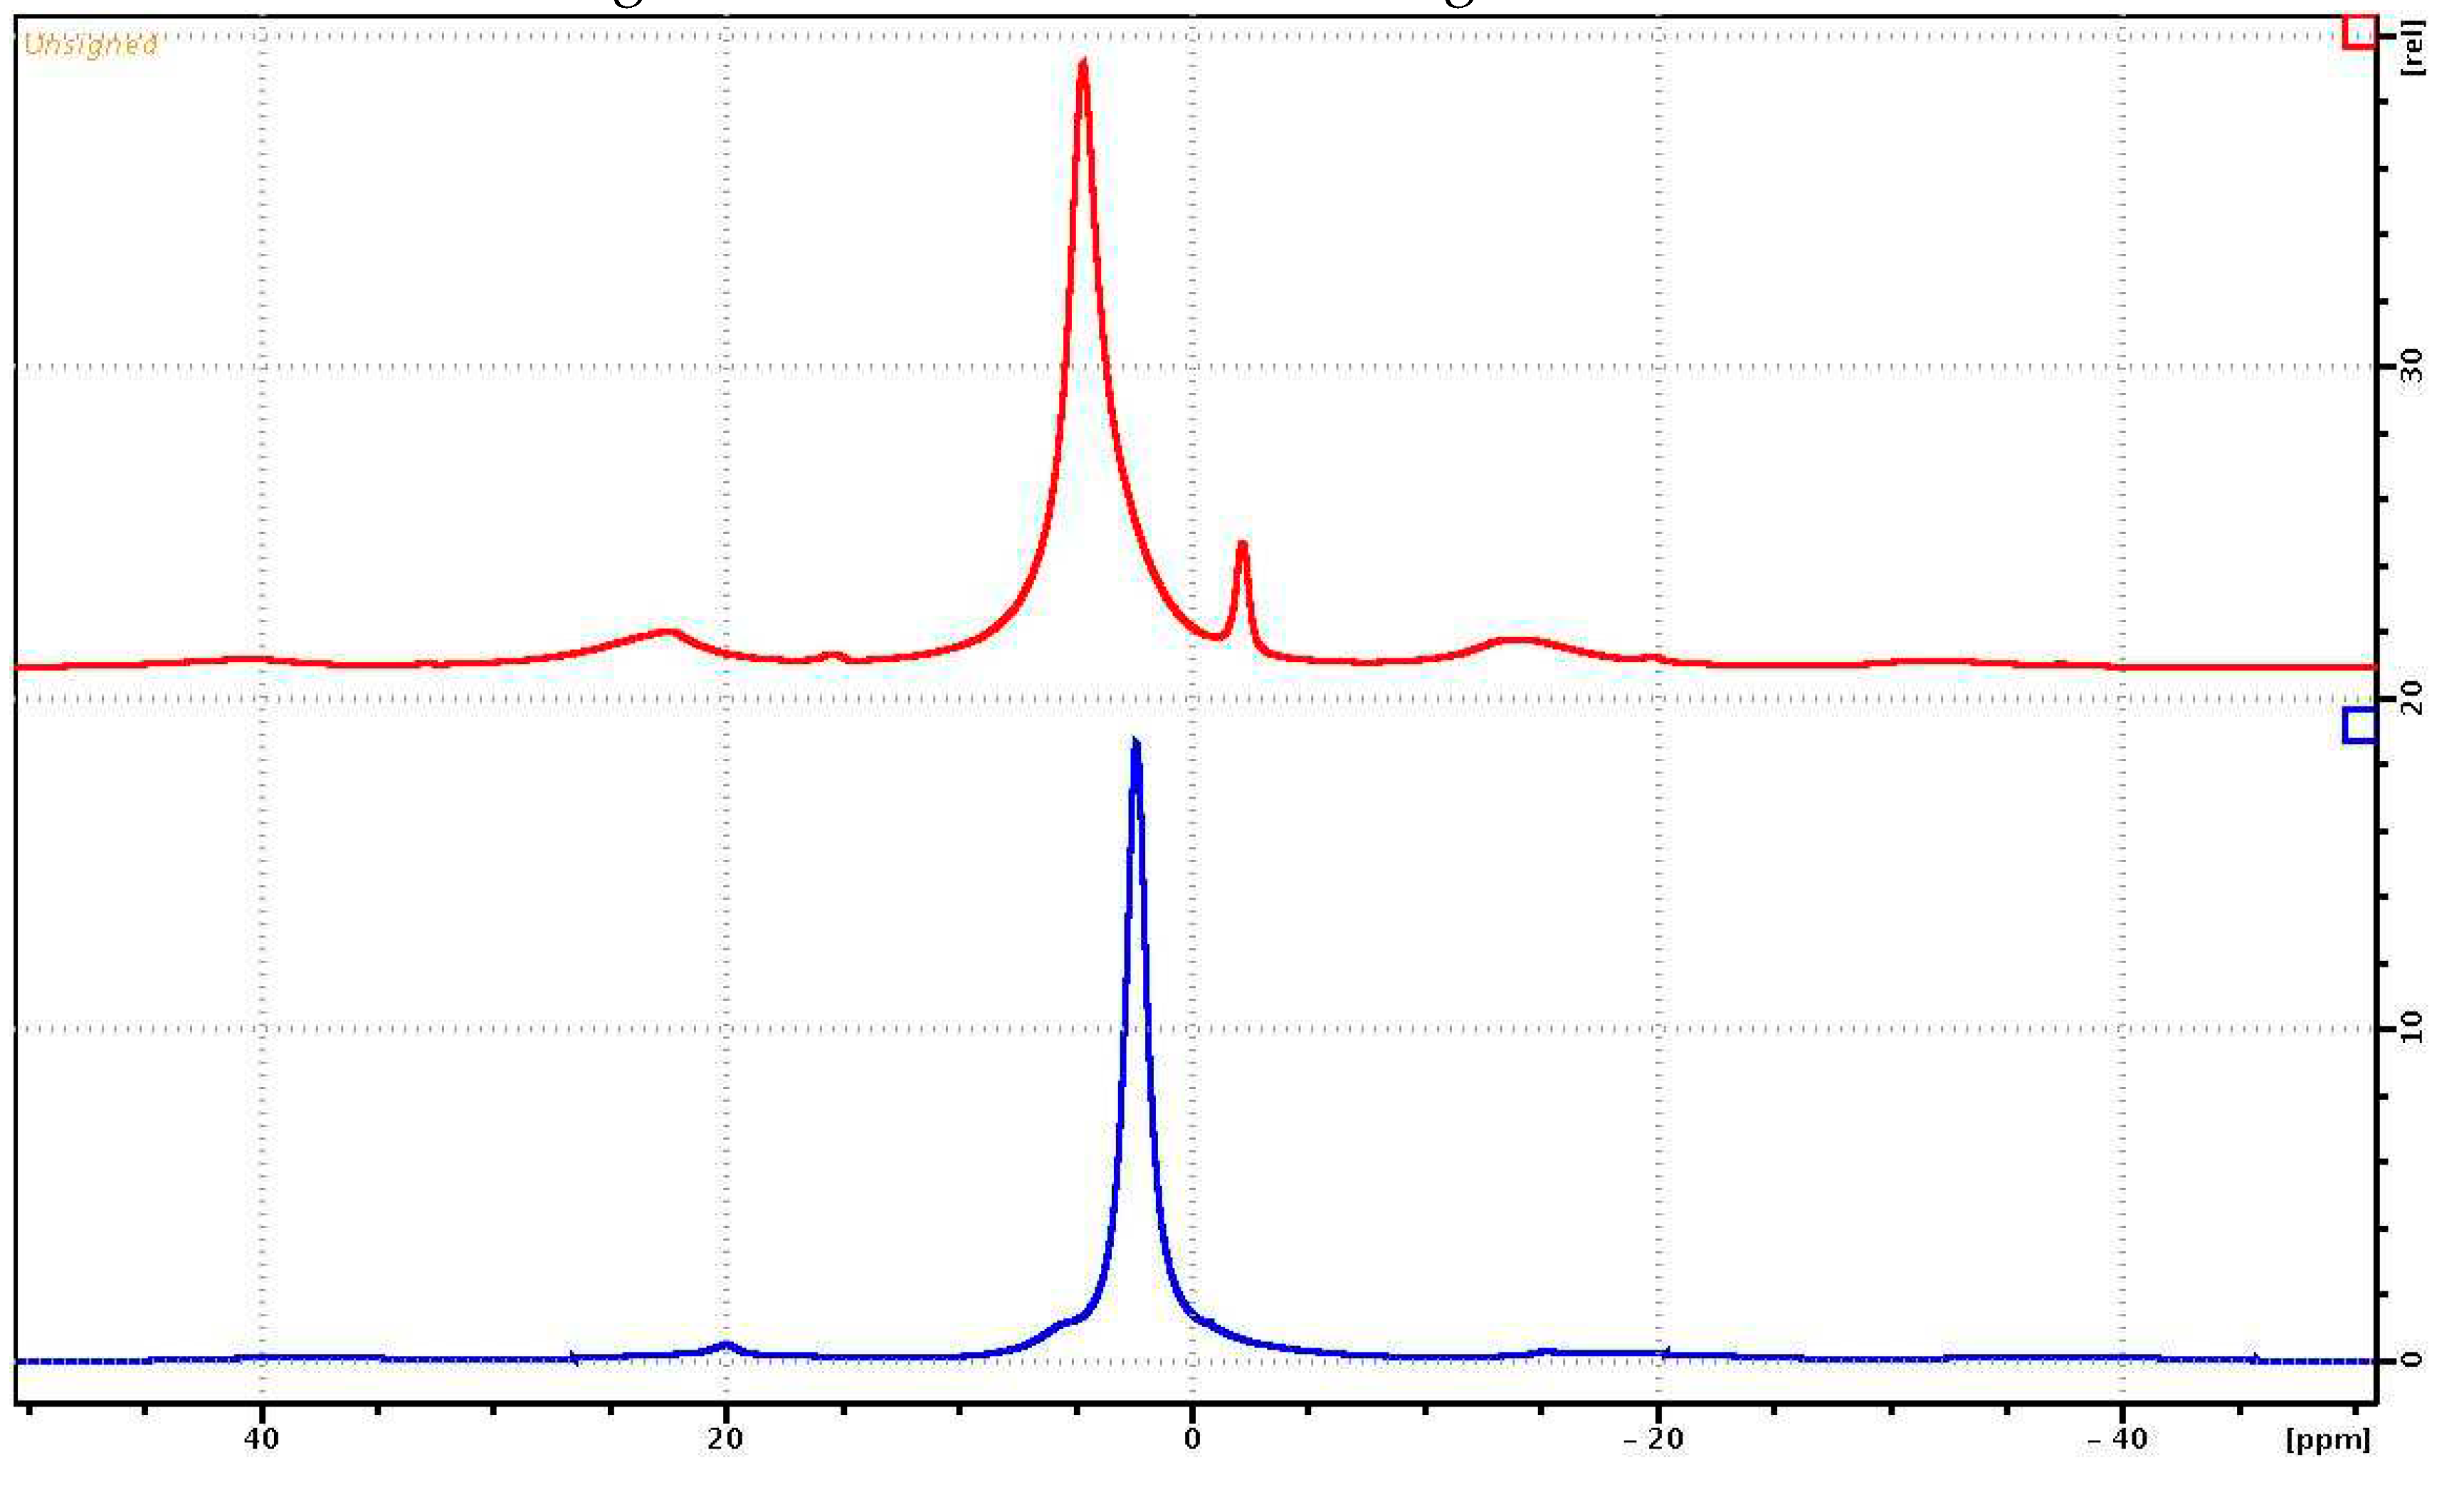
The
1H NMR spectra for PVP and PVP-HA are shown in
Figure 6. The
1H MAS-NMR spectrum of the PVP consists of one unresolved NMR signal at 2.4 ppm associated with the CH
2 groups of the pyridine ring (
Figure 2) and the polymer chain. The CH groups of the polymer chain contributed to the signal at about 5 ppm, while the CH
3 end groups make a small contribution in the region of 0.5-1.5 ppm. On the
1H NMR spectrum in
Figure 6, the contributions of these chemical groups appeared as small shoulders to the right and left of the main NMR signal.
The
1H NMR spectrum of a sample of a PVP-HA consists of two
1H NMR signals at 4.7 ppm and -2.15 ppm [
33,
34]. The integrated intensity of the NMR signal at 4.7 ppm is significantly greater compared to the intensity of the NMR signal at -2.15 ppm. The
1H NMR signal at 4.7 ppm for a PVP-HA is associated with «free» water adsorbed on the surface of HA, the 1H NMR signal at -2.15 ppm with hydroxyls present in the HA structure. The shape of the NMR signal at 4.7 ppm is asymmetric due to the superposition of the proton signals of water and polymer.
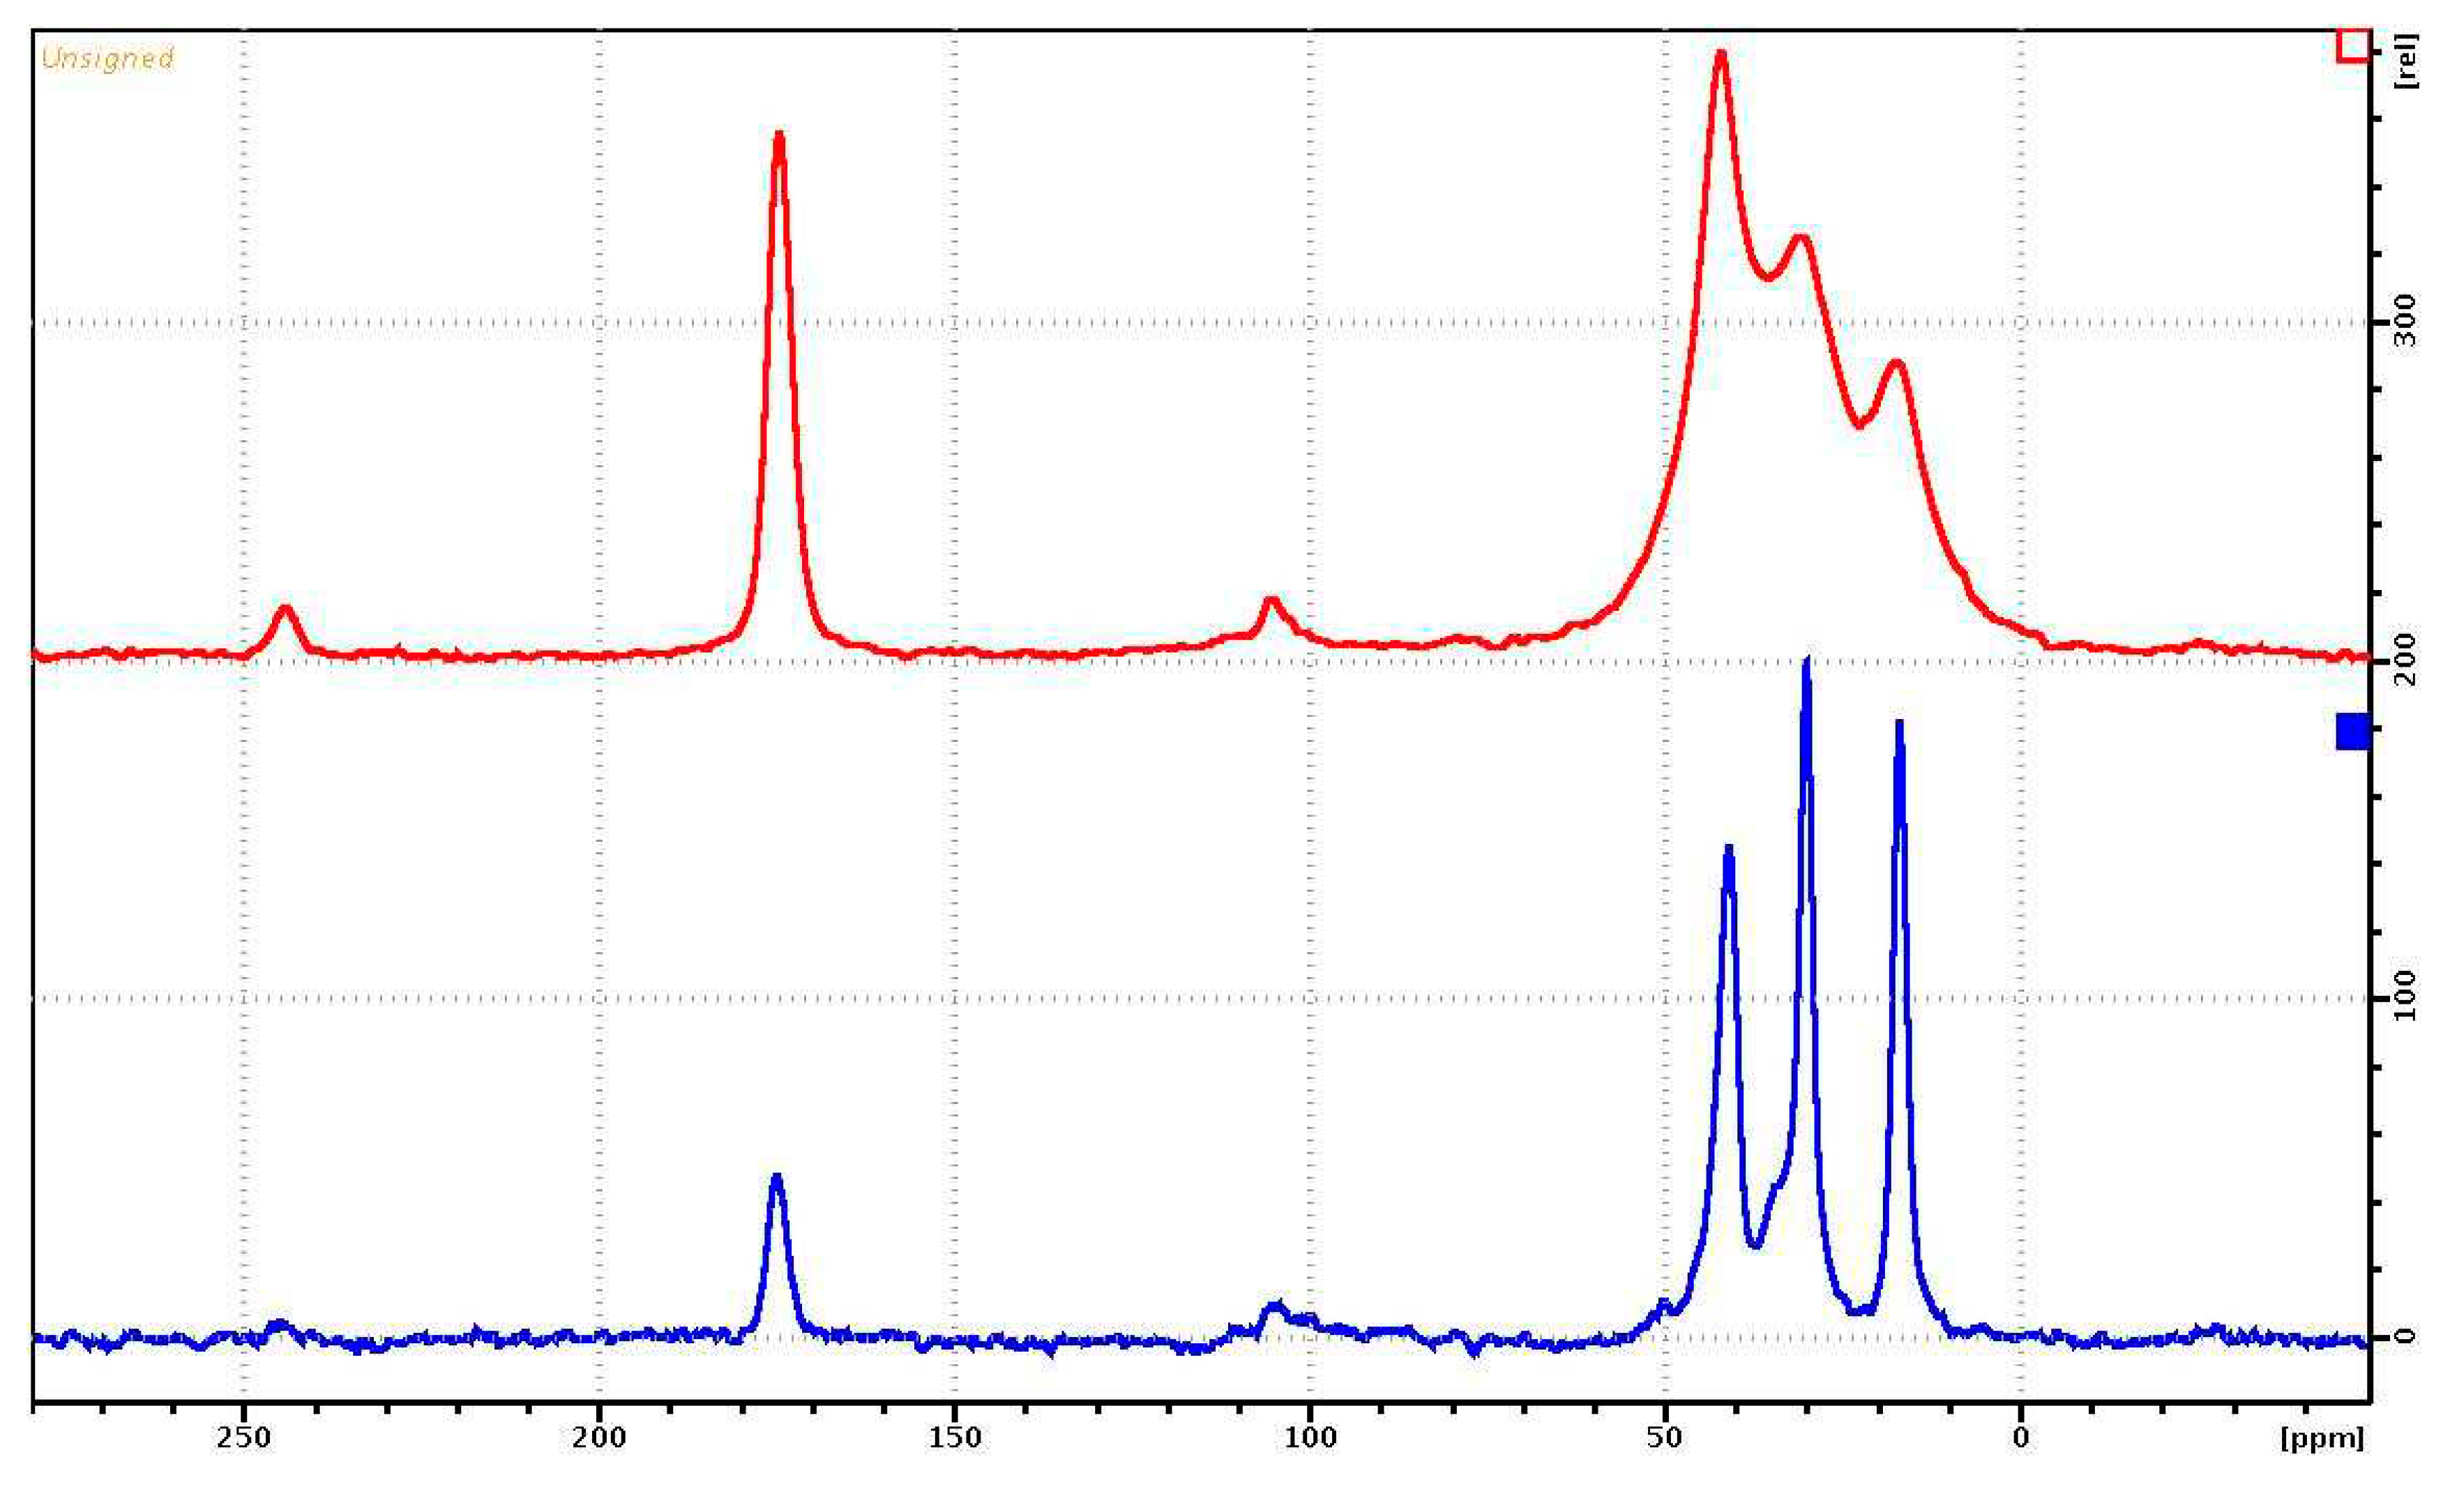
Figure 7 shows the
13C{
1H} MAS-NMR spectra of the PVP on
13C during proton decoupling, obtained using the pulse program cp (red) and hpdec (blue), respectively. The MAS-NMR
13С{
1H} spectrum of PVP-HA has the same form as in
Figure 6, only the signal-to-noise ratio is several times lower. The NMR signals of the aliphatic region for cross-polarization have a resolution worse than for the
13C NMR spectrum with proton suppression.
The data on measurements of spin-lattice relaxation times on protons for the two samples (PVP and PVP-HA) are shown in
Table 3. The table lists the chemical shifts of the signals for which the spin-lattice relaxation rates were measured.
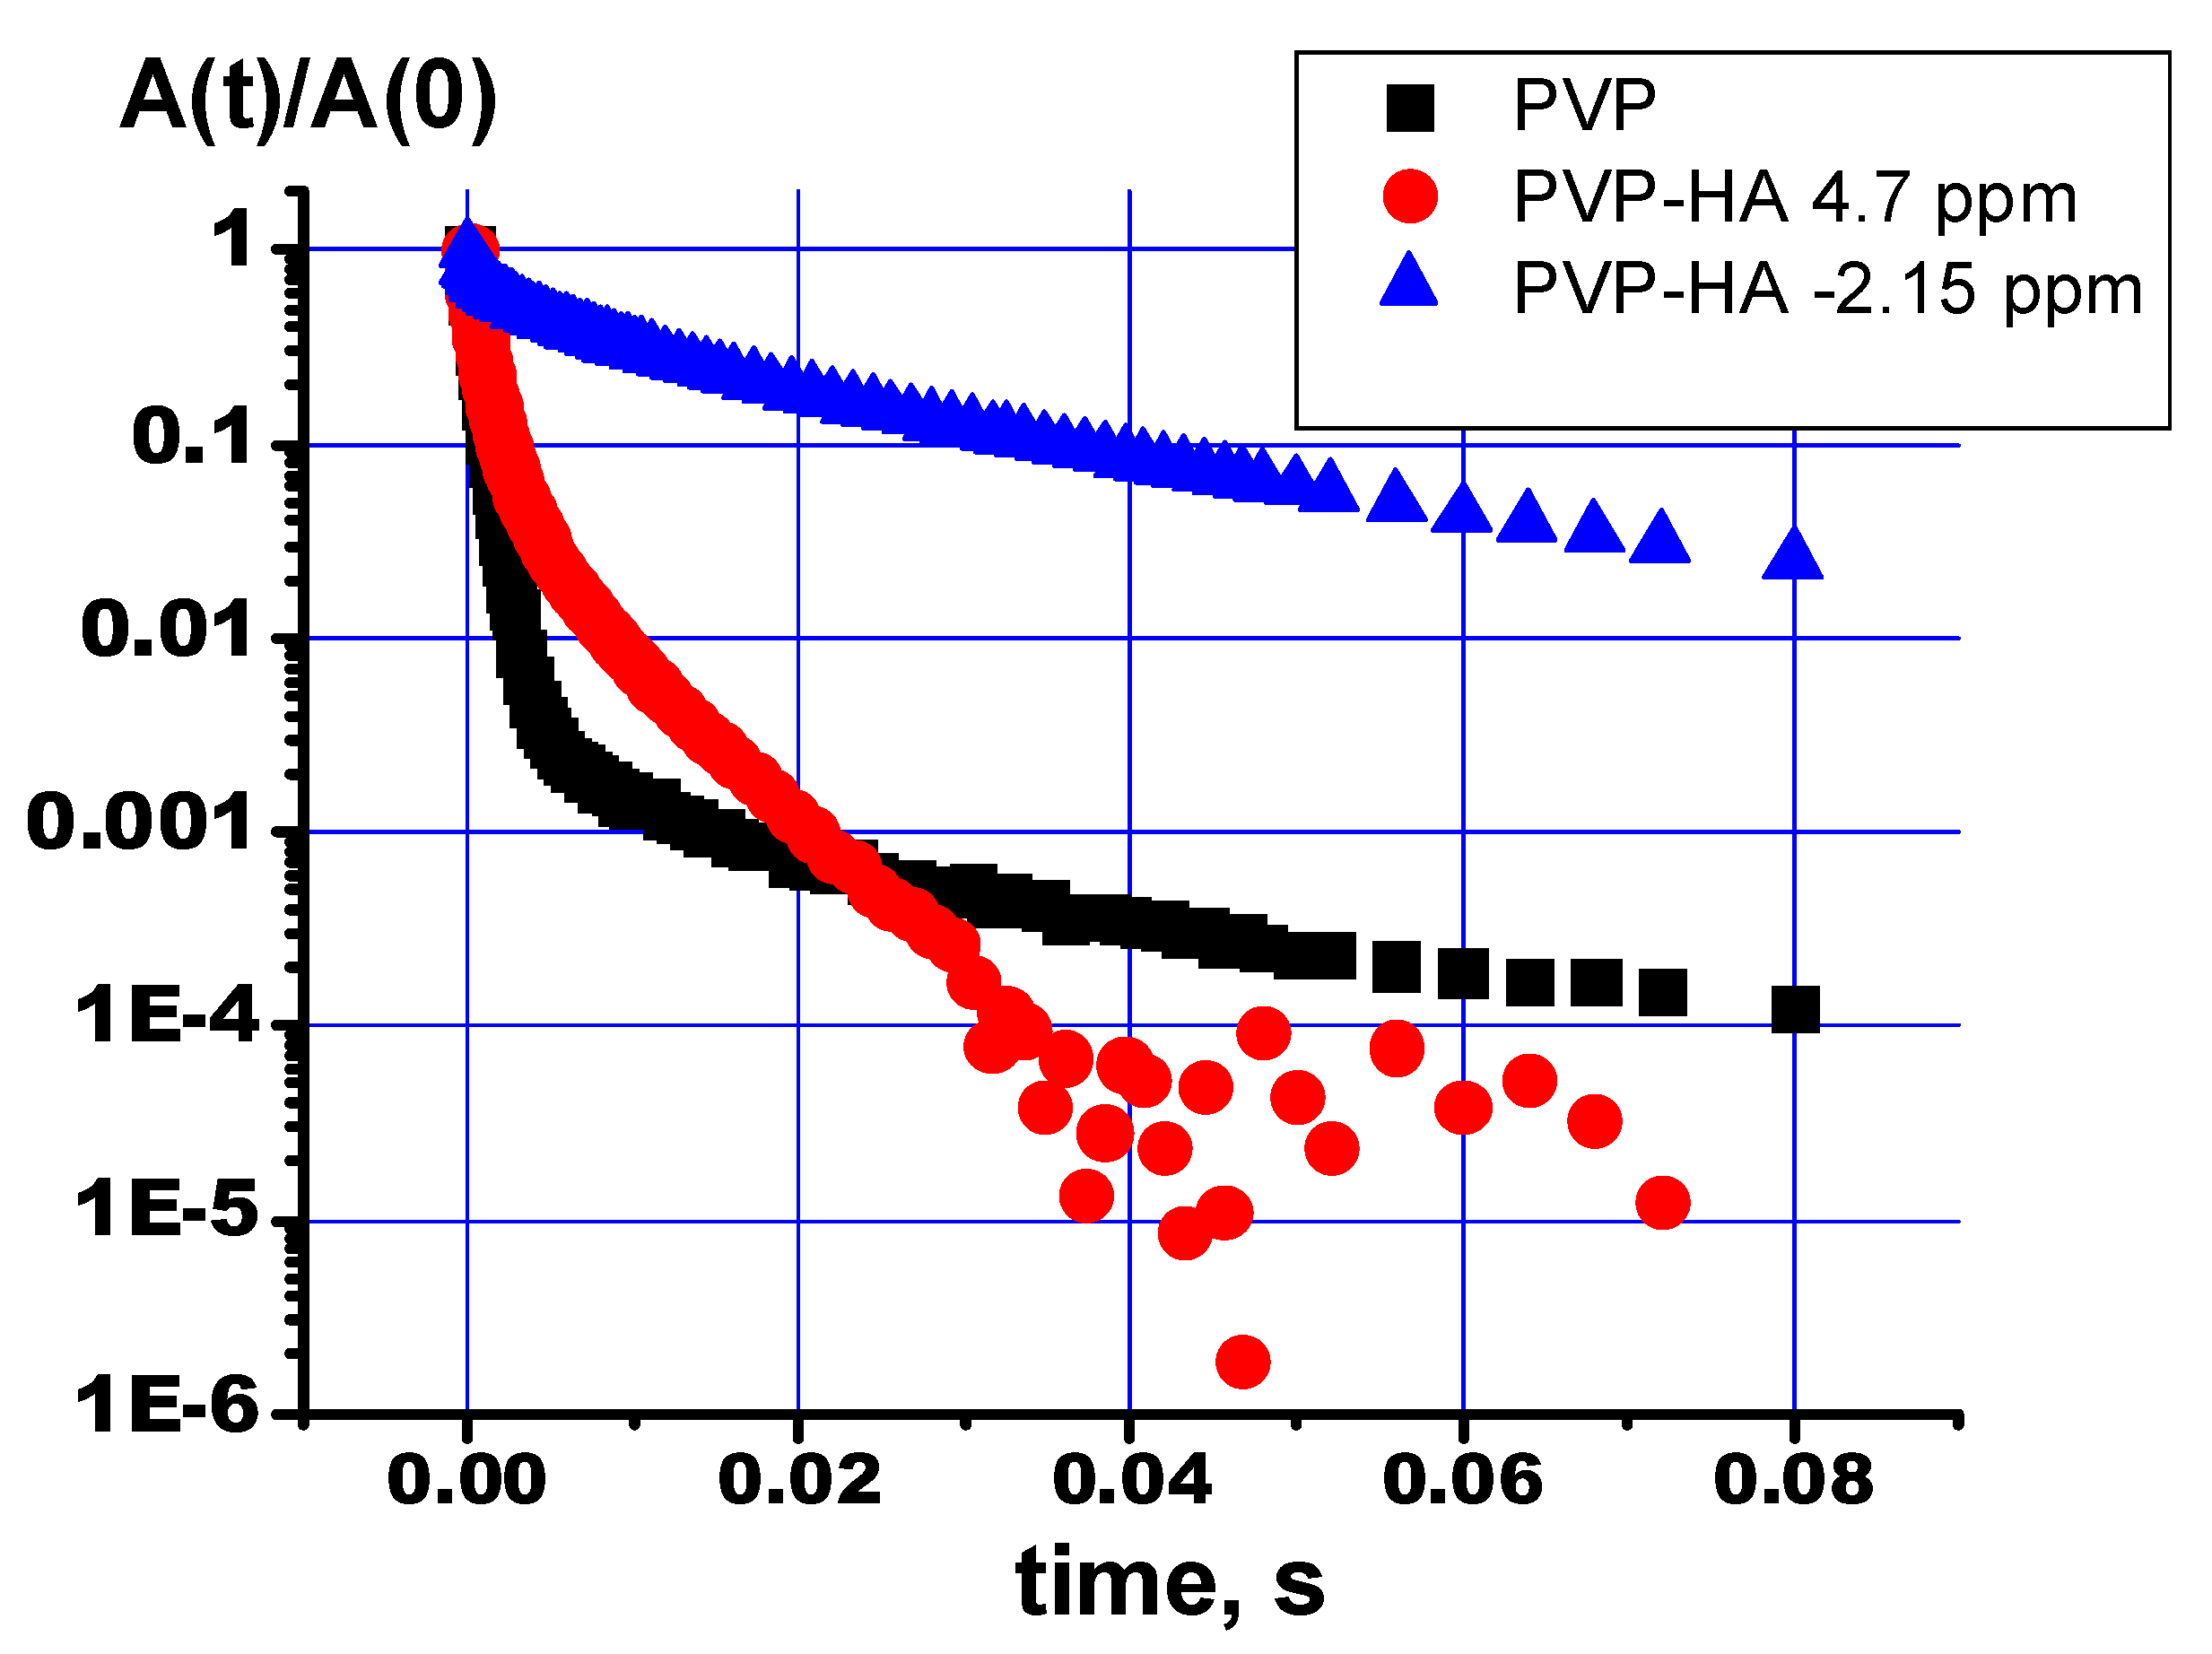
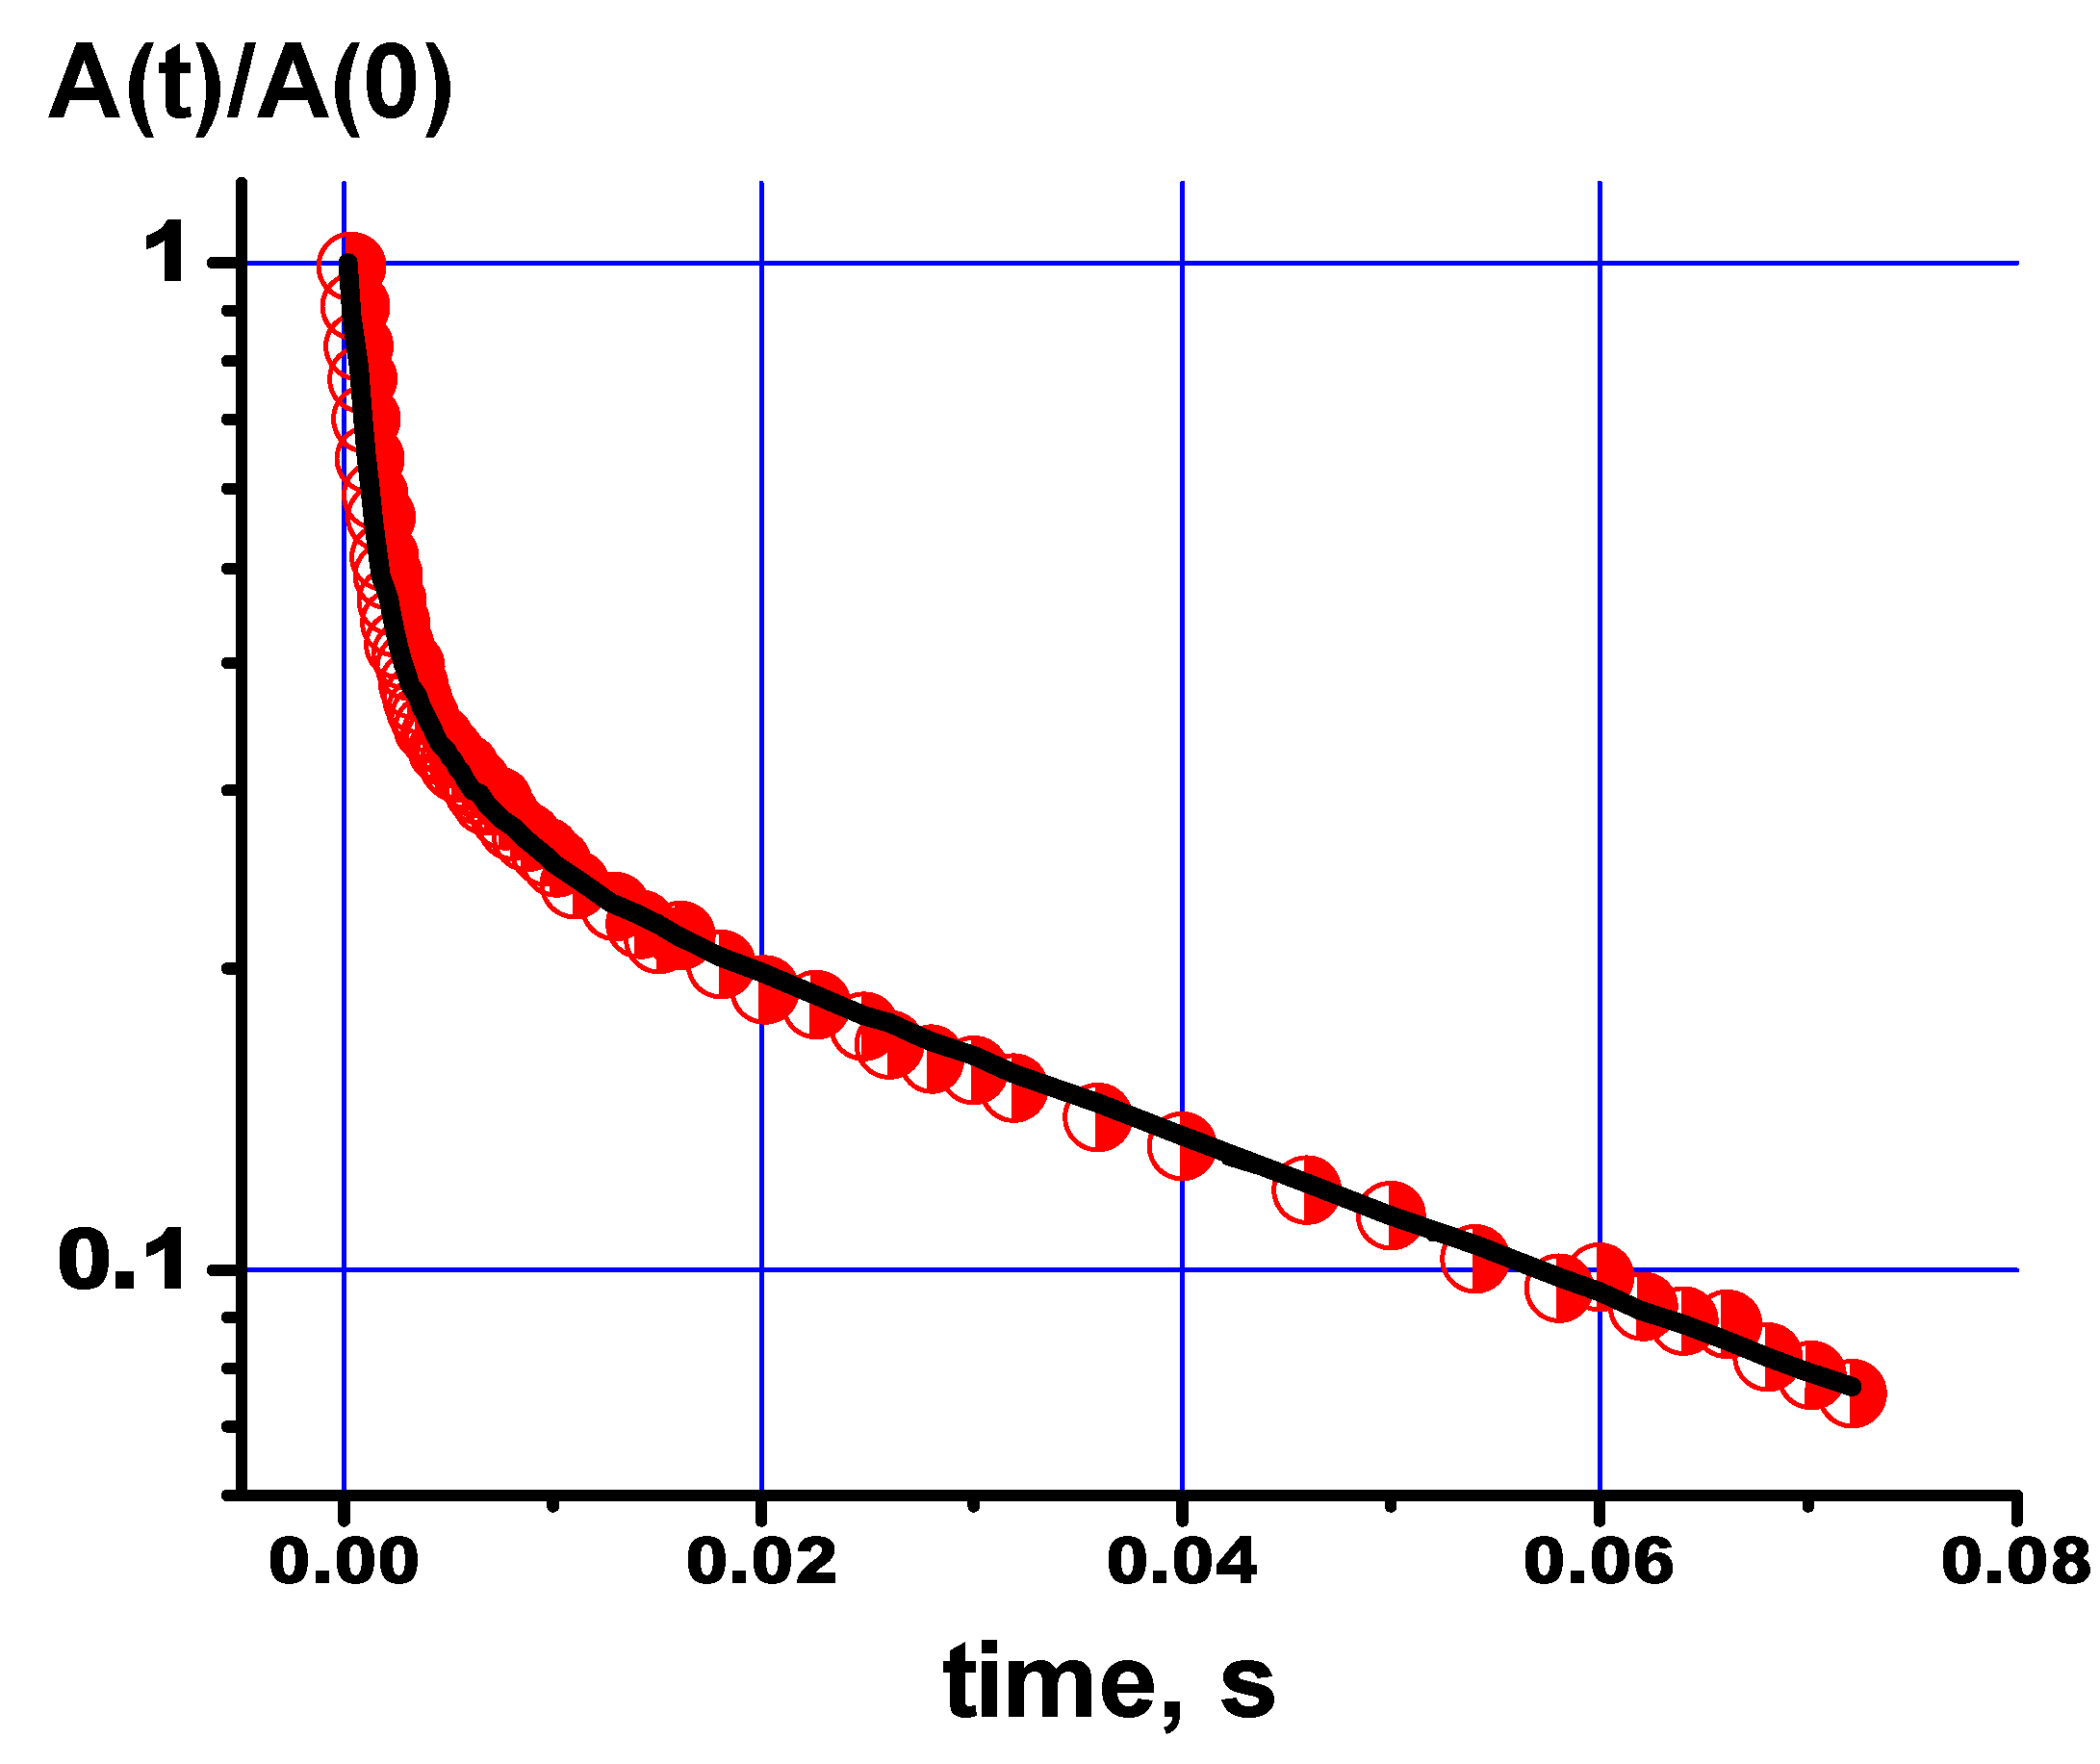
Figure 8 shows the relaxation decays obtained by the Carr-Purcell-Meiboom-Gill (cpmg) sequence for the NMR signals of the chemical shift regions, according to
Table 3. As can be seen, the proton relaxation decays for the NMR signals from the PVP and PVP-HA differ from each other and are described by several exponents. The decays curves of the transverse magnetization of protons in the PVP and PVP-HA samples were approximated by the formula:
where
A(0) – initial amplitude of NMR signal, Т
2(i) – spin-spin relaxation times of components with populations
рi. The values of spin-spin relaxation times and their populations calculated from the relaxation decays are given in
Table 4.
It is known that multicomponent relaxation attenuation can manifest itself due to different types of molecular motion or different surroundings of the nuclei. We assume that the presence of three transverse relaxation components for protons is due to the different positions of the OH groups in the PVP-HA composite. So, hydroxyls, included in the structure of HA (δ = - 2.15 ppm), should be characterized by the longest time of transverse (spin-spin) magnetization. Hydroxyls in the environment of defects in the HA crystals should be described by high rates of nuclear spin-spin relaxation. The same approach applies to water localized on the HA surface.
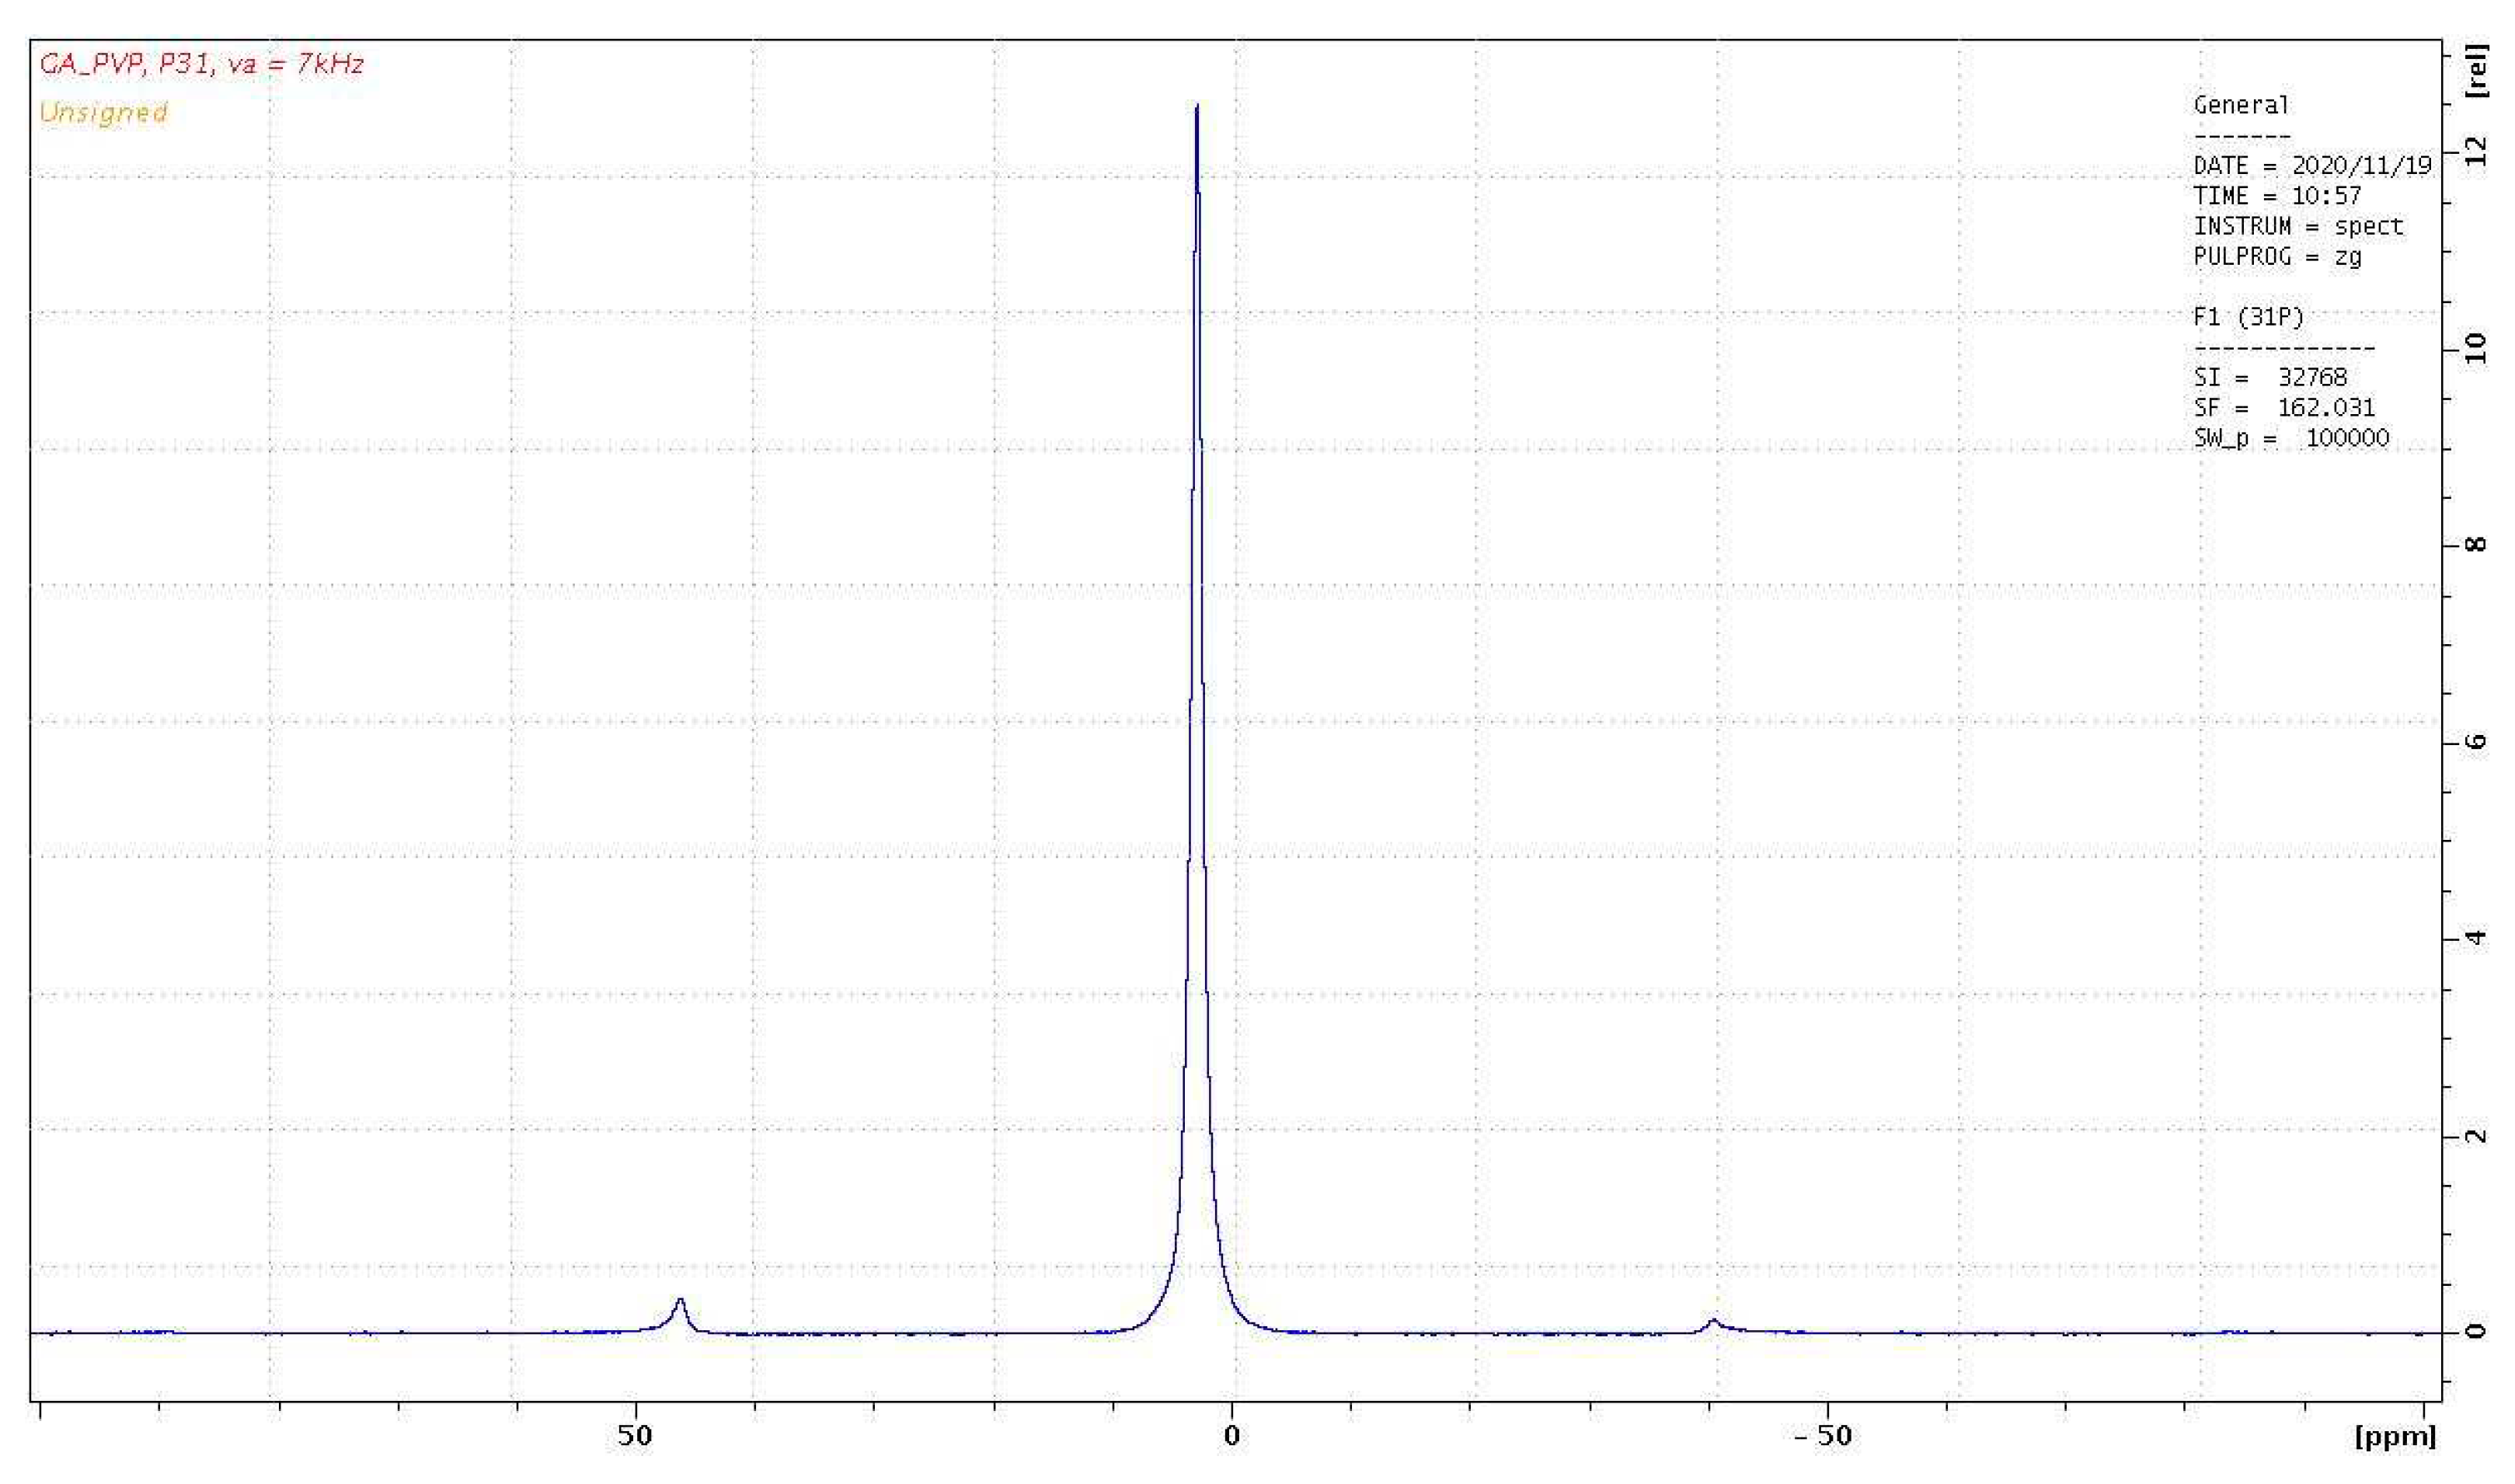
The
31P NMR spectrum of the PVP-HA sample is shown in
Figure 9. It is a single line with a width of about 290 Hz with an isotropic chemical shift of 3 ppm. The shape of the spectrum indicates that all the phosphorus nuclei in HA are in the same chemical environment. It should be noted that the stationary
31Р NMR spectrum of the PVP-HA sample (without rotation) has the same chemical shift, and the linewidth of 3000 Hz.
The spin-lattice relaxation time for
31P was measured as T
1=238±21 s.
Figure 10 shows the relaxation decay of the
31P NMR signal for the PVP-HA and the fitting curve based on the relaxation decay decomposition parameters, according to the Eq.(2).
The values of spin-spin relaxation times and their populations obtained from the relaxation decay for the line in the
31P NMR spectrum of the PVP-HA are listed in
Table 5. The presence of three transverse relaxation components for phosphorus atoms, as well as for protons, is probably due to the presence of lattice defects in the HA crystals.
4. Conclusions
1. Using two microwave frequencies, the EPR parameters for the light and radiation induced paramagnetic centers in the PVP, HA and PVP-HA (such as components of g-factors and hyperfine constants A between electron and
14N nuclei) were defined with high accuracy (
Table 1).
2. In the PVP-HA composite, the EPR spectra and electronic relaxation times of the radiation induced paramagnetic centers were very close to that in HA. In the PVP-HA distribution of A components for the electron-
14N interaction for NO
32- radicals was larger than for the pure HA (
Table 1). The PVP-HA composites did not contain light-induced radicals characteristic of PVP. It can be ascribed to the re-distribution of the electrical charges between PVP and HA. The results can be used for the control of the quality of the in-situ synthesis of PVP-HA composites by the EPR.
3. The 1H MAS NMR for PVP-HA shows the presence of two signals at 4.7 ppm and -2.15 ppm, which can be attributed to “free” water and hydroxyl groups, while the single line - to 31P.
4. The NMR relaxation measurements for 1H and 31P showed that the relaxation decays are a multicomponent process that can be described by three components of the transverse relaxation times. Multicomponent relaxation decay can be ascribed to the presence of defects in HA lattice.
5. The obtained results demonstrated that the applied magnetic resonance techniques can be used for the control of quality of synthesis products and, potentially, to follow the processes of the samples treatment, resorption, and degradation.
Author Contributions
Conceptualization, M.G.; methodology, G.M.; software, G.M. and O.G.; validation, J.R., G.M. and I.F.; formal analysis, O.G.; investigation, I.F., A.P., A.F., O.A. and O.G.; data curation, O.A. and A.P.; writing—original draft preparation, I.F. and M.G.; writing—review and editing, J.R.; visualization, G.M., M.G.; supervision, M.G.; project administration, J.R.; funding acquisition, M.G. and I.F. All authors have read and agreed to the published version of the manuscript.
Funding
This work was funded by the subsidy allocated to Kazan Federal University for the state assignment in the sphere of scientific activities number FZSM-2023-0016. The synthesis of composites was carried out with the support of the Russian science foundation, grant No. 22-23-00278.
Data Availability Statement
The experimental data on the results reported in this manuscript are available upon an official request to the corresponding authors.
Conflicts of Interest
The authors declare no conflict of interest.
References
- Vallet-Regi, M. Ceramics for Medical Applications // J. Chem. Soc. Dalton Trans., 2001, No. 2,P. 97-108. [CrossRef]
- Barinov, S. M. Calcium phosphate-based ceramic and composite materials for medicine // Russian chemical reviews,2010,V.79, № 1,Р. [CrossRef]
- Dziadek, M., Stodolak-Zych, E. and Cholewa-Kowalska, K. Biodegradable ceramic-polymer composites for biomedical applications// A review. Materials Science and Engineering: C, 2017,№ 71, P.1175-1191. [CrossRef]
- Bandyopadhyay A., Mitra I., Bose S. 3D printing for bone regeneration //Current osteoporosis reports,2020, V. 18,No. 5,Р. 505-514.
- Bergmann C. et al. 3D printing of bone substitute implants using calcium phosphate and bioactive glasses //Journal of the European Ceramic Society, 2010, V. 30, No. 12, P. 2563-2567. [CrossRef]
- Teodorescu, M. and Bercea M. Poly (vinylpyrrolidone)–a versatile polymer for biomedical and beyond medical applications// Polymer-Plastics Technology and Engineering, 2015, V.54, № 9, P. [CrossRef]
- Morejón L., Mendizábal E., Delgado J. A., Davidenko N., López-Dellamary F., Manríquez R., ... &Planell, J. A. Synthesis and characterization of poly (methyl methacrylate-styrene) copolymeric beads for bone cements // Latin American applied research, 2005, V. 35, № 3,P. 175-182.
- Zhang Y., Lu J. A Mild and Efficient Biomimetic Synthesis of Rodlike Hydroxyapatite Particles with a High Aspect Ratio Using Polyvinylpyrrolidone as Capping Agent // Crystal Growth and Design, 2008, V. 8, № 7, P. 2101–2107. [CrossRef]
- Jemli Y.E., Abdelouahdi K., Minh D.P., Barakat A. and Solhy A. Synthesis and Characterization of Hydroxyapatite and Hydroxyapatite-Based Catalysts // Design and Applications of Hydroxyapatite-Based Catalysts, 2022,P.19-72. [CrossRef]
- Schöller K., Ethirajan A., Zeller A., Landfester K. Biomimetic Route to Calcium Phosphate Coated Polymeric Nanoparticles: Influence of Different Functional Groups and pH // Macromol. Chem. and Phys, 2011, V. 212, P. 1165–1175. [CrossRef]
- Langroudi M.M., Saravani M.G., Nouri A. Surfactant-Assisted Synthesis of Polyvinylpyrrolidone-Hydroxyapatite Composites as a Bone Filler // J. Appl. Appl. Biomaterials &Funct. Materials, 2017, V. 15, № 4, P. 334-340. [CrossRef]
- Guesmi, Y. , Agougui H., Jabli M., &Alsharabasy A. M. Bioactive composites of hydroxyapatite/polyvinylpyrrolidone for bone regeneration applications // Chemical Engineering Communications, 2018. [CrossRef]
- Chen J., Peng Q., Peng X., Zhang H. and Zen, H. Probing and manipulating noncovalent interactions in functional polymeric systems// Chemical Reviews, 2022, V.122, № 18, P.14594-14678. [CrossRef]
- Murzakhanov F. F., Grishin P. O., Goldberg M. A., Yavkin B. V., Mamin G. V., Orlinskii S. B., ... &Komlev V. S. Radiation-induced stable radicals in calcium phosphates: Results of multifrequencyepr, ednmr, eseem, and endor studies // Applied Sciences, 2021, V. 11, № 16, P. 7727. [CrossRef]
- Shurtakova D. V., Yavkin B. V., Mamin G. V., Orlinskii S. B., Sirotinkin V. P., Fedotov A. Y., ... &Komlev V. S. X-ray diffraction and multifrequencyepr study of radiation-induced room temperature stable radicals in octacalcium phosphate // Radiation Research, 2021, V. 195, № 2,P. 200-210. [CrossRef]
- MurzakhanovF., MaminG.V., OrlinskiiS., GoldbergM., Petrakova N.V.Study of electron–nuclear interactions in doped calcium phosphates by various pulsed EPR spectroscopy techniques // ACS omega,V. 6, № 39, pp. 25338-2534. [CrossRef]
- Gervais C., Bonhomme C., & Laurencin D. Recent directions in the solid-state NMR study of synthetic and natural calcium phosphates // Solid State Nuclear Magnetic Resonance, 2020, V. 107,P. 101663. [CrossRef]
- Pajchel L. et al. Comprehensive structural studies of ultra-fine nanocrystalline calcium hydroxyapatite using MAS NMR and FT-IR spectroscopic methods //Materials Research Bulletin, 2013, V. 48, №. 11,P. 4818-4825. [CrossRef]
- Jäger C., Welzel T., Meyer-Zaika W., &EppleM. A solid-state NMR investigation of the structure of nanocrystalline hydroxyapatite // Magnetic Resonance in Chemistry,2006, V. 44, № 6, P. 573-580. [CrossRef]
- Manatunga D. C., de Silva R. M., Nalin de Silva K. M., de Silva N., &Premalal, E. V. A. Metal and polymer-mediated synthesis of porous crystalline hydroxyapatite nanocomposites for environmental remediation // Royal Society Open Science, 2018, V. 5, № 1, P. 171557. [CrossRef]
- Hu Y. Y., Liu X. P., Ma X., Rawal A., Prozorov T., Akinc M., ... & Schmidt-Rohr, K. Biomimetic self-assembling copolymer− hydroxyapatite nanocomposites with the nanocrystal size controlled by citrate // Chemistry of Materials, 2011, V. 23, № 9, P. 2481-2490. [CrossRef]
- FadeevaI.V., TrofimchukE. S., ForysenkovaA. A., AhmedA. I., GnezdilovO. I., DavydovaG.A., KozlovaS.G., Antoniac A. and Rau J.V. Composite Polyvinylpyrrolidone–Sodium Alginate—Hydroxyapatite Hydrogel Films for Bone Repair and Wound Dressings Applications // Polymers, 2021, V..13, № 3989, P.1-21. [CrossRef]
- Rai R. K., & Sinha, N. Dehydration-induced structural changes in the collagen–hydroxyapatite interface in bone by high-resolution solid-state NMR spectroscopy// The Journal of Physical Chemistry C, 2011, V. 115, № 29, P. 14219-14227. [CrossRef]
- Morejón L., Mendizábal E., Delgado J. A., Davidenko N., López-Dellamary F., Manríquez R., ... &Planell J. A. Synthesis and characterization of poly (methyl methacrylate-styrene) copolymeric beads for bone cements // Latin American applied research,2005, V. 35, № 3,P. 175-182.
- Fadeeva I. V., Trofimchuk E. S., Forysenkova A. A., Ahmed A. I., Gnezdilov O. I., Davydova G. A., ... & Rau J. V. Composite Polyvinylpyrrolidone–Sodium Alginate—Hydroxyapatite Hydrogel Films for Bone Repair and Wound Dressings Applications // Polymers, 2021, V.13, № 22, P. 3989. [CrossRef]
- Gabbasov B., Gafurov M., Starshova A., Shurtakova D., Murzakhanov F., Mamin G., Orlinskii S. Conventional, Pulsed and High-Field Electron Paramagnetic Reso¬nance for Studying Metal Impurities in Calcium Phosphates of Biogenic and Synthetic Origins // J. Magnetism and Magnetic Materials. 2019. V. 470. P. 109–117. [CrossRef]
- Stoll S. CW-EPR Spectral Simulations //Solid State Methods in Enzymology,2015, V. 563, P. 121-142. [CrossRef]
- Gafurov M., Biktagirov T., Yavkin B., Mamin G., Filippov Y., Klimashina E., Putlayev V. and Orlinskii S. Nitrogen-containing species in the structure of the synthesized nano-hydroxyapatite // JETP letters, 2014, V. 99, P.196-203.
- ShurtakovaD.V., MaminG.V., GafurovM.R. The study of synthetic tricalcium phosphate by EPR and DFT methods //Magn. Reson. Solids,2023, V. 25,P. 23201. [CrossRef]
- Gabbasov B., Gafurov M., Starshova A., Shurtakova D., Murzakhanov F., Mamin G., Orlinskii S. Conventional, Pulsed and High-Field Electron Paramagnetic Resonance for Studying Metal Impurities in Calcium Phosphates of Biogenic and Synthetic Origins // J. Magne¬tism and Magnetic Materials, 2019, V. 470, P. 109–117. [CrossRef]
- RadtsigV.A.MODERN ACHIEVEMENTS IN MECHANICAL ENZYMATIVE PROCESSING OF PLANT RAW MATERIALS //Khim. Fiz., 2004, V. 23, № 10, P. 70–109. (in Russian).
- FadeevaI.V., ForysenkovaA.A., TrofimchukE.S., GafurovM.R., AhmedA.I., DavidovaG.A., AntonovaO.S. andBarinov, S.M.Porous matrixes based on polyvinylpyrrolidone containing calcium phosphates for medical application // Russian Chemical Bulletin, 2022, V. 71, №3, P.543-548.
- LaurencinD., Almora-BarriosN., de LeeuwN. H., GervaisC., BonhommeC., MauriF., ChrzanowskiW., KnowlesJ. C., NewportR. J., WongA., GanZ., SmithM. E., AmJ. Magnesium incorporation into hydroxyapatite //Biomaterials, 2011, V.32 P.1826-1837.
- James, P. , Yesinowski and Hellmut Eckert J. Hydrogen Environments in Calcium Phosphates: NMR at High Spinning Speeds // Am. Chem. SOC., 1987, P. 6274-6282. [CrossRef]
|
Disclaimer/Publisher’s Note: The statements, opinions and data contained in all publications are solely those of the individual author(s) and contributor(s) and not of MDPI and/or the editor(s). MDPI and/or the editor(s) disclaim responsibility for any injury to people or property resulting from any ideas, methods, instructions or products referred to in the content. |
© 2023 by the authors. Licensee MDPI, Basel, Switzerland. This article is an open access article distributed under the terms and conditions of the Creative Commons Attribution (CC BY) license (http://creativecommons.org/licenses/by/4.0/).

