1. Introduction
1.1. Background
Advances in construction technology emerge from the advantages of the latest concrete technology. Since its first use, concrete has become a mandatory gigaton material for various construction and structural applications. The estimated worldwide concrete production has reached 30 gigatons [
1]. The boom in construction witnessed in the current century has increased the demand for concrete materials, especially cement as the essential binding material. Aïtcin [
2] reported that the demand for cement increased from 10 Mt in 1900 to 3.5 Mt until 2016, this increases with the demand for concrete for new constructions. The main ingredients of concrete can be seen as those composing the cementitious matrix and those forming the skeletal aggregates [
3,
4,
5]. The first phase, the cementitious matrix, is responsible for drying shrinkage and most of the deteriorating reaction when innocuous aggregates are present. The critical zone is represented by the boundaries between the cementitious matrix and aggregate circumferences, which lead to the formation of local stresses along the interface due to shrinkage and hardening processes as weak points [
3]. The cracks are well reported to be initiated due to and near these weak points. Accordingly, the overall durability depends on the quality of the interfacial transition zone (ITZ) and its microstructure [
6,
7,
8]. Therefore, improving the quality of ITZ becomes a common practice to enhance the durability of concrete. The improvement process can be achieved by reducing the water-to-binder (w/b) ratio and applying appropriate chemical and mineral admixtures, as well as many other fine and ultra-fine natural and artificial materials.
1.2. Bibliographical overview
According to Lagerblad and Kjellsen [
9] and Winnefeld [
10], the factors affecting the quality of ITZ are:
Type of cement and, accordingly, its chemistry and activity.
The packing of both the ingredients for the cementitious matrix and aggregate skeleton
Chemical and volume stability of the individual cementitious, mortar, and concrete phases.
Sieve analysis, fineness, and chemical stability of fine and coarse aggregates.
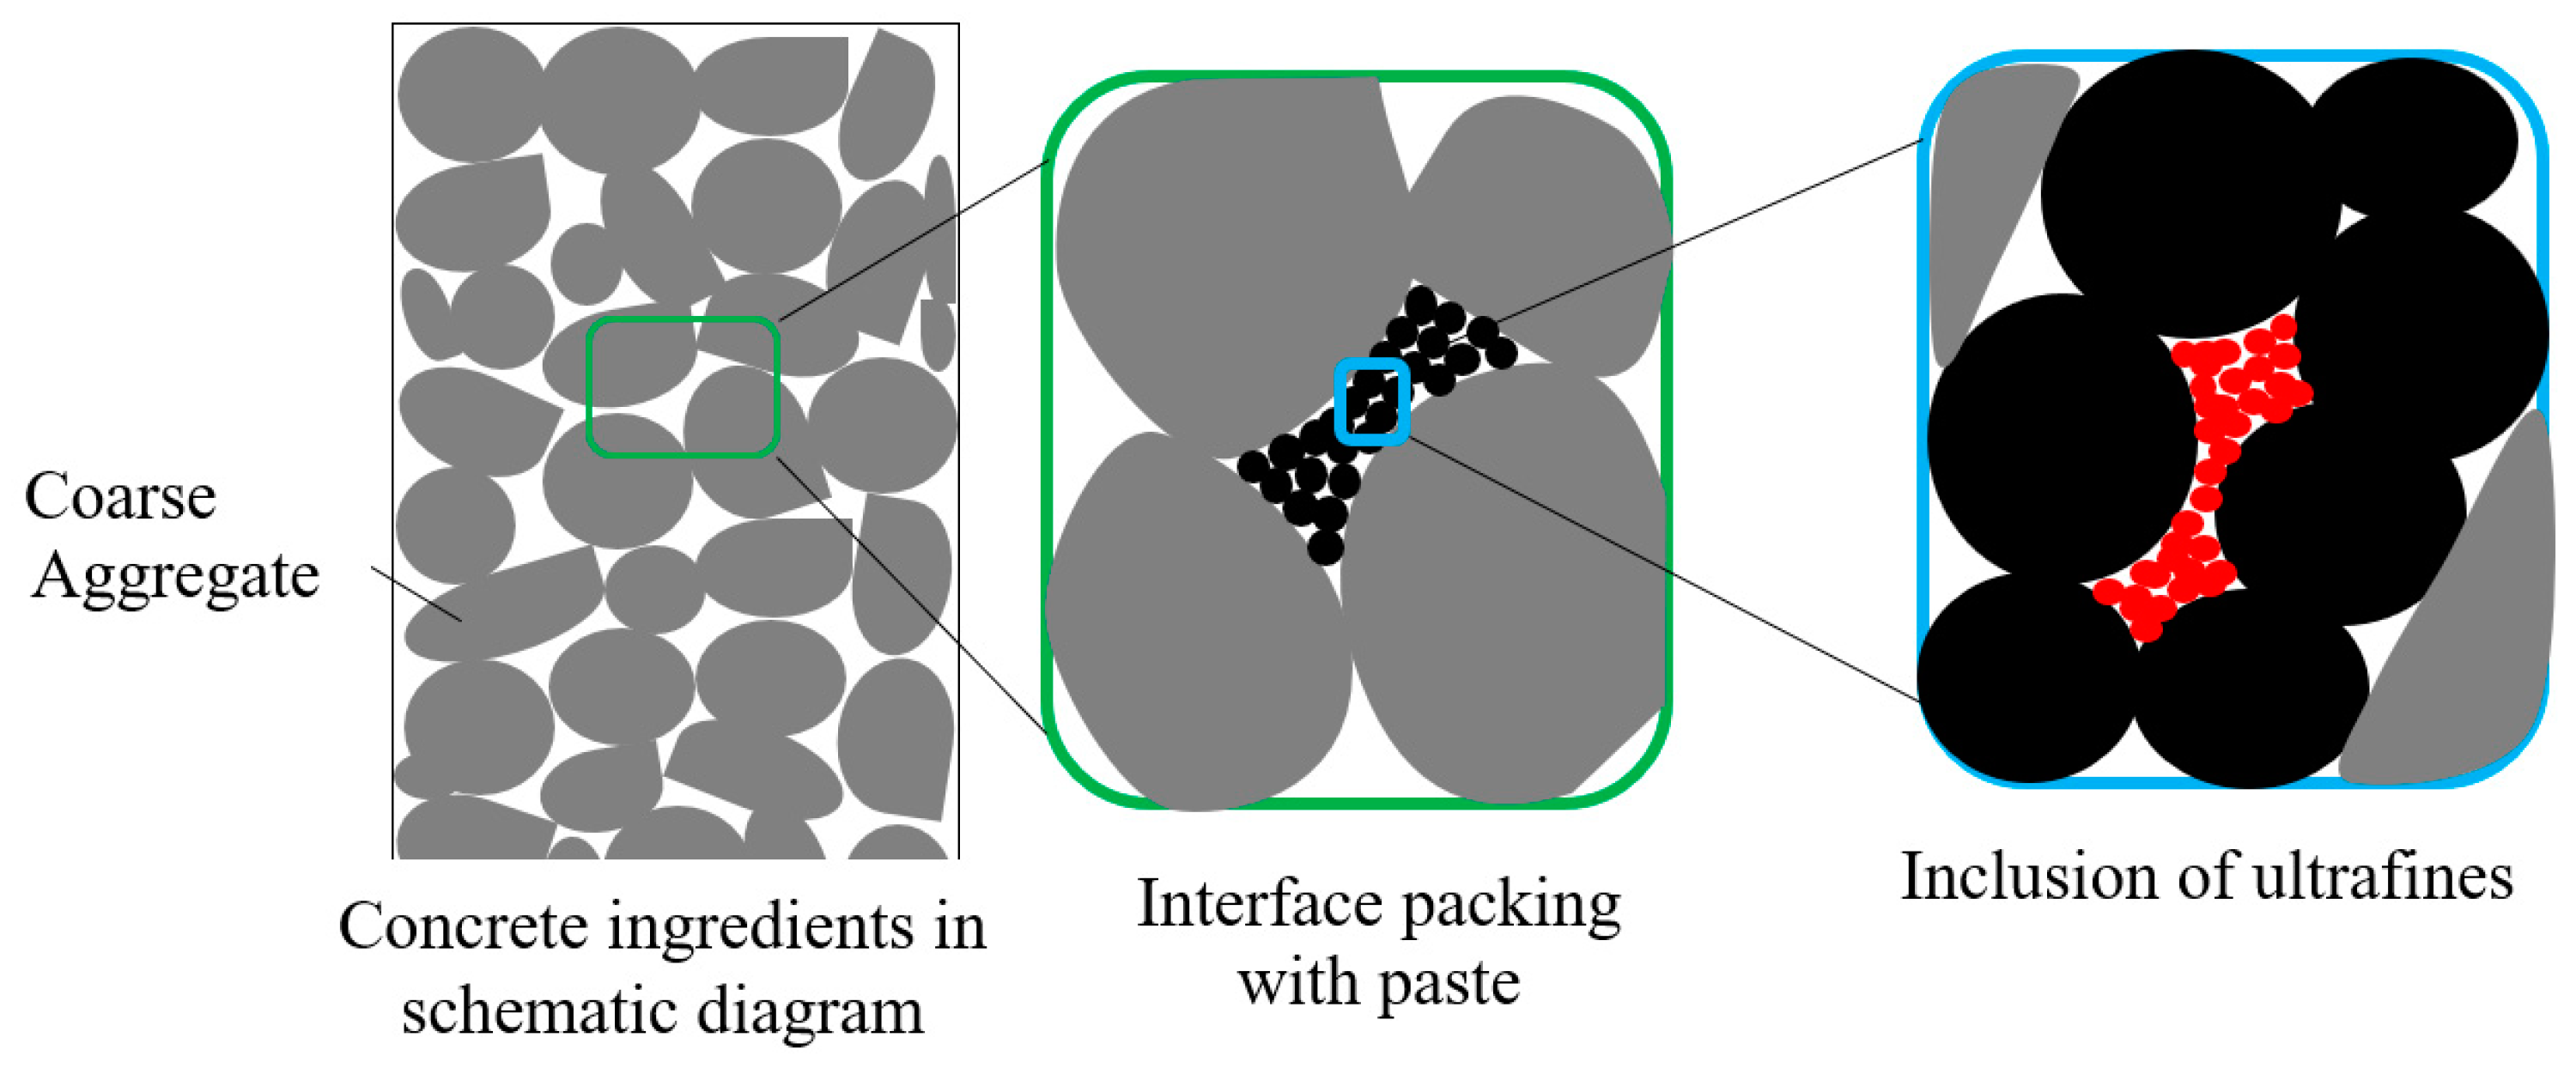
Packing density comes from the main concept of filling the voids in the cementitious matrix using finer powders and those in the aggregate skeleton using well-distributed aggregates. Dispersion becomes critical for optimal packing density, which can be achieved using compatible chemical admixtures. Mineral admixtures with pozzolanic activities contribute to the formation of secondary calcium-silicate hydrates (C-S-H), which enhance the quality of ITZ. Moreover, the presence of mineral admixtures modifies the flowability of concrete due to the slippage of aggregates, causing it to move from a normal slump to a high degree of flowability. The improved flowability is reported to lead to improved ITZ [
11]. The presence of filling particles, either smaller than cement particles or aggregate grains, can be visualized, as shown in
Figure 1.
The partial replacement of cement with mineral admixtures was shown to have multiple economic and durability benefits. For example, silica fume (SF) has a high degree of pozzolanicity due to its particles with nano-median sizes (200–400 nm) and a high degree of amorphicity. When SF partially replaces cement, it first reduces the amount of cement. It thus reduces the CO
2 footprint, and second, it reacts with the liberated calcium hydroxide (CH) due to the hydration of silicate phases and the formation of C-S-H. This chemical reaction significantly improves the mechanical properties of concrete due to the elevated strength of the cementitious matrix and the enhanced ITZ properties [
12,
13,
14]. SF replacement level of up to 15% was reported to be used in the production of high-performance concrete (HPC) with improved strength [
15,
16,
17]. Compared to the control mixture, the presence of up to 15% SF is also reported to lead to an increase of 21% in the compressive strength that reaches its maximum improvement value at 90 days [
15]. Similarly, it is also reported that the incorporation of 6 and 10% SF has led to a 19% and 25% increase in compressive strength, respectively [
18]. In another study, the early strength was reduced compared to the control mix due to the presence of SF at low w/b ratios of 0.27 to 0.33 and the improvement was noted after 7 days [
19]. The reduction was notable at a higher replacement level. This can be attributed to the difficulty of efficiently dispersing SF at higher dosages, which can also be attributed to the increase in plastic viscosity and yield stress that make the flowability difficult and the packing density lower. All the researchers agreed that the increase in strength could be attributed to the pozzolanicity and filling effect of the nano-sized SF particles.
On the other hand, fly ash (FA) is another type of mineral admixture known for its amorphous alumino-ferrite-silicate structure and especially spherical structures known as cenospheres. Due to the micro size of its particles, they become slower in the pozzolanic activity with CH compared to SF. Due to the slow pozzolanic activity of FA, its incorporation in a partial replacement of cement causes a notable reduction in the heat of hydration of cement. Therefore, due to its pozzolanic activity and spherical structure, the presence of FA has the dual benefits of secondary hydration and filler [
20,
21,
22,
23,
24,
25].
For that reason, the effective combination of FA and SF as a partial replacement for cement and an enhancer for strength and durability becomes a common practice [
26,
27,
28,
29,
30,
31,
32,
33,
34]. The ternary combination of SF (10%) with FA increases its compressive strength compared to the reference binary with FA by about 145% [
29]. The ranges of 8–12% SF and 15–20% FA were reported to significantly reduce the permeability and related properties such as porosity and sorptivity [
26]. Similarly, it is mentioned that the ranges of 4–8% SF and 20–50% FA could be combined together in different ternary mixes for better mechanical properties and the lowest permeability [
35]. For example, the combination of 3% SF and 32% FA was found to have a chloride permeability of 3000 coulombs, while it was found to have one below 500 coulombs when formulating 9% SF and 26% FA [
36,
37]. Therefore, the proportion of binding materials and curing conditions have a substantial effect on the ITZ and durability properties of fillers and materials of variable pozzolanic properties [
38,
39,
40]. The filler effect due to the size effect can also be attributed to the formation of different nucleation sites that accelerate cement hydration products with condensed and improved microstructures [
10,
41,
42,
43,
44]. Therefore, the packing density at the cementitious matrix and aggregate skeletal levels, in addition to the nature of fine and ultrafine powder, all together represent an overall package that defines the final output's fresh and hardened properties [
45,
46,
47]. Despite all these old and recent investigations, ultrafine powders, especially silica sand, still need further research.
1.3. Scope and significance of the research
From the previous literature review, it becomes evident that there is limited literature on the use of ultrafine fillers for improving concrete's durability. This study aimed to examine the mechanical and durability properties of concrete using different ultrafine fillers and mineral admixtures both alone and in binary combinations. In this study, we focused on the effects of micro-quartz filler (MQ), in combination with silica fume, on the properties of various concrete types, including high-, and normal-strength concrete mixes. This study examined 40 concrete mixes containing varying ratios of water–binder (0.25, 0.30, 0.35, and 0.40) and binary combinations of both SF and MQ to optimize their strength and durability characteristics. In this comprehensive study, the integration of silica fume and micro-quartz not only innovatively enhances concrete's durability and mechanical characteristics but also positions it as a leading sustainable construction solution.
2. Materials
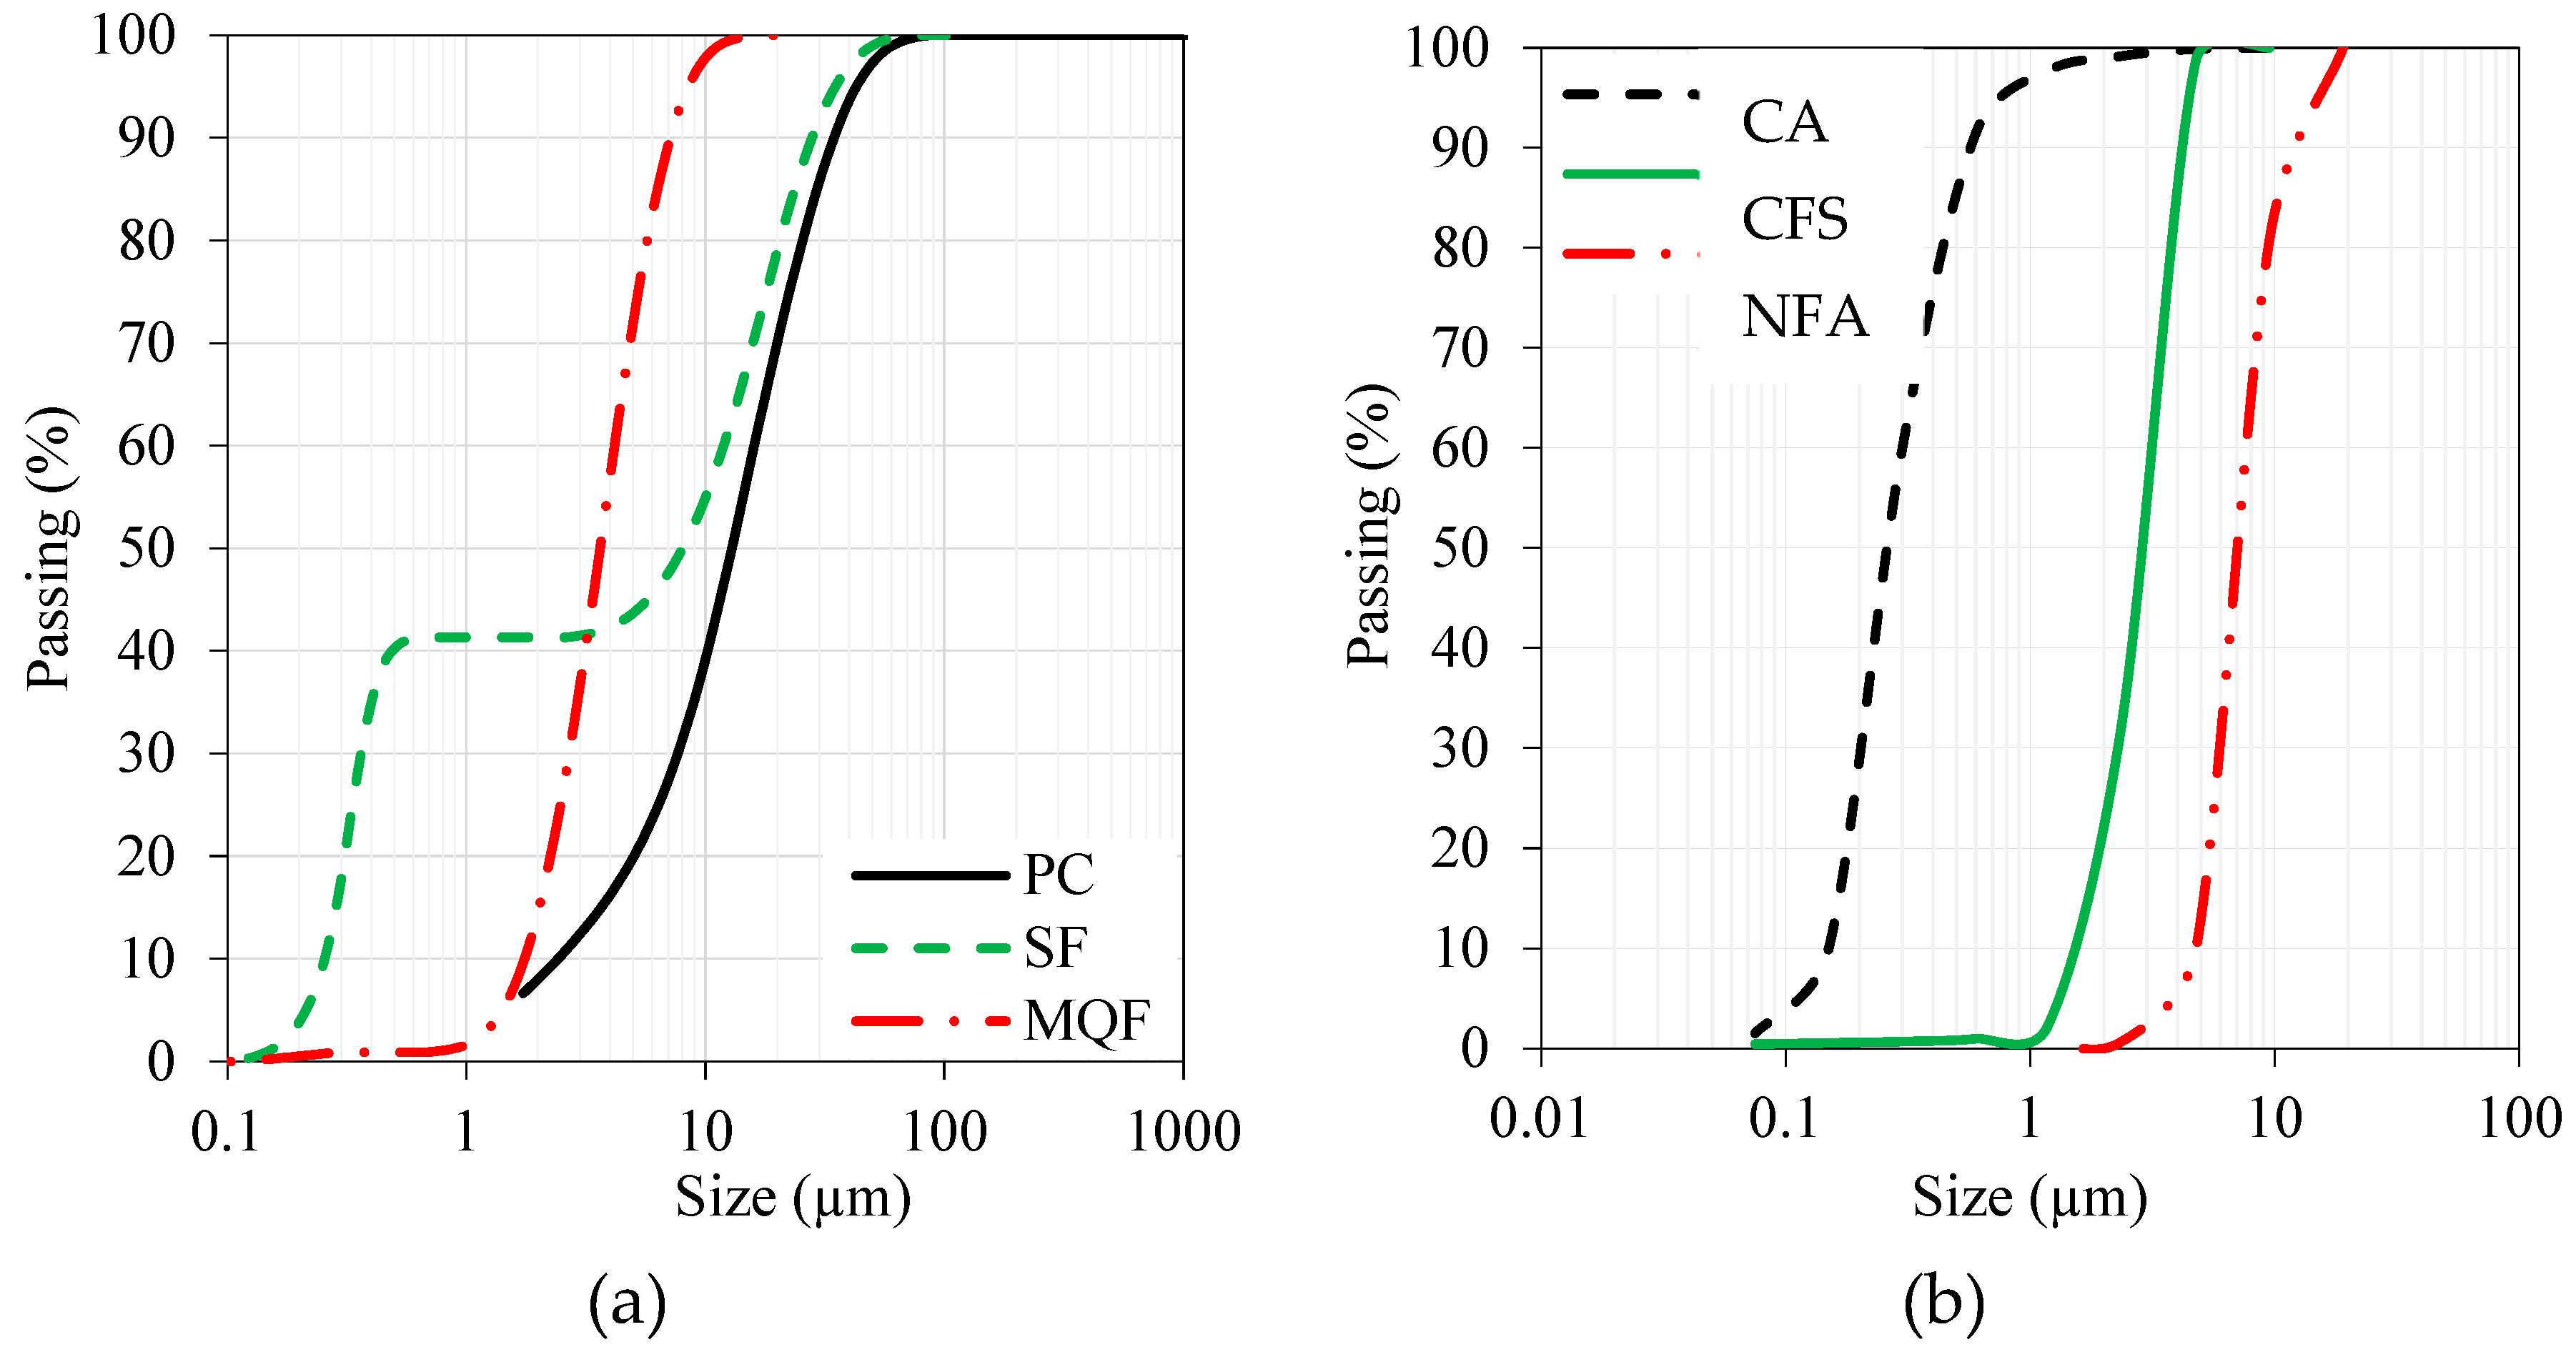
This study used ordinary Portland cement (PC-type I, which meets ASTM C 150) as the primary binder. Supplementary cementitious material, namely silica fume (SF), has also been included. Additionally, micro-quartz (MQ) as ultrafine filler was added to the concrete mixes to improve their strength and durability. In this investigation, PC, SF, MQ, and median grain sizes were approximately 13.0, 8.0, 3.5, and 15.0 µm.
Table 1 lists the physicochemical properties of the fine powders, and
Figure 2a shows their grain size distributions.
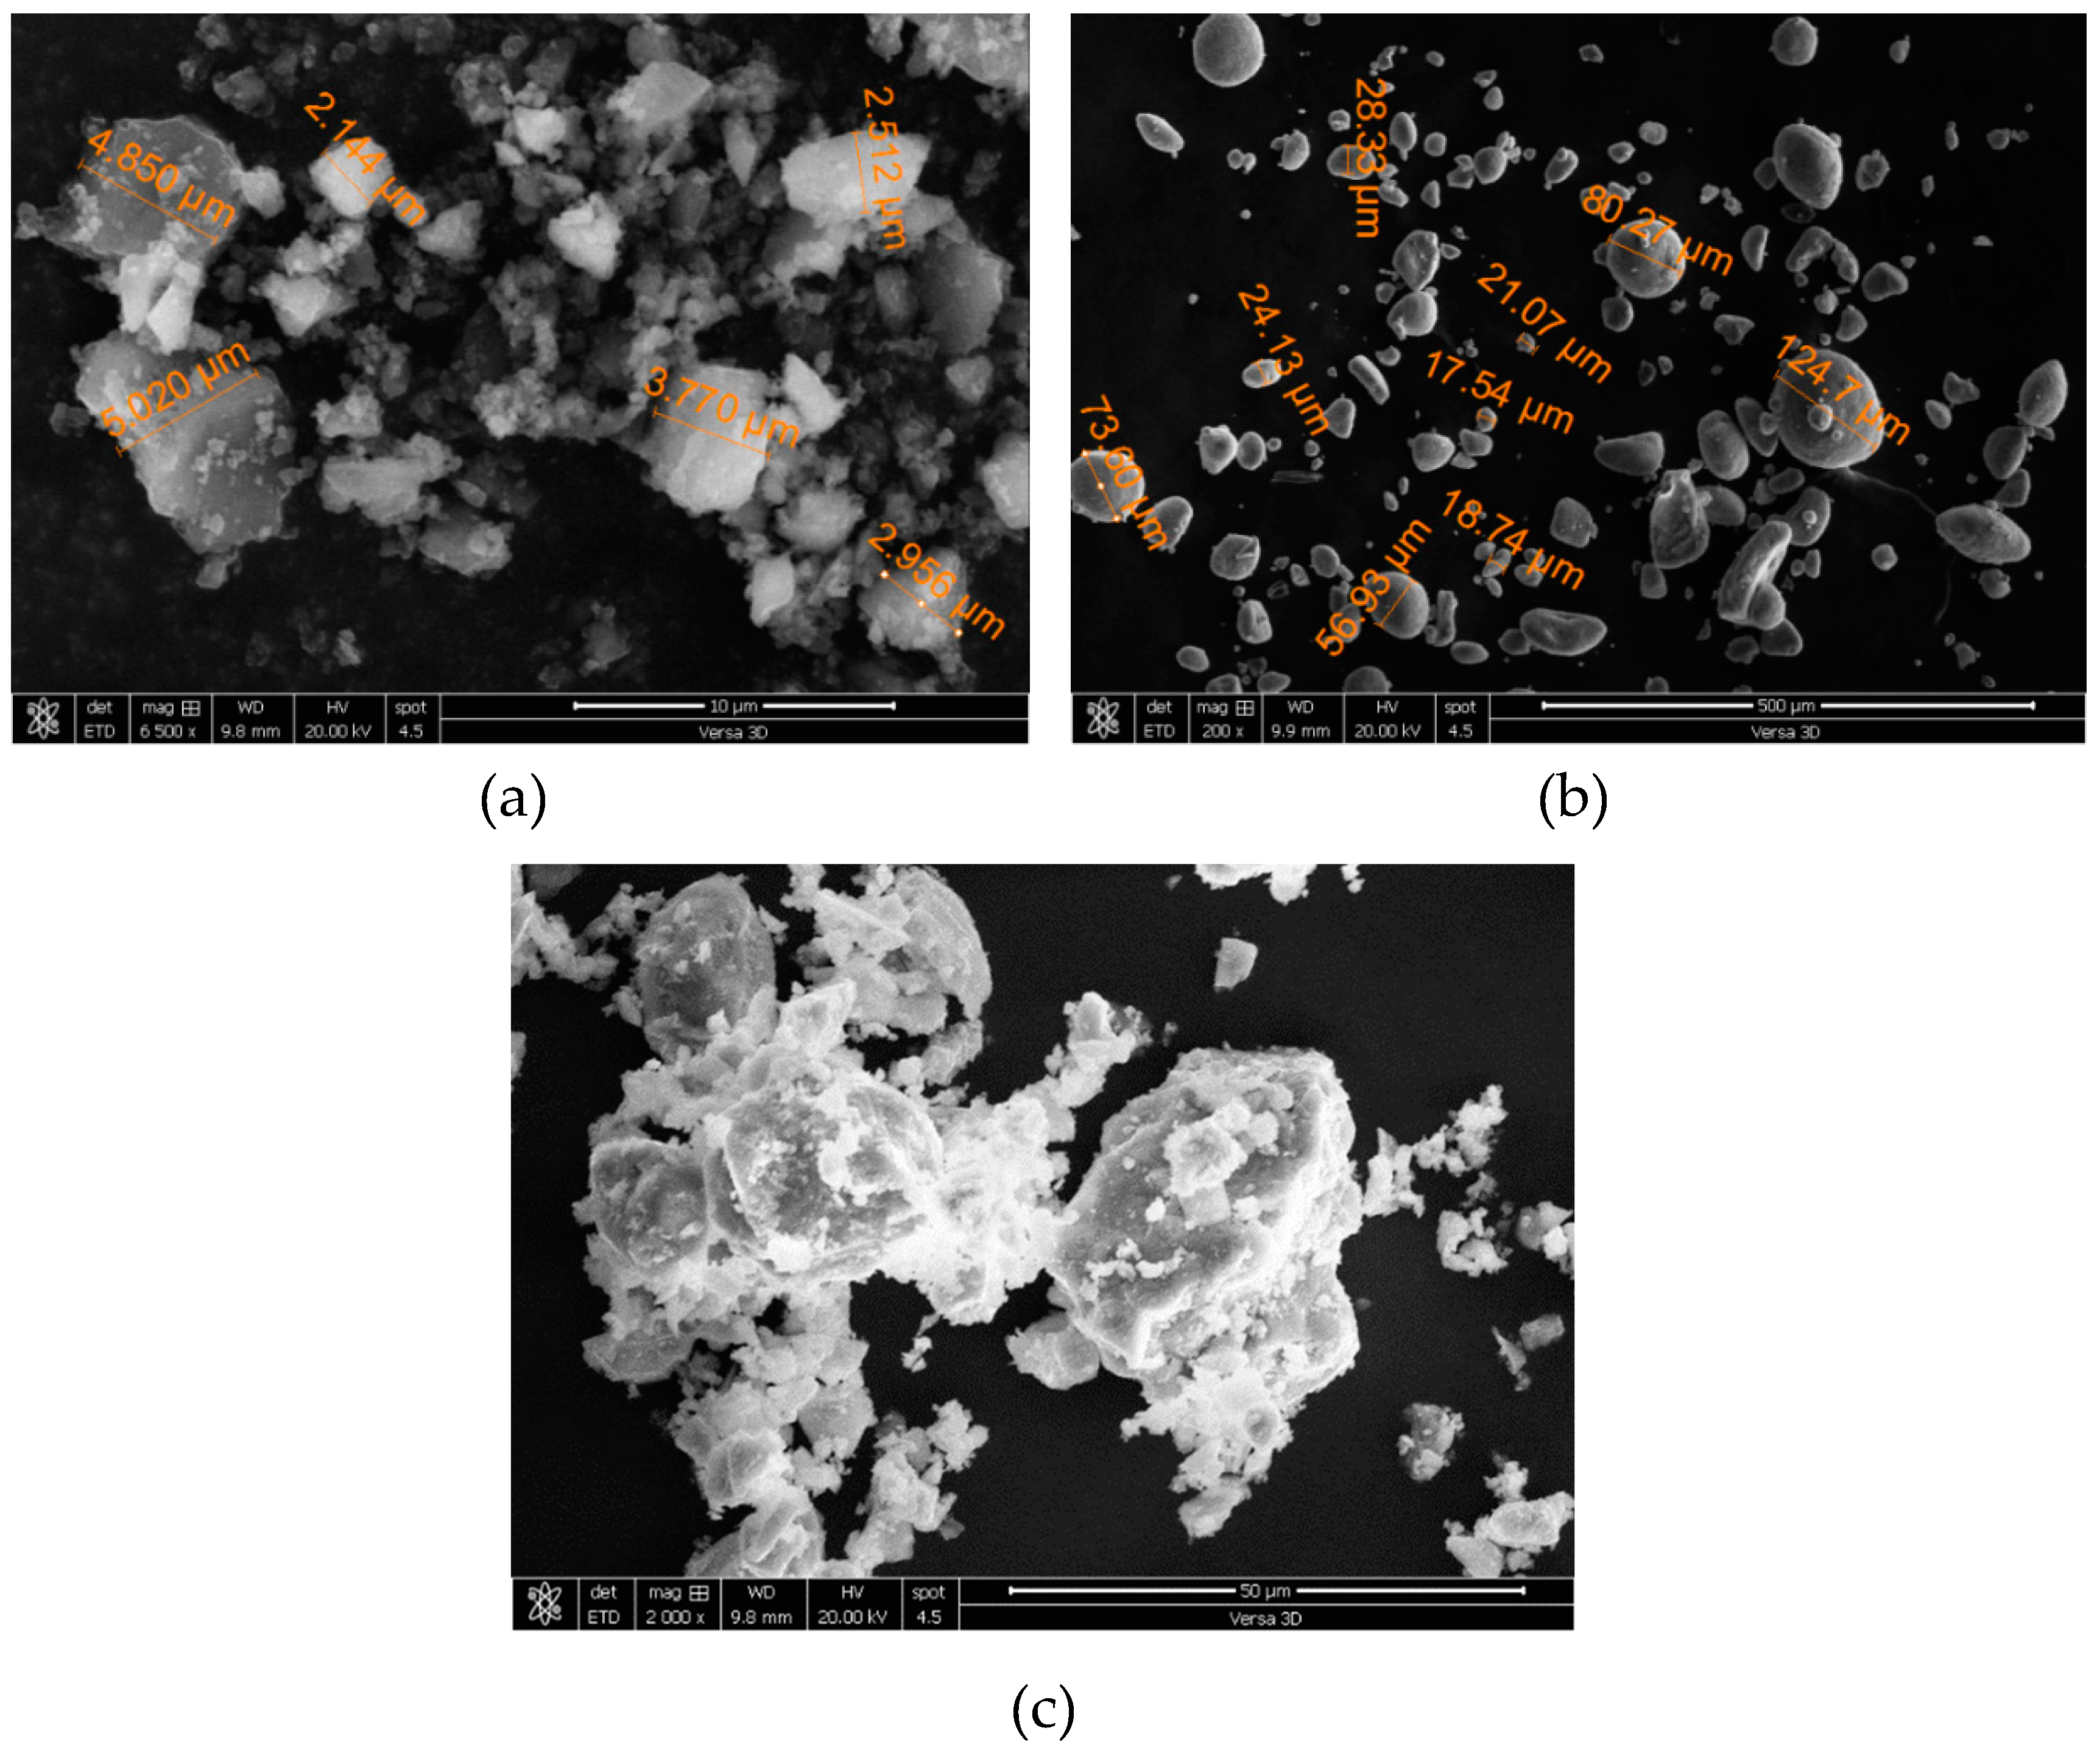
Images of the fine powders obtained by scanning electron microscopy (SEM) are presented in
Figure 3. The MQ particles in
Figure 3a are characterized by their amorphous shape, and their average size ranges from 2 to 5 µm. Additionally,
Figure 3b illustrates the SEM analysis of the SF which contained a mixture of smooth and rough-surfaced sphere particles with a mean size of 10 µm, significantly smaller than the typical SF particle size that is typically less than 1 µm, according to [
48]. Moreover, the PC particles were polyangular, asymmetrical, and ranged in size from 1 to 20 µm [
Figure 3b]. Additionally,
Figure 3c illustrates that the FA particles exhibit sphere-shaped shapes with a mean particle size of approximately 15 µm.
This study utilized a modified polycarboxylic ether polymer superplasticizer (SP) known as Glenium 51 to achieve the required workability of concrete mixes. The dry extract of this SP is 36% and its specific gravity is 1.1. To calculate the SP dosage for the concrete mixture, a ratio of the dry extract (D.E.) and the cement weight (%, wt.) was divided, and this ratio was optimized for a concrete mixture that would provide the highest workability. In this investigation, we used two types of sand with varying particle sizes to prepare the concrete mixes, namely crushed fine aggregates (CFA) and natural fine aggregates (NFA). These fine aggregates were characterized by fineness moduli of 4.66 and 1.47, respectively. In the blended fine aggregates, the fineness modulus was 2.54 as a result of the combination of 65% NFA and 35% CFA. Furthermore, coarse aggregates (CA) with an aggregate size of not more than 10 mm have also been used in the preparation of all concrete mixtures.
Figure 2b illustrates the grain size distribution of the aggregates, while
Table 2 summarizes their physical properties.
3. Methodology
3.1. Mixing, casting, and curing
In this study, the various aggregates were stirred in a typical concrete mixer for a few minutes while the associated absorption water was introduced simultaneously. Afterward, the fine powders were mixed dry for a few minutes to ensure uniformity. Then, the mixing water and SP solution were combined as a ready-mixed blend and stirred for three minutes, followed by a three-minute break and a second two-minute stir. On the other hand, a fiber-reinforced concrete system was developed by incorporating fibers during concrete preparation and blending it for five minutes to distribute the fibers evenly. A separate procedure was carried out in the HPFRCC, in which the dry materials were mixed together in an effort to form a unified material and a pre-mixed amount of SP dosage was added to the mixture until a unified material was formed. As in this case, the mixing process continued until a homogenized mixture had been achieved. Upon attaining this condition, fibers were added, and it was mixed until the fibers were dispersed and thoroughly incorporated into the composite. Finally, the mixer was turned off, and the specimens were cast into the molds, which concluded the mixing process. In
Table 3, detailed characteristics of specimens cast from different cement-based materials are presented to assess their properties. To maintain the specimen's moisture condition, a trowel was used to smooth the top surface and a plastic sheet was placed to cover it. In this investigation, the following curing methods have been employed. In all these curing systems, specimens were demolded after 24h and the curing regime was implemented up to the testing age. Notably, the Hot room curing system was employed for the drying shrinkage testing.
3.2. Detail of mixes
This study examined 40 concrete mixes containing SF and MQ to determine the optimal mixture for strength and durability.
Table 5 displays a detailed breakdown of these different mixes' water-binder ratios and fine powder contents. The CA content of these mixes was 1056 kg/m
3, while the total FA content of these mixes was 450±40 kg/m
3. The SP for these mixes ranged from 4.3 to 12.6 L/m
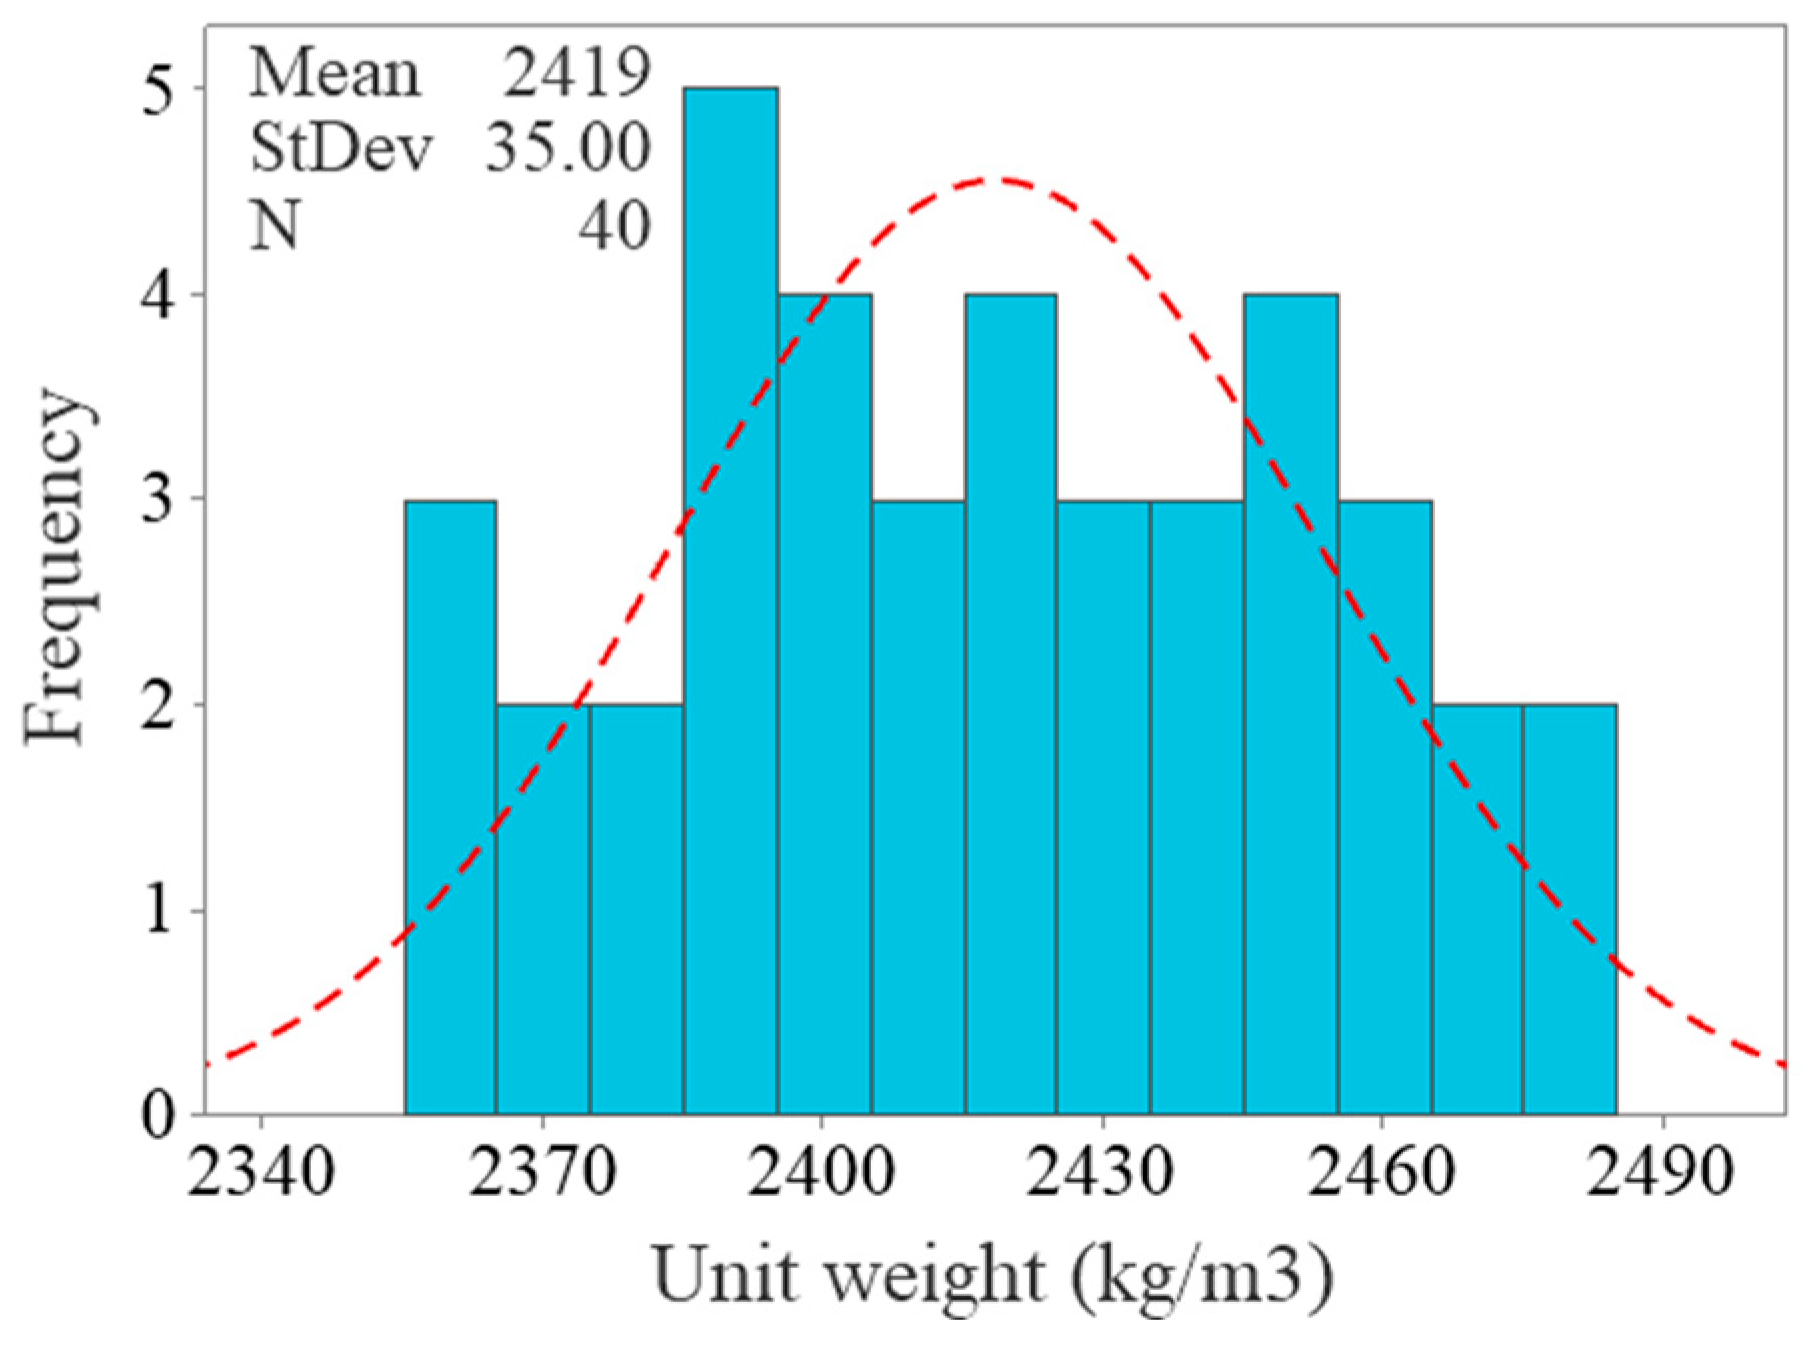
3, which was adjusted to maintain the slump (measured in accordance with ASTM C 143) within a reasonable range (175±25 mm). A notable feature of the concrete casting process is the measurement of the unit weight of the concrete to determine its density.
Figure 4 illustrates the measurements of these mixes with unit weights ranging from 2361.4 to 2481.4 kg/m
3, with a mean value of 2418.4 kg/m
3.
Figure 4.
Unit weight of the developed concrete mixes.
Figure 4.
Unit weight of the developed concrete mixes.
3.3. Testing procedures
3.3.1. Uniaxial compression test
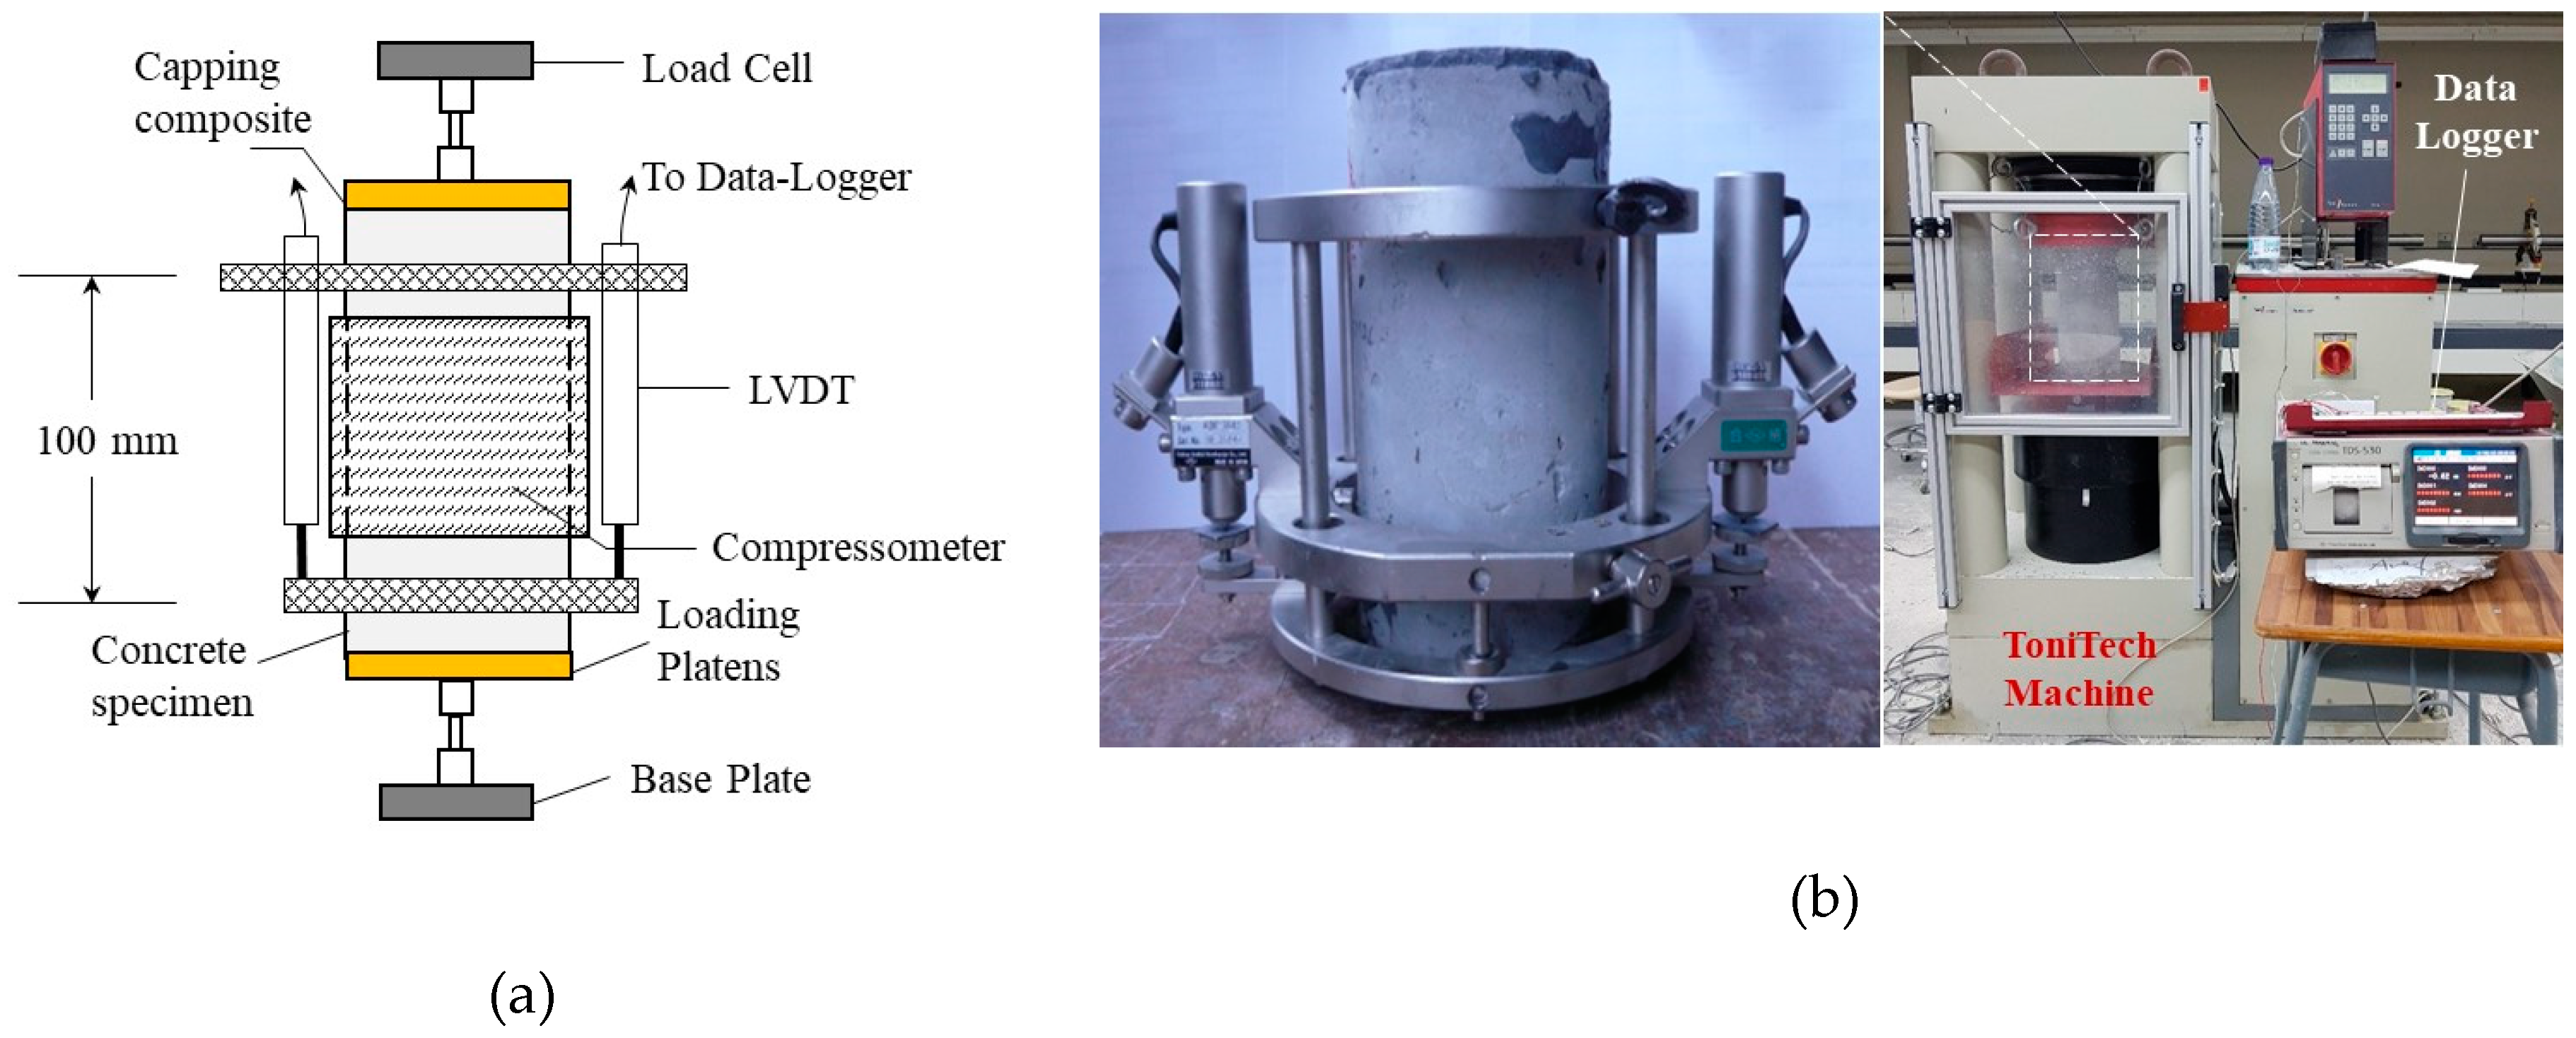
A thin layer of sulfur mortar was applied to the cylindrical specimens before performing the uniaxial compression test. This ensures that the top and bottom surfaces are flat, thus ensuring the load will be equally distributed. In this study, the 28d elasticity modulus and the compressive strength of cement-based materials were assessed according to the specifications of ASTM C469 and ASTM C39, respectively. The test was conducted on a ToniTech universal compression testing machine (capacity 3000 kN, See
Figure 4). Two linear variable displacement transducers (LVDTs) and compressometer rings were attached at approximately 100 mm (the center height of the samples) to quantify in-plane and transverse strains. The loading conditions in this study were displacement- and load-controlled (i.e., 2.5×0
-3 mm/s and 0.25×MPa/s respectively). We conducted the measurements for two or three duplicates of the compression test samples in order to ensure reliability, while the mean result is reported.
Figure 4.
The uniaxial compression test: (a) schematic diagram and (b) testing setup.
Figure 4.
The uniaxial compression test: (a) schematic diagram and (b) testing setup.
3.3.2. Rapid chloride-ion permeability test
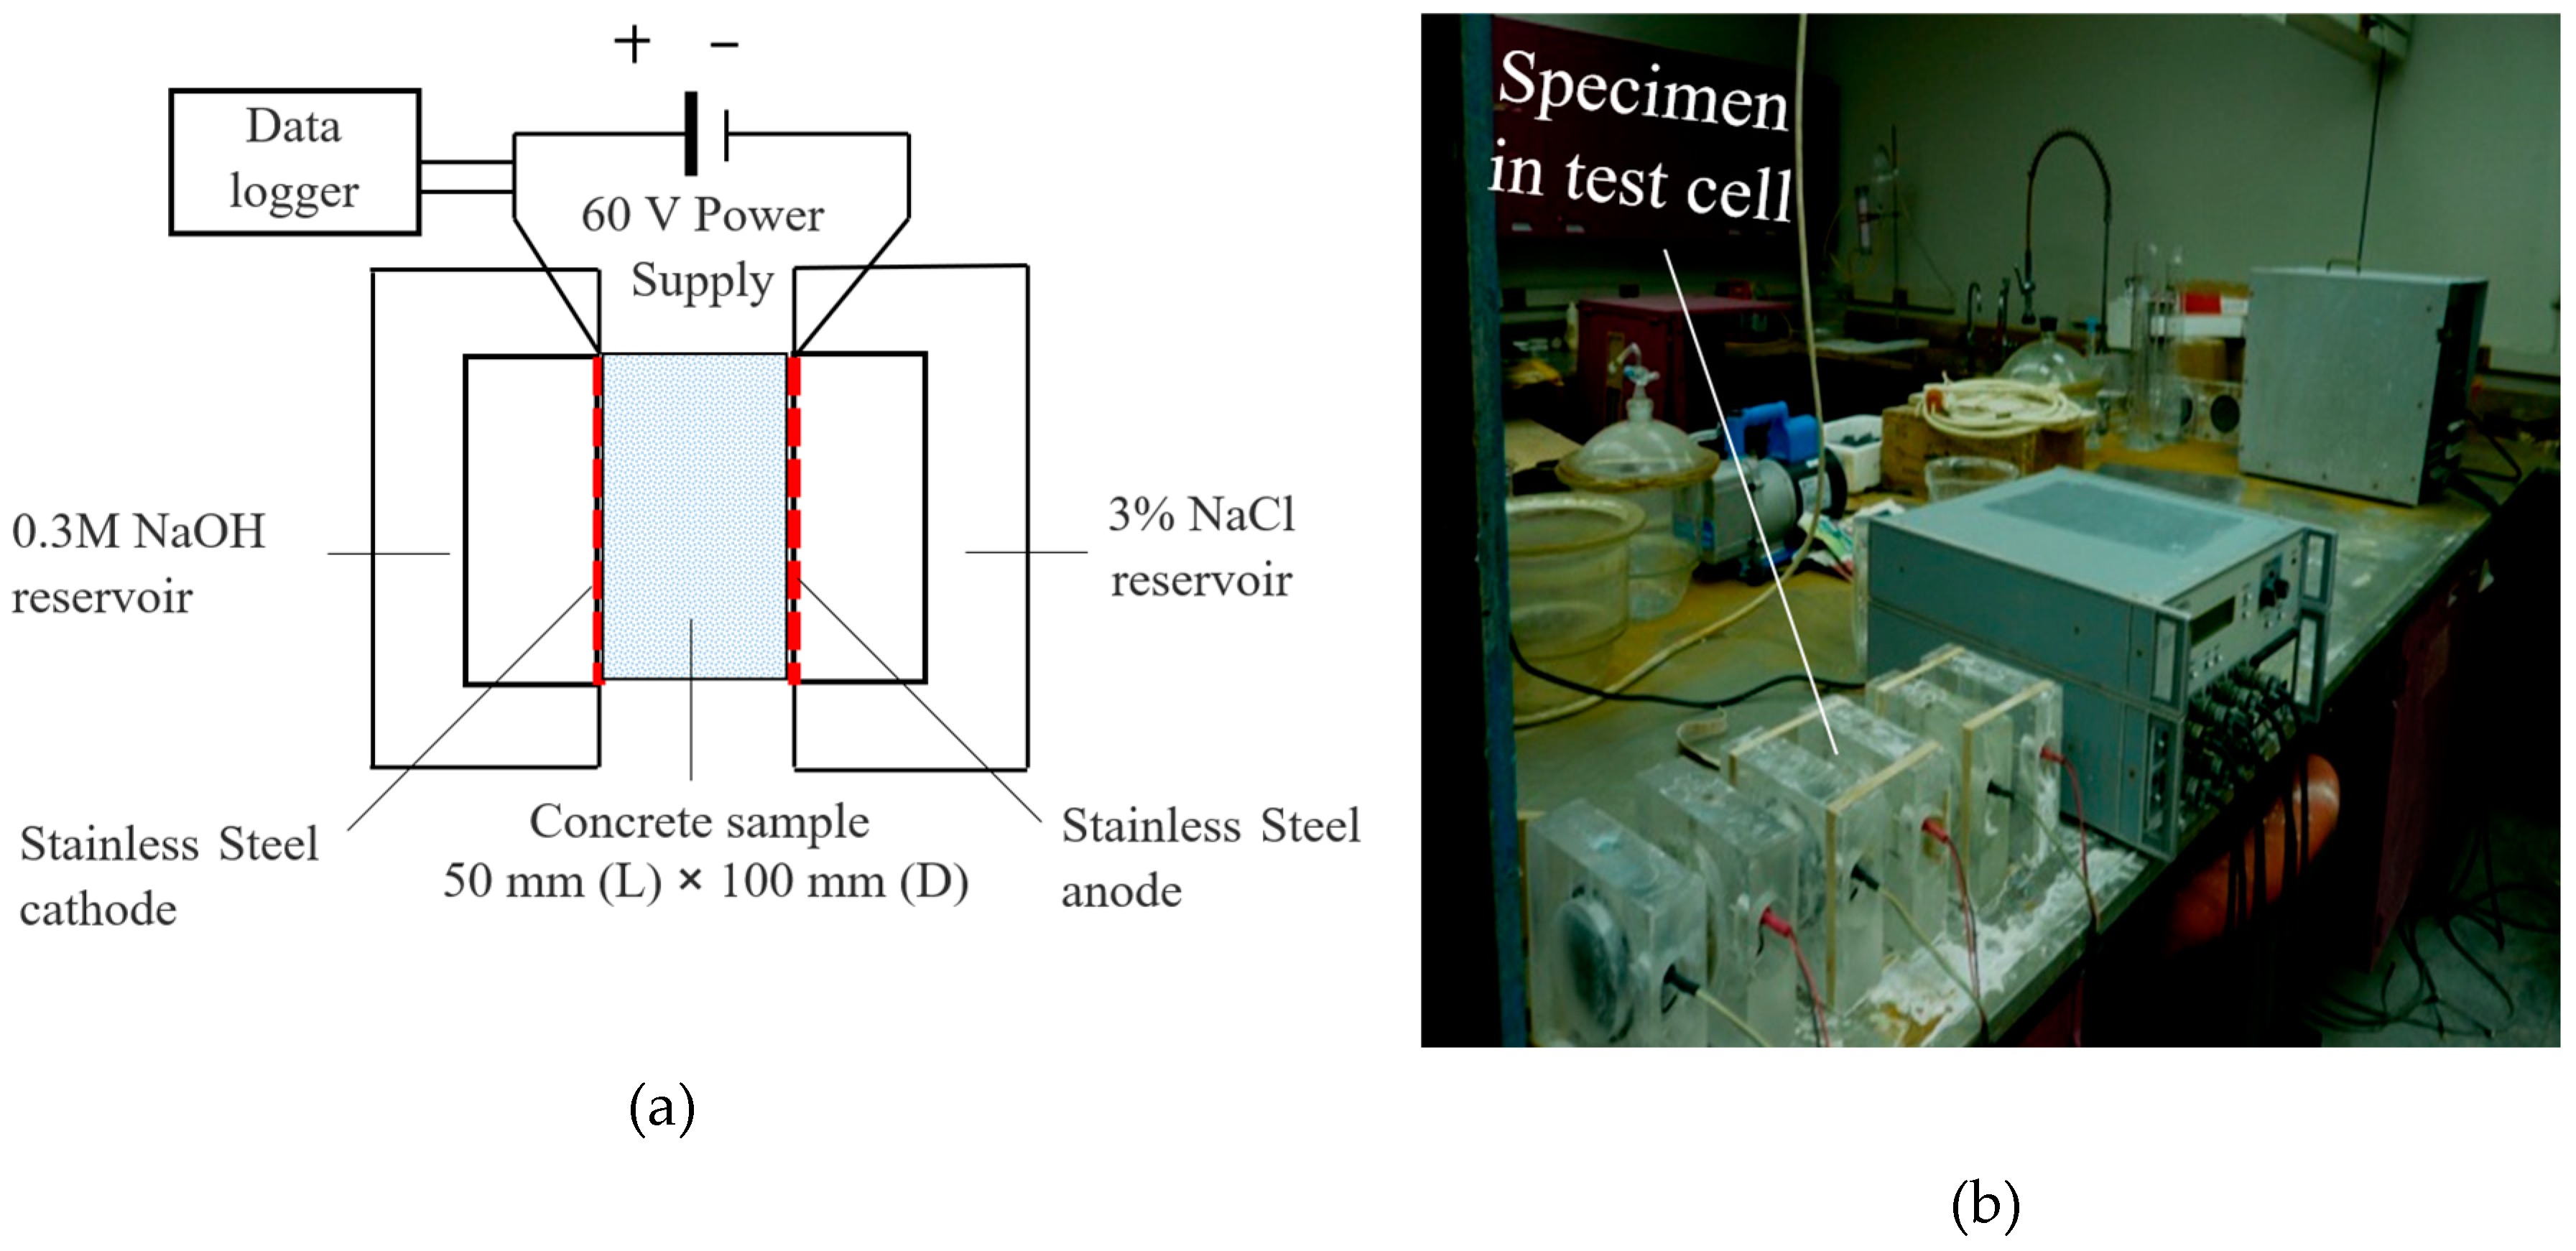
Following ASTM C1202, we performed a chloride permeability test on concrete cylinders with diameters of 50 mm and lengths of 100 mm. As recommended by RELIM [
49], these cylindrical concrete samples were vacuum-soaked to maintain continuous saturation levels. In terms of analyzing diffusion characteristics, the chloride permeability test does not provide an accurate measure of these characteristics [
32]. Nevertheless, this test can be used to examine parametric data in the context of this study.
Figure 1 illustrates how concrete cylinders are filled with chloride before the test is conducted in order to measure the concrete's chloride permeability. We conducted the measurements on two or three duplicates of the chloride permeability sample in order to ensure the reliability and repeatability of the results of this study.
Figure 5.
Rapid chloride-ion permeability test: (a) schematic diagram and (b) testing setup.
Figure 5.
Rapid chloride-ion permeability test: (a) schematic diagram and (b) testing setup.
3.3.3. Porosity test
In this study, concrete's porosity was evaluated in accordance with RILEM CPC 11.3. To accomplish this test, a disc concrete specimen (100 mm diameter with 50 mm height) was dried at 100 ±5
oC until a constant weight was obtained. We placed dried concrete samples under a vacuum in a desiccator for three hours, then immersed them in de-aired distilled water for another hour, followed by an additional immersion in the desiccator. Accordingly, we were able to calculate the porosity of concrete as a result of Eq. (1).
Where,
is the mass of water-saturated concrete specimen in air,
is a mass of the oven-dried concrete specimen,
is the mass of the concrete specimen in water.
4. Results and discussion
The results of the experiments conducted in this study are summarized in
Table 6. In the following sections, we will discuss the results of the experiment in more detail.
4.1. Strength characteristics
4.1.1. The 28d compressive strength of SF and MQ concrete
Figure 7 and
Figure 8 illustrate the influence of MQ and SF on the 28d compressive strength of concrete mixes developed with a variety of water-binder ratios (0.25, 0.30, 0.35, and 0.40).
Figure 7 shows that compression strength was almost unaffected with ultrafine replacement rated at less than 10% in the concrete matrix regardless of the water-cement ratio. We also noticed that compressive strength increased slightly when 8% of cement was replaced with ultra-fine material. The 28d's compressive strength decreases, however, if the ultrafine dosage reaches 10% or more. In the presence of increasing water-binder ratios, this decrease in compressive strength becomes more apparent. In the case of the 0.4 water-cement ratio, the 28d strength was reduced by 10, 16, 24, and 28% for MQ replacement levels of 10, 15, 25, and 35%, respectively. A lower level of pozzolanitivity in the MQ may explain this reduction in compressive strength. The presence of micro-packing effects could explain the lack of reductions or even slight increases at low MQ doses. A noteworthy aspect of this conclusion is that it corresponds to the conclusions of other researchers [
50,
51,
52,
53,
54].
Typically, silica fume is used to enhance the properties of cement-based materials; therefore, it is used predominantly in high-performance concrete due to its fineness and pozzolanic reaction.
Figure 8 illustrates the 28d compressive strength of concrete has been increased by the addition of 8, 10, and 12% SF for four different ratios of water–binders (0.25, 0.3, 0.35, and 0.4). The compressive strength increased by 2, 5, and 9% with SF replacements of 8, 10, and 12% at a water-binder ratio of 0.25. Further, when cement was replaced by SF at a dosage of 8, 10, and 12% at a water-cement ratio of 0.3, the increase in compressive strength was 3, 5, and 11%. The compressive strength was increased by 6, 7, and 12% when SF was substituted for cement at dosages of 8, 10, and 12% using a water-binder ratio of 0.35. Further, the compressive strength was significantly boosted by 8.5, 11, and 18% when SF was substituted for cement at dosages of 8, 10, and 12% using a water-binder ratio of 0.4. There have been several studies stating that concrete strength can increase by 30 to 100% depending on many factors such as mix type, cement type, SF dosage, superplasticizer, aggregates, and curing regime [
55,
56,
57,
58]. In concrete, SF particles improve packing by filling in the spaces between the particles. In the same way, and fills gaps between coarse aggregates when it is mixed with cement. These findings showed that the maximum 28d strength of concrete (18%) was obtained with 12% SF and 0.4 water-binder ratio. As the water-binder ratio increases, the incorporation of SF appears to be more effective at enhancing concrete strength. The higher the water-binder ratio, the more porous the concrete becomes, which makes SF an extremely valuable component of increasing strength due to its micro-filling effect. It is true that concrete that has a low water-binder ratio, like that of 0.25 or 0.30, is pretty compact, but the fine particles still contribute to the strength of the mix. The major role the SF would play in a scenario like this would be to enhance the flowability of the concrete during its plastic phase. It has been scientifically proven that filling the spaces between cement grains occurs whenever there is sufficient SP available to counteract the electrostatic forces between the particles of cement [
59,
60].
4.1.2. A modified ABRAM’s model for SF and MQ concrete
In the second decade of the 20th century, Abram [
61] developed a relationship between the compressive strength and water–cement ratio of normal Portland cement concrete are related (Eq (1), where
and
[
62,
63]. The development of this relationship was considered a significant step in concrete technology [
62]. There are a number of factors that contribute to the strength of concrete. The factors are classified by Newman [
57] into three categories: (i) properties and ingredients of constituent materials, (ii) curing system, and (iii) testing parameters. In order to understand how concrete responds to stress, various factors must be understood. It is therefore essential to formulate an exact formula for the prediction of the compressive strength of any modified concrete in order to determine its strength. In the present study, a modification factor (
) is introduced into Abram's formula [Eq (2)]. This modification factor was calculated using the most closely fitting experimental data for all mixtures.
Where,
|
the concrete's compressive strength at a certain age (here, considered 28d). |
|
the empirical-based factors reflect the effects of individual constituent materials, the curing system, testing parameters, and the age of concrete. |
|
the water–binder ratio. |
Figure 9 shows the prediction capacity of the proposed formula [Eq. (2)] for the water–binder and 28-day compressive strength of MQ and SF concrete’s strength relations. The alpha value for the MQ concrete was determined to be 1.32, whereas the alpha value for the SF concrete was determined to be 1.60.
Figure 9a illustrates that most MQ concrete points fall within the error range of ±15%, in contrast to Abram's formula [Eq. (1)] which underestimated concrete strength. In addition,
Figure 9b reveals that SF concrete data points fall within the ±5% error band of the proposed model, while Abram's distinctly underestimates it.
4.1.3. The age-dependent compressive strength
A number of factors determine the age-dependent strength of concrete, namely the type of cement used, the type of admixtures used, the water-binder ratio, and weather conditions [
64]. The relationship for strength as a function of time assumes moist curing and normal temperature (20
°C). Assuming a constant water–binder ratio, it was predicted that higher strength would be achieved by exposing the cement to moist curing conditions for a prolonged period of time since anhydrous cement particles undergo hydration during drying. The strength of the material does not significantly increase with time after moisture is removed by capillaries under air-curing conditions [
65]. After 28 days, silica fume does not significantly increase compression strength (ACI 234-06). The apparent decrease in compressive strength due to the addition of silica fume to concrete over a period of 90 days has been reported in very limited literature [
66].
Based on ACI 234, the impact of testing machines on compressive strength may be the cause of the reduction in strength. In this study, the strength experimental observations at various ages are compared with calculated strengths based on the formulas for time-dependent strength provided by ACI Committee 209 [Eq. (3)] and CEB-
fib-90 mode code [Eq. (4)]. In
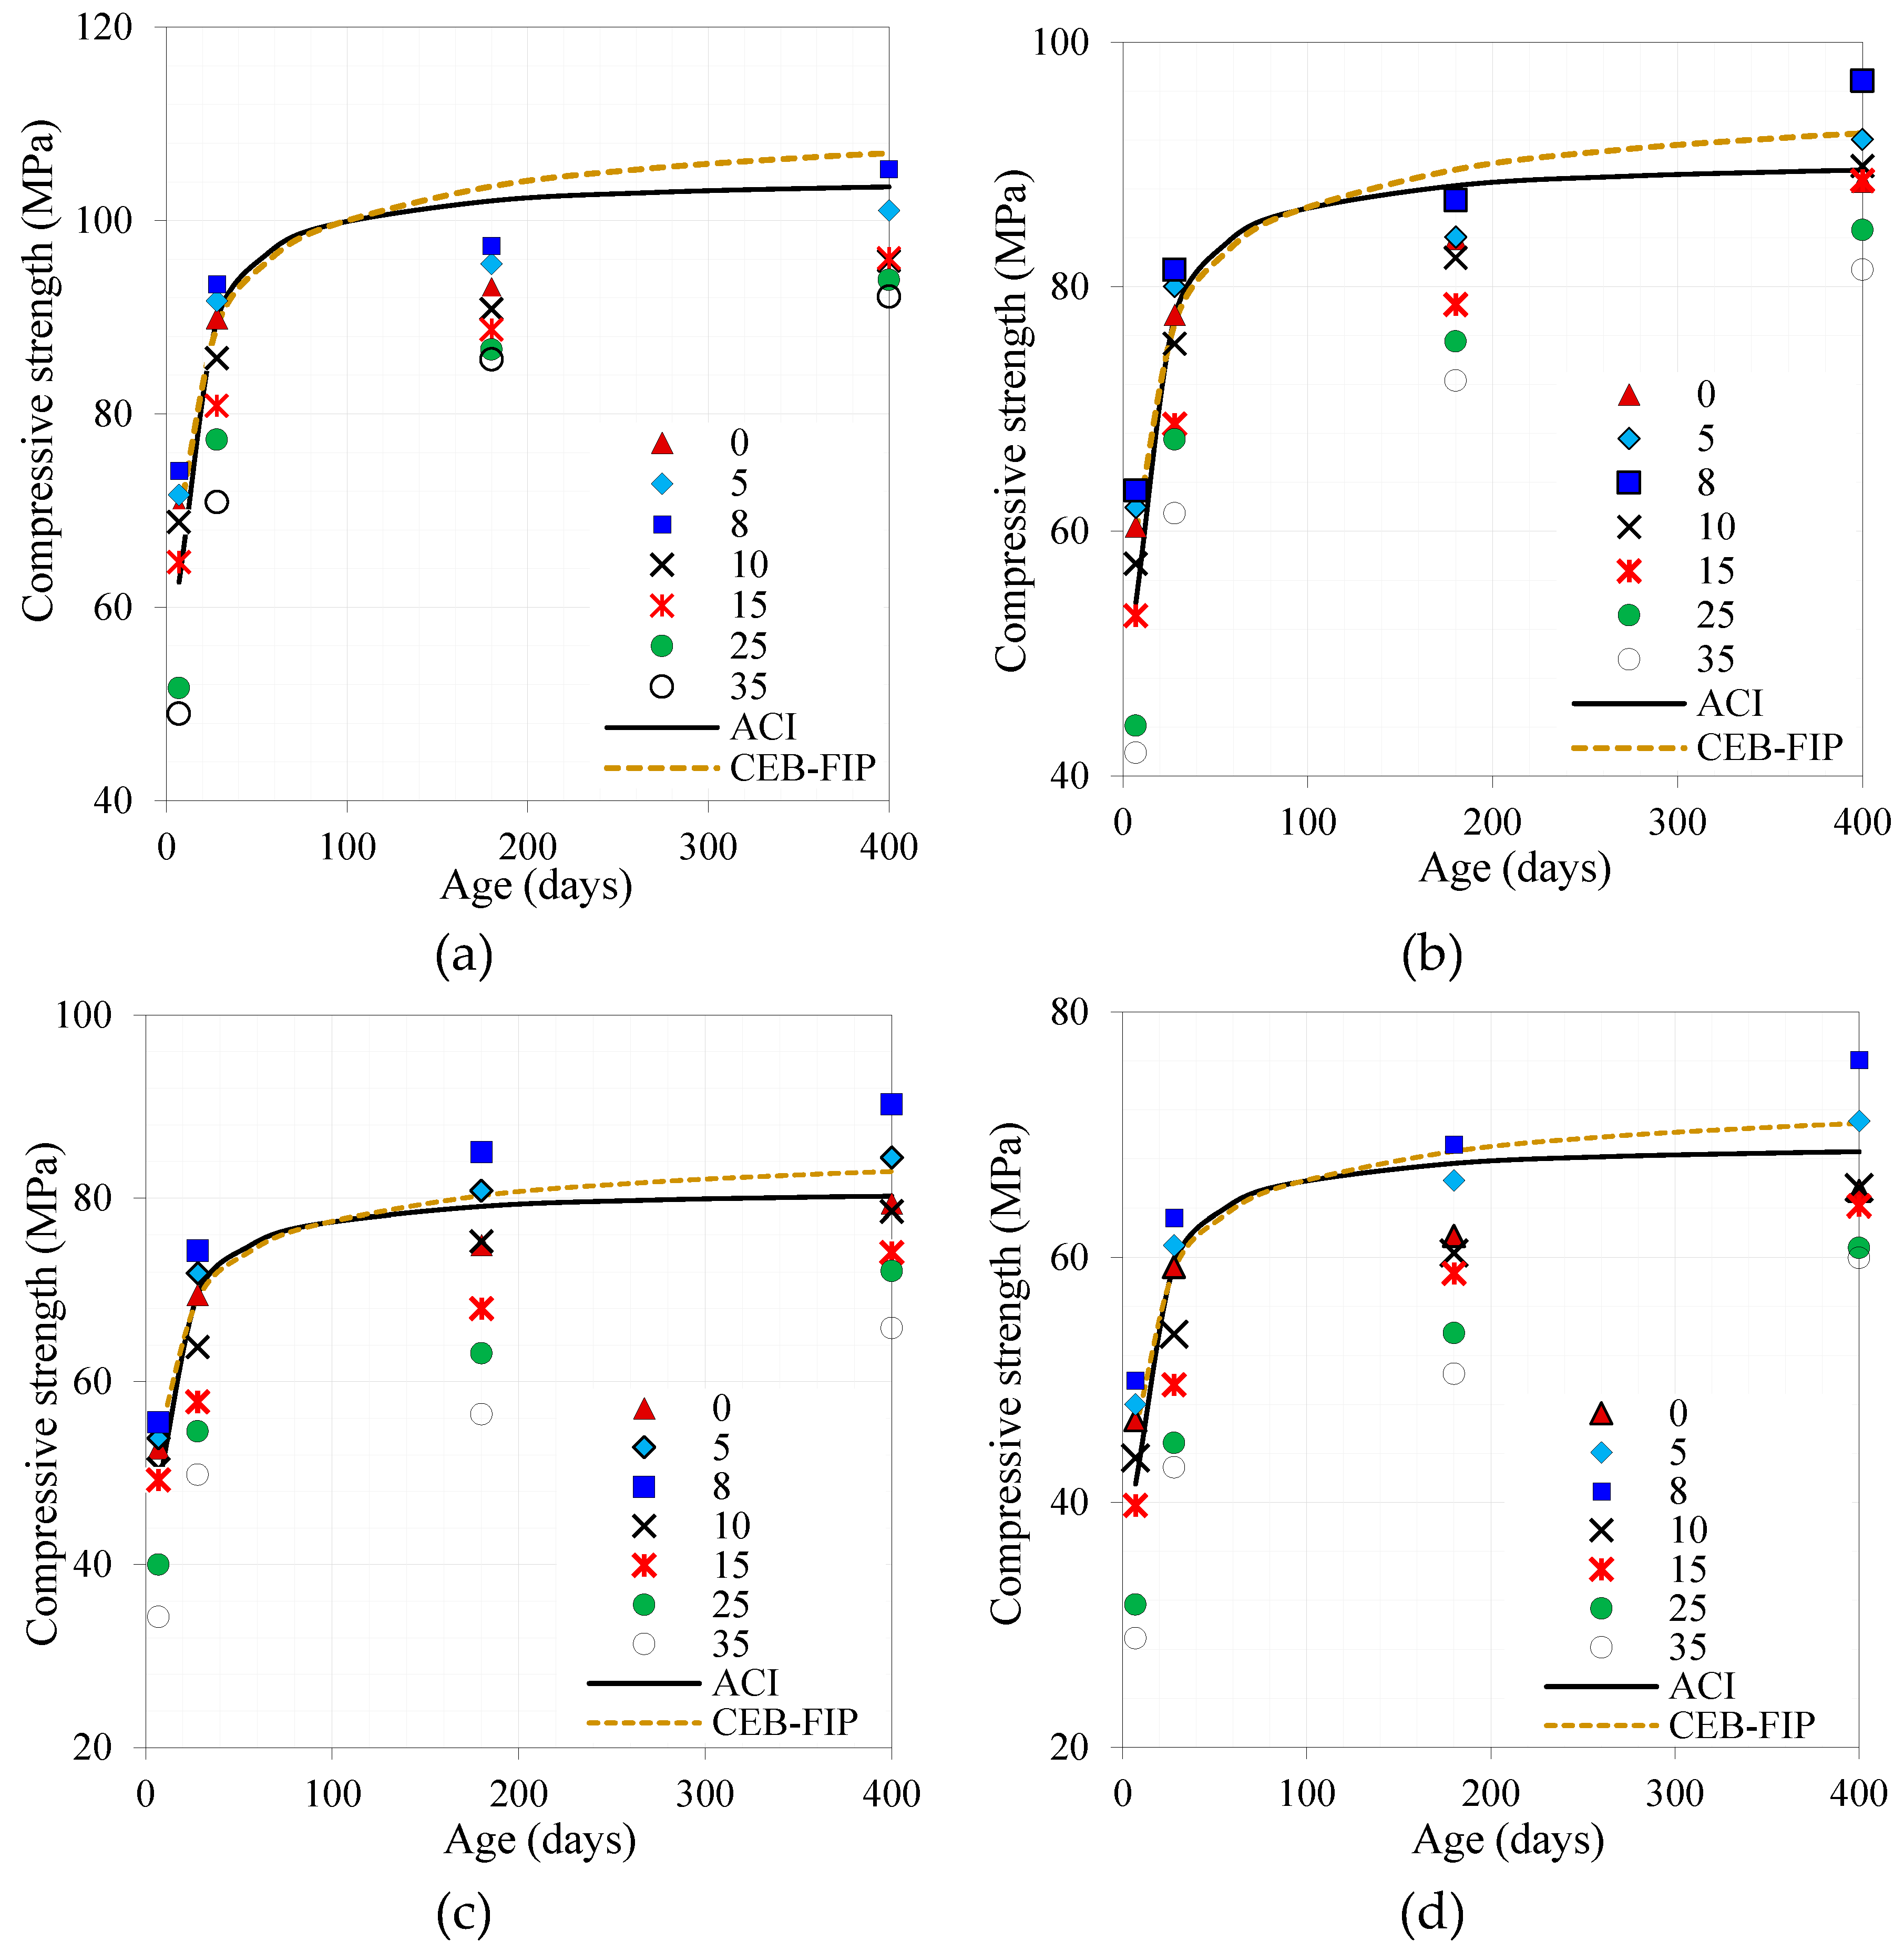
Figure 10, the compressive strength of MQ concrete is illustrated as a function of age. In the course of the curing process, MQ ultrafine is found to have a positive effect on the strength gain of concrete, even at higher MQ doses. As a result of the hydration of anhydrous cement particles and the very slow hydration of ultrafine quartz particles, a rise in compressive strength can be explained. According to
Figure 10, the inclusion of almost 10% MQ ultrafines in concrete did not adversely affect its strength properties. A possible explanation is that ultrafine grain particles have been packed between cement particles in order to achieve maximum compression strength at the micron level. Further, the ultrafine particles provided the greatest increase in compression strength when added to the system later (after 90 days), regardless of the dosage content. At an early stage (up to 28 days) of concrete development, when a water-binder ratio of 0.35 or 0.40 is used [
Figure 10c,d], the concrete's compressive strength decreases with an increased dosage of MQ ultrafine.
Where,
|
: |
mean compressive strength at age t days |
|
: |
A coefficient that depends on the cement type (0.20 for high-early strength, 0.25 for normal hardening, and 0.38 for slow hardening). |
|
: |
1-day. |
The increase in compressive strength beyond 28 days with the control mix with a water-binder ratio of 0.25 appears to be significantly smaller than that predicted by the ACI Committee 209 and CEB-
fib-90 model codes, as illustrated in
Figure 9a. Nevertheless, the ACI-209 and CEB-
fib-90 models calculated more accurately the compressive strength gains for MQ concrete with a 0.30 water-binder ratio [
Figure 9b].
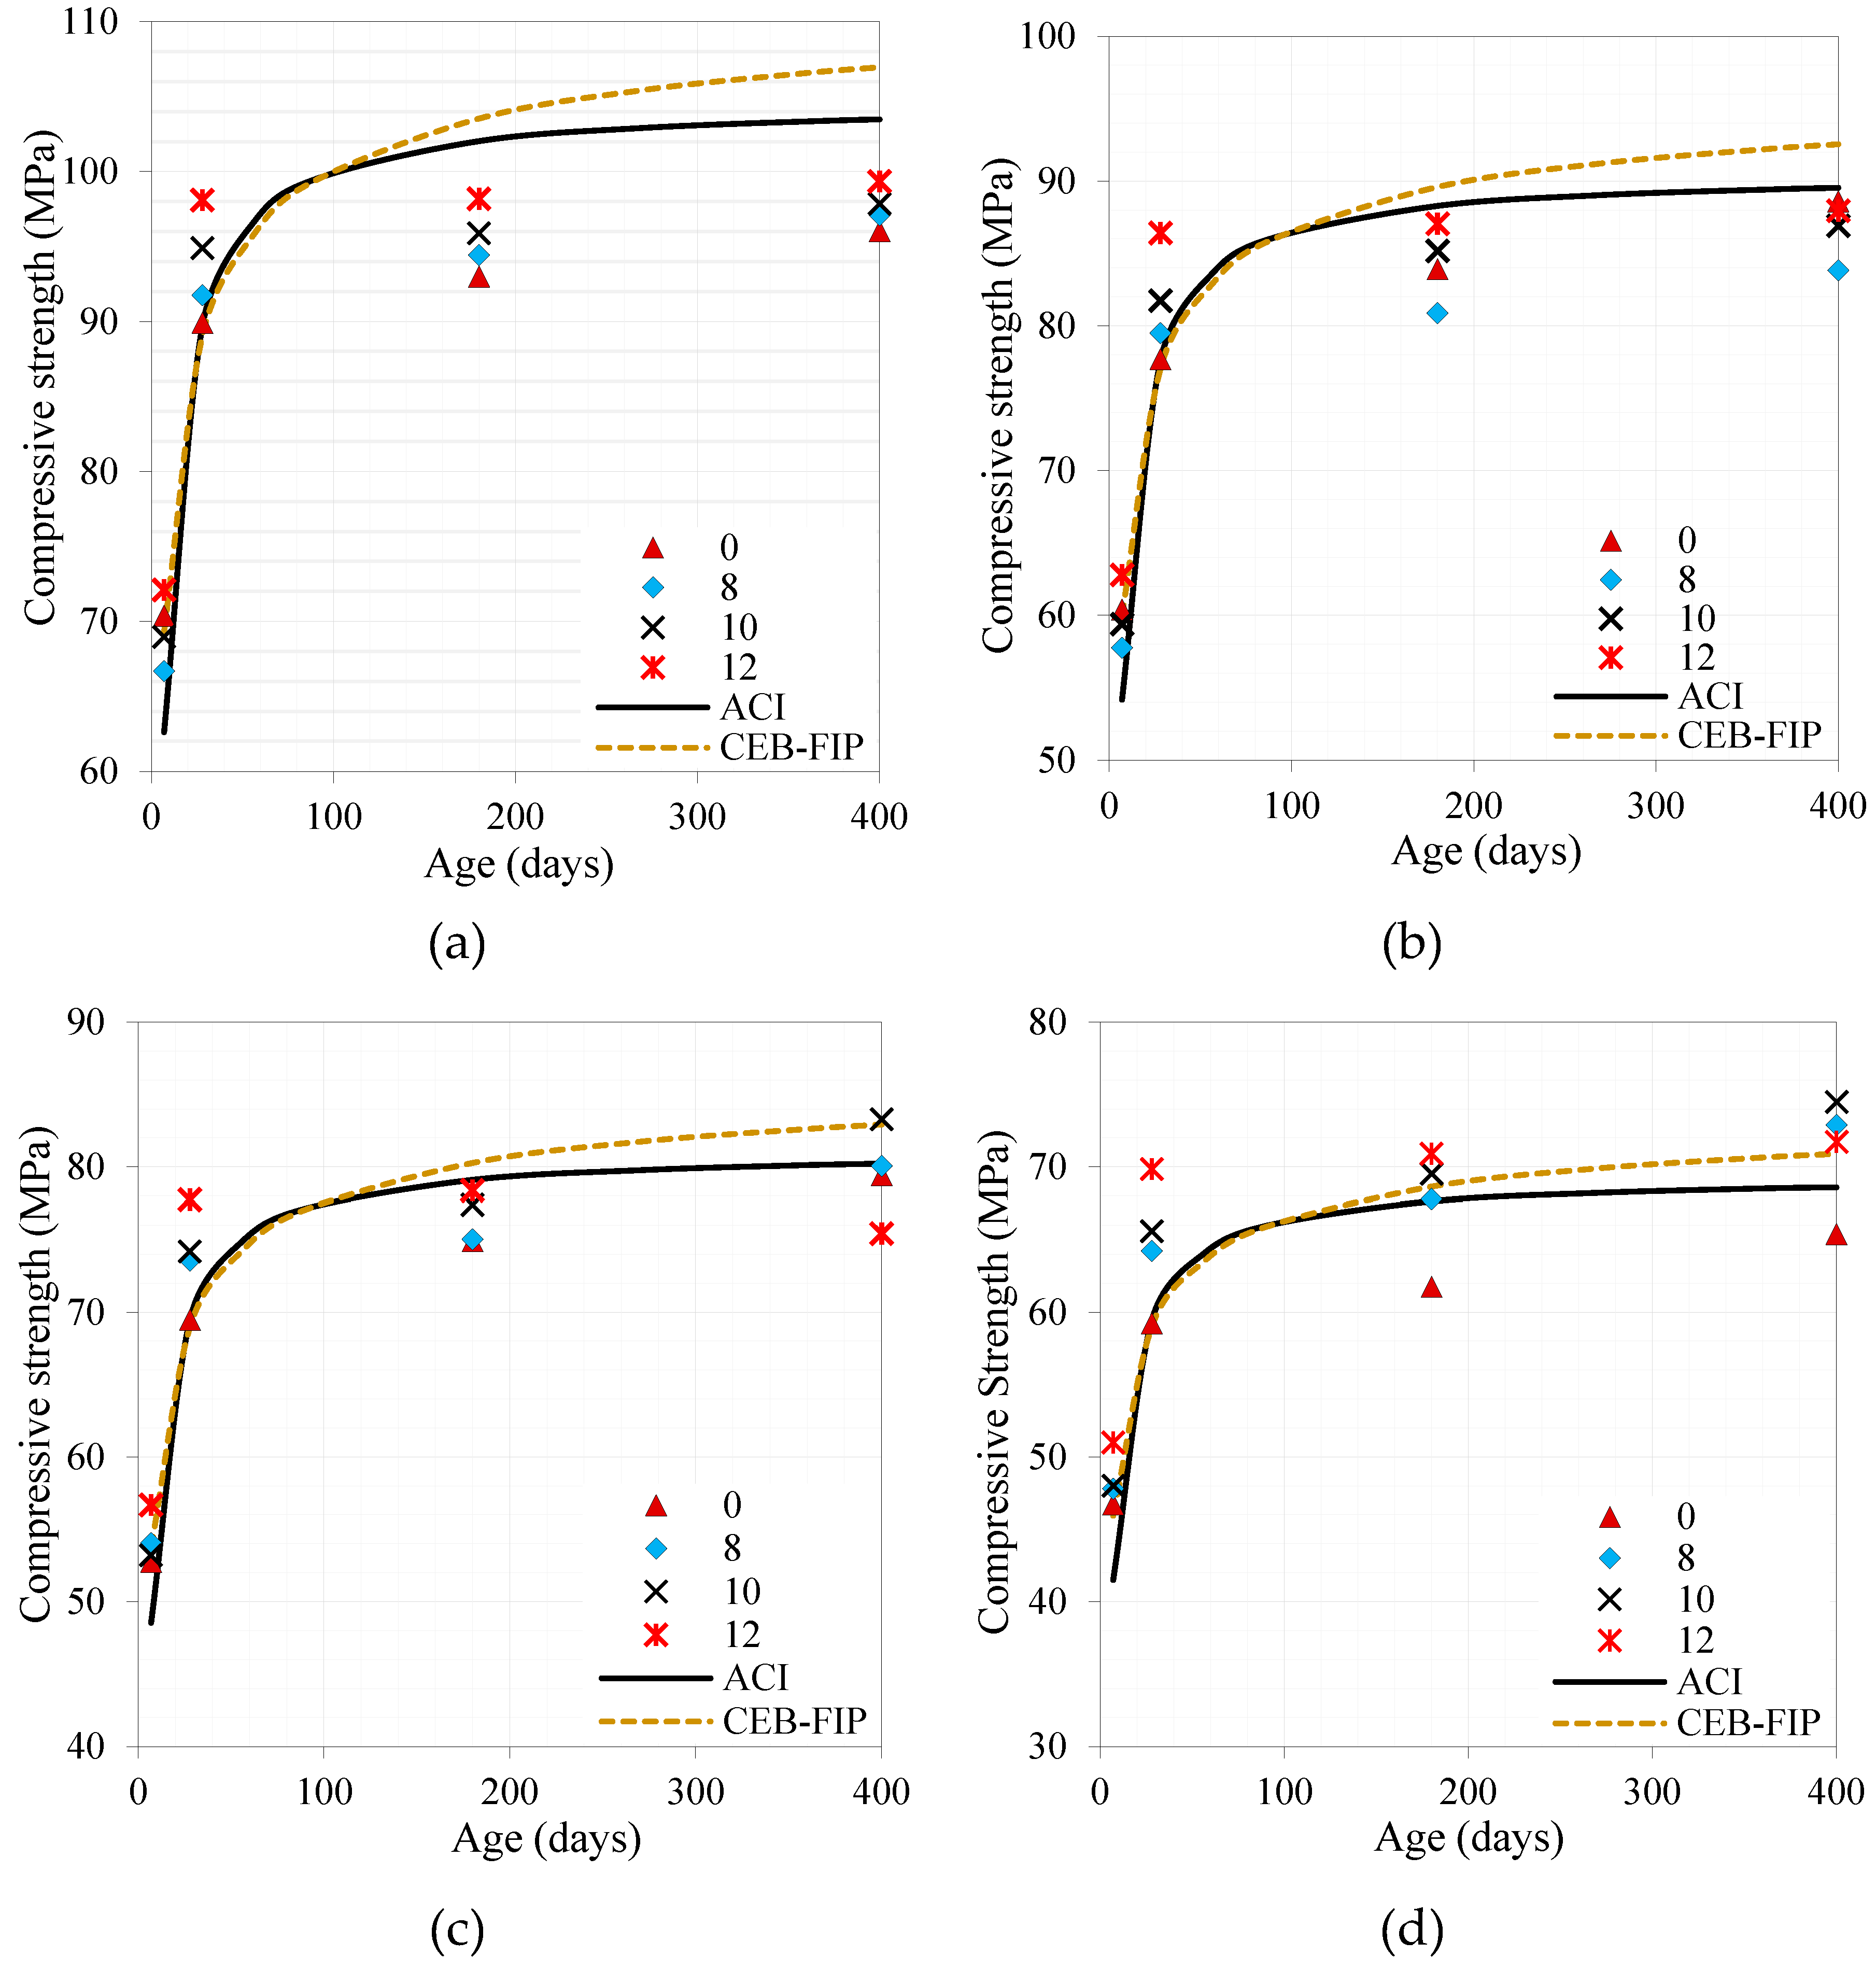
Figure 11 shows a plot of the development of the compressive strength of SF concrete with a variety of water-binder ratios. As shown in the figure, the replacement of cement with SF has resulted in a significant increase in the early-age strength of concrete compared to control concrete. In the early stages of SF replacement, strength increases may be attributed to (i) a tighter packing of the particles at the micro-scale, and (ii) a chemical reaction between SF and the cementitious matrix. Further, the ACI-209 and CEB-
fib-90 predicted the strength of control mixtures nearly perfectly at ages up to 28 days. Nevertheless, at an early age, the compressive strength of SF concrete was higher than that predicted by ACI-209 and CEB-fib-90. Additionally, the compressive strength did not show a significant improvement with aging and was lower than that of the ACI-209 and CEB-FIP models. Several studies [
67,
68,
69] indicate that many major cement hydration processes occurred during the early stages of cement formation (up to 24 h), which may explain the phenomenon.
In
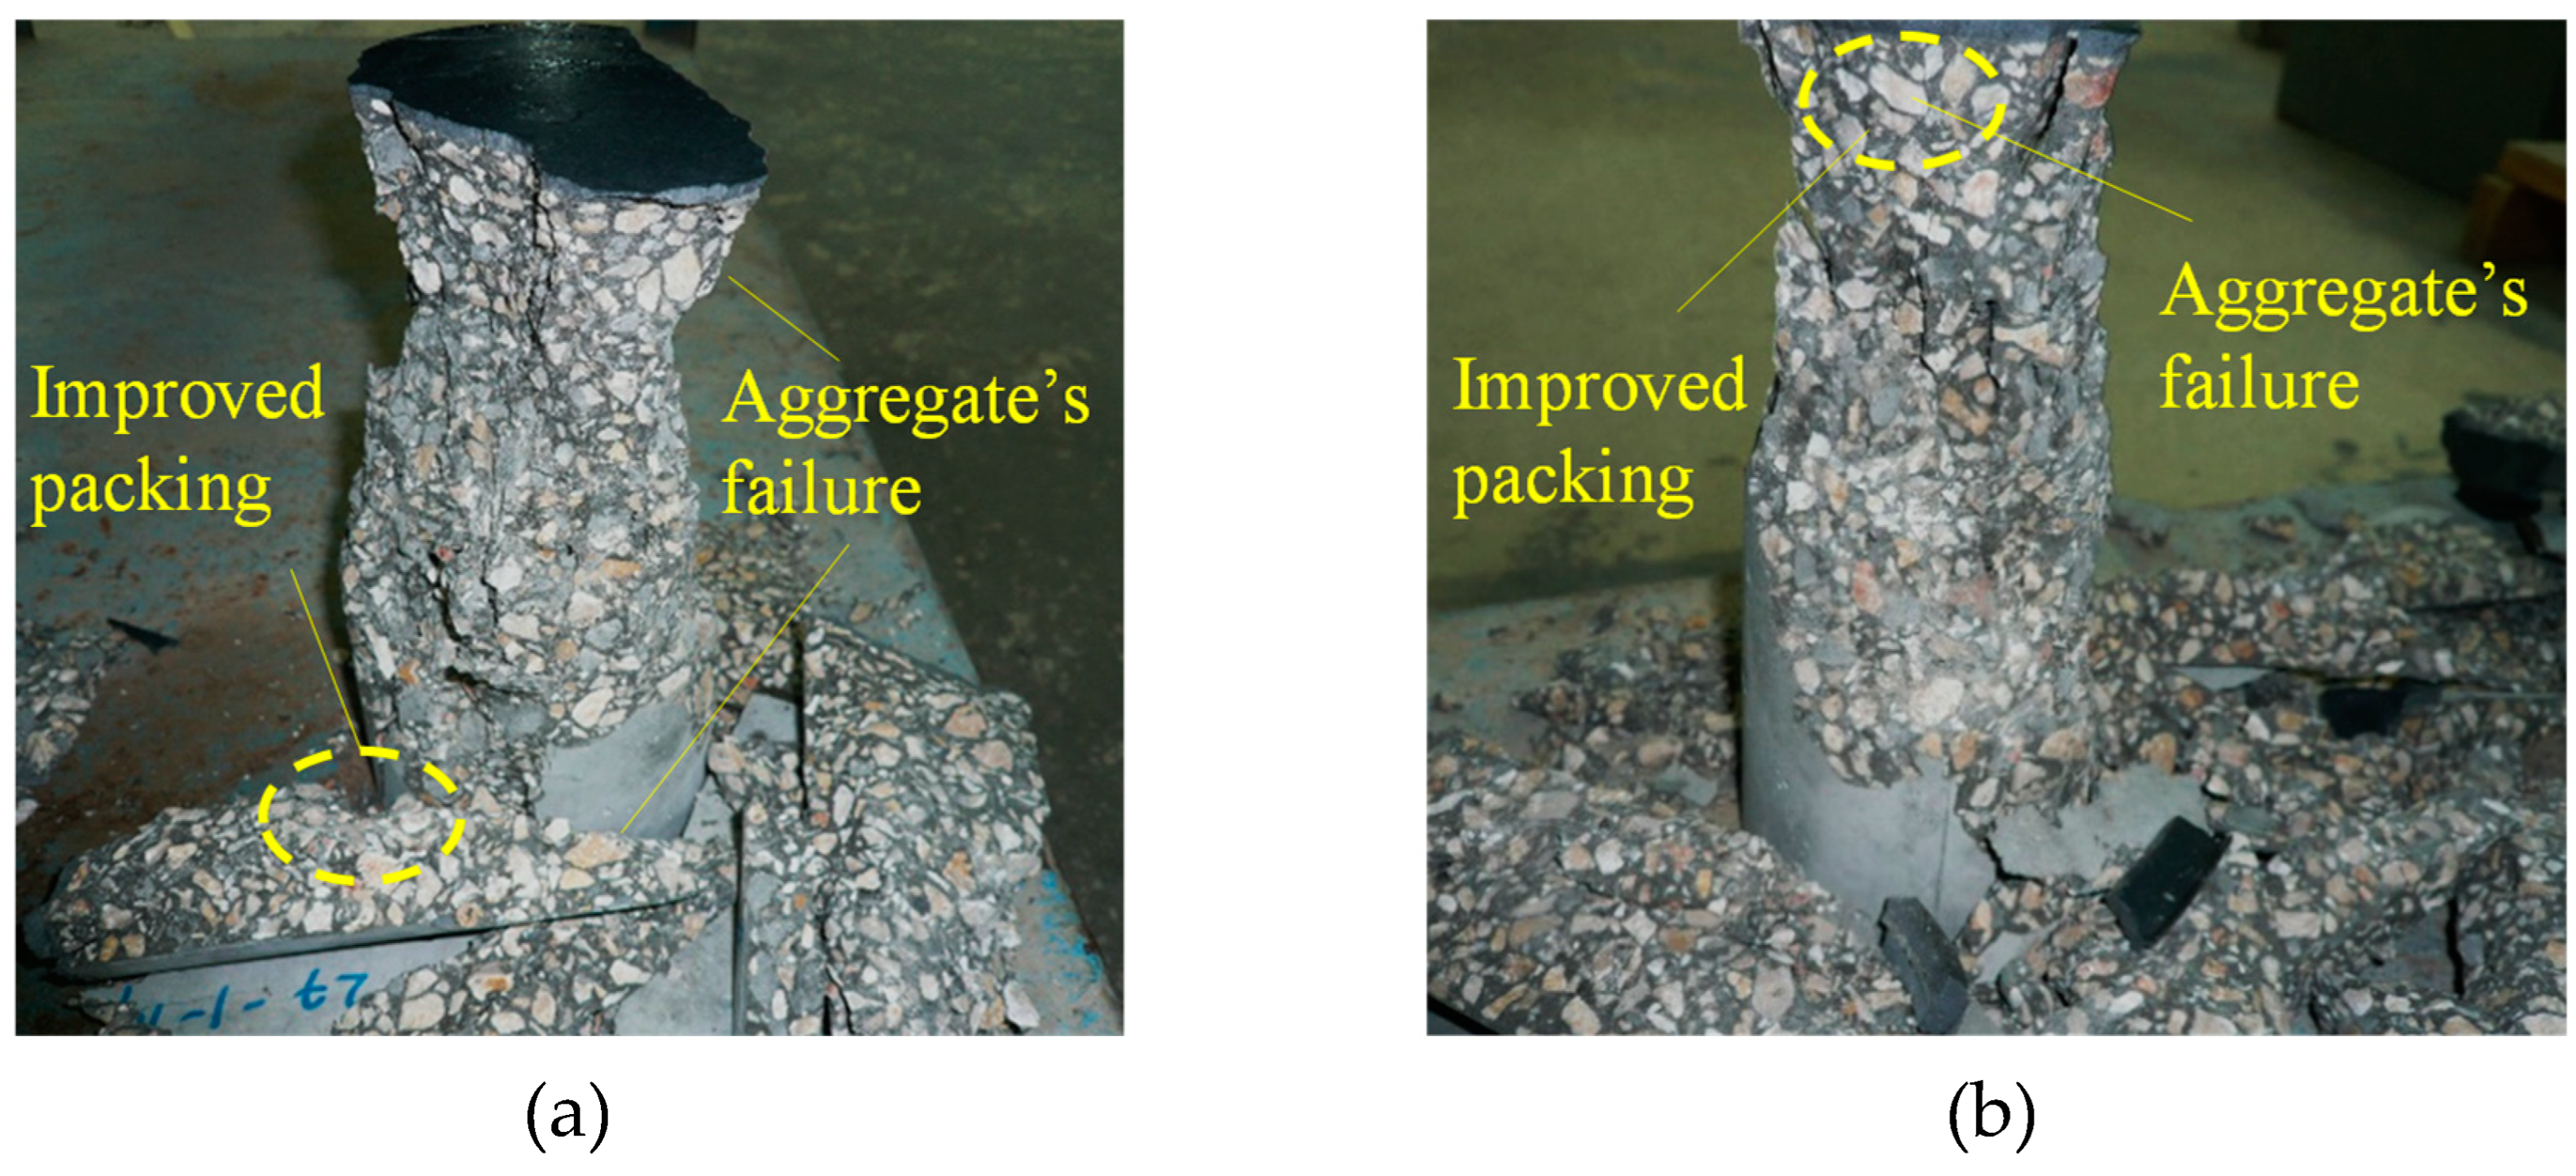
Figure 11, the replacement of cement with MQ and SF ultrafines led to increased compressive strength, indicating a better paste micro-structure, which was apparent from the failure pattern. A typical mode of failure was aggregate fractures, regardless of the water-binder ratio. The paste-aggregate with a lower water-cement ratio was more resistant to loading due to stronger bonding and more compacted interfacial transition zones.
4.2. Durability characteristics
4.2.1. The chloride-ion permeability
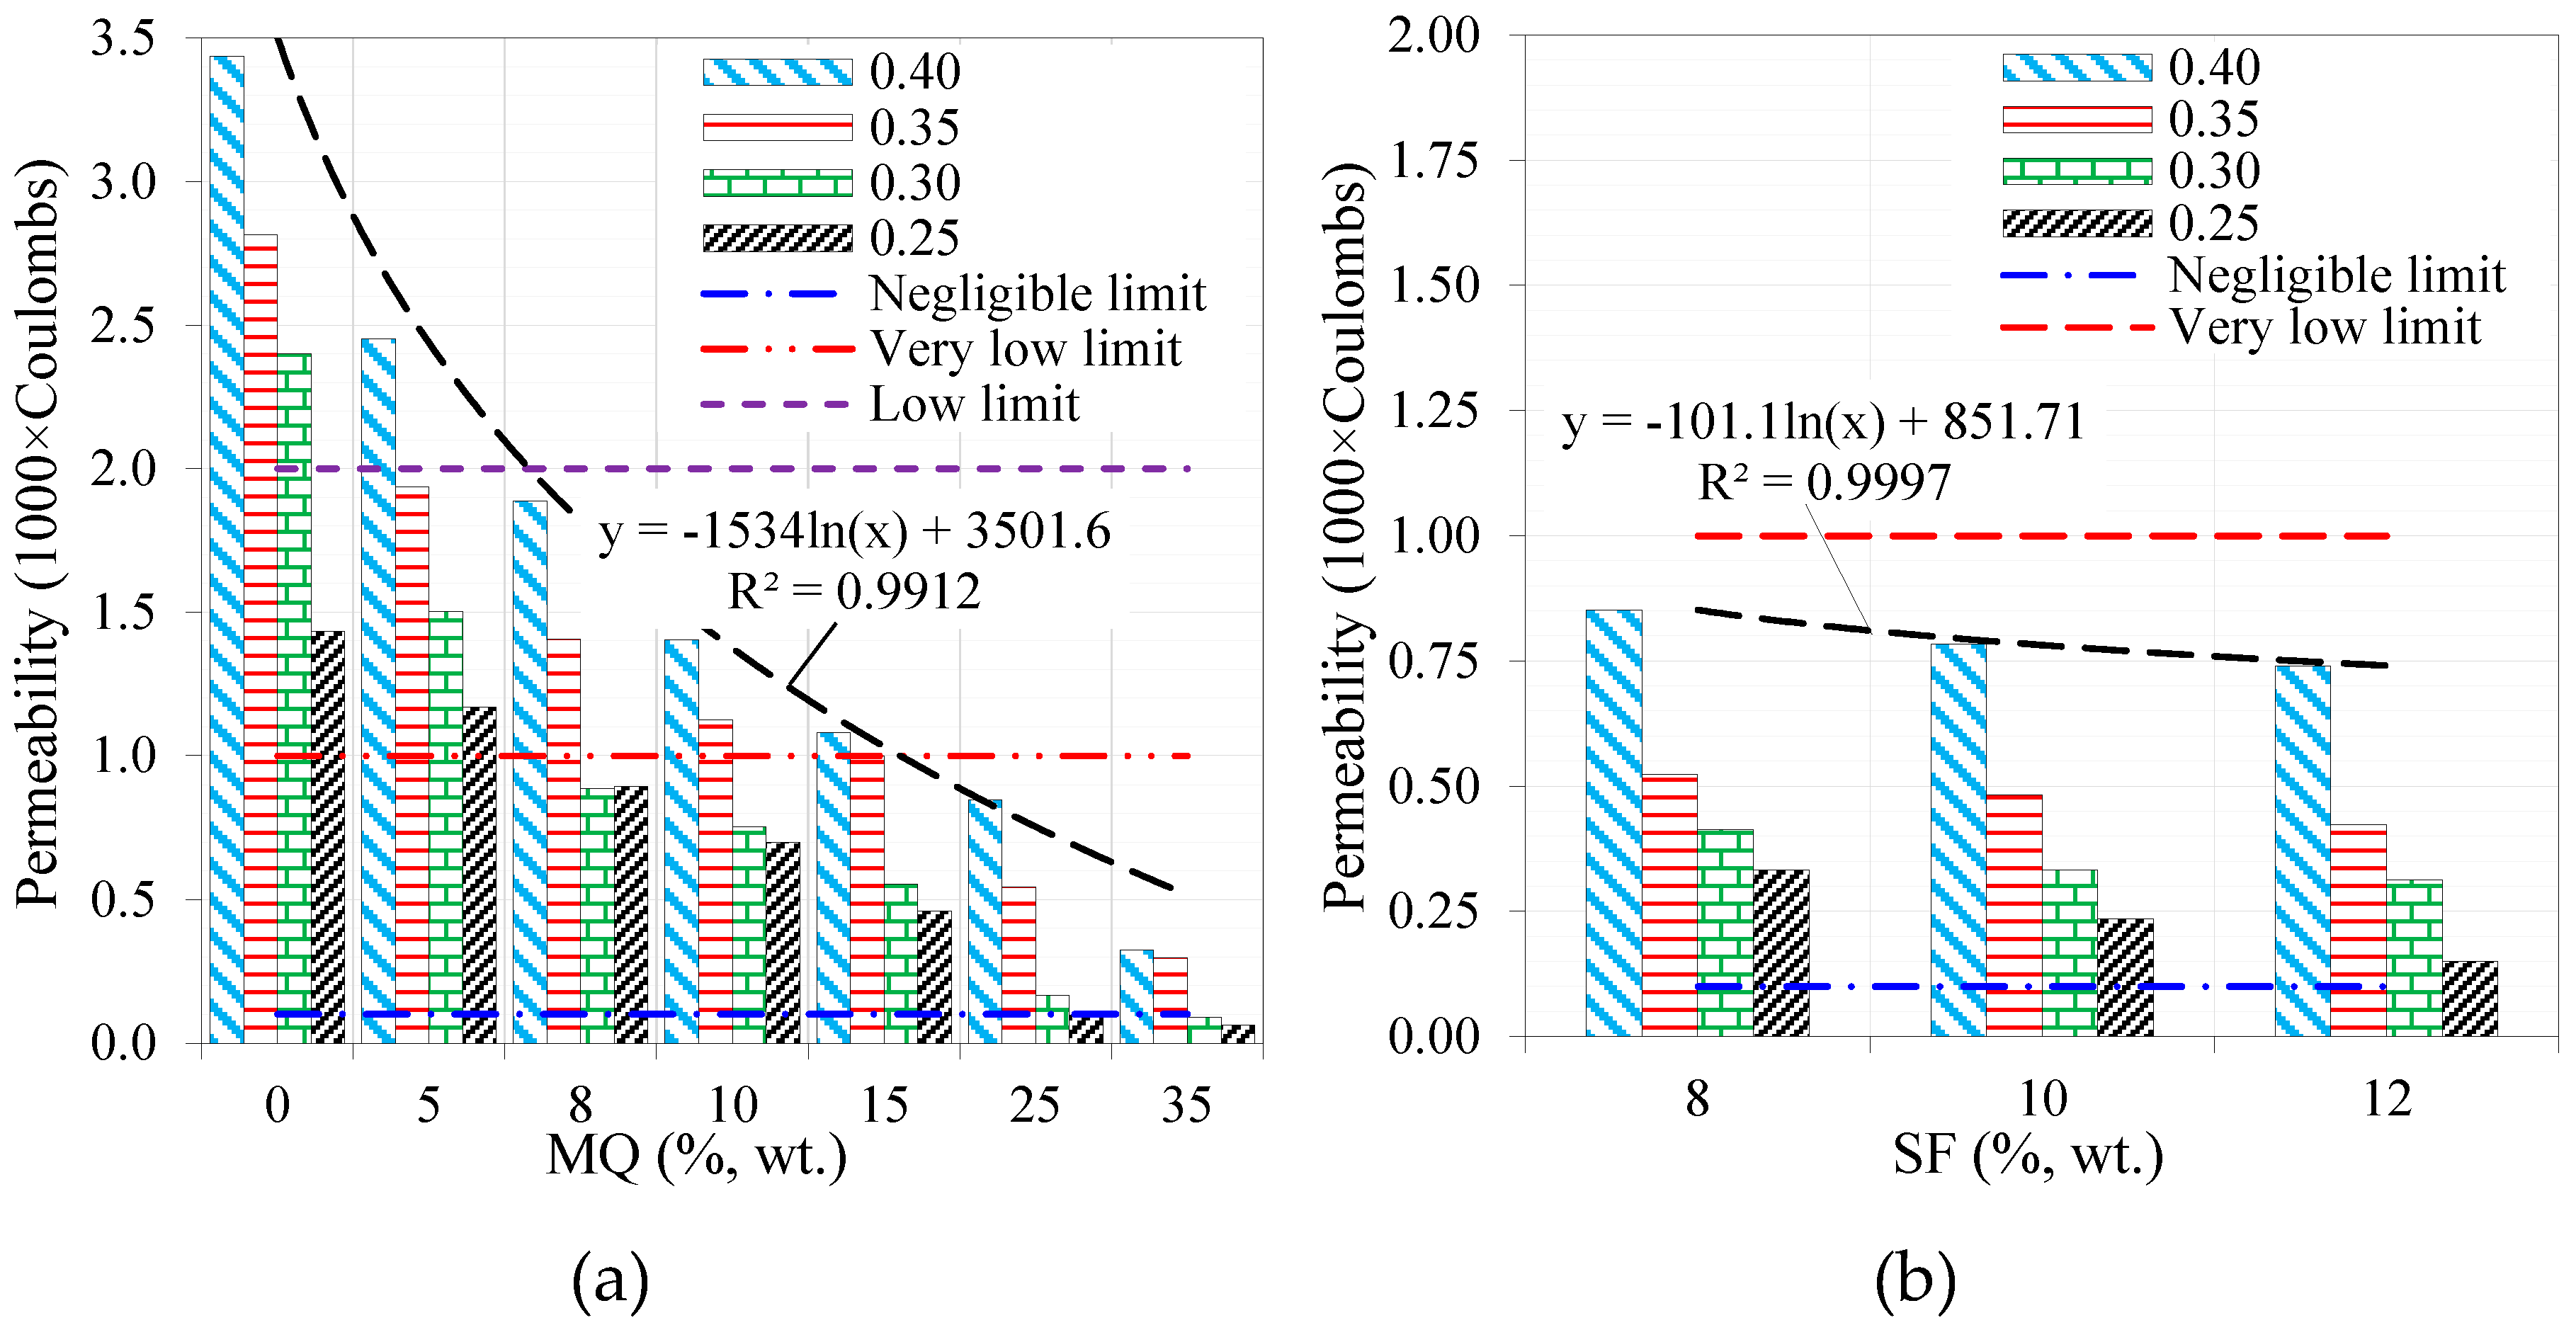
Figure 13 shows the impact of MQ and SF ultrafines on chloride-ion penetration of concrete using different water–binder ratios (0.25–0.40). The ASTM 1202 limits of ion transmission are also shown in the figure to illustrate the range of materials through which chloride ions can be transmitted. The figure shows that the passage of charge through the matrix has been significantly reduced by increasing the ultrafine dosage. The result can be explained by the filling of pores between cement particles with ultrafine materials, which facilitate enhanced packing of the matrix, resulting in a significant reduction in permeability. Further, using 8% MQ ultrafines as a matrix, the passing charge through concrete has been reduced to below the “low limit” for all water-binder ratios. The charge passing through concrete material was lower than the “very low” limit at the water-binder ratio of 0.3 and with 8% MQ ultrafines. Additionally, 15% MQ ultrafines added to concrete resulted in "very low" concrete permeability, regardless of the water-binder ratio. The permeability of concrete and the dosage of MQ generally follow a logarithmic function, as shown in
Figure 13a.
Moreover, a significant reduction in the passing charge through the matrix occurred after the addition of SF was observed in
Figure 13b. In all water-binder ratios, adding 8% SF resulted in passing charges through concrete below ASTM 1202's "very low" limit. In addition to being capable of micro-filling concrete, SF also enhances the microstructure of concrete and makes it dense as a result of its pozzolanic reaction. The results of other studies investigated the pozzolanic effects of SF confirmed this improvement in the microstructure [
70,
71,
72,
73]. Moreover, the permeability of concrete did not improve significantly with an increase in SF dosage from 8 to 12%.
4.2.2. The porosity
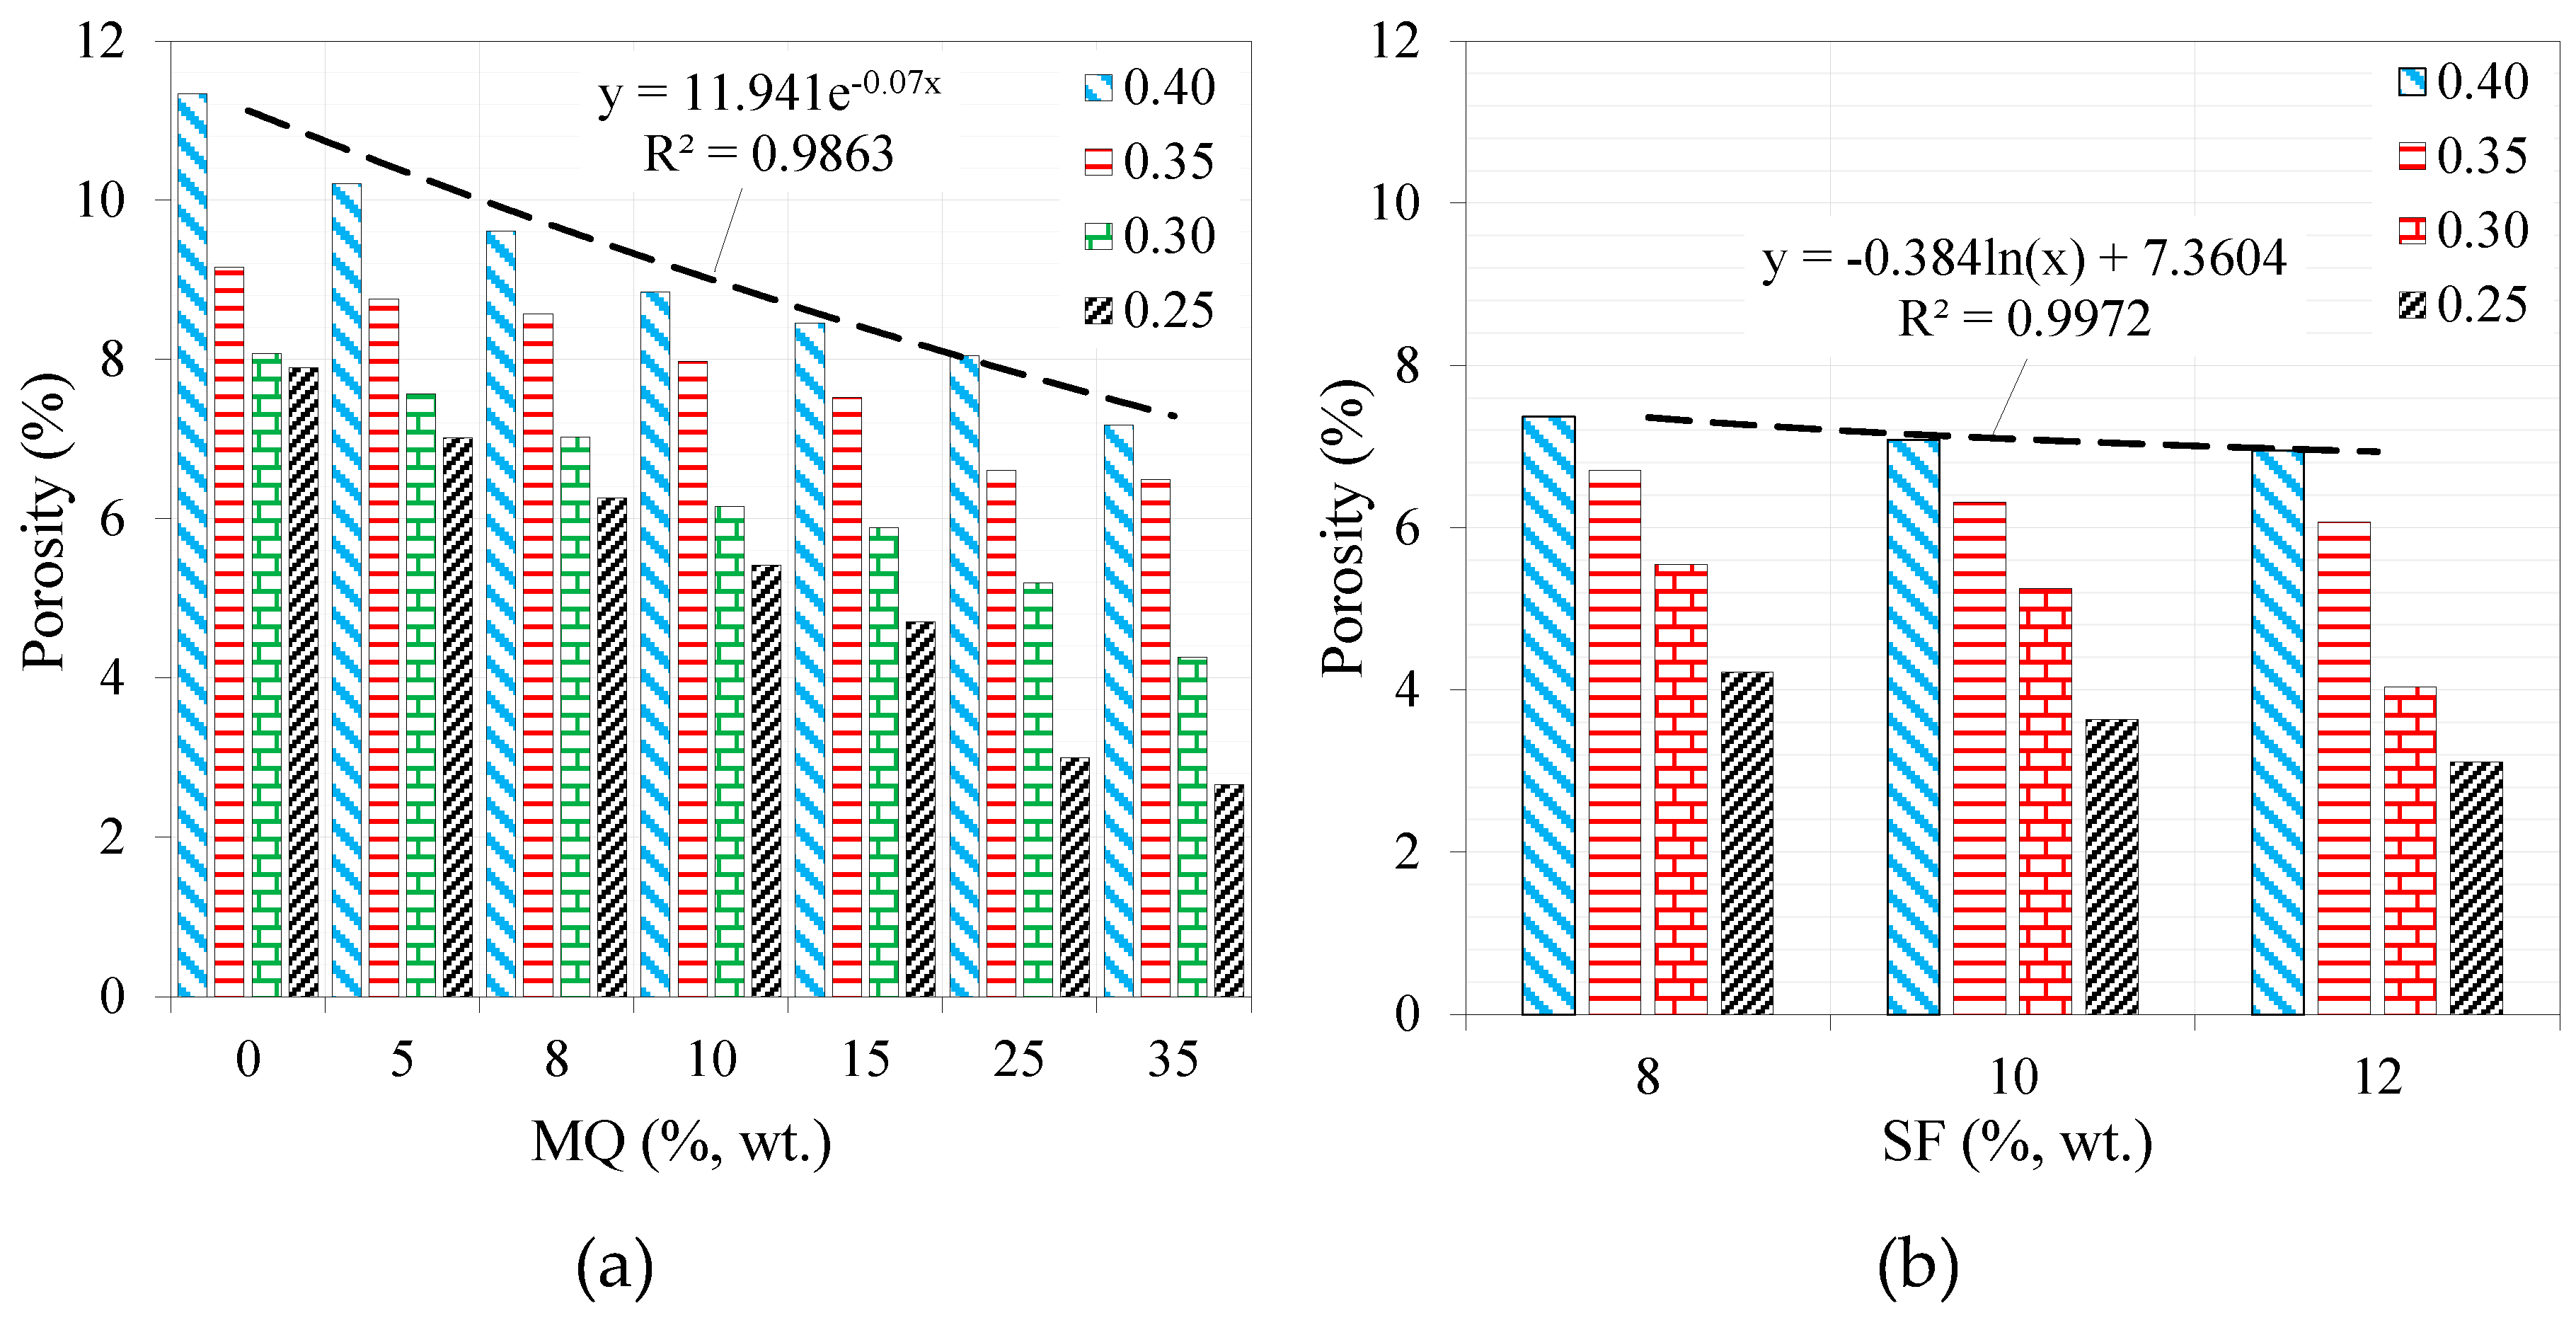
Figure 14a illustrates the influence of MQ incorporation into concrete on its porosity at various water–binder ratios. The porosity of concrete mixes with a higher water–binder ratio has been observed to be higher. By increasing the dosage of MQ, a significant reduction in matrix porosity has been observed [
Figure 14a]. At higher water-binder ratios, adding MQ to concrete mixtures resulted in less porosity improvement, perhaps due to reduced cement content in concrete mixtures and therefore fewer micropores. At lower ratios, however, the improvement in porosity is more pronounced. In general, the porosity of concrete and the MQ dosage were exponentially related [
Figure 14a].
At varying water-binder ratios, the impact of the incorporation of SF into concrete on its porosity is illustrated in
Figure 14b. As the water-binder ratio increased, the porosity increased throughout the matrix, with the maximum porosity observed at 0.4. A substantial reduction in matrix porosity has also been observed as a result of increased SF content. With higher water-binder ratios, the addition of SF to concrete mixtures resulted in a lesser increase in porosity, which can be attributed to the fewer micropores available since there was less cement in the mixture. The porosity improvement is more significant in mixtures with a lower water-to-cement ratio. The overall trend of a logarithmic function was observed in all mixtures with different levels of substitution of SF.
4.3. Effects of MQ and SF by statistical analysis
The analysis of variance (ANOVA) results at a confidence level of 95% for strength, porosity and RCPT are presented in
Table 6 and
Table 7. The essential variables included the replacement level of ultrafine and w/b ratio, which significantly affect compressive strength, porosity, and accordingly permeability. As per the ANOVA results, the w/b ratio and the replacement level of ultrafine substantially both impact the values of compressive strength, porosity, and RCPT. The F-value found in the analysis of variance of experimental data was notably higher than
Fcrit, which means that water to cement ratio and parameters are significant for deciding the effective parameter as listed in
Table 7.
Similarly, the ANOVA results at a confidence level of 95% for compressive strength, porosity, and RCPT are presented in
Table 8 and
Table 9. The essential variables included SF and w/b ratio. The main goals of this part of the study are to investigate the effects of SF replacement level (8-12%) and w/b ratio on compressive strength, porosity, and RCPT values. The F-value found in the analysis of variance of experimental data was significantly more than
Fcrit (
Table 9) which means that water to cement ratio and parameters are significant for deciding the effective parameter.
4.4. Optimization of concrete mixtures
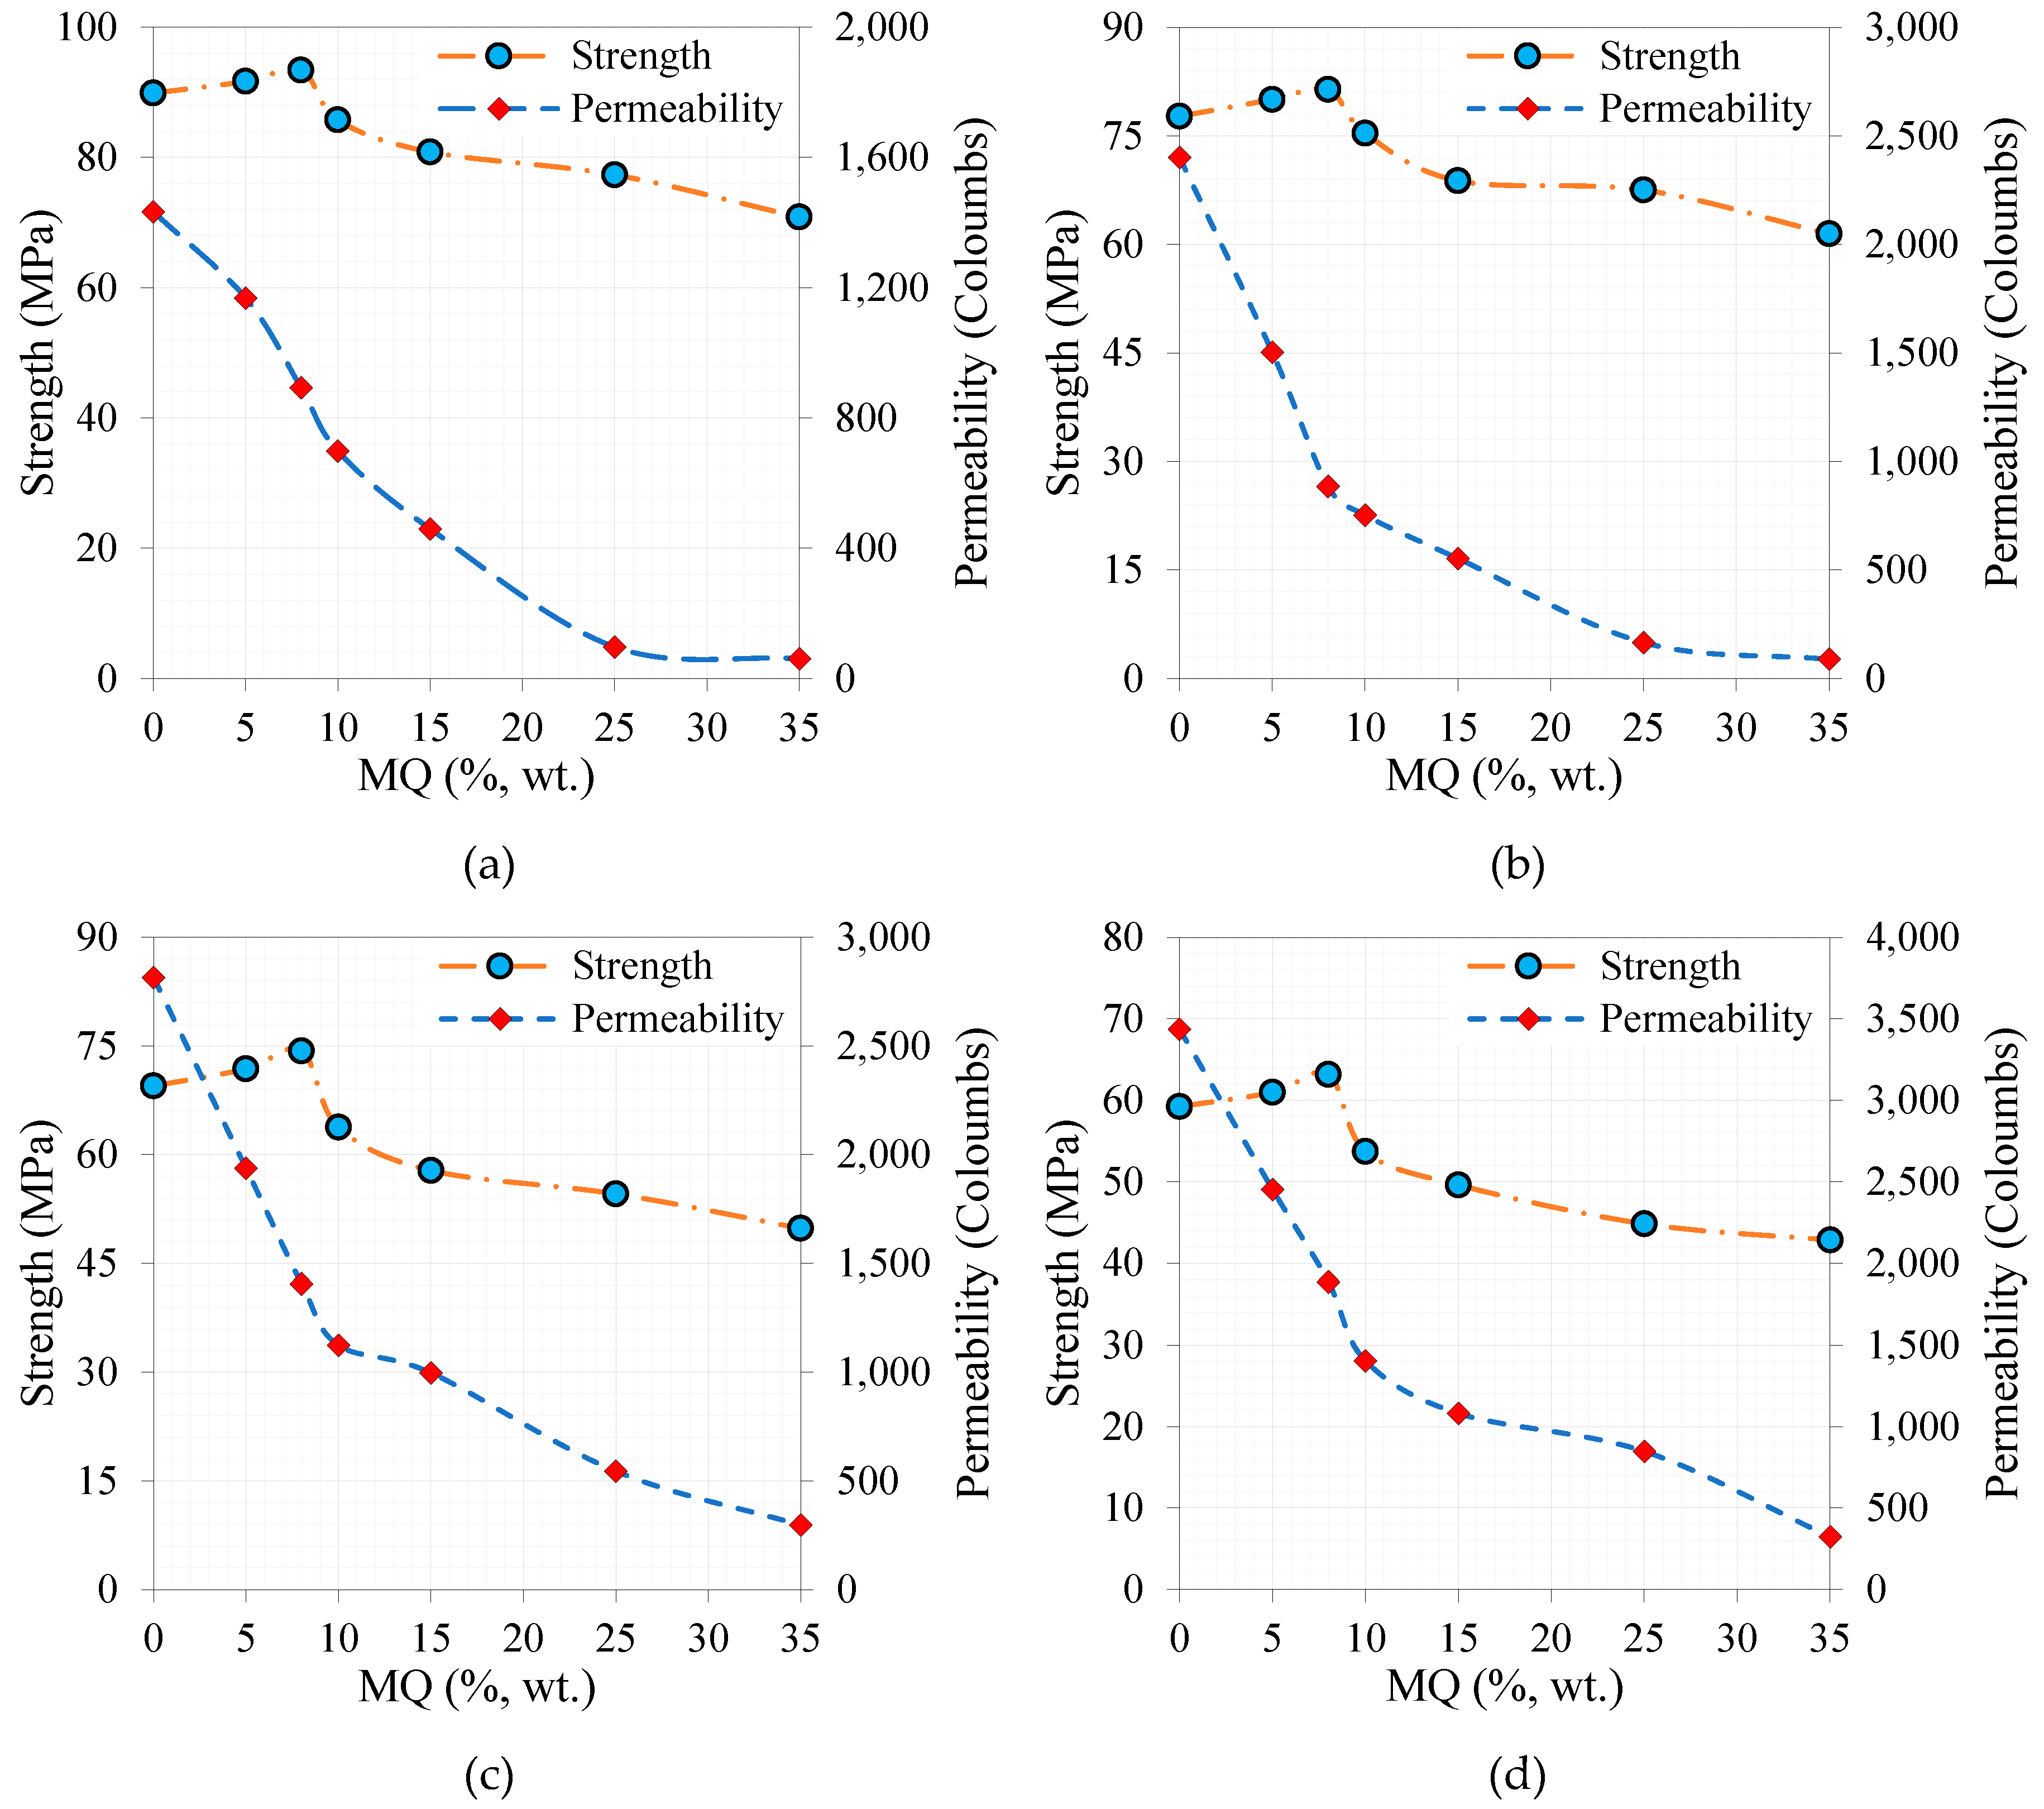
A representation of the strength and permeability responses for the various developed MQ concrete mixtures is shown in
Figure 15. Based on the figure, a replacement level of 8% MQ led to a reduction in compressive strength. In general, the results indicate that concrete containing 8% MQ and 0.3 water-binder ratio had improved compressive strength and durability properties.
5. Conclusions, limitations, and future directions
The use of ultrafine fillers and superplasticizers in the packing of materials can improve the freshness, mechanical properties, and durability of concrete. There is however a need for further research on ultrafine fillers as well as an admixture of pozzolanic minerals in a ternary blend of fillers. Moreover, there is an urgent need to carry out evaluating research to investigate the effects of ultrafine fillers derived from inert material on the durability of high-strength concrete. From the results, it is concluded that MQ can contribute to compressive strength, porosity, and permeability in a similar way to SF. This improvement was attributed to its ultrafine particles that support the filling effect and the packing density of the cementitious matrix.
- (1)
Regardless of the type of fine material, porosity, and permeability, both decrease as the replacement level rises.
- (2)
The strength improves with the SF level, while it shows a maximal value at MQ of 25%.
- (3)
All SF mixes had the highest strength, and in the case of MQ, it remained the highest until a replacement level of 15%.
- (4)
In a manner similar to SF, the ultrafine size of MQ particles improves compressive strength, porosity, and permeability despite having a high degree of crystallinity.
Building upon this research, the following are some potential prospects and directions. To strike a harmonious equilibrium between mechanical attributes and cost-effectiveness, there is room for refining the replacement proportions of SF and MQ. Furthermore, a comprehensive evaluation of the system's life cycle and sustainability implications is imperative. Lastly, exploring the viability of integrating nanomaterials like nano-silica or nano-alumina into binary cementitious systems warrants thorough investigation.
Acknowledgments
The authors extend their appreciation to Researcher Supporting Project number (RSPD2023R692), King Saud University, Riyadh, Kingdom of Saudi Arabia.
References
- Initiative Cement Sustainability (CSI). Recycling Concrete. World Business Council for Sustainable Development-WBCSD. 2009.
- Aı̈tcin, P. The durability characteristics of high performance concrete: a review. Cem. Concr. Compos. 2003, 25, 409–420. [Google Scholar] [CrossRef]
- Stroeven, M. Discrete numerical modelling of Composite Materials-application to cementitious materials. Delft, The Netherlands: Delft University of Technology; 1999.
- Bai, G.; Wang, L.; Ma, G.; Sanjayan, J.; Bai, M. 3D printing eco-friendly concrete containing under-utilised and waste solids as aggregates. Cem. Concr. Compos. 2021, 120, 104037. [Google Scholar] [CrossRef]
- Zhou, Y.; Guo, D.; Xing, F.; Guo, M. Multiscale mechanical characteristics of ultra-high performance concrete incorporating different particle size ranges of recycled fine aggregate. Constr. Build. Mater. 2021, 307. [Google Scholar] [CrossRef]
- Bui, D.; Hu, J.; Stroeven, P. Particle size effect on the strength of rice husk ash blended gap-graded Portland cement concrete. Cem. Concr. Compos. 2005, 27, 357–366. [Google Scholar] [CrossRef]
- Zhang, H.; Ji, T.; Liu, H. Performance evolution of the interfacial transition zone (ITZ) in recycled aggregate concrete under external sulfate attacks and dry-wet cycling. Constr. Build. Mater. 2019, 229. [Google Scholar] [CrossRef]
- Zhao, H.; Wu, Z.; Liu, A.; Zhang, L. Numerical insights into the effect of ITZ and aggregate strength on concrete properties. Theor. Appl. Fract. Mech. 2022, 120. [Google Scholar] [CrossRef]
- Lagerblad B, Kjellsen K. Normal and high strength concretes with conventional aggregates. RILEM REPORT. 1999:53-70.
- Kaufmann J, Winnefeld F, editors. Influence of addition of ultrafine cement on the rheological properties and strength of Portland cement paste. Innovations and Developments In Concrete Materials And Construction. In Proceedings of the International Conference held at the University of Dundee, Scotland, UK, 9–11 September 2002.
- Bayramov F, Tasdemir M, Ilki A, et al., editors. Steel fibre reinforced concrete for heavy traffic load conditions. Proceedings of the 9th International Symposium on Concrete Roads, Istambul, Turkey; 2004.
- Neville, AM. Properties of concrete. Vol. 4. England: Pearson; 2004.
- Dobiszewska, M.; Schindler, A.K.; Pichór, W. Mechanical properties and interfacial transition zone microstructure of concrete with waste basalt powder addition. Constr. Build. Mater. 2018, 177, 222–229. [Google Scholar] [CrossRef]
- Adamu, M.; Ibrahim, Y.E.; Al-Atroush, M.E.; Alanazi, H. Mechanical Properties and Durability Performance of Concrete Containing Calcium Carbide Residue and Nano Silica. Materials 2021, 14, 6960. [Google Scholar] [CrossRef]
- Mazloom, M.; Ramezanianpour, A.A.; Brooks, J.J. Effect of silica fume on mechanical properties of high-strength concrete. Cem. Concr. Compos. 2004, 26, 347–357. [Google Scholar] [CrossRef]
- Güneyisi, E.; Gesoğlu, M.; Karaoğlu, S.; Mermerdaş, K. Strength, permeability and shrinkage cracking of silica fume and metakaolin concretes. Constr. Build. Mater. 2012, 34, 120–130. [Google Scholar] [CrossRef]
- Shi H-s, Xu B-w, Zhou X-c. Influence of mineral admixtures on compressive strength, gas permeability and carbonation of high performance concrete. Construction and Building Materials. 2009;23(5):1980-1985. [CrossRef]
- Behnood, A.; Ziari, H. Effects of silica fume addition and water to cement ratio on the properties of high-strength concrete after exposure to high temperatures. Cem. Concr. Compos. 2008, 30, 106–112. [Google Scholar] [CrossRef]
- Wong, H.; Razak, H.A. Efficiency of calcined kaolin and silica fume as cement replacement material for strength performance. Cem. Concr. Res. 2005, 35, 696–702. [Google Scholar] [CrossRef]
- Barger GS, Hill RL, Ramme BW, et al. Use of fly ash in concrete. American Concrete Institute, Farmington Hills, MI, USA. 2003.
- Papadakis, V.G. Effect of fly ash on Portland cement systems: Part I. Low-calcium fly ash. Cem. Concr. Res. 1999, 29, 1727–1736. [Google Scholar] [CrossRef]
- Poon, C.; Kou, S.; Lam, L.; Lin, Z. Activation of fly ash/cement systems using calcium sulfate anhydrite (CaSO4). Cem. Concr. Res. 2001, 31, 873–881. [Google Scholar] [CrossRef]
- Russell, M.; Basheer, P.; Rao, J. Potential use of spent mushroom compost ash as an activator for pulverised fuel ash. Constr. Build. Mater. 2005, 19, 698–702. [Google Scholar] [CrossRef]
- Zhang, J.; Lv, T.; Hou, D.; Dong, B. Synergistic effects of fly ash and MgO expansive additive on cement paste: Microstructure and performance. Constr. Build. Mater. 2023, 371. [Google Scholar] [CrossRef]
- Hanif, A.; Lu, Z.; Li, Z. Utilization of fly ash cenosphere as lightweight filler in cement-based composites – A review. Constr. Build. Mater. 2017, 144, 373–384. [Google Scholar] [CrossRef]
- Khan, M.I.; M. I. Khan, M.ASCE11Lecturer in Structural Engineering, School of Civil Engineering, Univ. of Nottingham, Nottingham NG7 2RD, U.K.; M.Asce Permeation of High Performance Concrete. J. Mater. Civ. Eng. 2003, 15, 84–92. [Google Scholar] [CrossRef]
- Yazıcı, H. The effect of curing conditions on compressive strength of ultra high strength concrete with high volume mineral admixtures. J. Affect. Disord. 2007, 42, 2083–2089. [Google Scholar] [CrossRef]
- Demirboğa, R. Thermal conductivity and compressive strength of concrete incorporation with mineral admixtures. Build. Environ. 2007, 42, 2467–2471. [Google Scholar] [CrossRef]
- Nochaiya, T.; Wongkeo, W.; Chaipanich, A. Utilization of fly ash with silica fume and properties of Portland cement–fly ash–silica fume concrete. Fuel 2010, 89, 768–774. [Google Scholar] [CrossRef]
- Azmee, N.; Abbas, Y.M.; Shafiq, N.; Fares, G.; Osman, M.; Khan, M.I. Enhancing the Microstructure and Sustainability of Ultra-High-Performance Concrete Using Ultrafine Calcium Carbonate and High-Volume Fly Ash under Different Curing Regimes. Sustainability 2021, 13, 3900. [Google Scholar] [CrossRef]
- Abbas, Y.M.; Khan, M.I. Optimization of Arabian-Shield-Based Natural Pozzolan and Silica Fume for High-Performance Concrete Using Statistical Design of Experiments. Adv. Civ. Eng. 2021, 2021, 1–15. [Google Scholar] [CrossRef]
- Abbas, Y. Simplex-lattice strength and permeability optimization of concrete incorporating silica fume and natural pozzolan. Constr. Build. Mater. 2018, 168, 199–208. [Google Scholar] [CrossRef]
- Khan, M.; Abbas, Y. Curing optimization for strength and durability of silica fume and fuel ash concretes under hot weather conditions. Constr. Build. Mater. 2017, 157, 1092–1105. [Google Scholar] [CrossRef]
- Khan, M.I.; Abbas, Y.M. Robust extreme gradient boosting regression model for compressive strength prediction of blast furnace slag and fly ash concrete. Mater. Today Commun. 2023, 35. [Google Scholar] [CrossRef]
- Bouzoubaa N, Bilodeau A, Sivasundaram V, et al. Development of ternary blends for high-performance concrete. Materials Journal. 2004;101(1):19-29. [CrossRef]
- zyıldırım C, Halstead W. Improved concrete quality with combinations of fly ash and silica fume. ACI Materials Journal. 1994;91(6):587-594.
- Ronne, M. Effect of Condensed Silica Fume and Fly Ash on Compressive Strength Development of Concrete. "SP-114: Fly Ash, Silica Fume, Slag, and Natural Pozzolans in Concrete: Proceedings of the Third International Conference". LOCATION OF CONFERENCE, COUNTRYDATE OF CONFERENCE; pp. 175–190.
- Abed, M.; Nemes, R. Long-term durability of self-compacting high-performance concrete produced with waste materials. Constr. Build. Mater. 2019, 212, 350–361. [Google Scholar] [CrossRef]
- Bakker, R. Application and advantages of blended cement concretes. QCL Group Technical Note. 1999.
- Moosberg-Bustnes, H.; Lagerblad, B.; Forssberg, E. The function of fillers in concrete. Mater. Struct. 2004, 37, 74–81. [Google Scholar] [CrossRef]
- Nehdi, M. Microfiller effect on rheology, microstructure, and mechanical properties of high-performance concrete. The University of British Columbia: National Library of Canada= Bibliothèque nationale du Canada, Ottawa; 1999.
- Fennis, S. Design of ecological concrete by particle packing optimization. the Netherlands: University of Technology; 2011.
- Vogt, C. Ultrafine particles in concrete: Influence of ultrafine particles on concrete properties and application to concrete mix design: Royal Institute of Technology; 2010.
- Cyr M, Lawrence P, Ringot E. Mineral admixtures in mortars: Quantification of the physical effects of inert materials on short-term hydration. Cement and concrete research. 2005;35(4):719-730. [CrossRef]
- Shi, C.; Wu, Z.; Xiao, J.; Wang, D.; Huang, Z.; Fang, Z. A review on ultra high performance concrete: Part I. Raw materials and mixture design. Constr. Build. Mater. 2015, 101, 741–751. [Google Scholar] [CrossRef]
- Mehdipour, I.; Khayat, K.H. Effect of particle-size distribution and specific surface area of different binder systems on packing density and flow characteristics of cement paste. Cem. Concr. Compos. 2017, 78, 120–131. [Google Scholar] [CrossRef]
- Yousuf, S.; Sanchez, L.; Shammeh, S. The use of particle packing models (PPMs) to design structural low cement concrete as an alternative for construction industry. J. Build. Eng. 2019, 25. [Google Scholar] [CrossRef]
- Kosmatka SH, Kerkhoff B, Panarese W. Fly ash, slag, silica fume, and natural pozzolans. Design and control of concrete mixtures. 2002;13:57-72.
- Zagar L, editor Methods of determination of pore structure, permeability and diffusion. Proceedings of RILEM / IUPAC International Symposium on the Pore Structure and Properties of Materials; 1973; Prague.
- Cheerarot, R.; Tangpagasit, J.; Jaturapitakkul, C. Compressive Strength of Mortars Due to Pozzolanic Reaction of Fly Ash. "SP-221: Eighth CANMET/ACI International Conference on Fly Ash, Silica Fume, Slag, and Natural Pozzolans in Concrete". LOCATION OF CONFERENCE, COUNTRYDATE OF CONFERENCE; pp. 411–426.
- Jaturapitakkul, C.; Tangpagasit, J.; Songmue, S.; Kiattikomol, K. Filler effect and pozzolanic reaction of ground palm oil fuel ash. Constr. Build. Mater. 2011, 25, 4287–4293. [Google Scholar] [CrossRef]
- Khan, M.; Abbas, Y.; Fares, G. Review of high and ultrahigh performance cementitious composites incorporating various combinations of fibers and ultrafines. J. King Saud Univ. - Eng. Sci. 2017, 29, 339–347. [Google Scholar] [CrossRef]
- Wang, X.; Wu, D.; Zhang, J.; Yu, R.; Hou, D.; Shui, Z. Design of sustainable ultra-high performance concrete: A review. Constr. Build. Mater. 2021, 307, 124643. [Google Scholar] [CrossRef]
- S. K., K.; Singh, S.; Chourasia, A. Alternative fine aggregates in production of sustainable concrete- A review. J. Clean. Prod. 2020, 268, 122089. [Google Scholar] [CrossRef]
- Loland K, Hustad T. Report 2 Mechanical Properties. FCB/SINTEF. 1981.
- Sellevold EJ, Nilsen T. Condensed silica fume in concrete: a world review. Supplementary Cementing Materials for concrete CANMET; Ottawa, Canada1987. p. 165-243.
- Newman J, Choo BS. Advanced concrete technology 2: concrete properties. Elsevier; 2003.
- Benli, A.; Karataş, M.; Bakir, Y. An experimental study of different curing regimes on the mechanical properties and sorptivity of self-compacting mortars with fly ash and silica fume. Constr. Build. Mater. 2017, 144, 552–562. [Google Scholar] [CrossRef]
- Lamond JF, Pielert JH. Significance of tests and properties of concrete and concrete-making materials. Vol. 169. ASTM international; 2006.
- Scrivener, K.L.; Juilland, P.; Monteiro, P.J. Advances in understanding hydration of Portland cement. Cem. Concr. Res. 2015, 78, 38–56. [Google Scholar] [CrossRef]
- Abrams, L. Properties of concrete. Pitman Publishing Ltd.: London, UK; 1919.
- Oluokun, FA. Fly ash concrete mix design and the water-cement ratio law. Materials Journal. 1994;91(4):362-371.
- Abd Elaty MAA. Compressive strength prediction of Portland cement concrete with age using a new model. HBRC journal. 2014;10(2):145-155.
- Taerwe, L. Constitutive modelling of high strength/high performance concrete: state-of-art report. Vol. 42. Fédération internationale du Béton (FIB); 2008.
- Mehta PK, Monteiro PJ. Concrete: microstructure, properties, and materials. McGraw-Hill Education; 2014.
- Burg R, Ost B. Engineering properties of commercially available high-strength concretes (including three-year data). 1994.
- Hu, J.; Ge, Z.; Wang, K. Influence of cement fineness and water-to-cement ratio on mortar early-age heat of hydration and set times. J. Constr. Build. Mater. 2014, 50, 657–663. [Google Scholar] [CrossRef]
- Qi, T.; Zhou, W.; Liu, X.; Wang, Q.; Zhang, S. Predictive Hydration Model of Portland Cement and Its Main Minerals Based on Dissolution Theory and Water Diffusion Theory. Materials 2021, 14, 595. [Google Scholar] [CrossRef]
- Shen, D.; Wang, X.; Wu, S. Determining hydration mechanisms for initial fall and main hydration peak in tricalcium silicate hydration using a two-scale hydration simulation model. Cem. Concr. Res. 2022, 156, 106763. [Google Scholar] [CrossRef]
- Detwiler RJ, Mehta PK. Chemical and physical effects of silica fume on the mechanical behavior of concrete. Materials Journal. 1989;86(6):609-614. [CrossRef]
- Goldman, A.; Bentur, A. Properties of cementitious systems containing silica fume or nonreactive microfillers. Adv. Cem. Based Mater. 1994, 1, 209–215. [Google Scholar] [CrossRef]
- Ibrahim, R.K.; Hamid, R.; Taha, M.R. Strength and Microstructure of Mortar Containing Nanosilica at High Temperature. ACI Mater. J. 2014, 111, 163–170. [Google Scholar] [CrossRef]
- Amin, M.; Zeyad, A.M.; Tayeh, B.A.; Agwa, I.S. Effect of ferrosilicon and silica fume on mechanical, durability, and microstructure characteristics of ultra high-performance concrete. Constr. Build. Mater. 2021, 320, 126233. [Google Scholar] [CrossRef]
Figure 1.
The addition of ultrafine fillers improves the packing of concrete.
Figure 1.
The addition of ultrafine fillers improves the packing of concrete.
Figure 2.
The grain size distribution of (a) fine powders, and (b) aggregates.
Figure 2.
The grain size distribution of (a) fine powders, and (b) aggregates.
Figure 3.
SEM images of: (a) MQ, (b) SF, and (c) PC.
Figure 3.
SEM images of: (a) MQ, (b) SF, and (c) PC.
Figure 7.
The impact of the MQ content on the 28d compressive strength with (a) 0.25, (b) 0.30, (c) 0.35, and (d) 0.40 water–binder ratio.
Figure 7.
The impact of the MQ content on the 28d compressive strength with (a) 0.25, (b) 0.30, (c) 0.35, and (d) 0.40 water–binder ratio.
Figure 8.
The impact of the SF content on the 28d compressive strength with: (a) 0.25, (b) 0.30, (c) 0.35, and (d) 0.40 water–binder ratio.
Figure 8.
The impact of the SF content on the 28d compressive strength with: (a) 0.25, (b) 0.30, (c) 0.35, and (d) 0.40 water–binder ratio.
Figure 9.
28d compressive strength vs. water–binder ratio: (a) MQ, and (b) SF concrete.
Figure 9.
28d compressive strength vs. water–binder ratio: (a) MQ, and (b) SF concrete.
Figure 10.
The age-dependent MQ concrete’ compressive strength development with: (a) 0.25, (b) 0.30, (c) 0.35, and (d) 0.40 water–binder ratio.
Figure 10.
The age-dependent MQ concrete’ compressive strength development with: (a) 0.25, (b) 0.30, (c) 0.35, and (d) 0.40 water–binder ratio.
Figure 11.
The age-dependent SF concrete’ compressive strength development with: (a) 0.25, (b) 0.30, (c) 0.35, and (d) 0.40 water–binder ratio.
Figure 11.
The age-dependent SF concrete’ compressive strength development with: (a) 0.25, (b) 0.30, (c) 0.35, and (d) 0.40 water–binder ratio.
Figure 12.
Failure patterns during uniaxial compression loading for: (a) MQ-, (b) SF- concrete.
Figure 12.
Failure patterns during uniaxial compression loading for: (a) MQ-, (b) SF- concrete.
Figure 13.
Chloride permeability of: (a) MQ-, and (b) SF-concrete.
Figure 13.
Chloride permeability of: (a) MQ-, and (b) SF-concrete.
Figure 14.
Porosity of: (a) MQ-, and (b) SF-concrete.
Figure 14.
Porosity of: (a) MQ-, and (b) SF-concrete.
Figure 15.
Strength and permeability responses for the various developed MQ concrete mixtures with a w/b ratio of: (a) 0.25, (a) 0.30, (a) 0.35, and (b) 0.40.
Figure 15.
Strength and permeability responses for the various developed MQ concrete mixtures with a w/b ratio of: (a) 0.25, (a) 0.30, (a) 0.35, and (b) 0.40.
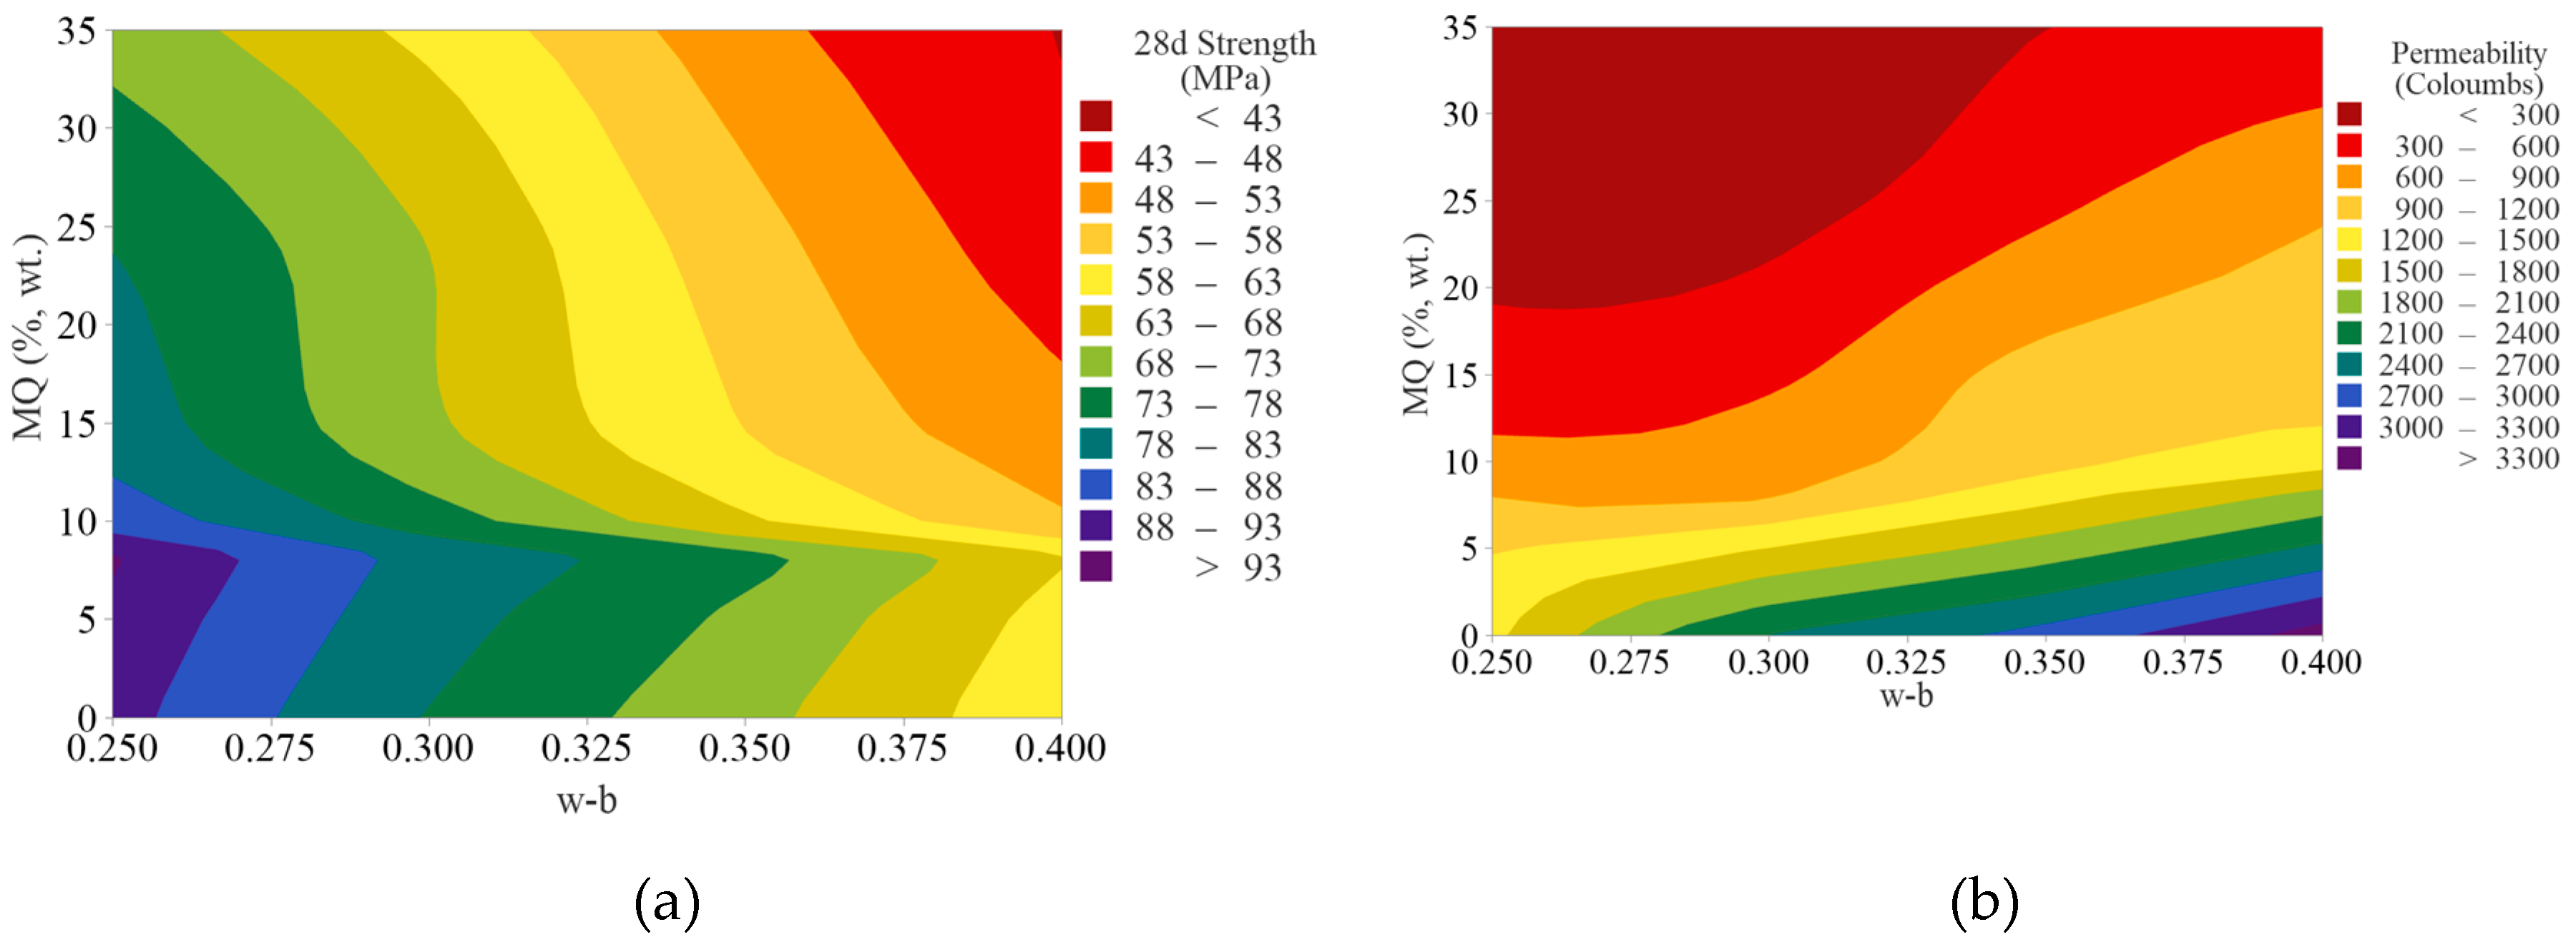
Figure 16.
(a) strength and (b) permeability contour plots for the MQ concrete mixtures.
Figure 16.
(a) strength and (b) permeability contour plots for the MQ concrete mixtures.
Table 1.
The physicochemical properties of the fine powders.
Table 1.
The physicochemical properties of the fine powders.
| Oxide composition (%) |
PC |
SF |
MQ |
| SiO2
|
20.2 |
93.2 |
99.5 |
| Al2O3
|
5.49 |
0.2 |
0.20 |
| Fe2O3
|
4.12 |
0.03 |
0.03 |
| CaO |
65.43 |
0.72 |
0.01 |
| MgO |
0.71 |
0.14 |
- |
| Na2Oeq |
0.26 |
0.07 |
- |
| SO3
|
2.61 |
<0.01 |
- |
| Loss on ignition (%) |
1.38 |
5.4 |
- |
| Specific gravity |
3.14 |
2.27 |
- |
| Fineness (m2/kg) |
373 |
19,000 |
16,500 |
Table 2.
The physical properties of the aggregates.
Table 2.
The physical properties of the aggregates.
| Material |
Specific Gravity |
Absorption, % |
Unit Weight, kg/m3
|
| NFA |
2.63 |
0.77 |
1725 |
| CFA |
2.68 |
1.52 |
1552 |
| CA |
2.65 |
1.45 |
1570 |
Table 3.
Detail of the cylindrical specimens for material testing.
Table 3.
Detail of the cylindrical specimens for material testing.
| Test |
Uniaxial
compression |
Rapid chloride-ion
permeability |
| specimen dimensions (mm) |
|
|
Table 4.
Details of concrete mixes.
Table 4.
Details of concrete mixes.
Sr.
No. |
Mix ID |
w/b |
Fine powders |
Sr.
No. |
Mix ID |
w/b |
Fine powders |
| PC |
SF |
MQ |
Total |
PC |
SF |
MQ |
Total |
| (kg/m3) |
(kg/m3) |
| 1 |
CTRL-25 |
0.25 |
550 |
|
|
550 |
21 |
CTRL-35 |
0.35 |
450.0 |
|
|
450 |
| 2 |
SF08-25 |
506 |
44.0 |
|
550 |
22 |
SF08-35 |
414.0 |
36.0 |
|
450 |
| 3 |
SF10-25 |
405 |
45.0 |
|
550 |
23 |
SF10-35 |
495.0 |
55.0 |
|
550 |
| 4 |
SF12-25 |
484 |
66.0 |
|
550 |
24 |
SF12-35 |
352.0 |
48.0 |
|
400 |
| 5 |
MQ05-25 |
523 |
|
27.5 |
550 |
25 |
MQ05-35 |
427.5 |
|
22.5 |
450 |
| 6 |
MQ08-25 |
506 |
|
44.0 |
550 |
26 |
MQ08-35 |
414.0 |
|
36.0 |
450 |
| 7 |
MQ10-25 |
405 |
|
45.0 |
450 |
27 |
MQ10-35 |
495.0 |
|
55.0 |
550 |
| 8 |
MQ15-25 |
468 |
|
82.5 |
550 |
28 |
MQ15-35 |
382.5 |
|
67.5 |
450 |
| 9 |
MQ25-25 |
413 |
|
137.5 |
550 |
29 |
MQ25-35 |
337.5 |
|
112.5 |
450 |
| 10 |
MQ35-25 |
358 |
|
192.5 |
550 |
30 |
MQ35-35 |
292.5 |
|
157.5 |
450 |
| 11 |
CTRL-30 |
0.30 |
500 |
|
|
500 |
31 |
CTRL-40 |
0.40 |
400.0 |
|
|
400 |
| 12 |
SF08-30 |
460 |
40.0 |
|
500 |
32 |
SF08-40 |
368.0 |
32.0 |
|
400 |
| 13 |
SF10-30 |
360 |
40.0 |
|
400 |
33 |
SF10-40 |
450.0 |
50.0 |
|
500 |
| 14 |
SF12-30 |
440 |
60.0 |
|
500 |
34 |
SF12-40 |
396.0 |
54.0 |
|
450 |
| 15 |
MQ05-30 |
475 |
|
25.0 |
500 |
35 |
MQ05-40 |
380.0 |
|
20.0 |
400 |
| 16 |
MQ08-30 |
460 |
|
40.0 |
500 |
36 |
MQ08-40 |
368.0 |
|
32.0 |
400 |
| 17 |
MQ10-30 |
360 |
|
40.0 |
400 |
37 |
MQ10-40 |
450.0 |
|
50.0 |
500 |
| 18 |
MQ15-30 |
425 |
|
75.0 |
500 |
38 |
MQ15-40 |
340.0 |
|
60.0 |
400 |
| 19 |
MQ25-30 |
375 |
|
125.0 |
500 |
39 |
MQ25-40 |
300.0 |
|
100.0 |
400 |
| 20 |
MQ35-30 |
325 |
|
175.0 |
500 |
40 |
MQ35-40 |
260.0 |
|
140.0 |
400 |
Table 5.
Summary of the experimental results.
Table 5.
Summary of the experimental results.
| Mix ID |
Strength (MPa) |
Porosity
% |
Permeability Coulombs |
| 7d |
28d |
180d |
400d |
| CTRL-25 |
70.4 |
89.9 |
93.0 |
96.0 |
7.9 |
1433.3 |
| MQ05-25 |
71.6 |
91.7 |
95.5 |
101.0 |
7.0 |
1169.0 |
| MQ08-25 |
74.1 |
93.4 |
97.4 |
105.3 |
6.3 |
893.7 |
| MQ10-25 |
68.8 |
85.8 |
90.9 |
95.8 |
5.4 |
699.3 |
| MQ15-25 |
64.7 |
80.8 |
88.7 |
96.1 |
4.7 |
460.0 |
| MQ25-25 |
51.6 |
77.3 |
86.7 |
93.9 |
3.0 |
97.7 |
| MQ35-25 |
49.0 |
70.9 |
85.6 |
92.2 |
2.7 |
61.7 |
| SF08-25 |
66.7 |
91.8 |
94.4 |
97.1 |
4.2 |
332.7 |
| SF10-25 |
69.0 |
94.9 |
95.9 |
97.9 |
3.6 |
235.3 |
| SF12-25 |
72.1 |
98.1 |
98.2 |
99.3 |
3.1 |
150.0 |
| CTRL-30 |
60.4 |
77.7 |
83.9 |
88.6 |
8.1 |
2400.7 |
| MQ05-30 |
62.0 |
80.0 |
84.1 |
92.1 |
7.6 |
1502.3 |
| MQ08-30 |
63.4 |
81.4 |
87.1 |
96.9 |
7.0 |
885.7 |
| MQ10-30 |
57.4 |
75.4 |
82.4 |
89.9 |
6.2 |
753.3 |
| MQ15-30 |
53.1 |
68.8 |
78.6 |
88.7 |
5.9 |
553.3 |
| MQ25-30 |
44.1 |
67.5 |
75.5 |
84.7 |
5.2 |
167.0 |
| MQ35-30 |
41.9 |
61.5 |
72.3 |
81.4 |
4.3 |
89.7 |
| SF08-30 |
57.8 |
79.5 |
80.9 |
83.9 |
5.5 |
413.7 |
| SF10-30 |
59.4 |
81.7 |
85.2 |
86.9 |
5.3 |
332.7 |
| SF12-30 |
62.8 |
86.4 |
87.1 |
88.0 |
4.0 |
312.7 |
| CTRL-35 |
52.7 |
69.5 |
74.9 |
79.4 |
9.2 |
2814.7 |
| MQ05-35 |
53.8 |
71.8 |
80.8 |
84.4 |
8.8 |
1936.7 |
| MQ08-35 |
55.5 |
74.3 |
85.0 |
90.2 |
8.6 |
1406.0 |
| MQ10-35 |
50.5 |
63.8 |
75.3 |
78.5 |
8.0 |
1125.0 |
| MQ15-35 |
49.3 |
57.8 |
68.0 |
74.1 |
7.5 |
997.5 |
| MQ25-35 |
40.0 |
54.6 |
63.1 |
72.1 |
6.6 |
544.7 |
| MQ35-35 |
34.3 |
49.8 |
56.4 |
65.9 |
6.5 |
296.7 |
| SF08-35 |
54.1 |
73.6 |
75.0 |
80.1 |
6.7 |
523.0 |
| SF10-35 |
53.2 |
74.2 |
77.4 |
83.3 |
6.3 |
483.0 |
| SF12-35 |
56.7 |
77.8 |
78.4 |
75.5 |
6.1 |
423.7 |
| CTRL-40 |
46.7 |
59.2 |
61.8 |
65.4 |
11.3 |
3437.0 |
| MQ05-40 |
48.0 |
61.0 |
66.2 |
71.1 |
10.2 |
2453.0 |
| MQ08-40 |
49.9 |
63.2 |
69.2 |
76.1 |
9.6 |
1886.7 |
| MQ10-40 |
43.6 |
53.7 |
60.4 |
65.7 |
8.9 |
1404.0 |
| MQ15-40 |
39.7 |
49.6 |
58.7 |
64.2 |
8.5 |
1080.3 |
| MQ25-40 |
31.6 |
44.8 |
53.8 |
60.8 |
8.0 |
847.0 |
| MQ35-40 |
28.9 |
42.8 |
50.5 |
60.0 |
7.2 |
323.0 |
| SF08-40 |
47.8 |
64.2 |
67.8 |
72.9 |
7.4 |
851.3 |
| SF10-40 |
48.0 |
65.6 |
69.5 |
74.5 |
7.1 |
782.7 |
| SF12-40 |
51.0 |
69.9 |
70.9 |
71.8 |
6.9 |
740.0 |
Table 6.
ANOVA analysis of the effect of different levels of MQ replacement.
Table 6.
ANOVA analysis of the effect of different levels of MQ replacement.
| Summary |
Response |
Sum |
Average |
Variance |
| w-b: 0.25 |
Strength |
589.80 |
84.26 |
68.65 |
| |
Porosity |
36.96 |
5.28 |
3.87 |
| |
Permeability |
4814.67 |
687.81 |
270346.8 |
| w-b: 0.30 |
Strength |
512.31 |
73.18 |
54.68 |
| |
Porosity |
44.17 |
6.31 |
1.80 |
| |
Permeability |
6352 |
907.42 |
658373.8 |
| w-b: 0.35 |
Strength |
441.57 |
63.08 |
86.81 |
| |
Porosity |
55.09 |
7.87 |
1.09 |
| |
Permeability |
9121.16 |
1303.02 |
735011.5 |
| w-b: 0.40 |
Strength |
374.39 |
53.48 |
64.39 |
| |
Porosity |
63.69 |
9.09 |
1.95 |
| |
Permeability |
11431 |
1633 |
1113823 |
Table 7.
ANOVA for MQ.
| Source of Variation |
SS |
df
|
MS |
F-value |
P-value |
Fcrit
|
| w/c ratio |
26133897 |
11 |
2375809 |
13.79 |
3.05E-13 |
1.94 |
| Properties |
5297891 |
6 |
882981.9 |
5.12 |
0.0002 |
2.23 |
| Error |
11369141 |
66 |
172259.7 |
|
|
|
| Total |
42800930 |
83 |
|
|
|
|
Table 8.
ANOVA analysis of the effect of different levels of SF replacement.
Table 8.
ANOVA analysis of the effect of different levels of SF replacement.
| Summary |
Variable |
Sum |
Average |
Variance |
| w-b: 0.25 |
Strength |
284.75 |
94.91 |
10.00 |
| |
Porosity |
10.96 |
3.65 |
0.30 |
| |
Permeability |
718 |
239.33 |
8353.77 |
| w-b: 0.30 |
Strength |
247.64 |
82.54 |
12.46 |
| |
Porosity |
14.83 |
4.94 |
0.63 |
| |
Permeability |
1059 |
353 |
2860.33 |
| w-b: 0.35 |
Strength |
225.54 |
75.18 |
5.13 |
| |
Porosity |
19.08 |
6.36 |
0.10 |
| |
Permeability |
1429.66 |
476.55 |
2497.92 |
| w-b: 0.10 |
Strength |
199.72 |
66.57 |
8.61 |
| |
Porosity |
21.39 |
7.13 |
0.046 |
| |
Permeability |
2374 |
791.33 |
3155.11 |
Table 9.
ANOVA for SF.
| Source of Variation |
SS |
df
|
MS |
F-value |
P-value |
Fcrit.
|
| Rows |
1972030 |
11 |
179275.4 |
162.27 |
2.06E-18 |
2.26 |
| Columns |
9504.37 |
2 |
4752.18 |
4.30 |
0.026 |
3.44 |
| Error |
24304.56 |
22 |
1104.75 |
|
|
|
| Total |
2005839 |
35 |
|
|
|
|
|
Disclaimer/Publisher’s Note: The statements, opinions and data contained in all publications are solely those of the individual author(s) and contributor(s) and not of MDPI and/or the editor(s). MDPI and/or the editor(s) disclaim responsibility for any injury to people or property resulting from any ideas, methods, instructions or products referred to in the content. |
© 2023 by the authors. Licensee MDPI, Basel, Switzerland. This article is an open access article distributed under the terms and conditions of the Creative Commons Attribution (CC BY) license (https://creativecommons.org/licenses/by/4.0/).
