Introduction
Non-destructive testing methods (NDT) [
1,
2,
3] are widely used to assess and monitor the health of structures. The guided ultrasonic wave (GUW) technique has gained significant popularity as a non-destructive testing method, extensively employed for defect detection and evaluation across diverse domains including aerospace vehicles, oil pipelines, industrial machinery, and civil engineering. Recent research efforts have been directed towards investigating the corrosion and stress testing of civil engineering structures, with a particular emphasis on prestressed cable structures present in large-span bridges. The examination of stress and corrosion in the prestressed steel strand, which functions as the primary load-bearing component in these bridges, has posed an enduring technical challenge in the field of civil engineering.
In recent years, several methodologies GUW have been employed to assess stress levels in steel strands. These methods are based on wave velocity [
4,
5], energy attenuation [
6,
7], and modal analysis [
8,
9]. Extensive research findings have demonstrated that GUW signals traveling through the steel strand contain valuable information regarding its tension stress. The collected GUW signals propagating in the waveguide structure under different stress states are comprehensively analyzed from multiple perspectives, including the time domain, frequency domain, and time-frequency domain, to establish the correlation between stress and the characteristics exhibited by the GUW signals. However, GUW propagating within the waveguide structure are prone to interference caused by ambient noise, leading to the submergence of measured GUW signals amidst the noise [
10]. The direct extraction of stress and corrosion information from the initial signal of steel strand often encounters the issue of inadequate repeatability of results due to the interference of noise. Consequently, it becomes imperative and significant to undertake denoising procedures on GUW signals to enhance the precision of testing outcomes.
The Fourier transform is a widely used technique in signal processing for attenuating high-frequency noise via a band-pass filter, yet it does not provide temporal information. Zhang et al. [
11]successfully identified the Lamb wave by employing the short time Fourier transform (STFT) method, which incorporates empirical mode decomposition (EMD) to extract wave velocity information. It’s worth noting that the STFT method cannot consider both time and frequency domain resolutions due to the fixed window size. Consequently, the Wavelet Transform (WT) method [
12], which replaces the infinite triangular basis function with a finite decaying wavelet basis function, offers enhanced resolution in terms of both frequency and time information. Legendre et al. [
13]conducted an analysis on the application of the Wavelet transform (WT) method for processing non-stationary signals, specifically focusing on GUW signals of composite structures. They further introduced a sample selection approach for composite structures, which relied on wavelet coefficients. Liang et al. [
14]introduced a novel approach, referred to as the maximal negentropy optimal scale WT method, which utilizes the discrete wavelet transform (DWT) method for the identification of GUW signals. This method offers time-saving benefits and efficiently eliminates noise from the original signal. However, it is important to note that the WT method necessitates the reliance on human expertise to determine appropriate wavelet basis parameters and a feasible number of decomposition layers.
The EMD method, as proposed by Huang et al.[
15], demonstrates theoretical applicability to a wide range of signal decompositions. Notably, this method exhibits notable advantages in effectively handling non-stationary and non-linear data with high SNR[
16]. In order to mitigate the limitations associated with mode mixing in the EMD method, Huang et al. introduced the ensemble empirical mode decomposition (EEMD) method. This approach incorporates white noise to effectively allocate the signals to a suitable reference scale [
17,
18]. The presence of noise, with its zero-mean characteristic, hinders the effectiveness of multiple averaging calculations, thereby enabling the direct utilization of the combined averaged calculations as the ultimate outcome. Nevertheless, the EMD method and the EEMD method suffer from a deficiency in rigorous mathematical theory, and majority of these methods typically lack the ability to rectify errors resulting from recursive screening. In order to address these issues, Dragomiretskiy et al. [
19] introduced the non-recursive VMD method, which enables the simultaneous extraction of modes. This approach builds upon the classical Wiener filter by incorporating a multi-adaptive bandwidth, and employs the alternating direction method of multipliers (ADMM) to optimize the decomposition model. Given that GUW signals exhibit multimodal mixing with distinct vibration characteristics, the VMD method can be employed to decompose the modal components of GUW, thereby facilitating the denoising of GUW signals characterized by high complexity and nonlinearity.
In the field of GUW signal processing, the integration of multiple signal analysis methods is significant importance. Huang et al. [
20] employed the synchro squeezed wavelet transform (SSWT) technique to reduce noise in the signal and combined it with the VMD method to determine the time-of-flight (TOF) of the GUW signal. Rostami et al. [
21] discovered that the SEMD technique significantly improves the effectiveness of EMD in analyzing highly contaminated signals by utilizing the WT method to eliminate undesired frequency components in each IMF during the initial screening phase of EMD. The utilization of anti-noise methods can enhance the detection sensitivity and accuracy of GUW to a certain degree. It is noteworthy that majority of prior research has concentrated on enhancing signal identification accuracy, with limited attention given to extracting information from low SNR weak signals. This is highly significant in improving the issues of useful information loss resulting from traditional denoising techniques and energy attenuation in long-range testing.
In recent years, the SVD method, recognized as a linear decomposition technique, has garnered significant attention in the realm of GUW signal processing. The SVD method reveals the intrinsic nature of the detected objects by processing matrices of a particular form constructed from GUW signals. Zhao et al. [
22]have substantiated that the SVD method shares a comparable signal processing mechanism with the Wavelet Transform (WT) method, thus establishing its efficacy as a potent and more straightforward approach for GUW signal analysis. Wang et al [
23] obtained the TOF of the damage scattering signal corresponding to the maximum singular value by utilizing the SVD method, and proposed a robust damage testing method based on the SVD method to detect the presence of mass scatterers under complex environmental conditions. Tang et al. [
24]proposed a new singular decreasing index (SDI) to distinguish defect signals and used the SDI spectrum to localize defects. Xu et al. [
25]proposed a Sparse SVD (S-SVD) method, which combines the advantages of the strong background noise suppression ability of the SVD method and the high wavenumber resolution effect of the sparse optimization, thus achieving a clear identification of overlapping dispersion curves. Furthermore, a significant limitation of the SVD method is the requirement to establish the effective rank of the singular values, a task heavily reliant on the user’s expertise, thereby rendering it vulnerable to the issue of excessive denoising in the signal. Consequently, it becomes imperative to ascertain the effective rank of the singular values through the differentiation between the GUW signal and the ambient noise.
In this paper, a noise filtering method for GUW signals is introduced a means to mitigate the adverse impact of measured noise on the identification of strand stress characteristics. The proposed method, referred to as VMD-SampEn-SVD method, combines the VMD method and the SVD method improved by SampEn theory. This amalgamation leverages the VMD method’s refined analysis capability for nonlinear time series and the SampEn-SVD method’s anti-interference capability against strong background noise. Ultimately, the effectiveness of the VMD-SampEn-SVD method is substantiated through the processing of simulated signals.
1. Theoretical analysis
1.1. Decomposition of the VMD-preprocessed noise component
Since the measured GUWs are a non-stationary signal carrying strong noise (low signal-to-noise ratio) (i.e., the measured signal consists of signal component and noise component), the extraction of useful information in GUWs in noisy environments is a critical issue in NDT. The VMD method is a great way for many scholars to deal with this problem, and its central idea is to construct and solve variational problems. That is, firstly, the Wiener filter theory is introduced into the solution process of variational optimization, and then the iterative search variational model optimal solution is used to achieve the decomposition of the non-stationary signal, and finally a series of standard orthogonal modal functions are obtained [
26].
Assuming that there is a noisy GUW signal as
x(
t), the constrained variational model of the VMD method is shown in Eq. (1):
where
K is the number of Intrinsic Mode Functions (IMF) components decomposed from the initial signal;
uk and
wk are the sequence and center frequency of each IMF component, respectively; and
δ(
t) is the Dirac function.
The above constrained variational problem is transformed into an unconstrained variational problem by introducing the Lagrange multiplier
λ(
t) and the penalty term
α. The
uk,
wk and
α are solved by alternating iteration (as shown in Eq. (2)).
In general, the IMF component with a larger correlation coefficient with the initial signal x(t) has a better correlation with the measured signal.
1.1. SVD method based on SampEn theory to determine the order
The SNR of the noise component is lower. Assuming a set of discrete signals to be noise reduced as
Y=(
y(1),
y(2), …,
y(
N)), the phase space reconstruction theory is utilized to construct the Hankel matrix
HN of the noise component sequence as follows:
where
N is the signal length, 1<
n<
N.
The Hankel matrix
HN is processed by SVD method:
where
S=diag(
λ1,
λ2, …,
λK) is diagonal matrix,
λ1,
λ2, …,
λK is the singular value of Hankel matrix
HN,
U is the left singular matrix of
HN,
V is the right singular matrix of
HN.
The SE method is often used to quantitatively describe the complexity of nonlinear dynamic systems, which essentially reflects the probability of the system to generate new patterns [
27]. It has been shown that the SE method, as one of the measure analysis methods of single variable entropy, is suitable for independent sequence diagnosis, and is a more reliable and stable evaluation method in the theoretical entropy model.
In general, for a time series consisting of N data {x(n)} = x(1), x(2), …, x(N), the SampEn is calculated as follows:
(1) Form a vectors sequence of m-dimension by ordinal number, Xm(1), …, Xm(N-m+1), where Xm(i)={x(i), x(i+1), …, x(i+m-1)}, 1≤i≤N-m+1. These vectors represent m consecutive values of x starting from the i-th point.
(2) Define the distance
d[
Xm(
i),
Xm(
j)] (Eq. (5)) between the vectors
Xm(
i) and
Xm(
j) as the absolute value of the maximum difference in the corresponding elements of the two.
(3) For a given
Xm(
i), count the number of
j (1≤
i≤
N-
m,
j≠
i) for which the distance between
Xm(
i) and
Xm(
j) is less than or equal to
r, then denote it as
Bi. For 1≤
i≤
N-
m,
(
r) is defined as:
(5) Increase the dimension to
m+1 and calculate the number of
Xm+1(
i) and
Xm+1(
j), (1≤
i≤
N-
m,
j≠
i) whose distance is less than or equal to
r, denoted as
Ai, and
(
r) is defined as:
Thus,
Bm(
r) is the probability that two sequences match
m points under the similarity tolerance
r, while
Am(
r) is the probability that two sequences match
m+1 points. The SampEn is defined as
When
N is a finite value, it can be estimated using the following equation:
The values of the parameters are very important for the calculation accuracy of SampEn. According to Ref. [
28] and the results of many experiments, it is found that when
m = 2,
r = (0.1~0.25)
σ (
σ is the standard deviation of the initial data) are taken beforehand, it can make the statistical properties of SampEn to be expressed most efficiently, and its results can reflect the signal characteristics more realistically.
There is a mutation in the SampEn between the signal component and the noise component, so the effective rank order of singular value is determined by the change in the SampEn. Set
βi denote the SampEn slope of the reconstructed signal connecting the
i-th and (
i+1)-th order, then the reconstruction order is:
where
i =2, …,
k-1,
k is the total singular value order.
1.1. Denoising process based on VMD-SampEn-SVD method
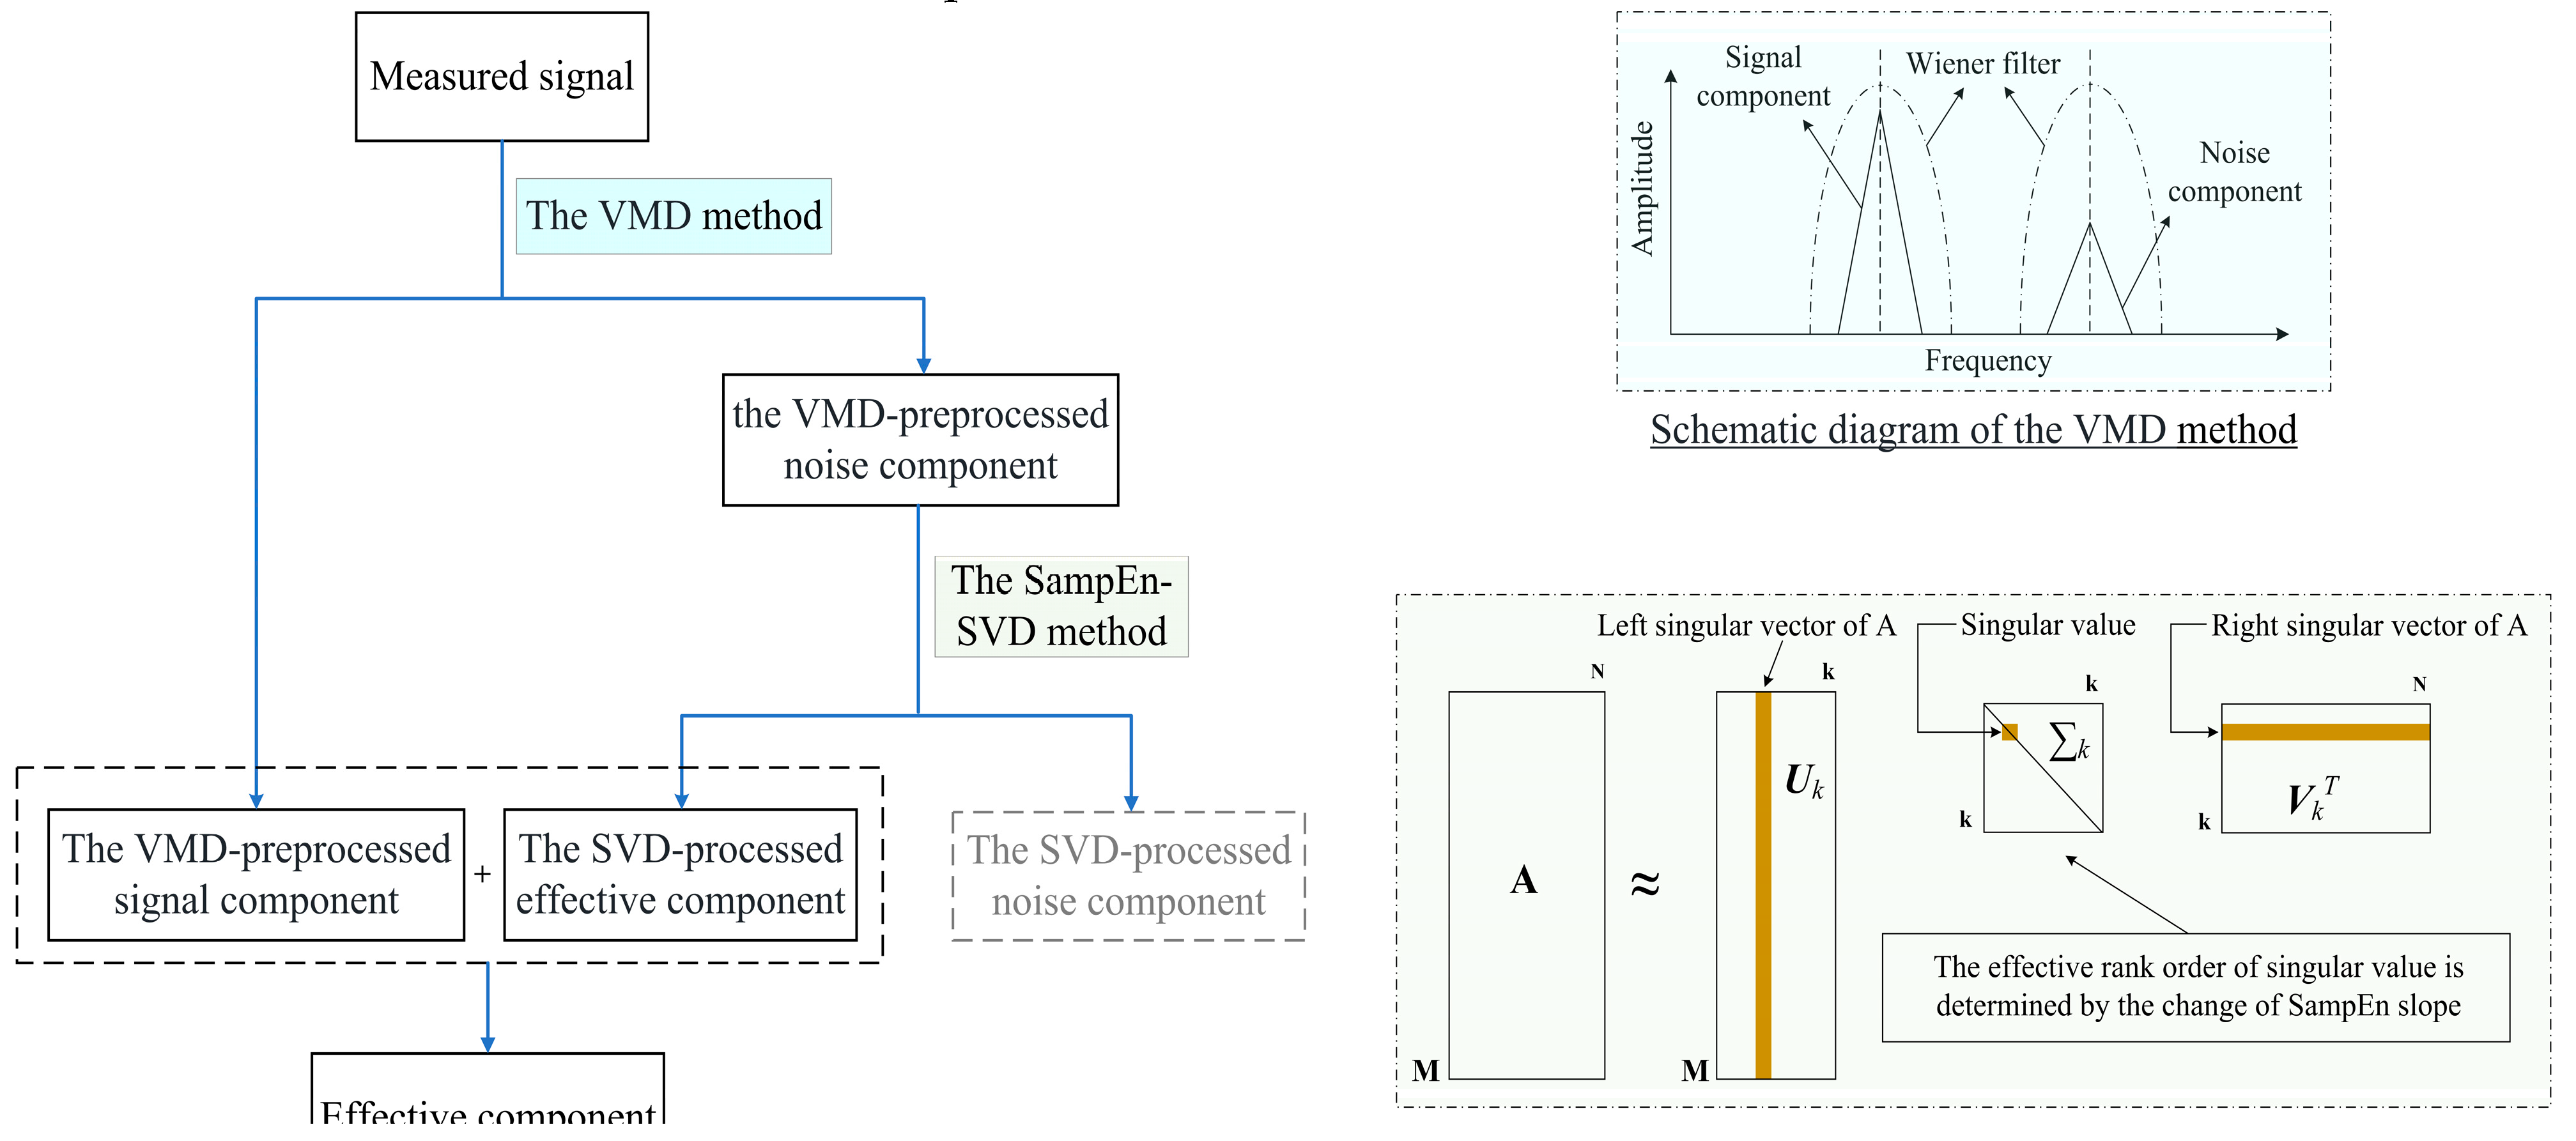
The flow chart of denoising method of GUW signal based on VMD-SampEn-SVD method is shown in
Figure 1 and the steps of VMD-SampEn-SVD method are as follows:
Step 1: The IMF components are obtained by the VMD method. Then correlation coefficients and center frequencies were calculated for each IMF component.
Step 2: The VMD-preprocessed noise components and the VMD-preprocessed signal components are determined based on the correlation coefficients of each IMF component. The more noise a component contains, the lower the correlation. The IMF components with lowest correlation are defined as the VMD-preprocessed noise components. And the center frequency of IMF components closest to the frequency of measured signal are taken as the VMD-preprocessed signal components.
Step 3: The VMD-preprocessed noise components are denoised by SampEn-SVD to obtain the SVD-processed effective components and reserve the VMD preprocessed signal components without any processing.
Step 4: The SVD-processed effective components and the VMD-preprocessed signal components were reconstructed to effective component.
1. Denoising of GUW signals in steel strands based on the SampEn-SVD method
1.1. Experimental setup
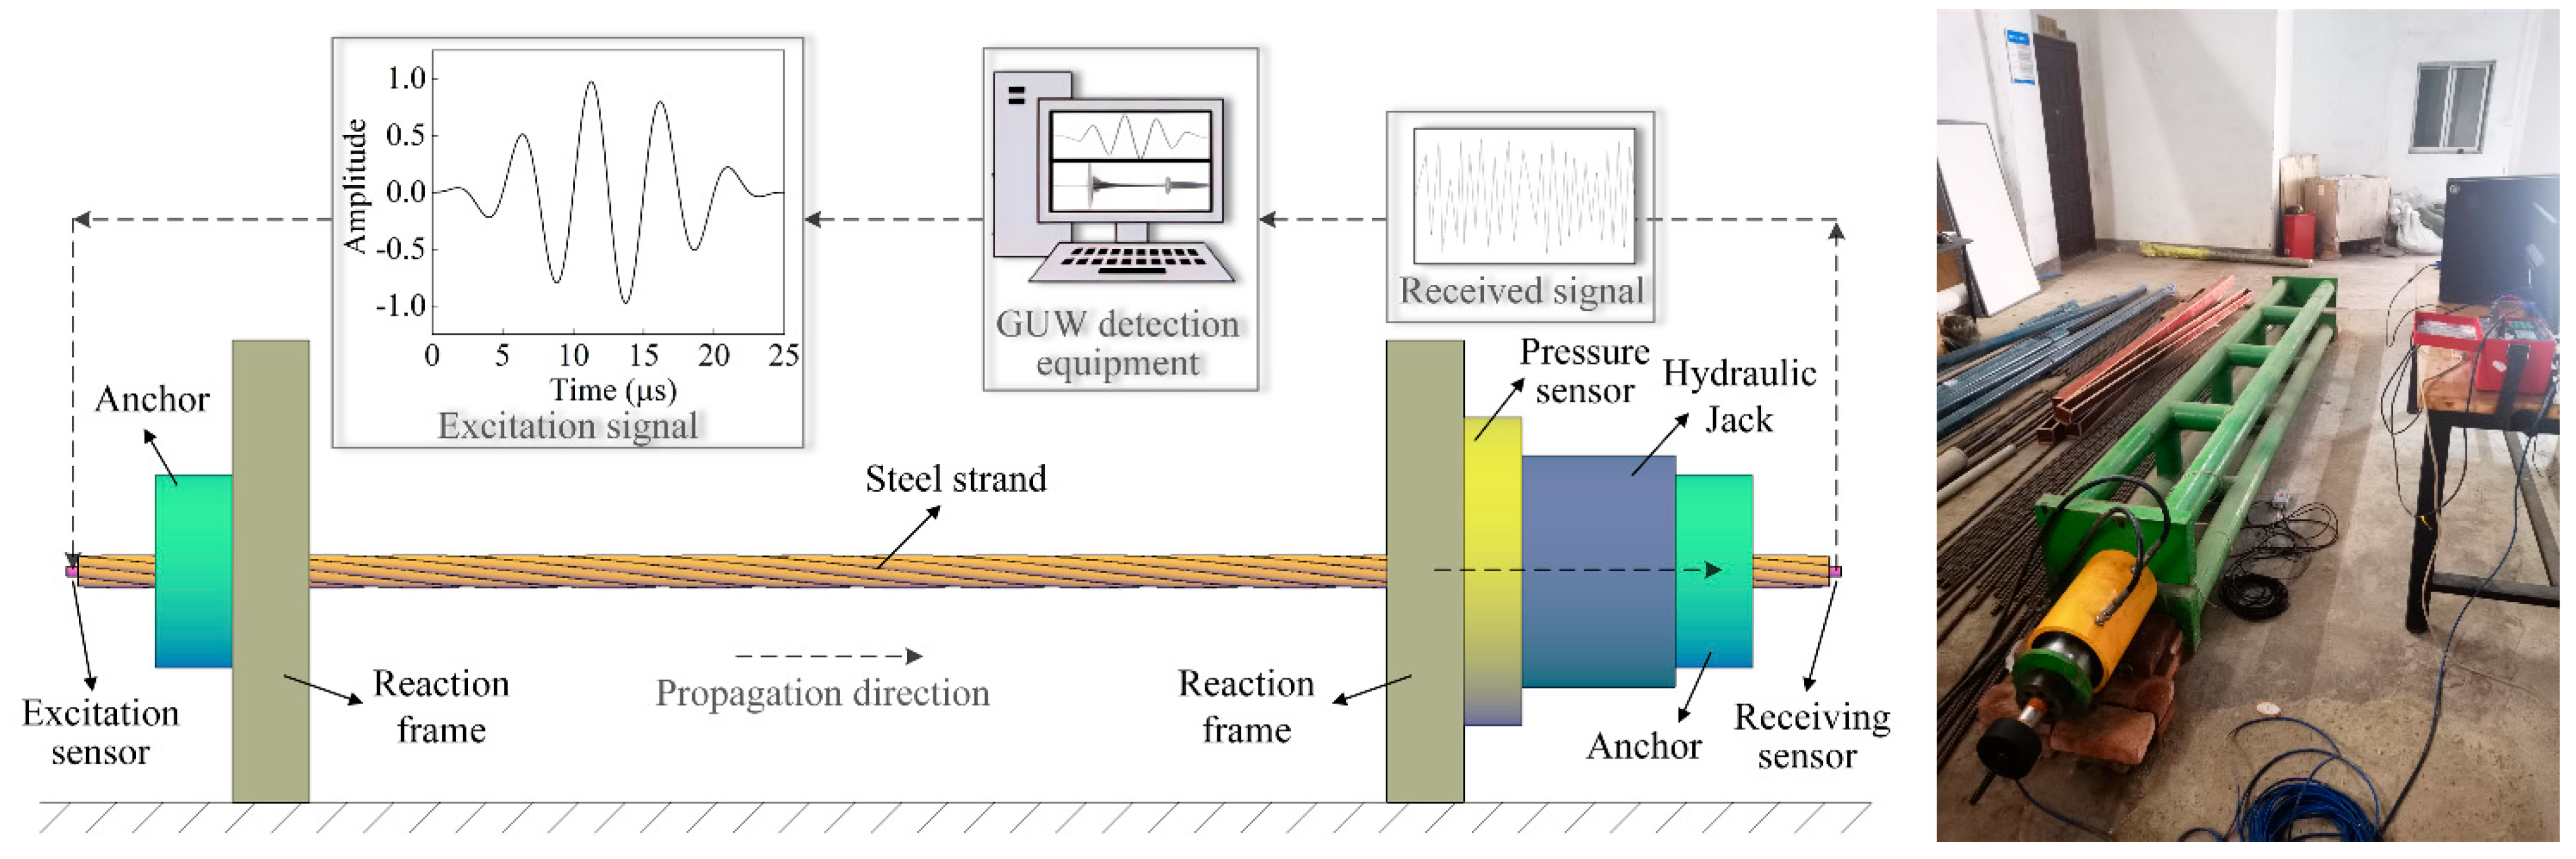
The GUW experimental setup for steel strands at different loading levels is shown in
Figure 2. The strands are seven-wire strands with a diameter of 15.2 mm. one end of the strand is fixed and the other end is loaded by hydraulic jack during loading. The strands were loaded from 0 to 204.8 kN (0-80% UTS, UTS is the ultimate tensile strength of the strand), and the load at each loading level was 25.6 kN (10% UTS). The strand was held for 5 minutes after each level of loading for excitation and receiver of GUW signals. The ultrasonic sensors with response frequency of 100~1000 kHz were arranged at the two end faces of the steel strand respectively by perfect vacuum silicon fat as coupling agent. The PCI-2 acoustic transmitter system from PAC, USA was used for the excitation and collection of GUW signals. The excitation source was a five-cycle sinusoidal signal with a center frequency of 200 kHz, and it was sampled at 2 MHz.
1.1. Denoising of measured signal
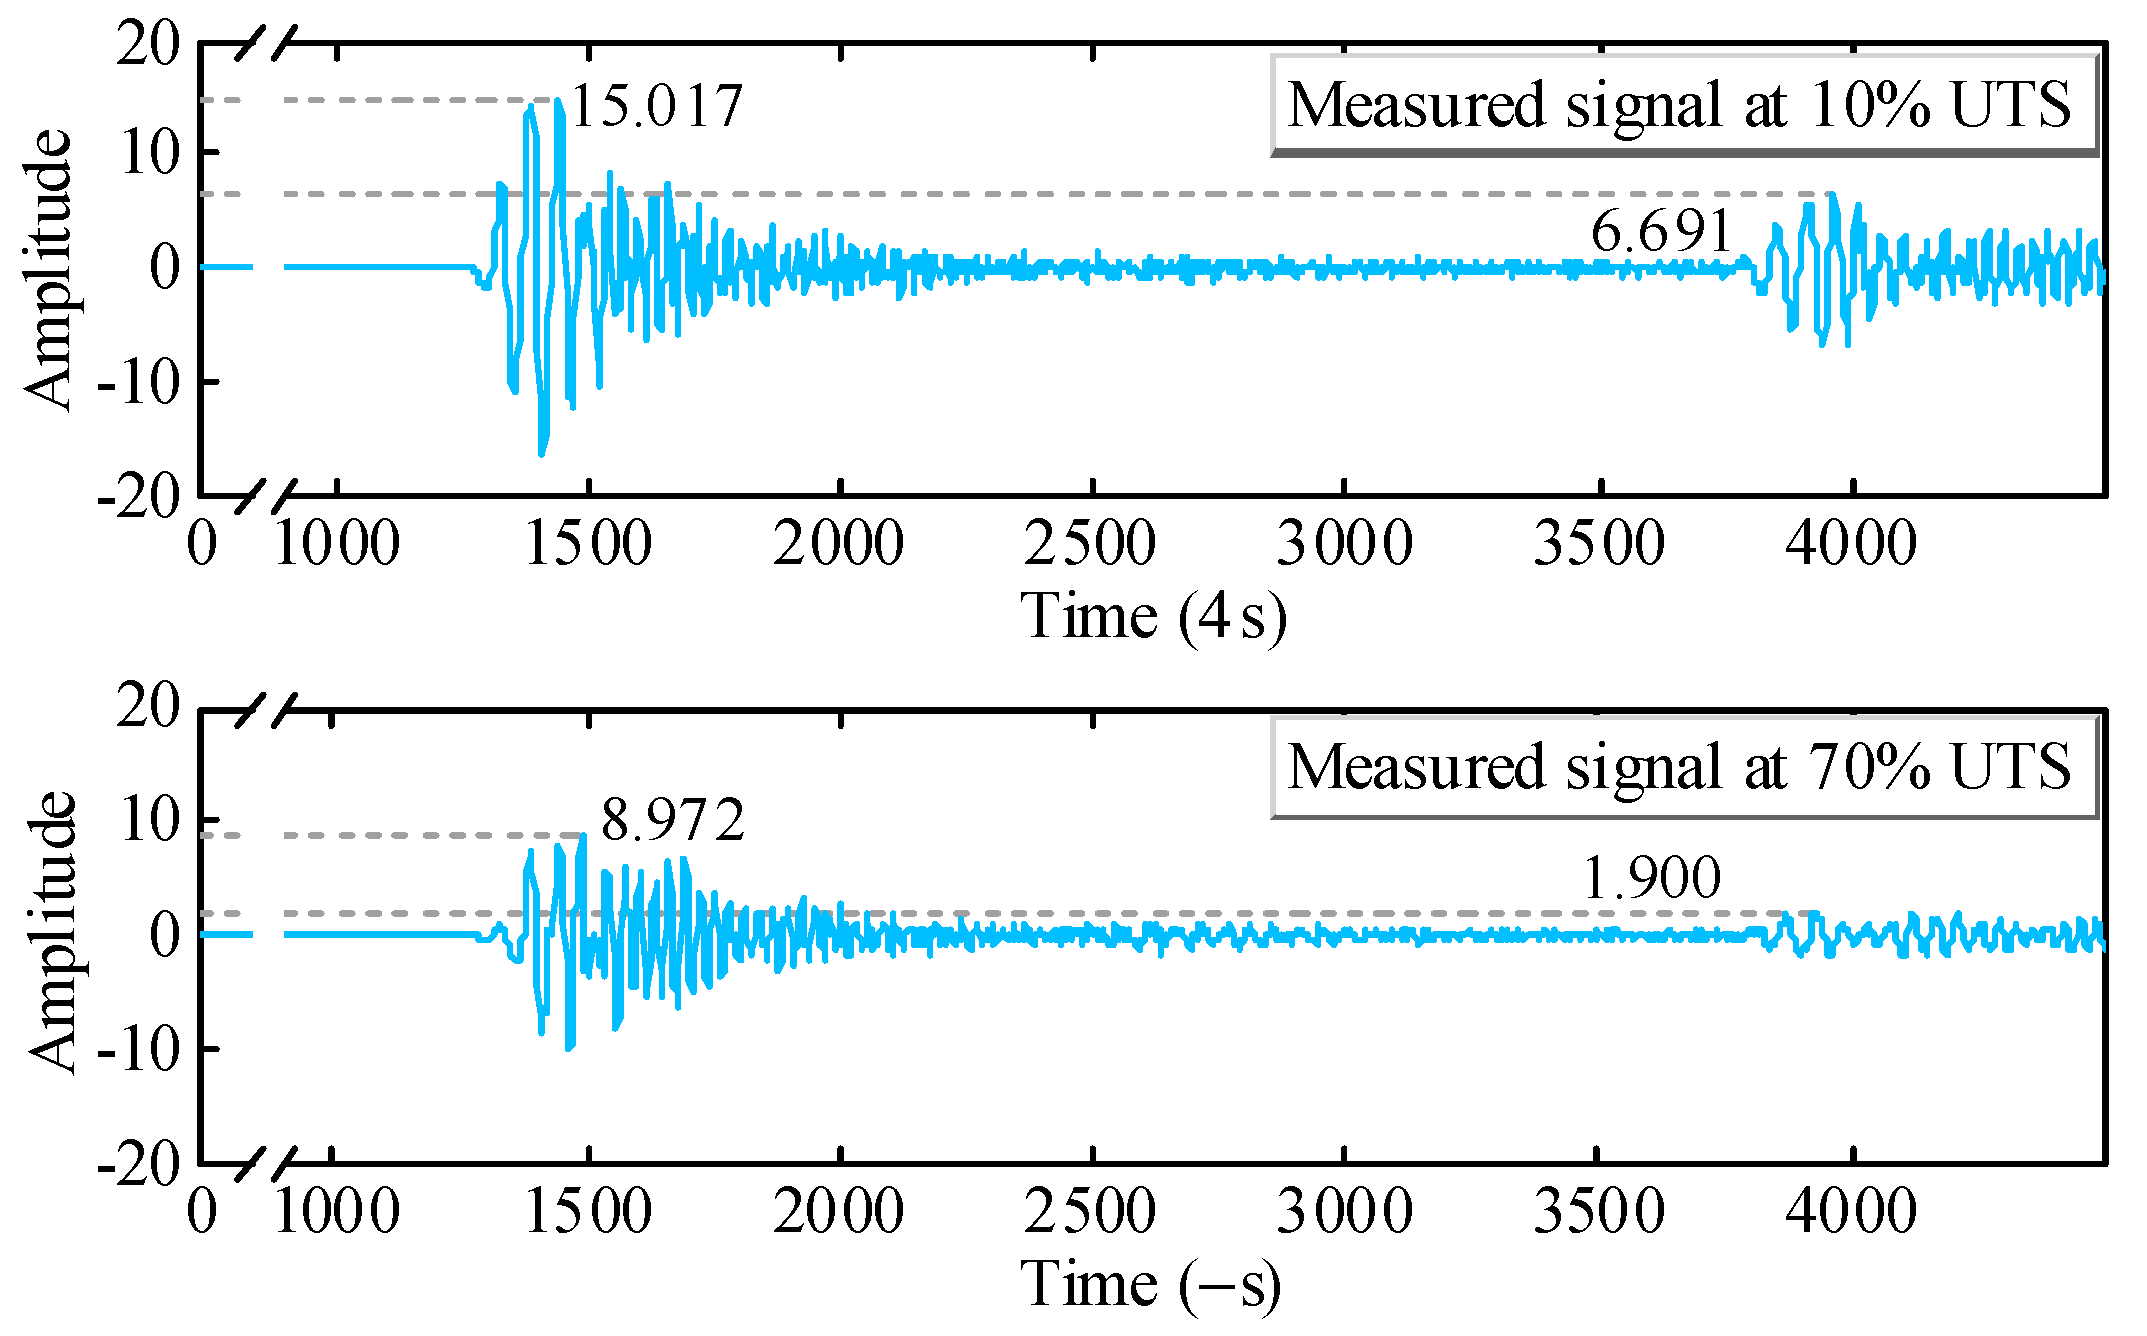
Since the contact stiffness between the seven wires of the strand is different at various load levels, the ultrasound propagating along the strand while maintaining the same excitation input will collect the GUW signals carrying different tension information. The time domain waveforms of GUW under the measured 10% UTS and 70% UTS conditions are shown in Error! Reference source not found.. When the tension is higher, the wires are in closer contact with each other, which will cause more ultrasonic energy to leak to the nearby wires and repeatedly transmit between multiple wires, and thus the ultrasonic amplitude will decay faster. This phenomenon is more obvious in the reflected wave with a longer propagation distance shown in Error! Reference source not found..
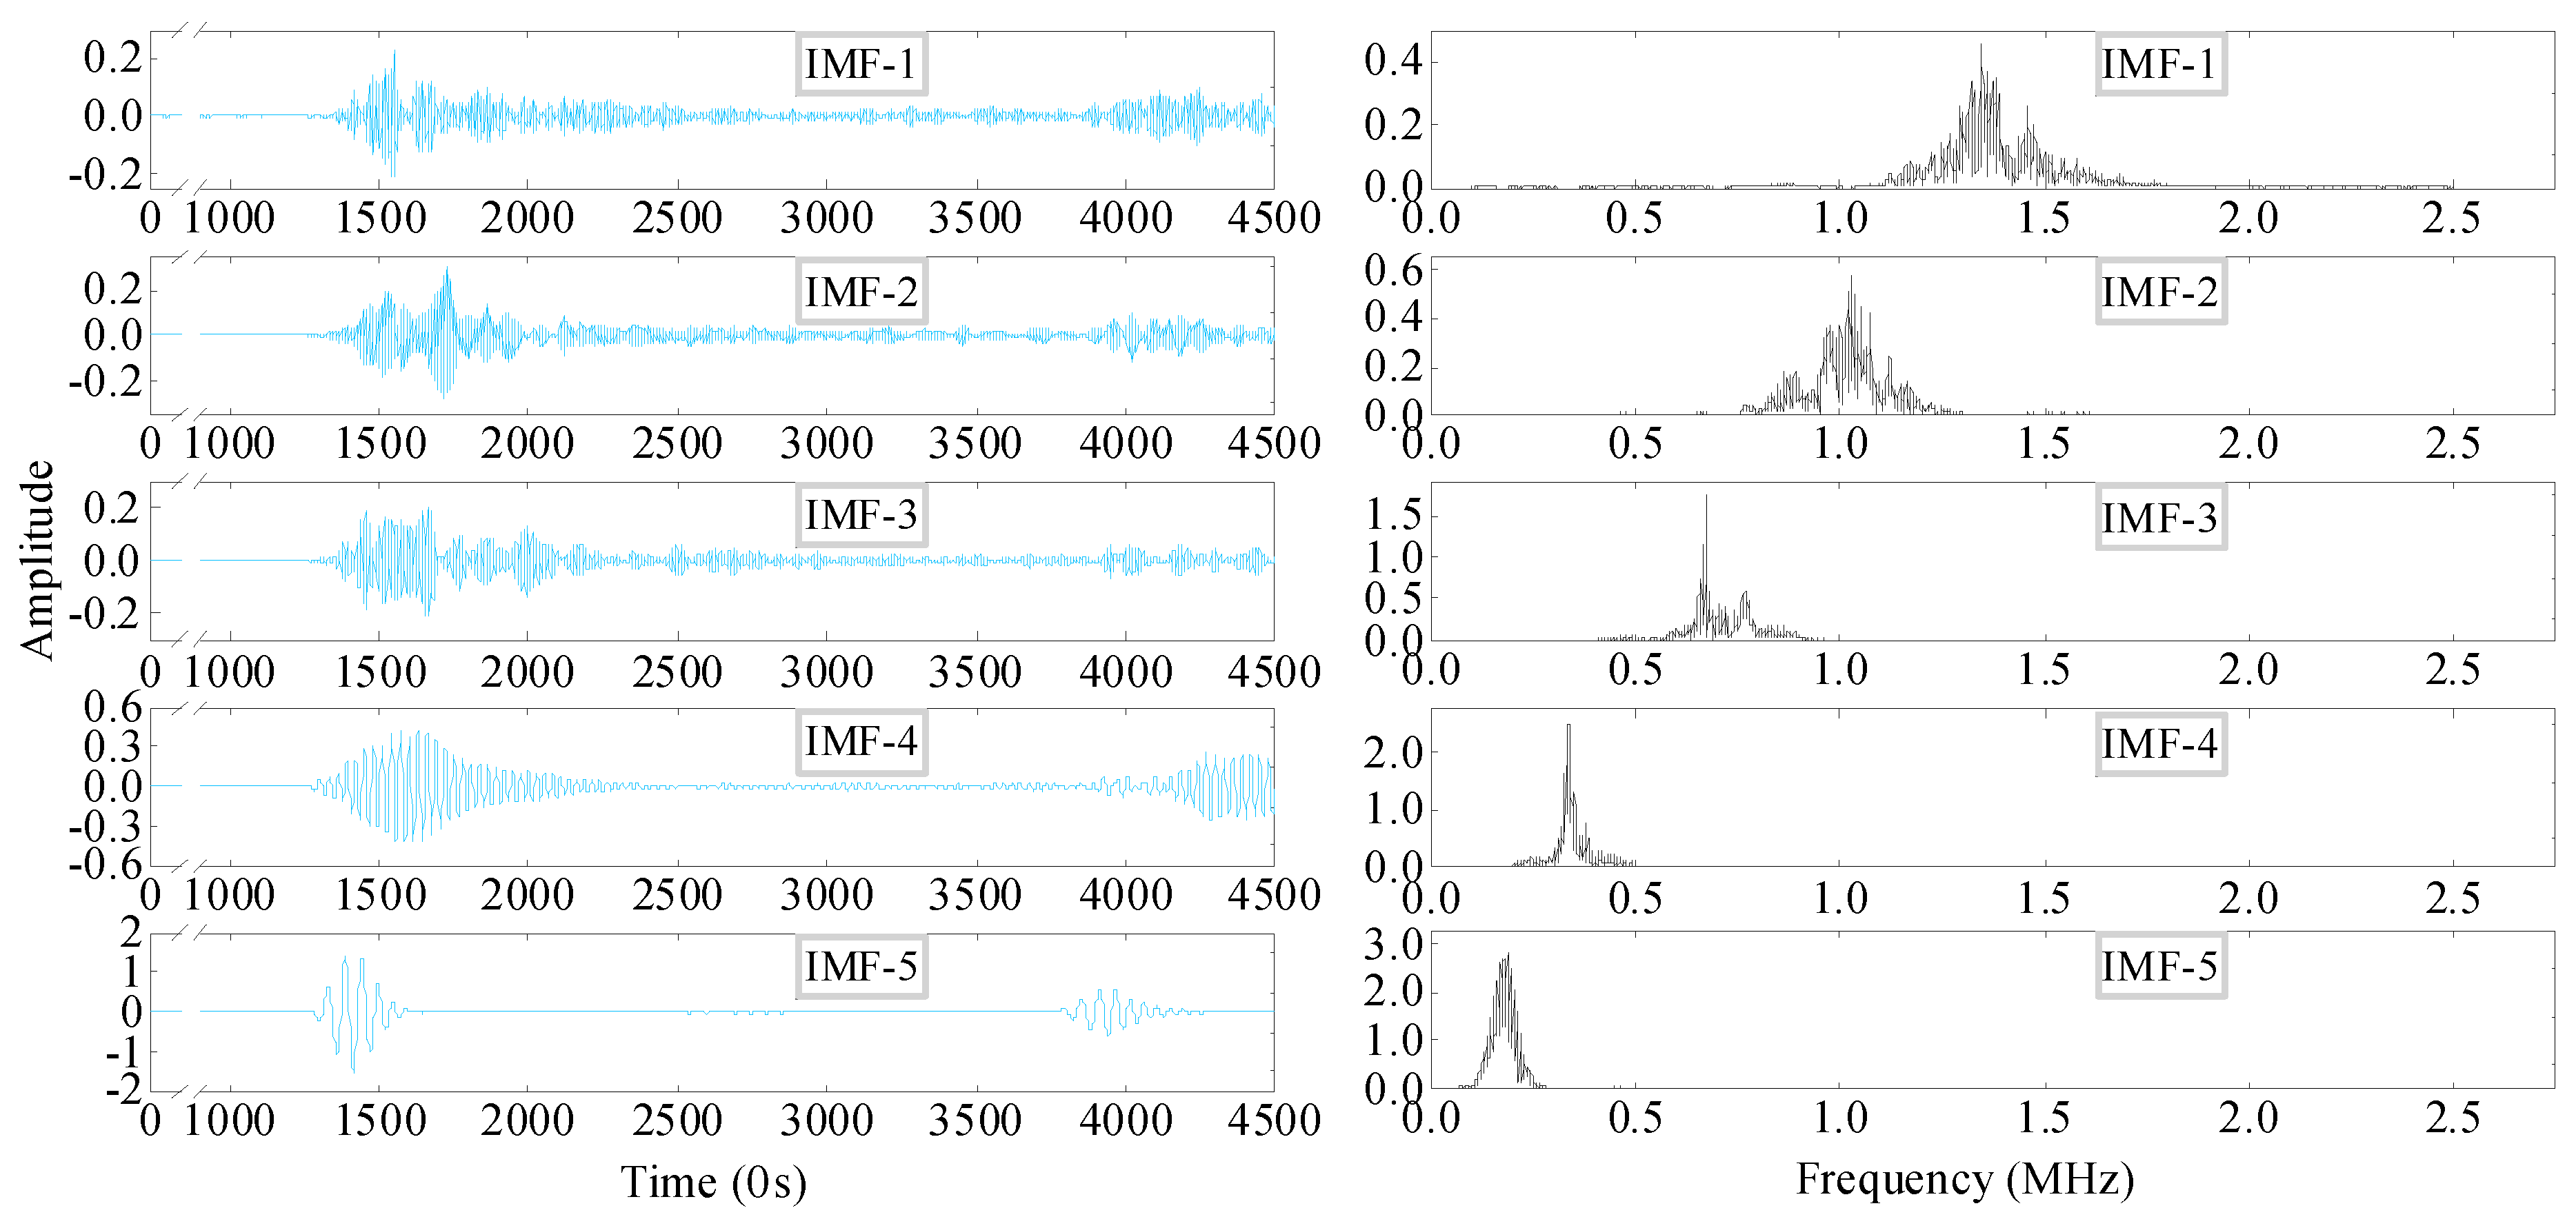
Firstly, the GUW signals under 10% UTS conditions were denoised by the VMD method, and the calculated center frequencies of each IMF at the different number of IMFs K are shown in Error! Reference source not found.. Once a similar frequency occurs, the K at this time is determined to be the best number of IMFs K. As the similar frequency starts from K = 6, K is determined to be 5, which indicates that the efficiency of the VMD method at this time is the best. The IMF components are shown in Error! Reference source not found.. The correlation coefficients between each IMF component and measured signal are shown in Error! Reference source not found.. From Error! Reference source not found., the IMF-5 has the highest energy and the center frequency is around 200kHz, which is closest to the frequency of excitation signal.
Then the correlation coefficients of each IMF component are calculated as shown in Error! Reference source not found.. The correlation coefficient of IMF-1 is the lowest relative to other IMF components, and it has the lowest energy in Error! Reference source not found.. IMF-1 is discarded because it is a high frequency noise component. Therefore, IMF-5 belong to the signal component, and IMF-2, IMF-3, and IMF-4 belong to the noise component.
Table 1.
The center frequencies of the IMF components corresponding to different K.
Table 1.
The center frequencies of the IMF components corresponding to different K.
| The number of IMFs K
|
Center frequency (MHz) |
| IMF-1 |
IMF-2 |
IMF-3 |
IMF-4 |
IMF-5 |
IMF-6 |
| 2 |
0.337 |
0.186 |
|
|
|
|
| 3 |
1.030 |
0.337 |
0.186 |
|
|
|
| 4 |
1.346 |
0.674 |
0.337 |
0.186 |
|
|
| 5 |
1.346 |
1.030 |
0.674 |
0.336 |
0.186 |
|
| 6 |
1.346 |
1.030 |
0.674 |
0.336 |
0.194 |
0.166 |
Figure 4.
IMF components under VMD method processing (10% UTS).
Figure 4.
IMF components under VMD method processing (10% UTS).
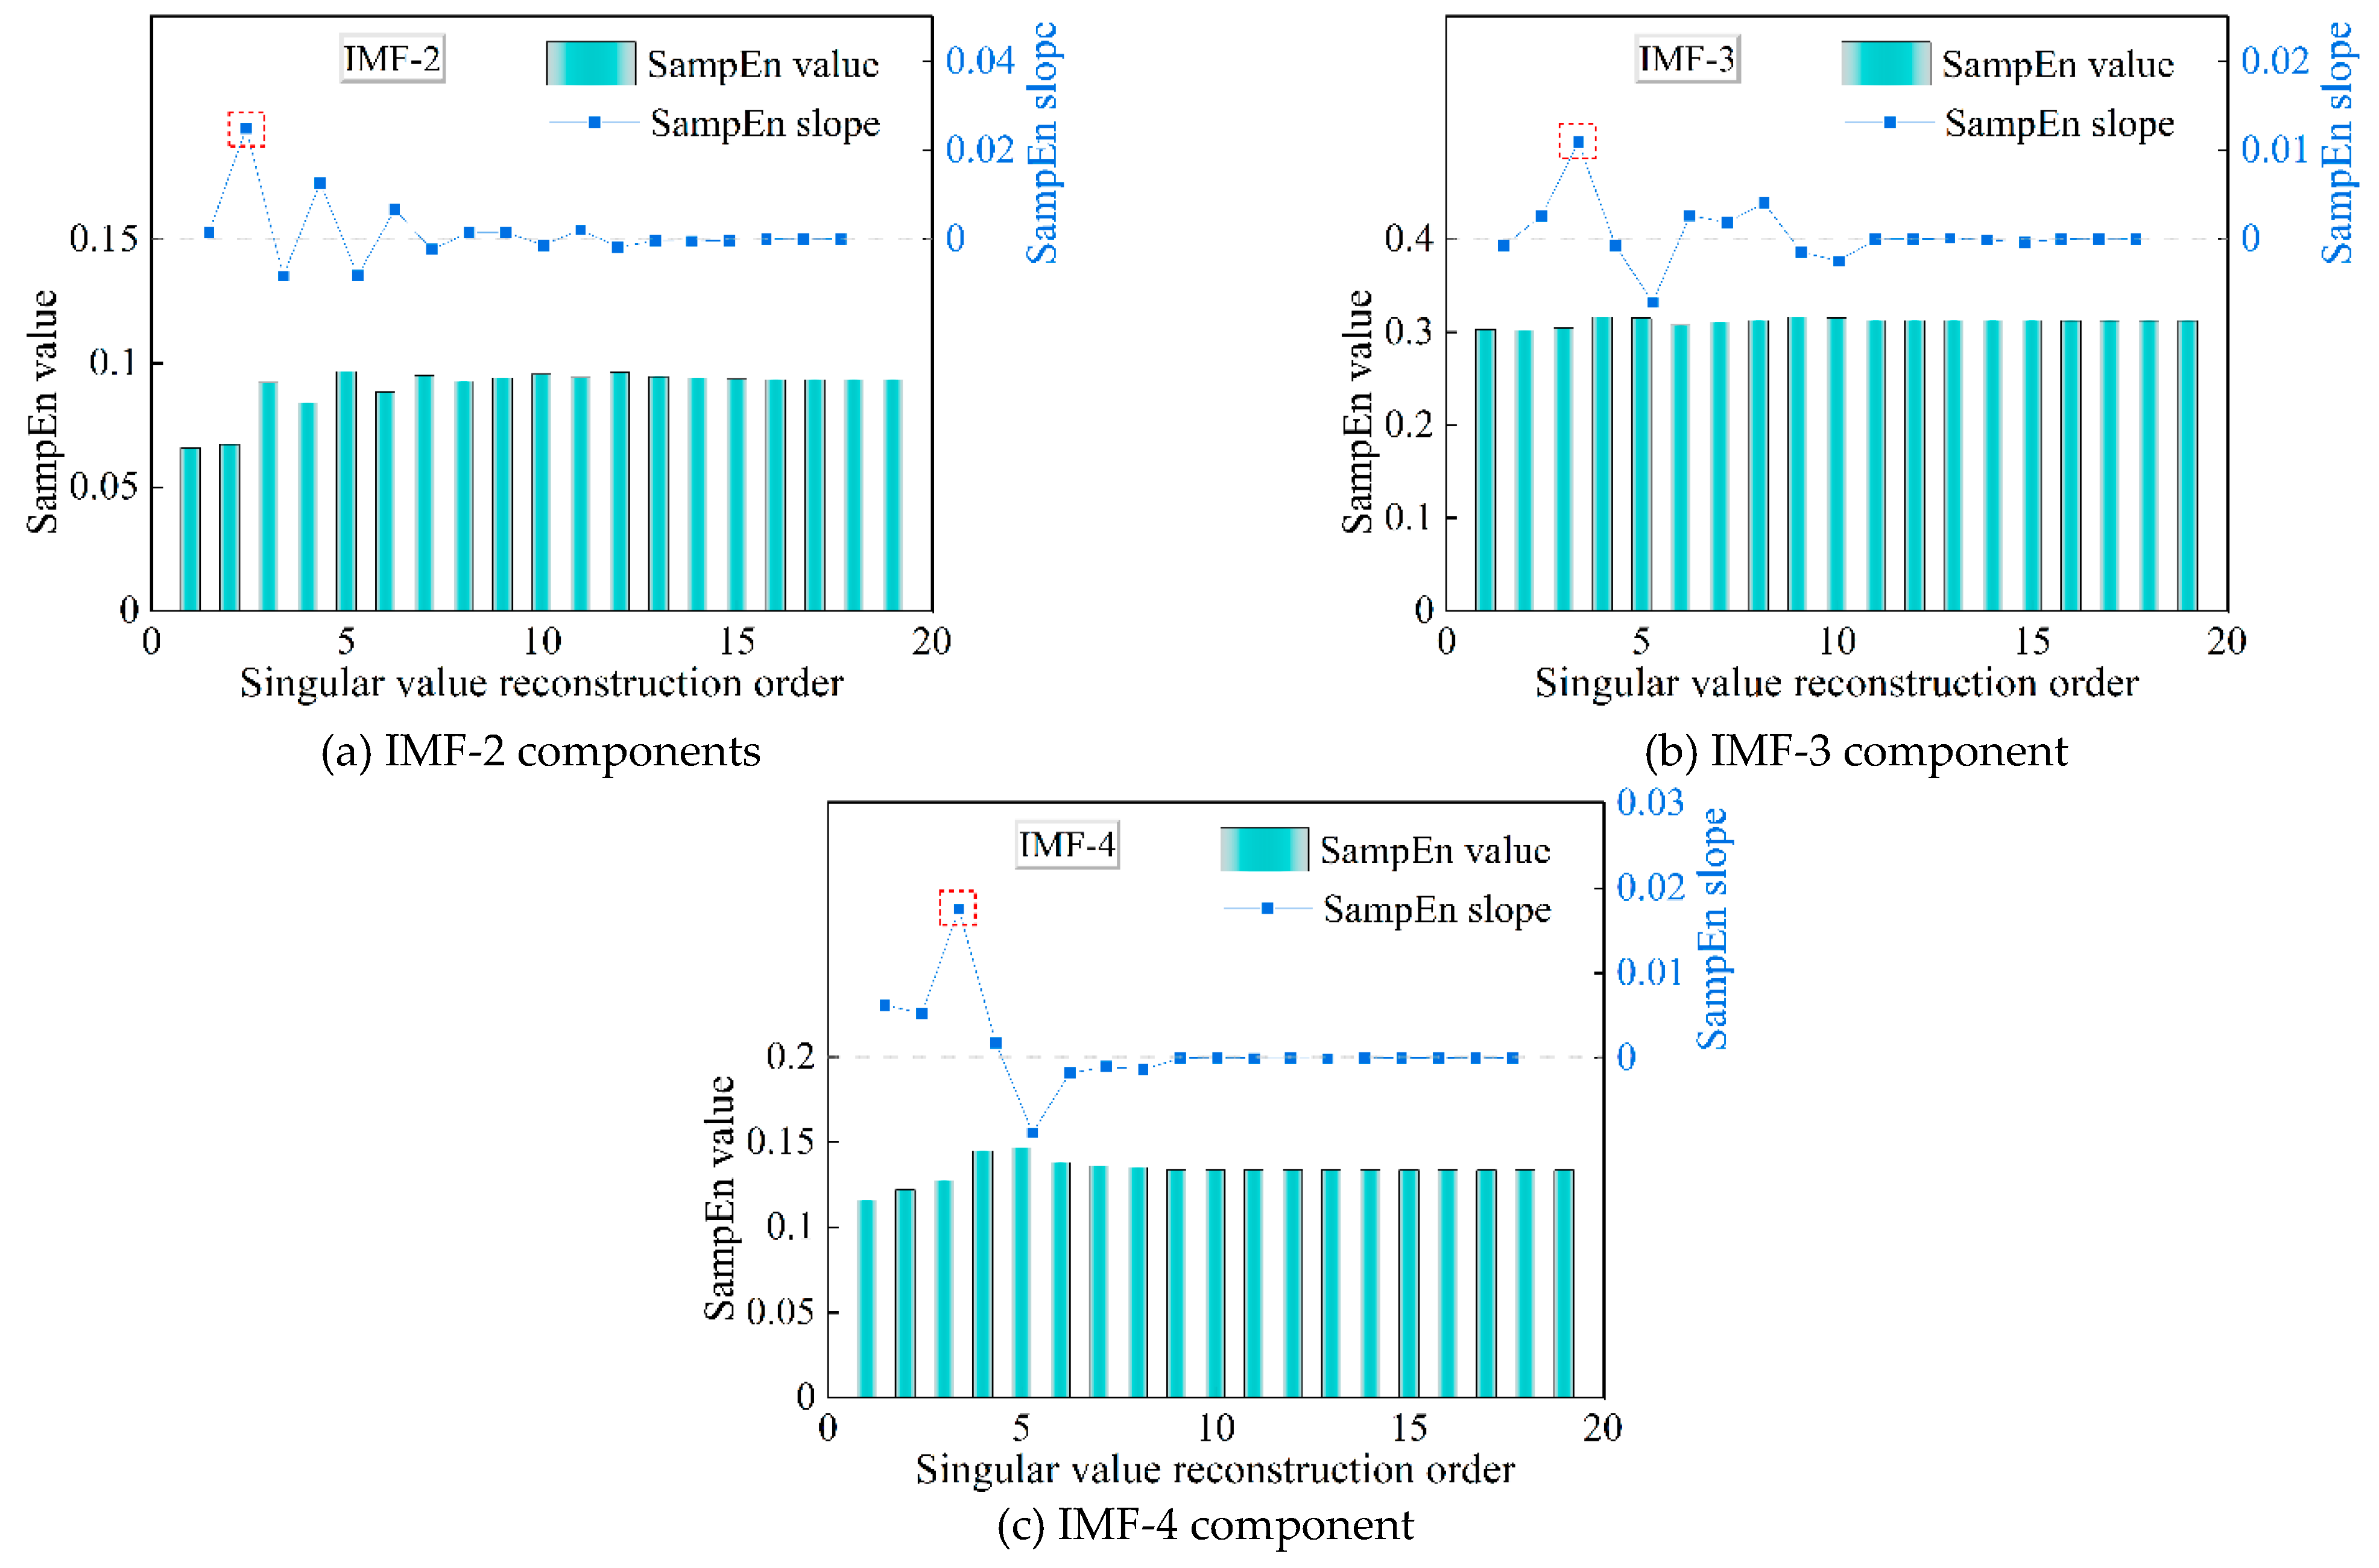
It has been pointed out previously that more useful information can be obtained from the high frequency noise by further denoising of the VMD-preprocessed noise component. Therefore, the selected IMF-2, IMF-3 and IMF-4 components were continued to be denoising by the SampEn-SVD method to obtain useful information about the signals in the high frequency part. According to the principle of maximum SampEn slope, the effective rank of singular values of IMF-2, IMF-3 and IMF-4 components are determined to be 2, 3 and 3, respectively, as shown in Error! Reference source not found..
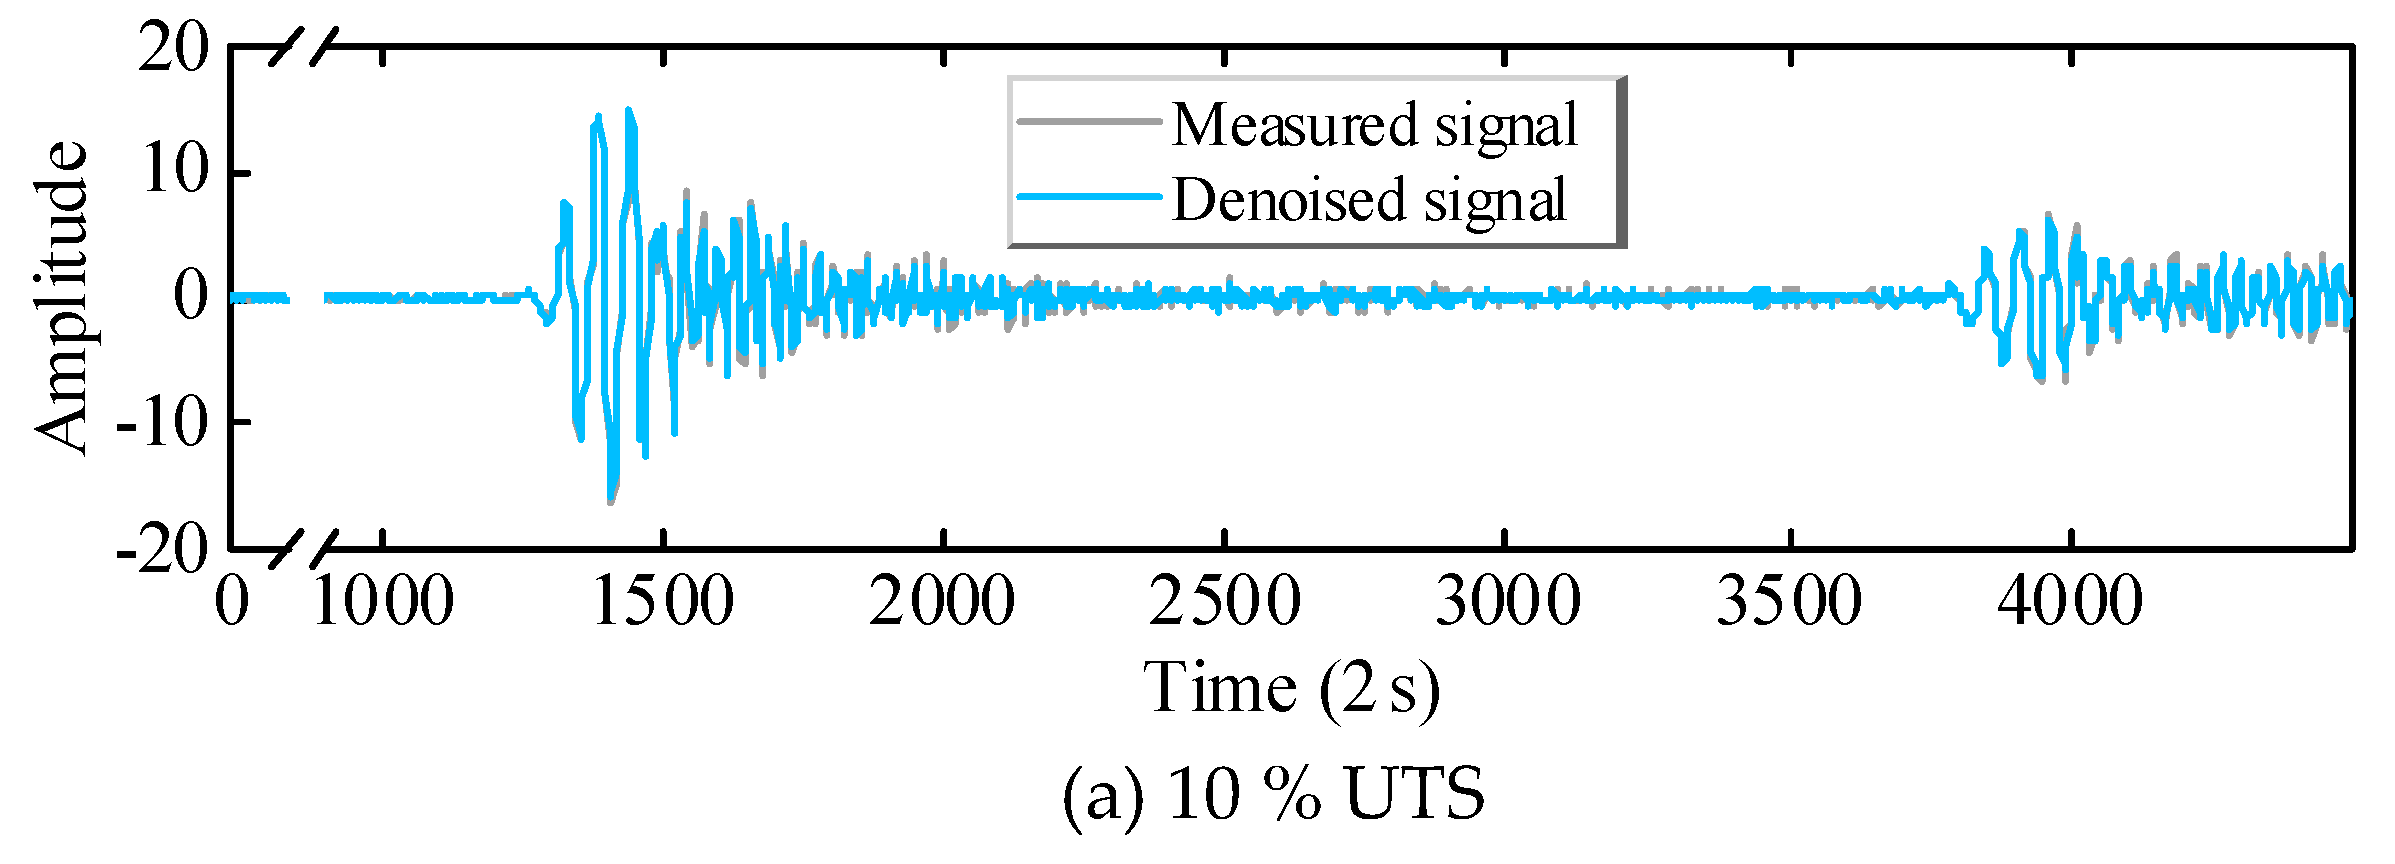
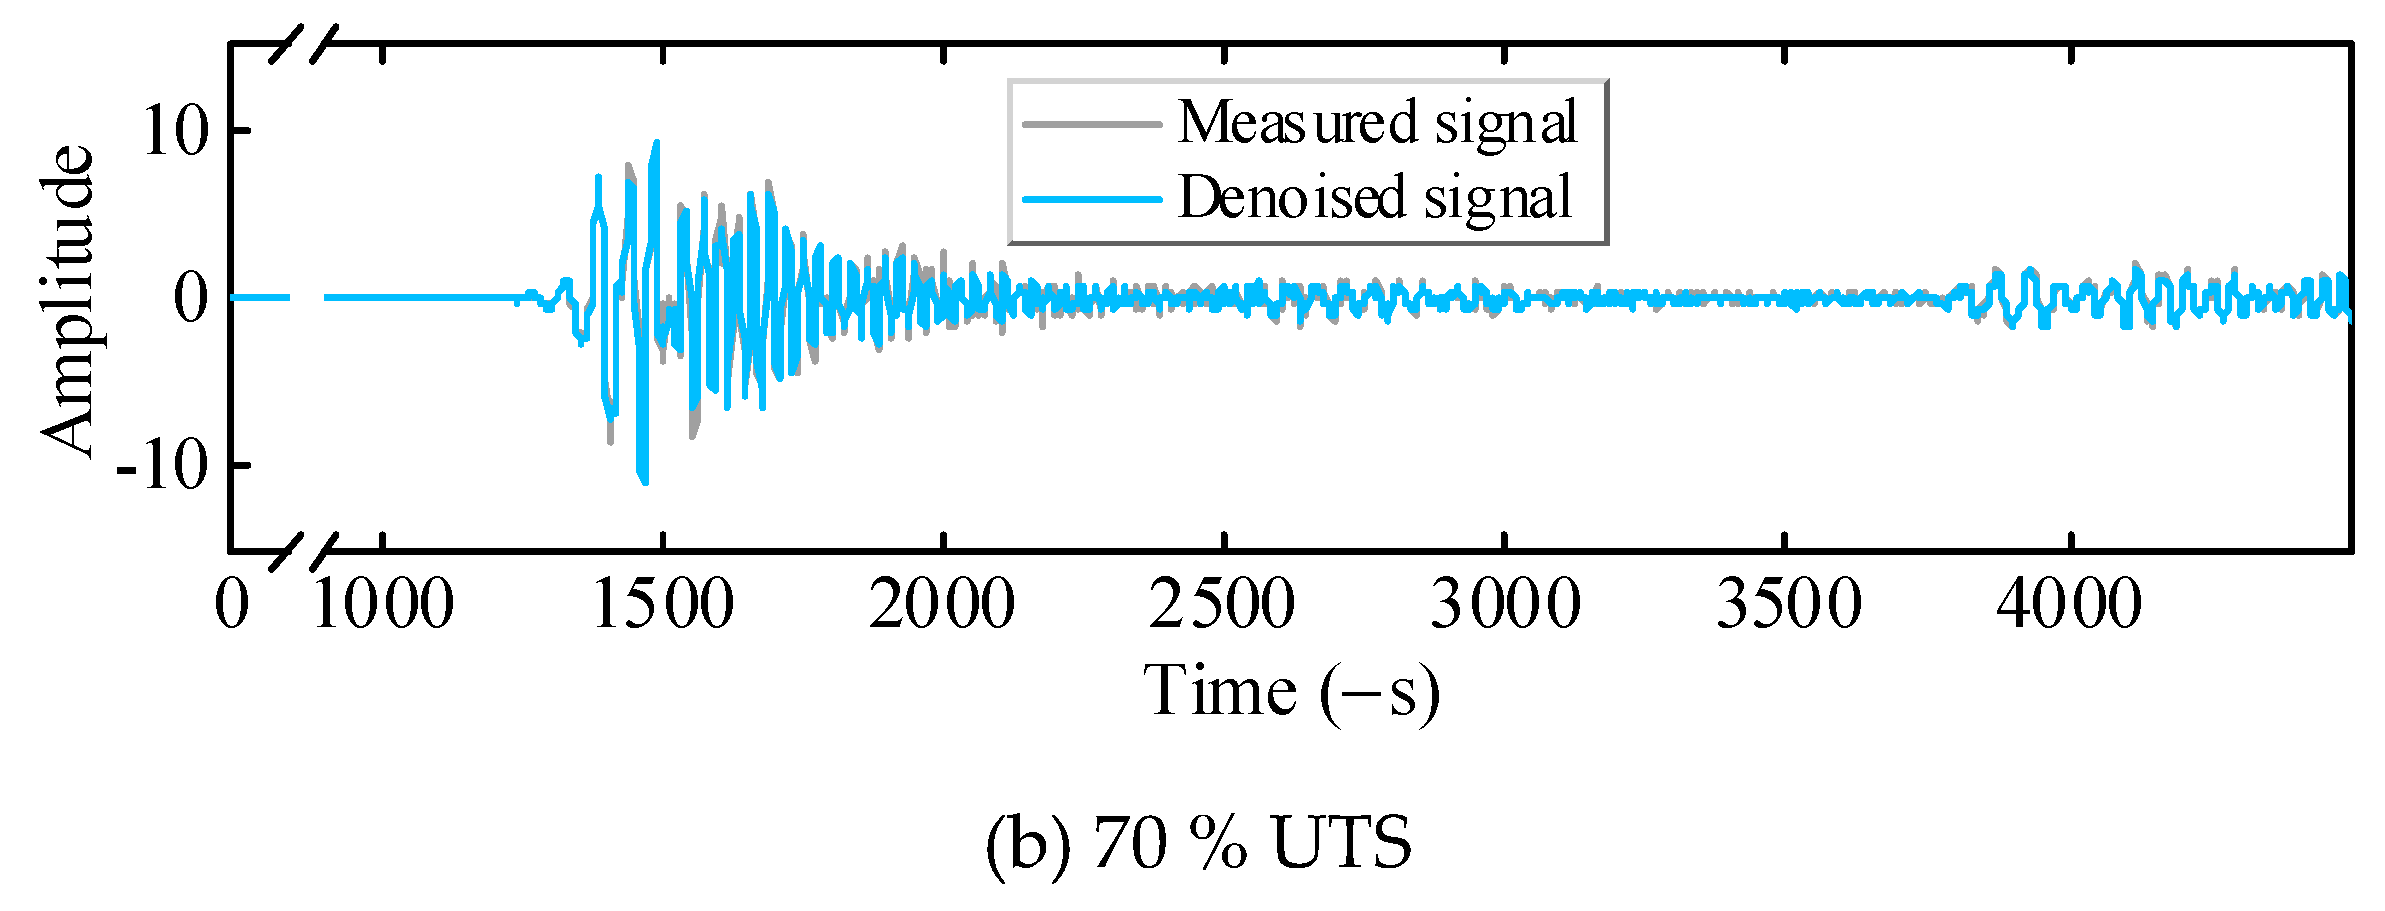
The effective component of each IMF component (IMF-2, IMF-3, IMF-4) is obtained by inverse transformation of Hankel matrix of the SVD method, and this effective component is reconstructed with the signal component (IMF-5 components) can be reconstructed to finally obtain the denoised signal at 10% UTS as shown in Error! Reference source not found.. The same denoising method was applied to the measured signal at 70% UTS, and the corresponding denoised signal thus obtained is shown in Error! Reference source not found..
Figure 5.
SampEn of reconstructed signal with different IMF components at different orders.
Figure 5.
SampEn of reconstructed signal with different IMF components at different orders.
Compared with the initial signal, the final denoised signal has a smooth waveform. The first echo of the denoised signal shows waveform conversion and dispersion effects due to end-plane reflections. This indicates that the proposed denoising method can effectively filter out the noise part, which makes the signal more observable and helps the subsequent spectrum analysis and feature extraction analysis.
Figure 6.
Reconfiguration signals after denoising at 10% UTS and 70% UTS.
Figure 6.
Reconfiguration signals after denoising at 10% UTS and 70% UTS.
1.1. Comparison with other denoising methods
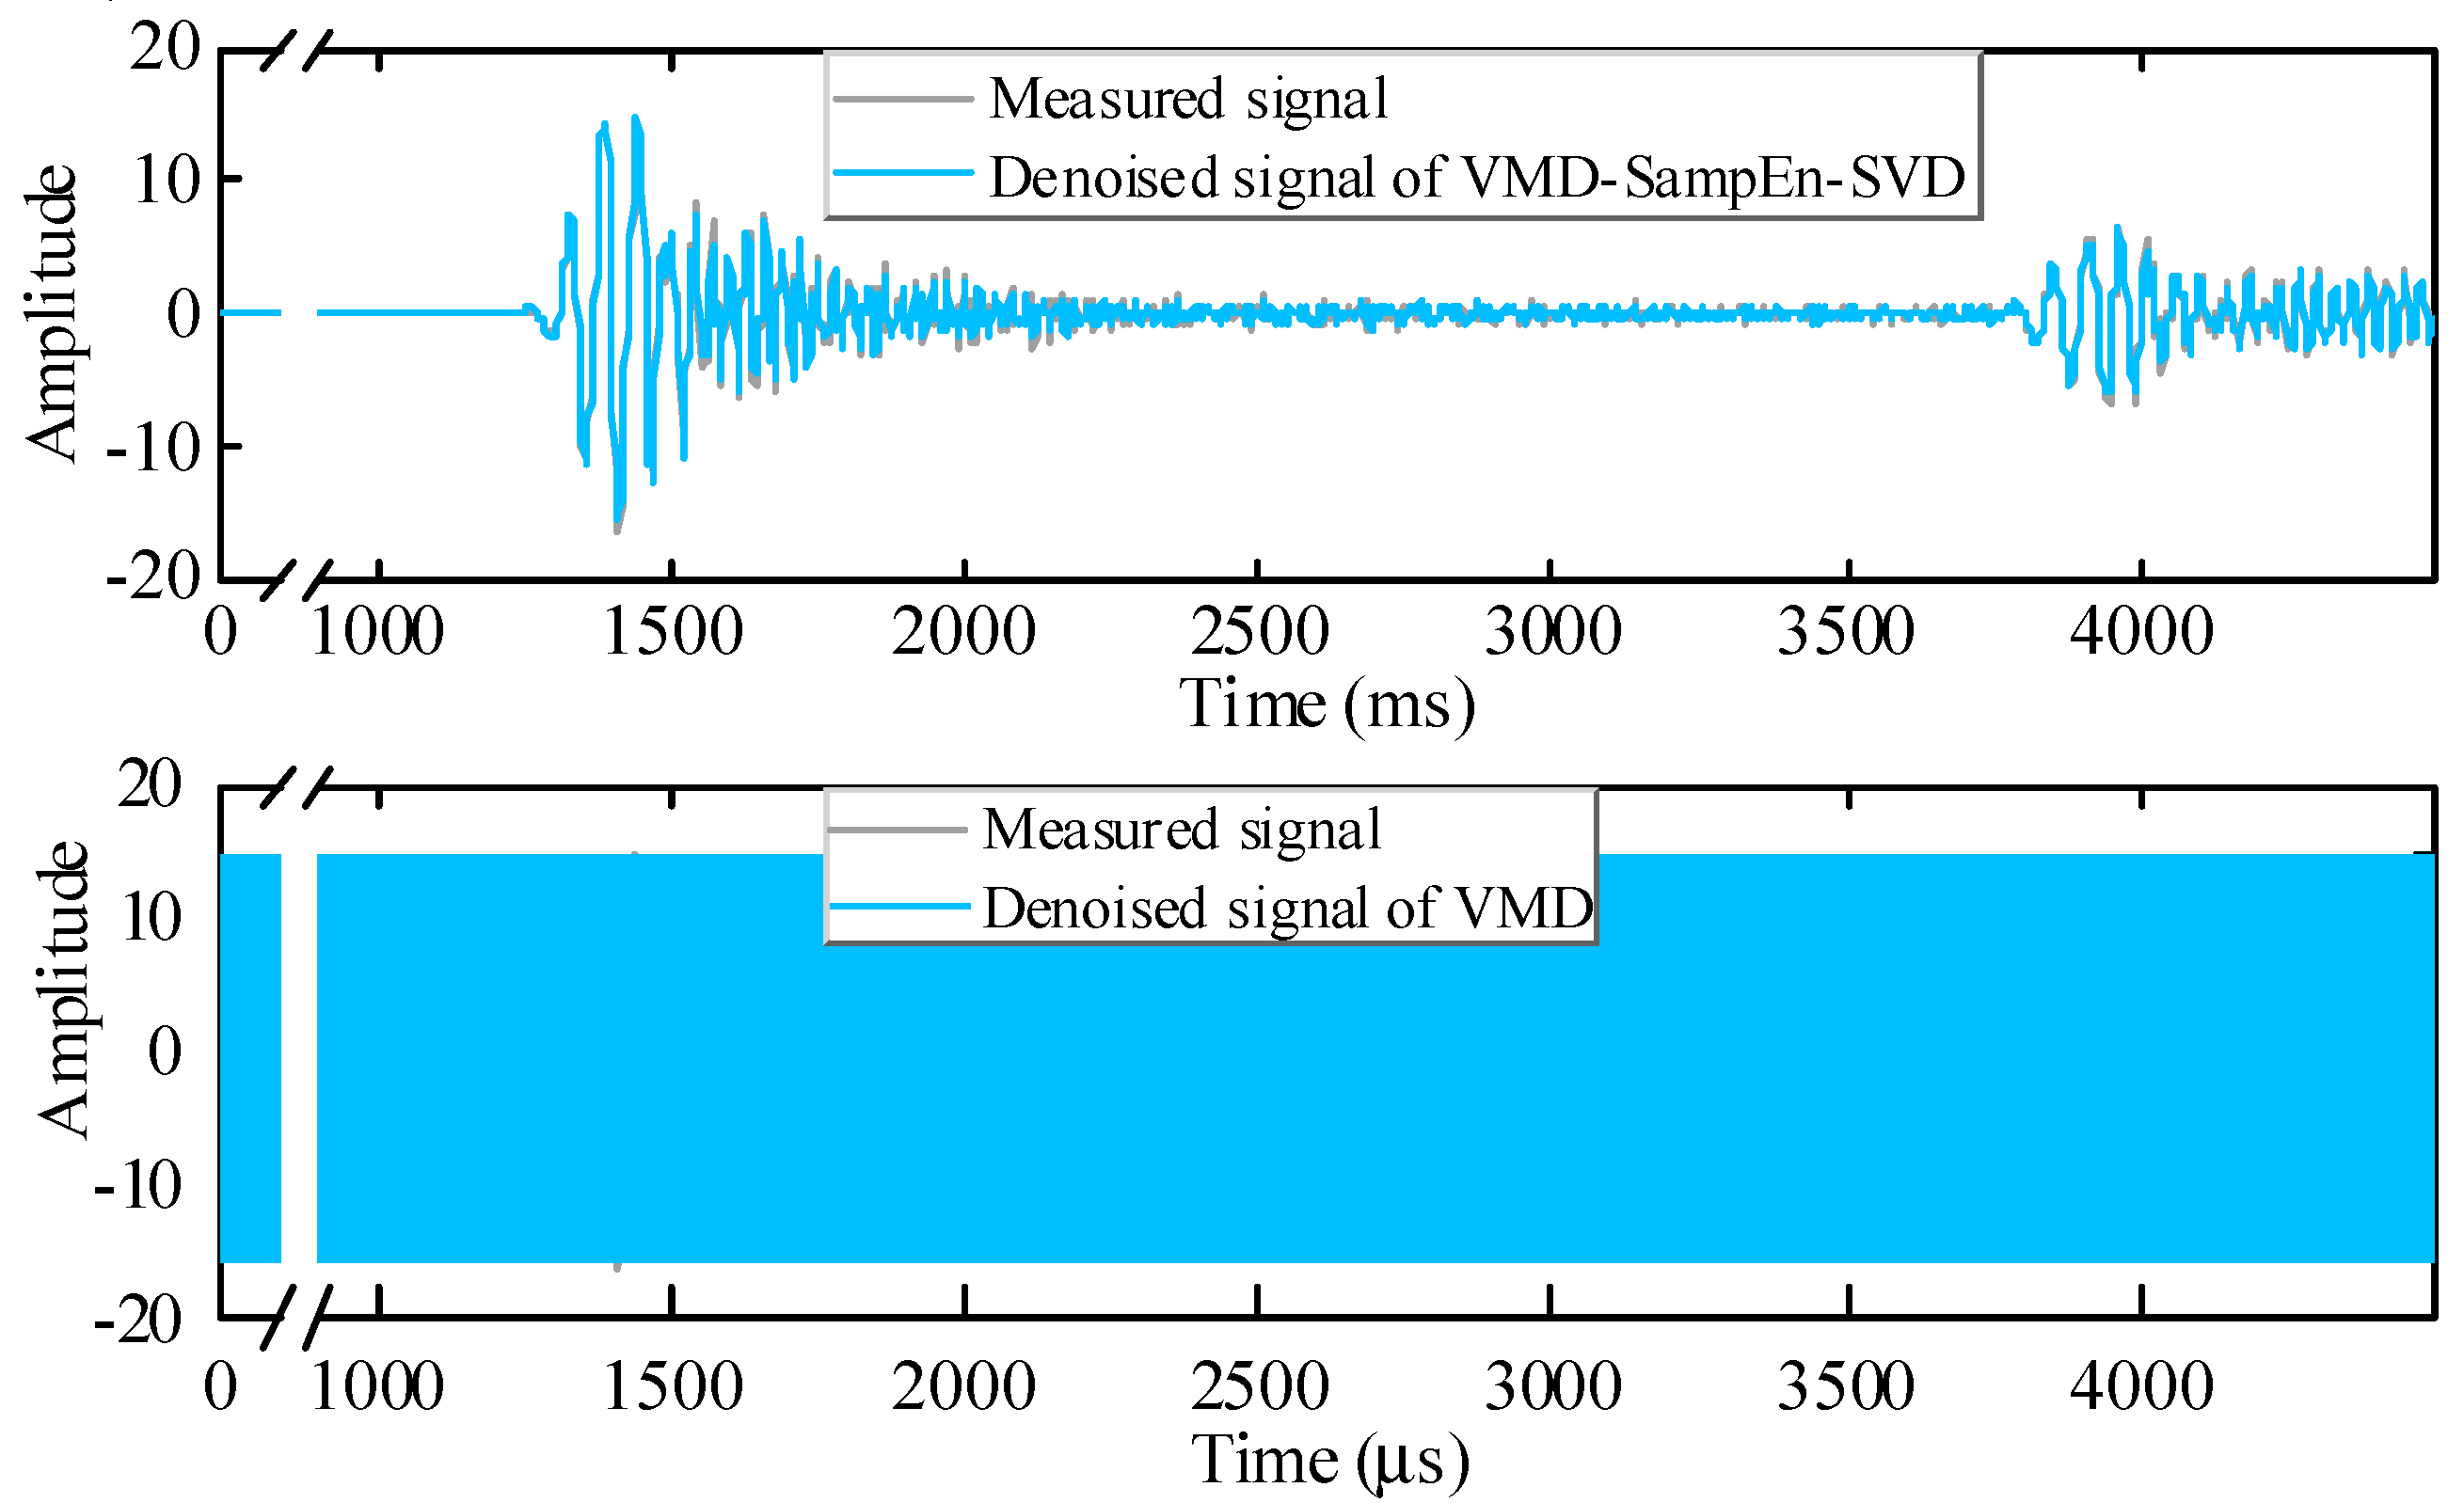
To evaluate the effectiveness of the SampEn-SVD method on the VMD-preprocessed noise component, the VMD method [
29] is comparatively analyzed for their denoising effect. The denoised signal is shown in
Figure 7, and the results of root mean squared error (RMSE) and SNR (see Eq. (13)-(14)) with respect to the initial signal are shown in
Table 3.
where
i is the number of sampling points,
N is the sample size,
x(
i) is the initial signal and
(
i) is the denoised signal.
The denoised signals processed by various denoising methods are able to reduce the RMSE and increase the SNR as shown in
Table 3. The RMSE is reduced by 31.19% and SNR is increased by 23.56% for the VMD-SampEn-SVD method compared to the VMD method. This shows that the VMD-SampEn-SVD method has the optimal noise reduction performance. This method is able to ensure the least loss of useful information (that is, minimum RMSE) and achieve the maximum noise suppression effect (that is, maximum SNR).
1. Conclusions
Aiming at the problem that it is difficult to characterize the stress state of steel strand with measured GUW signals in a noisy background, the SampEn-SVD method is proposed on the basis of the VMD-preprocessed component. This method can obtain effective signals to characterize the stress state of steel strand and reduce the loss of useful information in the denoising process. The effectiveness of this method is demonstrated based on measured data.
The proposed VMD-SampEn-SVD method has a better denoising effect by comparing with the VMD, and the basic characteristics of the signal are well preserved. The mean value, average rectified value, root mean square, form factor, margin factor, spectral centroid and Wavelet scale energy entropy are more suitable as feature index for characterizing strand stress. The sensitivity of strand stress identification by using combined eigenvector is better. Therefore, the VMD-SampEn-SVD method proposed in this paper has some practical research value and can lay a good foundation for further detection and identification of strand stress.
