1. Introduction
Various water bodies of the Northern Hemisphere (lakes, ponds, reservoirs, bays, wetlands, etc.) are an important component of boreal and subarctic landscapes. They are also an important element of the regional carbon budget. Water bodies function as carriers and converters of large amounts of carbon produced naturally and anthropogenically. They serve as passive channels for the transfer of carbon from soil to sea, and also remove carbon from the terrestrial environment into the atmosphere and precipitate it into bottom sediments [
1,
2,
3,
4].
Climate warming has a huge impact on the functioning of aquatic ecosystems. An important factor in these dynamics is organic carbon, which is associated with several vital functions of the ecosystem through its influence on biological production and the physicochemical properties of water areas. Works [
1,
2,
3,
4] show a close connection between water bodies of the subarctic and boreal zone and the terrestrial environment. High latitude ecosystems are undergoing major transformations under climate change. However, the mechanisms of positive and negative climate feedbacks are not fully understood. Particularly important to the global carbon budget is the future of the vast carbon reserves in northern wetlands. The removal of organic carbon from terrestrial environments is expected to increase in northern regions as temperatures and precipitation increase. The presence of permafrost areas may provide an additional contribution to carbon removal during thawing. Because of the close catchment-lake interactions, climate change may result in positive feedbacks that accelerate the movement of terrestrial carbon into the atmosphere through the aquatic environment.
The role of lakes, reservoirs, and wetlands in the transport and transformation of dissolved inorganic carbon depends on the characteristics of each water body. For example, in-water consumption and production of CO
2 may be the most important driver of carbon dynamics in warm eutrophic lakes (see
Appendix A), while lateral transport of CO
2 may be very significant in boreal and subarctic lakes [
5].
At high latitudes, a decrease in the duration of snow cover and permafrost thawing lead to an increase in the content of organic carbon in nearby waters [
6]. Changes in the duration of ice and snow cover, as well as permafrost degradation, affect the flow of carbon from a watershed, affecting both runoff and vegetation. The duration of the main growing season and runoff is determined by the average annual air temperature. This time interval appears to be a good predictor of changes in organic carbon concentrations over time and space scales [
7]. CO
2 content in inland waters often shows significant variability on a seasonal scale [
4]. Compared to other seasons of the year, CO
2 concentrations in summer are generally low due to the intense photosynthesis of phytoplankton in lakes and reservoirs, which absorb carbon dioxide in the water column. The period of ice melting is a critical time interval for CO
2 emissions from boreal and subarctic waters [
8,
9,
10]. Accumulated CO
2 trapped in ice and subglacial water can be quickly released into the atmosphere when the ice sheet melts. In oligotrophic lakes (see
Appendix A), seasonal variations in CO
2 concentration may be caused by changes in dissolved inorganic carbon and allochthonous organic matter [
4].
The work [
9] presents data on the variability of the partial pressure of carbon dioxide (pCO
2) under ice for 506 Swedish and Finnish lakes. These data were obtained either by direct measurements or calculated from total inorganic carbon, alkalinity, pH, water temperature and altitude, using various methods. Research has shown that water chemistry and lake morphometry are more important determinants of subglacial pCO
2 at a regional scale than climate variables (air temperature and ice duration). The accumulation of CO
2 in subglacial lakes occurs due to microbial mineralization of nutrients and organic matter in bottom sediments and the influx of CO
2 from the catchment area before the ice begins to melt. The paper [
9] concludes that, on a regional scale, carbon cycling in ice-covered lakes and subsequent CO
2 emissions due to ice melting are important components of annual carbon dioxide emissions. Given the potential for significant ecosystem changes in ice-covered lakes, studies of the ice period in a global assessment of CO
2 emissions should include monitoring not only its duration, but also changes in the trophic status of lakes.
Analysis of the processes associated with organic and inorganic carbon in various water bodies (including biological activity, physical mixing, thermodynamic process and gas exchange between air and water) becomes the key to understanding their role in the global carbon cycle, as well as climate changes occurring on our planet.
The present work is devoted to assessing the relationship between reanalysis data on the carbon dioxide content in the atmosphere and SMOS (Soil Moisture and Ocean Salinity) satellite data on the phenological phases of various water bodies of the Northern Hemisphere located in the boreal and subarctic zone for 2012–2020. The goal of the work was to show the seasonal cyclicity of CO2 concentration over various water bodies, which is associated with phenological phases. For all such objects, the dynamics of CO2 concentration is similar, and its maximum is observed at the beginning of the spring period, when the snow cover melts, the ice collapses and the soil surface thaws.
2. Water bodies under study
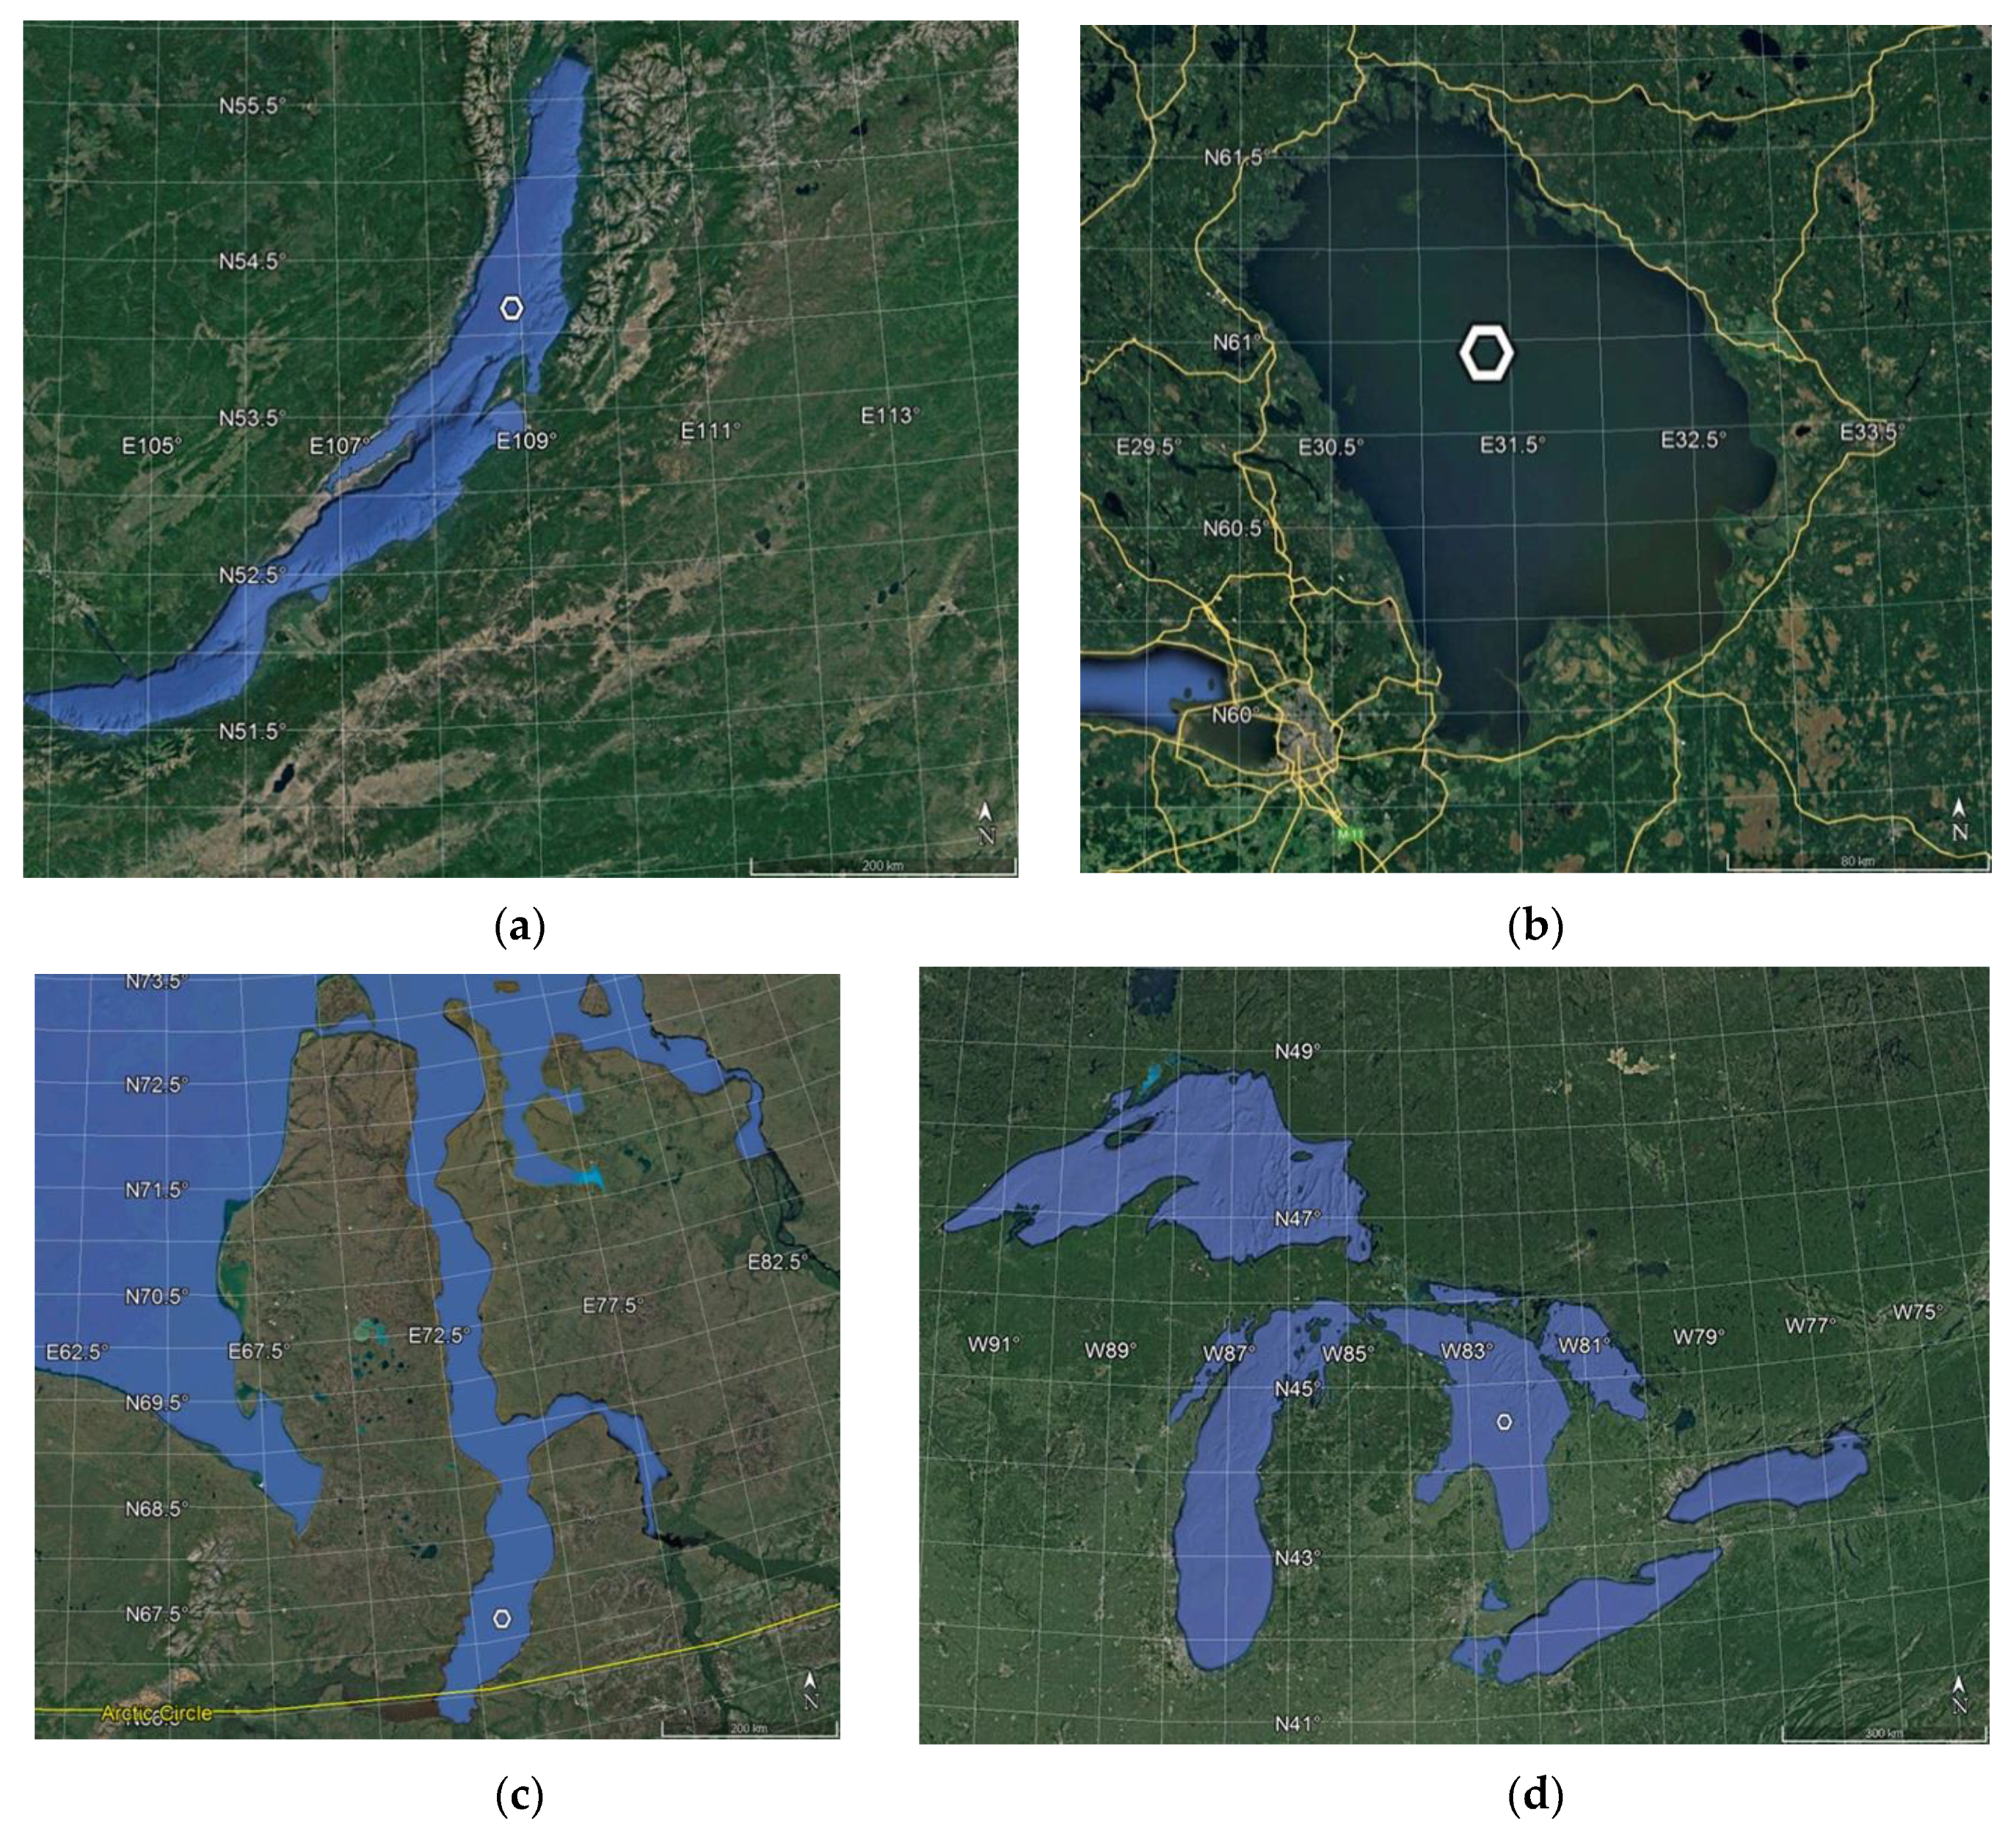
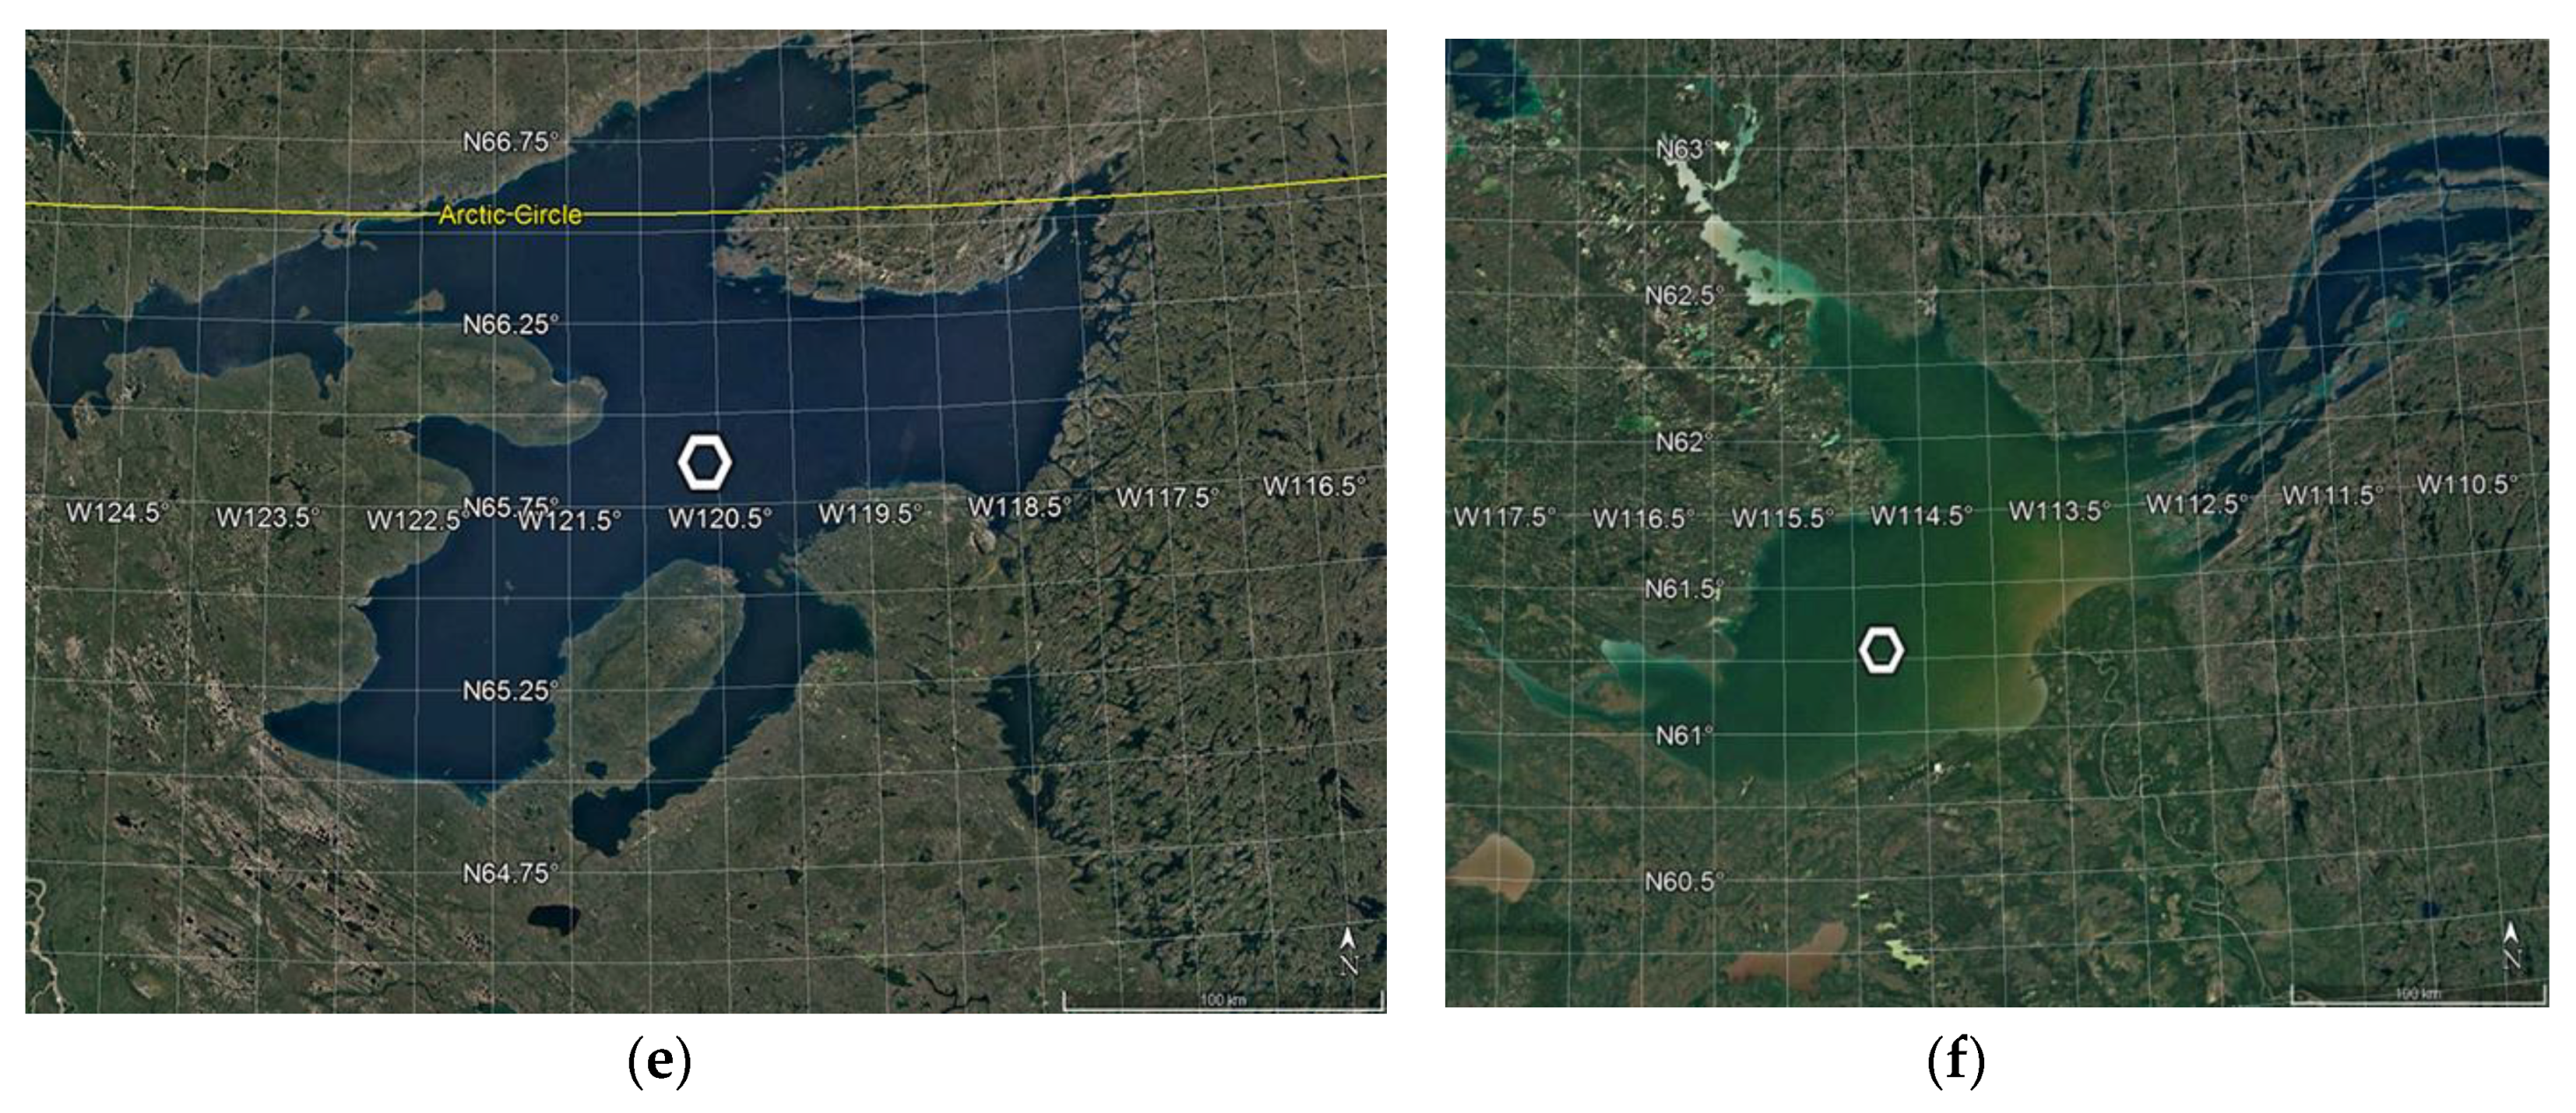
Six large freshwater areas located in various natural zones of the Northern Hemisphere were selected as study objects: Lake Baikal, Lake Ladoga, Lake Huron, Great Slave Lake and Great Bear Lake, as well as the southern (freshwater) part of the Gulf of Ob (
Figure 1). In
Figure 1, the area corresponding to the SMOS L1C product cell is highlighted in white (see section “Satellite data”).
Table 1 indicates the regions and natural zones in which the studied water areas are located, as well as the coordinates of the center of the analyzed cells of the SMOS L1C product.
Lake Baikal is one of the largest freshwater lakes on the globe, which is the largest repository of clean fresh water. It is located on the territory of the Russian Federation in the southern part of Eastern Siberia in an area with a sharply continental climate. More than 300 rivers and streams flow into Baikal, the largest of which is the Selenga River. It collects water through its numerous tributaries from a vast area of eastern Central Asia. The drainage from the lake is carried out by the Angara River, which flows north and after 1864 km merges with the Yenisei River. The water of Baikal is distinguished by its high transparency — up to 40 m, and only closer to the shore it decreases to 22–25 m. Baikal waters are low-mineralized. The total mineralization of the water is low — 100 mg/l, the water is calcium bicarbonate. Ice cover in Southern Baikal is most often established on January 5–10 and is completely destroyed around May 10–20. Northern Baikal is covered with ice on January 1–5, freed from ice on June 1–10, sometimes later. The thickness of the ice cover in Southern Baikal is 0.8–1 m, in Northern Baikal — 1.2–1.5 m. A feature of the lake is the subglacial blooming of water. For under-ice phytoplankton, the optimal temperature is 0.1–1 °C; an increase in water temperature by 4–5° causes its death. The under-ice maximum development of algae is not observed every year, but in years of abundant development, their biomass can reach 5–6 g/m
3. In such years, the waters of Lake Baikal become eutrophic (see
Appendix A) [
11].
Lake Ladoga is located in the north-west of the Russian Federation. The northern position of the lake determines the characteristics of its radiation and thermal regime, as well as the higher color and lower transparency of the water compared to other great lakes of the world. The climate of the area is formed under the influence of sea air from the Atlantic, continental air from the middle latitudes and periodic inflows of Arctic air. In spring, the coastal areas warm up first, and a thermal bar appears on their border with the cold central part of the lake, which gradually moves further and further from the shores. The temperature difference on opposite sides of the thermal bar sometimes reaches 20 °C. At the end of July – beginning of August, the water temperature reaches maximum values of 16–18 °C, under the layer of temperature jump there is cold 4-degree water. Over most of the lake’s water area, freeze-up has not formed in recent years, although primary forms of ice phenomena have been observed. Quantitative characteristics of phytoplankton (biomass 1.1–1.8 g/m
3, chlorophyll-a — 4.8–8.5 mg/m
3) characterize the lake as mesotrophic (see
Appendix A) [
11,
12].
The Gulf of Ob is the largest bay of the Kara Sea, which is located between the Gydansky and Yamal peninsulas. It is a huge water body about 800 km long and 30–90 km wide. The maximum depth does not exceed 28–30 m, but in most of the water area its depth fluctuates in the range of 10–15 m. The Gulf of Ob is almost entirely within the tundra zone. The period under ice cover averages about nine months a year. The Ob River, which supplies about 76 % of the flow into the gulf, is of decisive importance for the hydrological regime of the Gulf of Ob. In the Gulf of Ob, two primary water masses come into contact — river (fresh) and sea (salty), forming a mixing zone (transition zone). The area of contact with the salty waters of the Kara Sea is mobile and during the period of open water is between 71 N and 72 N. In winter, the transition zone can shift far to the south, up to 69 N and further south [
13]. Thus, in the Gulf of Ob, two large areas with moving boundaries can be distinguished: the first is a “river” area, and the second is a “sea” area. In its freshwater part, during the period of high waters, the Gulf of Ob resembles a river, and in the low waters it resembles a reservoir or lake [
14,
15].
Lake Huron is located in the United States (Michigan) and Canada (Ontario). In terms of area, it ranks fourth in the world after the Caspian Sea, Lakes Superior and Victoria. In winter, the lake usually does not completely freeze, although this happens in some years. Lake Huron is oligotrophic (see
Appendix A), and according to almost all chemical and biological parameters, there are no significant eutrophication processes observed here [
11].
The water area of the Great Bear Lake crosses the Arctic Circle. It is the largest lake in Canada. The lake has many features of polar lakes. For most of the year, from November to July, the lake is under ice. Low water temperature, poor supply of nutrients, and lack of sources of pollution determine the low biological productivity of the lake. The lake is ultra-oligotrophic (see
Appendix A). Almost all biological communities are represented by a poor species composition with low quantitative indicators. Higher aquatic vegetation is practically absent due to the long period of freeze-up. The diversity of phytoplankton species is also low [
11].
Great Slave Lake is located in Canada’s northwest territories, 400 km south of Great Bear Lake. The lake has a complex configuration. Its western part is larger in size, but shallower in depth. The eastern part, including McLeod and Christie Bays, is much deeper, with a maximum depth of 615 m. The eastern part is replete with islands. The morphometric features of the lake also affect its temperature regime. The average summer surface water temperature varies from 3.7 °C in Christie Bay to 14.5 °C in the Western Region. The lake has been under ice for almost 8 months. From the south, the Slave River flows into the lake, which has a huge drainage basin with an area of 606 thousand square kilometers. The Mackenzie River flows from the northwestern part of the lake, and this is where the river originates. The biomass of phytoplankton under the ice is extremely low, and in summer it increases from 130 to 340 mg/m
3. These values characterize the oligotrophic trophic level of the lake (see
Appendix A) [
11].
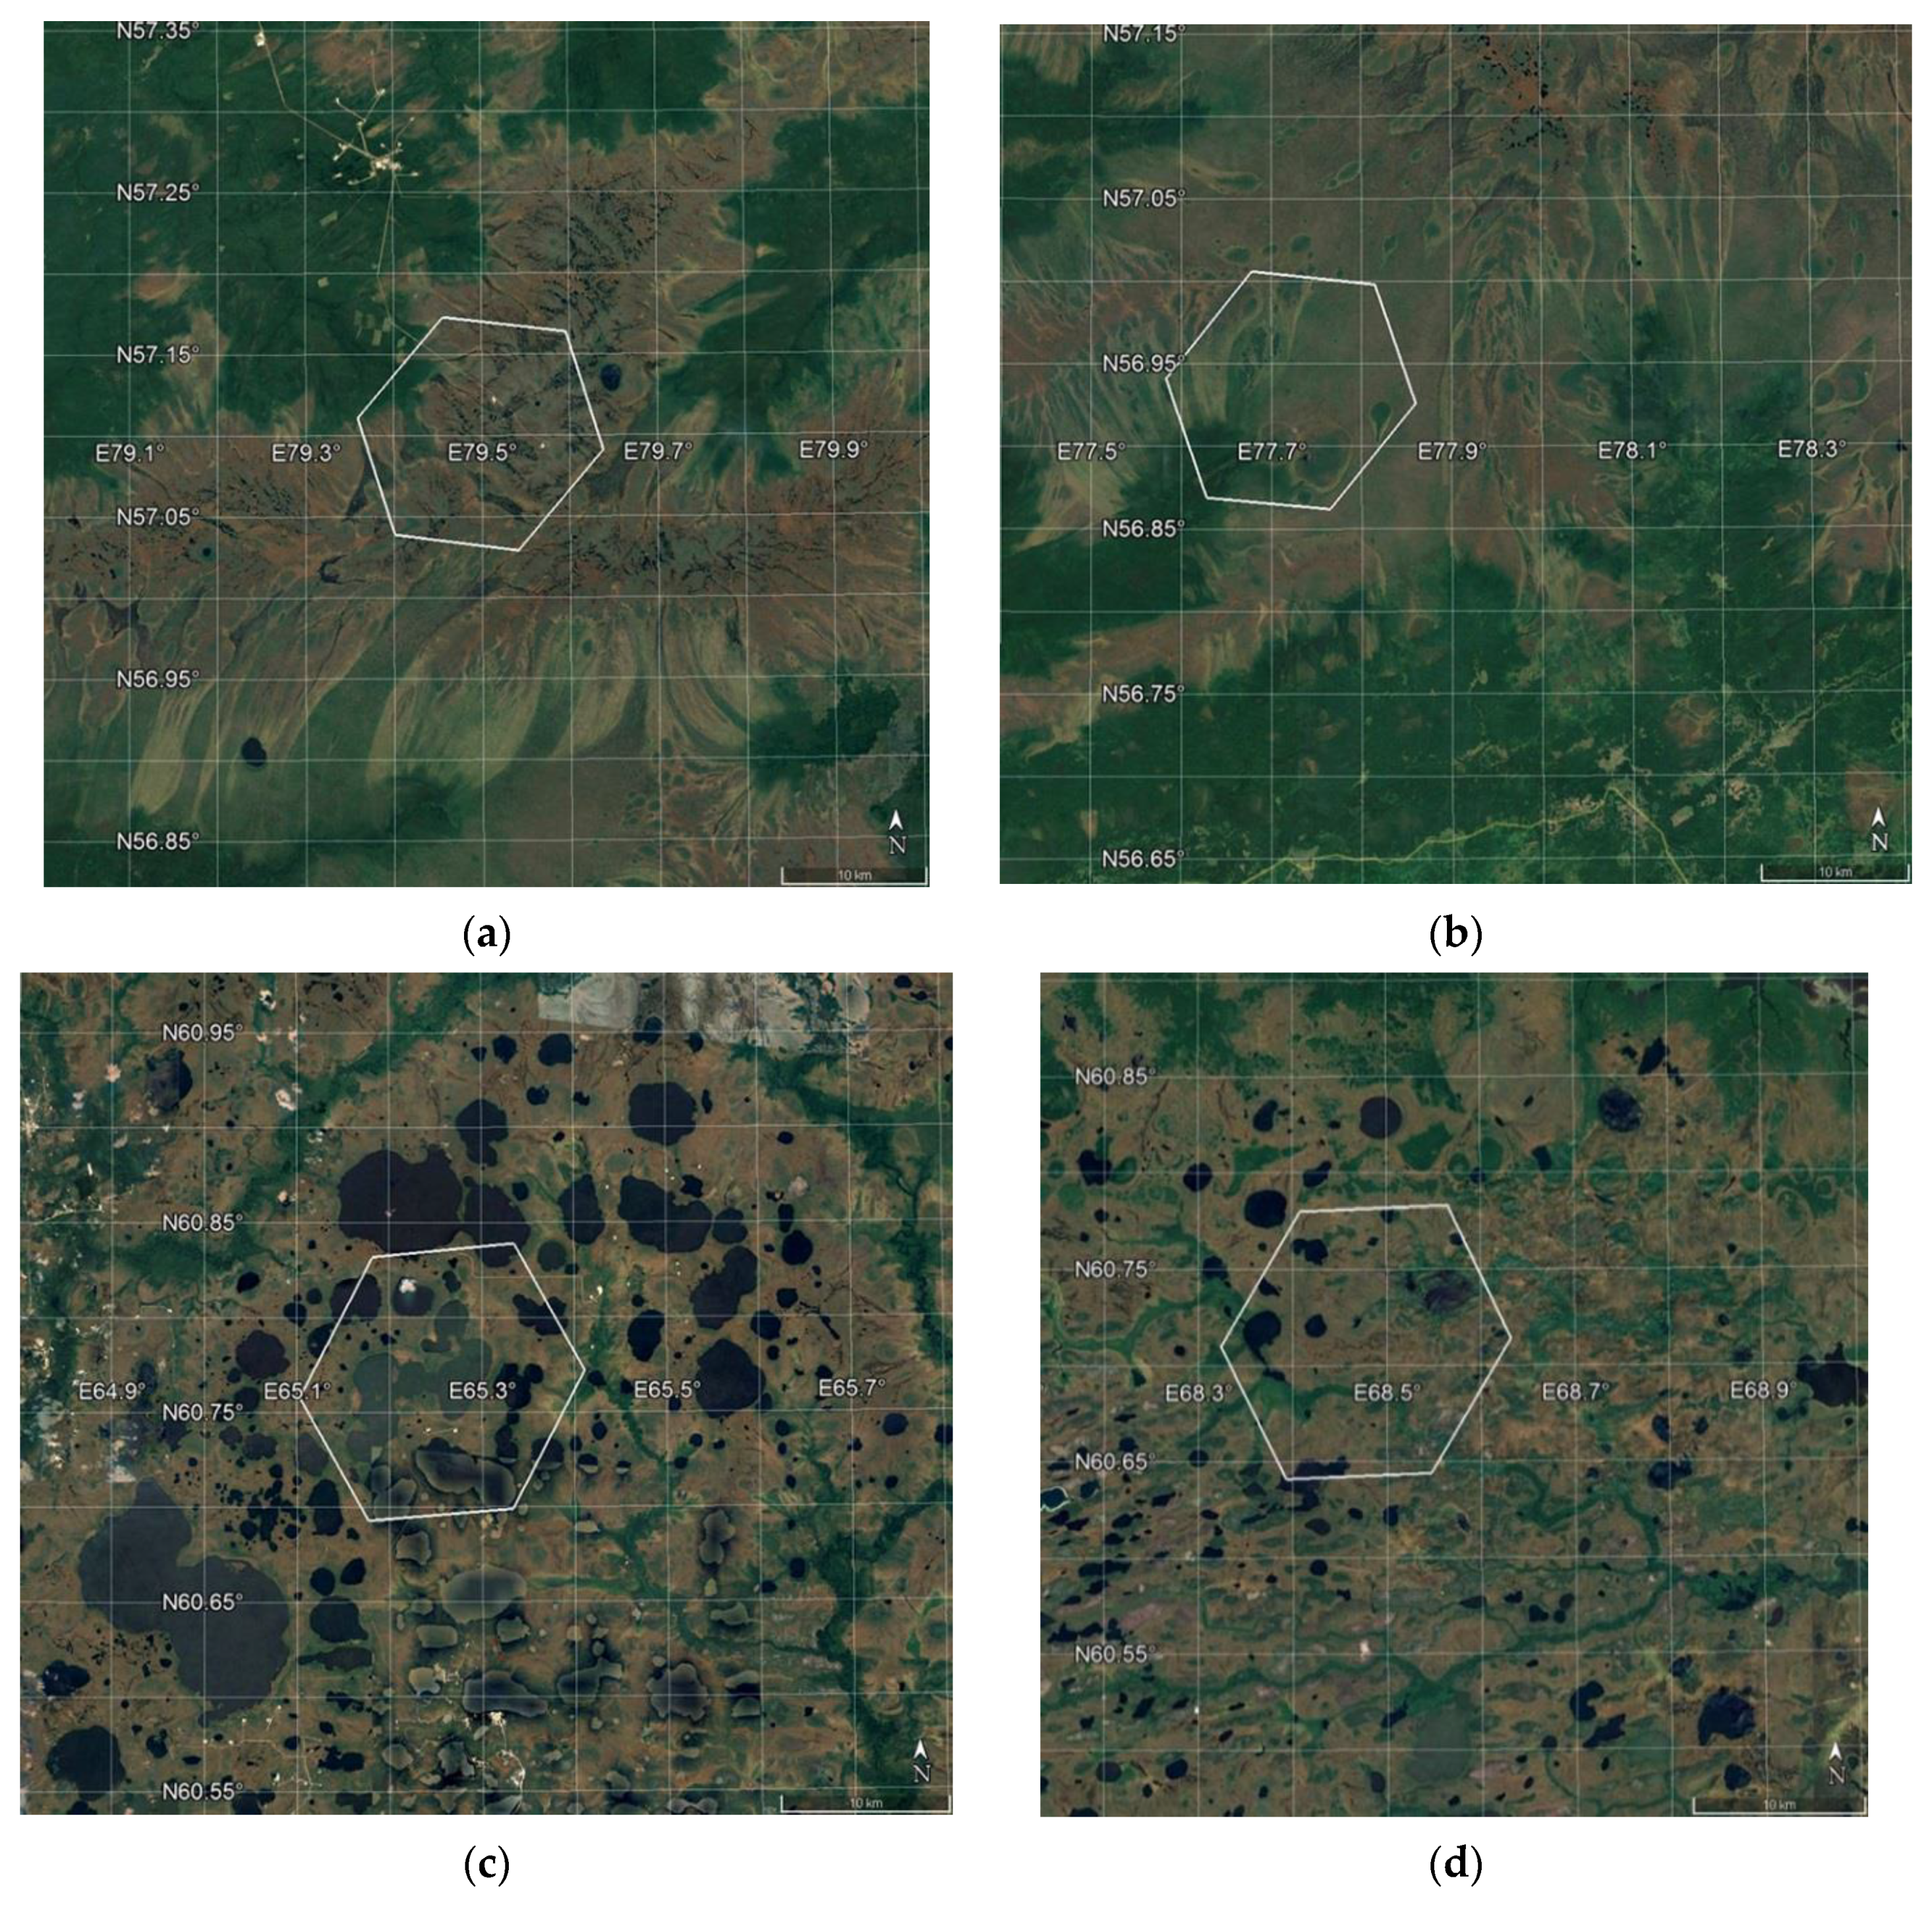
In addition to freshwater areas, 4 regions of the central part of the West Siberian Plain were studied, where extensive wetlands and a large number of small lakes are located [
16]. These are two areas located on the territory of the Great Vasyugan Mire [
17,
18] (
Figure 2a,b), and two — on the territory of the Mukhrino peatland [
19] (
Figure 2c,d).
Figure 2 shows the study areas, where the area corresponding to the SMOS L1C product cell is highlighted in white (see section “Satellite data”).
Table 2 gives the coordinates of the center of these studied cells, and also indicates the nearest settlement to the cell, region and terrestrial ecosystem in which the cell is located.
The Great Vasyugan Mire (Vasyugan Swamp) is one of the largest wetlands on Earth. The area of the wetland is about 53–55 thousand square kilometers. It is located between the Ob and Irtysh rivers. This wetland occupies the territory of the Tomsk region, as well as part of the Novosibirsk and Omsk regions and the Khanty-Mansi Autonomous Region. The Great Vasyugan Mire is located in the zone where small-leaved forests pass into the southern taiga. The Great Vasyugan Mire has an asymmetric structure: the northern slope is covered with oligotrophic and mesotrophic wetlands, in the southern part eutrophic types of wetlands predominate (see
Appendix A) [
20]. Two sites were selected on the territory of Vasyugan Swamp. The first is located on the northern slope, where oligotrophic and mesotrophic wetlands predominate (see
Appendix A) [
20]. The SMOS L1C product cell selected in this area (
Figure 2a) is located in the Tomsk region, 50 kilometers south of the city of Kedrovy (
Table 2). The second site is located on the southern slope of the Great Vasyugan Mire, where eutrophic types of wetlands predominate (see
Appendix A) [
20]. The SMOS L1C product cell selected in this area (
Figure 2b) is located in the Novosibirsk region, 30 kilometers northwest of the village of Ostyatsk (
Table 2).
The Mukhrino peatland (Mukhrino bog) is located on the eastern terrace of the Irtysh River, 20 kilometers south of its confluence with the Ob River, in the middle taiga zone of the West Siberian Plain. The climate of the region is subarctic or boreal with long cold winters and short warm summers. Average annual temperature at the Khanty-Mansiysk weather station for the period 1983–2013 is –0.7 °C, annual precipitation is 526 mm. The Mukhrino peatland consists of raised oligotrophic bogs with a mosaic of ridges and hollows, as well as oligo-mesotrophic wetlands (see
Appendix A). A number of small lakes up to 300 m wide are located in the swampiest areas, and the central part of the peatland is occupied by a wide watercourse. The average peat depth is 3.3 m [
19,
21]. Two sites were selected on the territory of the Mukhrino peatland. The first is located in a heavily swampy area, where there are a large number of small lakes [
21]. The SMOS L1C product cell selected in this area (
Figure 2c) is located in the Tyumen region, 20 kilometers southeast of the village of Supra (
Table 2). The second site is in a less swampy area. The SMOS L1C product cell selected in this area (
Figure 2d) is located in the Tyumen region, 35 kilometers southwest of the city of Khanty-Mansiysk, near the Mukhrino field station [
19] (
Table 2).
4. Satellite data and phenological phases of water bodies
To determine the phenological phases of the water bodies selected for the study, SMOS L1C data (MIR_SCLF1C product, versions 620 and 724) were used.
The brightness temperature of the Earth’s surface,
TBr, taking into account polarization, is measured in the range of viewing angles 0–60° using a microwave radiometer MIRAS (Microwave Imaging Radiometer using Aperture Synthesis) [
23]. The MIRAS radiometer is located on the ESA (European Space Agency) SMOS (Soil Moisture and Ocean Salinity) satellite. It receives outgoing radiation at a frequency of 1.41 GHz. Maximum spatial coverage is achieved at a viewing angle of 42.5°, while the spatial resolution is 35×65 kilometers [
24]. Conversion of
TBr values from the coordinate system associated with the antenna (
TX and
TY) to the coordinate system associated with the earth’s surface (
TH and
TV) — the so-called “rotation” of the polarization vector — is carried out according to standard SMOS algorithms [
24] using the SMOS-BOX package version 5.8.1 in the SNAP software environment. SMOS L1C data is referenced to the discrete geodetic grid DGG ISEA 4H9. The linear size of a grid cell is about 16 km, and the area is about 195 square kilometers [
25]. Thus, the brightness temperature value for any grid cell is formed by a section of the underlying surface with an area of 1780 square kilometers (at the 3 dB level). It turns out that one pixel of the MIRAS radiometer contains on average about nine cells of the DGG ISEA 4H9 geodetic grid. The cell itself, with an area of 195 square kilometers, is located in the center of this area [
25]. To achieve maximum reliability, the following measurements were excluded from the analysis:
- (1)
values susceptible to radio frequency interference;
- (2)
data with an error in determining TH and TV of more than 5 K;
- (3)
data with polarization coefficient (TH/TV) outside the range of 0.01–0.99.
A continuous archive of SMOS L1C data from 2012 to the present is stored on ESA servers.
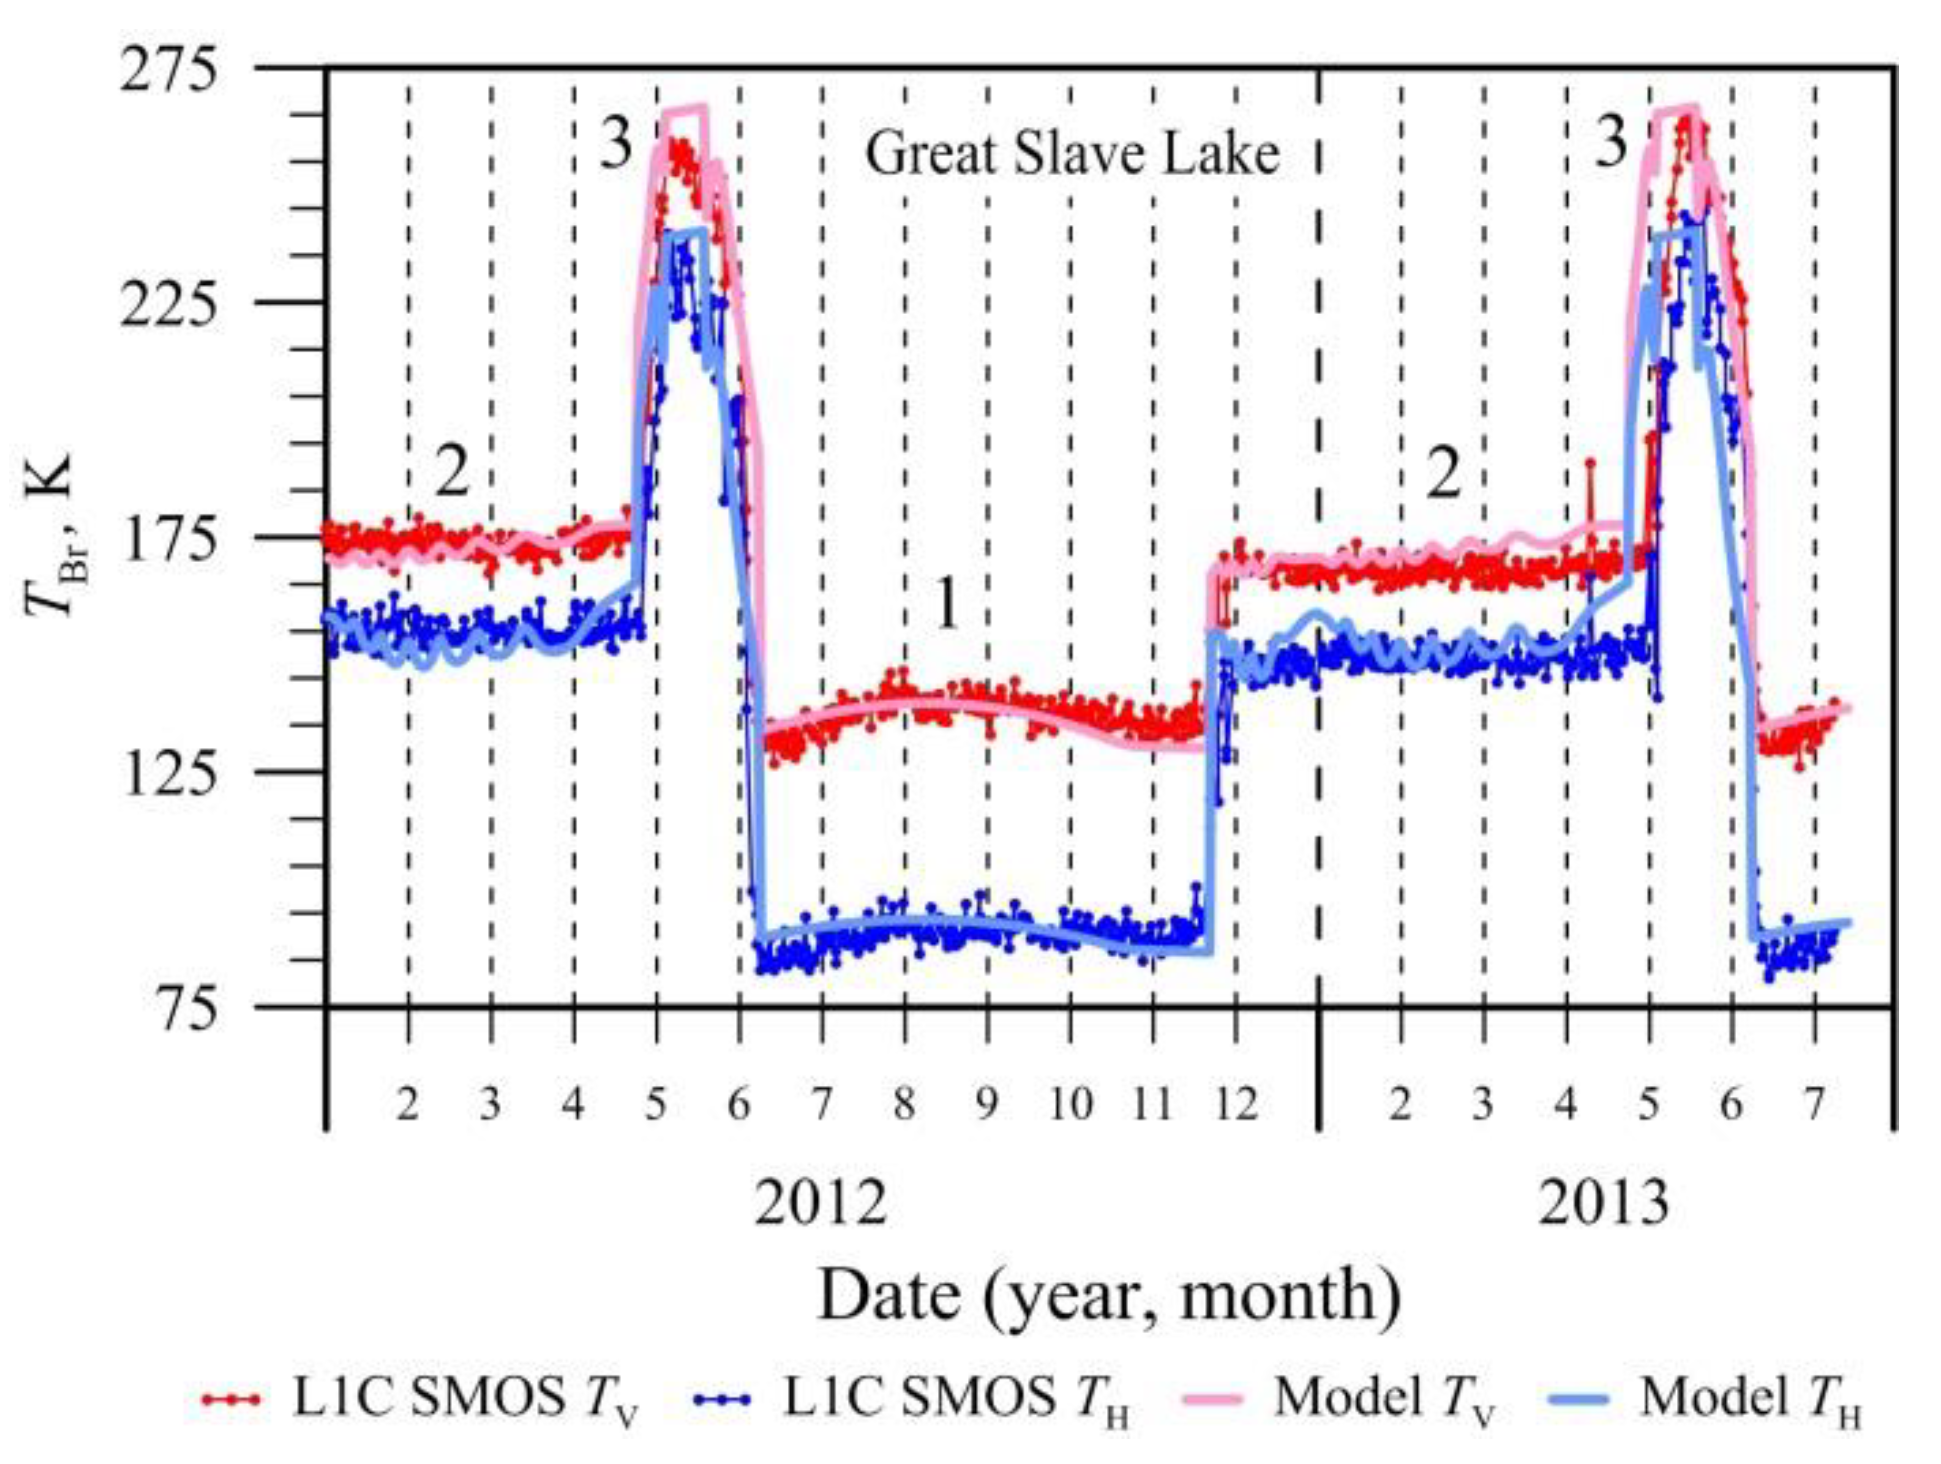
In works [
13,
26], based on theoretical modeling of the own microwave radiation of freshwater bodies (lakes, bays) and analysis of brightness temperature measured by the MIRAS radiometer of the SMOS satellite, the possibility of determining seasonal changes in the state of their surface is shown. A comparison of satellite data with model calculations made it possible to identify three time ranges of
TBr values for seasonally freezing freshwater bodies: the first range is associated with radiation from an ice-free water surface; the second – with an ice cover established on the surface of the lakes; and the third range, characterized by a short-term sharp increase in
TBr by an amount of about 40–90 K, corresponds to a period of cardinal changes in the structure of the ice cover (a period of intense destruction and melting) (
Figure 3).
In this paper, using the same method and based on data from the MIRAS radiometer of the SMOS satellite, we studied the specific features of microwave radiation in the wetlands of the West Siberian Plain. The research methodology included: analysis of the seasonal dynamics of the brightness temperature of the underlying surface in test areas, field measurements of the physical parameters of the underlying surface, as well as laboratory measurements of the dielectric characteristics of natural environments (water, soil, vegetation).
Using the example of the Mukhrino bog, five characteristic periods were identified in the seasonal dynamics of
TBr, corresponding to the phenological phases of wetlands in the boreal and subarctic zones (
Figure 4):
- (1)
1–2 “Winter plateau” — a period lasting approximately from the beginning of November to the end of March. During this period, the value of the brightness temperature in horizontal polarization (TH) is constant (within confidence intervals) and is about 255 K, or has a weak positive trend.
- (2)
2–3 “Spring melting” — rapid (10–30 days) decrease in TH values to 220 K. This period is associated with strong humidification, as well as the covering of a significant part of the underlying surface with water as a result of the melting of seasonal snow cover.
- (3)
3–4 “Summer period 1” — in different years, different dynamics of TH are observed, the type of which depends on the vegetation cycles of marsh vegetation. At point 4 the maximum TH value is reached. It corresponds to the maximum drying of the wetland, or the maximum development of marsh vegetation and its screening of radiation from the water surface.
- (4)
4–5 “Summer period 2” — associated with the gradual withering of surface vegetation.
- (5)
5–1 “Autumn-winter freezing of bog strata” — the type of seasonal dynamics of TH depends on the characteristics of freezing of the bog strata as a multilayer system consisting of layers of living vegetation, dead vegetation and soil.
The accuracy of determining the boundaries of these periods depends on the frequency of satellite imagery and ranges from 1 to 3 days, depending on the geographic latitude of the observation site.
The seasonal dynamics of carbon dioxide content in the atmosphere over the studied water bodies was compared with seasonal changes in their phenological phases determined from the SMOS satellite data for the period 2012–2020. The results and analysis of this comparison are presented in the next section.
5. Results and discussion
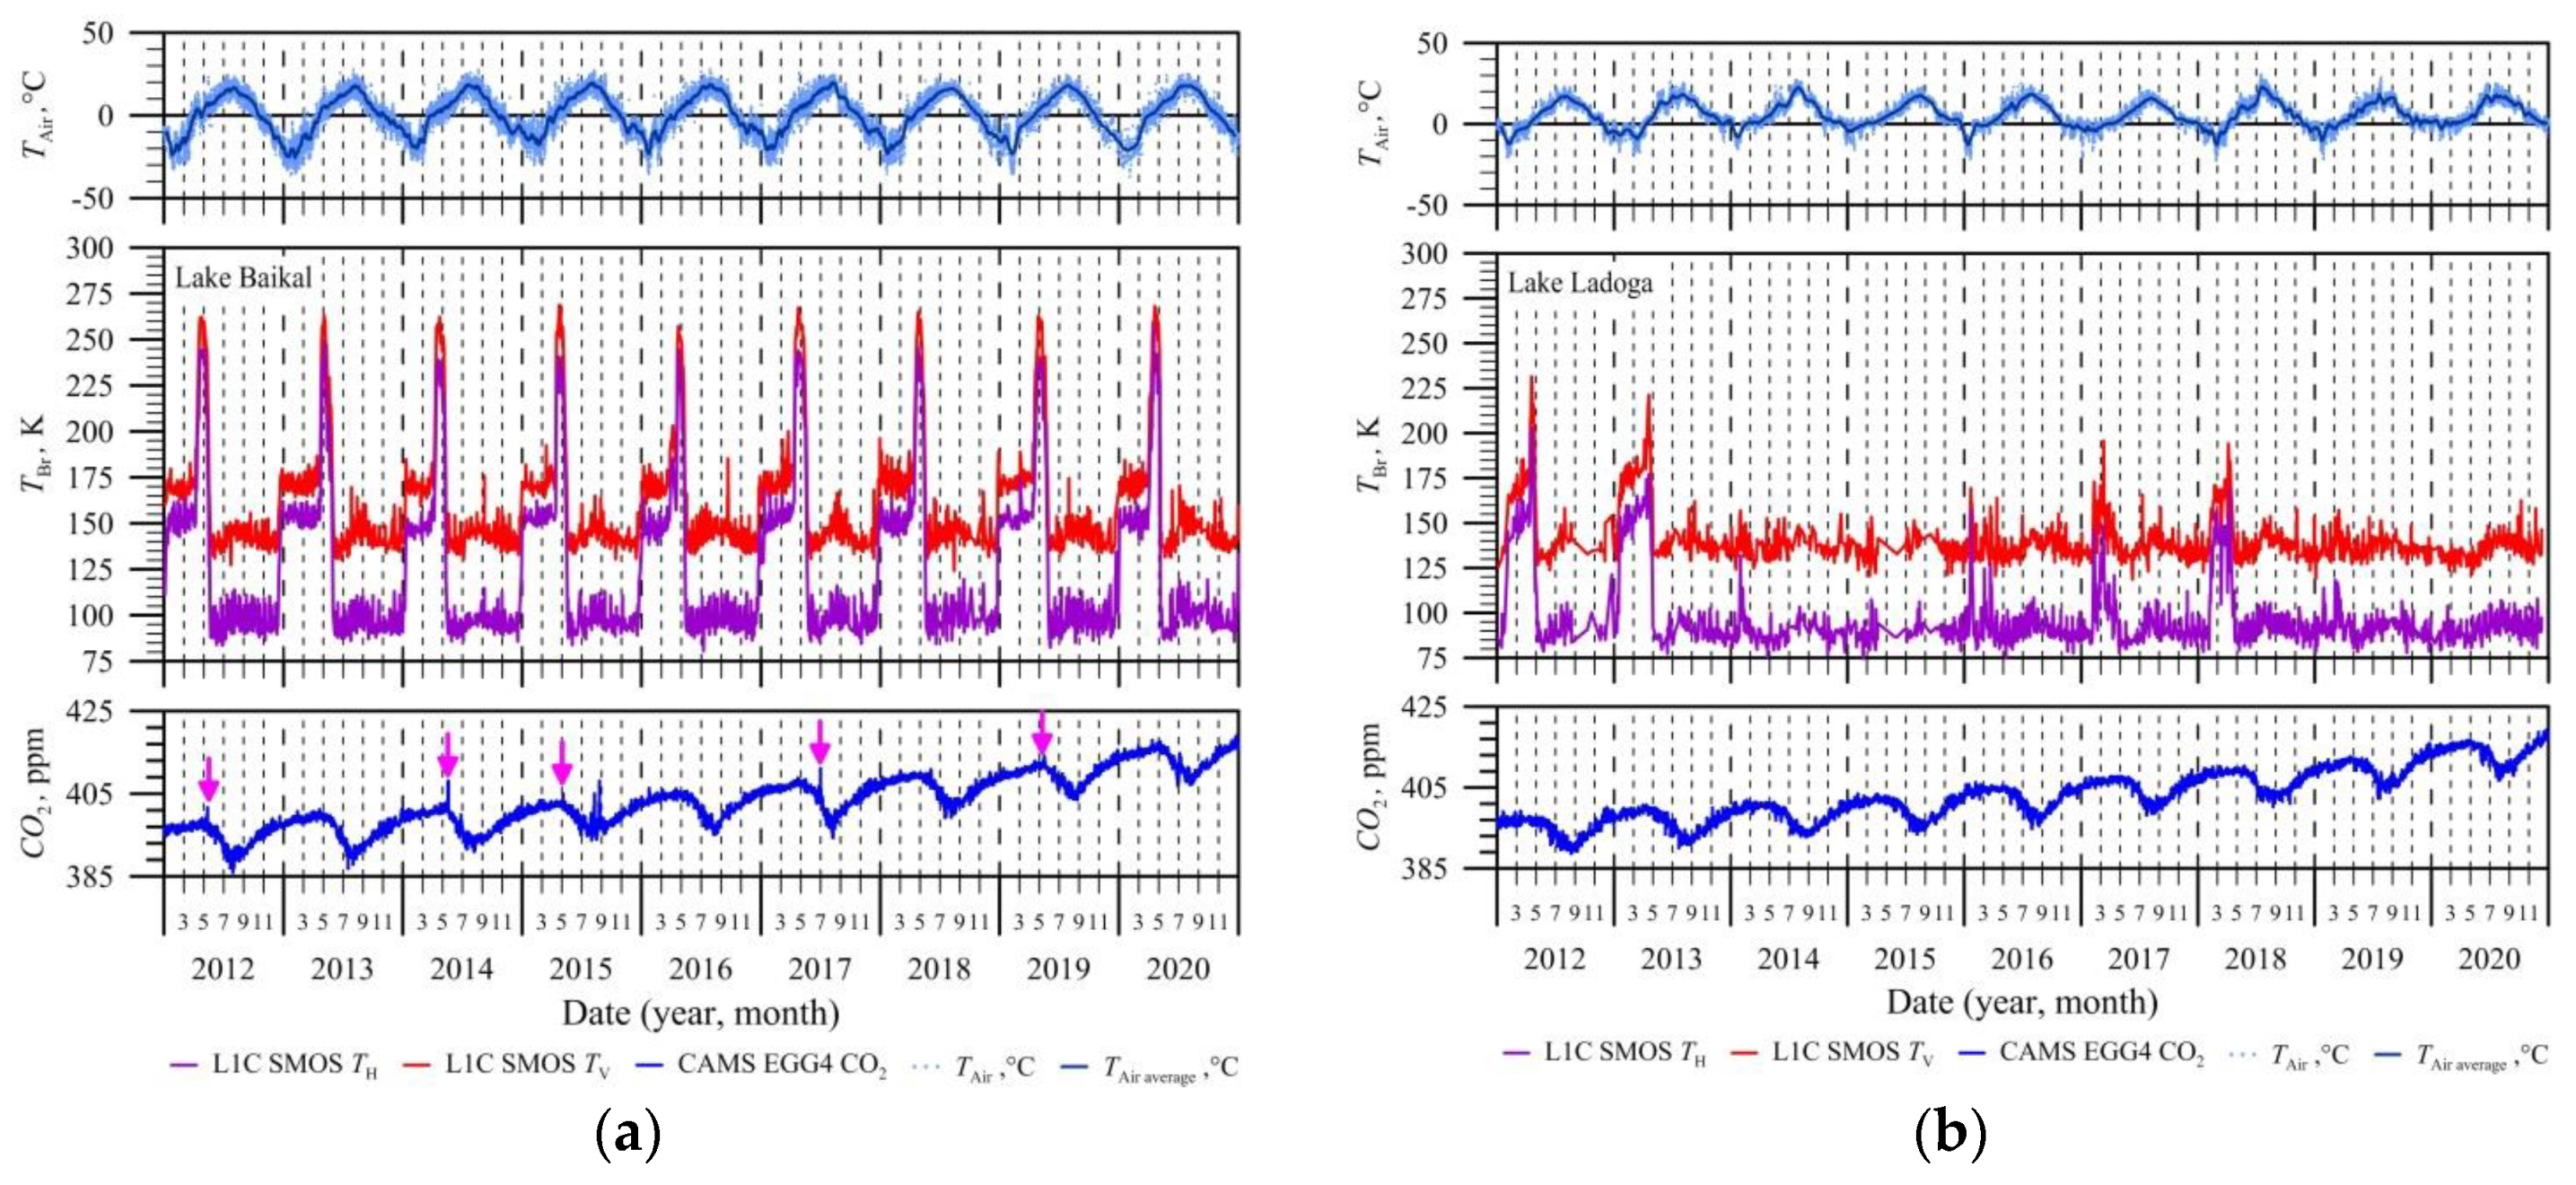
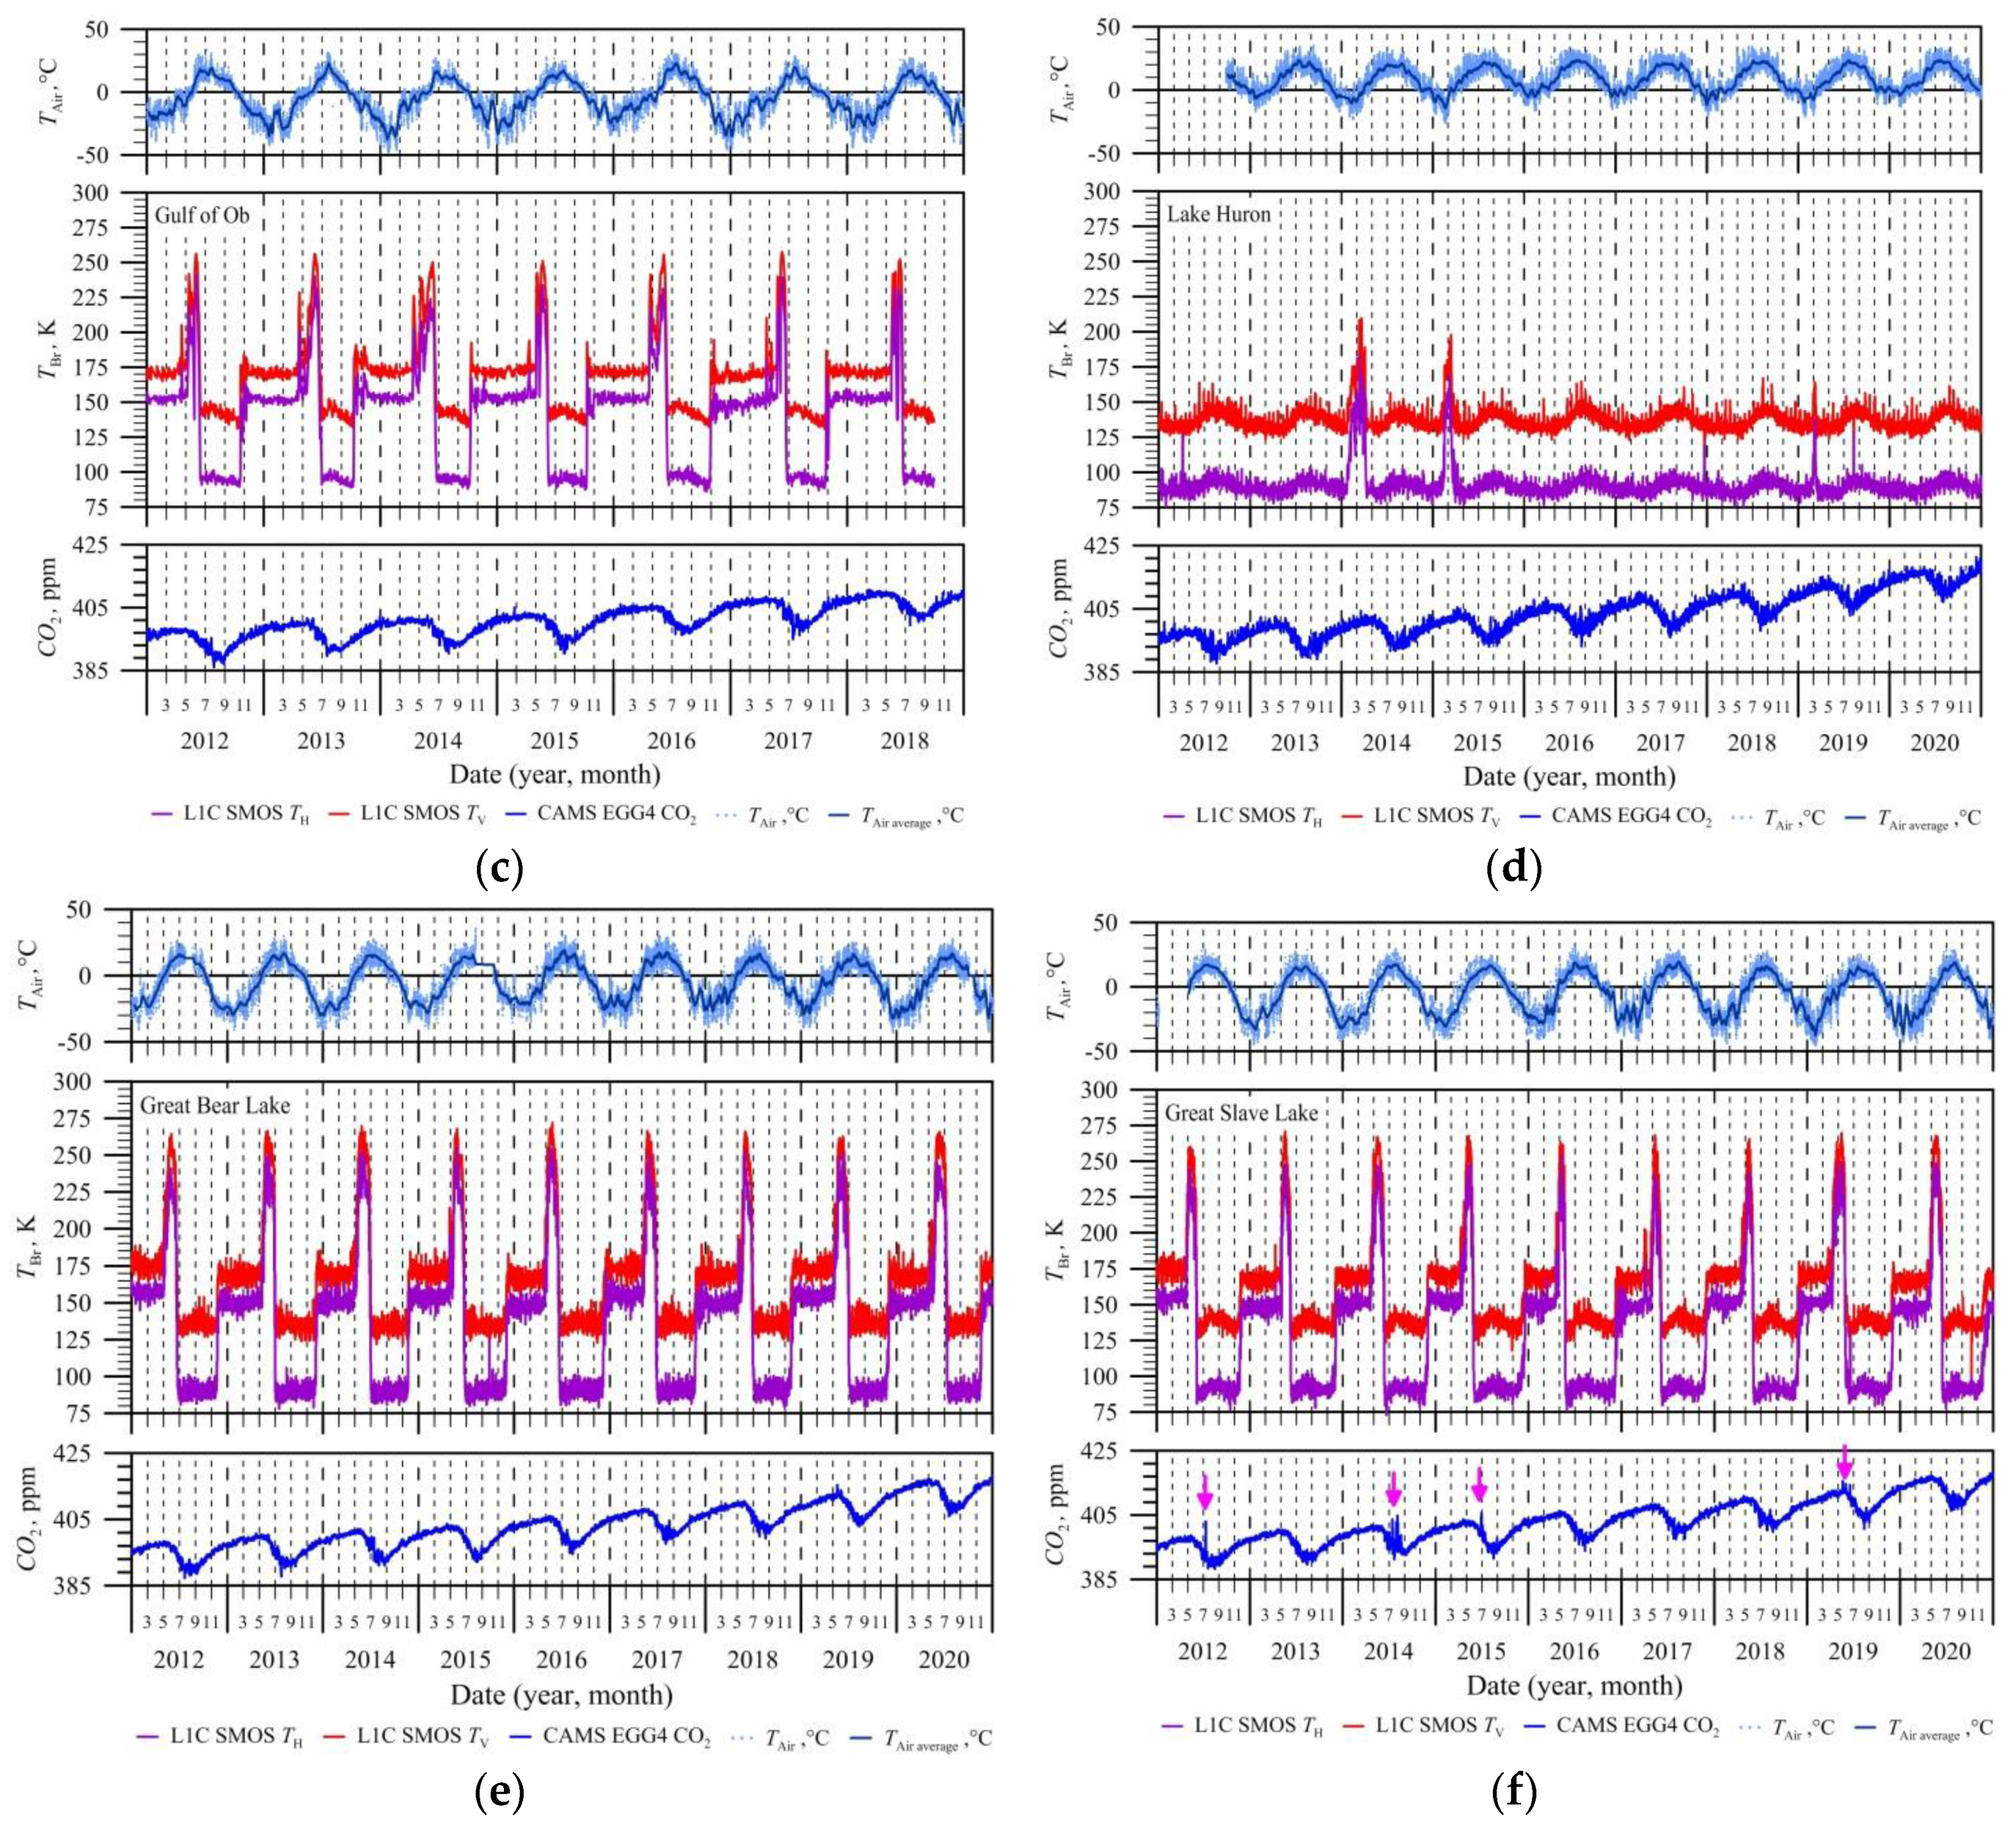
Figure 5 shows the dynamics of
TBr of the selected cells (SMOS L1C data) for large freshwater bodies (see
Figure 4 and
Table 1) and the dynamics of CO
2 content above them, obtained from CAMS EGG4 data, for the period 2012–2020 (for the Gulf of Ob the period is 2012–2018). In addition, the figure shows the dynamics of air temperature obtained from the weather station closest to the cell.
Analysis of hydrological data [
11,
12,
15] and seasonal dynamics of
TBr for the studied freshwater bodies allowed us to divide them into three types: rarely freezing water bodies of the boreal zone (Lake Ladoga and Lake Huron), freezing water bodies of the boreal zone (Lake Baikal and Great Slave Lake), freezing water bodies of the subarctic zone (Gulf of Ob and Great Bear Lake). The seasonal dynamics of
TBr for all freezing freshwater areas fully corresponds to their phenological phases (open water, ice cover, ice destruction). For Lake Ladoga and Lake Huron (
Figure 5b,d), changes in
TBr can be used to determine winter seasons when the water bodies were almost completely covered with ice for a short period: 2012, 2013, 2017, 2018, and 2014, 2015, respectively.
The presented dependencies (see
Figure 5) generally showed that the concentration of CO
2 in the atmosphere over the studied water bodies has a seasonal cyclical nature. The minimum concentration corresponds to the summer period due to strong photosynthesis of phytoplankton in water bodies, as a result of which carbon dioxide is absorbed in the water column. The maximum CO
2 concentration over water bodies corresponds to the end of the winter (cold) period. In winter, due to a significant decrease in water temperature, photosynthesis decreases, which leads to a decrease in the absorption of CO
2 in the water column and, accordingly, an increase in its concentration in water and emission from water bodies. Such dynamics of
TBr and CO
2 concentration are typical for all studied water bodies, both those that constantly freeze in winter and those that rarely freeze in winter.
In the freezing water bodies of the boreal zone, in addition to the regular spring maximum of CO
2 concentration, there is sometimes a strong short-term emission of carbon dioxide corresponding to the stage of destruction of the ice cover: for Lake Baikal in 2012, 2014, 2015, 2017 and 2019. (
Figure 5(a)); for Great Slave Lake in 2012, 2014, 2015 and 2019 (
Figure 5f). This characteristic emission is explained by the higher bio-productivity of water bodies in the boreal zone compared to those of the subarctic zone. During freeze-up, carbon dioxide accumulates in the water column under the ice and in the ice cover. The collapse of the ice cover in spring releases CO
2 accumulated over the winter period, which was “sealed” in the ice and in the water column under the ice. The absence of such emissions in some years near the freezing lakes of the boreal zone requires further study. It is probably associated with some hydrological and biochemical processes occurring in these waters. For Lake Baikal, the lack of spring CO
2 emissions in some years may be due to the development of subglacial phytoplankton in late winter — early spring. Its bio-productivity over a one-week period can exceed the bioproduction of the same layer of water during the ice-free period [
11,
28]. The appearance of such phytoplankton at the end of the freeze-up period increases the process of photosynthesis. This leads to an increase in CO
2 absorption under the ice and, accordingly, a decrease in carbon dioxide emissions during the period of ice destruction.
A comparison of two seemingly similar lakes located in northwestern Canada (Great Slave Lake and Great Bear Lake) showed that they differ greatly in their bio-productivity. Great Bear Lake, located on the border of the boreal and subarctic zones, is ultra-oligotrophic (see
Appendix A). Low water temperature, poor supply of nutrients, and lack of sources of pollution determine the low biological productivity of the lake. This lake is characterized by a small proportion of nutrients dissolved in the water, higher aquatic vegetation is practically absent, fish production is low, and the diversity of phytoplankton species is very low [
11]. Great Slave Lake, which is located in the boreal zone, is oligotrophic (see
Appendix A). The Slave River flows into the lake, bringing 54 thousand tons of dissolved mineral compounds and 36 thousand tons of suspended substances in the summer. The lake’s fish production is quite diverse. The biomass of phytoplankton in the lake under ice in winter is extremely low, and in summer it increases from 130 to 340 mg/m
3 [
11]. Thus, the bio-productivity of Great Slave Lake is significantly higher than that of Great Bear Lake. This is likely what leads to the production and accumulation of CO
2 under the ice at Great Slave Lake in some years. During the spring period of destruction and melting of ice, this carbon dioxide is sharply released, which leads to a short-term increase in its concentration in the atmosphere (
Figure 5f).
Quantitative characteristics of the phytoplankton of Lake Ladoga characterize it as mesotrophic (see
Appendix A) [
11,
12]. In the autumn-winter period, due to lower air and water temperatures, photosynthesis processes in the water column are greatly reduced. A decrease in photosynthesis in water would lead to the accumulation of CO
2 in the layer of water under the ice. However, in recent years, Lake Ladoga does not completely freeze in winter [
11,
12] and carbon dioxide does not accumulate. This fact explains the absence of short-term spring CO
2 emissions by Lake Ladoga.
Lake Huron is oligotrophic (see
Appendix A) [
11], i.e., its biological productivity is lower than that of Lake Ladoga. This lake also almost never freezes in winter [
11], which leads to the absence of short-term spring CO
2 emissions.
For the freshwater part of the Gulf of Ob, the absence of CO
2 emissions during the period of ice cover destruction can be explained by the following reason. The Gulf of Ob is an estuary of the Ob River. Even in winter, there is a significant flow of the Ob River, which does not allow the water mass to stagnate under the ice [
13] and the accumulation of carbon dioxide does not occur.
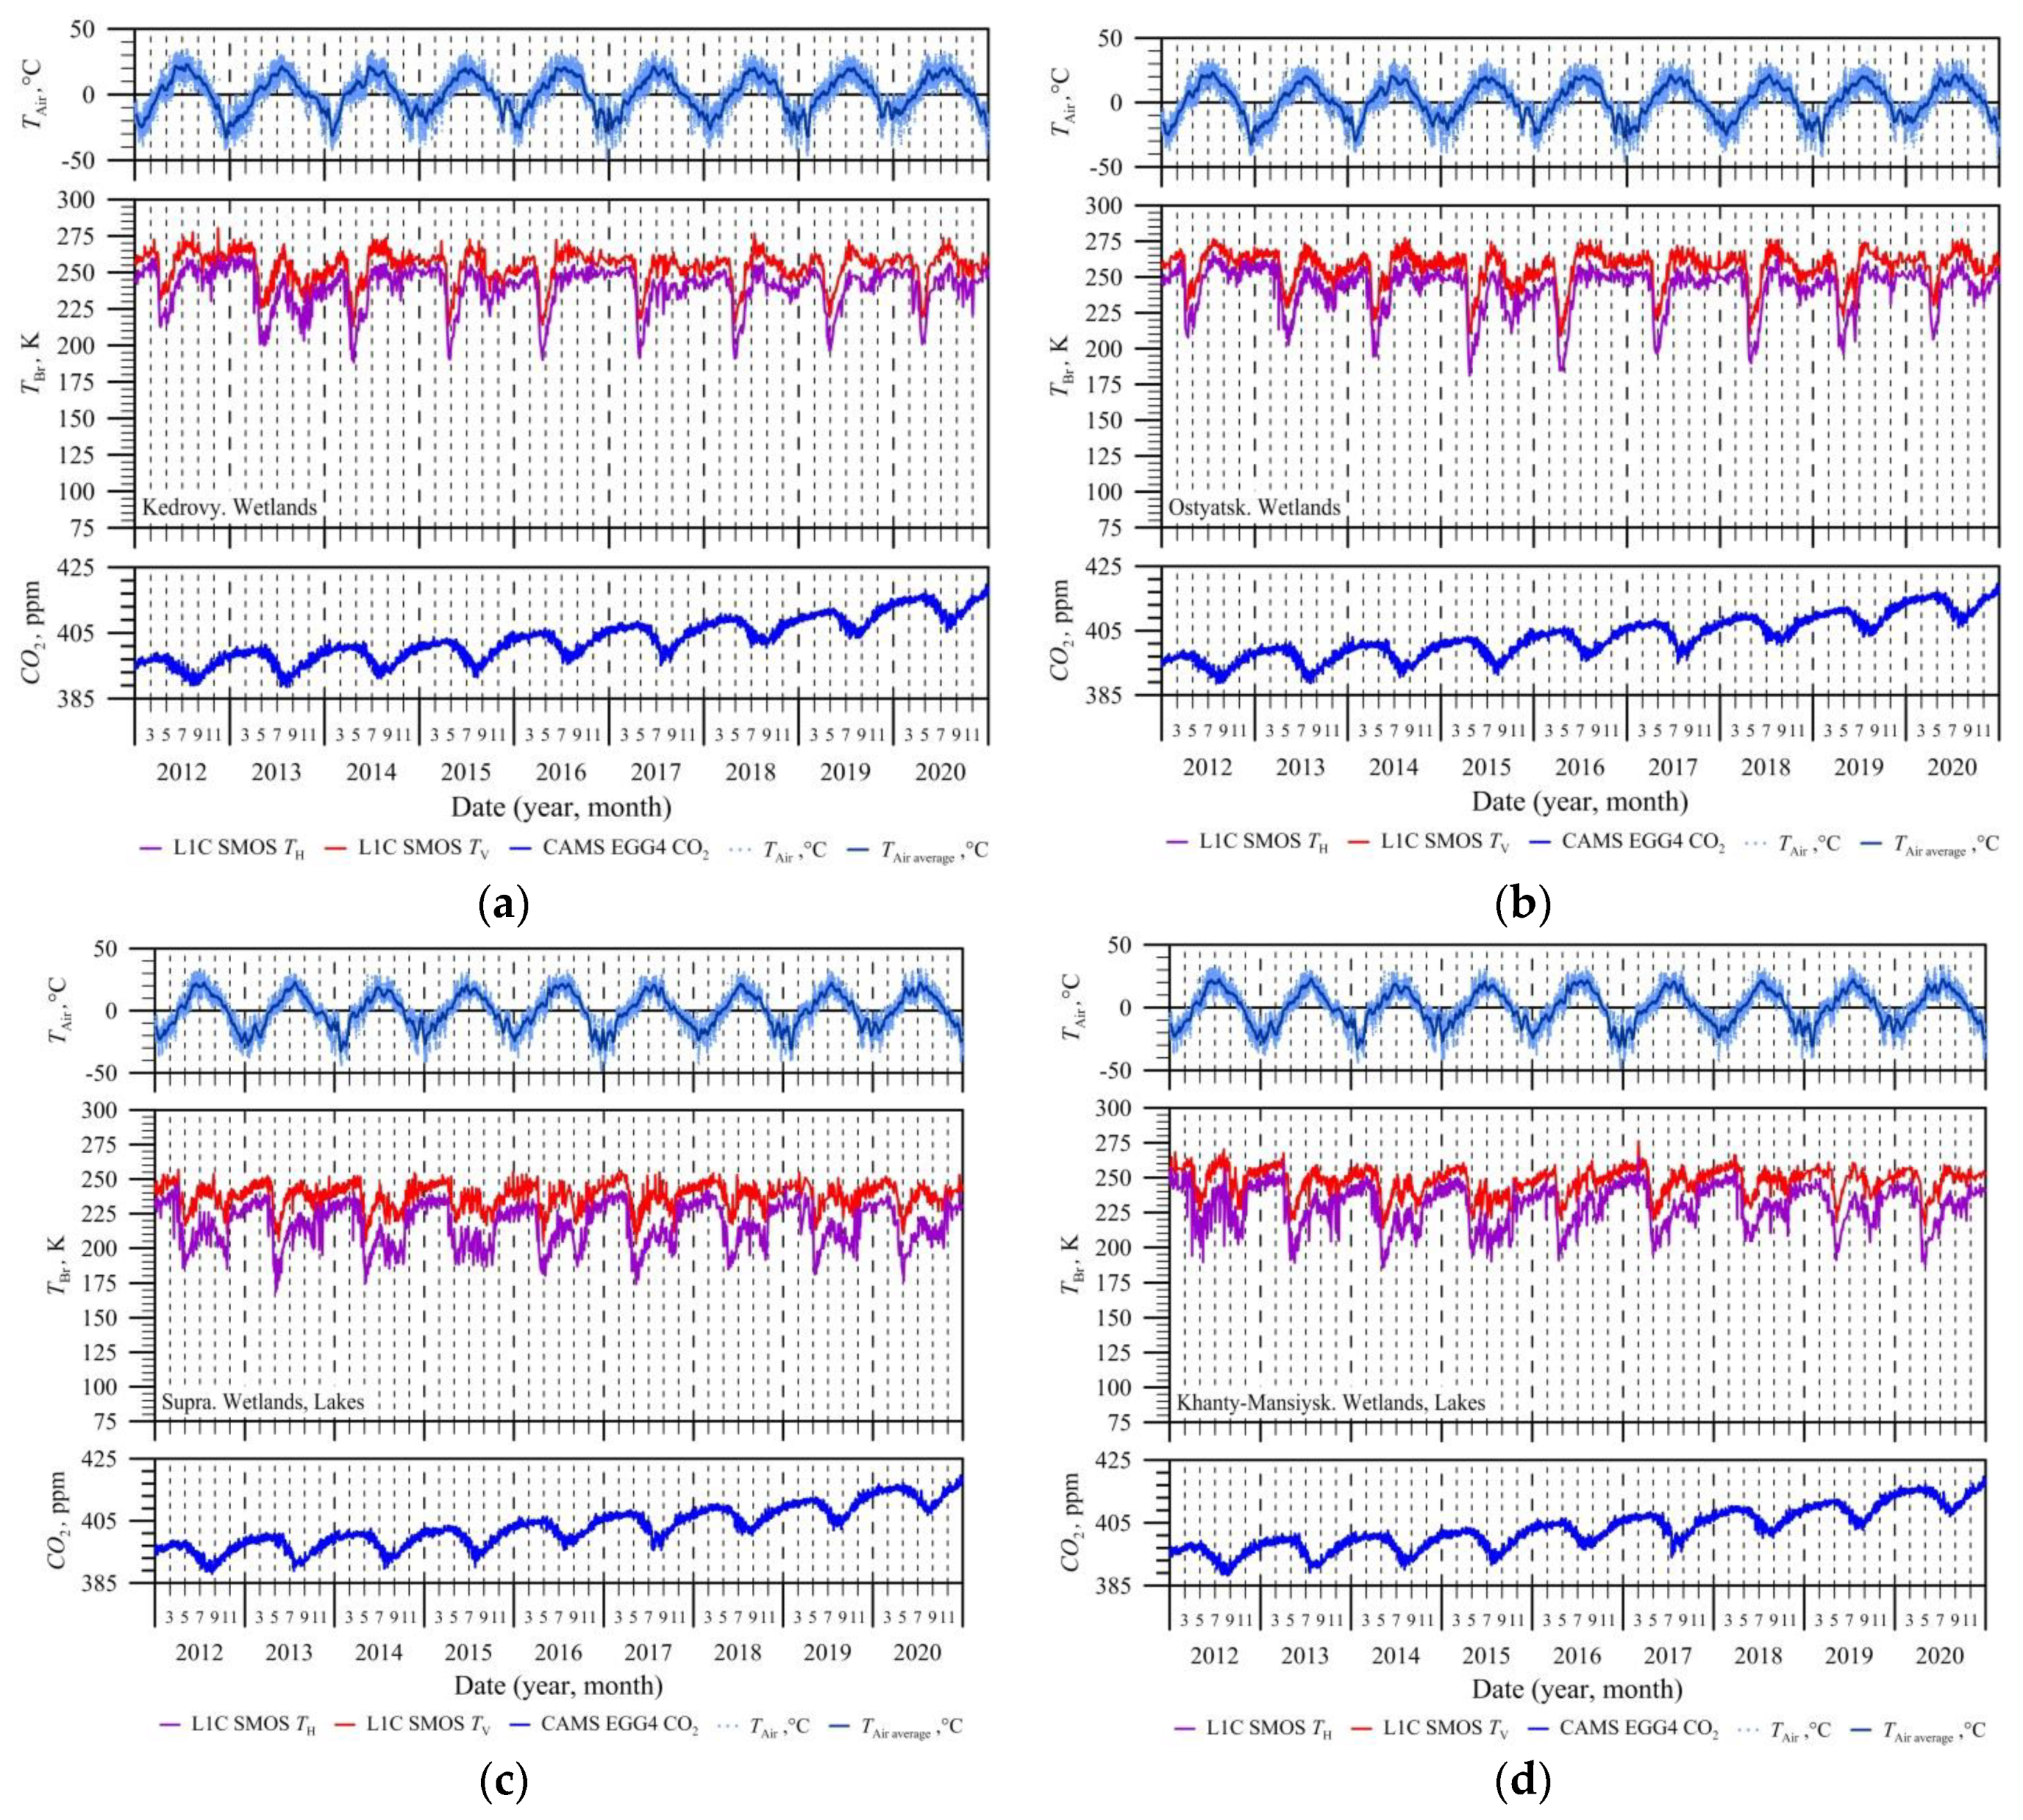
The seasonal
TBr dynamics of selected wetland sites differs significantly from the seasonal
TBr dynamics of larger freshwater bodies (
Figure 6).
TBr values at horizontal and vertical polarization for test wetland sites have a different level and amplitude of change (compare
Figure 5 and
Figure 6). This is due to the presence of vegetation (forest, shrubs, mosses, etc.) in the study areas. The presence of vegetation leads to an increase in the number of phenological phases of wetlands compared to freshwater bodies (see
Section 4 and
Figure 4) — new phases appear associated with the seasonal dynamics of marsh vegetation (development, wilting, etc.).
The maximum
TBr values for the Great Vasyugan Mire (
Figure 6a,b) correspond to mid-summer and are associated with maximum development of vegetation. Further, the
TBr values decrease, which is due to the wilting of vegetation and subsequent freezing of the surface. In winter,
TBr values increase slightly or remain constant. The minimum brightness temperature corresponds to the period of spring melting, when the surface becomes wet and vegetation has not yet begun to develop. After the minimum, there is a sharp increase in
TBr values, associated with drying of the surface and rapid development of vegetation [
27].
In the Mukhrino peatland, the seasonal dynamics of
TBr are similar to the seasonal dynamics of
TBr in the Great Vasyugan Mire. The difference lies in the
TBr absolute values and their amplitude. The maximum
TBr values for the Mukhrino peatland no longer occur in mid-summer, but during the spring melting period (
Figure 6c,d). These differences are associated with the presence within the studied cells of the Mukhrino peatland territory of a large number of small lakes, the phenological phases of which differ from the phenological phases of wetlands (compare
Figure 3 and
Figure 4).
Seasonal changes in CO2 concentration in the atmospheric column over the test areas of the Great Vasyugan Mire and the Mukhrino peatland, as well as in freshwater bodies, are cyclical. The minimum concentration of carbon dioxide occurs in the summer, corresponding to the maximum of photosynthesis, determined by the lush development of vegetation. The maximum CO2 concentration occurs in the spring, when the period of melting (freeing the surface from snow and ice) has begun, and vegetation has not yet begun to develop. Short-term spring CO2 emissions, as those of freshwater bodies of the boreal zone, are not observed in the test areas of the wetlands in any of the seasons, which is indirect evidence of the connection of these emissions with the destruction of the ice cover of freshwater bodies of the boreal zone. The influence of the trophic level of the studied wetlands on the seasonal dynamics of CO2-concentration in the atmospheric column above them was not detected.
6. Conclusion
The paper presents the results of a comparison of the seasonal dynamics of carbon dioxide concentration in the atmosphere obtained from the CAMS EGG4 reanalysis data and the phenological phases of various water bodies of the Northern Hemisphere located in the boreal and subarctic zone for the period of 2012–2020. Several large freshwater bodies, as well as a number of wetland areas, were selected as research objects. The phenological phases of water bodies were determined using satellite microwave radiometry data (SMOS satellite).
The paper shows the connection between satellite microwave radiometry data, which can be used to track the phenological phases of various water bodies in the boreal and subarctic zones, with the dynamics of CO2 concentration in the atmospheric column above them. The presented results demonstrated the similarity of the seasonal dynamics of CO2 concentration for all studied water bodies (lakes, wetlands). The concentration of CO2 in the atmosphere over the studied water bodies has a seasonal cyclical nature. The minimum concentration corresponds to the summer period due to strong photosynthesis, as a result of which carbon dioxide is absorbed by the vegetation of wetlands or phytoplankton of freshwater areas. The maximum CO2 concentration over water bodies corresponds to the end of the winter period. In winter, due to a strong decrease in water temperature, photosynthesis sharply decreases, which leads to a strong decrease in CO2 absorption and, accordingly, an increase in its concentration in water bodies and further emission. In freezing lakes of the boreal zone, sometimes there is also a strong short-term release of carbon dioxide corresponding to the stage of destruction of the ice cover. This release is explained by the higher bio-productivity of water bodies in the boreal zone compared to water areas of the subarctic zone.
In this paper, we tried to briefly explain the reasons for the seasonal cyclicity of CO2 concentration in the atmospheric column over water bodies, as well as the presence or absence of short-term CO2 emissions during the period of ice destruction in a number of water bodies. A detailed study of these reasons is a topic for a separate large-scale work, with the involvement of many specialists dealing with the study of lakes and wetlands, the dynamics of their waters, bio-productivity, atmospheric physics, etc. We did not set such a global task for ourselves. We wanted to show that all such water bodies have similar dynamics of CO2 content in the atmosphere and that it is associated with their phenological phases.
It is almost impossible to carry out contact measurements of the seasonal dynamics of carbon dioxide concentration in the atmosphere for all water bodies in the subarctic and boreal zones. However, data from the SMOS satellite can be used. Thus, satellite microwave radiometry data can be potentially implemented to indirectly characterize seasonal changes in atmospheric CO2 concentrations over large freshwater areas and wetlands in the boreal and subarctic zones.

