Submitted:
08 October 2023
Posted:
09 October 2023
You are already at the latest version
Abstract
Keywords:
1. Introduction
2. Materials and Methods
2.1. Ethical approval
2.2. Experimental animals
2.3. Sample collection
2.4. Determination of ALP, LPS, and ROS levels
2.5. Measurement of gut permeability
2.6. Determination of Antioxidant activity
2.7. Measurement of metabolic (plasma lipid) profiles
2.8. Hematoxylin and Eosin (H&E) staining
2.9. RNA extraction and cDNA synthesis for RT-qPCR analysis
2.10. Statistical analysis
3. Results
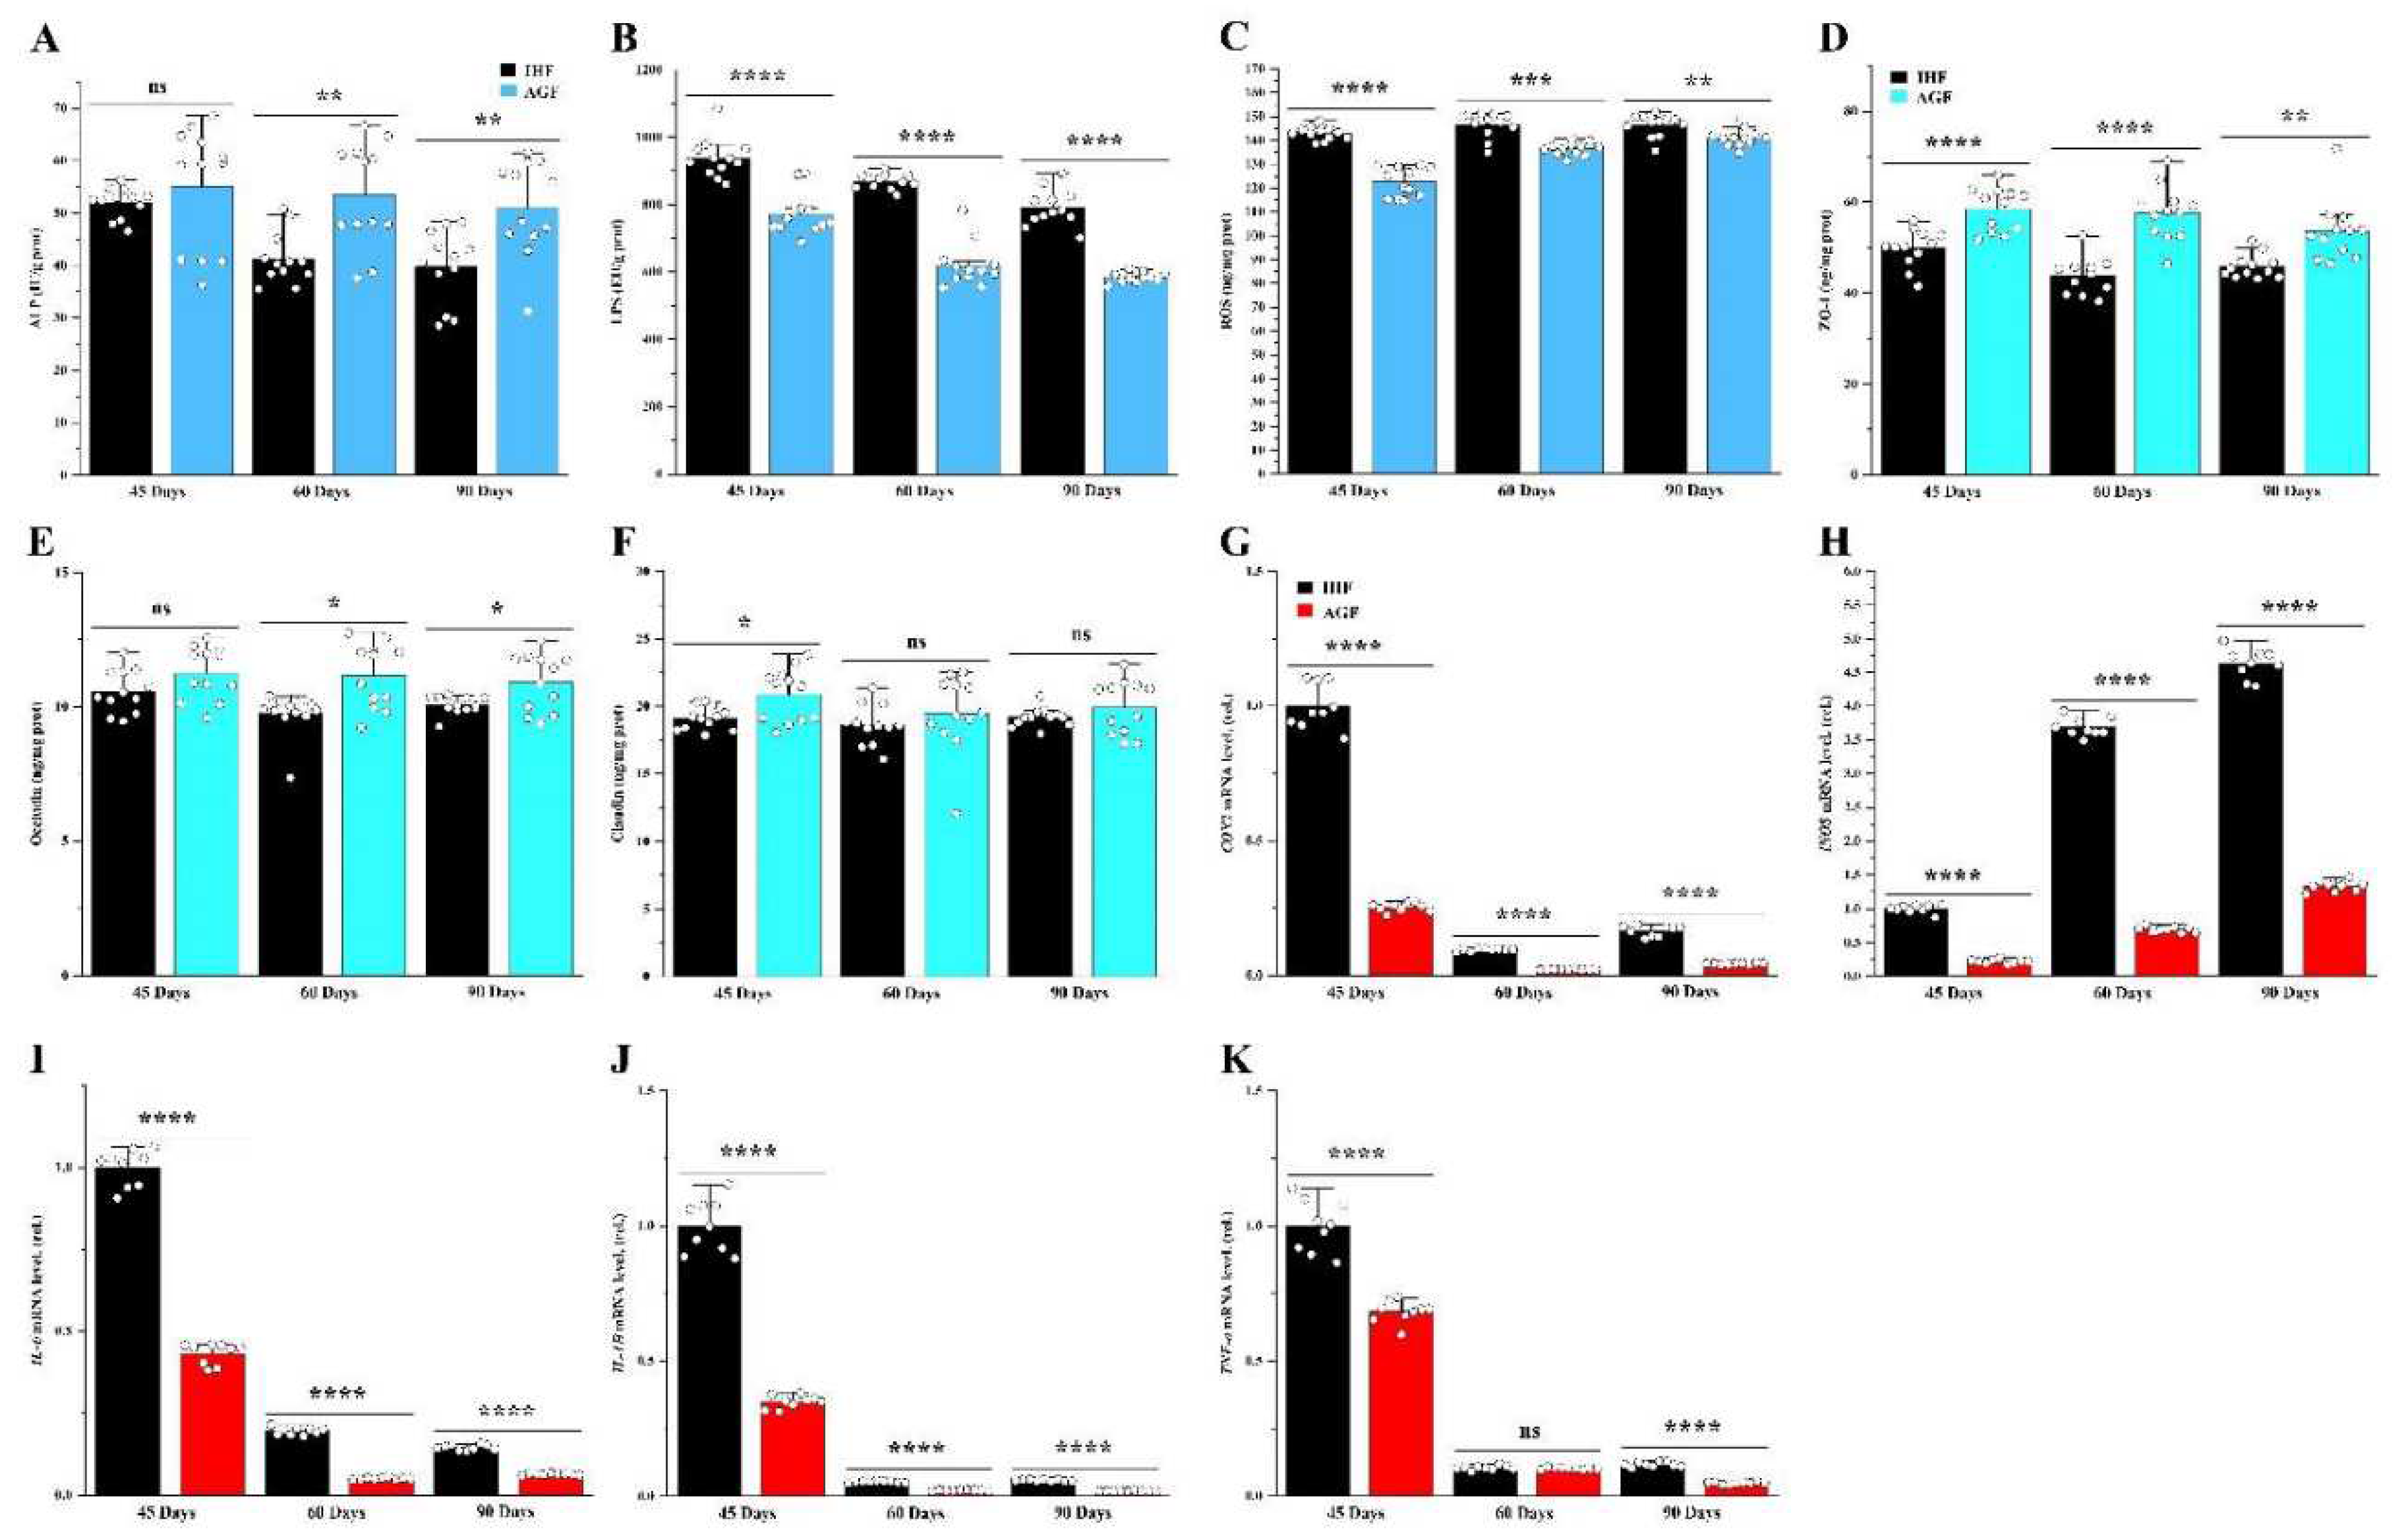
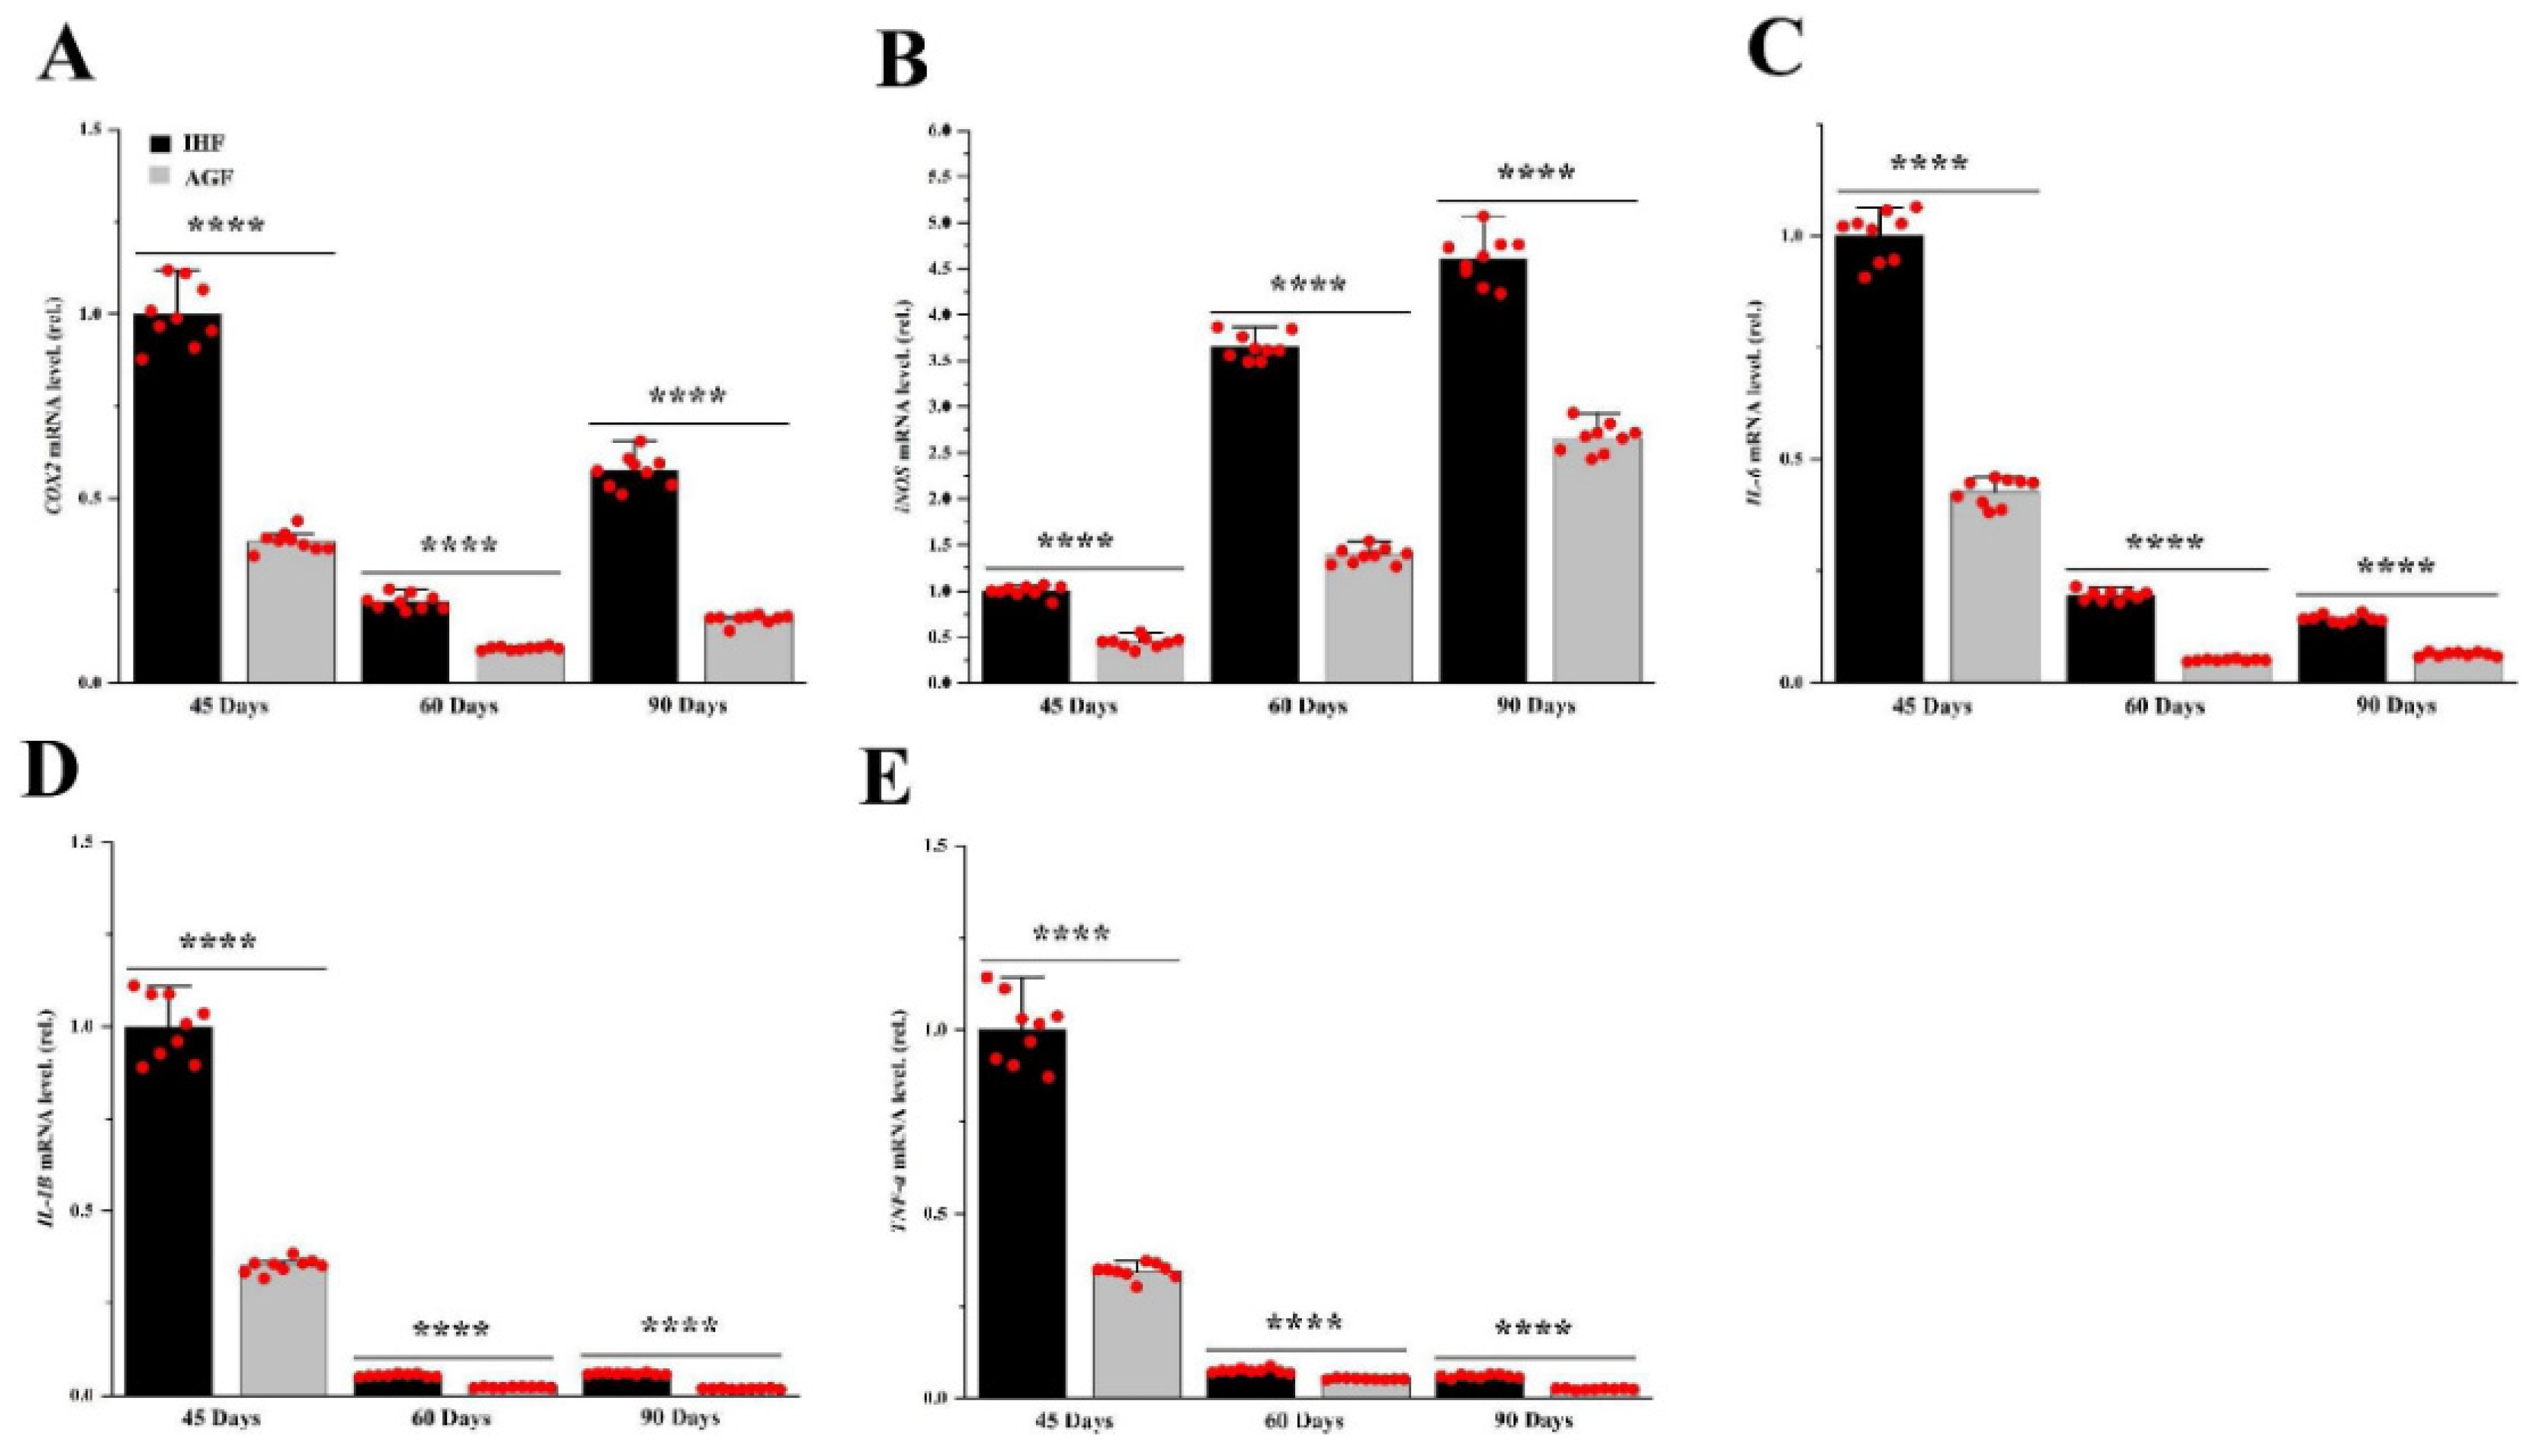
3.1. A commercial diet-dependent decline in ALP activity caused gut permeability and systemic inflammation
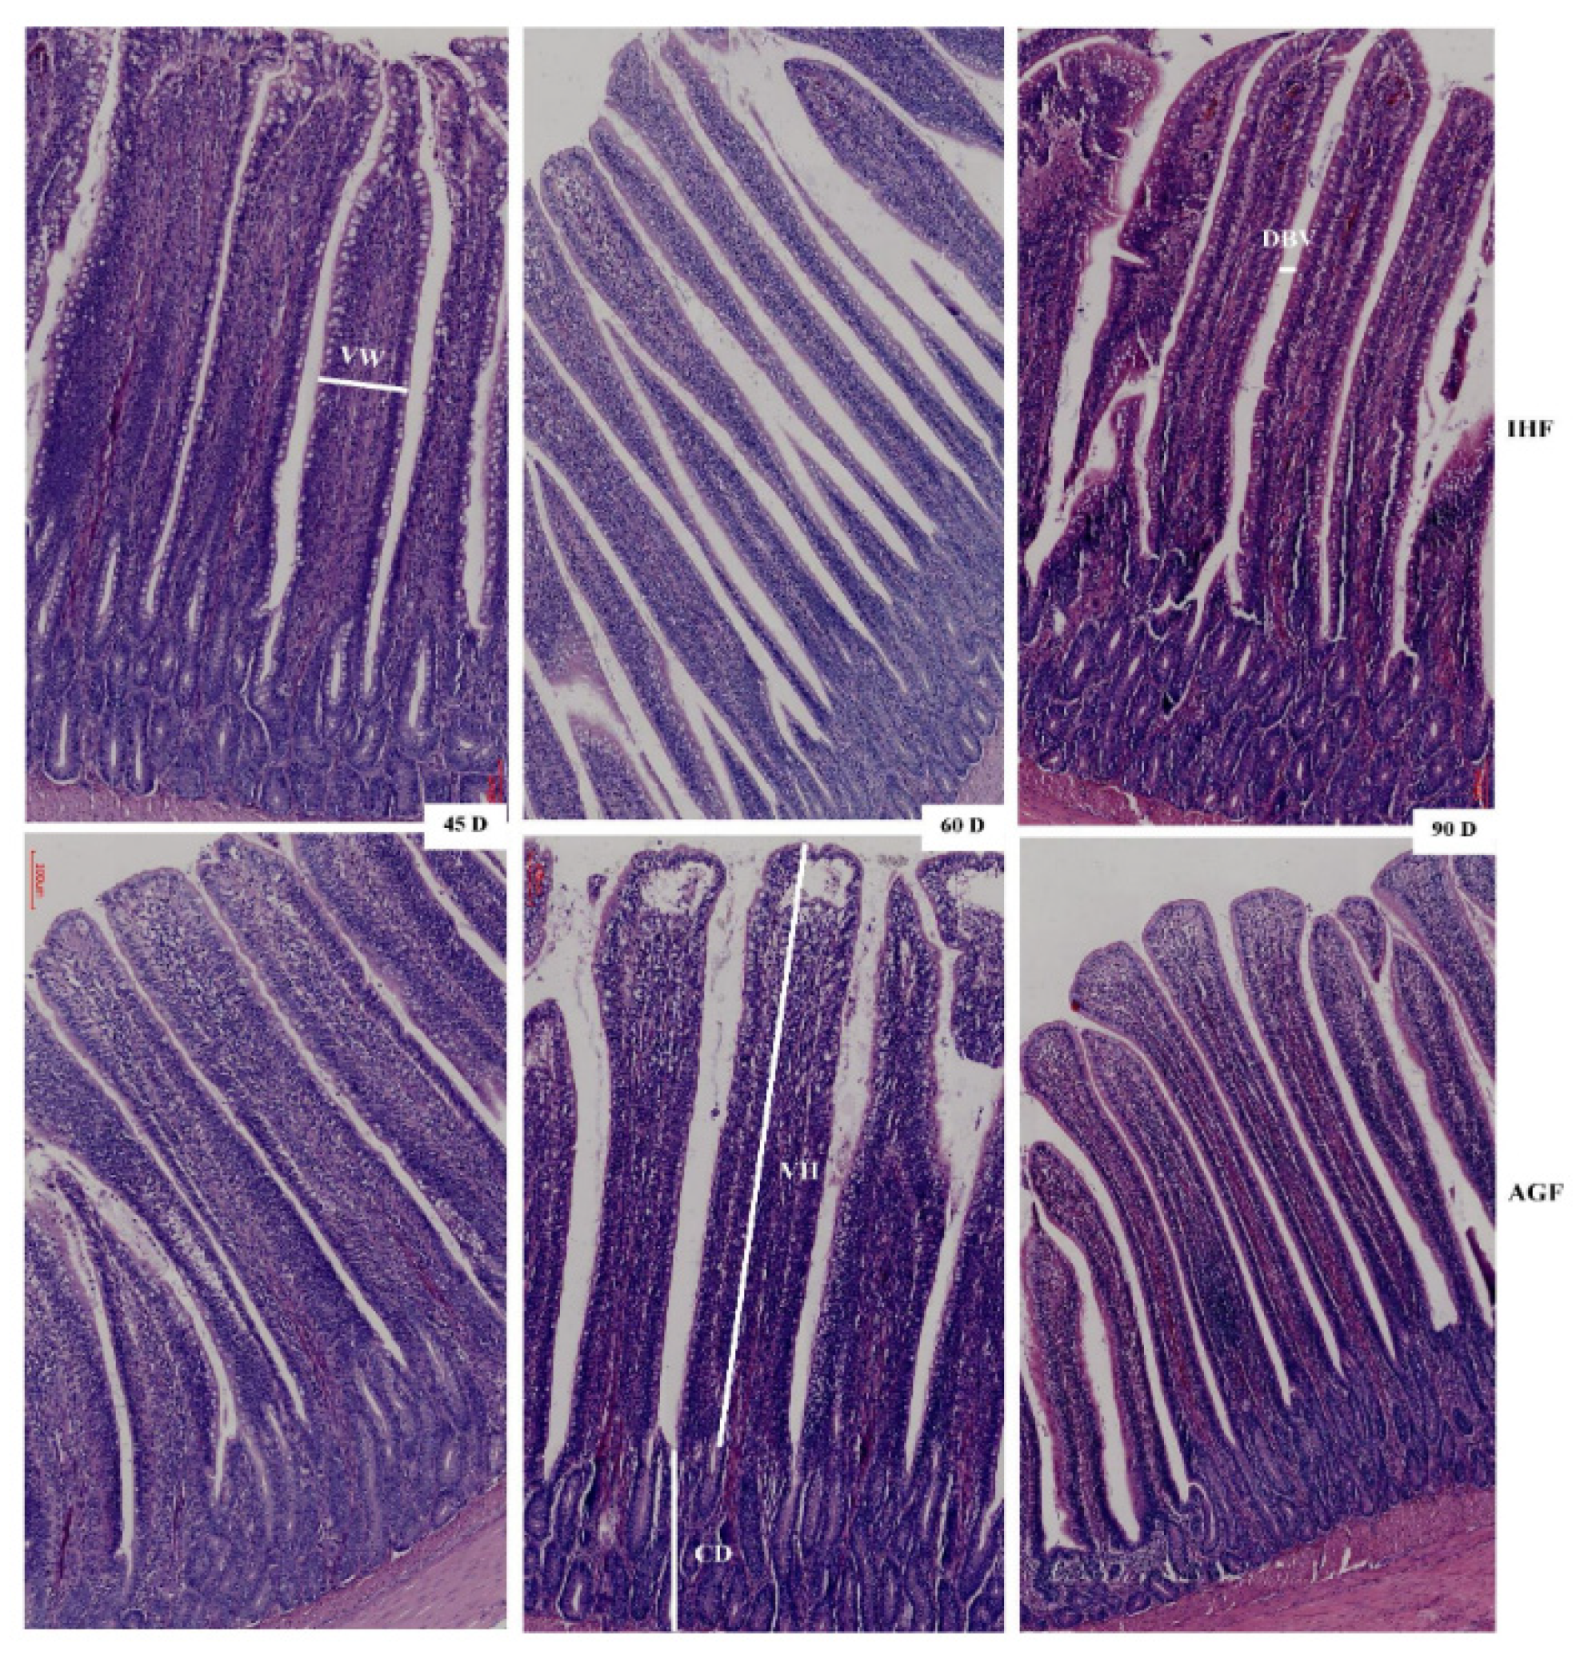
3.2. Commercial diet caused deterioration of nutrient absorption
3.3. Commercial diet-dependent gut permeability is paralleled by liver inflammation
3.4. Long-term pasture intake causes redox signaling pathway activation
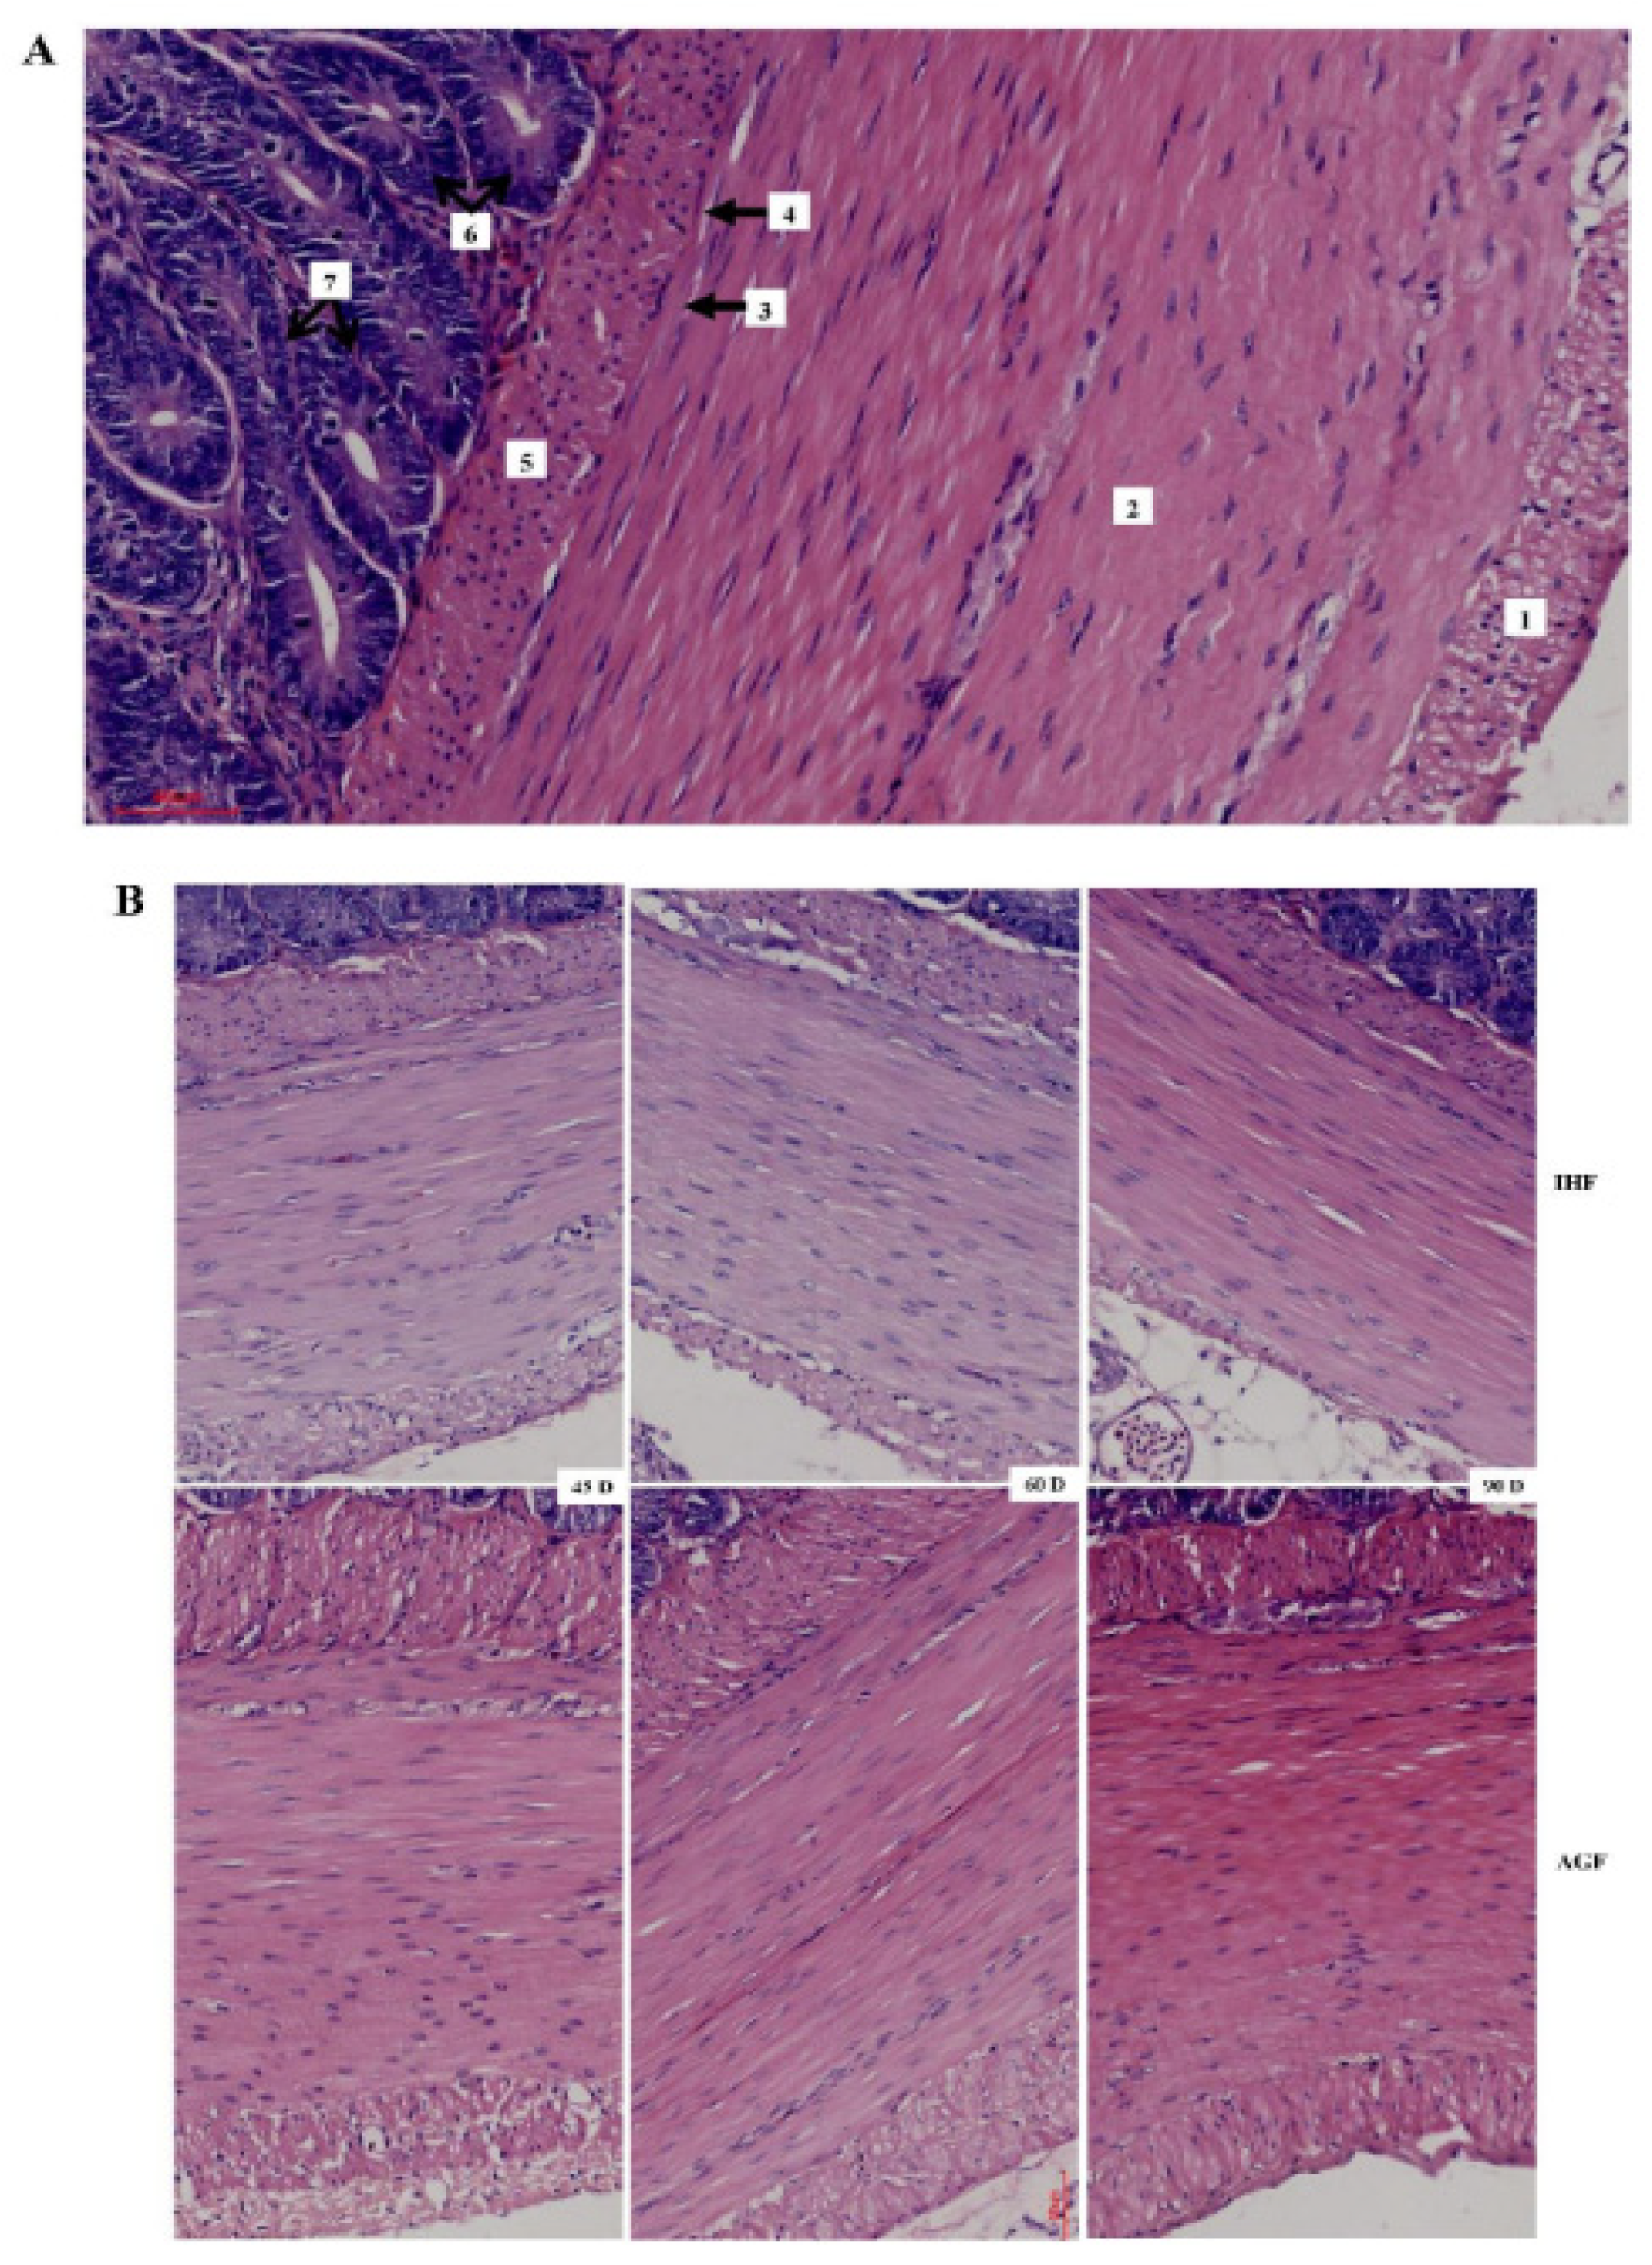
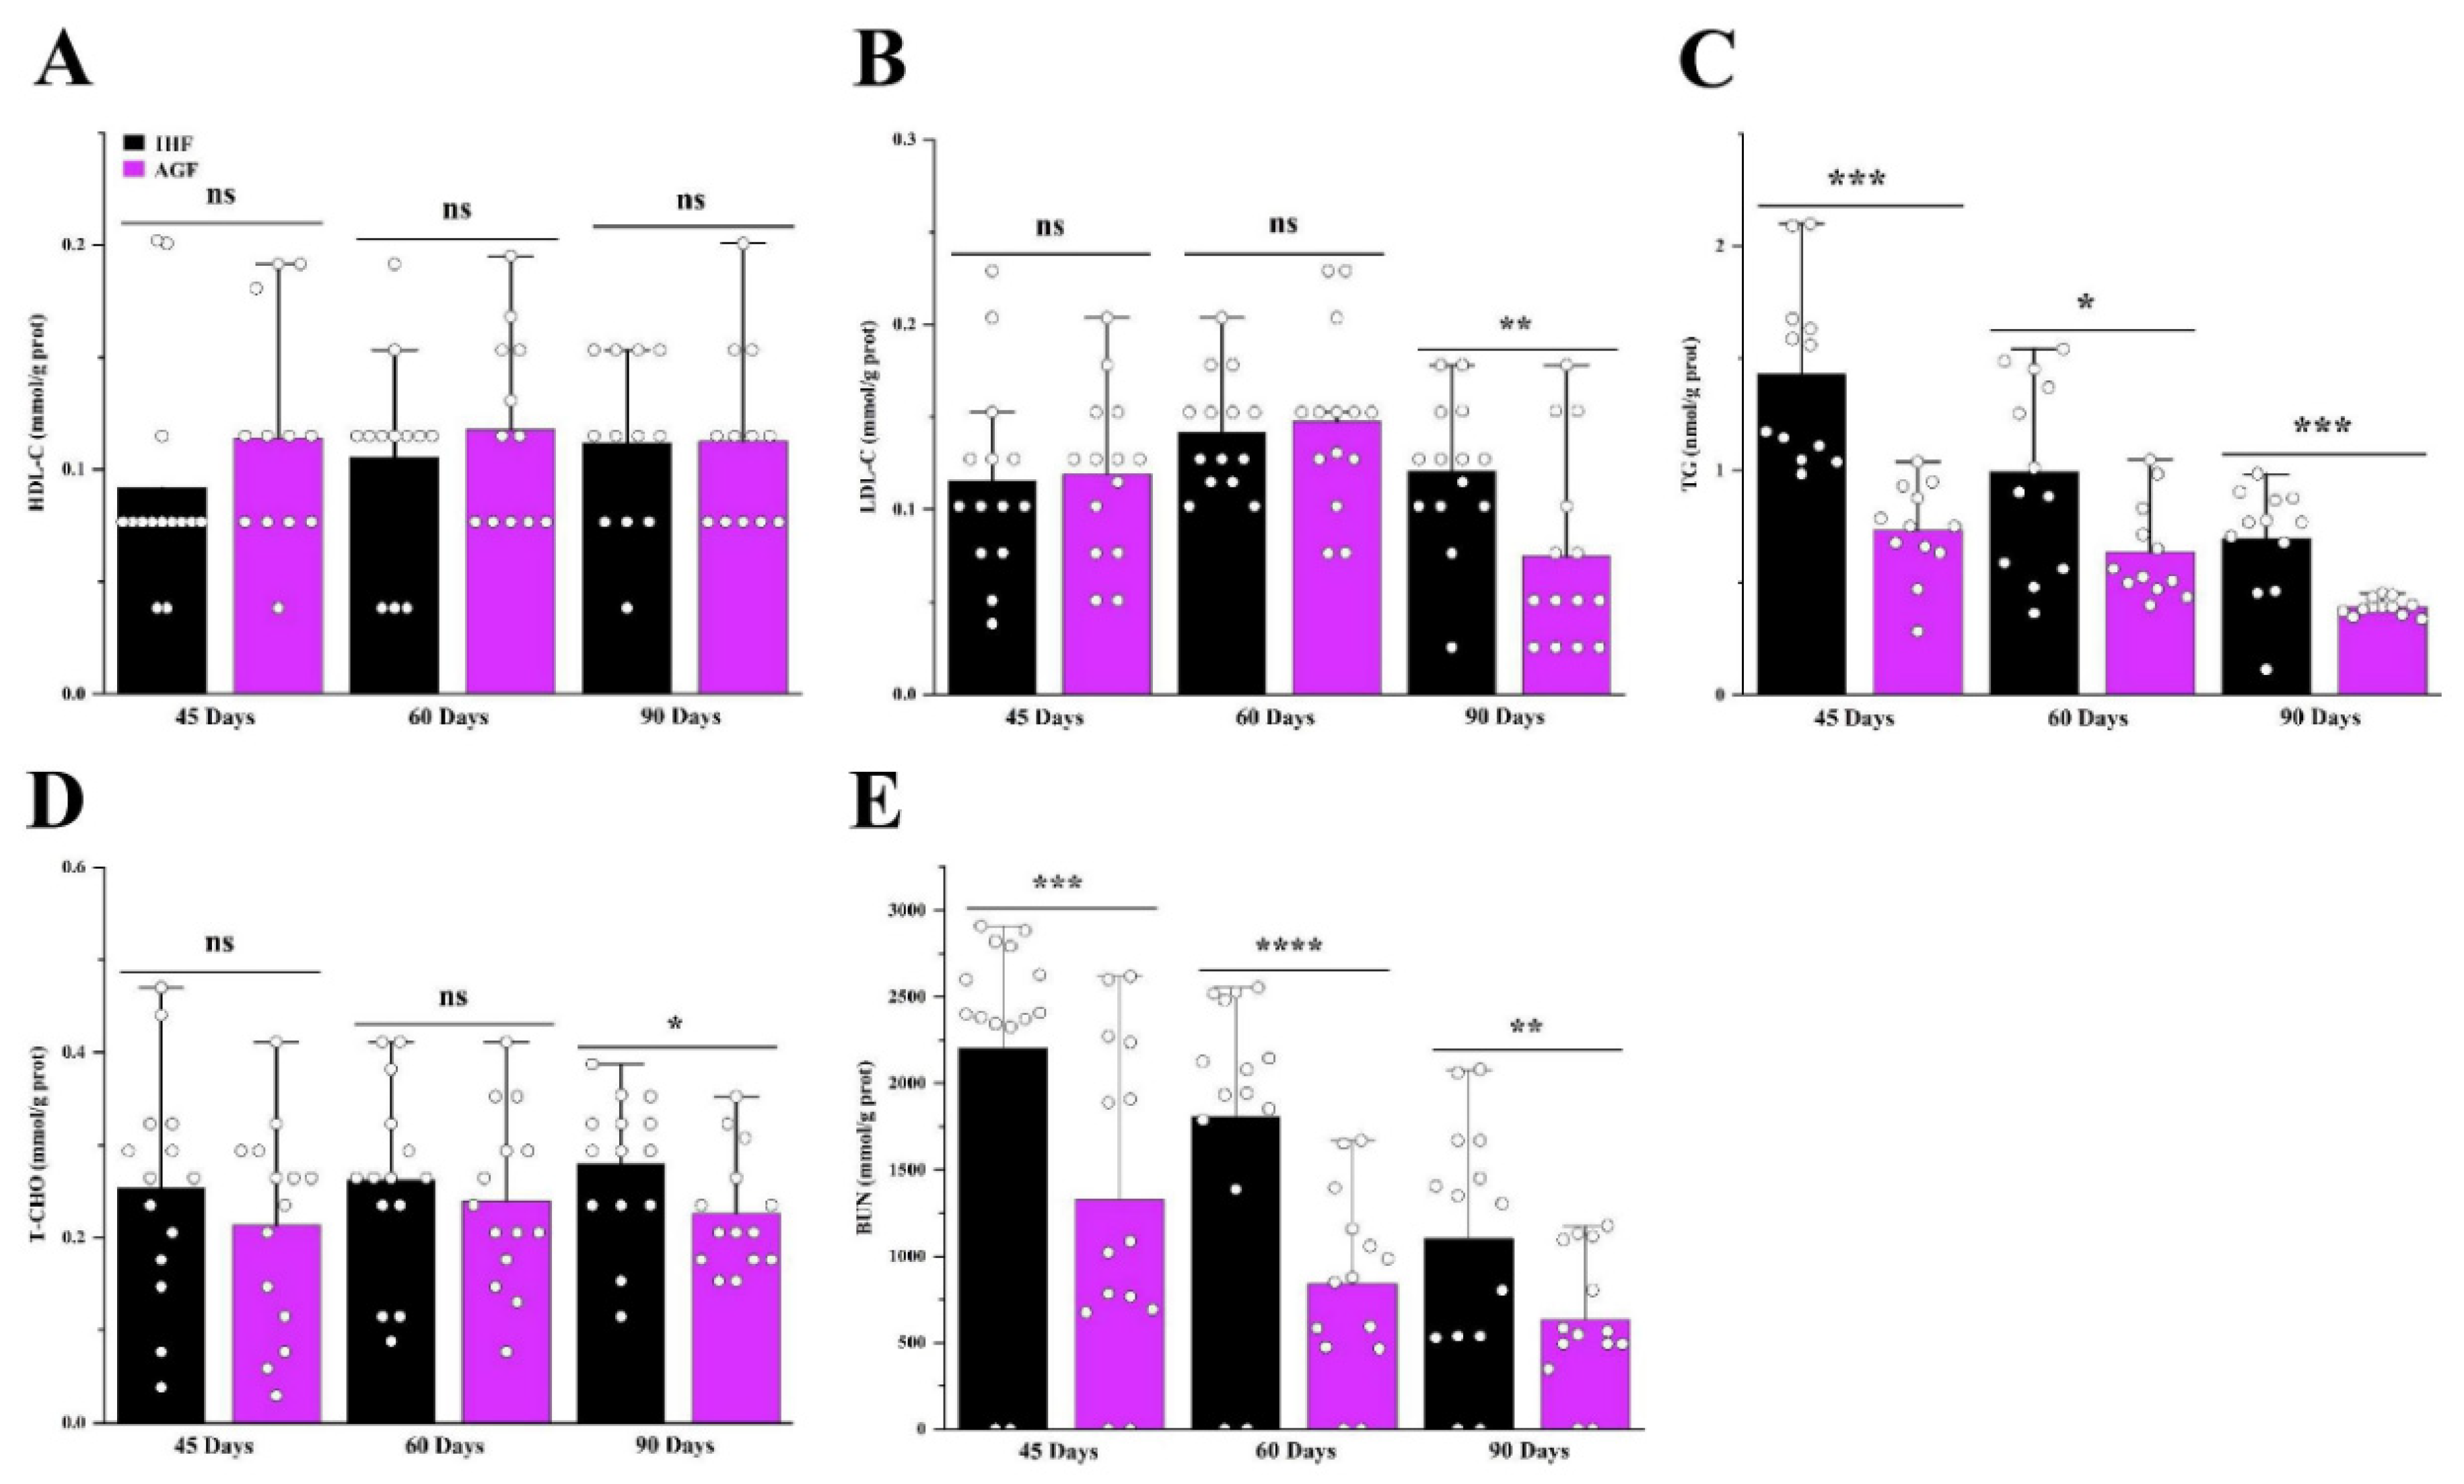
3.5. Long-term pasture intake caused improved growth performance, intestinal organ development, and the metabolic profile of geese
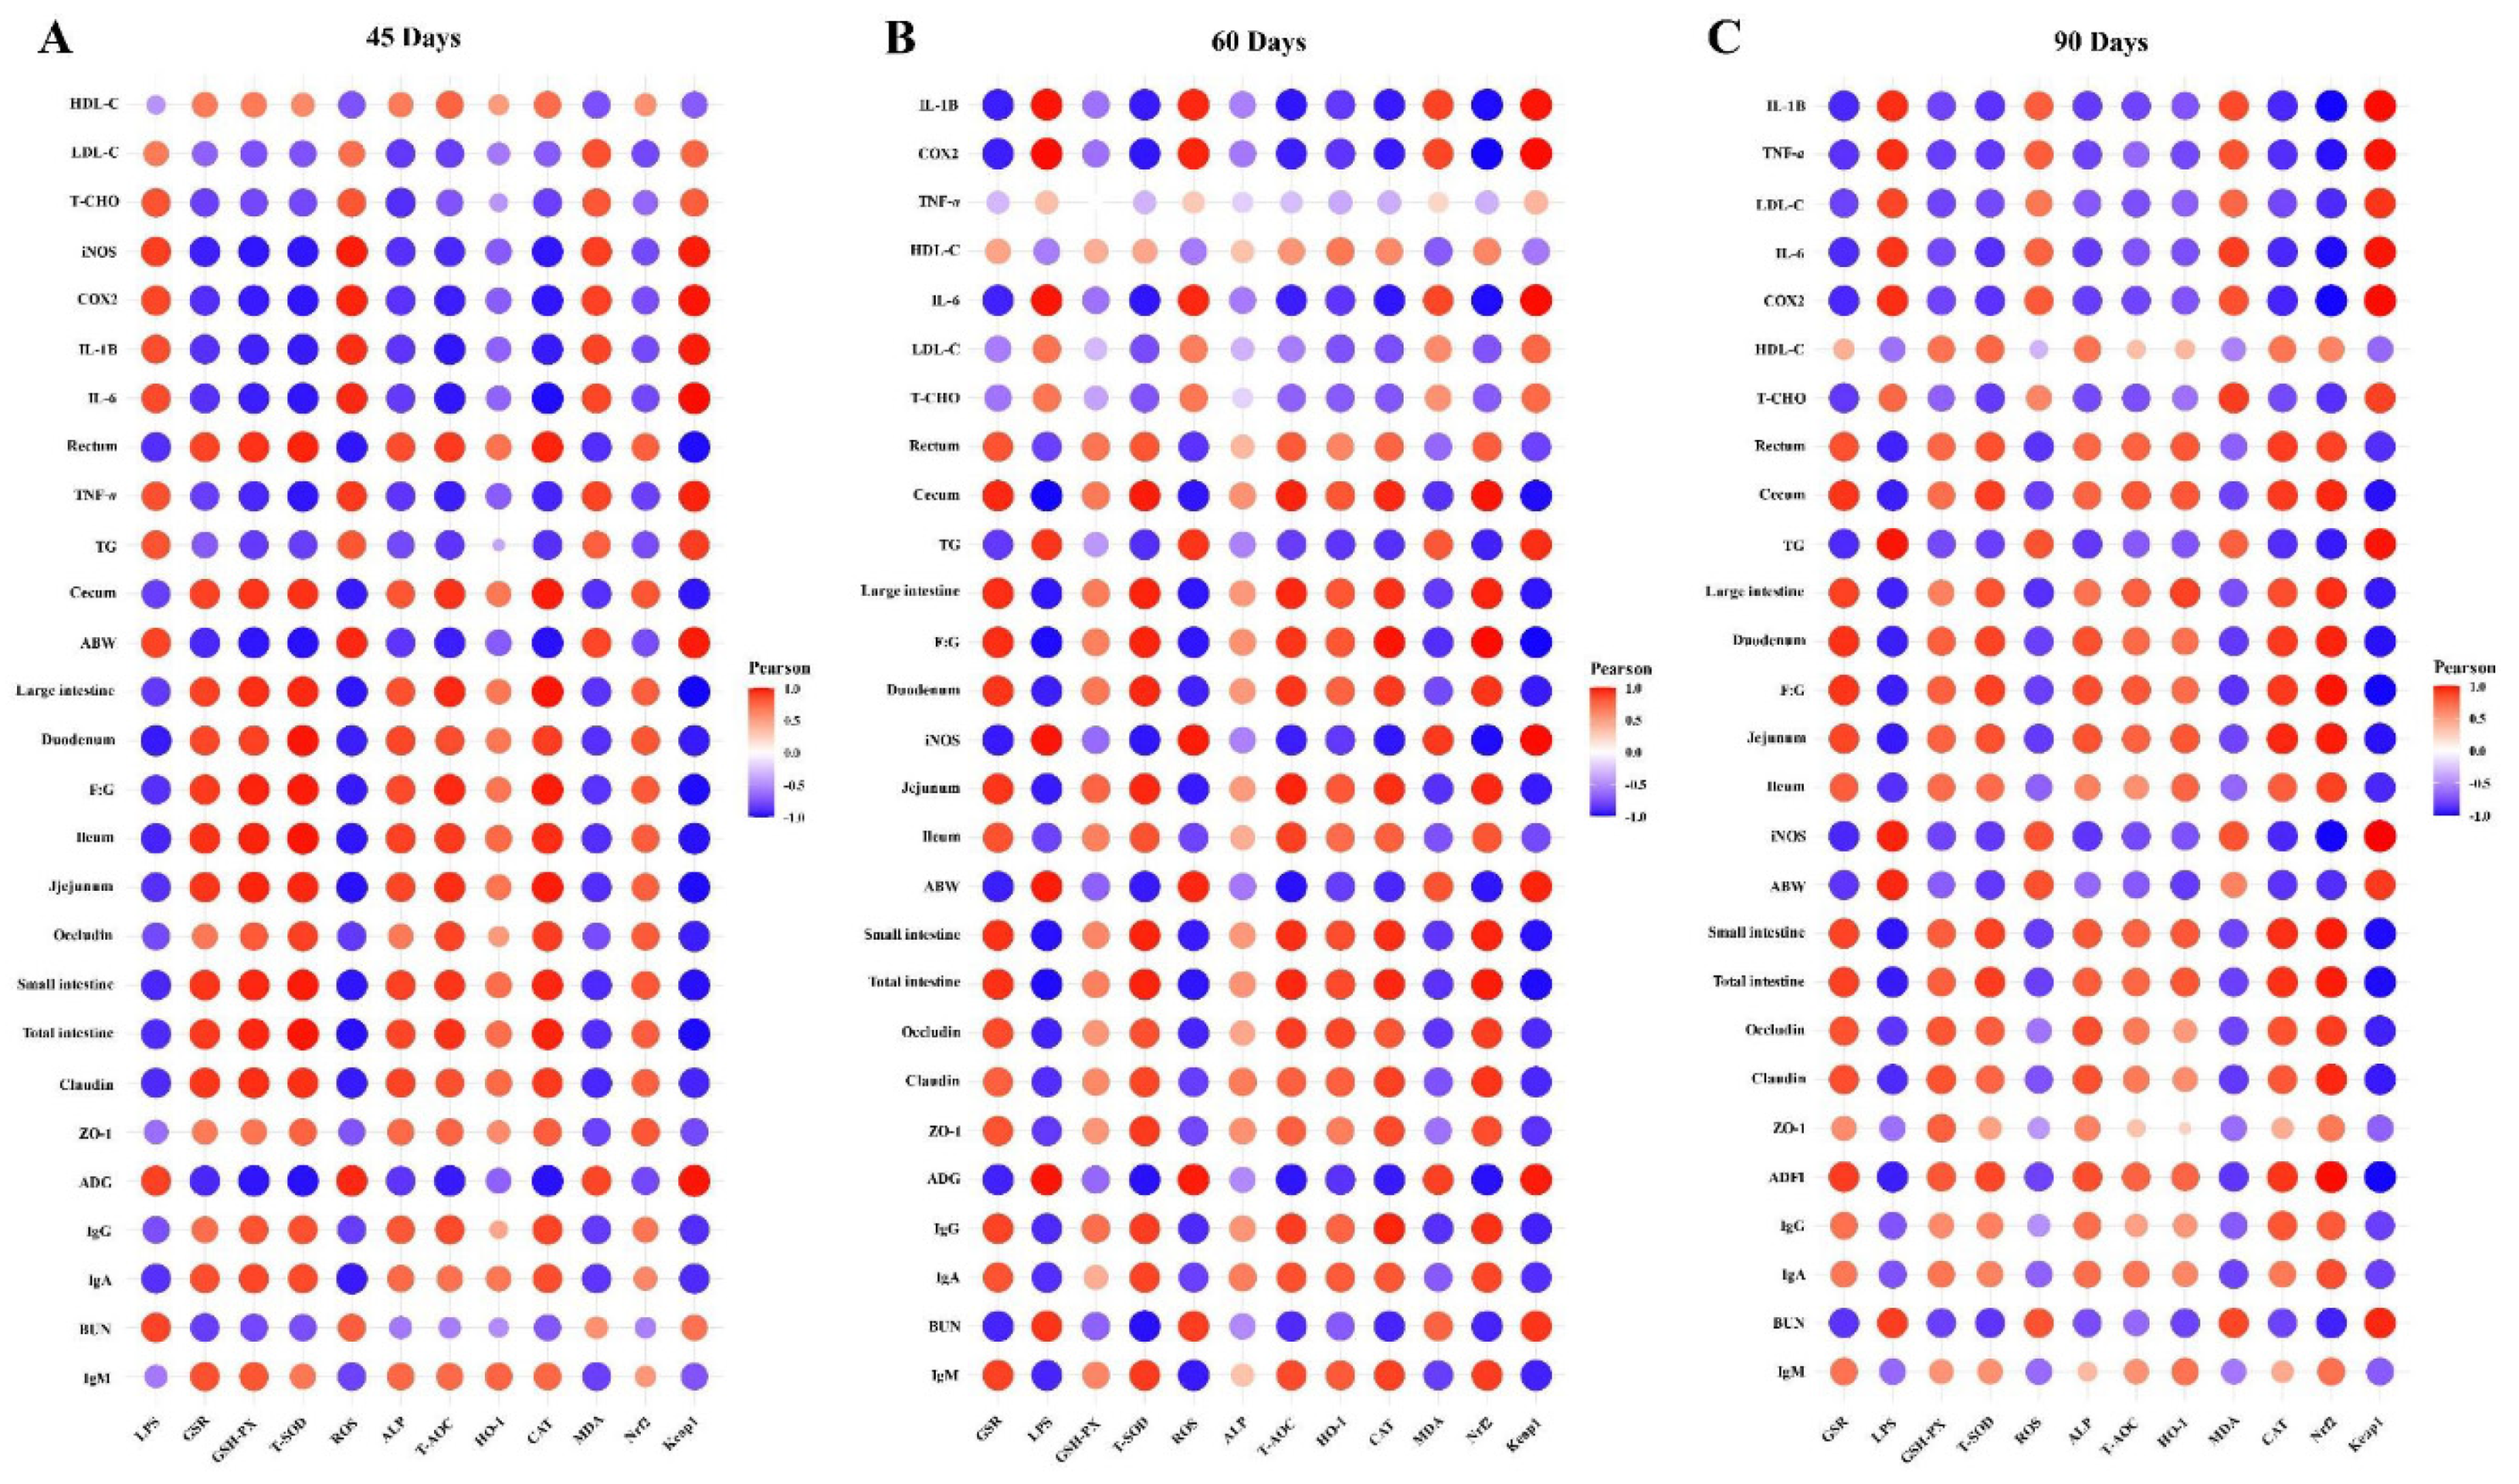
3.6. Integrated analysis of host markers
4. Discussion
5. Conclusions
Supplementary Materials
Acknowledgments
Conflicts of Interest
References
- Obianwuna, U.E.; Agbai Kalu, N.; Wang, J.; Zhang, H.; Qi, G.; Qiu, K.; Wu, S. Recent Trends on Mitigative Effect of Probiotics on Oxidative-Stress-Induced Gut Dysfunction in Broilers under Necrotic Enteritis Challenge: A Review. Antioxidants (Basel, Switzerland) 2023, 12. [Google Scholar] [CrossRef]
- Romano, K.P.; Hung, D.T. Targeting LPS biosynthesis and transport in gram-negative bacteria in the era of multi-drug resistance. Biochimica et biophysica acta. Molecular cell research 2023, 1870, 119407. [Google Scholar] [CrossRef]
- Ali, Q.; Ma, S.; Farooq, U.; Niu, J.; Li, F.; Li, D.; Wang, Z.; Sun, H.; Cui, Y.; Shi, Y. Pasture intake protects against commercial diet-induced lipopolysaccharide production facilitated by gut microbiota through activating intestinal alkaline phosphatase enzyme in meat geese. Frontiers in immunology 2022, 13, 1041070. [Google Scholar] [CrossRef] [PubMed]
- Volk, A.; Lee, J. Cyanobacterial blooms: A player in the freshwater environmental resistome with public health relevance? Environmental research 2023, 216, 114612. [Google Scholar] [CrossRef] [PubMed]
- Kumar, A.; Ali, A.; Kapardar, R.K.; Dar, G.M.; Nimisha; Apurva; Sharma, A. K.; Verma, R.; Sattar, R.S.A.; Ahmad, E.; et al. Implication of gut microbes and its metabolites in colorectal cancer. Journal of cancer research and clinical oncology 2023, 149, 441–465. [Google Scholar] [CrossRef] [PubMed]
- Pham, V.H.; Abbas, W.; Huang, J.; Guo, F.; Zhang, K.; Kong, L.; Zhen, W.; Guo, Y.; Wang, Z. Dietary coated essential oil and organic acid mixture supplementation improves health of broilers infected with avian pathogenic Escherichia coli. Animal nutrition (Zhongguo xu mu shou yi xue hui) 2023, 12, 245–262. [Google Scholar] [CrossRef] [PubMed]
- Moradi Vastegani, S.; Hajipour, S.; Sarkaki, A.; Basir, Z.; Parisa Navabi, S.; Farbood, Y.; Khoshnam, S.E. Curcumin mitigates lipopolysaccharide-induced anxiety/depression-like behaviors, blood-brain barrier dysfunction and brain edema by decreasing cerebral oxidative stress in male rats. Neuroscience letters 2022, 782, 136697. [Google Scholar] [CrossRef] [PubMed]
- Sahasrabudhe, N.M.; Beukema, M.; Tian, L.; Troost, B.; Scholte, J.; Bruininx, E.; Bruggeman, G.; van den Berg, M.; Scheurink, A.; Schols, H.A.; et al. Dietary Fiber Pectin Directly Blocks Toll-Like Receptor 2-1 and Prevents Doxorubicin-Induced Ileitis. Frontiers in immunology 2018, 9, 383. [Google Scholar] [CrossRef] [PubMed]
- Wellington, M.O.; Hamonic, K.; Krone, J.E.C.; Htoo, J.K.; Van Kessel, A.G.; Columbus, D.A. Effect of dietary fiber and threonine content on intestinal barrier function in pigs challenged with either systemic E. coli lipopolysaccharide or enteric Salmonella Typhimurium. Journal of animal science and biotechnology 2020, 11, 38. [Google Scholar] [CrossRef]
- Chauhan, A.; Islam, A.U.; Prakash, H.; Singh, S. Phytochemicals targeting NF-κB signaling: Potential anti-cancer interventions. Journal of pharmaceutical analysis 2022, 12, 394–405. [Google Scholar] [CrossRef]
- Okazaki, Y.; Katayama, T. Glucomannan consumption elevates colonic alkaline phosphatase activity by up-regulating the expression of IAP-I, which is associated with increased production of protective factors for gut epithelial homeostasis in high-fat diet-fed rats. Nutrition research (New York, N.Y.) 2017, 43, 43–50. [Google Scholar] [CrossRef]
- Fawley, J.; Gourlay, D.M. Intestinal alkaline phosphatase: a summary of its role in clinical disease. The Journal of surgical research 2016, 202, 225–234. [Google Scholar] [CrossRef] [PubMed]
- Ghosh, S.S.; Gehr, T.W.; Ghosh, S. Curcumin and chronic kidney disease (CKD): major mode of action through stimulating endogenous intestinal alkaline phosphatase. Molecules (Basel, Switzerland) 2014, 19, 20139–20156. [Google Scholar] [CrossRef]
- Escobar-Correas, S.; Broadbent, J.A.; Andraszek, A.; Stockwell, S.; Howitt, C.A.; Juhász, A.; Colgrave, M.L. Perennial Ryegrass Contains Gluten-Like Proteins That Could Contaminate Cereal Crops. Frontiers in nutrition 2021, 8, 708122. [Google Scholar] [CrossRef] [PubMed]
- Cartoni Mancinelli, A.; Mattioli, S.; Dal Bosco, A.; Piottoli, L.; Ranucci, D.; Branciari, R.; Cotozzolo, E.; Castellini, C. Rearing Romagnola geese in vineyard: Pasture and antioxidant intake, performance, carcass and meat quality. Italian Journal of Animal Science 2019, 18, 372–380. [Google Scholar] [CrossRef]
- Barati, M.T.; Caster, D.J. The potential of Nrf2 activation as a therapeutic target in systemic lupus erythematosus. Metabolites 2022, 12, 151. [Google Scholar] [CrossRef] [PubMed]
- Salvatore, S.; Battigaglia, M.S.; Murone, E.; Dozio, E.; Pensabene, L.; Agosti, M. Dietary Fibers in Healthy Children and in Pediatric Gastrointestinal Disorders: A Practical Guide. Nutrients 2023, 15. [Google Scholar] [CrossRef] [PubMed]
- Huyghebaert, G.; Ducatelle, R.; Van Immerseel, F. An update on alternatives to antimicrobial growth promoters for broilers. Veterinary journal (London, England : 1997) 2011, 187, 182–188. [Google Scholar] [CrossRef]
- Lu, Y.C.; Yeh, W.C.; Ohashi, P.S. LPS/TLR4 signal transduction pathway. Cytokine 2008, 42, 145–151. [Google Scholar] [CrossRef]
- Cui, J.; Chen, Y.; Wang, H.Y.; Wang, R.F. Mechanisms and pathways of innate immune activation and regulation in health and cancer. Human vaccines & immunotherapeutics 2014, 10, 3270–3285. [Google Scholar] [CrossRef]
- Guo, S.; Al-Sadi, R.; Said, H.M.; Ma, T.Y. Lipopolysaccharide causes an increase in intestinal tight junction permeability in vitro and in vivo by inducing enterocyte membrane expression and localization of TLR-4 and CD14. The American journal of pathology 2013, 182, 375–387. [Google Scholar] [CrossRef] [PubMed]
- Kühn, F.; Adiliaghdam, F.; Cavallaro, P.M.; Hamarneh, S.R.; Tsurumi, A.; Hoda, R.S.; Munoz, A.R.; Dhole, Y.; Ramirez, J.M.; Liu, E.; et al. Intestinal alkaline phosphatase targets the gut barrier to prevent aging. JCI insight 2020, 5. [Google Scholar] [CrossRef] [PubMed]
- Koyama, I.; Matsunaga, T.; Harada, T.; Hokari, S.; Komoda, T. Alkaline phosphatases reduce toxicity of lipopolysaccharides in vivo and in vitro through dephosphorylation. Clinical Biochemistry 2002, 35, 455–461. [Google Scholar] [CrossRef] [PubMed]
- Lee, D.H.; Lim, B.S.; Lee, Y.K.; Yang, H.C. Effects of hydrogen peroxide (H2O2) on alkaline phosphatase activity and matrix mineralization of odontoblast and osteoblast cell lines. Cell biology and toxicology 2006, 22, 39–46. [Google Scholar] [CrossRef]
- Hills, R.D., Jr.; Pontefract, B.A.; Mishcon, H.R.; Black, C.A.; Sutton, S.C.; Theberge, C.R. Gut Microbiome: Profound Implications for Diet and Disease. Nutrients 2019, 11. [Google Scholar] [CrossRef] [PubMed]
- Xi, Y.; Huang, Y.; Li, Y.; Huang, Y.; Yan, J.; Shi, Z. The effects of dietary protein and fiber levels on growth performance, gout occurrence, intestinal microbial communities, and immunoregulation in the gut-kidney axis of goslings. Poultry science 2022, 101, 101780. [Google Scholar] [CrossRef]
- Liu, W.; Hu, D.; Huo, H.; Zhang, W.; Adiliaghdam, F.; Morrison, S.; Ramirez, J.M.; Gul, S.S.; Hamarneh, S.R.; Hodin, R.A. Intestinal Alkaline Phosphatase Regulates Tight Junction Protein Levels. Journal of the American College of Surgeons 2016, 222, 1009–1017. [Google Scholar] [CrossRef]
- Ali, Q.; Ma, S.; La, S.; Guo, Z.; Liu, B.; Gao, Z.; Farooq, U.; Wang, Z.; Zhu, X.; Cui, Y.; et al. Microbial short-chain fatty acids: a bridge between dietary fibers and poultry gut health - A review. Animal bioscience 2022, 35, 1461–1478. [Google Scholar] [CrossRef]
- Alemka, A.; Whelan, S.; Gough, R.; Clyne, M.; Gallagher, M.E.; Carrington, S.D.; Bourke, B. Purified chicken intestinal mucin attenuates Campylobacter jejuni pathogenicity in vitro. Journal of medical microbiology 2010, 59, 898–903. [Google Scholar] [CrossRef]
- Pourabedin, M.; Chen, Q.; Yang, M.; Zhao, X. Mannan-and xylooligosaccharides modulate caecal microbiota and expression of inflammatory-related cytokines and reduce caecal Salmonella Enteritidis colonisation in young chickens. FEMS microbiology ecology 2017, 93, fiw226. [Google Scholar] [CrossRef]
- Mappley, L.J.; La Ragione, R.M.; Woodward, M.J. Brachyspira and its role in avian intestinal spirochaetosis. Veterinary microbiology 2014, 168, 245–260. [Google Scholar] [CrossRef] [PubMed]
- McNabney, S.M.; Henagan, T.M. Short chain fatty acids in the colon and peripheral tissues: a focus on butyrate, colon cancer, obesity and insulin resistance. Nutrients 2017, 9, 1348. [Google Scholar] [CrossRef]
- Guerville, M.; Boudry, G. Gastrointestinal and hepatic mechanisms limiting entry and dissemination of lipopolysaccharide into the systemic circulation. American journal of physiology. Gastrointestinal and liver physiology 2016, 311, G1–g15. [Google Scholar] [CrossRef] [PubMed]
- Estaki, M.; DeCoffe, D.; Gibson, D.L. Interplay between intestinal alkaline phosphatase, diet, gut microbes and immunity. World journal of gastroenterology 2014, 20, 15650–15656. [Google Scholar] [CrossRef] [PubMed]
- Simmons, D.L.; Botting, R.M.; Hla, T. Cyclooxygenase isozymes: the biology of prostaglandin synthesis and inhibition. Pharmacological reviews 2004, 56, 387–437. [Google Scholar] [CrossRef]
- Varadhan, R.; Yao, W.; Matteini, A.; Beamer, B.A.; Xue, Q.L.; Yang, H.; Manwani, B.; Reiner, A.; Jenny, N.; Parekh, N.; et al. Simple biologically informed inflammatory index of two serum cytokines predicts 10 year all-cause mortality in older adults. The journals of gerontology. Series A, Biological sciences and medical sciences 2014, 69, 165–173. [Google Scholar] [CrossRef]
- Horie, Y.; Suzuki, T.; Inoue, J.; Iso, T.; Wells, G.; Moore, T.W.; Mizushima, T.; Dinkova-Kostova, A.T.; Kasai, T.; Kamei, T.; et al. Molecular basis for the disruption of Keap1–Nrf2 interaction via Hinge & Latch mechanism. Communications Biology 2021, 4, 576. [Google Scholar] [CrossRef]
- Arroyave-Ospina, J.C.; Wu, Z.; Geng, Y.; Moshage, H. Role of Oxidative Stress in the Pathogenesis of Non-Alcoholic Fatty Liver Disease: Implications for Prevention and Therapy. Antioxidants (Basel, Switzerland) 2021, 10. [Google Scholar] [CrossRef]
- Chen, Z.; Xing, T.; Li, J.; Zhang, L.; Jiang, Y.; Gao, F. Oxidative stress impairs the meat quality of broiler by damaging mitochondrial function, affecting calcium metabolism and leading to ferroptosis. Animal bioscience 2022, 35, 1616–1627. [Google Scholar] [CrossRef]
- Ling, J.; GAO, Y.-y.; Hui, Y.; WANG, W.-c.; LIN, Z.-p.; YANG, H.-y.; HUANG, S.-b.; Lin, Y. Effects of dietary fiber and grit on performance, gastrointestinal tract development, lipometabolism, and grit retention of goslings. Journal of Integrative Agriculture 2014, 13, 2731–2740. [Google Scholar]
- Chen, J.; Weng, K.; Liu, J.; Gu, W.; Luo, S.; Zheng, M.; Cao, Z.; Zhang, Y.; Zhang, Y.; Chen, G. Effect of different free-range systems on the growth performance, carcass traits, and meat quality of Yangzhou geese. Animal Biotechnology 2022, 1–7. [Google Scholar] [CrossRef] [PubMed]
- He, C.; Wu, H.; Lv, Y.; You, H.; Zha, L.; Li, Q.; Huang, Y.; Tian, J.; Chen, Q.; Shen, Y. Gastrointestinal development and microbiota responses of geese to honeycomb flavonoids supplementation. Frontiers in Veterinary Science 2021, 8, 739237. [Google Scholar] [CrossRef] [PubMed]
- Zheng, M.; Mao, P.; Tian, X.; Meng, L. Effects of grazing mixed-grass pastures on growth performance, immune responses, and intestinal microbiota in free-range Beijing-you chickens. Poultry science 2021, 100, 1049–1058. [Google Scholar] [CrossRef] [PubMed]
- Tomizawa, M.; Kawanabe, Y.; Shinozaki, F.; Sato, S.; Motoyoshi, Y.; Sugiyama, T.; Yamamoto, S.; Sueishi, M. Triglyceride is strongly associated with nonalcoholic fatty liver disease among markers of hyperlipidemia and diabetes. Biomedical reports 2014, 2, 633–636. [Google Scholar] [CrossRef]
- Yang, H.L.; Feng, P.; Xu, Y.; Hou, Y.Y.; Ojo, O.; Wang, X.H. The Role of Dietary Fiber Supplementation in Regulating Uremic Toxins in Patients With Chronic Kidney Disease: A Meta-Analysis of Randomized Controlled Trials. Journal of renal nutrition : the official journal of the Council on Renal Nutrition of the National Kidney Foundation 2021, 31, 438–447. [Google Scholar] [CrossRef]
- Yu, J.; Yang, Z.; Yang, H.; Wang, Z. Effects of cottonseed meal on growth performance, liver redox status, and serum biochemical parameters in goslings at 1 to 28 days of age. BMC Veterinary Research 2022, 18, 347. [Google Scholar] [CrossRef]


| Parameters | 45 D | 60 D | 90 D | ||||||
|---|---|---|---|---|---|---|---|---|---|
| IHF | AGF | P>0.05 | IHF | AGF | P>0.05 | IHF | AGF | P>0.05 | |
| Inner layer (um) | 51.82±5.76 | 59.5±6.13 | 0.02 | 54.51±5.77 | 80±8.62 | 6.4378E-05 | 48.6±7.3 | 70.29±5.69 | 9.4035E-05 |
| Outer layer (um) | 10.32±2.22 | 14.36±3.51 | 0.02 | 10.97±2.25 | 19.25±3.63 | 0.0004 | 8.53±1.18 | 15.48±2.13 | 6.1937E-05 |
| Total (um) | 62.14±5 | 73.86±9.04 | 0.010 | 65.48±3.93 | 99.26±9.26 | 0.000005 | 57.13±7.57 | 85.77±6.8 | 0.00002 |
| Relative thickness of muscular tonic (um) | 26.98±3.13 | 45.6±6.55 | 0.00005 | 15.34±1.33 | 29.81±2.44 | 0.0000001 | 10.69±1.91 | 19.76±2.71 | 0.00003 |
| Inner layer (um) | 8.89±1.82 | 14.25±3.66 | 0.00464366 | 8.5±1.11 | 21.37±3.68 | 4.7427E-06 | 6.53±1.27 | 11.68±3.4 | 0.003 |
| Outer layer (um) | 1.07±0.17 | 1.58±0.21 | 0.0004 | 1.16±0.25 | 1.61±0.31 | 0.01 | 0.99±0.15 | 1.68±0.33 | 0.0004 |
| Total (um) | 9.95±1.94 | 15.83±3.49 | 0.002 | 9.65±1.01 | 22.97±3.64 | 3.0064E-06 | 7.52±1.32 | 13.35±3.48 | 0.002 |
| Relative thickness of muscularis mucosa (um) | 4.33±0.99 | 9.76±2.21 | 0.0001 | 2.25±0.19 | 6.89±0.99 | 0.0000003 | 1.41±0.32 | 3.13±1.05 | 0.002 |
| Age, d | Parameters | IHF | AGF* | P-value |
|---|---|---|---|---|
| 45 d | ADFI (g/d) | 206.3±0.27 | 171.37±0.23 | 1.62E-20 |
| 60 d | 229.21±0.01 | 183.3±0.27 | 7.42E-23 | |
| 90 d | 308.3±0.09 | 260.4±0.09 | 2.61E-26 | |
| 45 d | ABW (kg) | 2.31±0.13 | 1.63±0.14 | 2.48E-06 |
| 60 d | 4.28±0.16 | 3.33±0.11 | 1.44E-07 | |
| 90 d | 5.39±0.34 | 4.38±0.4 | 0.000411 | |
| 45 d | ADG (g/d) | 81.5±1.26 | 49.06±0.12 | 1.33E-14 |
| 60 d | 123.15±0.35 | 110.88±0.02 | 5.60E-16 | |
| 90 d | 69.38±0.02 | 82.3±0.09 | 4.99E-22 | |
| 45 d | F:G | 1.87±0.01 | 3.27±0.01 | 5.73E-21 |
| 60 d | 1.16±0.01 | 1.8±0.01 | 1.43E-17 | |
| 90 d | 1.25±0 | 1.81±0.01 | 1.11E-16 |
| Age, d | Parameters | IHF | AGF | P-value |
|---|---|---|---|---|
| 45 d | Rectum (cm/Kg) | 7.04±0.6 | 8.9±0.84 | 0.001 |
| 60 d | 3.94±0.53 | 5.22±0.46 | 0.001 | |
| 90 d | 2.99±0.3 | 3.99±0.37 | 0.000 | |
| 45 d | Cecum (cm/Kg) | 10.02±0.63 | 13.87±1.1 | 0.001 |
| 60 d | 5.08±0.36 | 7.93±0.35 | 2.6984E-07 | |
| 90 d | 3.94±0.17 | 6.19±0.3 | 3.54706E-05 | |
| 45 d | Ileum (cm/Kg) | 39.9±4.16 | 47.78±4.24 | 0.004 |
| 60 d | 23.12±1.43 | 29.57±0.56 | 6.31188E-07 | |
| 90 d | 16.42±1 | 24.31±1.75 | 1.1555E-06 | |
| 45 d | Jejunum (cm/Kg) | 42.13±3.18 | 49.34±8.1 | 0.03 |
| 60 d | 23.2±0.73 | 29.49±1.7 | 4.15458E-06 | |
| 90 d | 17.23±1.41 | 22.95±1.13 | 7.64026E-06 | |
| 45 d | Duodenum (cm/Kg) | 20.04±1.1 | 27.26±2.11 | 1.10792E-05 |
| 60 d | 13.98±2.42 | 16.29±1.21 | 0.03 | |
| 90 d | 9.36±1.71 | 12.18±1.77 | 0.01 | |
| 45 d | Large intestine (cm/Kg) | 17.06±0.9 | 22.77±1.69 | 1.29825E-05 |
| 60 d | 9.02±0.67 | 13.15±0.68 | 4.78312E-07 | |
| 90 d | 6.94±0.44 | 10.18±0.58 | 2.02335E-06 | |
| 45 d | Small intestine (cm/Kg) | 102.07±5.98 | 124.38±12.34 | 0.001 |
| 60 d | 60.31±3.55 | 75.35±1.99 | 1.96589E-06 | |
| 90 d | 43.01±1.44 | 59.43±3.06 | 1.56872E-07 | |
| 45 d | Total intestine (cm/Kg) | 119.13±6.26 | 147.15±13.93 | 0.001 |
| 60 d | 69.32±4.12 | 88.5±2.41 | 4.66565E-06 | |
| 90 d | 49.94±1.74 | 69.62±3.51 | 1.15652E-07 |
Disclaimer/Publisher’s Note: The statements, opinions and data contained in all publications are solely those of the individual author(s) and contributor(s) and not of MDPI and/or the editor(s). MDPI and/or the editor(s) disclaim responsibility for any injury to people or property resulting from any ideas, methods, instructions or products referred to in the content. |
© 2023 by the authors. Licensee MDPI, Basel, Switzerland. This article is an open access article distributed under the terms and conditions of the Creative Commons Attribution (CC BY) license (https://creativecommons.org/licenses/by/4.0/).


