Preprint
Article

Exploring Circulating Long Non-Coding RNAs in Mild Cognitive Impairment Patients’ Blood

Altmetrics

Downloads

76

Views

22

Comments

0

A peer-reviewed article of this preprint also exists.

Submitted:

08 October 2023

Posted:

09 October 2023

You are already at the latest version

Alerts
Abstract
miRNA regulatory axes in blood of MCI patients, which includes lncRNA-SNHG16, lncRNA-H19 and lncRNA-NEAT1. Microarray investigations have demonstrated modifications in the expression of long non-coding RNAs (lncRNA) in blood of patients with MCI compared with control samples. This is the first study to explore lncRNA profiles in Mild Cognitive Impairment blood. Our study proposes RNAs targets involved in molecular pathways connected to the pathogenesis of MCI.
Keywords: 
Subject: Biology and Life Sciences  -   Neuroscience and Neurology

1. Introduction

Mild Cognitive Impairment (MCI) is a state considered a “transitional zone” between normal aging and dementia [1]. Morphologically MCI shows some changes in brain structure stackable to Alzheimer's disease as beta-amyloid plaques, tangles of tau proteins, and microscopic clumps of Lewy bodies' protein determining alterations such as the decreased size of the hippocampus, increased size of ventricles, and reduced use of glucose in key brain regions resulting in memory impairment. The strongest genetic risk factors for MCI neurodegenerative cascade are the allelic variant e4 of the human Apolipoprotein E (APOE) gene and the systemic inflammatory responses composed of increased levels of soluble tumor necrosis factor receptor 2 (sTNFR2), monocyte chemoattractant protein-1 (MCP-1), IL-6 and decreased levels of IL-8 [2]. No test currently represents the gold standard confirming that someone has a mild cognitive impairment (MCI). MCI diagnosis is based on mental status tests (Short Test of Mental Status, Montreal Cognitive Assessment -MoCA or the Mini-Mental State Examination -MMSE), neurological exams, and lab tests (vitamin B-12, thyroid hormone, brain imaging), but no none of them identify MCI state uniquely [3]. Therefore, in recent years, research has increasingly focused on the involvement of circulating non-coding RNAs (ncRNAs) in the development and/or progression of neurodegenerative diseases. Actually, we know that ncRNAs as long non-coding RNA (lncRNA), micro RNAs (miRNAs), small nucleolar RNAs (snoRNAs), and circular RNAs (circRNAs) are key regulators in transcription and post-transcriptional modifications, cell metabolism, proliferation, and apoptosis [4]. Several studies reported that miRNAs deregulation contributes to neurodegeneration as mir-567 [5] or the triad miR-181a-5p, miR-146a-5p, and miR-148a-3p [6] impairing neural plasticity and cognitive function in MCI patients advancing to AD. Again, some miRNAs families as miR-132 and/or miR-134 were shown to be deregulated in MCI patients, specifically miR-132 for its involvement in tau metabolism through IT PKB gene (Inositol-Trisphosphate 3-Kinase B) targeting [7]. LncRNAs are mRNA-like transcripts (200 nt to >100 kb), with a biogenesis process similar to mRNAs, but different from them for the lack of an open reading frame (ORF) of significant length and the absence of a translation capacity [8]. They are located in subcellular compartments, as in the nucleus, cytoplasm, and foci of cells [9]. LncRNAs are known for their involvement in gene expression regulation acting as miRNA decoys or by trapping mRNAs in nuclear bodies, and in translation interference by preventing protein phosphorylation or disrupting ribosome recruitment [10], but the role of lncRNAs in neurodegenerative diseases, particularly in MCI, is poorly known. The lack of knowledge about this contribution prompted us to study the association between circulating lncRNAs and MCI onset through the investigation of the whole transcriptome. Here, for the first time, microarray investigations have demonstrated modifications in the expression of long non-coding RNAs (lncRNA) in blood of patients with MCI, comprising lncRNA-SNHG16, lncRNA-H19 and lncRNA-NEAT1.
This research offers a starting point to comprehend the roles of such long non-coding RNAs in MCI from the earliest stages of disease.

2. Materials and Methods

2.1. Recruitment of patients

To profile circulating lncRNAs, we drew blood samples from 10 patients (6 females, 4 men), aged 59,07 ± 18,76 years, and 10 healthy volunteers (control group; 5 men, 5 females), aged 62,25 ± 11,26 years old recruited from the Neurology Unit of Policlinic Federico II, Naples. MCI subjects show objective evidence of cognitive impairment evaluated using a Mini-Mental State Examination (MMSE) score and absence of difficulties in functional activities of daily life, dementia, and other cerebrovascular pathology-related cognitive decline or metabolic/endocrine diseases [11]. MCI patients and healthy controls characteristics are reported in Table 1. After obtaining written informed consent from all participants for the use of their fluid specimens, the entire trial was conducted under the guidelines of The Ethic Committee of the University of Study of Campania "Luigi Vanvitelli" which approved the research (Prot. 12478/20) and the samples were handled according to the guidelines of the Helsinki Declaration.

2.2. Blood Collection

For lncRNAs quantification, we collected a venous blood sample (4 ml) from each participant, and we isolated PBMC (peripheral blood mononuclear cell) using an EDTA-K2 anticoagulant tube (VACUETTE®) according to the manufacturer's instructions.

2.3. RNA Extraction

Total RNAs were extracted from entire blood samples using Trizol Reagent (Invitrogen, #15596-026) plus an optional DNase digestion step in agreement with the manufacturer's protocol and stored at −80 °C before use. The RNA quality and quantity were analyzed using the Nanodrop 2000 (Thermo Fisher Scientific), then total RNA (1 μg) was reverse transcribed using RT2 First Strand Kit (Qiagen).
2.4. lncRNAs Microarray Profiling
We executed microarray profiling using Human RT2 lncRNA PCR Assays (Qiagen). RT² SYBR Green FAST Master mix for qPCR (Qiagen) was used and followed by hybridization to the chip. We then scanned microarrays using an Agilent microarray scanner directed by GenePix Pro 6.0 software (Axon). Agilent Feature Extraction software elaborated TIFF images for grid alignment and expression data analysis. Expression data were normalized by a quartile normalization and by (RMA) algorithm that was included in the Agilent software. We identified differentially expressed lncRNAs through fold change filtering. The microarray data with threshold values of −2 <fold change<2 under FDR protection (P < 0.05) were selected.

2.5. Validation of lncRNA Gene Expression in Blood by Real-time Quantitative PCR (RT-qPCR)

We performed RT-PCR quantification of lncRNAs expression in duplicate for each sample using lncRNA assays (Applied Biosystems Inc., Foster City, CA) according to the manufacturer's protocol, and then we evaluated the specificity of the PCR product through the dissociation curve. ABI Prism 7500 sequence detection system (Applied Biosystems, Foster City, CA) is used to perform RT-PCR. Reactions were performed in a mixture (20 μL) containing 5μL cDNA template, 10 μL 2 × SYBR-Green PCR Mix (Qiagen), and 0.5 μL each of sense and antisense primers. Actin  was used as internal control. For quantitative results, the expression of each lncRNAs was represented as a fold change using the 2−ΔΔCt method and then analyzed for statistical significance.

2.6. Statistical and Bioinformatics Analyses

A two-tailed unpaired t-test was performed on normalized delta CT values from both MCI and negative controls, to obtain the Fold Change of the mean gene expression values between the two groups, and their relative p-value. The MCI sample “NMC12” was excluded from the statistical analyses as it represented an outlier, having a Z-score higher in absolute value than three deviation standards. Python v. 3.7.0 was used for the statistical studies, together with its modules numpy [12], SciPy [13], and Pandas [14]. Matplotlib [15] and Seaborn [16] libraries were used to visualize data and create graphs.
We searched for possible interactors using the web tool RNAInter v4.0 [17,18]. For each lncRNA the query was set to search for Human RNA-associated interaction collected only from experimental literature using strong detection methods. The resulting interaction databases were joined into a single database and processed using Python v. 3.7.0 and its libraries Pandas [14]and Glob [19].
Pathway analysis was performed on the resulting list of lncRNAs and their interactors, using the g:Profiler [20] web-based toolset. The sources selected were for Gene Ontology: GO molecular function and GO biological process; for biological pathways: KEGG, Reactome and WikiPathways; for regulatory motifs in DNA: miRTarBase. The significance threshold was set to 0.0001 and the maximum size of the set was 800. Network visualization was performed using Cytoscape [21] v.3.10.0. The interaction dataset was imported selecting only the stronger interactions starting from a score of 0.3, adding also a column bearing the expression values for the lncRNAs. G:Profiler results were imported using the add-on Enrichment Map [22] v.3.3.6. To obtain a less dense and more readable network, the FDR Q value cutoff was set to 0,00001 and the edges and connectivity were set to “sparser”. Important nodes and hubs were selected using the add-on cytoHubba ranked according to their Maximal Clique Centrality score [23].

3. Results

We first performed a two-tailed unpaired t-test on the differentially expressed lnc-RNAs to assess their fold change and corresponding p-value. Results, visible in Figure 1, show that the majority of the differentially expressed lncRNA are significantly overexpressed in MCI patients respect to controls, except for lncRNA-NEAT1, which is significantly under-expressed. By contrast, lncRNAs MALAT1 and XIST fold change in expression appear to be non-significant. Top ten lncRNAs with the highest fold change are: DIO3OS, LINC00853, BOK-AS1, CCAT2, BCYRN1, WT1-AS, FENDRR, NRON and PANDAR.
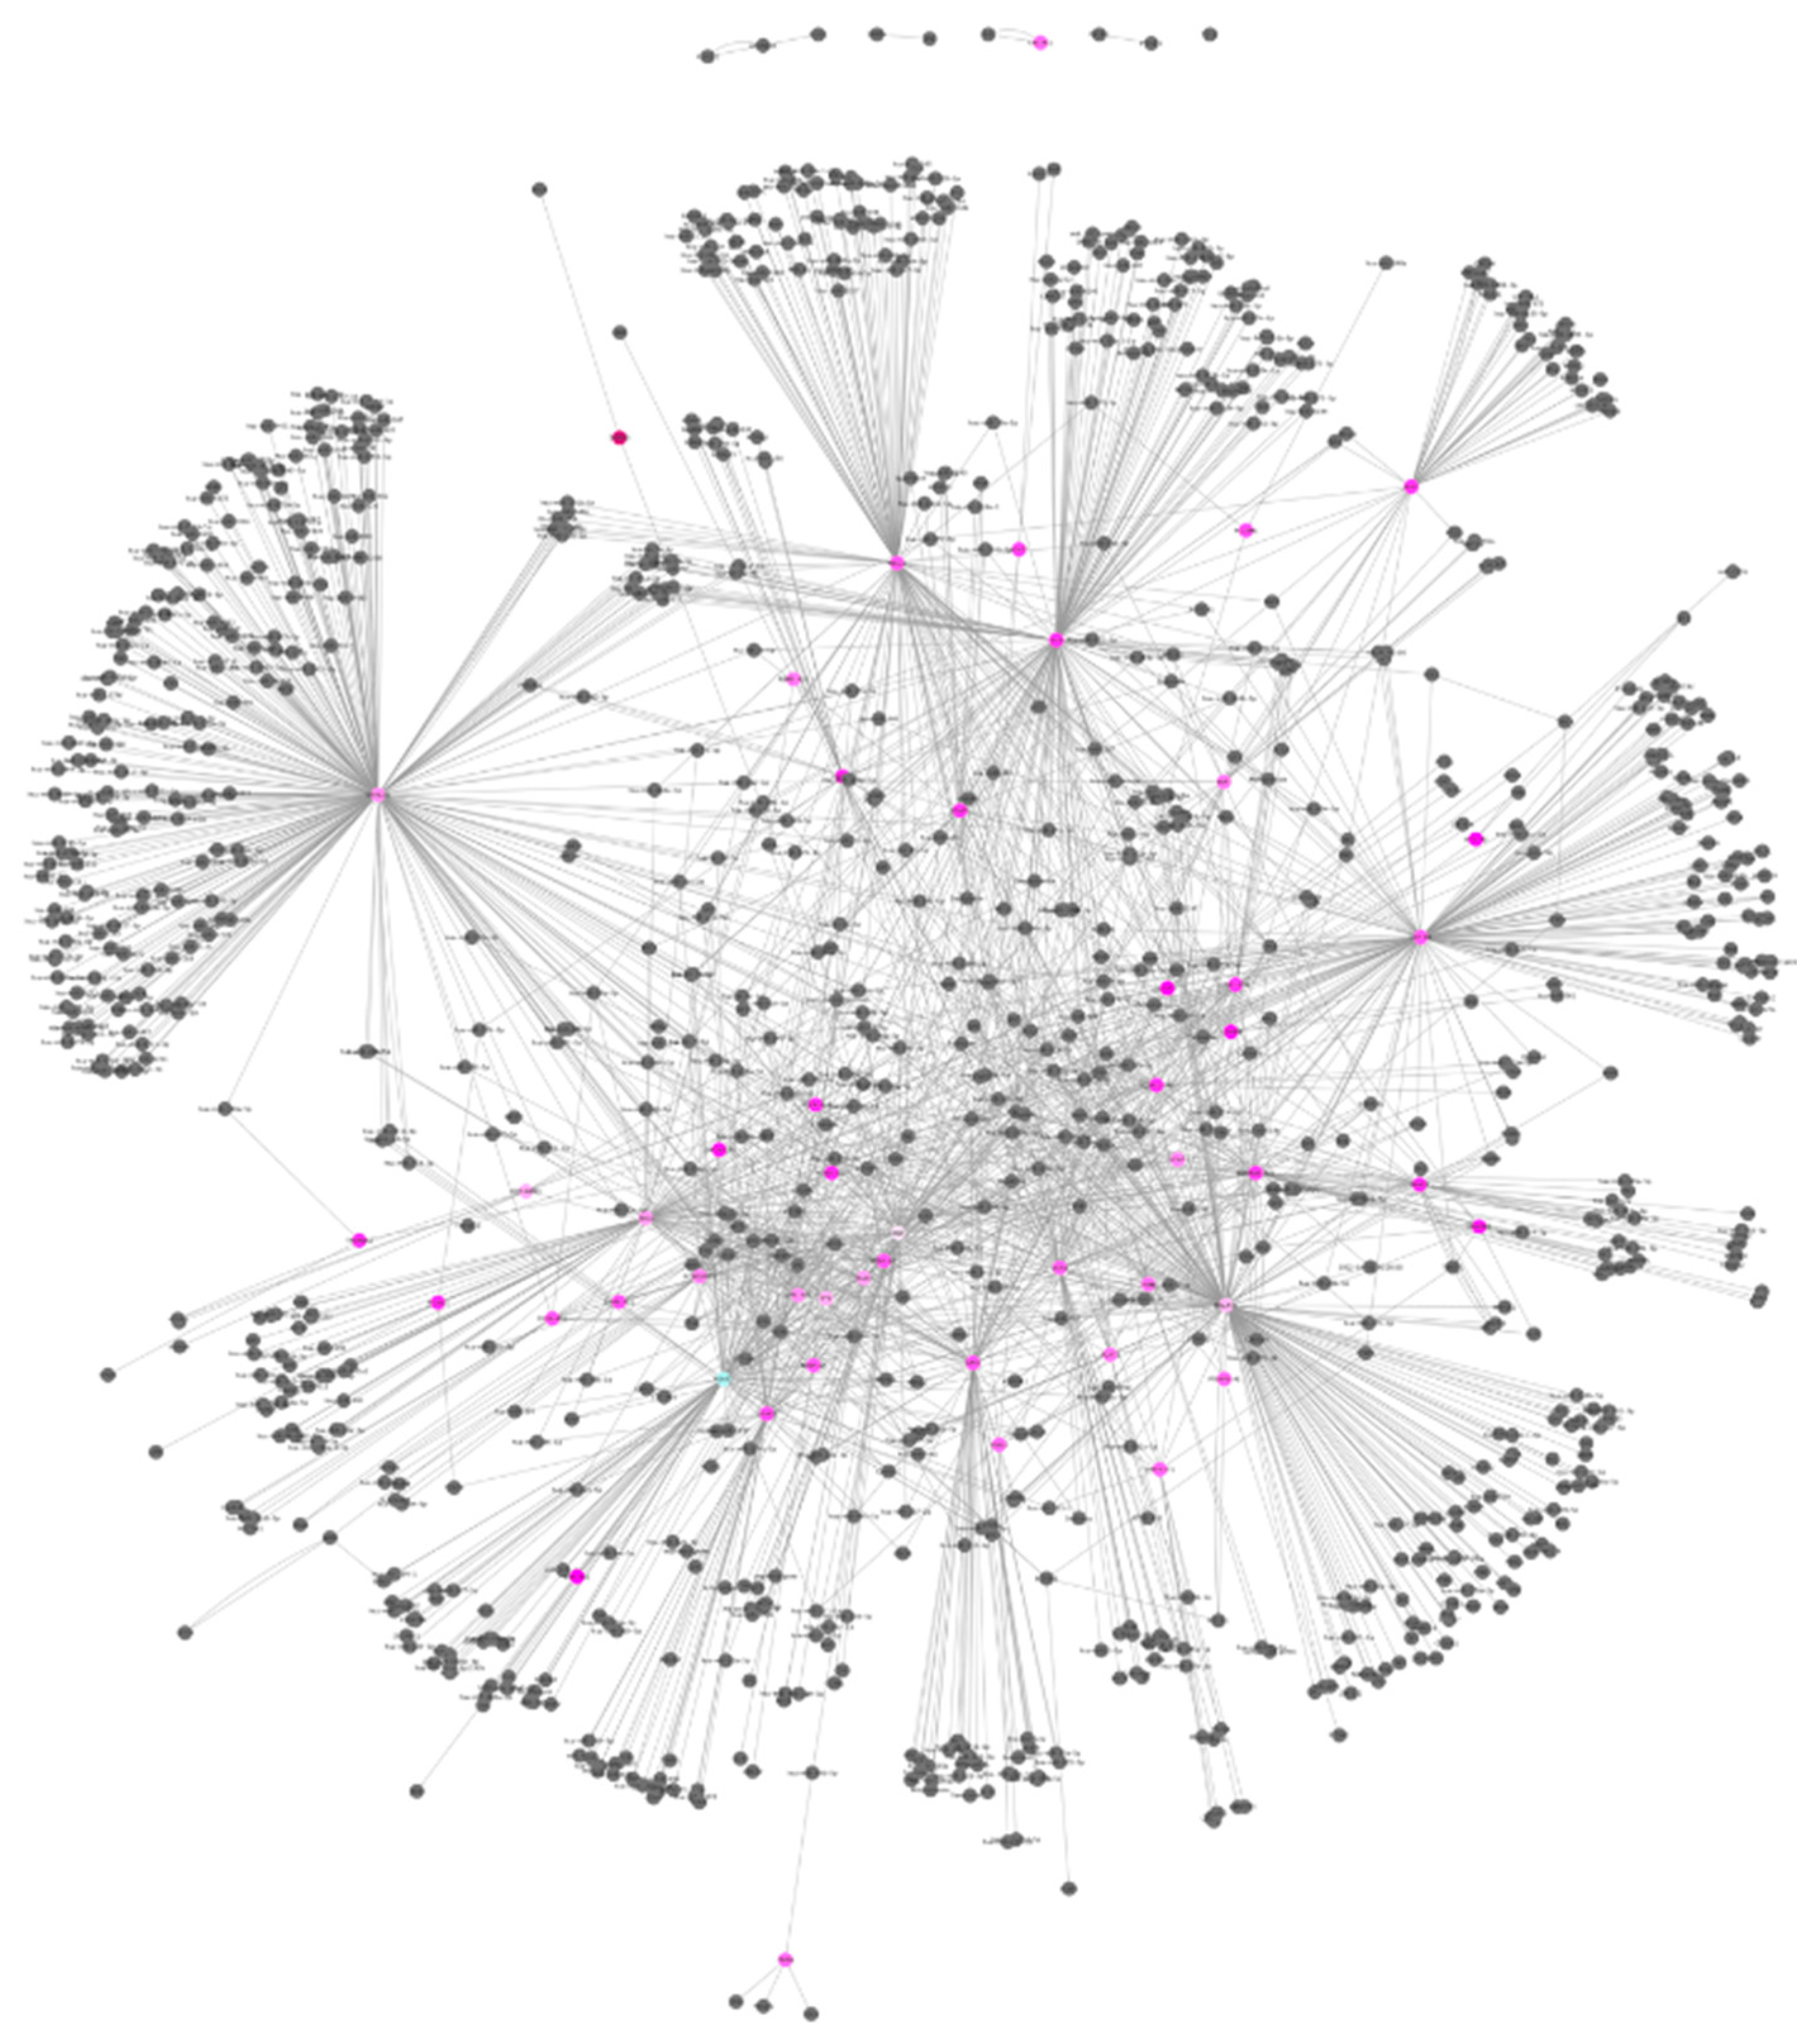
A list of interactors for each lncRNA was downloaded from RNAInter interactome database in order to build an interaction network. The interactions were filtered to include only those with strong experimental evidence. Interactors include micro-RNAs, lnc-RNAs, mRNAs, transcription factors, proteins, DNA loci and compounds. The resulting network is displayed in Figure 2. The nodes representing the lncRNAs object of our study are colored according to their fold change, while the interactors are in grey. Among the various interactions present in the network, it is worth highlighting the indirect interaction that may occur between the third highest expressed lncRNA BOK-AS1 and the only downregulated lncRNA NEAT1, via their common interactors, the RNA-binding proteins NONO and SPFQ.
Interestingly, the overexpression of NEAT1 was linked to Alzheimer Disease (AD) and memory impairment in many studies [24,25,26], while its knockdown in mice leads to decreased memory deficit and increased dendritic spine density [27], and it has been suggested as plasma biomarker for AD progression [28].
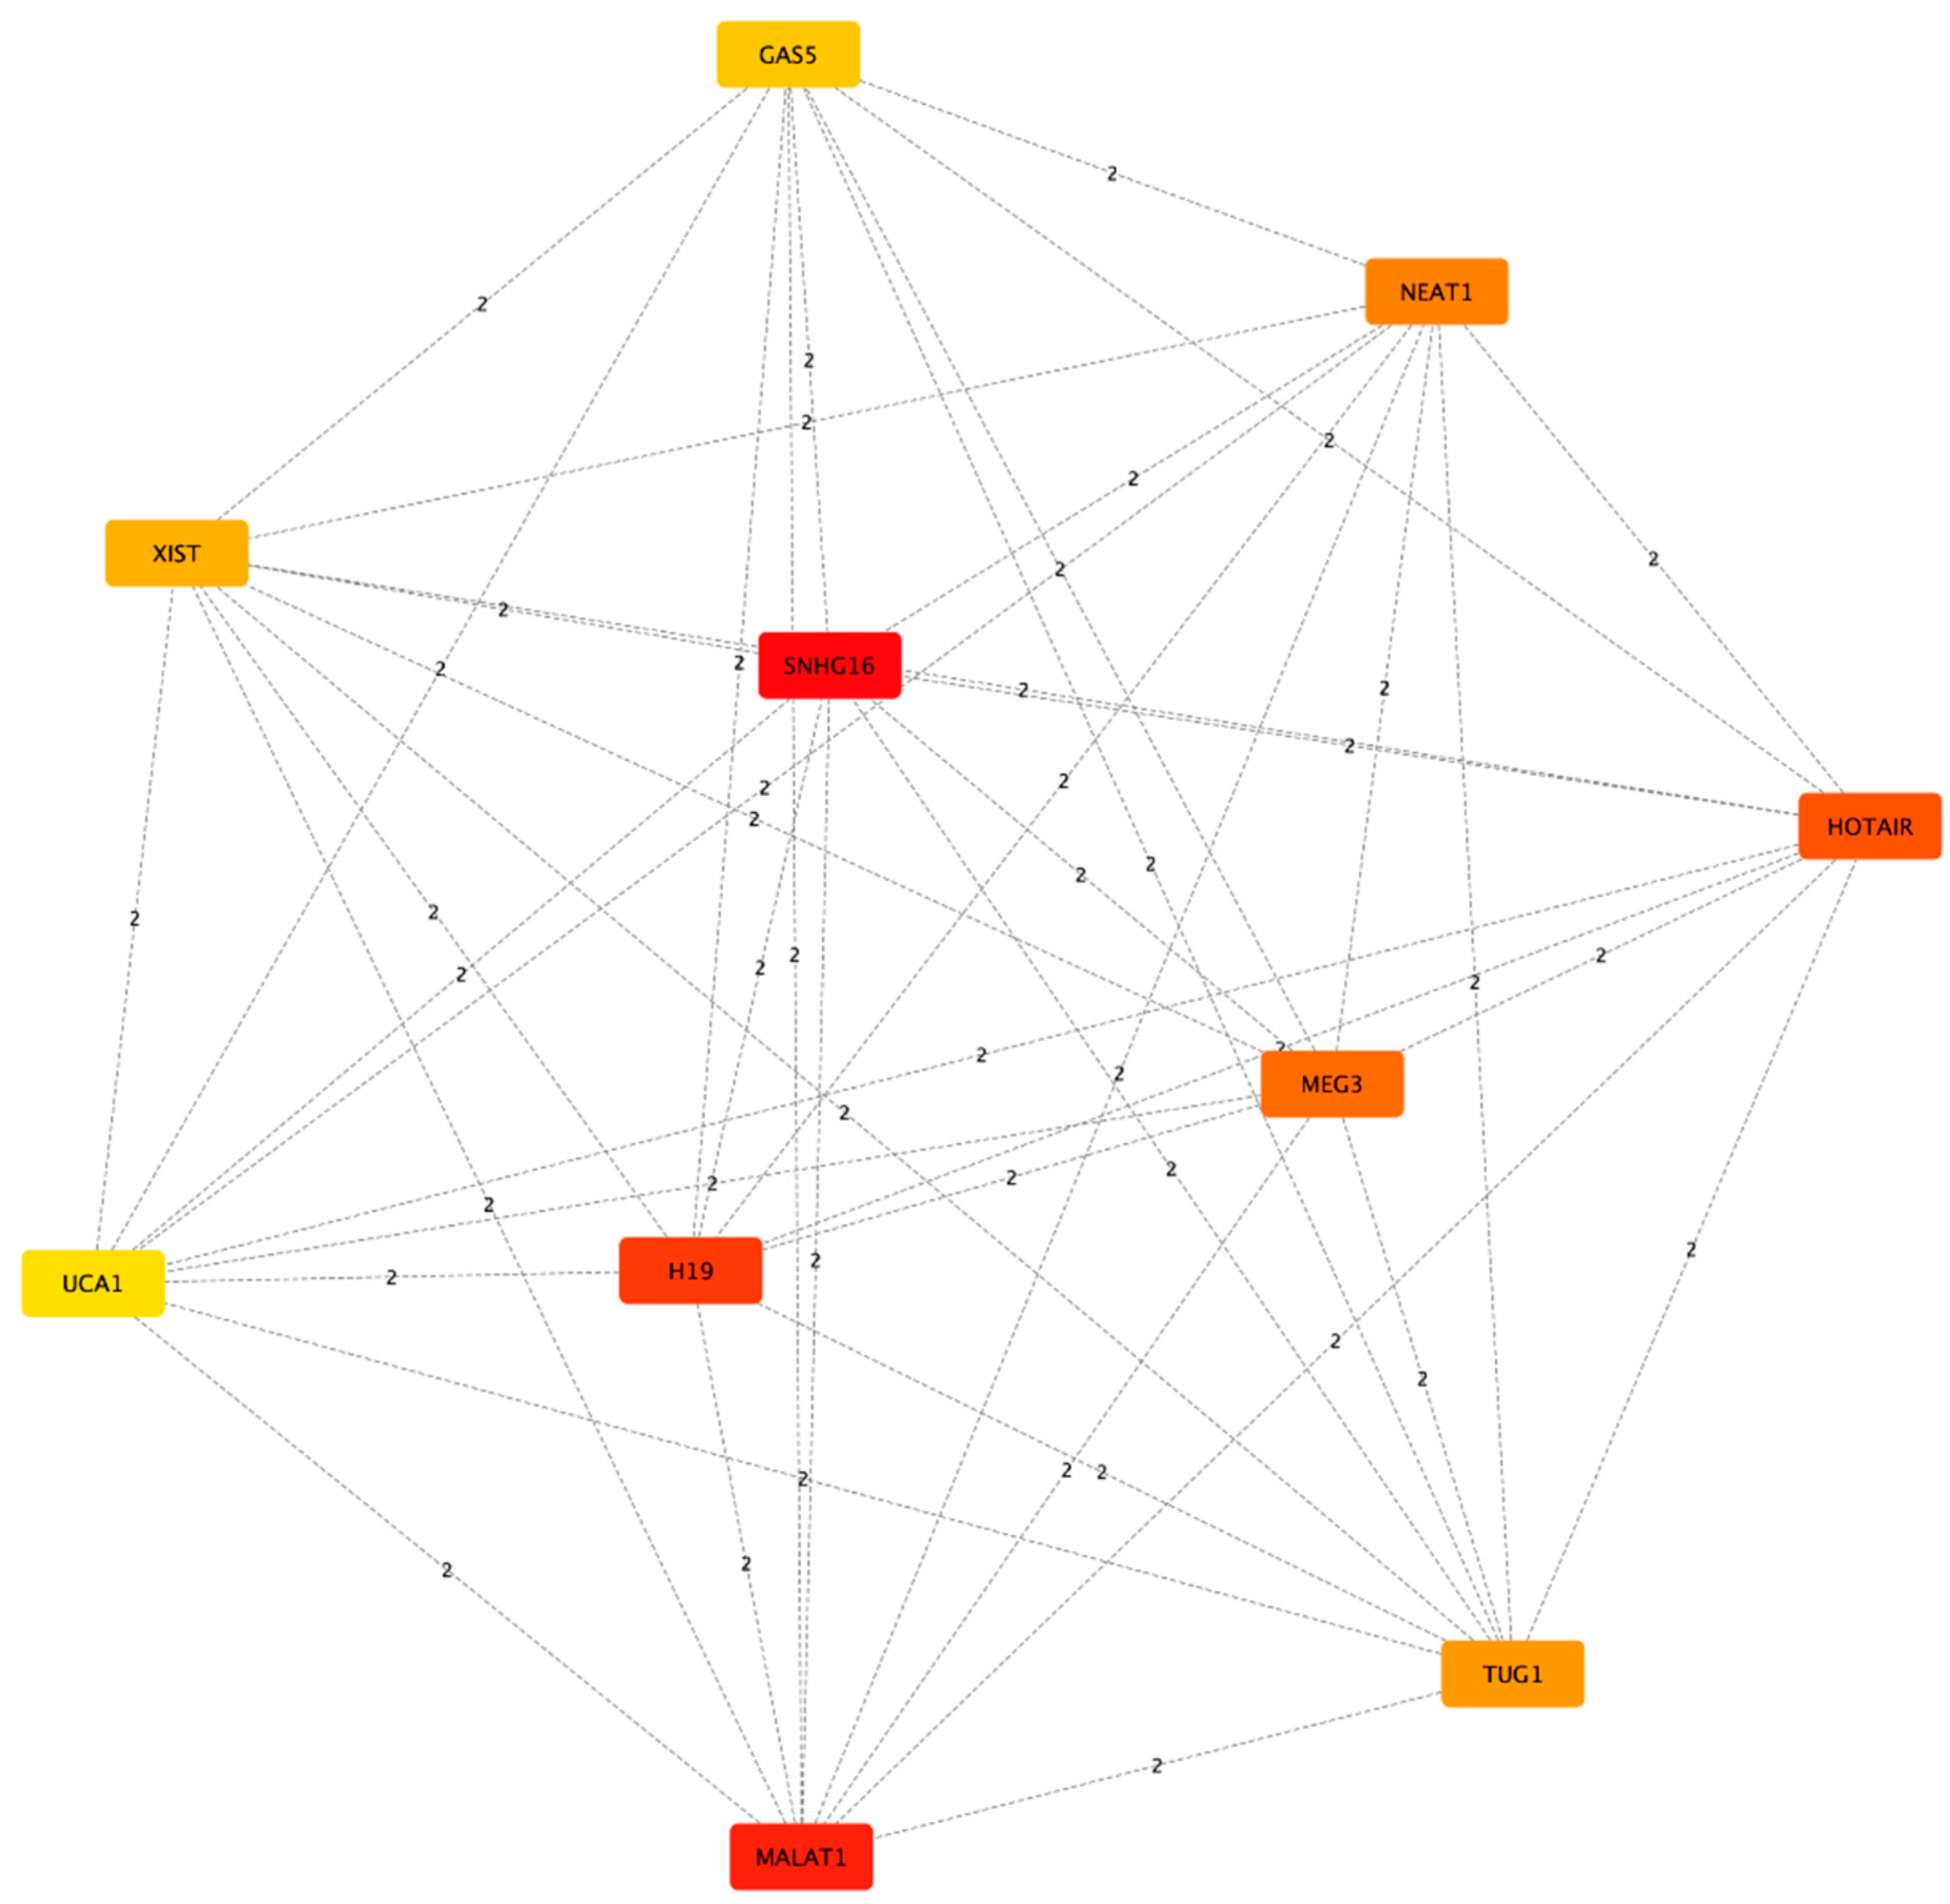
Subsequently, we proceeded to look for lncRNAs that could act a s HUBs of connectivity among the network, so we used cytoHubba to have a list of the top 10 lncRNAs ranked for their Maximal Clique Centrality (MCC) score (Figure 3, Table 2). The list includes from the highest to the lowest score: SNHG16, MALAT1, H19, HOTAIR, MEG3, NEAT1, TUG1, XIST, GAS5 and UCA1. It’s worth noting that the most researched and well characterized lncRNAs will tend to have a high number of known interactors, and on the contrary, less researched lncRNAs will show a lower number of interactions.
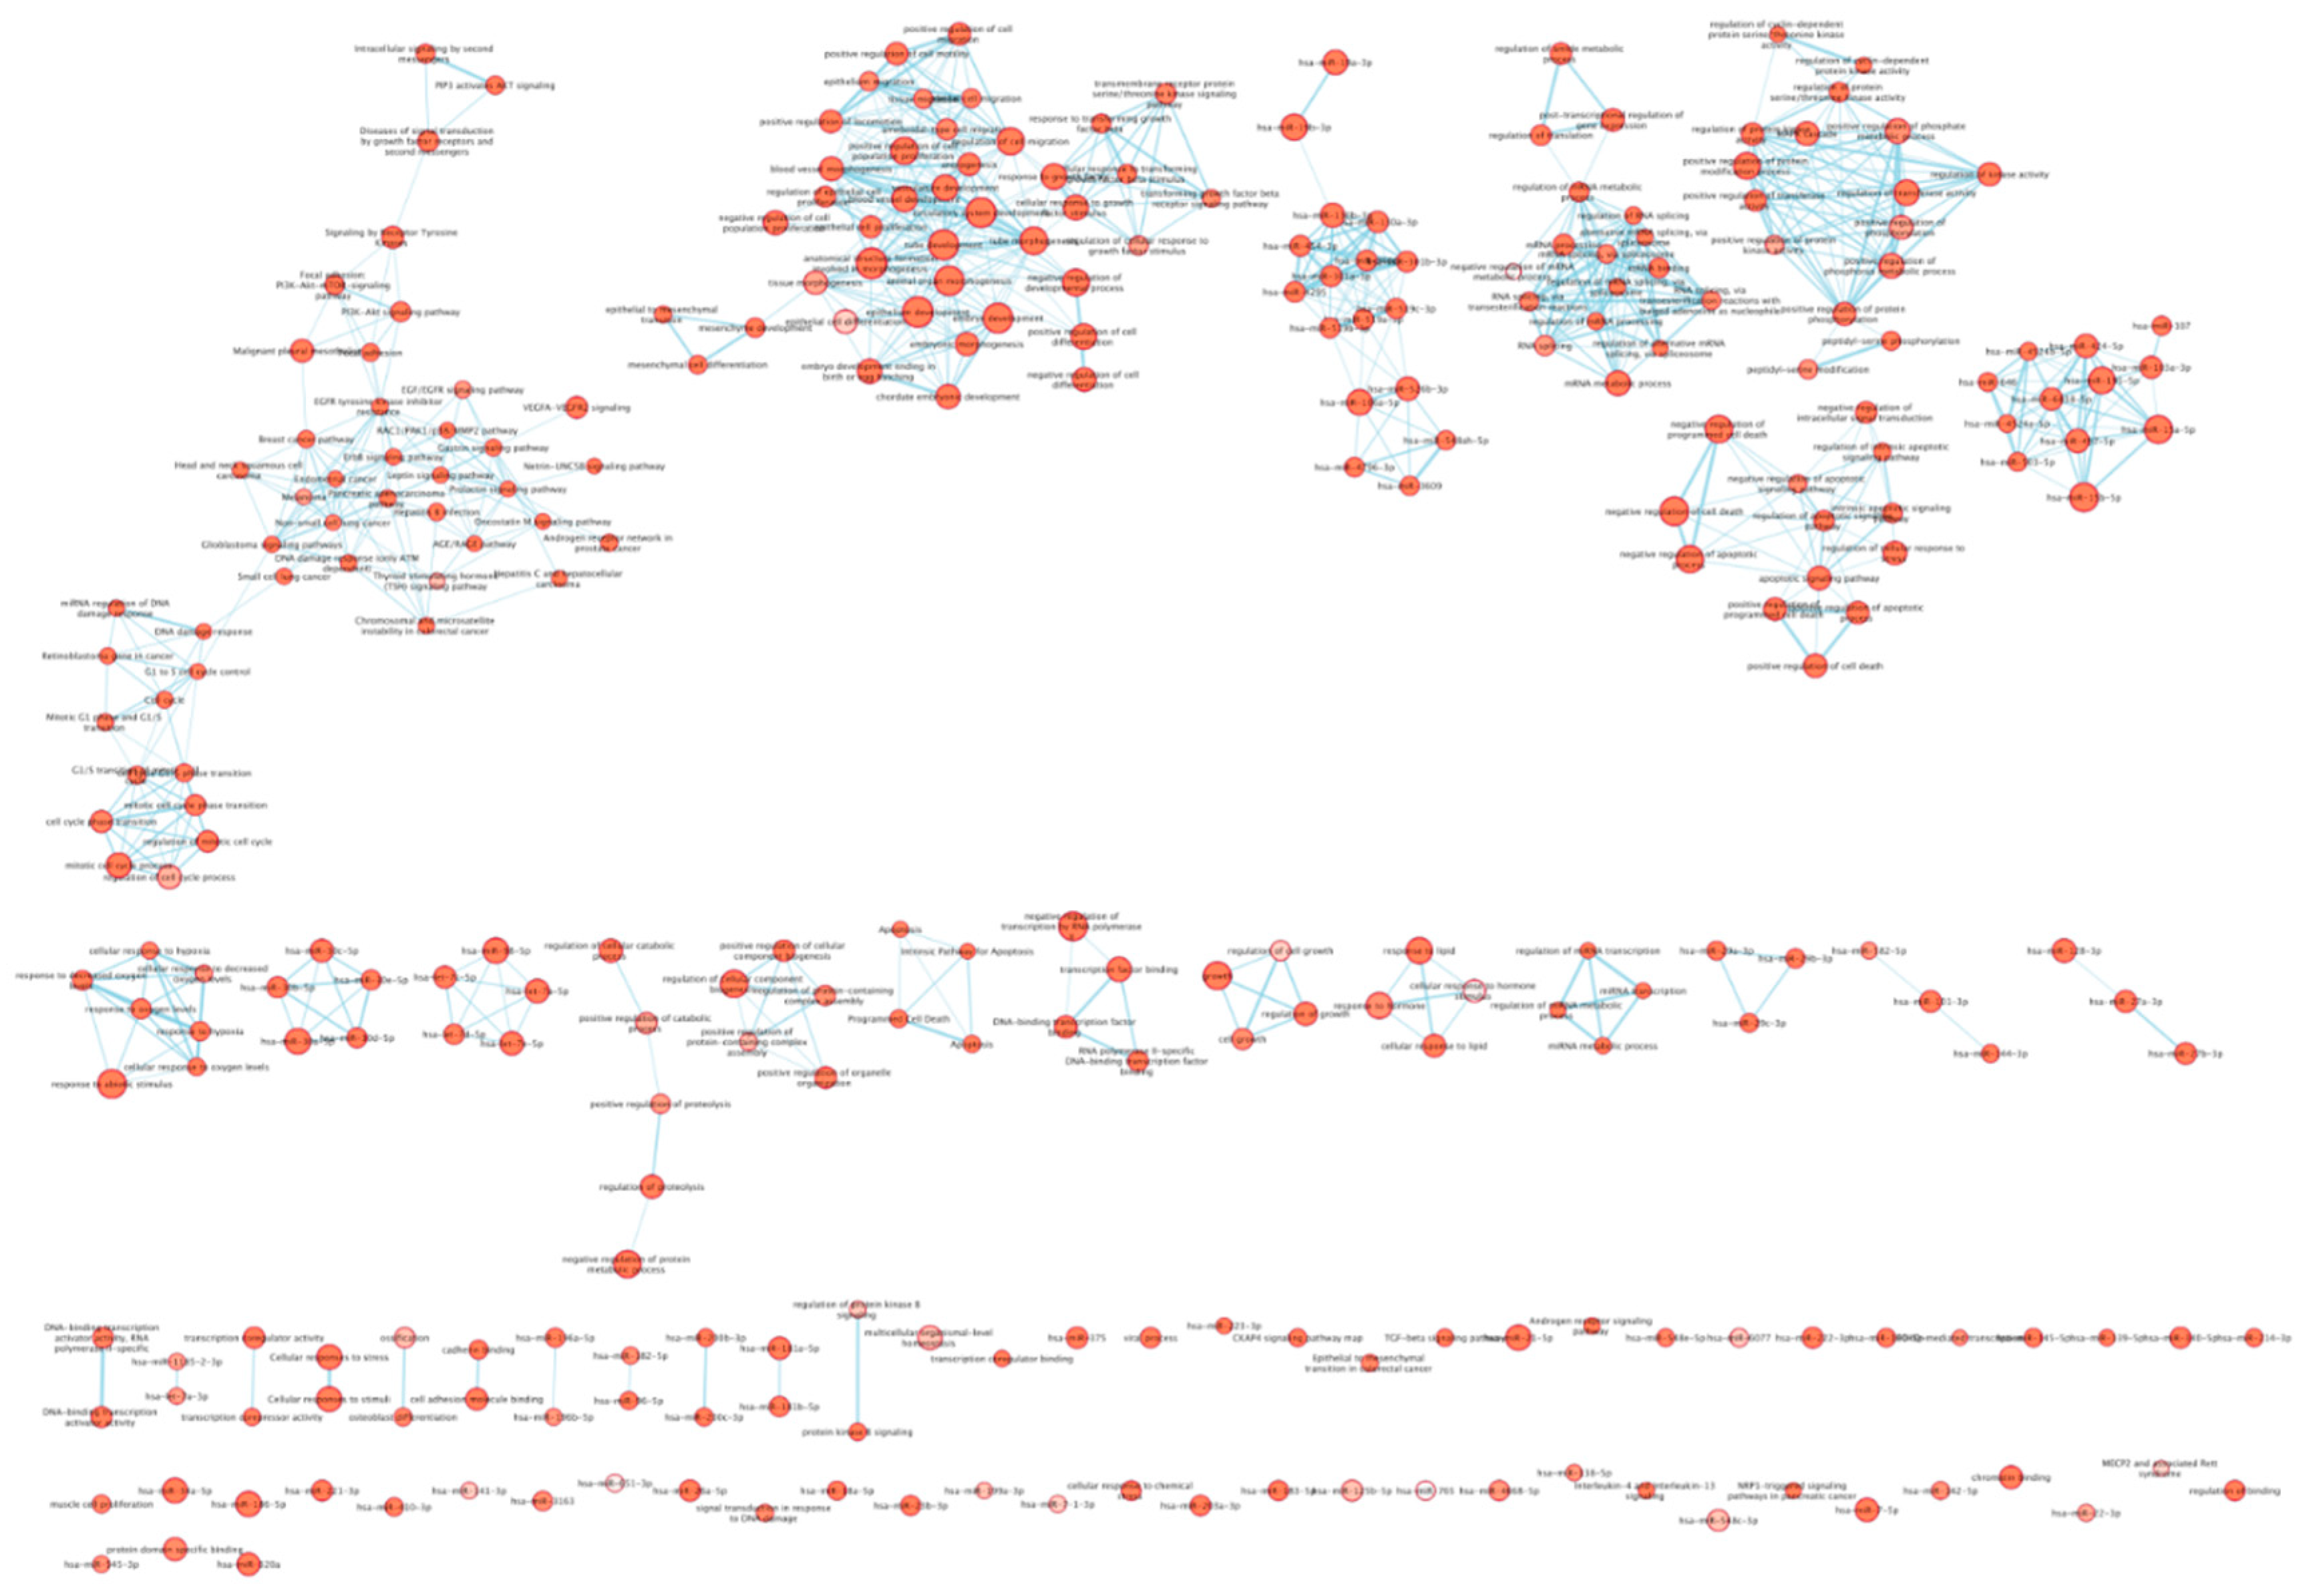
Next step was to use the expanded list of lncRNAs and their interactors to perform a pathway analysis using G:Profiler. As result, shown in Figure 4, we obtained several networks with the biggest one representing pathways involved in cell cycle progression and G1 to S phase transition. The second biggest network includes pathways involved in tissue morphogenesis, angiogenesis, and cellular migration. Other smaller networks include pathways involved in regulation of cell death, positive regulation of kinase activity, mRNA splicing, cellular response to hypoxia and regulation of protein metabolism.

4. Discussion

Mild cognitive impairment (MCI) is regarded as a prodrome of dementia; in fact, around half of the patients diagnosed with MCI will develop dementia within 3 years. MCI can be categorized into amnestic, non-amnestic, and multi-domain impairment subtypes, and not all of them evolve in Alzheimer's Disease (AD). The prevalence of MCI in the community is difficult to determine, but different studies reported a percentage of 3%- 25%, dependent on mean age and other risk factors (smoking, diabetes, metabolic syndrome, etc.) [29]. MCI diagnosis is based on the same techniques used for AD. After an initial Mini-Mental Status Examination (MMSE), patients are investigated through neuroimaging techniques and amyloid beta (Aβ42), total tau, and phosphorylated tau detection in the cerebrospinal fluid (CSF). Besides, the epsilon 4 allele of the apolipoprotein gene (APOE-e4) confers a risk for MCI [30]. For clinicians, MCI is a "window" in which it may be possible to intervene and delay the progression to dementia, for this reason, they are constantly looking for a few biomarkers representing a gold standard for early MCI diagnosis. For this study, we enrolled a group of 10 MCI patients whose diagnosis was reached according to the IWG-2 criteria [5].
LncRNAs are ncRNAs (〜200 nt) with no protein-coding potential. They have a 5′ cap structure, multiple exons, and 3′ polyadenylated tails and are spliced in a way similar to mRNAs. Not only DNA methylation and histone modification, but also a combination of ncRNAs and transcription factor (TF) are involved in genome epigenetic modifications. Several studies on the role of lncRNAs suggest that their dysregulation could trigger neuronal death via still unexplored RNA-based regulatory mechanisms [31].
Herein, we observed lncRNAs in a small, well-characterized population of MCI patients. Poorly is known about lncRNAs in neurodegeneration, especially in MCI state. However, lncRNAs in MCI state can be significant for their regulatory role in biological processes and potential role as an early biomarker for diagnosis.
In this study, we have found a group of significantly deregulated lncRNAs in MCI patients compared to healthy controls. We then expanded this list with the experimentally known interactors for each lncRNA and generated an interactome network and a pathway network, in order to have a broad overview of the processes that may be involved in the pathogenesis of MCI and possibly in its progression to Alzheimer Disease.
Given the complexity of the results, we choose to focus our observations on three promising lncRNAs: SNHG16, H19, and NEAT1.
Among our list of deregulated lncRNAs, SNHG16 has the highest MCC score, given the interactions, it exerts with a plethora of miRNAs suggesting that it may play a crucial role in coordinating a particular biological process or function within a larger network of genes involved in MCI. Distinctly, lncRNA SNHG16, observed to be upregulated in MCI, showcased a neuroprotective role in both rat cells treated with dexmedetomidine and hESC-derived neurons treated with ketamine. Its involvement in the mir10b5p/BDNF and NeuroD1 pathways, respectively, raises pivotal questions about its broad-spectrum functionality in neuroprotection [32,33]. Furthermore, the protective attributes of SNHG16, which intervenes against OGD R-induced apoptosis in hBMECs, illustrate the intricate and multifaceted roles this lncRNA plays in cellular responses to stress and damage [34]. Due to its significance, it merits further investigation to better understand its role in the development and progression of MCI.
If we set aside MALAT1, which our data indicates has expression levels not significantly different from those of the control group, H19 is the next lncRNA with the highest MCC score. H19 stands out as one of the pioneering imprinted lncRNAs identified with a pivotal role in both physiological and pathological contexts. For instance, is has been observed to be involved in neuroinflammation upon ischemic stroke (IS), where H19 reportedly competes with miR-138-5p to stimulate the NF-κB pathway, thus augmenting the release of pro-inflammatory cytokines [35]. The observed shift from pro-inflammatory M1 phenotype to the anti-inflammatory M2 phenotype upon H19 knockdown further underlines its importance in inflammatory modulation [36,37]. Although the precise role of H19 in MCI has yet to be assessed and its role in Alzheimer Disease remains elusive, it was observed that in Aβ25-35-induced PC12 cells, lncRNA H19 negatively regulates the expression of the pro inflammatory cytokine HMGB1 by targeting miRNA miR-129 and acting as a sponge, consequently promoting inflammation, while its knockdown ameliorates inflammation and neurological function in rat models, making it a promising pharmacological target [38].
Finally, our results show NEAT1 to be significantly less expressed in MCI patients than in controls. As mentioned before, the identified potential interaction between lncRNAs BOK-AS1 and NEAT1 underscores the complex regulatory network of NEAT1's associations with Alzheimer's Disease, both in terms of memory impairment and its knockdown benefits, further consolidate its significance in neurological contexts [24,25,26,27,28].
To summarize, the intricate roles and interactions of SNHG16, H19, and NEAT1 in various neurological conditions suggests that an implication in MCI may be plausible. As our understanding of these lncRNAs continues to evolve, it is evident that they could present promising avenues for MCI therapeutic interventions and diagnostic strategies. However, future studies elucidating their mechanistic pathways and broader implications are imperative for translating these findings into clinical applications.

Author Contributions

BDF performed data analysis and prepared the manuscript. CM performed array assay and qRealTimePCR expression analysis of patient samples. CC, SB and ES medical analysis and critically revised the manuscript. BDF was the principal investigator. FF. performed statistical and bioinformatics analyses, visualization, results interpretation and writing.

Funding

This research received no external funding.

Institutional Review Board Statement

The study was conducted in accordance with the Declaration of Helsinki and approved by the Ethics Committee of the UNIVERSITY OF STUDY OF CAMPANIA "LUIGI VANVITELLI" (protocol code 12478/20).

Informed Consent Statement

Informed consent was obtained from all subjects involved in the study.

Data Availability Statement

The data presented in this study are available on reasonable request from the corresponding author.

Conflicts of Interest

The authors declare no conflict of interest.

References

  1. Giau VV, Bagyinszky E, An SSA (2019) Potential Fluid Biomarkers for the Diagnosis of Mild Cognitive Impairment. Int J Mol Sci. [CrossRef]
  2. Shen XN, Niu LD, Wang YJ, Cao XP, Liu Q, Tan L, Zhang C, Yu JT (2019) Inflammatory markers in Alzheimer's disease and mild cognitive impairment: a meta-analysis and systematic review of 170 studies. J Neurol Neurosurg Psychiatry. [CrossRef]
  3. Mayo Clinic. (n.d.). Dementia: Symptoms and causes. https://www.mayoclinic.org/diseases-conditions/dementia/symptoms-causes/syc-20352013.
  4. Wang J, Zhu S, Meng N, He Y, Lu R, Yan GR (2019) ncRNA-Encoded Peptides or Proteins and Cancer. Mol Ther. [CrossRef]
  5. De Felice B, Montanino C, Oliva M, Bonavita S, Di Onofrio V, Coppola C (2020) MicroRNA Expression Signature in Mild Cognitive Impairment Due to Alzheimer's Disease. Mol Neurobiol. [CrossRef]
  6. Wei ZD, Shetty AK (2022) Can mild cognitive impairment and Alzheimer's disease be diagnosed by monitoring a miRNA triad in the blood? Ageing Cell. [CrossRef]
  7. Zhan F, Yang J, Lin S, Chen L (2022) miRNA-Based Signature to Predict the Development of Alzheimer's Disease. Comb Chem High Throughput Screen. [CrossRef]
  8. Santoro M, Nociti V, Lucchini M, Loiodice M, Centofanti F, Botta A, Losavio FA, De Fino C, Mirabella M (2020) A pilot study of lncRNAs expression profile in serum of progressive multiple sclerosis patients. Eur Rev Med Pharmacol Sci. [CrossRef]
  9. Zhu J, Fu H, Wu Y, Zheng X (2013) Function of lncRNAs and approaches to lncRNA-protein interactions. Sci China Life Sci. [CrossRef]
  10. Wu YY, Kuo HC (2020) Functional roles and networks of non-coding RNAs in the pathogenesis of neurodegenerative diseases. J Biomed Sci. [CrossRef]
  11. Serebrovska ZO, Serebrovska TV, Kholin VA, Tumanovska LV, Shysh AM, Pashevin DA, Goncharov SV, Stroy D, Grib ON, Shatylo VB, Bachinskaya NY, Egorov E, Xi L, Dosenko VE (2019) Intermittent Hypoxia-Hyperoxia Training Improves Cognitive Function and Decreases Circulating Biomarkers of Alzheimer's Disease in Patients with Mild Cognitive Impairment: A Pilot Study. Int J Mol Sci. [CrossRef]
  12. Harris, C. R. et al. Array programming with NumPy. Nature 585, 357–362 (2020). [CrossRef]
  13. Virtanen, P. et al. SciPy 1.0: fundamental algorithms for scientific computing in Python. Nat. Methods 17, 261–272 (2020). [CrossRef]
  14. McKinney, W. Data Structures for Statistical Computing in Python. Proc. 9th Python Sci. Conf. 56–61 (2010). 2010. [CrossRef]
  15. Hunter, J. D. Matplotlib: A 2D graphics environment. Comput. Sci. Eng. 9, 90–95 (2007). [CrossRef]
  16. Waskom, M. Seaborn: Statistical Data Visualization. J. Open Source Softw. 6, 3021 (2021). [CrossRef]
  17. Kang, J. et al. RNAInter v4.0: RNA interactome repository with redefined confidence scoring system and improved accessibility. Nucleic Acids Res. 50, D326–D332 (2022). [CrossRef]
  18. Lin, Y. et al. RNAInter in 2020: RNA interactome repository with increased coverage and annotation. Nucleic Acids Res. 48, D189–D197 (2020). [CrossRef]
  19. Python Software Foundation. ‘glob - Unix style pathname pattern expansion.’ Python Documentation. 2020. Available at: https://docs.python.org/3/library/glob.html. (Accessed: 14th June 2023). 20 June.
  20. Raudvere, U. et al. G:Profiler: A web server for functional enrichment analysis and conversions of gene lists (2019 update). Nucleic Acids Res. 47, W191–W198 (2019). [CrossRef]
  21. Paul Shannon, 1 et al. Cytoscape: A Software Environment for Integrated Models. Genome Res. 13, 426 (1971). [CrossRef]
  22. Merico, D., Isserlin, R., Stueker, O., Emili, A. & Bader, G. D. Enrichment map: A network-based method for gene-set enrichment visualization and interpretation. PLoS One 5, (2010). [CrossRef]
  23. Chin, C. H. et al. cytoHubba: Identifying hub objects and sub-networks from complex interactome. BMC Syst. Biol. 8, S11 (2014). 2014. [CrossRef]
  24. Shobeiri, P. et al. Circulating long non-coding RNAs as novel diagnostic biomarkers for Alzheimer’s disease (AD): A systematic review and meta-analysis. PLoS One 18, 1–17 (2023). [CrossRef]
  25. Dong, L. X. et al. LncRNA NEAT1 promotes Alzheimer’s disease by down regulating micro-27a-3p. Am. J. Transl. Res. 13, 8885–8896 (2021).
  26. The lncRNA MIR31HG. (2023).
  27. Wu, Y. et al. lncRNA Neat1 regulates neuronal dysfunction post-sepsis via stabilization of hemoglobin subunit beta. Mol. Ther. 30, 2618–2632 (2022). [CrossRef]
  28. Khodayi, M., Khalaj-Kondori, M., Feizi, M. A. H., Bonyadi, M. J. & Talebi, M. Plasma Lncrna Profiling Identified Bc200 and Neat1 Lncrnas As Potential Blood-Based Biomarkers for Late-Onset Alzheimer’S Disease. EXCLI J. 21, 772–785 (2022). [CrossRef]
  29. Breton A, Casey D, Arnaoutoglou NA (2019) Cognitive tests for the detection of mild cognitive impairment (MCI), the prodromal stage of dementia: Meta-analysis of diagnostic accuracy studies. Int J Geriatr Psychiatry. [CrossRef]
  30. Anderson ND (2019) State of the science on mild cognitive impairment (MCI). CNS Spectr. [CrossRef]
  31. Jalaiei A, Asadi MR, Sabaie H, Dehghani H, Gharesouran J, Hussen BM, Taheri M, Ghafouri-Fard S, Rezazadeh M (2021) Long Non-Coding RNAs, Novel Offenders or Guardians in Multiple Sclerosis: A Scoping Review. Front Immunol. [CrossRef]
  32. Wang, L. et al. Dexmedetomidine had neuroprotective effects on hippocampal neuronal cells via targeting lncRNA SHNG16 mediated microRNA-10b-5p/BDNF axis. Mol. Cell. Biochem. 469, 41–51 (2020). [CrossRef]
  33. Pang, X., Su, Z., Sun, Y., Zhang, W. & Wang, H. Long noncoding RNA SNHG16 reduced ketamine-induced neurotoxicity in human embryonic stem cell-derived neurons. J. Chem. Neuroanat. 94, 39–45 (2018). [CrossRef]
  34. Teng, H., Li, M., Qian, L., Yang, H. & Pang, M. Long non-coding RNA SNHG16 inhibits the oxygen-glucose deprivation and reoxygenation-induced apoptosis in human brain microvascular endothelial cells by regulating miR-15a-5p/bcl-2. Mol. Med. Rep. 22, 2685–2694 (2020).
  35. LncRNA H19 promotes inflammatory response induced by cerebral ischemia- reperfusion injury through regulating miR-138-5p /p65 Running title : H19/miR-138-5p/p65 axis in cerebral ischemia-reperfusion injury. 1–44.
  36. Guo, S., Wang, H. & Yin, Y. Microglia Polarization From M1 to M2 in Neurodegenerative Diseases. Front. Aging Neurosci. 14, 1–16 (2022). [CrossRef]
  37. Zhong, L., Liu, P., Fan, J. & Luo, Y. Long non-coding RNA H19: Physiological functions and involvements in central nervous system disorders. Neurochem. Int. 148, 105072 (2021). [CrossRef]
  38. Zhang, Y. Y. et al. Silenced lncRNA H19 and up-regulated microRNA-129 accelerates viability and restrains apoptosis of PC12 cells induced by Aβ25-35 in a cellular model of Alzheimer’s disease. Cell Cycle 20, 112–125 (2021). [CrossRef]
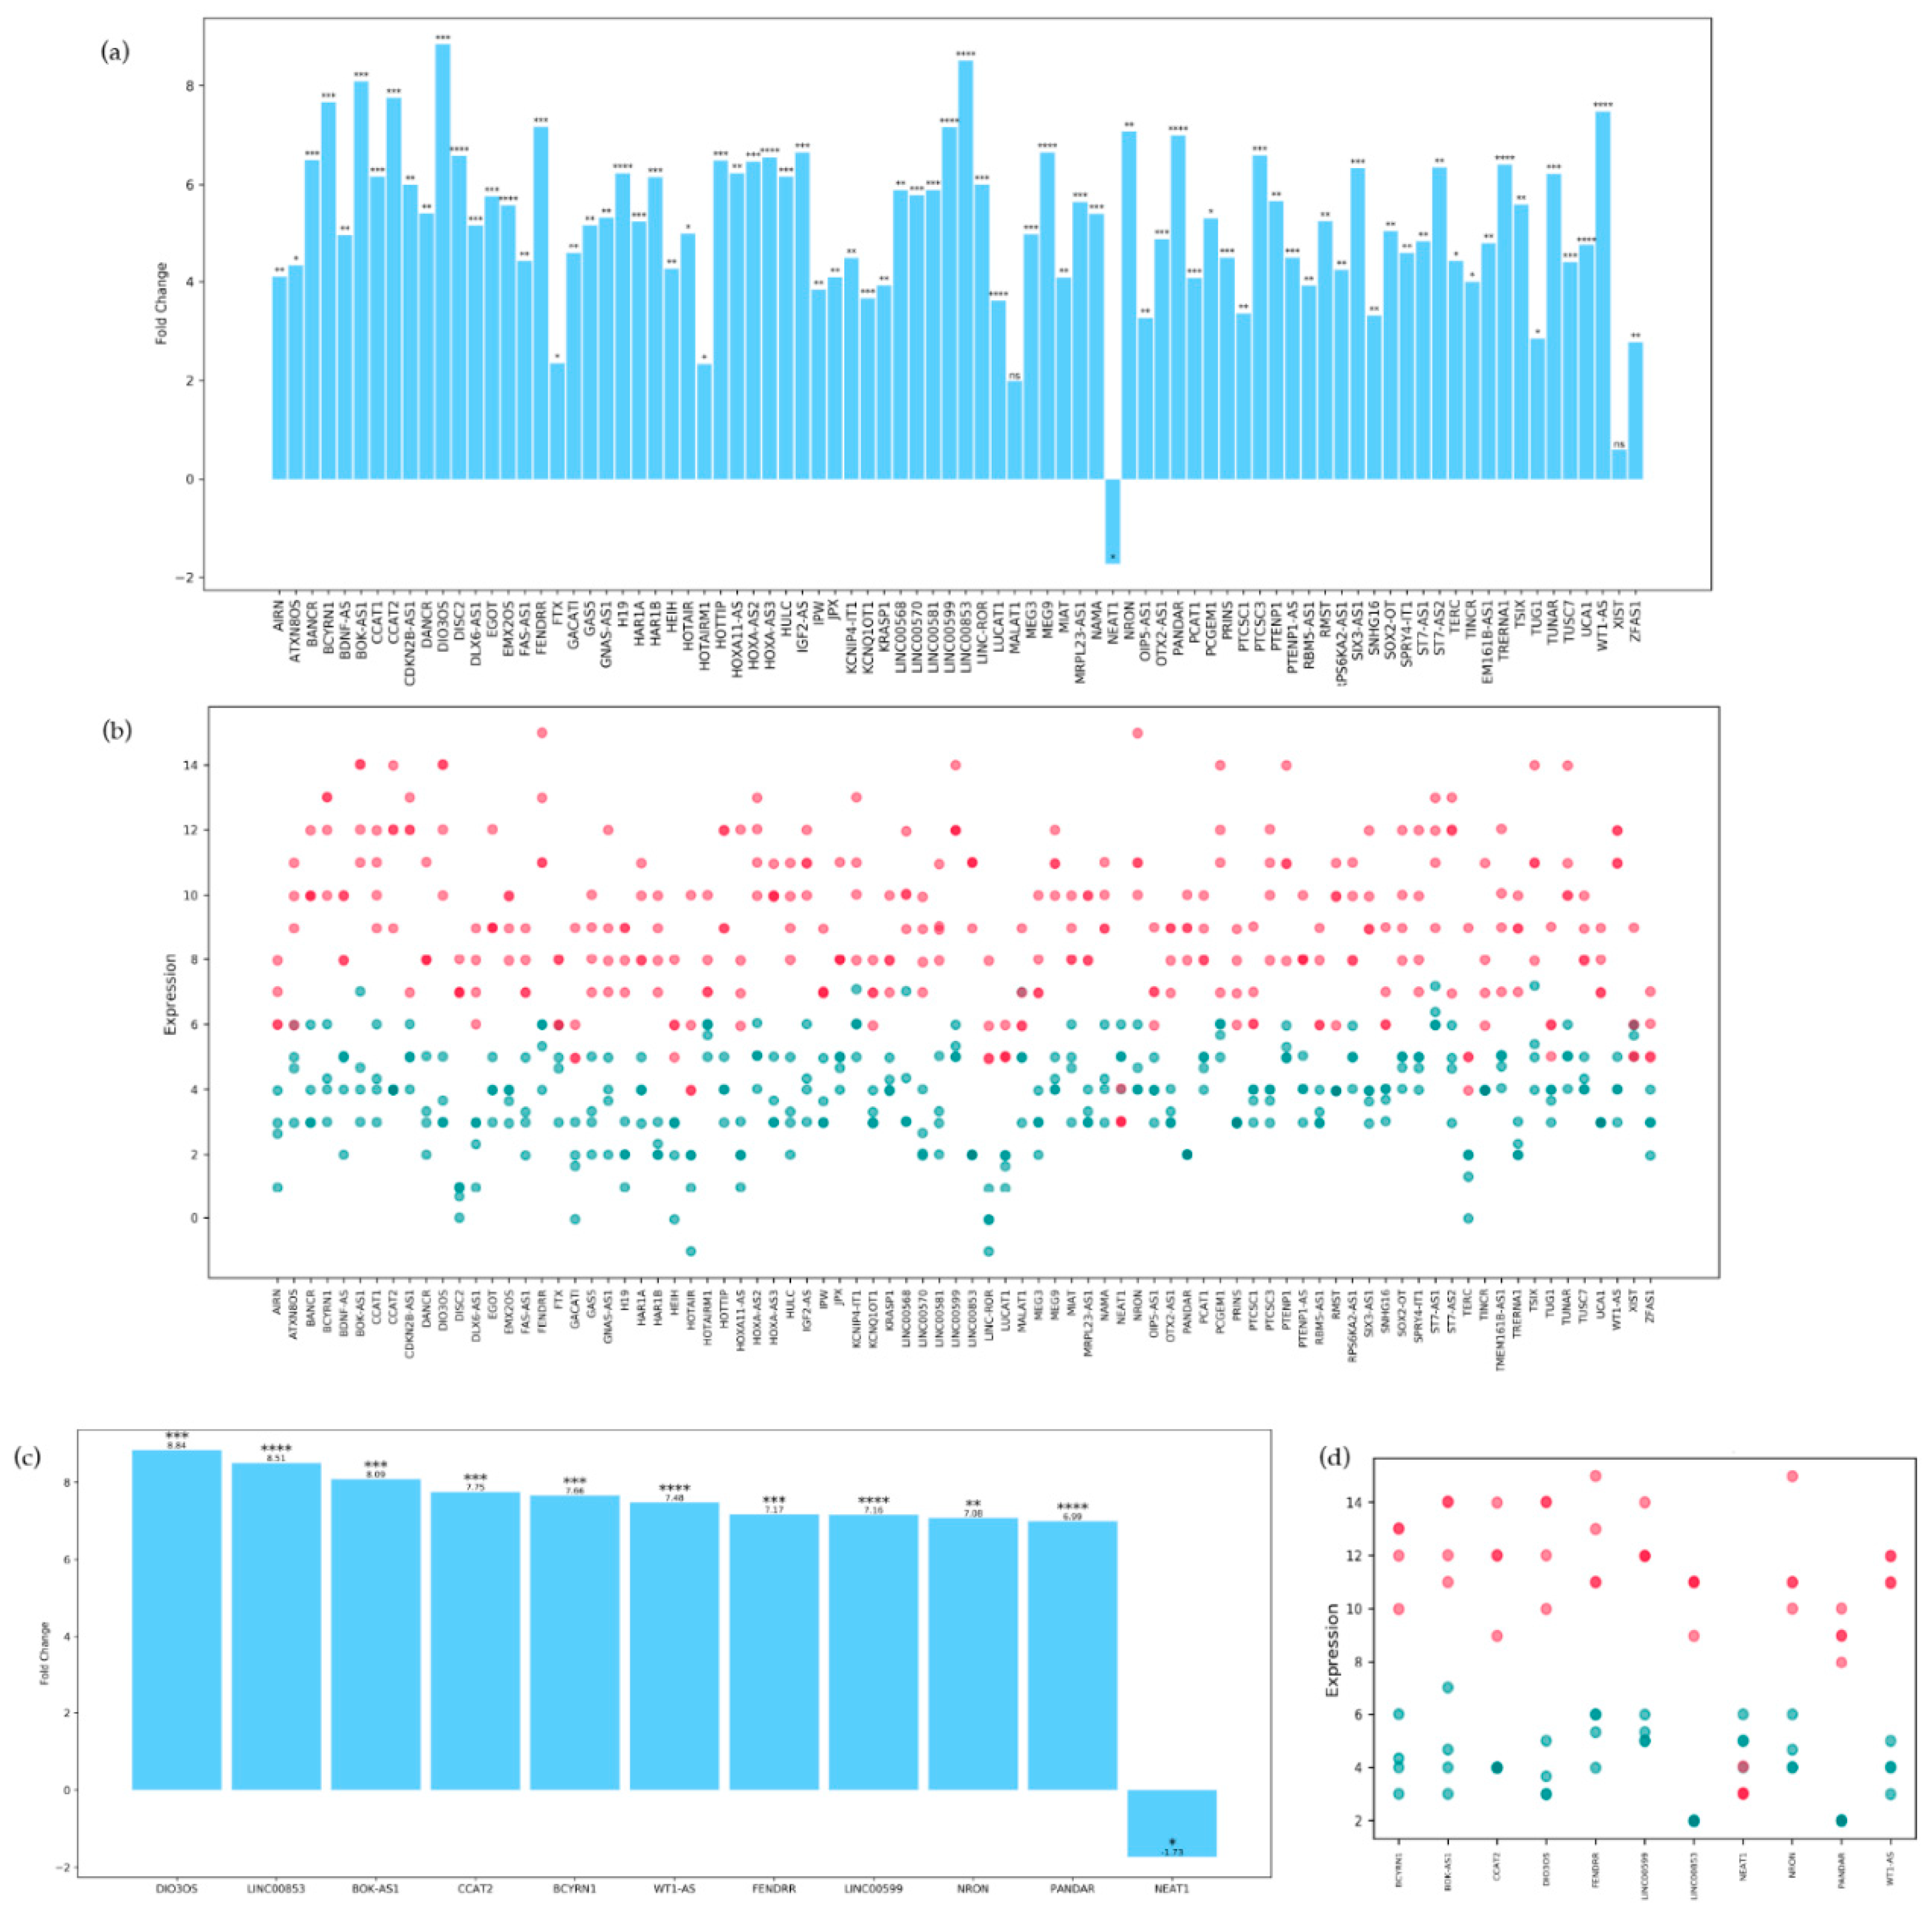
Figure 1. (a) Column histogram showing on the x axis the 84 lncRNAS and on the y axis their respective fold change. Significance is attributed the following way: ns for p-values above 0.05, * for p-values between 0.05 and 0.01; ** for p-values between 0.01 and 0.001, *** for p-values between 0.001 and 0.0001, and **** for p-values smaller than 0.0001. (b) Scatterplot representing on the x axis each lncRNA and on the y axis their respective expression. Each dot represents the expression in a single sample, MCI patients are colored magenta while control patients are cyan. A deeper color represents two or more patients having a similar expression level. (c) Column histogram showing only the top 10 lncRNAs with the highest fold change, plus NEAT1. (d) Scatterplot showing the expression distribution for every sample of the top 10 lncRNAs with the highest fold change, plus NEAT1.
Preprints 87253 g001
Figure 2. Interaction Network. The nodes representing lncRNAs taken in consideration are colored differently based on their expression, positive fold change is represented by pink color, the deeper the pink, the higher the fold change, white color corresponds to zero fold change, while a negative fold change is represented by blue color. Interactors, for which expression is unknown, are represented by grey color.
Preprints 87253 g002
Figure 3. Subnetwork created from the Interaction network representing the top 10 lncRNAS having the higher MCC score. Nodes are colored according to the score, with red nodes having the higher score and yellow the lowest score.
Preprints 87253 g003
Figure 4. Network resulting from the pathway analysis. Each node's width varies in direct proportion to the number of its associated proteins. Protein-sharing pathways are connected by blue edges, with the thickness of the edges according to the quantity of shared proteins.
Preprints 87253 g004
Table 1.
Clinical characteristics Value MCI Patients Healthy Controls
Age at our observation (years) Mean 59.07 ± 18.76 62.25 ± 11.26
Range 49-65 52-66
Age at symptoms onset (years) Mean 55.17 ±10.35 -
Range 55.17 ±10.35 -
Sex Male 4 5
Female 6 5
Mini-Mental State Examination (MMSE) score - 22.48 (±2.06) 28.47 (±1.93)
Other cerebrovascular pathology - None None
Metabolic/endocrine disease - None None
Table 2. Top 10 lncRNAs ranked by Maximal Clique Centrality score.
Rank Name Score
1 SNHG16 281.0
2 MALAT1 202.0
3 H19 174.0
4 HOTAIR 153.0
5 MEG3 135.0
6 NEAT1 102.0
7 TUG1 95.0
8 XIST 84.0
9 GAS5 78.0
10 UCA1 63.0
Disclaimer/Publisher’s Note: The statements, opinions and data contained in all publications are solely those of the individual author(s) and contributor(s) and not of MDPI and/or the editor(s). MDPI and/or the editor(s) disclaim responsibility for any injury to people or property resulting from any ideas, methods, instructions or products referred to in the content.
Copyright: This open access article is published under a Creative Commons CC BY 4.0 license, which permit the free download, distribution, and reuse, provided that the author and preprint are cited in any reuse.
Prerpints.org logo

Preprints.org is a free preprint server supported by MDPI in Basel, Switzerland.

Subscribe

© 2024 MDPI (Basel, Switzerland) unless otherwise stated