Submitted:
06 October 2023
Posted:
09 October 2023
You are already at the latest version
Abstract
Keywords:
1. Introduction
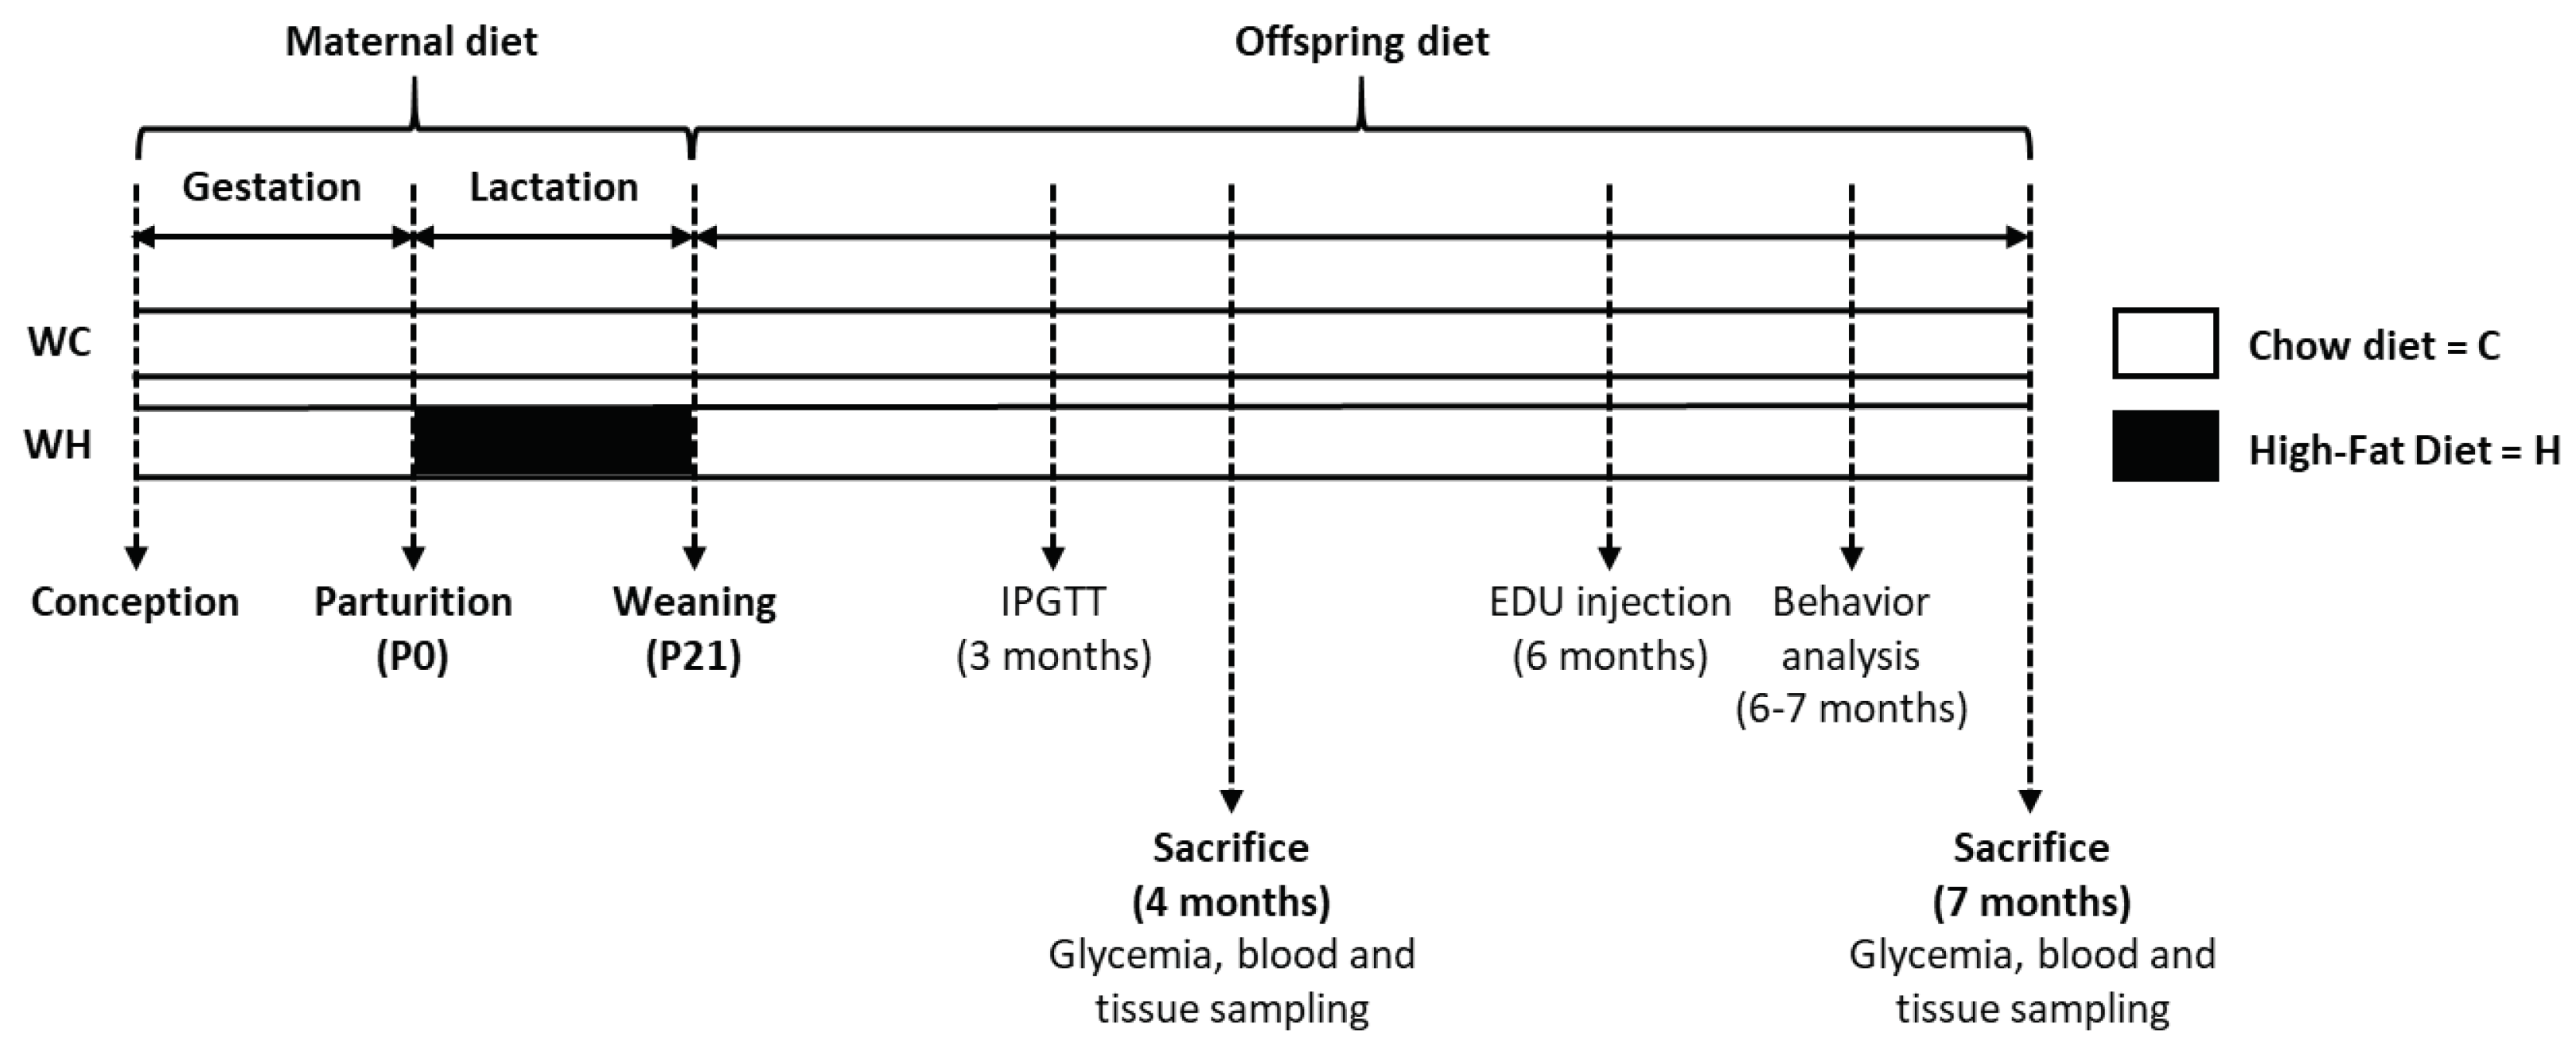
2. Materials and methods
2.1. Animals
2.2. Behavioural study
2.3. Sacrifice and brain tissue preparation
2.4. Glycaemia
2.5. Glucose tolerance test
2.6. Biochemical plasma parameters
2.7. Adult hippocampal neurogenesis analysis
2.7.2. EDU staining
2.8. RNA-sequencing analysis
2.8.1. RNA extraction
2.8.2. RNA-sequencing analysis
2.8.3. Data processing
2.9. Mass spectrometry
2.9.1. Protein extraction
2.9.2. Proteomic preparation
2.9.3. NanoLC-MS/MS analysis
2.9.4. Data processing
2.10. Regulon analysis
2.11. Statistics
3. Results
3.1. Maternal high-fat diet increases body weight gain during lactation in offspring, and induces a glucose intolerance in adult males
| Parameters | WC ♂ | WH ♂ | Significance | WC ♀ | WH ♀ | Significance |
|---|---|---|---|---|---|---|
| Body weight at P21 (g) | 8.6 ± 0.3 | 9.7 ± 0.3 | p = 0.010; ** | 8.2 ± 0.2 | 10.0 ± 0.2 | p = 0.001; *** |
| Body weight at the sacrifice - 4 months (g) | 26.8 ± 0.5 | 25.6 ± 0.4 | p = 0.055 | 19.7 ± 0.3 | 19.7 ± 0.4 | p = 0.979 |
| Body weight at the sacrifice - 7 months (g) | 34.3 ± 0.7 | 30.4 ± 1.0 | p = 0.006; ** | 24.2 ± 0.7 | 23.4 ± 0.8 | p = 0.765 |
| Glycemia ad libitum (mg/dl) | 183.7 ± 5.5 | 181.7 ± 6.0 | p = 0.806 | 163.0 ± 3.8 | 173.9 ± 5.2 | p = 0.096 |
| Glycemia fasting (6h) (mg/dl) | 166.7 ± 5.5 | 157.2 ± 6.8 | p = 0.284 | 154.8 ± 4.8 | 151.4 ± 6.2 | p = 0.666 |
| Insulinemia fasting (6h) - 4 months (µg/l) | 0.6 ± 0.05 | 0.5 ± 0.05 | p = 0.106 | 0.2 ± 0.02 | 0.1 ± 0.01 | p = 0.243 |
| Insulinemia fasting (6h) - 7 months (µg/l) | 0.6 ± 0.05 | 0.5 ± 0.07 | p = 0.030; * | 0.3 ± 0.04 | 0.3 ± 0.01 | p = 0.128 |
| Free fatty acid - 4 months (mmol/l) | 1.2 ± 0.10 | 1.0 ± 0.07 | p = 0.172 | 0.9 ± 0.04 | 1.0 ± 0.09 | p = 0.837 |
| Free fatty acid - 7 months (mmol/l) | 0.2 ± 0.03 | 0.1 ± 0.04 | p = 0.862 | 0.2 ± 0.02 | 0.2 ± 0.02 | p = 0.594 |
| Triglyceride - 4 months (mg/dl) | 79.9 ± 3.0 | 76.0 ± 3.9 | p = 0.464 | 74.5 ± 2.5 | 68.3 ± 1.8 | p = 0.065 |
| Triglyceride - 7 months (mg/dl) | 53.7 ± 10.5 | 64.0 ± 7.3 | p = 0.431 | 45.9 ± 3.4 | 48.9 ± 2.9 | p = 0.578 |
| Cholesterol - 4 months (mg/dl) | 89.9 ± 4.7 | 84.9 ± 4.6 | p = 0.474 | 72.4 ± 3.8 | 71.1 ± 2.7 | p = 0.786 |
| Cholesterol - 7 months (mg/dl) | 61.7 ± 10.1 | 65.3 ± 7.9 | p = 0.788 | 50.1 ± 3.7 | 47.7 ± 3.5 | p = 0.659 |
| Temperature (°C) | 37.6 ± 0.1 | 37.5 ± 0.1 | p = 0.540 | 37.4 ± 0.1 | 37.3 ± 0.1 | p = 0.693 |
3.2. Maternal high-fat diet leads to glucose intolerance in a sex-dependent manner in offspring
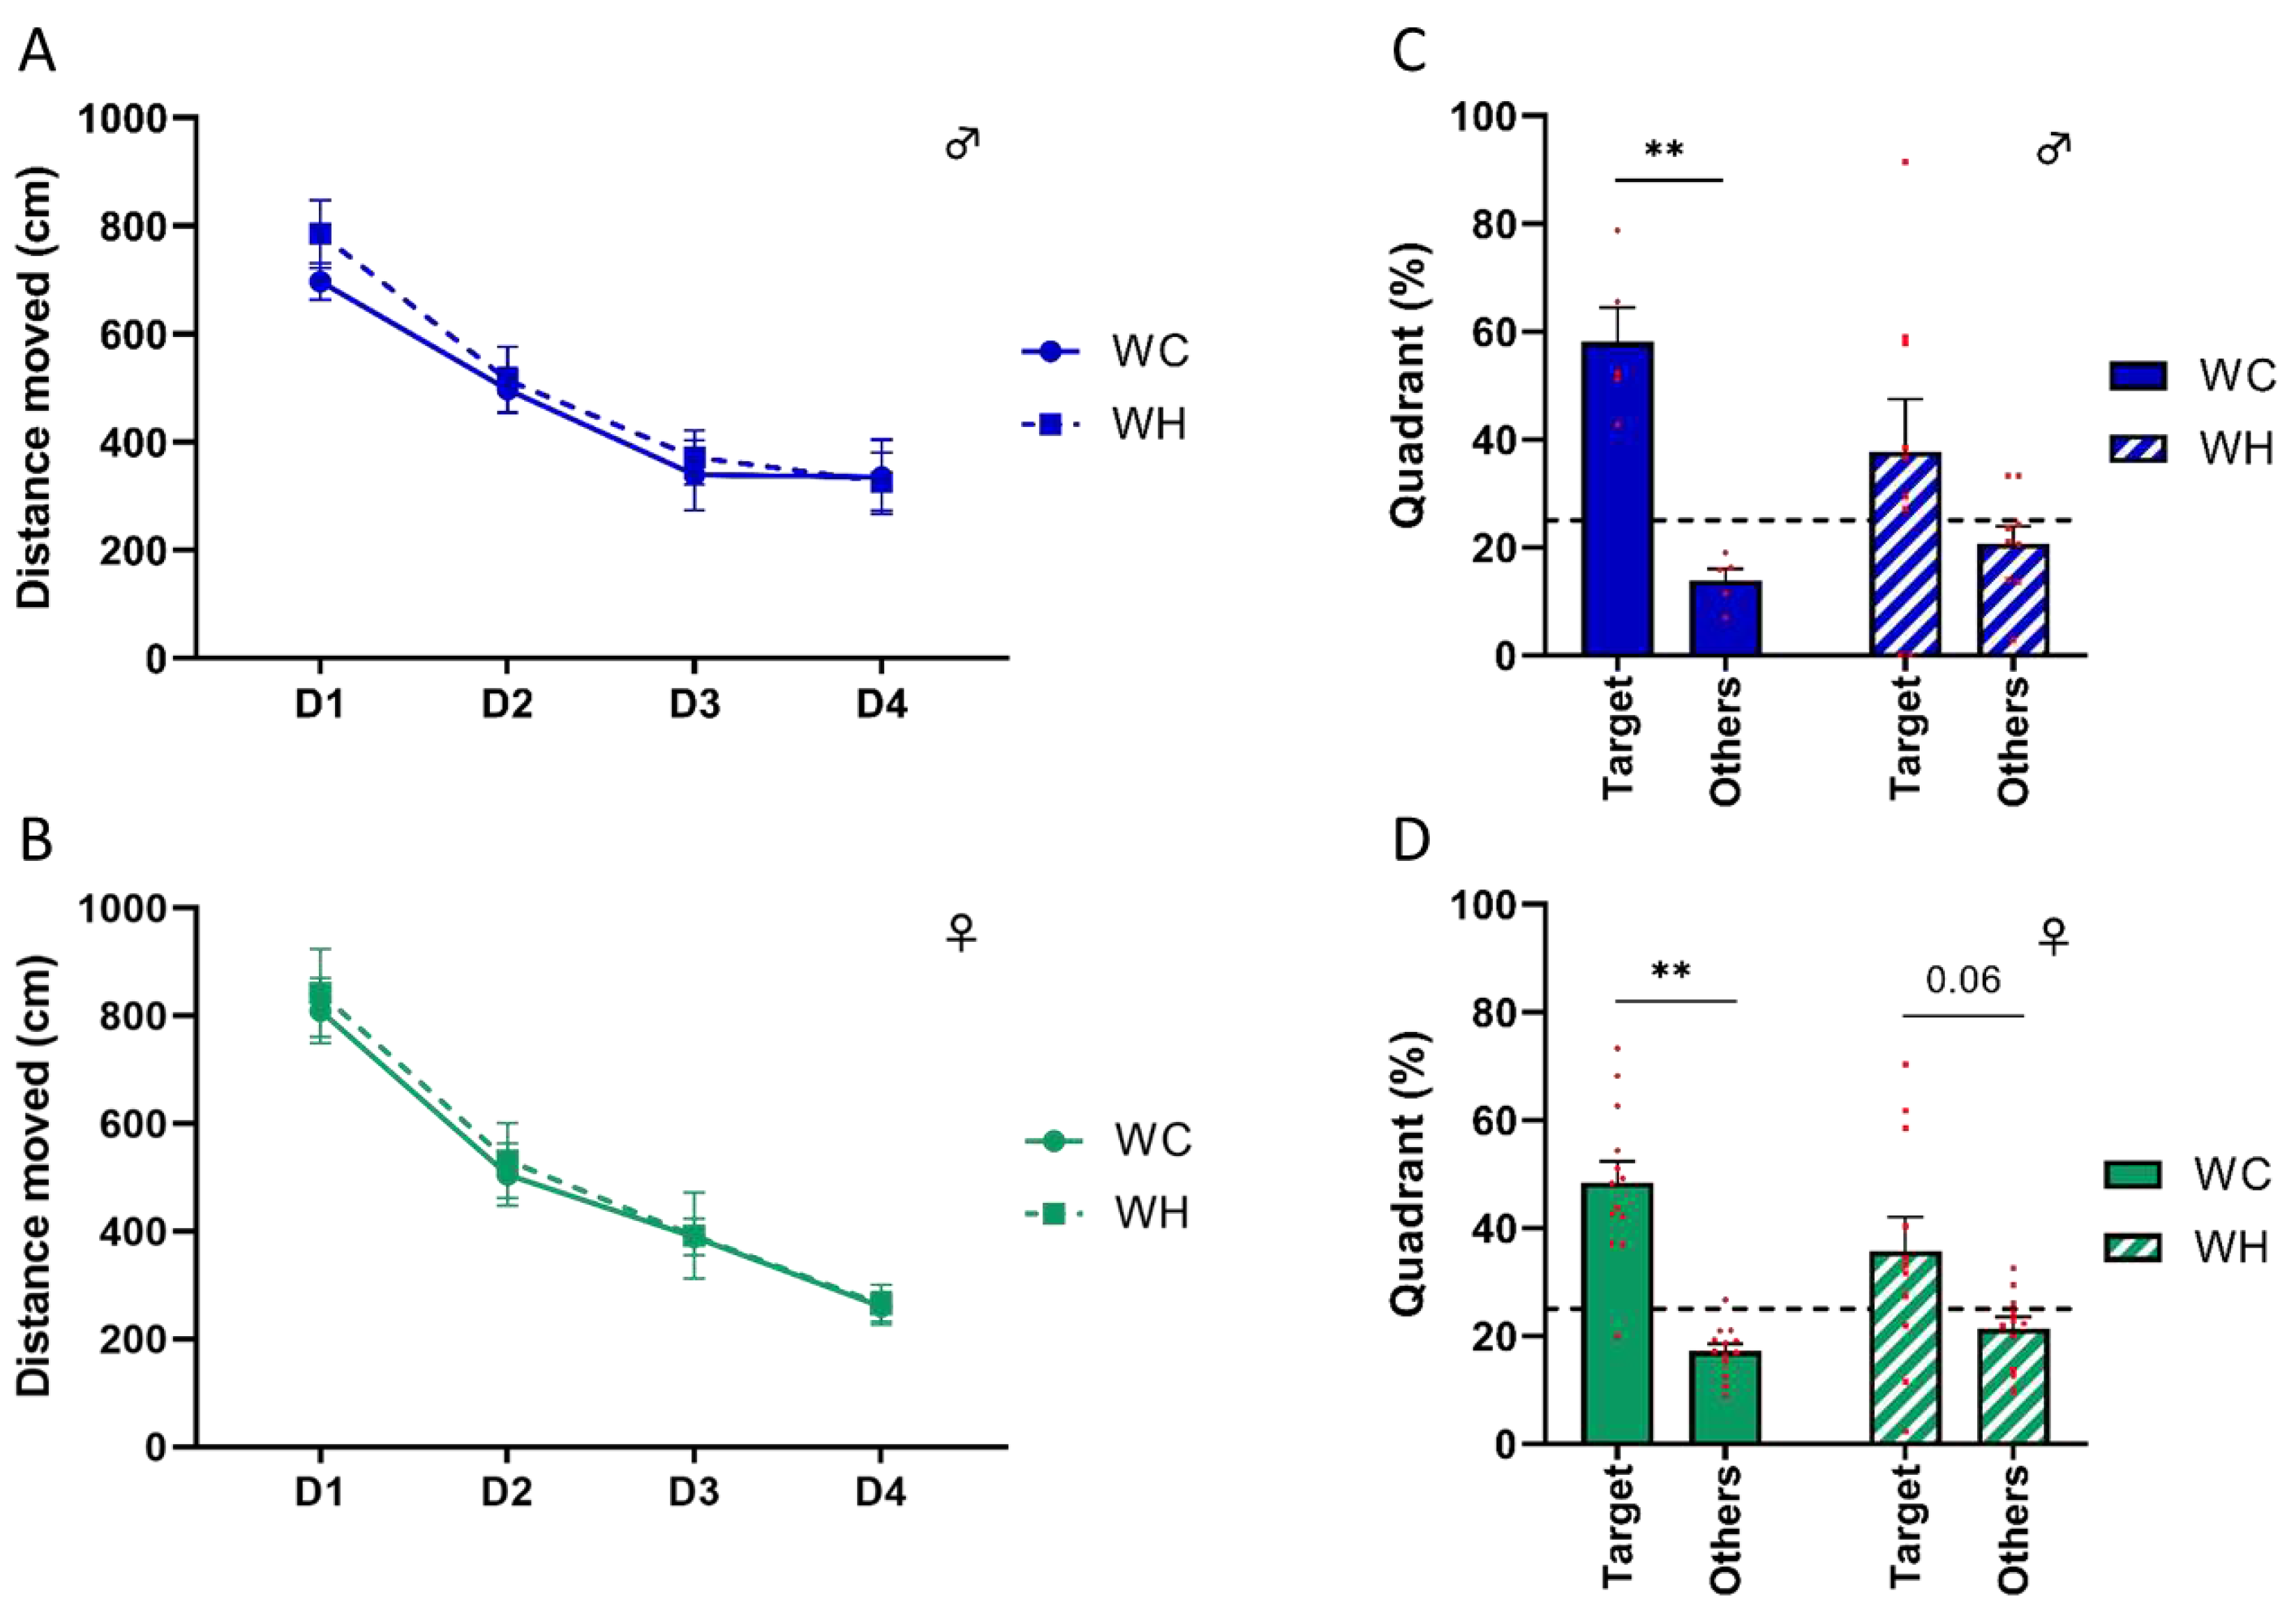
3.3. Maternal high-fat diet impairs long-term spatial memory in offspring
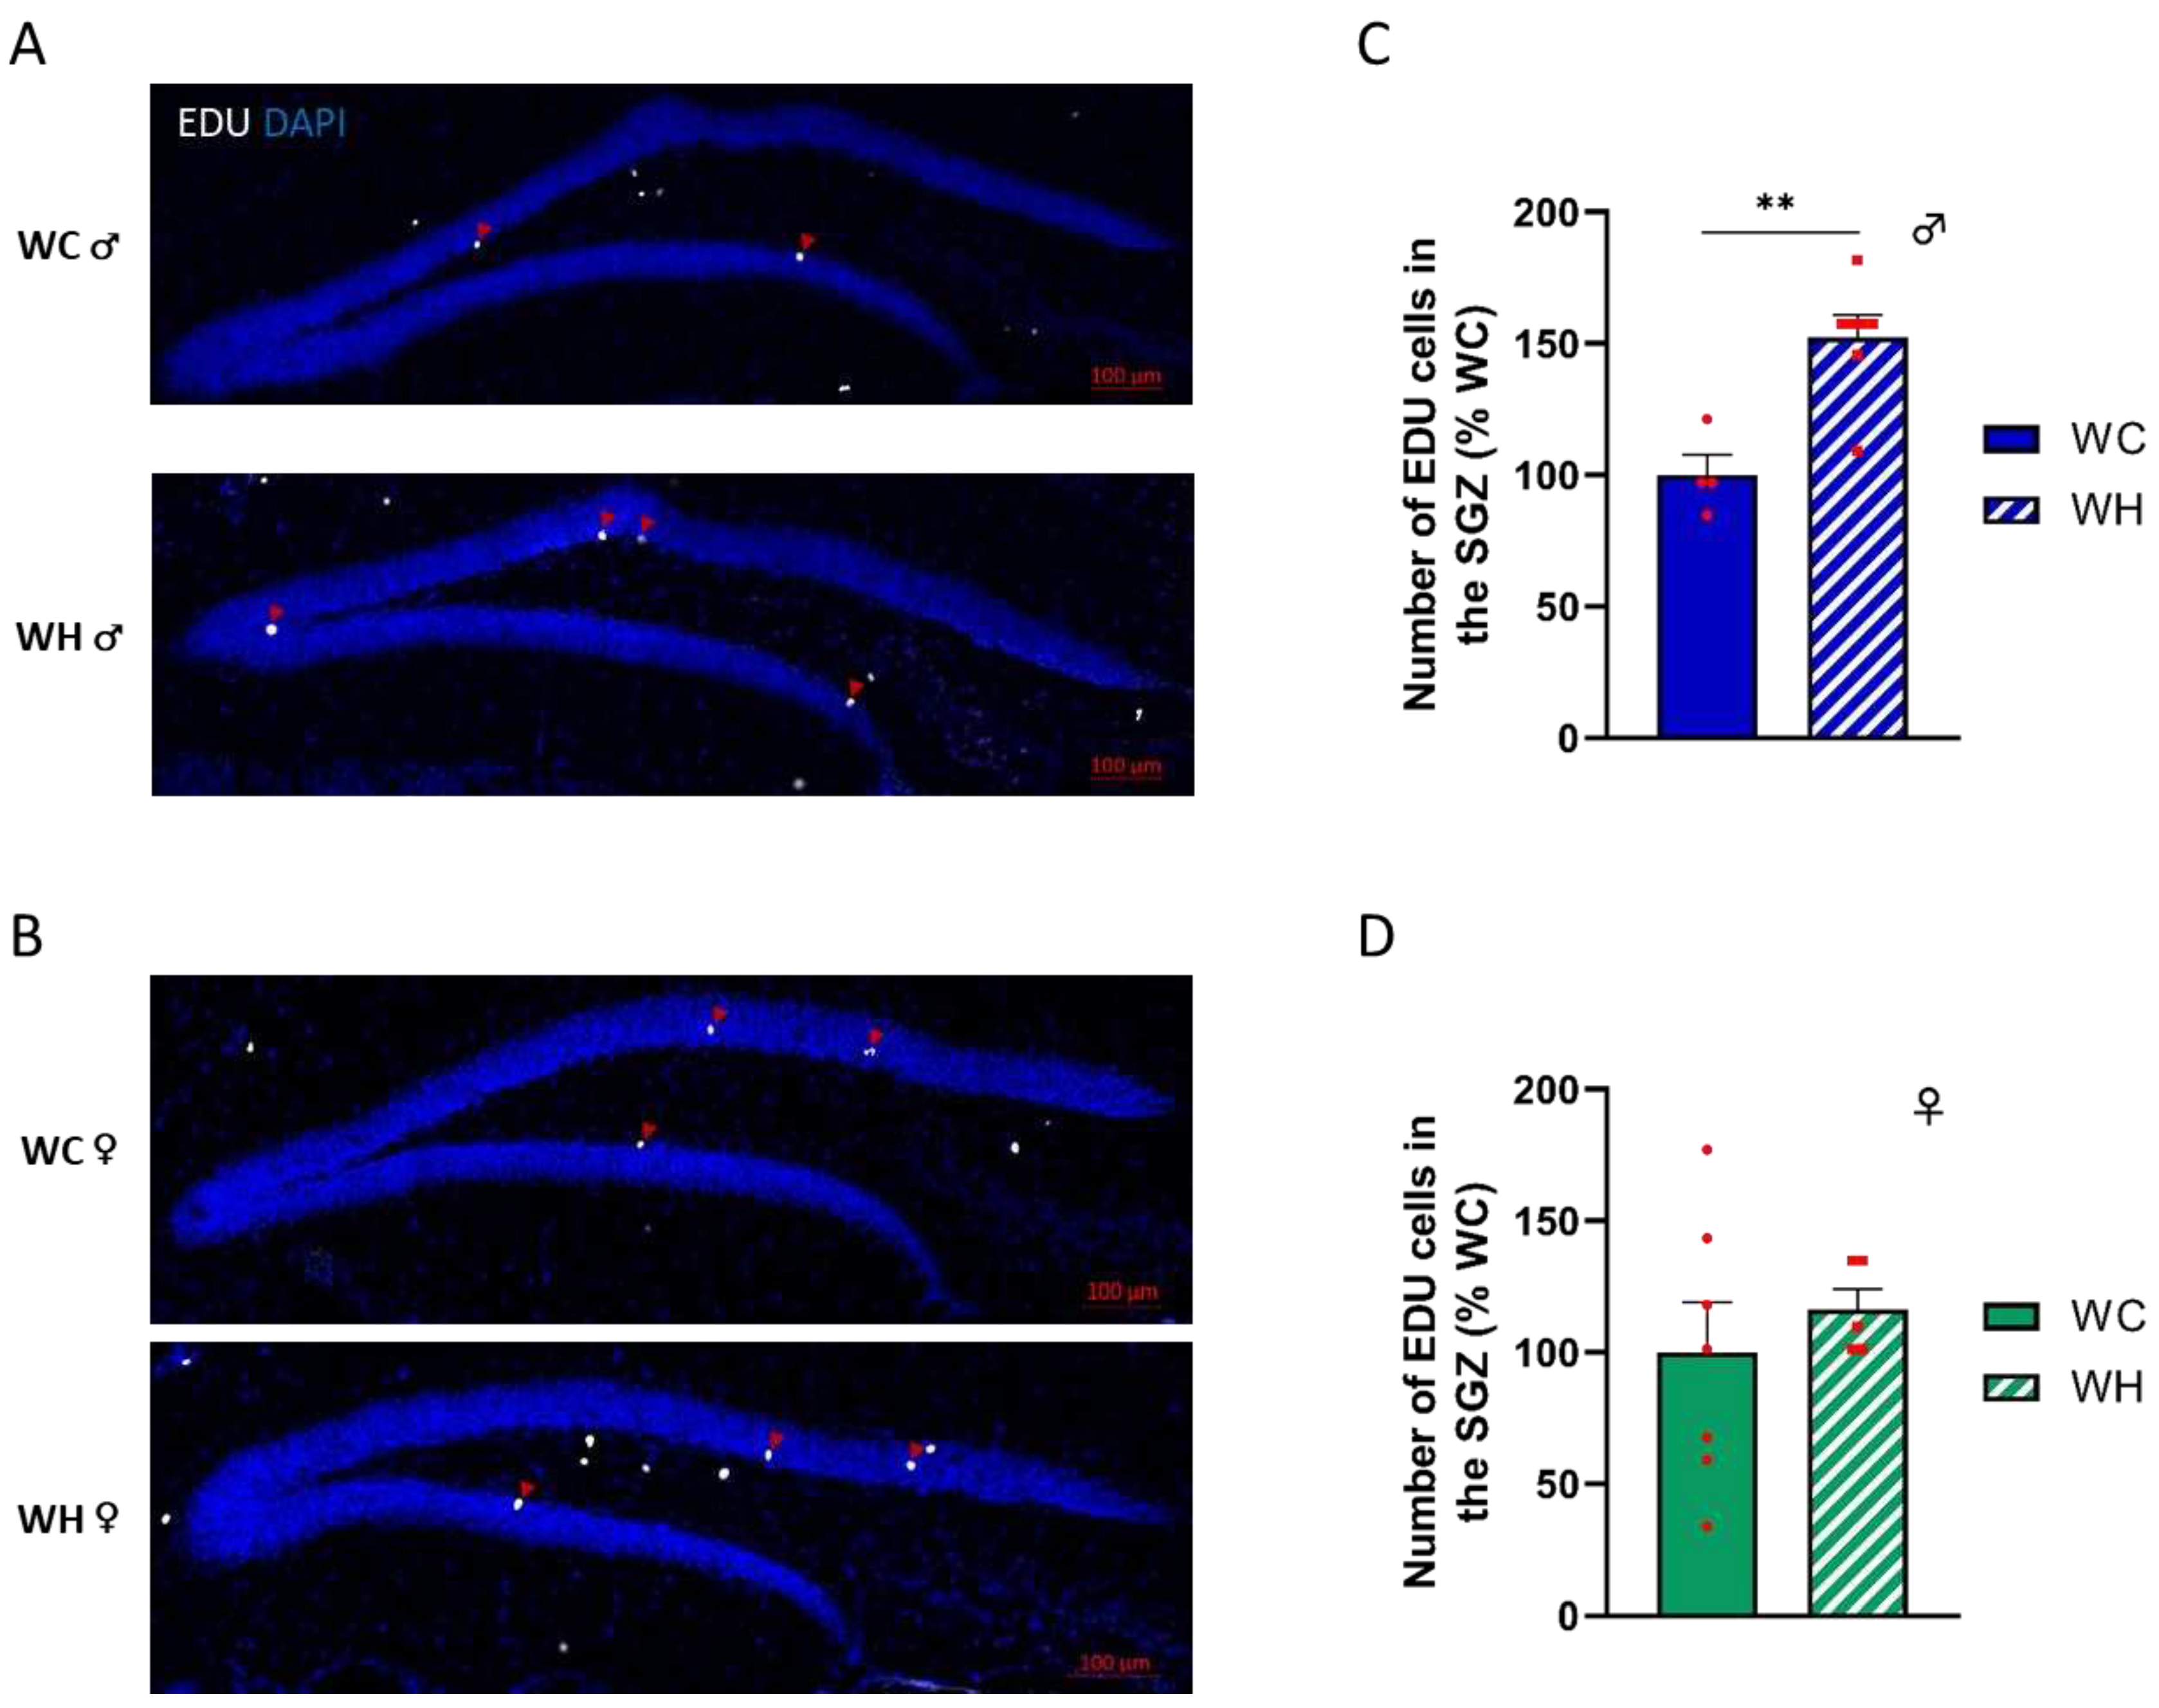
3.4. Maternal high-fat diet increases the number of proliferating neural stem cells in the subgranular zone in male offspring
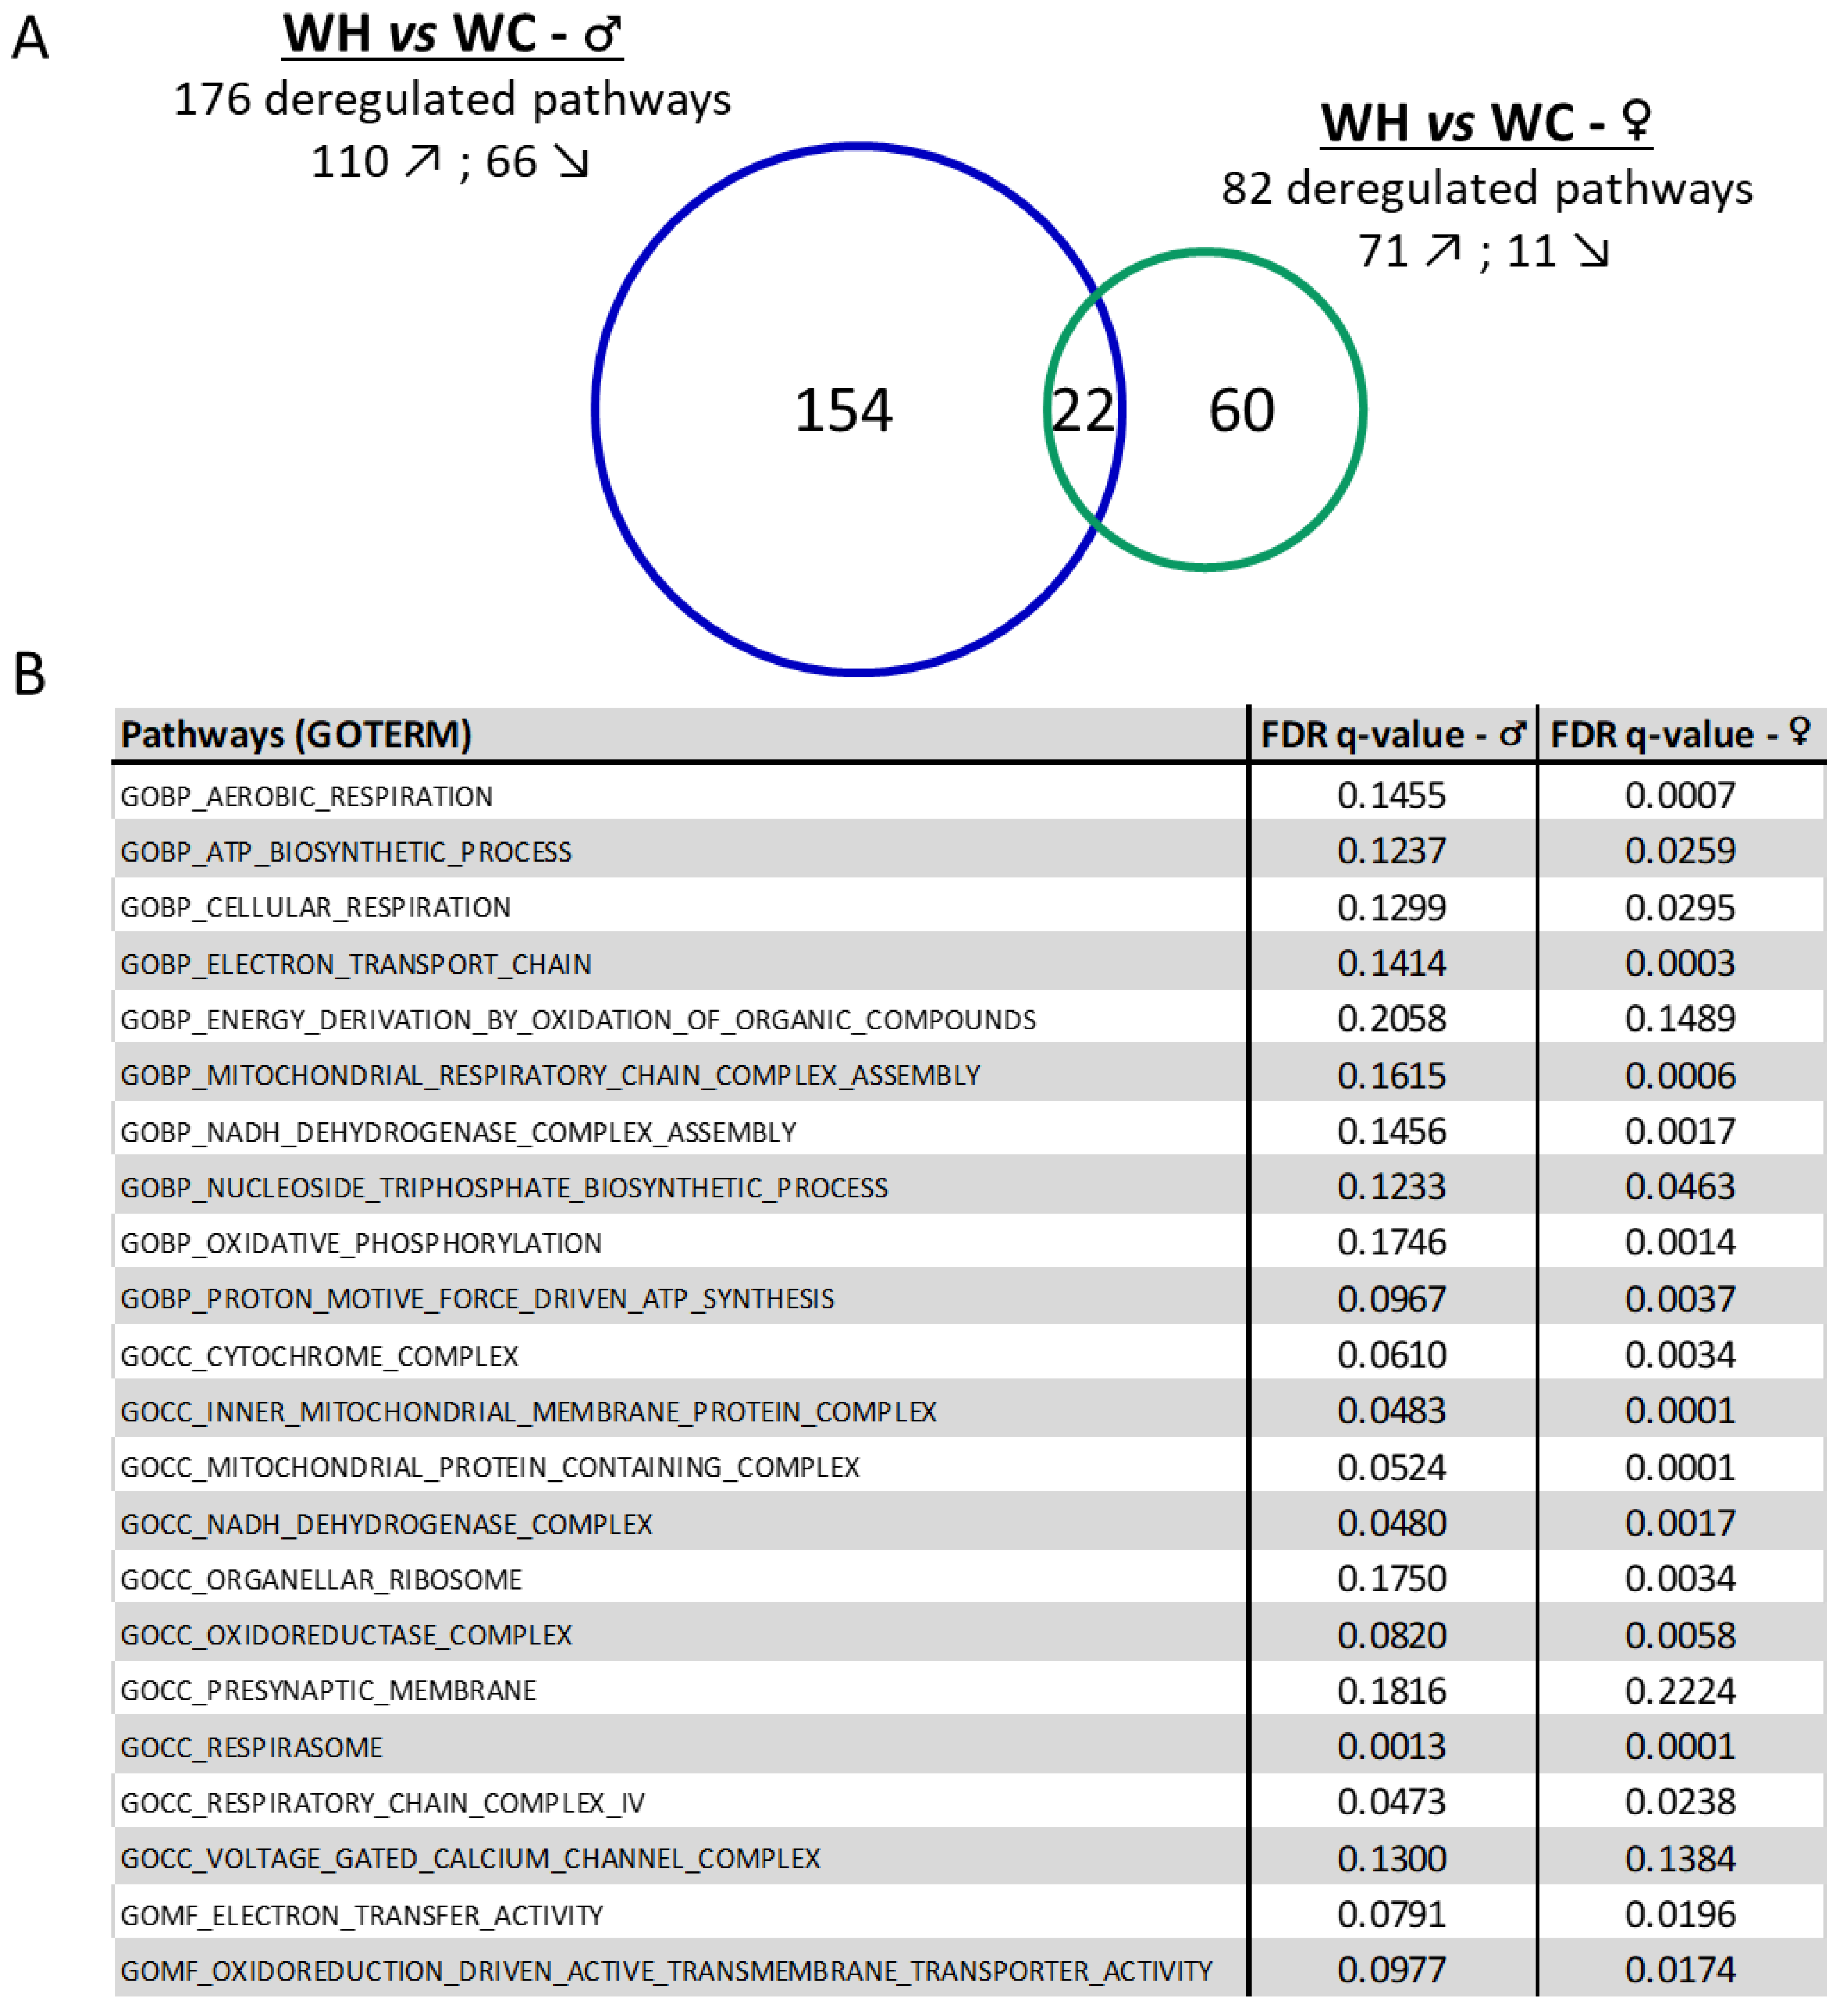
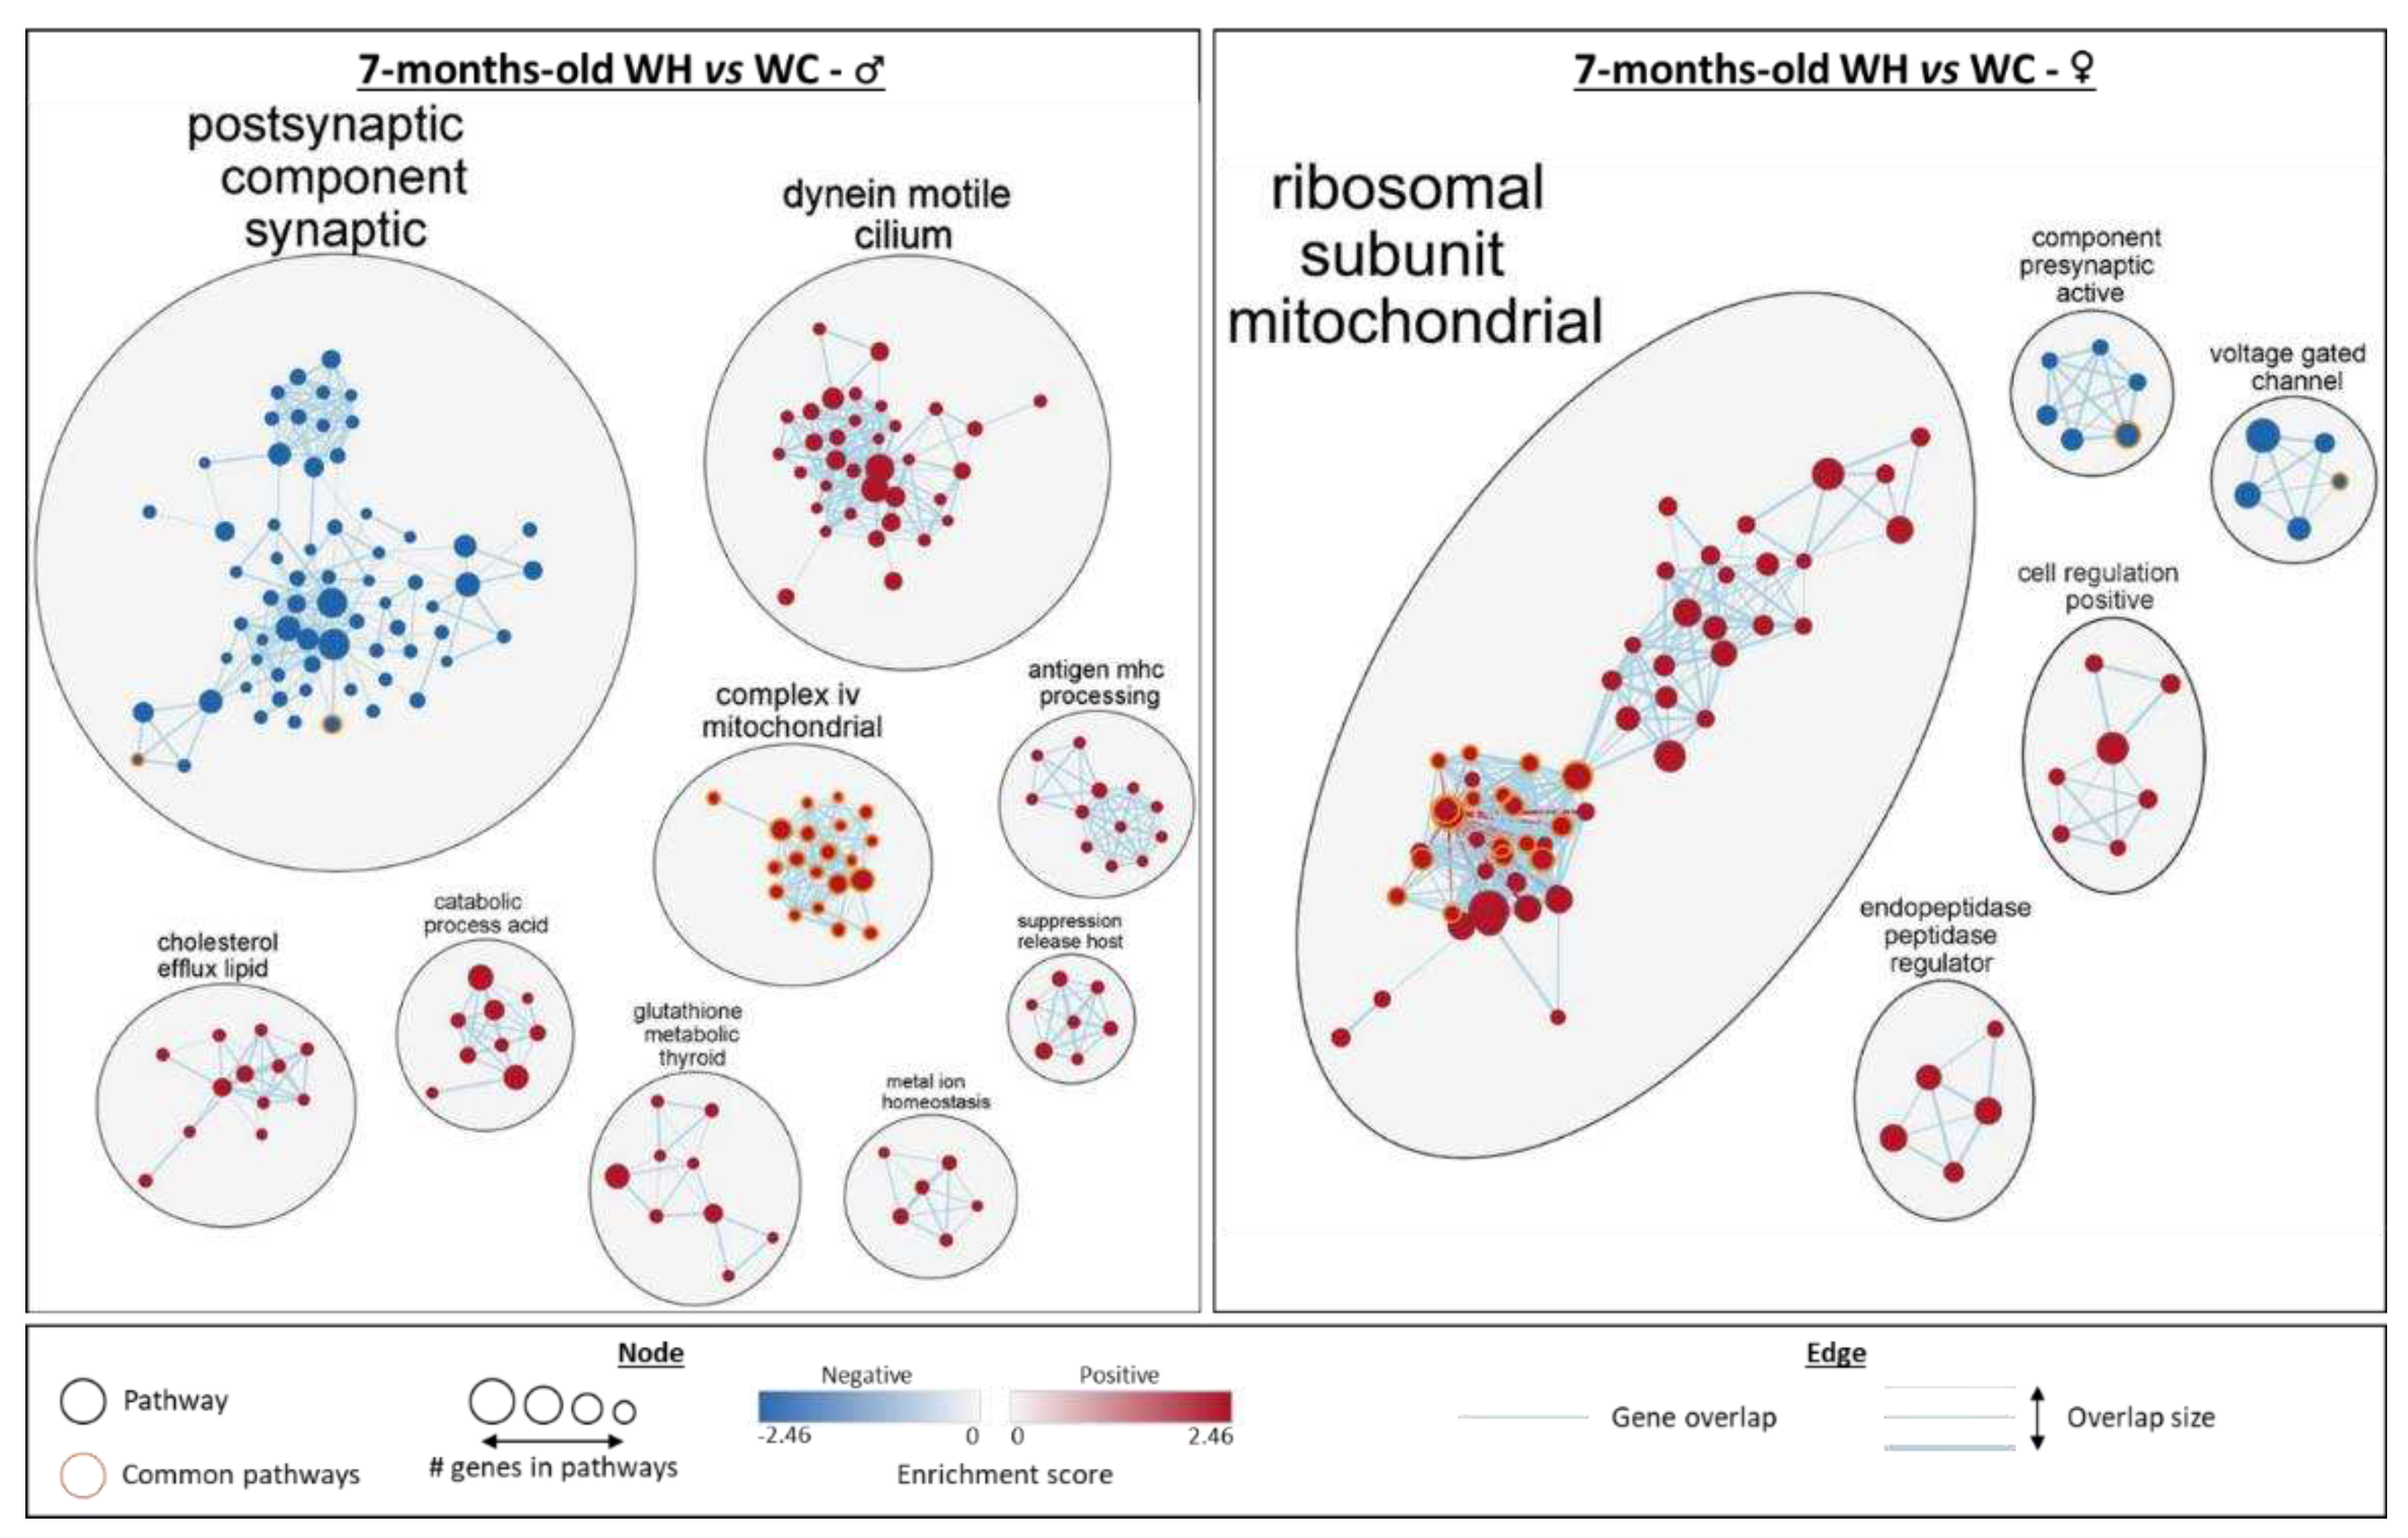
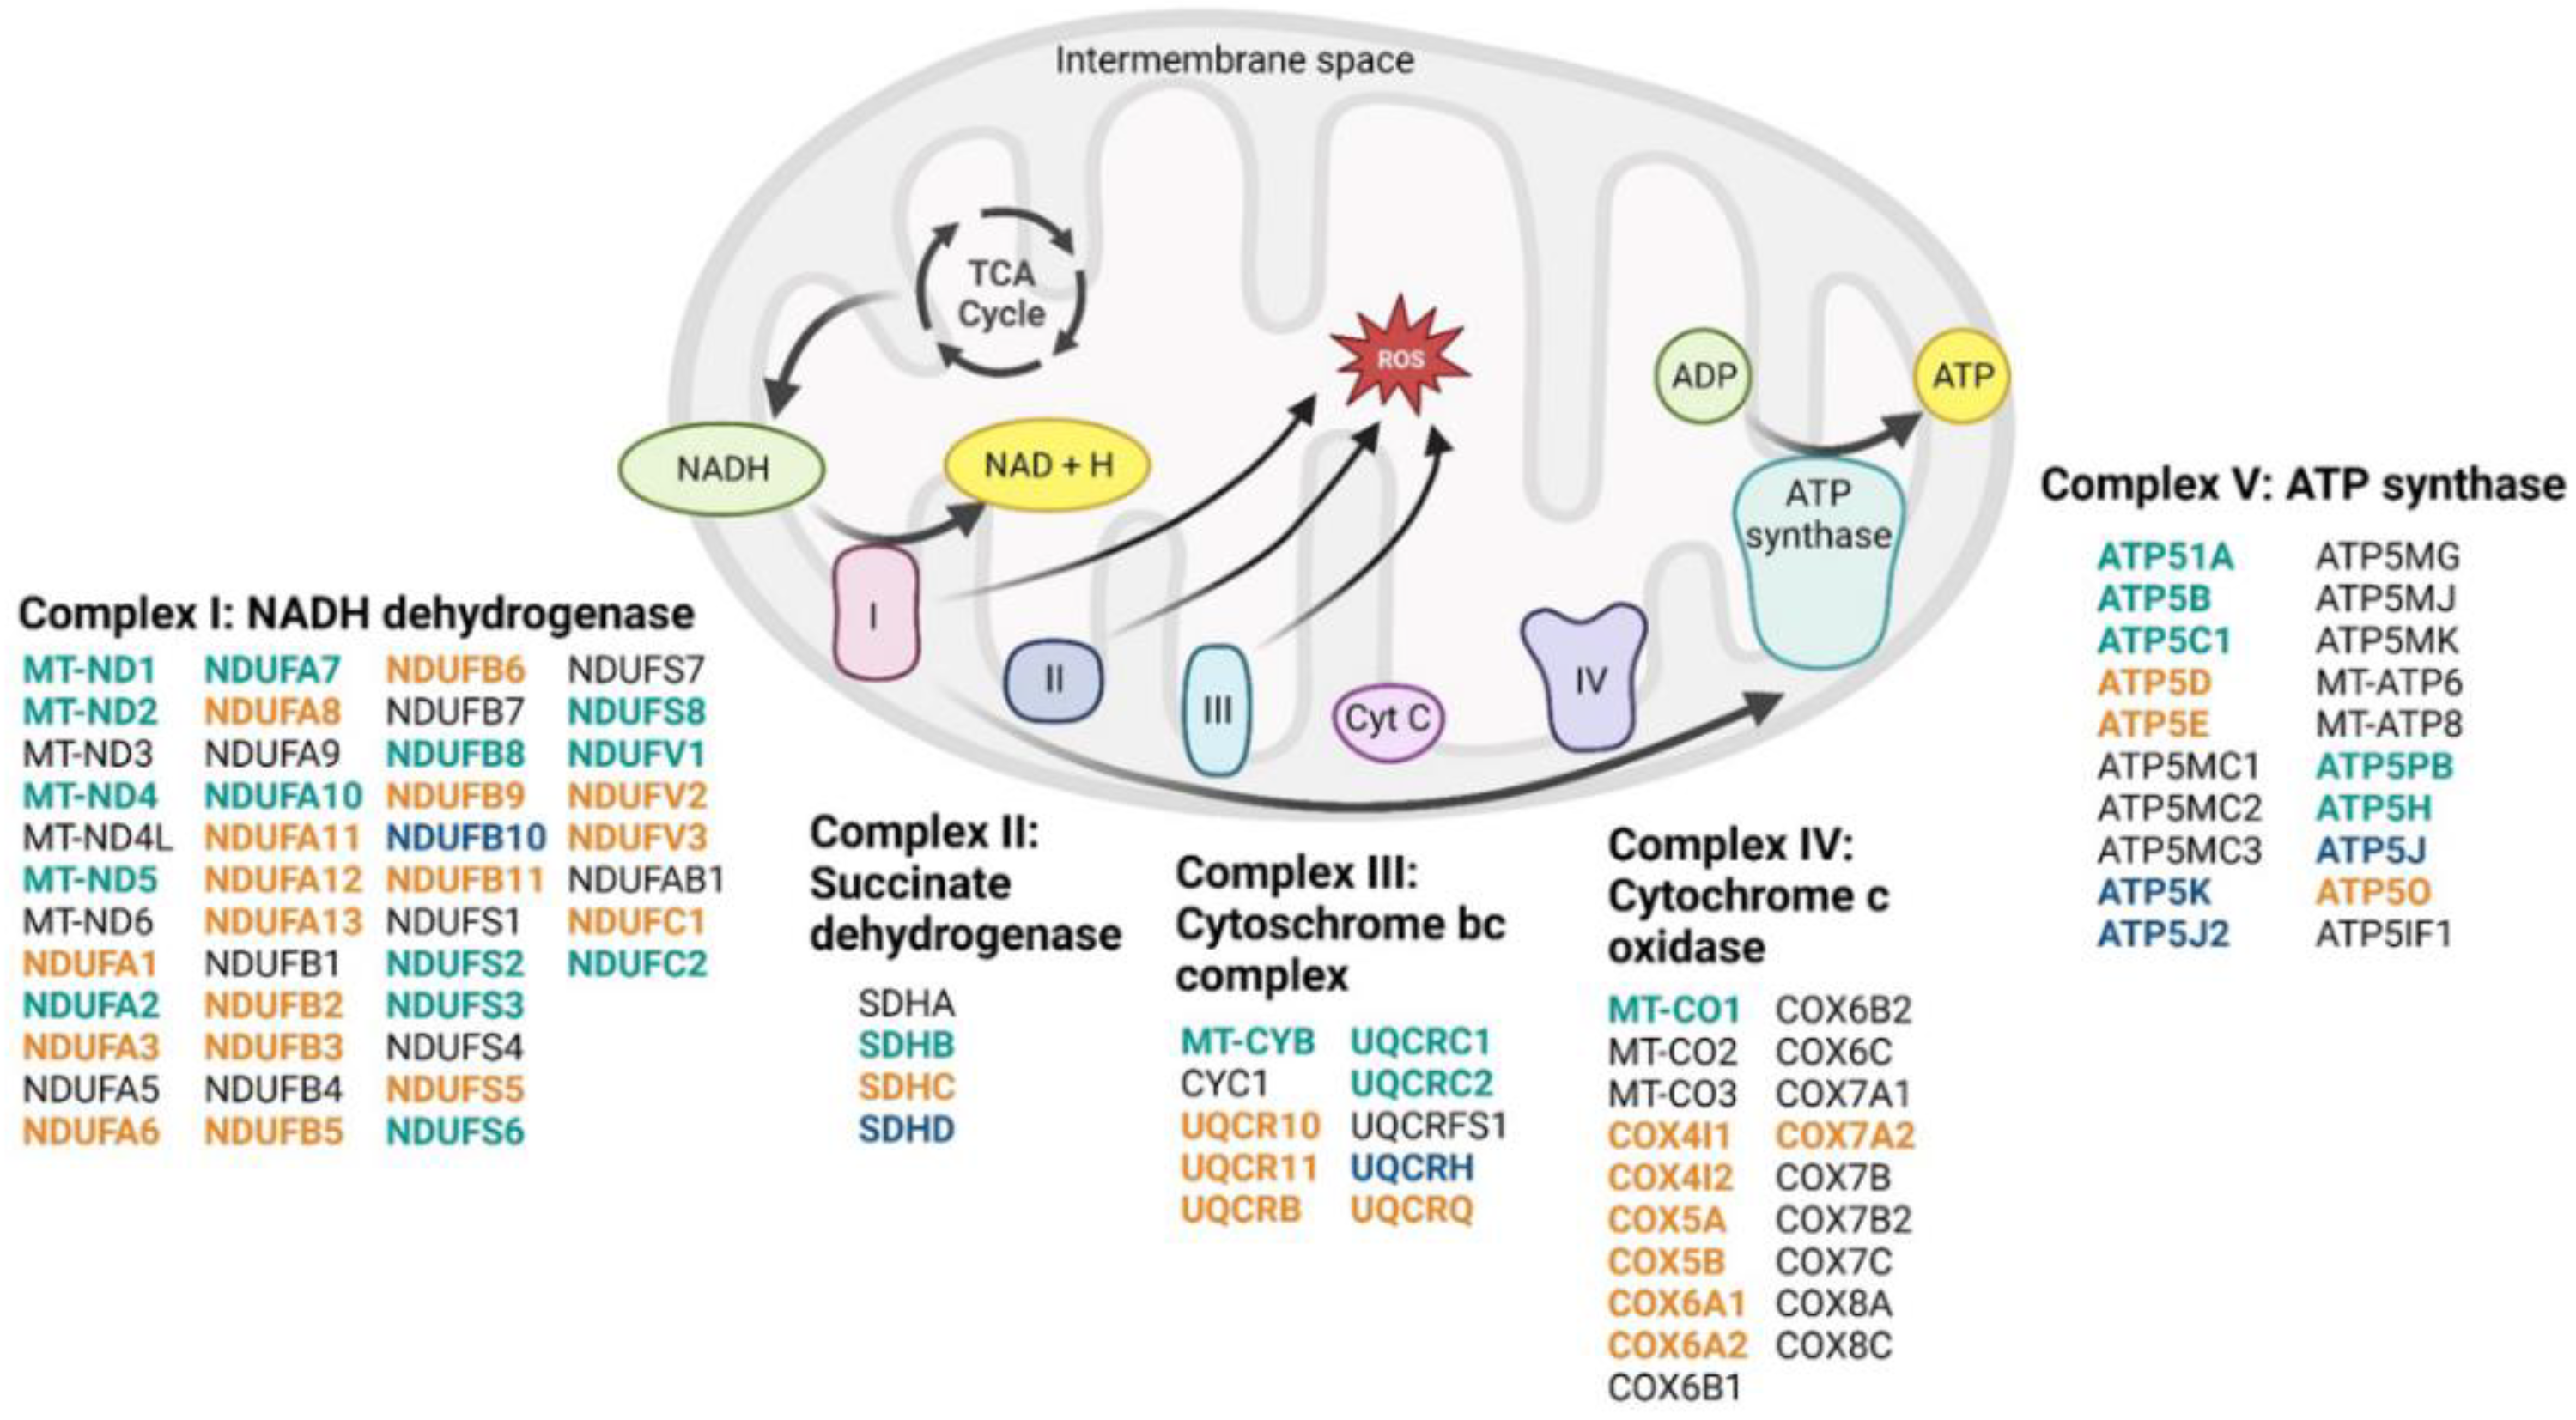
3.5. Maternal high-fat diet impairs hippocampal transcriptome in a sex-dependent manner in the offspring
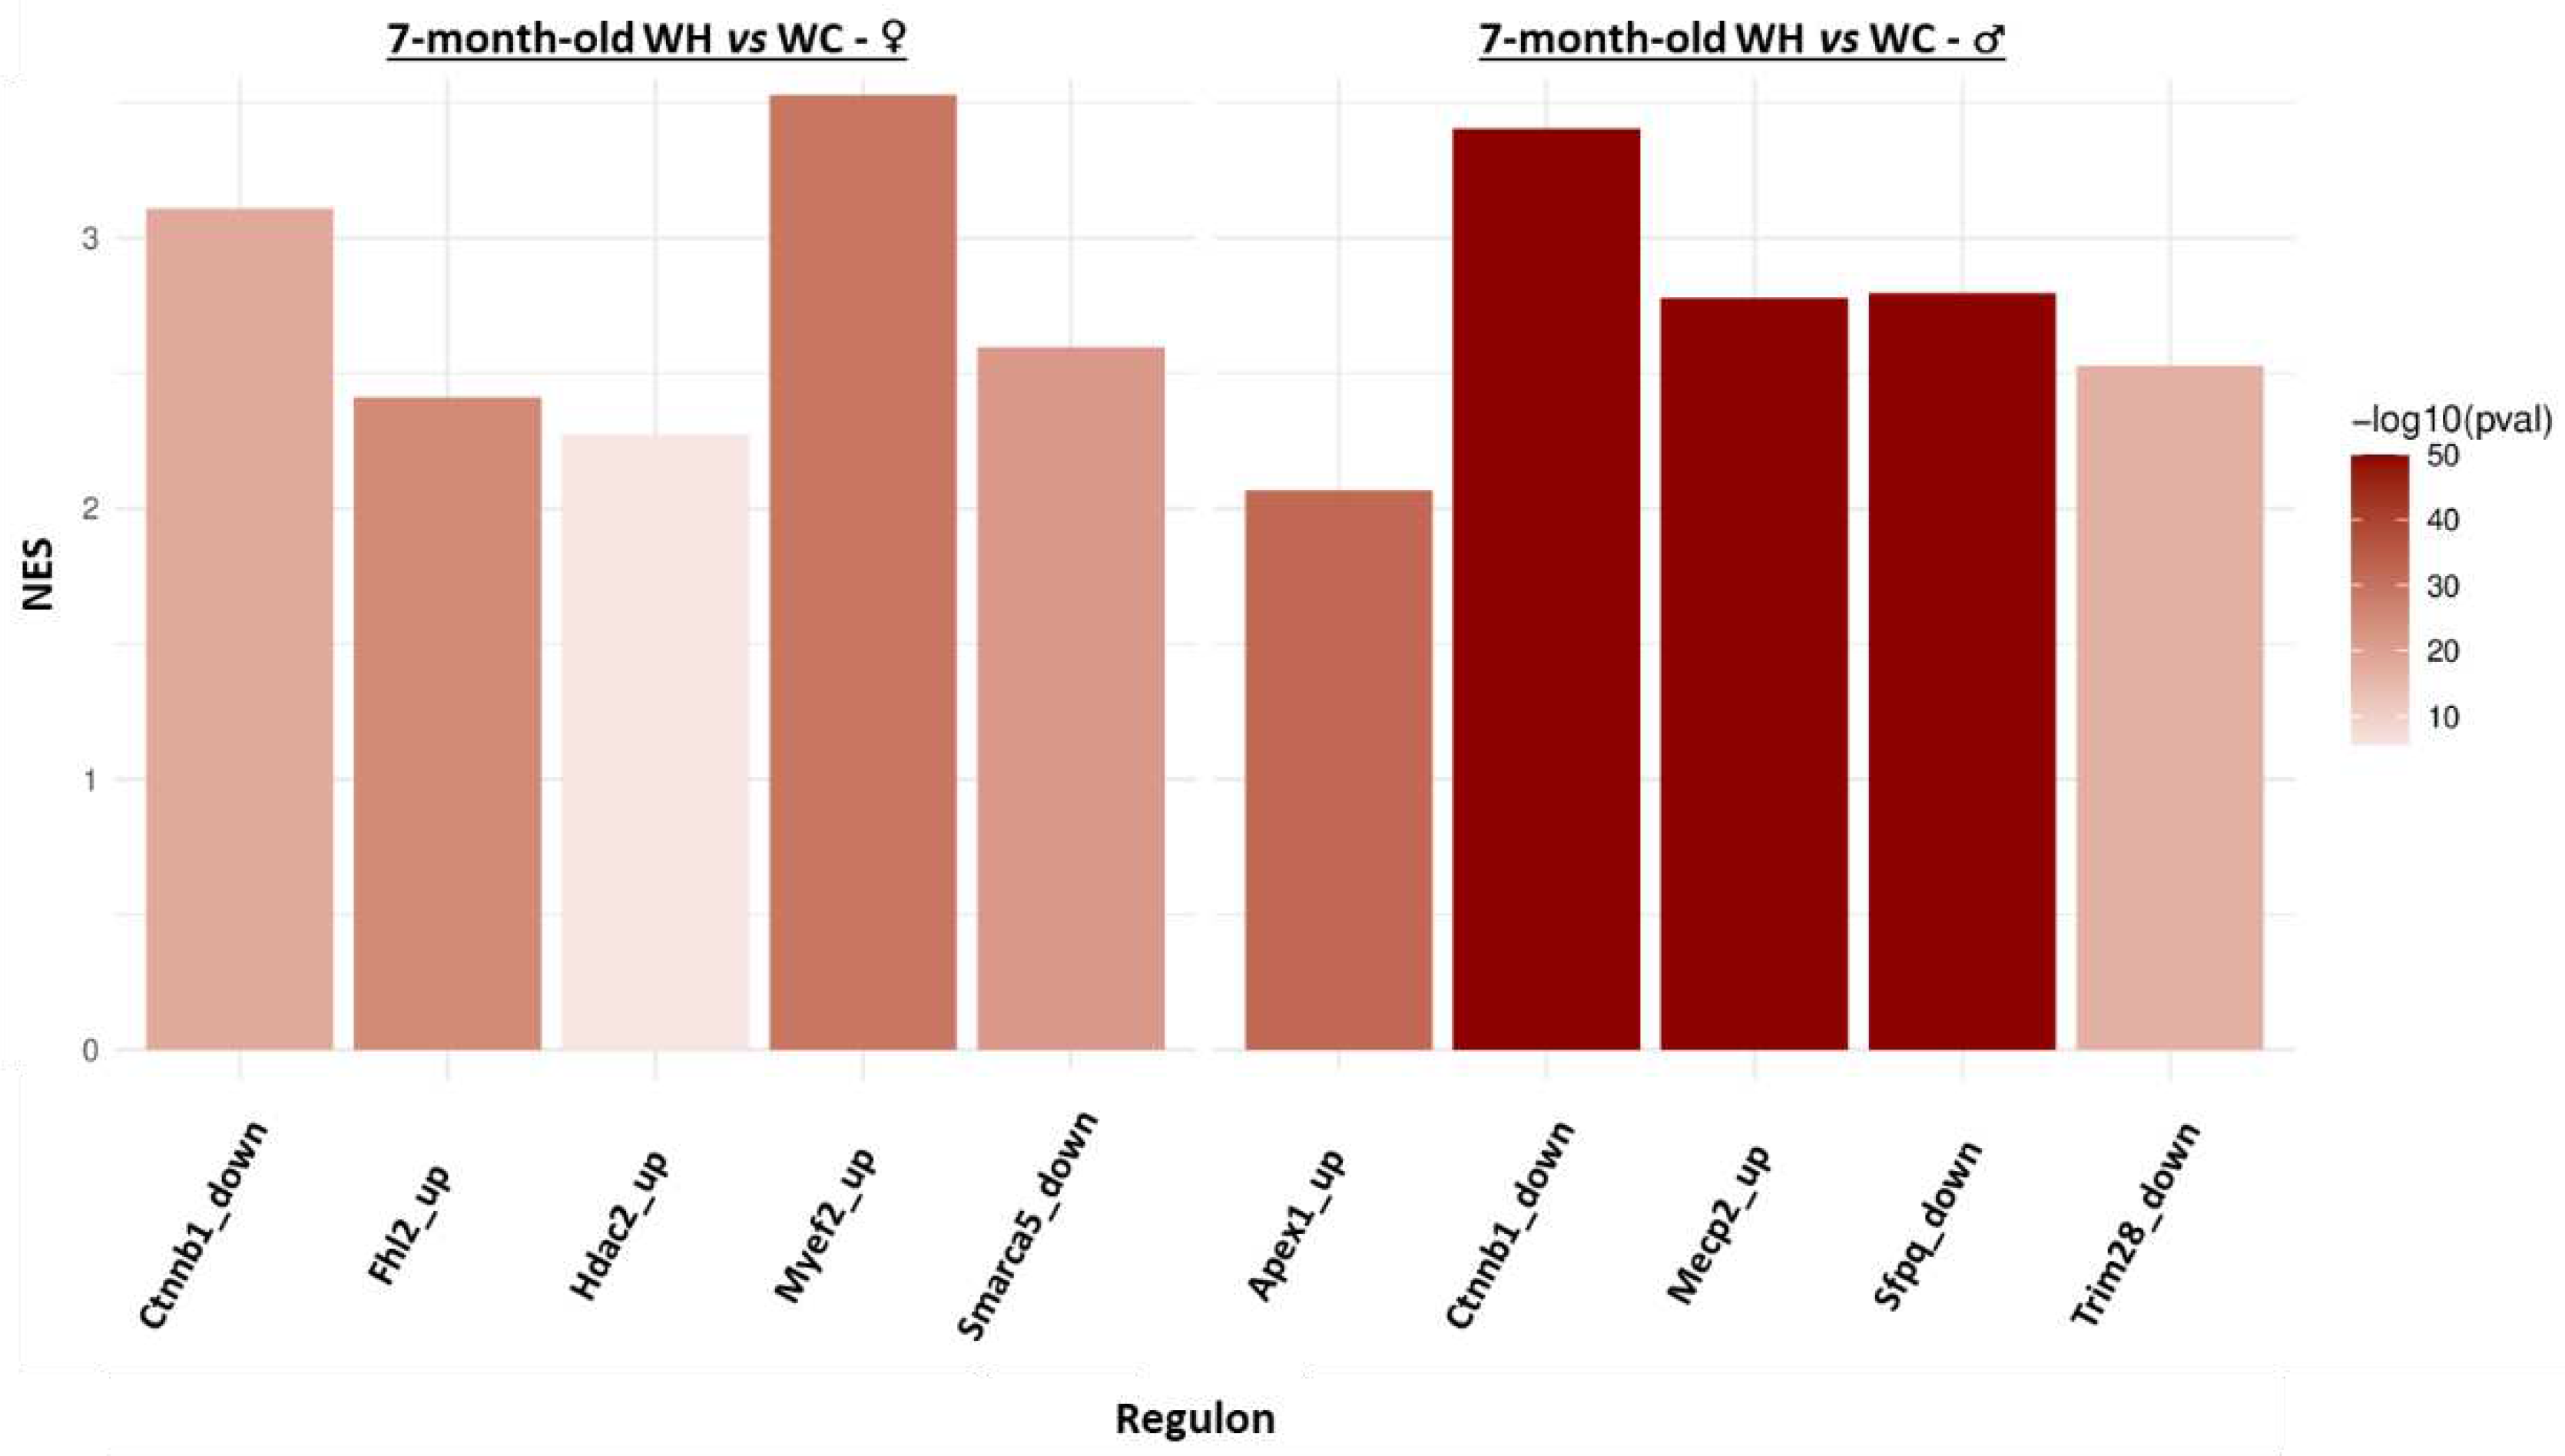
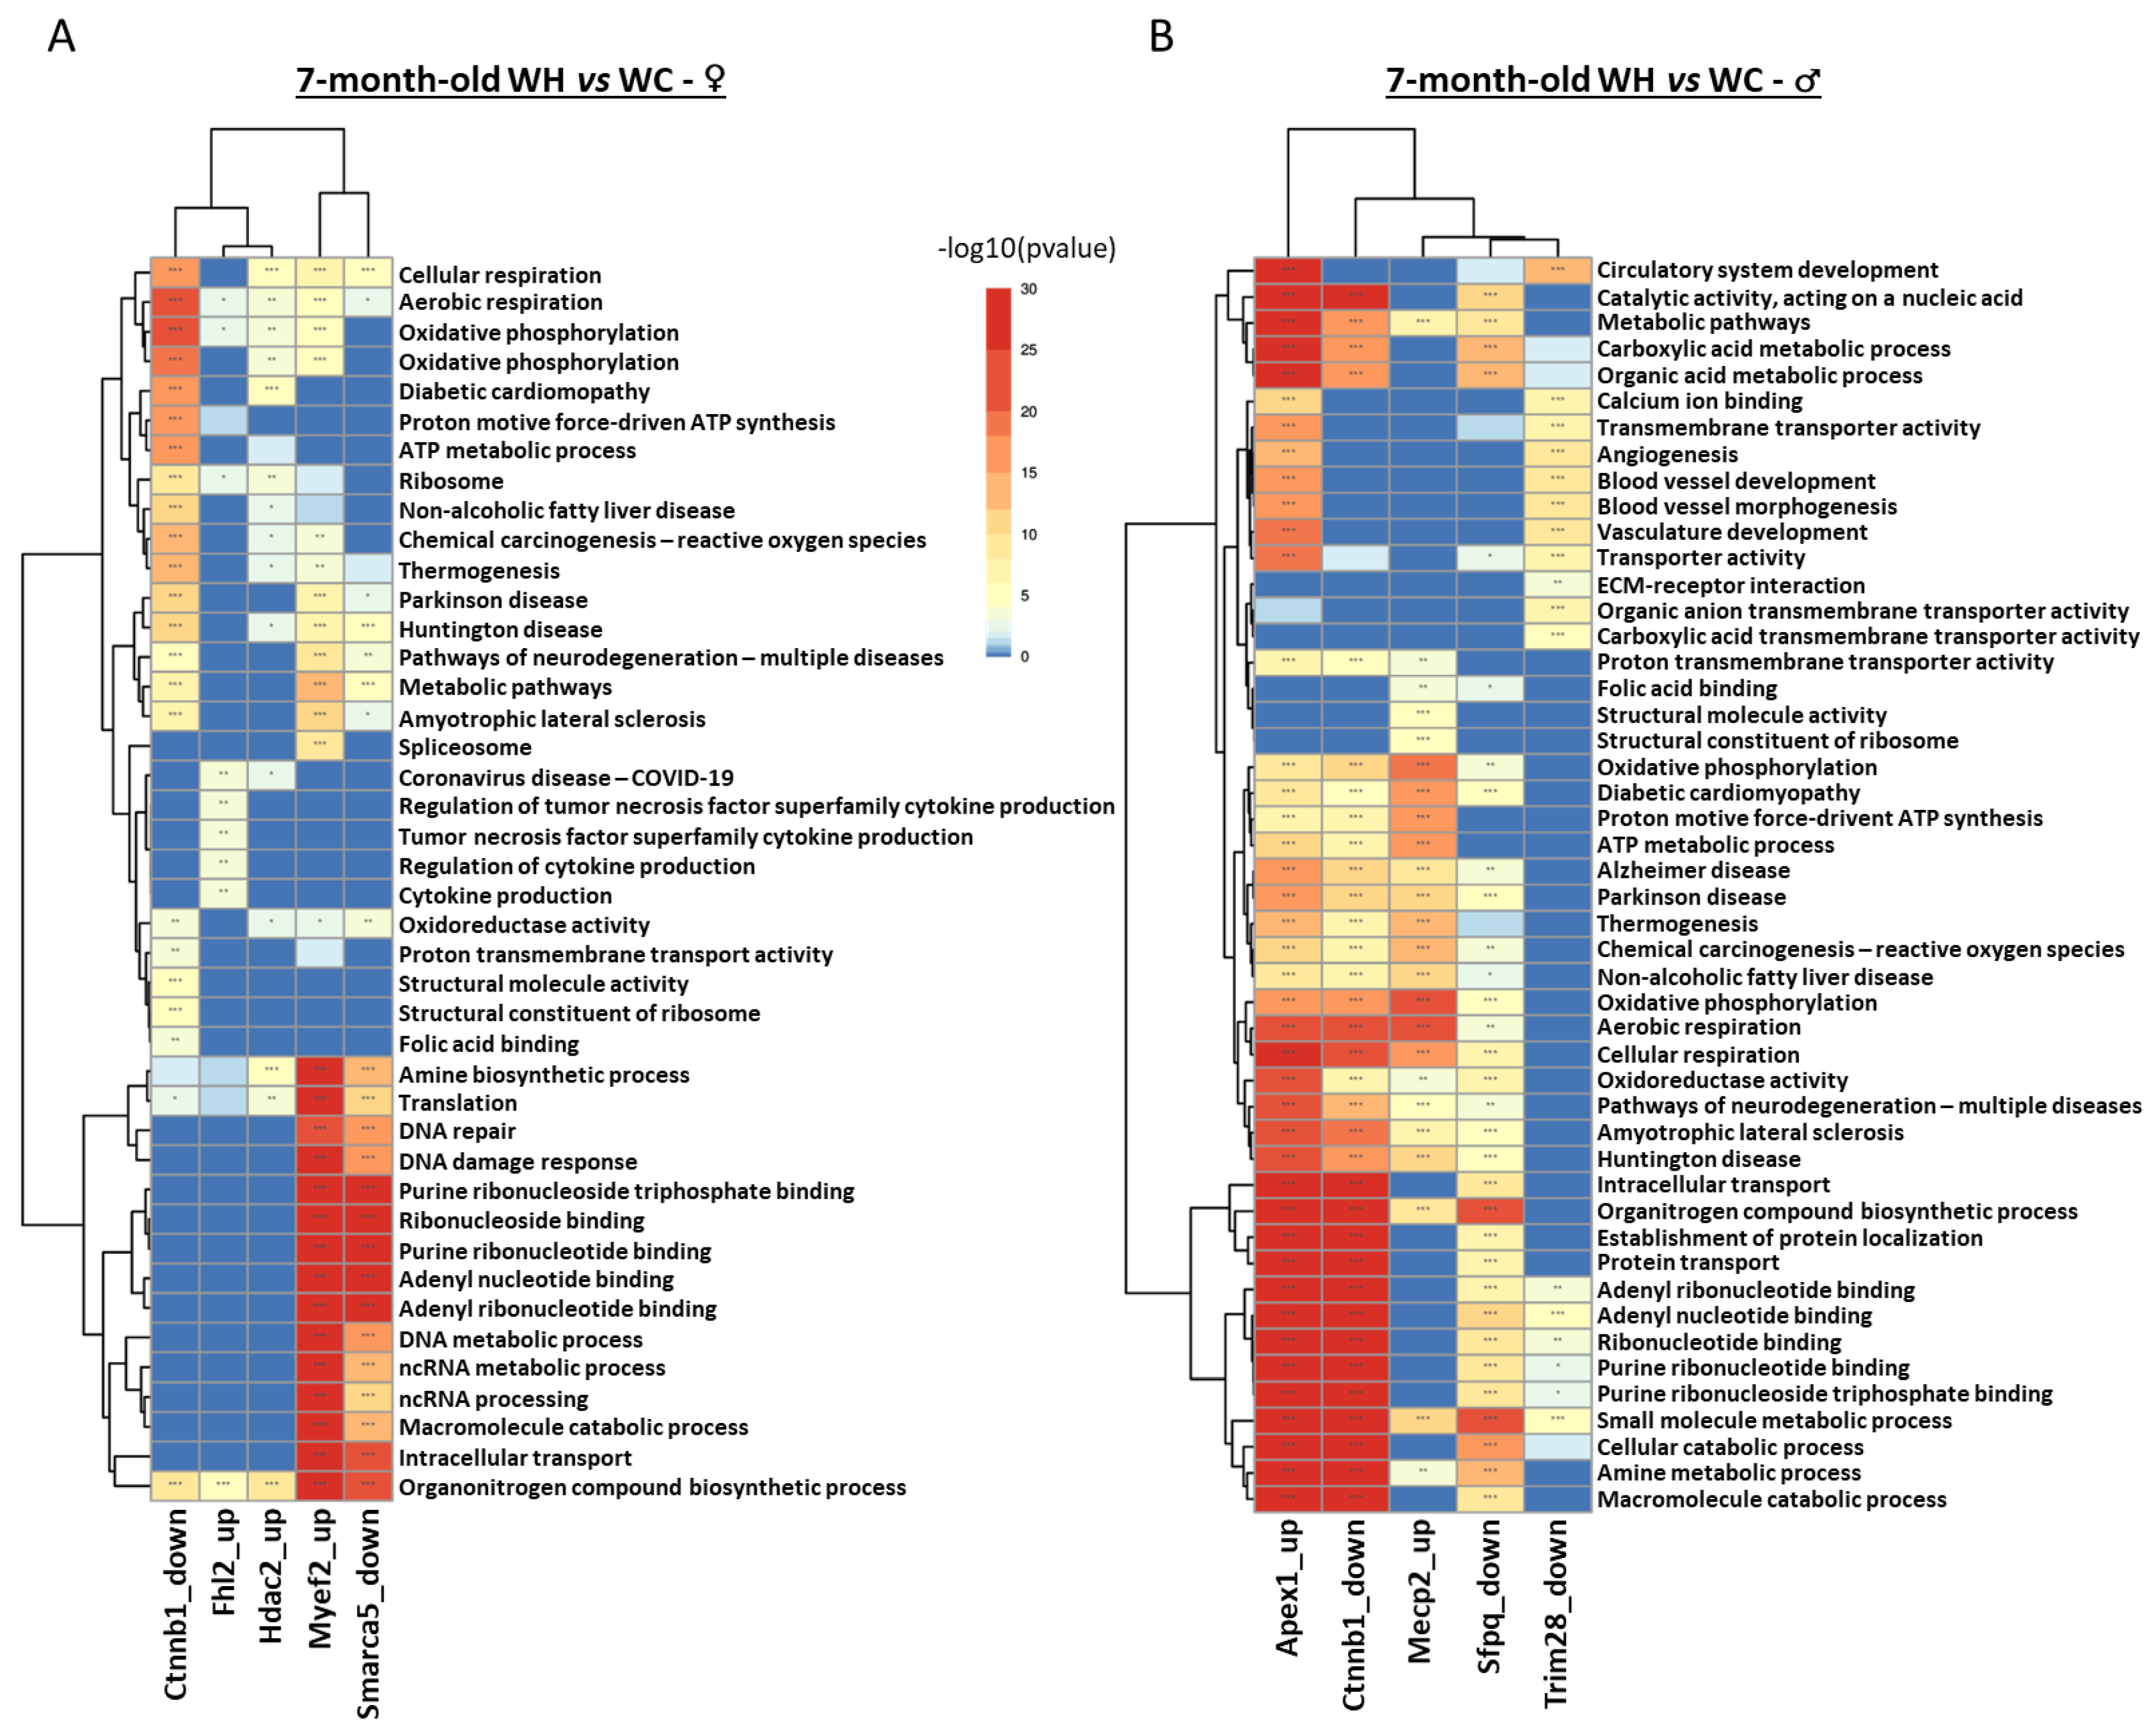
3.6. Identification of upstream regulators triggering changes in gene expression induced by maternal high-fat diet
4. Discussion
Supplementary Materials
Author Contributions
Funding
Institution Review Board Statement
Acknowledgments
Conflicts of Interest
References
- World Health Organization Obesity and Overweight.
- Chen, C.; Xu, X.; Yan, Y. Estimated Global Overweight and Obesity Burden in Pregnant Women Based on Panel Data Model. PLOS ONE 2018, 13, e0202183. [Google Scholar] [CrossRef] [PubMed]
- Flegal, K.M.; Carroll, M.D.; Kit, B.K.; Ogden, C.L. Prevalence of Obesity and Trends in the Distribution of Body Mass Index Among US Adults, 1999-2010. JAMA 2012, 307, 491–497. [Google Scholar] [CrossRef]
- Strauss, A. Obesity in Pregnant Women: Maternal, Fetal, and Transgenerational Consequences. Eur J Clin Nutr 2021, 75, 1681–1683. [Google Scholar] [CrossRef]
- Gaillard, R.; Durmuş, B.; Hofman, A.; Mackenbach, J.P.; Steegers, E.A.P.; Jaddoe, V.W.V. Risk Factors and Outcomes of Maternal Obesity and Excessive Weight Gain during Pregnancy. Obesity (Silver Spring) 2013, 21, 1046–1055. [Google Scholar] [CrossRef] [PubMed]
- Barker, D.J.P. The Origins of the Developmental Origins Theory. Journal of Internal Medicine 2007, 261, 412–417. [Google Scholar] [CrossRef]
- Barker, D.J.P.; Osmond, C.; Winter, P.D.; Margetts, B.; Simmonds, S.J. WEIGHT IN INFANCY AND DEATH FROM ISCHAEMIC HEART DISEASE. The Lancet 1989, 334, 577–580. [Google Scholar] [CrossRef]
- Heslehurst, N.; Vieira, R.; Akhter, Z.; Bailey, H.; Slack, E.; Ngongalah, L.; Pemu, A.; Rankin, J. The Association between Maternal Body Mass Index and Child Obesity: A Systematic Review and Meta-Analysis. PLOS Medicine 2019, 16, e1002817. [Google Scholar] [CrossRef]
- Li, M.; Sloboda, D.M.; Vickers, M.H. Maternal Obesity and Developmental Programming of Metabolic Disorders in Offspring: Evidence from Animal Models. Exp Diabetes Res 2011, 2011, 592408. [Google Scholar] [CrossRef]
- Sanchez, C.E.; Barry, C.; Sabhlok, A.; Russell, K.; Majors, A.; Kollins, S.H.; Fuemmeler, B.F. Maternal Pre-Pregnancy Obesity and Child Neurodevelopmental Outcomes: A Meta-Analysis. Obes Rev 2018, 19, 464–484. [Google Scholar] [CrossRef] [PubMed]
- Menting, M.D.; van de Beek, C.; Mintjens, S.; Wever, K.E.; Korosi, A.; Ozanne, S.E.; Limpens, J.; Roseboom, T.J.; Hooijmans, C.; Painter, R.C. The Link between Maternal Obesity and Offspring Neurobehavior: A Systematic Review of Animal Experiments. Neuroscience & Biobehavioral Reviews 2019, 98, 107–121. [Google Scholar] [CrossRef]
- Contu, L.; Hawkes, C.A. A Review of the Impact of Maternal Obesity on the Cognitive Function and Mental Health of the Offspring. International Journal of Molecular Sciences 2017, 18, 1093. [Google Scholar] [CrossRef]
- Soto, M.; Cai, W.; Konishi, M.; Kahn, C.R. Insulin Signaling in the Hippocampus and Amygdala Regulates Metabolism and Neurobehavior. Proc Natl Acad Sci U S A 2019, 116, 6379–6384. [Google Scholar] [CrossRef] [PubMed]
- Page, K.C.; Anday, E.K. Dietary Exposure to Excess Saturated Fat During Early Life Alters Hippocampal Gene Expression and Increases Risk for Behavioral Disorders in Adulthood. Frontiers in Neuroscience 2020, 14. [Google Scholar] [CrossRef] [PubMed]
- Dias, C.T.; Curi, H.T.; Payolla, T.B.; Lemes, S.F.; Betim Pavan, I.C.; Torsoni, M.A.; Simabuco, F.M.; Lambertucci, R.H.; Mendes da Silva, C. Maternal High-Fat Diet Stimulates Proinflammatory Pathway and Increases the Expression of Tryptophan Hydroxylase 2 (TPH2) and Brain-Derived Neurotrophic Factor (BDNF) in Adolescent Mice Hippocampus. Neurochemistry International 2020, 139, 104781. [Google Scholar] [CrossRef] [PubMed]
- Bordeleau, M.; Lacabanne, C.; Fernández de Cossío, L.; Vernoux, N.; Savage, J.C.; González-Ibáñez, F.; Tremblay, M.-È. Microglial and Peripheral Immune Priming Is Partially Sexually Dimorphic in Adolescent Mouse Offspring Exposed to Maternal High-Fat Diet. Journal of Neuroinflammation 2020, 17, 264. [Google Scholar] [CrossRef]
- Lin, C.; Lin, Y.; Luo, J.; Yu, J.; Cheng, Y.; Wu, X.; Lin, L.; Lin, Y. Maternal High-Fat Diet Multigenerationally Impairs Hippocampal Synaptic Plasticity and Memory in Male Rat Offspring. Endocrinology 2021, 162, bqaa214. [Google Scholar] [CrossRef]
- Premachandran, H.; Zhao, M.; Arruda-Carvalho, M. Sex Differences in the Development of the Rodent Corticolimbic System. Frontiers in Neuroscience 2020, 14. [Google Scholar] [CrossRef]
- Glendining, K.A.; Higgins, M.B.A.; Fisher, L.C.; Jasoni, C.L. Maternal Obesity Modulates Sexually Dimorphic Epigenetic Regulation and Expression of Leptin Receptor in Offspring Hippocampus. Brain Behav Immun 2020, 88, 151–160. [Google Scholar] [CrossRef] [PubMed]
- Fernandes, D.J.; Spring, S.; Roy, A.R.; Qiu, L.R.; Yee, Y.; Nieman, B.J.; Lerch, J.P.; Palmert, M.R. Exposure to Maternal High-Fat Diet Induces Extensive Changes in the Brain of Adult Offspring. Transl Psychiatry 2021, 11, 1–9. [Google Scholar] [CrossRef] [PubMed]
- Aiken, C.E.; Ozanne, S.E. Sex Differences in Developmental Programming Models. Reproduction 2013, 145, R1–13. [Google Scholar] [CrossRef]
- Rodríguez-González, G.L.; Bautista, C.J.; Rojas-Torres, K.I.; Nathanielsz, P.W.; Zambrano, E. Importance of the Lactation Period in Developmental Programming in Rodents. Nutr Rev 2020, 78, 32–47. [Google Scholar] [CrossRef] [PubMed]
- Sun, B.; Purcell, R.H.; Terrillion, C.E.; Yan, J.; Moran, T.H.; Tamashiro, K.L.K. Maternal High-Fat Diet During Gestation or Suckling Differentially Affects Offspring Leptin Sensitivity and Obesity. Diabetes 2012, 61, 2833–2841. [Google Scholar] [CrossRef] [PubMed]
- Semple, B.D.; Blomgren, K.; Gimlin, K.; Ferriero, D.M.; Noble-Haeusslein, L.J. Brain Development in Rodents and Humans: Identifying Benchmarks of Maturation and Vulnerability to Injury across Species. Progress in Neurobiology 2013, 106–107, 1–16. [Google Scholar] [CrossRef]
- Li, M.; Su, S.; Cai, W.; Cao, J.; Miao, X.; Zang, W.; Gao, S.; Xu, Y.; Yang, J.; Tao, Y.-X.; et al. Differentially Expressed Genes in the Brain of Aging Mice With Cognitive Alteration and Depression- and Anxiety-Like Behaviors. Frontiers in Cell and Developmental Biology 2020, 8. [Google Scholar] [CrossRef] [PubMed]
- Lu, Y.; Xu, K.; Lin, D.; Wang, S.; Fu, R.; Deng, X.; Croppi, G.; Zhang, J. Multi-Omics Analysis Reveals Neuroinflammation, Activated Glial Signaling, and Dysregulated Synaptic Signaling and Metabolism in the Hippocampus of Aged Mice. Frontiers in Aging Neuroscience 2022, 14. [Google Scholar] [CrossRef]
- Dobin, A.; Davis, C.A.; Schlesinger, F.; Drenkow, J.; Zaleski, C.; Jha, S.; Batut, P.; Chaisson, M.; Gingeras, T.R. STAR: Ultrafast Universal RNA-Seq Aligner. Bioinformatics 2013, 29, 15–21. [Google Scholar] [CrossRef]
- Anders, S.; Pyl, P.T.; Huber, W. HTSeq--a Python Framework to Work with High-Throughput Sequencing Data. Bioinformatics 2015, 31, 166–169. [Google Scholar] [CrossRef]
- Benjamini, Y.; Hochberg, Y. Controlling the False Discovery Rate: A Practical and Powerful Approach to Multiple Testing. Journal of the Royal Statistical Society. Series B (Methodological) 1995, 57, 289–300. [Google Scholar] [CrossRef]
- Cox, J.; Mann, M. MaxQuant Enables High Peptide Identification Rates, Individualized p.p.b.-Range Mass Accuracies and Proteome-Wide Protein Quantification. Nat Biotechnol 2008, 26, 1367–1372. [Google Scholar] [CrossRef]
- Cox, J.; Hein, M.Y.; Luber, C.A.; Paron, I.; Nagaraj, N.; Mann, M. Accurate Proteome-Wide Label-Free Quantification by Delayed Normalization and Maximal Peptide Ratio Extraction, Termed MaxLFQ. Mol Cell Proteomics 2014, 13, 2513–2526. [Google Scholar] [CrossRef]
- Tyanova, S.; Temu, T.; Sinitcyn, P.; Carlson, A.; Hein, M.Y.; Geiger, T.; Mann, M.; Cox, J. The Perseus Computational Platform for Comprehensive Analysis of (Prote)Omics Data. Nat Methods 2016, 13, 731–740. [Google Scholar] [CrossRef] [PubMed]
- Perez-Riverol, Y.; Bai, J.; Bandla, C.; García-Seisdedos, D.; Hewapathirana, S.; Kamatchinathan, S.; Kundu, D.J.; Prakash, A.; Frericks-Zipper, A.; Eisenacher, M.; et al. The PRIDE Database Resources in 2022: A Hub for Mass Spectrometry-Based Proteomics Evidences. Nucleic Acids Res 2022, 50, D543–D552. [Google Scholar] [CrossRef]
- Aibar, S.; González-Blas, C.B.; Moerman, T.; Huynh-Thu, V.A.; Imrichova, H.; Hulselmans, G.; Rambow, F.; Marine, J.-C.; Geurts, P.; Aerts, J.; et al. SCENIC: Single-Cell Regulatory Network Inference and Clustering. Nat Methods 2017, 14, 1083–1086. [Google Scholar] [CrossRef] [PubMed]
- Huynh-Thu, V.A.; Irrthum, A.; Wehenkel, L.; Geurts, P. Inferring Regulatory Networks from Expression Data Using Tree-Based Methods. PLoS One 2010, 5, e12776. [Google Scholar] [CrossRef]
- Han, H.; Cho, J.-W.; Lee, S.; Yun, A.; Kim, H.; Bae, D.; Yang, S.; Kim, C.Y.; Lee, M.; Kim, E.; et al. TRRUST v2: An Expanded Reference Database of Human and Mouse Transcriptional Regulatory Interactions. Nucleic Acids Res 2018, 46, D380–D386. [Google Scholar] [CrossRef]
- Korotkevich, G.; Sukhov, V.; Budin, N.; Shpak, B.; Artyomov, M.N.; Sergushichev, A. Fast Gene Set Enrichment Analysis 2021, 060012.
- Tozuka, Y.; Kumon, M.; Wada, E.; Onodera, M.; Mochizuki, H.; Wada, K. Maternal Obesity Impairs Hippocampal BDNF Production and Spatial Learning Performance in Young Mouse Offspring. Neurochemistry International 2010, 57, 235–247. [Google Scholar] [CrossRef] [PubMed]
- Robb, J.-L.; Messa, I.; Lui, E.; Yeung, D.; Thacker, J.; Satvat, E.; Mielke, J.G. A Maternal Diet High in Saturated Fat Impairs Offspring Hippocampal Function in a Sex-Specific Manner. Behavioural Brain Research 2017, 326, 187–199. [Google Scholar] [CrossRef] [PubMed]
- Ojeda, D.A.; Hutton, O.; Hopkins, R.; Cagampang, F.; Smyth, N.R.; Fleming, T.P.; Eckert, J.; Willaime-Morawek, S. Preimplantation or Gestation/Lactation High-Fat Diet Alters Adult Offspring Metabolism and Neurogenesis. Brain Commun 2023, 5, fcad093. [Google Scholar] [CrossRef]
- Lieberwirth, C.; Pan, Y.; Liu, Y.; Zhang, Z.; Wang, Z. HIPPOCAMPAL ADULT NEUROGENESIS: ITS REGULATION AND POTENTIAL ROLE IN SPATIAL LEARNING AND MEMORY. Brain Res 2016, 1644, 127–140. [Google Scholar] [CrossRef]
- Vogt, M.C.; Paeger, L.; Hess, S.; Steculorum, S.M.; Awazawa, M.; Hampel, B.; Neupert, S.; Nicholls, H.T.; Mauer, J.; Hausen, A.C.; et al. Neonatal Insulin Action Impairs Hypothalamic Neurocircuit Formation in Response to Maternal High-Fat Feeding. Cell 2014, 156, 495–509. [Google Scholar] [CrossRef]
- Song, L.; Cui, J.; Wang, R.; Wang, N.; Yan, J.; Sun, B. Maternal Exercise and High-Fat Diet Affect Hypothalamic Neural Projections in Rat Offspring in a Sex-Specific Manner. The Journal of Nutritional Biochemistry 2022, 103, 108958. [Google Scholar] [CrossRef]
- da Silva, R.K.B.; de Vasconcelos, D.A.A.; da Silva, A.V.E.; da Silva, R.P.B.; de Oliveira Neto, O.B.; Galindo, L.C.M. Effects of Maternal High-Fat Diet on the Hypothalamic Components Related to Food Intake and Energy Expenditure in Mice Offspring. Life Sci 2022, 307, 120880. [Google Scholar] [CrossRef]
- Surget, A.; Belzung, C. Adult Hippocampal Neurogenesis Shapes Adaptation and Improves Stress Response: A Mechanistic and Integrative Perspective. Mol Psychiatry 2022, 27, 403–421. [Google Scholar] [CrossRef] [PubMed]
- Elkind, D.; Hochgerner, H.; Aloni, E.; Shental, N.; Zeisel, A. Sex, Strain, and Lateral Differences in Brain Cytoarchitecture across a Large Mouse Population. eLife 2023, 12, e82376. [Google Scholar] [CrossRef] [PubMed]
- Bundy, J.L.; Vied, C.; Nowakowski, R.S. Sex Differences in the Molecular Signature of the Developing Mouse Hippocampus. BMC Genomics 2017, 18, 237. [Google Scholar] [CrossRef]
- Ribaroff, G.A.; Wastnedge, E.; Drake, A.J.; Sharpe, R.M.; Chambers, T.J.G. Animal Models of Maternal High Fat Diet Exposure and Effects on Metabolism in Offspring: A Meta-regression Analysis. Obes Rev 2017, 18, 673–686. [Google Scholar] [CrossRef]
- Purcell, R.H.; Sun, B.; Pass, L.L.; Power, M.L.; Moran, T.H.; Tamashiro, K.L.K. Maternal Stress and High-Fat Diet Effect on Maternal Behavior, Milk Composition, and Pup Ingestive Behavior. Physiol Behav 2011, 104, 474–479. [Google Scholar] [CrossRef] [PubMed]
- Chen, Y.; Wang, J.; Yang, S.; Utturkar, S.; Crodian, J.; Cummings, S.; Thimmapuram, J.; San Miguel, P.; Kuang, S.; Gribskov, M.; et al. Effect of High-Fat Diet on Secreted Milk Transcriptome in Midlactation Mice. Physiological Genomics 2017, 49, 747–762. [Google Scholar] [CrossRef]
- Winther, G.; Elfving, B.; Müller, H.K.; Lund, S.; Wegener, G. Maternal High-Fat Diet Programs Offspring Emotional Behavior in Adulthood. Neuroscience 2018, 388, 87–101. [Google Scholar] [CrossRef]
- Dearden, L.; Balthasar, N. Sexual Dimorphism in Offspring Glucose-Sensitive Hypothalamic Gene Expression and Physiological Responses to Maternal High-Fat Diet Feeding. Endocrinology 2014, 155, 2144–2154. [Google Scholar] [CrossRef]
- Rodríguez-González, G.L.; De Los Santos, S.; Méndez-Sánchez, D.; Reyes-Castro, L.A.; Ibáñez, C.A.; Canto, P.; Zambrano, E. High-Fat Diet Consumption by Male Rat Offspring of Obese Mothers Exacerbates Adipose Tissue Hypertrophy and Metabolic Alterations in Adult Life. Br J Nutr 2023, 130, 783–792. [Google Scholar] [CrossRef]
- Oken, E.; Thompson, J.W.; Rifas-Shiman, S.L.; Vilchuk, K.; Bogdanovich, N.; Hameza, M.; Yang, S.; Patel, R.; Kramer, M.S.; Martin, R.M. Analysis of Maternal Prenatal Weight and Offspring Cognition and Behavior: Results From the Promotion of Breastfeeding Intervention Trial (PROBIT) Cohort. JAMA Network Open 2021, 4, e2121429. [Google Scholar] [CrossRef]
- Mizera, J.; Kazek, G.; Pomierny, B.; Bystrowska, B.; Niedzielska-Andres, E.; Pomierny-Chamiolo, L. Maternal High-Fat Diet During Pregnancy and Lactation Disrupts NMDA Receptor Expression and Spatial Memory in the Offspring. Mol Neurobiol 2022, 59, 5695–5721. [Google Scholar] [CrossRef] [PubMed]
- Gabory, A.; Ferry, L.; Fajardy, I.; Jouneau, L.; Gothié, J.-D.; Vigé, A.; Fleur, C.; Mayeur, S.; Gallou-Kabani, C.; Gross, M.-S.; et al. Maternal Diets Trigger Sex-Specific Divergent Trajectories of Gene Expression and Epigenetic Systems in Mouse Placenta. PLoS One 2012, 7, e47986. [Google Scholar] [CrossRef] [PubMed]
- Hatanaka, Y.; Wada, K.; Kabuta, T. Maternal High-Fat Diet Leads to Persistent Synaptic Instability in Mouse Offspring via Oxidative Stress during Lactation. Neurochemistry International 2016, 97, 99–108. [Google Scholar] [CrossRef] [PubMed]
- Janthakhin, Y.; Rincel, M.; Costa, A.-M.; Darnaudéry, M.; Ferreira, G. Maternal High-Fat Diet Leads to Hippocampal and Amygdala Dendritic Remodeling in Adult Male Offspring. Psychoneuroendocrinology 2017, 83, 49–57. [Google Scholar] [CrossRef] [PubMed]
- Claycombe-Larson, K.J.; Bundy, A.N.; Kuntz, T.; Hur, J.; Yeater, K.M.; Casperson, S.; Brunelle, D.C.; Roemmich, J.N. Effect of a Maternal High-Fat Diet with Vegetable Substitution on Fetal Brain Transcriptome. The Journal of Nutritional Biochemistry 2022, 108, 109088. [Google Scholar] [CrossRef]
- Sun, N.; Youle, R.J.; Finkel, T. The Mitochondrial Basis of Aging. Mol Cell 2016, 61, 654–666. [Google Scholar] [CrossRef]
- Olesen, M.A.; Torres, A.K.; Jara, C.; Murphy, M.P.; Tapia-Rojas, C. Premature Synaptic Mitochondrial Dysfunction in the Hippocampus during Aging Contributes to Memory Loss. Redox Biol 2020, 34, 101558. [Google Scholar] [CrossRef]
- Area-Gomez, E.; Guardia-Laguarta, C.; Schon, E.A.; Przedborski, S. Mitochondria, OxPhos, and Neurodegeneration: Cells Are Not Just Running out of Gas. J Clin Invest 2019, 129, 34–45. [Google Scholar] [CrossRef]
- Sharma, C.; Kim, S.; Nam, Y.; Jung, U.J.; Kim, S.R. Mitochondrial Dysfunction as a Driver of Cognitive Impairment in Alzheimer’s Disease. Int J Mol Sci 2021, 22, 4850. [Google Scholar] [CrossRef]
- Huang, H.-M.; Wu, C.-W.; Chen, I.-C.; Lee, Y.-C.; Huang, Y.-S.; Hung, C.-Y.; Wu, K.L.H. Maternal High-Fructose Diet Induced Early-Onset Retinopathy via the Suppression of Synaptic Plasticity Mediated by Mitochondrial Dysfunction. Am J Physiol Endocrinol Metab 2021, 320, E1173–E1182. [Google Scholar] [CrossRef] [PubMed]
- Stocher, D.P.; Klein, C.P.; Saccomori, A.B.; August, P.M.; Martins, N.C.; Couto, P.R.G.; Hagen, M.E.K.; Matté, C. Maternal High-Salt Diet Alters Redox State and Mitochondrial Function in Newborn Rat Offspring’s Brain. Br J Nutr 2018, 119, 1003–1011. [Google Scholar] [CrossRef] [PubMed]
- Stevanović-Silva, J.; Beleza, J.; Coxito, P.; Oliveira, P.J.; Ascensão, A.; Magalhães, J. Gestational Exercise Antagonises the Impact of Maternal High-Fat High-Sucrose Diet on Liver Mitochondrial Alterations and Quality Control Signalling in Male Offspring. Int J Environ Res Public Health 2023, 20, 1388. [Google Scholar] [CrossRef] [PubMed]
- Manczak, M.; Jung, Y.; Park, B.S.; Partovi, D.; Reddy, P.H. Time-Course of Mitochondrial Gene Expressions in Mice Brains: Implications for Mitochondrial Dysfunction, Oxidative Damage, and Cytochrome c in Aging. J Neurochem 2005, 92, 494–504. [Google Scholar] [CrossRef]
- Mortensen, O.H.; Larsen, L.H.; Ørstrup, L.K.H.; Hansen, L.H.L.; Grunnet, N.; Quistorff, B. Developmental Programming by High Fructose Decreases Phosphorylation Efficiency in Aging Offspring Brain Mitochondria, Correlating with Enhanced UCP5 Expression. J Cereb Blood Flow Metab 2014, 34, 1205–1211. [Google Scholar] [CrossRef]
- Todorova, V.; Blokland, A. Mitochondria and Synaptic Plasticity in the Mature and Aging Nervous System. Curr Neuropharmacol 2017, 15, 166–173. [Google Scholar] [CrossRef]
- DeMars, K.M.; Ross, M.R.; Starr, A.; McIntyre, J.C. Neuronal Primary Cilia Integrate Peripheral Signals with Metabolic Drives. Frontiers in Physiology 2023, 14. [Google Scholar] [CrossRef]
- Rhee, S.; Kirschen, G.W.; Gu, Y.; Ge, S. Depletion of Primary Cilia from Mature Dentate Granule Cells Impairs Hippocampus-Dependent Contextual Memory. Sci Rep 2016, 6, 34370. [Google Scholar] [CrossRef]
- Youn, Y.H.; Han, Y.-G. Primary Cilia in Brain Development and Diseases. Am J Pathol 2018, 188, 11–22. [Google Scholar] [CrossRef]
- Zhang, X.; Wei, X.; Mei, Y.; Wang, D.; Wang, J.; Zhang, Y.; Li, X.; Gu, Y.; Peng, G.; Sun, B. Modulating Adult Neurogenesis Affects Synaptic Plasticity and Cognitive Functions in Mouse Models of Alzheimer’s Disease. Stem Cell Reports 2021, 16, 3005–3019. [Google Scholar] [CrossRef]
- Leiter, O.; Zhuo, Z.; Rust, R.; Wasielewska, J.M.; Grönnert, L.; Kowal, S.; Overall, R.W.; Adusumilli, V.S.; Blackmore, D.G.; Southon, A.; et al. Selenium Mediates Exercise-Induced Adult Neurogenesis and Reverses Learning Deficits Induced by Hippocampal Injury and Aging. Cell Metab 2022, 34, 408–423.e8. [Google Scholar] [CrossRef]
- Hill, A.S.; Sahay, A.; Hen, R. Increasing Adult Hippocampal Neurogenesis Is Sufficient to Reduce Anxiety and Depression-Like Behaviors. Neuropsychopharmacology 2015, 40, 2368–2378. [Google Scholar] [CrossRef] [PubMed]
- Natale, F.; Spinelli, M.; Barbati, S.A.; Leone, L.; Fusco, S.; Grassi, C. High Fat Diet Multigenerationally Affects Hippocampal Neural Stem Cell Proliferation via Epigenetic Mechanisms. Cells 2022, 11, 2661. [Google Scholar] [CrossRef]
- Fabianová, K.; Babeľová, J.; Fabian, D.; Popovičová, A.; Martončíková, M.; Raček, A.; Račeková, E. Maternal High-Energy Diet during Pregnancy and Lactation Impairs Neurogenesis and Alters the Behavior of Adult Offspring in a Phenotype-Dependent Manner. Int J Mol Sci 2022, 23, 5564. [Google Scholar] [CrossRef]
- Naninck, E.F.G.; Hoeijmakers, L.; Kakava-Georgiadou, N.; Meesters, A.; Lazic, S.E.; Lucassen, P.J.; Korosi, A. Chronic Early Life Stress Alters Developmental and Adult Neurogenesis and Impairs Cognitive Function in Mice. Hippocampus 2015, 25, 309–328. [Google Scholar] [CrossRef] [PubMed]
- Zapalska-Sozoniuk, M.; Chrobak, L.; Kowalczyk, K.; Kankofer, M. Is It Useful to Use Several “Omics” for Obtaining Valuable Results? Mol Biol Rep 2019, 46, 3597–3606. [Google Scholar] [CrossRef] [PubMed]

Disclaimer/Publisher’s Note: The statements, opinions and data contained in all publications are solely those of the individual author(s) and contributor(s) and not of MDPI and/or the editor(s). MDPI and/or the editor(s) disclaim responsibility for any injury to people or property resulting from any ideas, methods, instructions or products referred to in the content. |
© 2023 by the authors. Licensee MDPI, Basel, Switzerland. This article is an open access article distributed under the terms and conditions of the Creative Commons Attribution (CC BY) license (http://creativecommons.org/licenses/by/4.0/).


