Preprint
Article

Discharges in a Neotropical River: A Descriptive Study

Altmetrics

Downloads

76

Views

24

Comments

0

This version is not peer-reviewed

Submitted:

07 October 2023

Posted:

10 October 2023

You are already at the latest version

Alerts
Abstract
Puerto Rico is a neotropical island located in the Caribbean. Like other neotropical regions, Puerto Rico streams discharges can vary with the seasons, atmospheric events, and human activities. The Lapa River is part of the Puerto Rico Heritage Rivers Program. This program identifies and manages the protection of hydrographic systems that maintain their natural conditions. The necessity of increasing the knowledge of the natural processes of the Lapa River and providing valuable information for the development of a future management plan for the ecosystem, the following objectives were established in this research: (1) to describe the temporal variations in water discharges in the Lapa River and (2) to describe the impact of atmospheric events on the water discharges at the Lapa River. This study concluded that the highest annual discharge averages recorded from 1989 to 2021 in the Lapa River occurred in 2011 and 2017. 2011, the annual mean discharge was 31.20 (ft3/s); in 2017, the average was 40.44 (ft3/s). In terms of atmospheric events, this study concludes that, during the evaluated period, the highest discharge event occurred after the impact of hurricanes Irma and Maria, with an average discharge of 164.40 ft3/s in October and 182.60 ft3/s in September. This event set a precedent in the river Lapa’s discharges, impacting the river basin’s flora, fauna, and morphology from its headwaters downstream.
Keywords: 
Subject: Environmental and Earth Sciences  -   Environmental Science

1. Introduction

Rivers are continuous or intermittent watercourses that flow into other rivers, reservoirs, lakes, or the sea [1]. Their flow can fluctuate due to environmental variables such as precipitation and periods of drought. Neotropical rivers are ecosystems located in the Central America, South America, and some Caribbean regions [2,3]. These rivers are characterized by their biodiversity, geomorphology, and their presence in tropical or subtropical climates [2,3]. In terms of the ecosystem services these rivers provide, they include the provision of clean water, a source of food like fish and shrimp for human consumption, and habitats for numerous species of plants and animals [4,5]. Similarly, these natural spaces hold significant cultural value and offer opportunities for recreation, meditation, and inspiration [6,7]. Overall, the availability of ecosystem services from these rivers depends on multiple variables, including their discharges [8,9]. Over the past few decades, the discharges of these ecosystems have undergone changes due to anthropogenic impacts and the effects of global warming. For instance, the construction of dams, alterations to river channels, and excessive water usage represent some of the anthropogenic threats [6,10,11]. In terms of climate change, droughts and variations in rainfall patterns have also affected the flow of these rivers [6,12,13].

2. River Discharges in Puerto Rico

Puerto Rico is a tropical island in the Caribbean region with a land area of approximately 3435 square miles [14]. The island has 224 rivers and over 553 streams [14]. Most rivers originate in the Central Mountain Range, and the hydrological network comprises surface and groundwater streams [14,15,16,17]. Like other neotropical regions, Puerto Rico experiences various water discharges over time and space. These discharges can vary with the seasons, atmospheric events, climate change factors, and human activities. For example, discharge patterns in Puerto Rico are marked by the rainy and dry seasons [18]. Temporally, the rainy season typically begins in August and ends in November, while the dry season generally starts in December and concludes between April and May [18].
Yu and Gao [19] assessed the intra- and inter-annual variability in freshwater discharge in two tropical mountainous watersheds in Puerto Rico. Their study aimed to understand whether there is a long-term trend in water discharge variability and how climate variability impacts freshwater discharge in mountainous tropical watersheds. The results indicated that more significant seasonal variations in discharge are closely linked to increased annual mean rainfall. Interannual discharge variability over three years was influenced by changes in rainfall, variability in maximum temperature, and mean maximum and minimum temperatures. Overall, in Puerto Rico, water discharges in rivers tend to be higher during the rainy season compared to the dry season [18]. These discharges are primarily a result of rainfall, especially in the Central Mountain Range, which flows into lower-lying areas. During the dry season, some rivers receive base flow from groundwater sources, maintaining a minimum flow.
Significant flood discharges occur during extreme weather events such as hurricanes, tropical storms, and tropical waves. In Puerto Rico, heavy rains can rapidly raise river water levels, often resulting in flash floods [20,21,22]. Severe riverine flooding may involve significant erosion, sediment transportation, and sediment deposition. These processes can modify the characteristics of the river channel and the floodplain, thereby affecting their vulnerability to future flooding [23]. Li et al. [23] conducted a study in Puerto Rico using high-resolution LiDAR topography data collected before and after Hurricane Maria in September 2017. The research investigated how the extent and depth of 10- and 100-year floods changed in thirteen river sections following the hurricane. The findings revealed that the flood extent and depth altered by up to 7% and 16%, respectively, for 10-year floods and up to 4% and 8% for 100-year floods. These changes were generally more minor than the impacts of peak flow quantiles for the 100-year flood but more significant for 10-year events. The study suggests that in tropical hurricane-prone regions, the geomorphic changes caused by major storms should be factored into floodplain mapping and updates, particularly as climate change leads to more intense rainfall and flooding.
Impermeability caused by urban sprawl is a factor that increases wastewater discharge in Puerto Rico. In some urban areas where water drainage is obstructed, the sewer system has deficiencies, and there is a high degree of asphalt and concrete, surface waters tend to flow into river channels [24]. This problem typically occurs during heavy rain events that overwhelm sewage systems and wastewater treatment plants. Wastewater discharges can impact the rivers’ water quality and negatively affect biodiversity and public health. In terms of nutrient discharges, rivers transport nitrogen and phosphorus from natural processes within ecosystems and from rural areas where agricultural and livestock activities take place. The increase in these types of discharges disrupts natural ecosystems and leads to the death of their flora and fauna [24].
For instance, a study conducted by Sánchez-Colón, Y. M., & Schaffner [25] focused on Laguna Cartagena, a neotropical freshwater wetland in southwestern Puerto Rico, which has become eutrophic due to external nutrient input, primarily phosphorus, and historical agricultural practices. The research aimed to identify nonpoint sources of phosphorus (SRP and TP) and nitrogen (nitrate, nitrite, and ammonia) that enter the Laguna Cartagena, as well as the influence of precipitation events. The results revealed that the channelized waterways delivering water to the lagoon have high TP concentrations, classifying them as hypereutrophic (>100 μg/L) but relatively low nitrogen concentrations, categorizing them as oligotrophic (<200 μg/L). The primary nonpoint source of nutrient pollution in these water sources was agriculture (specifically rice and cattle farming) at the nearby University of Puerto Rico’s Lajas Agricultural Experiment Substation. Nutrient loads likely originated from fertilizers used on rice fields and a high-density livestock population. Rural households in the drainage basin, particularly Cerro Alto hills north of the lagoon, also contributed to external surface water degradation by discharging greywater directly into the environment. Precipitation events were associated with increased SRP, TP, and ammonia loads [25].

3. Background and Problem

The conservation status of rivers in Puerto Rico is relatively good compared to other neotropical regions [26]. However, the effects of urban expansion, deforestation, alterations to the natural riverbed, and the impact of climate change have begun to be reflected in river discharges. These effects and impacts represent a threat to these ecosystems and society. For example, after an extreme rainfall event, the intensity of river discharges could alter their course, increase the input of nutrients and pollutants into the water body, and impact the habitats of certain species of aquatic flora and fauna [27]. The resilience of these ecosystems and the time it would take to return to their natural state may vary depending on the intensity of natural and anthropogenic impacts [27,28]. This is why protecting these ecosystems, especially those that retain their natural state, is essential.
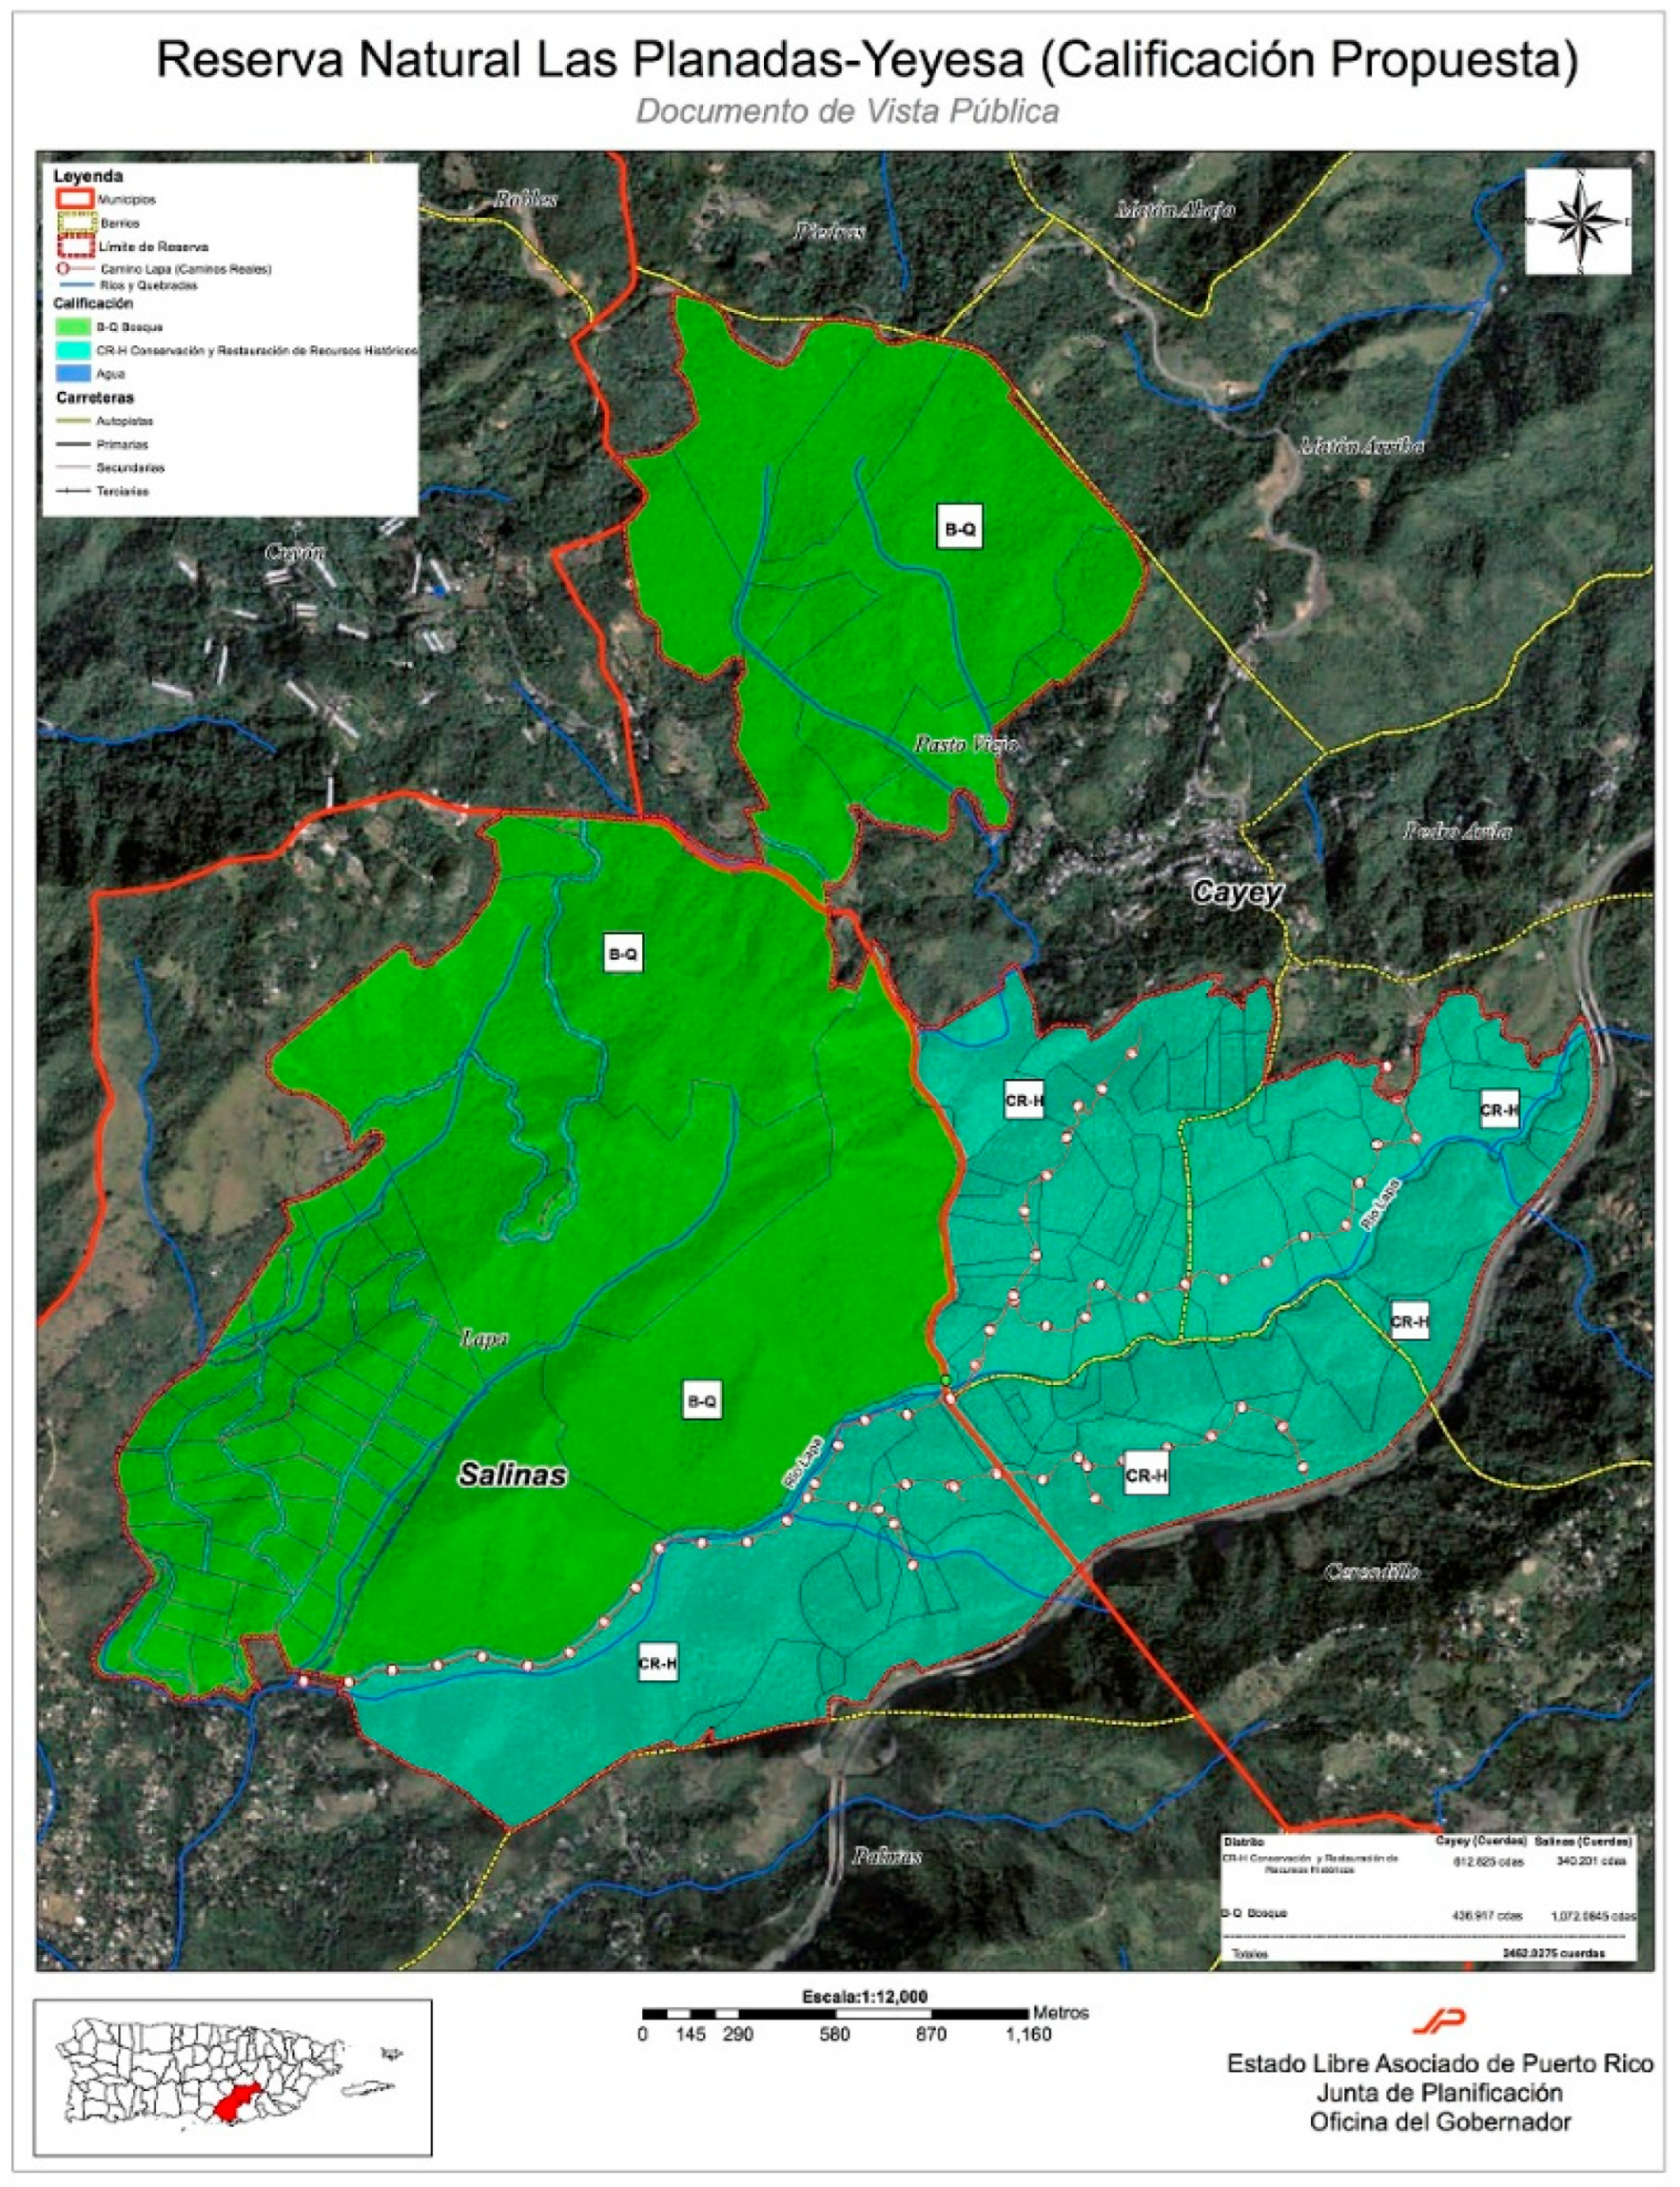
In Puerto Rico, the Heritage Rivers Program (HRP), which includes Puerto Rico Heritage Rivers, Natural High-Value Rivers, and Recreational Rivers, was established to identify, and manage the protection of hydrographic systems that have remained untouched by human interference and thus maintain their natural conditions [29]. The Puerto Rico Department of Environment and Natural Resources (DNER) oversees the program. The Lapa River is included in the HRP and is situated within the Planadas-Yeyesa Nature Reserve, spanning the municipalities of Cayey and Salinas in Puerto Rico (Figure 1 and Figure 2).
The HRP classifies the Lapa River as Type 2, which refers to rivers that have been minimally impacted by human activities and are located within natural reserves protected by the DNER [29]. Despite the protections afforded to the Lapa River, various natural and anthropogenic events have affected its course. For instance, natural events such as hurricanes Irma and María in 2017 led to an increase in discharges in this ecosystem, causing changes in its course and directly impacting the habitat of the aquatic fauna and flora. In terms of threats from anthropogenic activities, constructions in the northern area of the highway bordering the river’s northern area, as well as house constructions and other structures in areas adjacent to the river, may be affecting the natural state of the ecosystem, along with the discharges that reach the river. Regarding the discharges, conducting studies on this variable will increase our knowledge, potentially providing valuable information for ecosystem management planning. Therefore, the research question formulated for this study was: What have been the temporal variations in the discharges of the Lapa River? The objectives of this research were (1) to describe the temporal variations in water discharges in the Lapa River and (2) to describe the impact of atmospheric events on the water discharges at the Lapa River.

4. Methodology

This research aimed to describe the temporal patterns of water discharge from the Lapa River. Additionally, changes in the river’s discharge following the impact of hurricanes and other natural events were explained. The U.S. Geological Survey database was used to carry out this study [30]. The selected study site was the Lapa River (Lapa River NR Rabo Del Buey, PR—50100200). The selected years they have had to encompass data for all 12 months of their corresponding years to determine the evaluation period. The IBM® SPSS® Statistics program was employed to analyze the data. The variables evaluated in this study were discharges and dates. The following descriptive statistics (minimum, maximum, mean, standard deviation, and variance values) were established to conduct this study. Data from the National Oceanic and Atmospheric Administration (NOAA) was used to explain the changes in the discharges in the river after the impact of hurricanes and other natural events [31].

5. Results

5.1. Temporal Variations in Water Discharges in the Lapa River

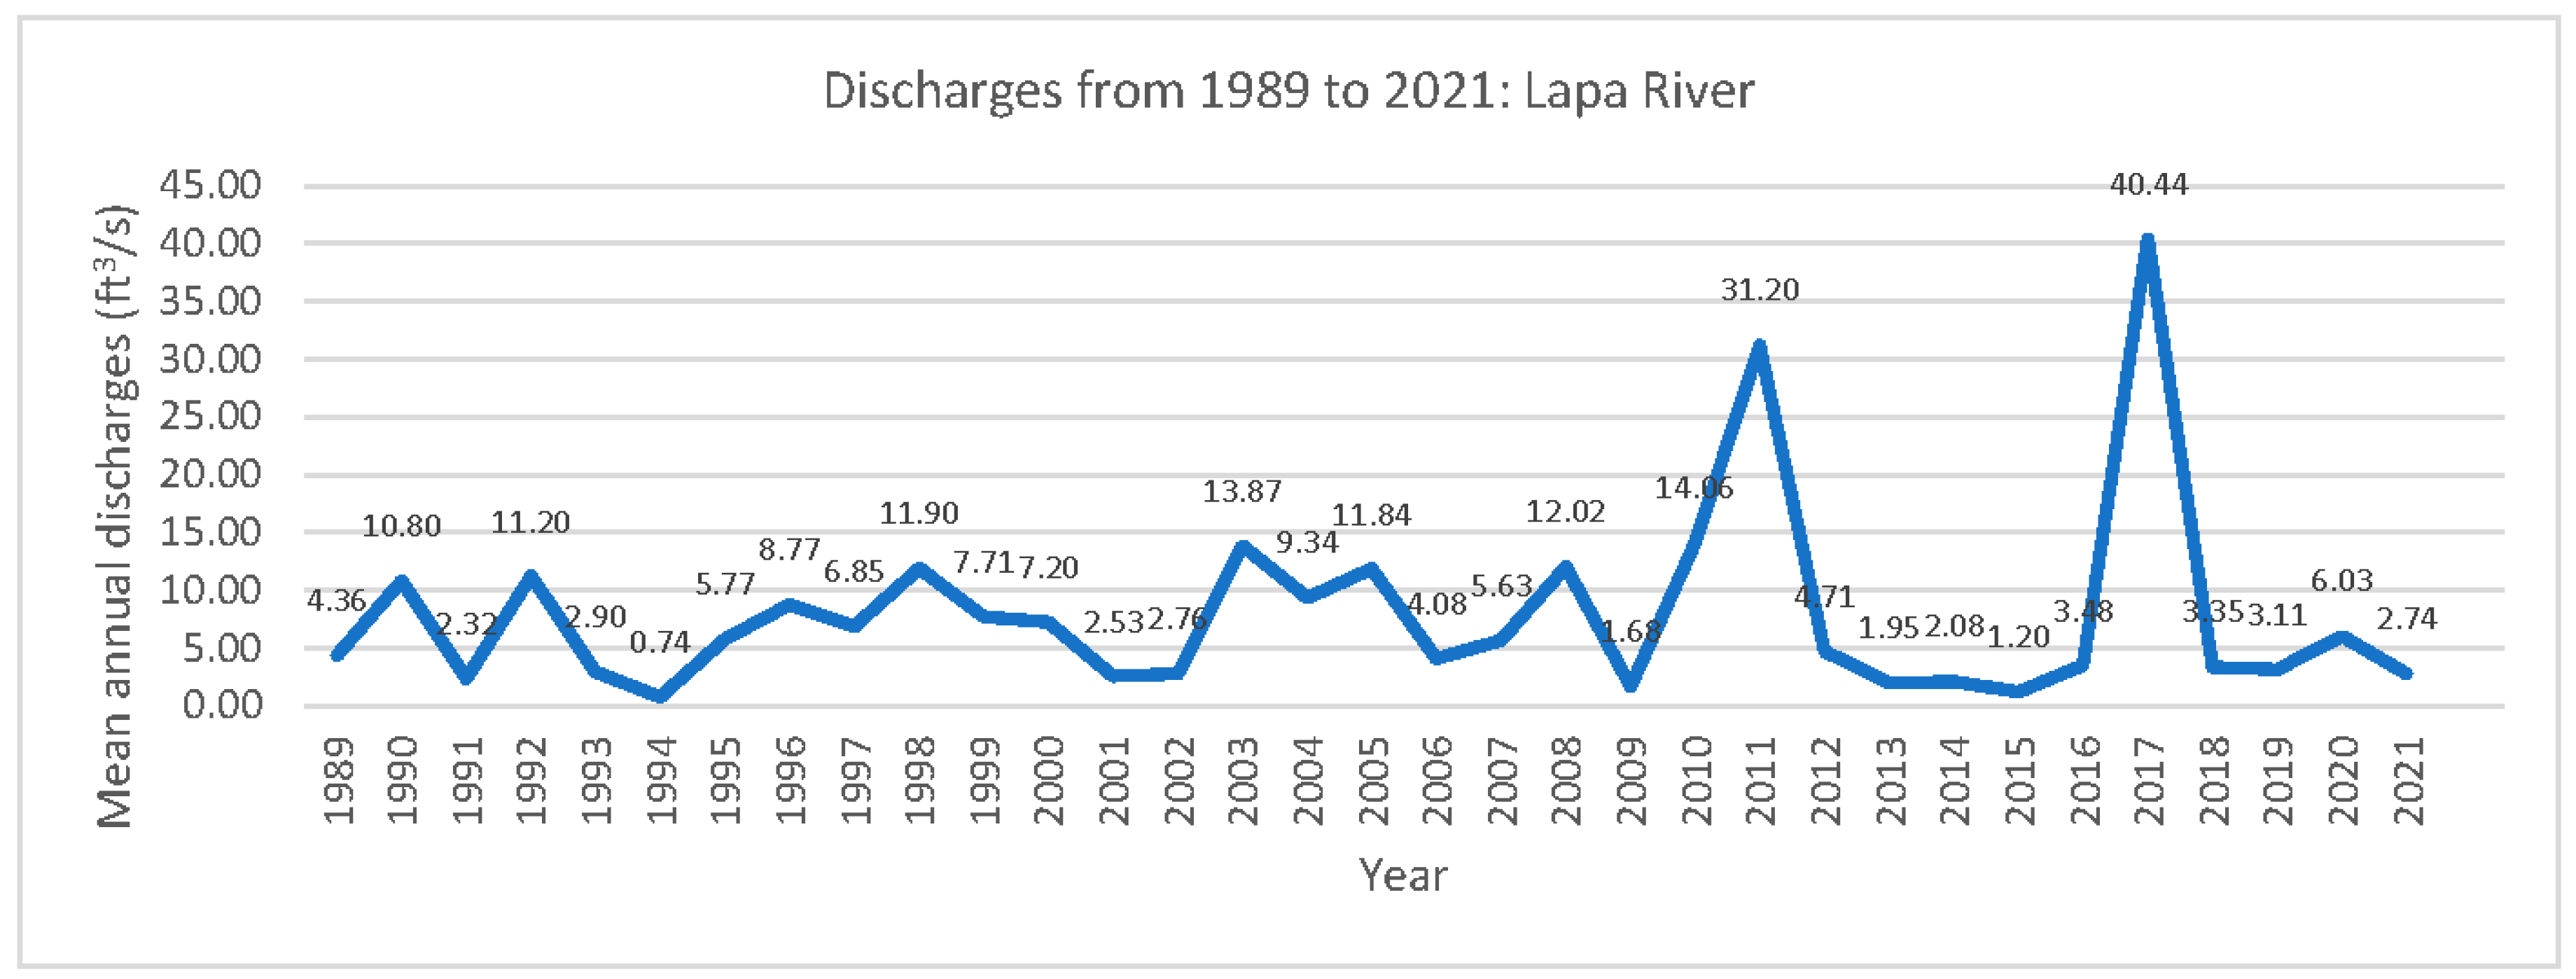
After evaluating all the data available for the Lapa River (Lapa River NR Rabo Del Buey, PR—50100200 USGS) site, data was extracted from 1989 to 2021. Figure 3 shows the Lapa River’s mean annual discharges (ft3/s) from 1989 to 2021. The highest annual discharge averages recorded from 1989 to 2021 in the Lapa River occurred in 2011 and 2017. In 2011, the annual mean discharge was 31.20 (ft3/s); in 2017, the average was 40.44 (ft3/s).
Table 1 shows the descriptive statistical analysis results of Lapa River discharges. The annual discharge mean was 7.84 (ft3/s). The lowest annual discharge mean was 0.74 ft3/s, which occurred in 1994, and the highest was 40.44 ft3/s in 2017.
Table 2 shows the descriptive statistical analysis results of Lapa River discharges, excluding the outliers’ values recorded in 2011 and 2017. The annual discharge average was 6.03 (ft3/s). The lowest annual discharge average was 0.74 ft3/s, which occurred in 1994, and the highest was 14.06 ft3/s in 2010.

5.2. Seasonal Discharges

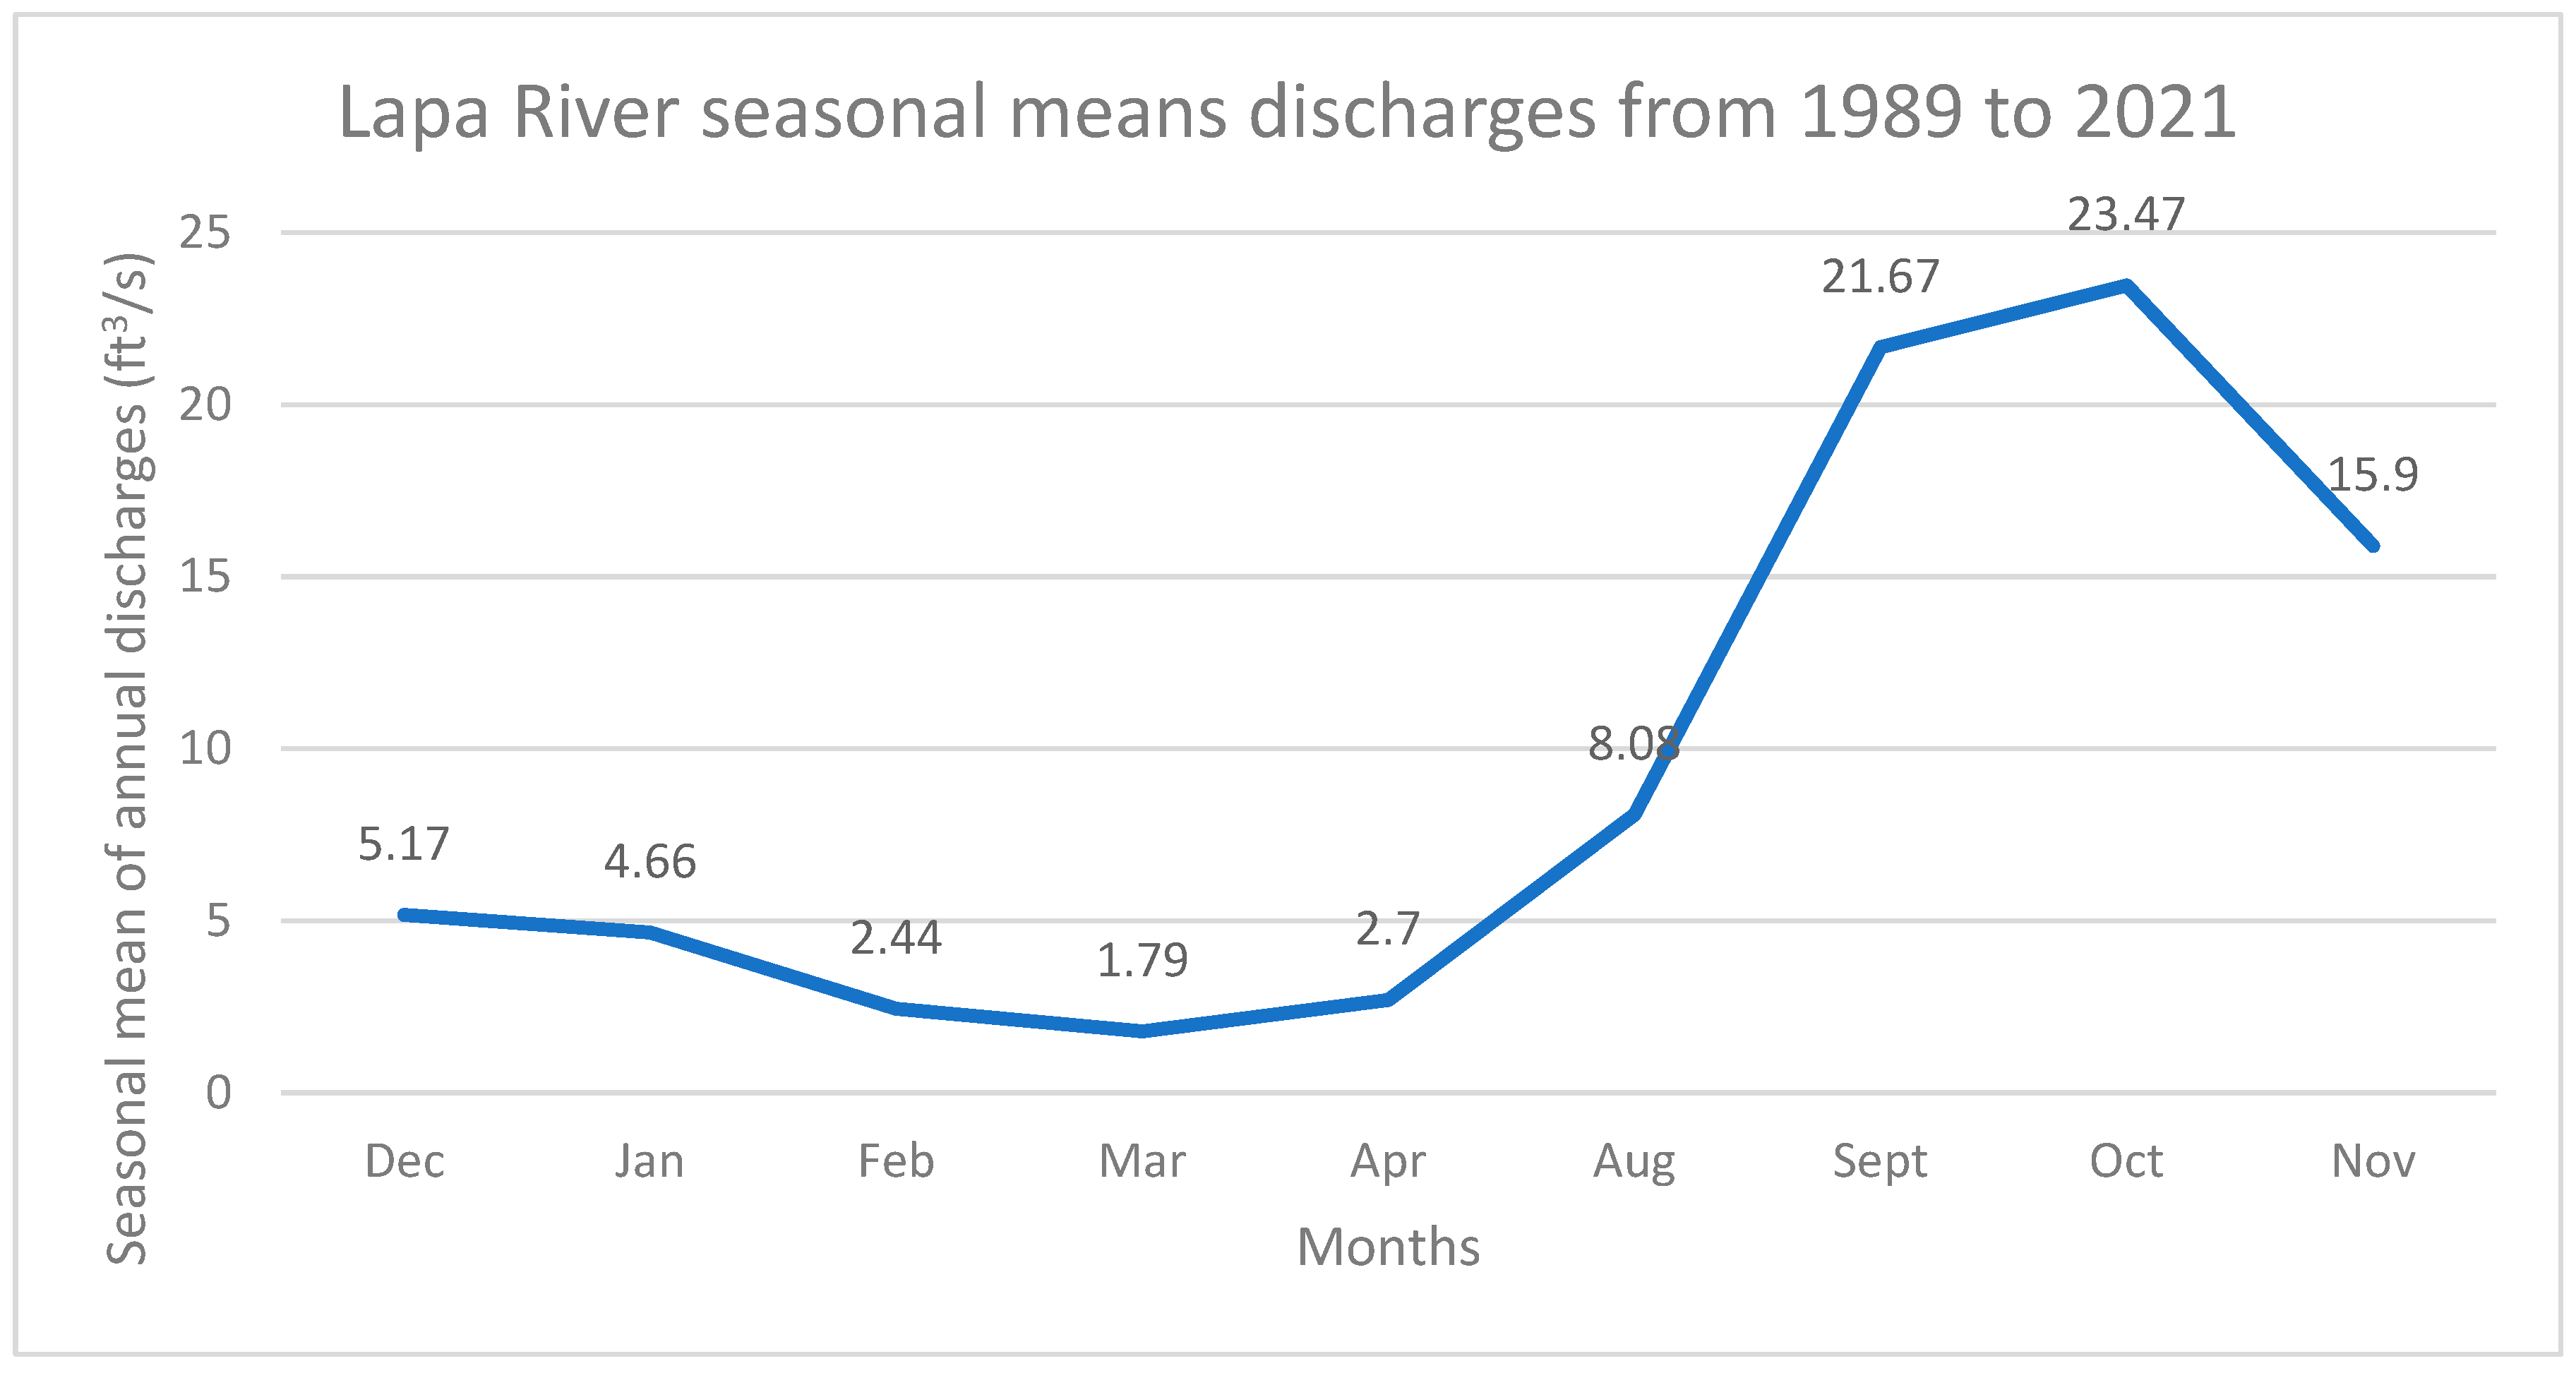
The evaluation of the seasonal discharges at the Lapa River was from the period 1989 to 2021. Figure 4 shows the Lapa River’s seasonal mean annual discharges (ft3/s). The dry season lasts from December to April. The rainy season lasts from August to November. The highest discharge month during the dry season was December, with a mean of 5.17 ft3/s. The highest discharge month during the rainy season was October, with a mean of 23.47 ft3/s.

5.3. Description of the Impact of Atmospheric Events on the Water Discharges at the Lapa River

Hurricanes, storms, and flooding events in Puerto Rico have impacted the island directly and indirectly. Each atmospheric event has had different effects on the Lapa River discharges. Table 3 shows the mean discharges during atmospheric events. For example, in 1989, Hurricane Hugo hit Puerto Rico as a Category 4 hurricane, leaving significant damage islandwide. The discharge mean at the Lapa River after this event was 29.10 ft3/s. In October 1990, Hurricane Klaus brought heavy rainfall to the Caribbean, leaving a mean of 76.10 ft3/s discharges in the river. In January 1992, severe thunderstorms associated with a stationary front in Puerto Rico caused heavy rains and flooding. This event left 68.80 ft3/s of discharges. Hurricane Marilyn, a Category 3 hurricane, impacted the Virgin Islands and Puerto Rico in 1995, causing significant damage. This event left 36.60 ft3/s of discharges. Hurricane Hortense, a Category 4 hurricane in 1996, left 81.20 ft3/s of discharges. 1997 Tropical Storm Grace formed north of Hispaniola but did not intensify much due to strong wind shear. This event left 55.50 ft3/s of discharges in the river. Hurricane Georges, a powerful Category 4 hurricane in 1998, left 57.50 ft3/s of discharges. In November 2003, flooding events in Puerto Rico left 88.10 ft3/s of discharges in the river. In October 2005, flooding events related to Hurricane Wilma left 77.30 ft3/s of discharges in the river. In October 2007, Tropical Storm Noel left 37.00 ft3/s of discharges in the river. In October 2008, Hurricane Omar brought moderate to heavy rainfall in the Caribbean, leaving 77.30 ft3/s of discharges in the river. In October 2010, Hurricane Otto left 76.40 ft3/s of discharges in the river. In 2011, flooding events and hurricanes impacted the Lapa River basin, leaving 133.30 ft3/s of discharges in the river during the month of August and 96.60 ft3/s of discharges in the river in September. In September 2017, two Hurricanes, Irma and Maria, each reached category five strength and significantly impacted the discharges at the Lapa River [32,33]. 164. 40 ft3/s of discharges in September, 182.60 ft3/s of discharges in October, and 98.70 ft3/s in December.

6. Conclusions

Puerto Rico is an island in a neotropical zone, where most rivers have a continuous water flow. Understanding water discharge in these neotropical ecosystems has allowed for developing watershed management plans and other actions to protect them. This descriptive study aimed to comprehend the river Lapa’s water discharges and the atmospheric events that have caused an increase in these discharges. The U.S. Geological Survey database data provided complete information from 1989 to 2021.
The results of this study reflected that discharges in this ecosystem can vary depending on the season. For example, during the dry season, the highest average discharge was 5.17 ft3/s, while the highest mean discharge during the rainy season was 23.47 ft3/s. Analyzing these data, we can conclude that water discharges in this neotropical river are pronounced during dry and rainy seasons, which span from August to November and reported higher average water discharge than the dry season.
In contrast to this research, Vélez et al. [34] examined the spatial patterns of the Precipitation Concentration Index (CI) in Puerto Rico using daily precipitation data from 20 precipitation gauging stations from 1971 to 2010. They found that the Southern and Eastern interior regions of Puerto Rico had higher CI values, whereas the Western and North-Western areas had lower CI values. The annual CI and the rainy season CI exhibited gradients from South-East to North-West, while the dry season CI showed a gradient from South to North. Remarkably, the rainy season CI registered the lowest values, in contrast to the dry season CI, which recorded the highest values. This study differs in that it primarily identifies the year’s season as a determining factor in precipitation and includes the spatial variable.
Furthermore, the results of this research reported an increase in the river Lapa’s discharges following the impact of atmospheric phenomena such as hurricanes, storms, and flood events. This study concludes that, during the evaluated period, the highest discharge event occurred after the impact of hurricanes Irma and Maria, with an average discharge of 164.40 ft3/s in October and 182.60 ft3/s in September. This event set a precedent in the river Lapa’s discharges, impacting the river basin’s flora, fauna, and morphology from its headwaters downstream. The periods of precipitation extended for several weeks, saturating the land with water.
In general, the results of this research are intended to contribute to creating a management plan that channels efforts toward the ongoing protection of the Lapa River, ensuring its ecosystem services. This descriptive analysis of river discharges will also benefit downstream communities as it contributes to understanding river discharges. Additionally, it helps identify periods of increased discharges, which is crucial for establishing emergency management plans for any sudden flooding affecting residents living near the river. Finally, this analysis is expected to serve as a foundation for future research comparing the Lapa River’s discharges with other aquatic ecosystems, providing different reference points and increasing knowledge about water discharges in neotropical rivers.

Funding

Not applicable.

Institutional Review Board Statement

Not applicable.

Informed Consent Statement

Not applicable.

Data Availability Statement

Data sets are available in Appendix A.

Conflicts of Interest

The authors declare no conflict of interest.

Appendix A

Table A1. Data Extracted from the U.S. Geological Survey Database.
Year Monthly Mean in ft3/s (Calculation Period: 1989-2021
January February March April May June July August September October November December
1989 1.14 1.60 0.74 0.32 0.30 0.46 0.14 0.18 29.10 13.10 3.98 1.27
1990 0.57 0.49 0.44 0.28 0.18 0.59 0.68 6.06 9.73 76.10 28.40 6.09
1991 3.74 12.40 1.75 0.99 1.50 0.83 0.60 0.60 0.82 1.46 2.17 0.96
1992 68.80 2.53 2.08 3.07 36.60 6.32 2.55 3.64 1.44 2.73 2.81 1.82
1993 1.36 0.99 0.80 1.39 1.71 10.40 7.80 3.94 2.46 2.02 1.07 0.89
1994 0.47 1.34 0.48 0.34 0.09 0.04 0.01 0.00 0.11 4.20 1.08 0.75
1995 0.48 3.22 0.93 1.23 1.42 1.70 1.75 1.82 36.60 13.80 3.14 3.16
1996 2.15 1.03 0.58 1.24 0.15 0.44 3.73 4.84 81.20 5.53 2.44 1.96
1997 0.98 1.17 0.71 0.44 0.17 0.07 0.04 0.20 0.05 55.50 20.00 2.86
1998 1.65 9.49 1.79 4.18 2.13 1.00 0.64 12.80 57.50 20.00 17.20 14.40
1999 8.28 4.00 2.59 1.98 2.51 1.70 1.06 2.41 11.30 9.15 36.40 11.10
2000 7.22 5.27 2.42 2.05 7.05 2.34 1.15 17.90 14.40 17.80 6.06 2.76
2001 1.44 0.97 1.08 1.18 4.90 0.68 0.16 7.70 1.36 1.26 5.33 4.34
2002 0.87 0.89 2.68 11.50 1.94 8.43 0.68 0.68 4.06 0.93 0.18 0.31
2003 0.32 0.23 0.27 20.70 1.06 0.38 1.14 3.81 5.20 12.20 88.10 33.00
2004 11.10 7.57 4.00 3.69 8.27 2.45 2.12 1.07 30.80 10.20 24.30 6.45
2005 5.12 2.16 1.33 1.22 4.51 2.01 12.20 3.67 3.21 77.30 22.00 7.31
2006 4.07 2.78 5.12 9.39 2.66 2.31 2.78 4.29 6.90 4.68 2.49 1.43
2007 1.04 0.98 0.98 0.93 0.61 0.34 0.19 0.75 0.20 37.00 10.10 14.50
2008 3.58 2.00 1.14 0.90 1.13 0.89 0.44 1.41 98.90 20.00 10.30 3.49
2009 2.40 1.53 2.62 0.79 1.41 0.88 1.22 0.49 1.03 1.21 0.67 5.91
2010 2.17 1.13 1.10 1.21 14.00 9.33 13.40 6.38 7.21 76.40 29.50 6.86
2011 3.50 1.92 1.41 2.62 34.90 30.50 26.40 133.30 96.80 26.10 13.10 3.85
2012 2.28 1.82 4.37 3.59 8.77 1.07 1.85 6.36 0.81 20.50 3.54 1.60
2013 1.07 0.93 2.05 1.40 1.78 0.60 1.78 0.79 7.96 1.10 1.97 2.01
2014 0.71 0.53 0.32 0.62 0.62 0.24 0.20 11.70 1.63 1.34 5.24 1.85
2015 1.23 1.39 0.53 0.44 0.34 0.22 0.09 0.46 0.12 5.81 2.80 0.97
2016 2.34 0.62 0.64 1.00 1.10 0.37 0.34 0.79 1.08 10.50 19.90 3.05
2017 0.63 0.70 6.54 3.41 8.87 0.95 1.45 3.68 164.40 182.60 98.70 13.40
2018 5.09 3.84 2.92 2.64 5.51 11.10 2.76 1.53 0.98 1.32 1.87 0.62
2019 0.92 0.67 0.62 0.49 0.43 0.24 0.28 5.11 5.48 13.40 6.79 2.89
2020 1.29 0.85 0.92 0.51 0.41 0.43 7.80 9.91 2.61 8.83 35.90 2.84
2021 1.23 0.93 1.28 0.62 0.45 0.62 0.35 0.33 8.13 17.00 1.24 0.69

References

  1. U.S. Geological Survey. Water Science School. Rivers, Streams, and Creeks. 2018. Available online: https://www.usgs.gov/special-topics/water-science-school/science/rivers-streams-and-creeks#overview (accessed on 10 October 2023).
  2. Morrone, J.J.; Escalante, T.; Rodriguez-Tapia, G.; Carmona, A.; Arana, M.; Mercado-Gómez, J.D. Biogeographic regionalization of the Neotropical region: New map and shapefile. An. Acad. Bras. Ciências 2022, 94, e20211167. [Google Scholar] [CrossRef] [PubMed]
  3. Albert, J.S.; Tagliacollo, V.A.; Dagosta, F. Diversification of Neotropical freshwater fishes. Annu. Rev. Ecol. Evol. Syst. 2020, 51, 27–53. [Google Scholar] [CrossRef]
  4. Pelicice, F.M.; Agostinho, A.A.; Azevedo-Santos, V.M.; Bessa, E.; Casatti, L.; Garrone-Neto, D.; Gomes, L.C.; Pavanelli, C.S.; Petry, A.C.; dos Santos Pompeu, P.; et al. Ecosystem services generated by Neotropical freshwater fishes. Hydrobiologia 2023, 850, 2903–2926. [Google Scholar] [CrossRef]
  5. Petsch, D.K.; Cionek, V.D.M.; Thomaz, S.M.; dos Santos, N.C.L. Ecosystem services provided by river-floodplain ecosystems. Hydrobiologia 2023, 850, 2563–2584. [Google Scholar] [CrossRef]
  6. Orozco-González, C.E.; Ocasio-Torres, M.E. Aquatic Macroinvertebrates as Bioindicators of Water Quality: A Study of an Ecosystem Regulation Service in a Tropical River. Ecologies 2023, 4, 209–228. [Google Scholar] [CrossRef]
  7. Hale, R.L.; Cook, E.M.; Beltrán, B.J. Cultural ecosystem services provided by rivers across diverse social-ecological landscapes: A social media analysis. Ecol. Indic. 2019, 107, 105580. [Google Scholar] [CrossRef]
  8. García-Alonso, J.; Lercari, D.; Defeo, O. Río de la Plata: A neotropical estuarine system. In Coasts and Estuaries; Elsevier: Amsterdam, The Netherlands, 2019; pp. 45–56. [Google Scholar]
  9. Caldeira, Y.M.; Casarim, R.; Pompeu, P.S. Natural variation of physical-habitat conditions among least-disturbed streams of a neotropical river basin in Brazil. Water Biol. Secur. 2023, 2, 100091. [Google Scholar] [CrossRef]
  10. Yu, X.; Zhang, W.; Hoitink, A.J.F. Impact of river discharge seasonality change on tidal duration asymmetry in the Yangtze River Estuary. Sci. Rep. 2020, 10, 6304. [Google Scholar] [CrossRef]
  11. Restrepo, J.D.; Escobar, R.; Tosic, M. Fluvial fluxes from the Magdalena River into Cartagena Bay, Caribbean Colombia: Trends, future scenarios, and connections with upstream human impacts. Geomorphology 2018, 302, 92–105. [Google Scholar] [CrossRef]
  12. Peluso, L.M.; Mateus, L.; Penha, J.; Bailly, D.; Cassemiro, F.; Suárez, Y.; Fantin-Cruz, I.; Kashiwaqui, E.; Lemes, P. Climate change negative effects on the Neotropical fishery resources may be exacerbated by hydroelectric dams. Sci. Total Environ. 2022, 828, 154485. [Google Scholar] [CrossRef]
  13. Erős, T.; Lowe, W.H. The landscape ecology of rivers: From patch-based to spatial network analyses. Curr. Landsc. Ecol. Rep. 2019, 4, 103–112. [Google Scholar] [CrossRef]
  14. Departamento de Recursos Naturales y Ambientales. Los Ríos. Hojas de Nuestro Ambiente. 2007. Available online: https://www.drna.pr.gov/wp-content/uploads/2015/04/Los-r%C3%ADos.pdf (accessed on 10 October 2023).
  15. Mejia Manrique, S.A.; Harmsen, E.W.; Khanbilvardi, R.M.; González, J.E. Flood impacts on critical infrastructure in a coastal floodplain in Western Puerto Rico during Hurricane María. Hydrology 2021, 8, 104. [Google Scholar] [CrossRef]
  16. Caldwell, P.V.; Kennen, J.G.; Hain, E.F.; Nelson, S.A.; Sun, G.; McNulty, S.G. Hydrologic Modeling for Flow-Ecology Science in the Southeastern United States and Puerto Rico; General Technical Report-Southern Research Station (SRS-246); USDA Forest Service: Missoula, MT, USA, 2020. [Google Scholar]
  17. Miller, P.W.; Kumar, A.; Mote, T.L.; Moraes, F.D.S.; Mishra, D.R. Persistent hydrological consequences of hurricane Maria in Puerto Rico. Geophys. Res. Lett. 2019, 46, 1413–1422. [Google Scholar] [CrossRef]
  18. Quiñones, F.; Torres, S. El Clima de Puerto Rico. Recursos de Agua de Puerto Rico. 2012. Available online: https://www.recursosaguapuertorico.com/Cartilla-del-Agua.html (accessed on 10 October 2023).
  19. Yu, M.; Gao, Q. Intra-and Inter-annual Variability in Freshwater Discharge of Tropical Mountainous Watersheds in the Caribbean under Changing Climate. In Proceedings of the AGU Fall Meeting Abstracts, Chicago, IL, USA, 12–16 December 2022; Volume 2022. id. B55H–1068. [Google Scholar]
  20. Rossi, M.W.; Whipple, K.X.; Vivoni, E.R. Precipitation and evapotranspiration controls on daily runoff variability in the contiguous United States and Puerto Rico. J. Geophys. Res. Earth Surf. 2016, 121, 128–145. [Google Scholar] [CrossRef]
  21. Acosta-Coll, M.; Ballester-Merelo, F.; Martinez-Peiró, M.; De la Hoz-Franco, E. Real-time early warning system design for pluvial flash floods—A review. Sensors 2018, 18, 2255. [Google Scholar] [CrossRef]
  22. Hall, J.; Scholl, M.; Gorokhovich, Y.; Uriarte, M. Forest cover lessens the impact of drought on streamflow in Puerto Rico. Hydrol. Process. 2022, 36, e14551. [Google Scholar] [CrossRef]
  23. Li, Y.; Wright, D.B.; Liu, Y. Flood-induced geomorphic change of floodplain extent and depth: A case study of hurricane maria in Puerto Rico. J. Hydrol. Eng. 2022, 27, 04022019. [Google Scholar] [CrossRef]
  24. Ríos-Touma, B.; Ramírez, A. Multiple stressors in the Neotropical region: Environmental impacts in biodiversity hotspots. In Multiple Stressors in River Ecosystems; Elsevier: Amsterdam, The Netherlands, 2019; pp. 205–220. [Google Scholar]
  25. Sánchez-Colón, Y.M.; Schaffner, F.C. Identifying nonpoint sources of phosphorus and nitrogen: A case study of pollution that enters a freshwater wetland (Laguna Cartagena, Puerto Rico). J. Water Resour. Prot. 2021, 13, 588–604. [Google Scholar] [CrossRef]
  26. Gutiérrez, P.E.; Ramírez, A. Evaluación de la calidad ecológica de los ríos en Puerto Rico: Principales amenazas y herramientas de evaluación. Hidrobiológica 2016, 26, 433–441. [Google Scholar]
  27. Zimmerman, J.K.; Willig, M.R.; Hernández-Delgado, E.A. Resistance, resilience, and vulnerability of social-ecological systems to hurricanes in Puerto Rico. Ecosphere 2020, 11, e03159. [Google Scholar] [CrossRef]
  28. Collazo, J.A.; Terando, A.J.; Engman, A.C.; Fackler, P.F.; Kwak, T.J. Toward a resilience-based conservation strategy for wetlands in Puerto Rico: Meeting challenges posed by environmental change. Wetlands 2019, 39, 1255–1269. [Google Scholar] [CrossRef]
  29. Departamento de Recursos Naturales y Ambientales. Programa Ríos Patrimoniales de Puerto Rico. Designación Tipo 2: Tramos de los Ríos que Nacen en los Bosques Protegidos por el DNER u Otras Areas Protegidas [Internet]. 2016. Available online: http://DNER.pr.gov/wp-content/uploads/formidable/Designaci%C3%B3n-Ríos-Patrimoniales.pdf (accessed on 10 October 2023).
  30. U.S. Geological Survey. Available online: https://waterdata.usgs.gov/monitoring-location/50100200/ (accessed on 10 October 2023).
  31. NOAA National Centers for Environmental Information. Monthly Tropical Cyclones Report for September 2017, Published Online October 2017. Available online: https://www.ncei.noaa.gov/access/monitoring/monthly-report/tropical-cyclones/201709 (accessed on 3 October 2023).
  32. Byrne, M.J., Sr. Monitoring Storm Tide, Flooding, and Precipitation from Hurricane Maria in Puerto Rico and the US Virgin Islands, September 2017 (No. 2019-1065); US Geological Survey: Reston, VA, USA, 2019. [Google Scholar]
  33. Keellings, D.; Hernández Ayala, J.J. Extreme rainfall associated with Hurricane Maria over Puerto Rico and its connections to climate variability and change. Geophys. Res. Lett. 2019, 46, 2964–2973. [Google Scholar] [CrossRef]
  34. Vélez, A.; Martin-Vide, J.; Royé, D.; Santaella, O. Spatial analysis of daily precipitation concentration in Puerto Rico. Theor. Appl. Climatol. 2019, 136, 1347–1355. [Google Scholar] [CrossRef]
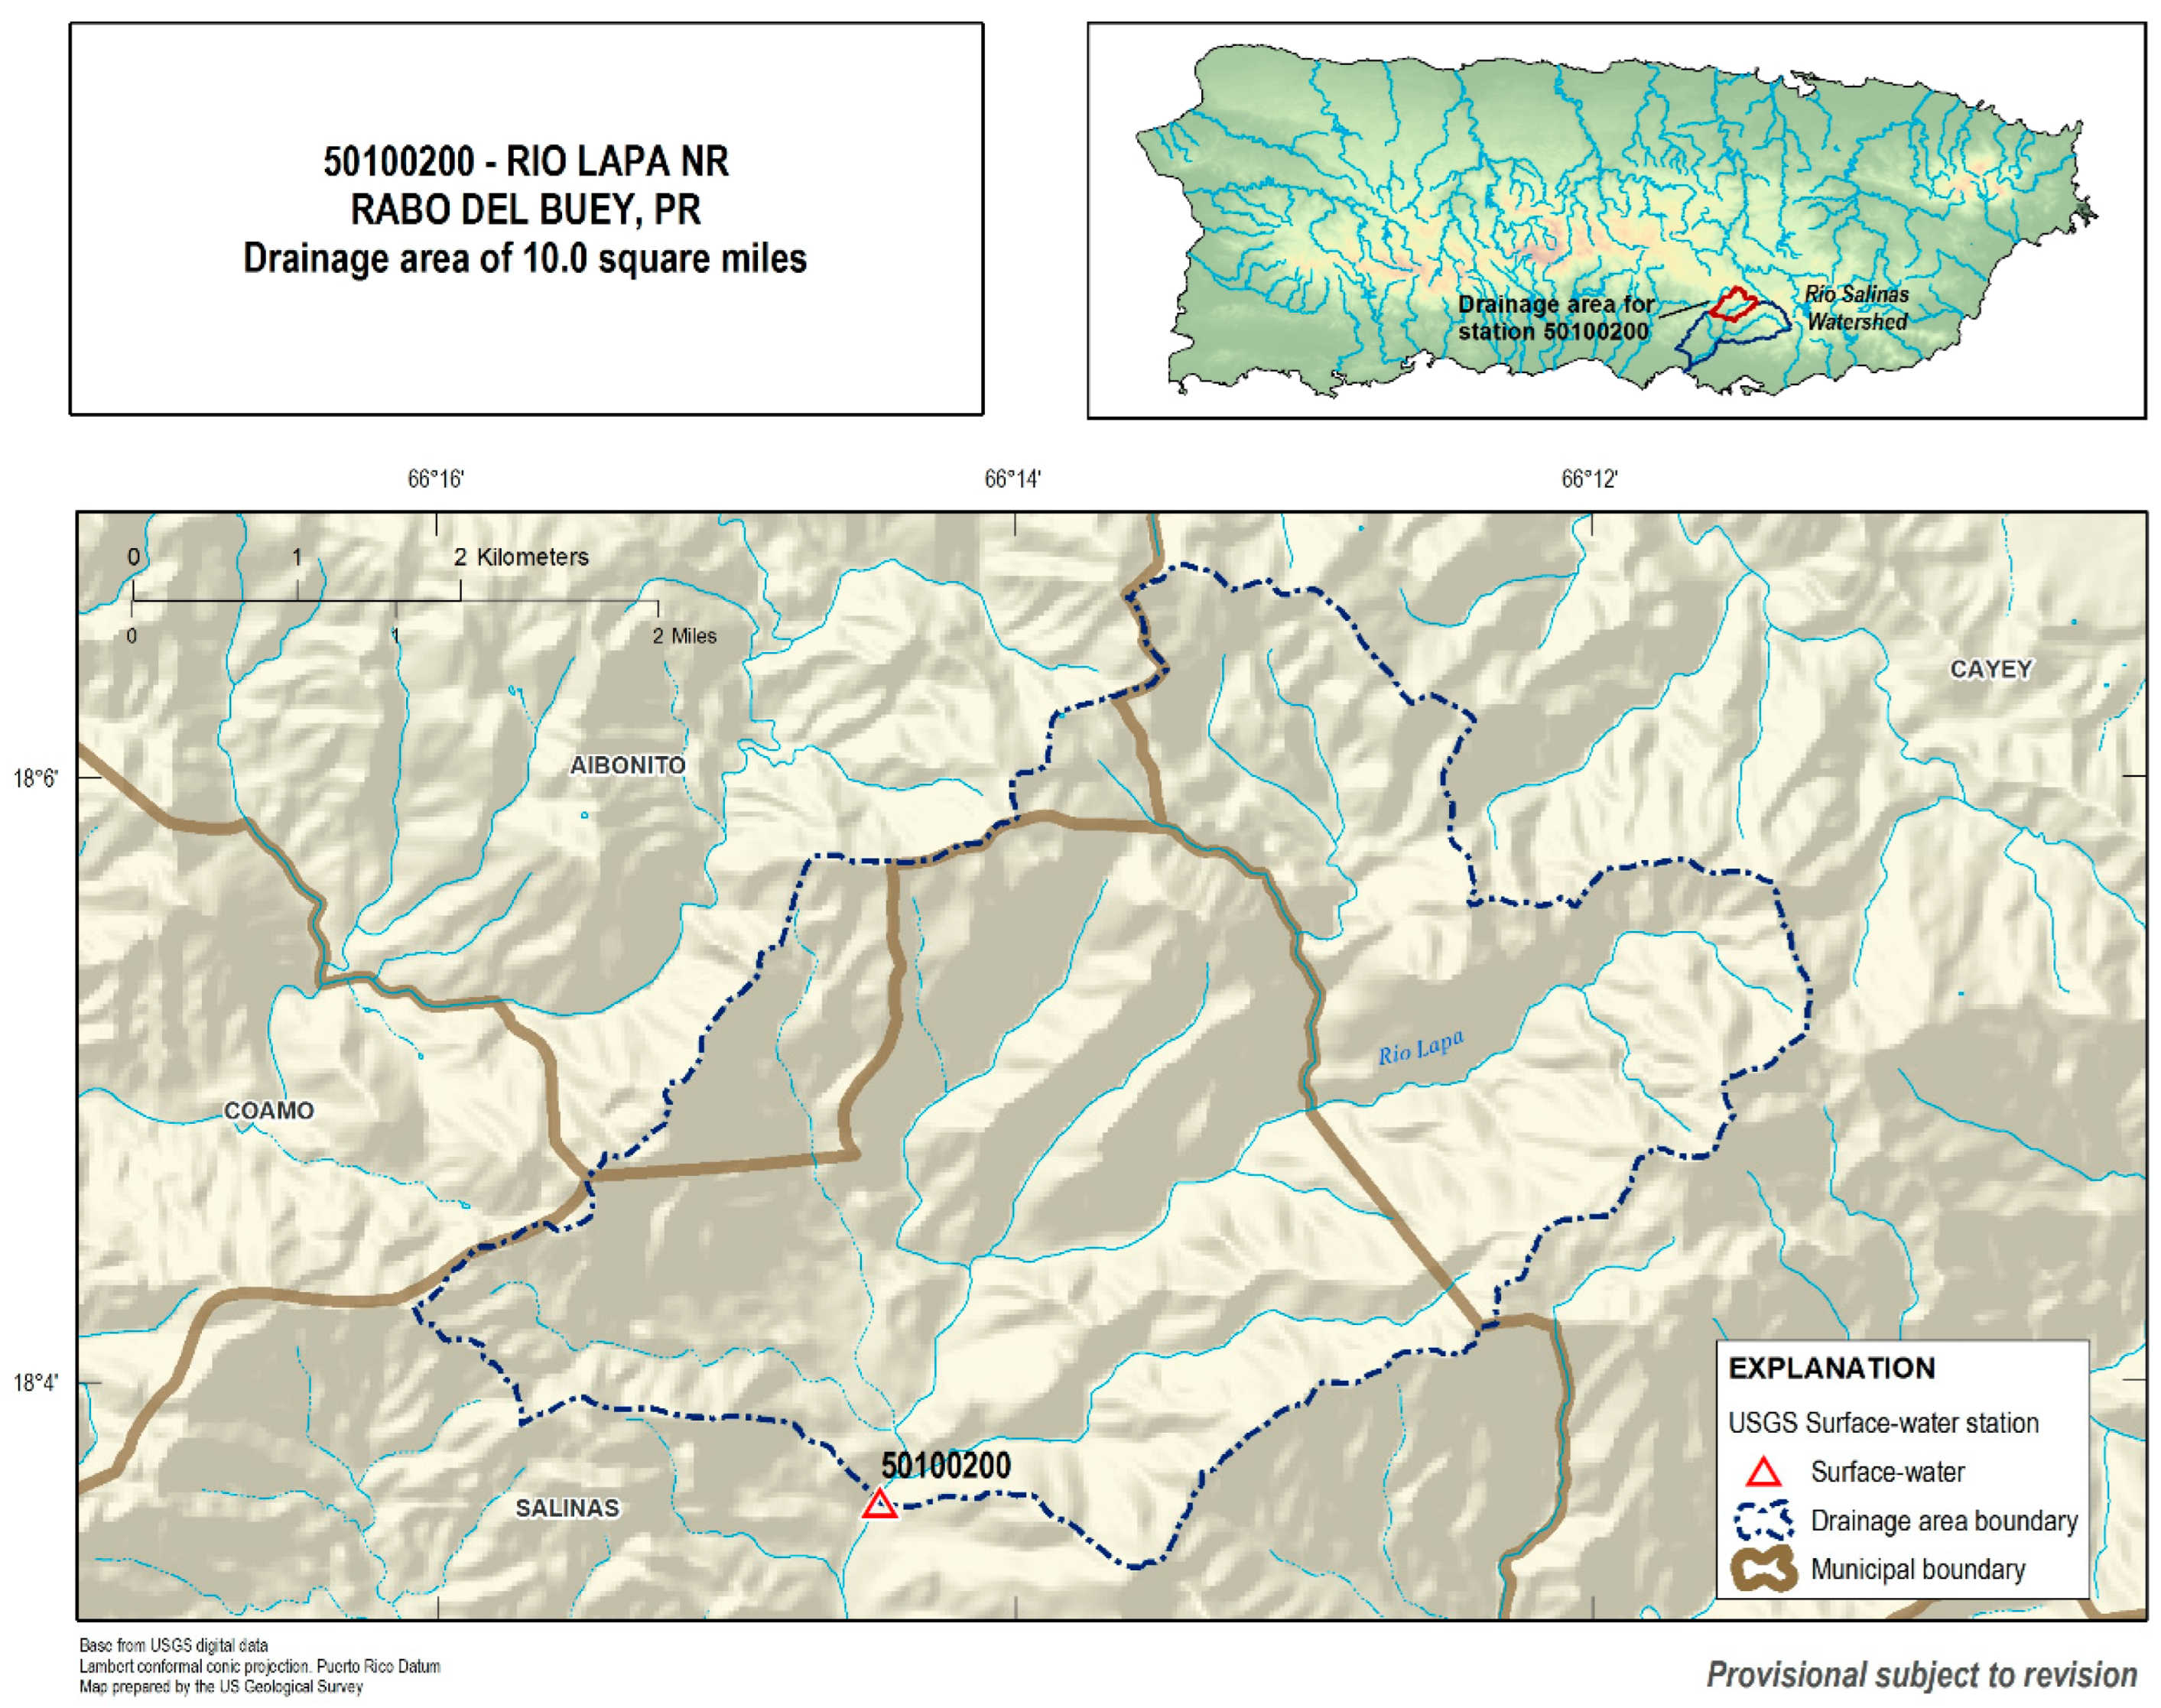
Figure 1. The Lapa River (USGS).
Preprints 87151 g001
Figure 2. Planadas Yeyesa Nature Reserve (Junta de Planificación de Puerto Rico).
Preprints 87151 g002
Figure 3. Annual mean discharges from the Lapa River for the 1989 to 2021 period.
Preprints 87151 g003
Figure 4. Lapa River seasonal means discharges from 1989 to 2021.
Preprints 87151 g004
Table 1. Descriptive statistics results for the mean annual discharges (ft3/s).
Mean 7.84
Standard Error 1.44
Median 5.63
Standard Deviation 8.30
Sample Variance 68.85
Kurtosis 8.20
Skewness 2.66
Range 39.70
Minimum 0.74
Maximum 40.44
Table 2. Descriptive statistics results for the mean annual discharges (ft3/s) excluding outliers values recorded in 2011 and 2017.
Mean 6.03
Standard Error 0.73
Median 4.71
Standard Deviation 4.05
Sample Variance 16.44
Kurtosis −0.91
Skewness 0.63
Range 13.32
Minimum 0.74
Maximum 14.06
Table 3. Discharges from the Rio Lapa after atmospheric events: 1989–2021.
Year Monthly Mean in ft3/s (Calculation Period: 1989-2021
January February March April May June July August September October November December
1989 1.14 1.60 0.74 0.32 0.30 0.46 0.14 0.18 *29.10 13.10 3.98 1.27
1990 0.57 0.49 0.44 0.28 0.18 0.59 0.68 6.06 9.73 *76.10 28.40 6.09
1991 3.74 12.40 1.75 0.99 1.50 0.83 0.60 0.60 0.82 1.46 2.17 0.96
1992 *68.80 2.53 2.08 3.07 *36.60 6.32 2.55 3.64 1.44 2.73 2.81 1.82
1993 1.36 0.99 0.80 1.39 1.71 10.40 7.80 3.94 2.46 2.02 1.07 0.89
1994 0.47 1.34 0.48 0.34 0.09 0.04 0.01 0.00 0.11 4.20 1.08 0.75
1995 0.48 3.22 0.93 1.23 1.42 1.70 1.75 1.82 *36.60 *13.80 3.14 3.16
1996 2.15 1.03 0.58 1.24 0.15 0.44 3.73 4.84 *81.20 5.53 2.44 1.96
1997 0.98 1.17 0.71 0.44 0.17 0.07 0.04 0.20 0.05 *55.50 20.00 2.86
1998 1.65 9.49 1.79 4.18 2.13 1.00 0.64 12.80 *57.50 20.00 17.20 14.40
1999 8.28 4.00 2.59 1.98 2.51 1.70 1.06 2.41 11.30 9.15 *36.40 11.10
2000 7.22 5.27 2.42 2.05 7.05 2.34 1.15 *17.90 *14.40 *17.80 6.06 2.76
2001 1.44 0.97 1.08 1.18 4.90 0.68 0.16 7.70 1.36 1.26 5.33 4.34
2002 0.87 0.89 2.68 11.50 1.94 8.43 0.68 0.68 4.06 0.93 0.18 0.31
2003 0.32 0.23 0.27 20.70 1.06 0.38 1.14 3.81 5.20 12.20 *88.10 33.00
2004 11.10 7.57 4.00 3.69 8.27 2.45 2.12 1.07 *30.80 10.20 24.30 6.45
2005 5.12 2.16 1.33 1.22 4.51 2.01 12.20 3.67 3.21 *77.30 22.00 7.31
2006 4.07 2.78 5.12 9.39 2.66 2.31 2.78 4.29 6.90 4.68 2.49 1.43
2007 1.04 0.98 0.98 0.93 0.61 0.34 0.19 0.75 0.20 *37.00 10.10 14.50
2008 3.58 2.00 1.14 0.90 1.13 0.89 0.44 1.41 *98.90 *20.00 10.30 3.49
2009 2.40 1.53 2.62 0.79 1.41 0.88 1.22 0.49 1.03 1.21 0.67 5.91
2010 2.17 1.13 1.10 1.21 14.00 9.33 13.40 6.38 7.21 *76.40 *29.50 6.86
2011 3.50 1.92 1.41 2.62 *34.90 *30.50 *26.40 *133.30 *96.80 *26.10 13.10 3.85
2012 2.28 1.82 4.37 3.59 8.77 1.07 1.85 6.36 0.81 *20.50 3.54 1.60
2013 1.07 0.93 2.05 1.40 1.78 0.60 1.78 0.79 7.96 1.10 1.97 2.01
2014 0.71 0.53 0.32 0.62 0.62 0.24 0.20 11.70 1.63 1.34 5.24 1.85
2015 1.23 1.39 0.53 0.44 0.34 0.22 0.09 0.46 0.12 5.81 2.80 0.97
2016 2.34 0.62 0.64 1.00 1.10 0.37 0.34 0.79 1.08 10.50 *19.90 3.05
2017 0.63 0.70 6.54 3.41 8.87 0.95 1.45 3.68 *164.40 *182.60 *98.70 13.40
2018 5.09 3.84 2.92 2.64 5.51 11.10 2.76 1.53 0.98 1.32 1.87 0.62
2019 0.92 0.67 0.62 0.49 0.43 0.24 0.28 5.11 5.48 13.40 6.79 2.89
2020 1.29 0.85 0.92 0.51 0.41 0.43 7.80 9.91 2.61 8.83 *35.90 2.84
2021 1.23 0.93 1.28 0.62 0.45 0.62 0.35 0.33 8.13 17.00 1.24 0.69
* Hurricanes, storms, and flooding events in Puerto Rico that increased the discharges in the Lapa River are highlighted in bold.
Disclaimer/Publisher’s Note: The statements, opinions and data contained in all publications are solely those of the individual author(s) and contributor(s) and not of MDPI and/or the editor(s). MDPI and/or the editor(s) disclaim responsibility for any injury to people or property resulting from any ideas, methods, instructions or products referred to in the content.
Copyright: This open access article is published under a Creative Commons CC BY 4.0 license, which permit the free download, distribution, and reuse, provided that the author and preprint are cited in any reuse.
Prerpints.org logo

Preprints.org is a free preprint server supported by MDPI in Basel, Switzerland.

Subscribe

© 2024 MDPI (Basel, Switzerland) unless otherwise stated