Submitted:
09 October 2023
Posted:
10 October 2023
You are already at the latest version
Abstract
Keywords:
1. Introduction
2. Materials and Methods
2.1. Cell Culture and Treatment
2.2. β-Galactosidase Staining
2.3. Optical Diffraction Tomography
2.4. Raman Spectroscopy
2.5. Statistical Analysis
3. Results
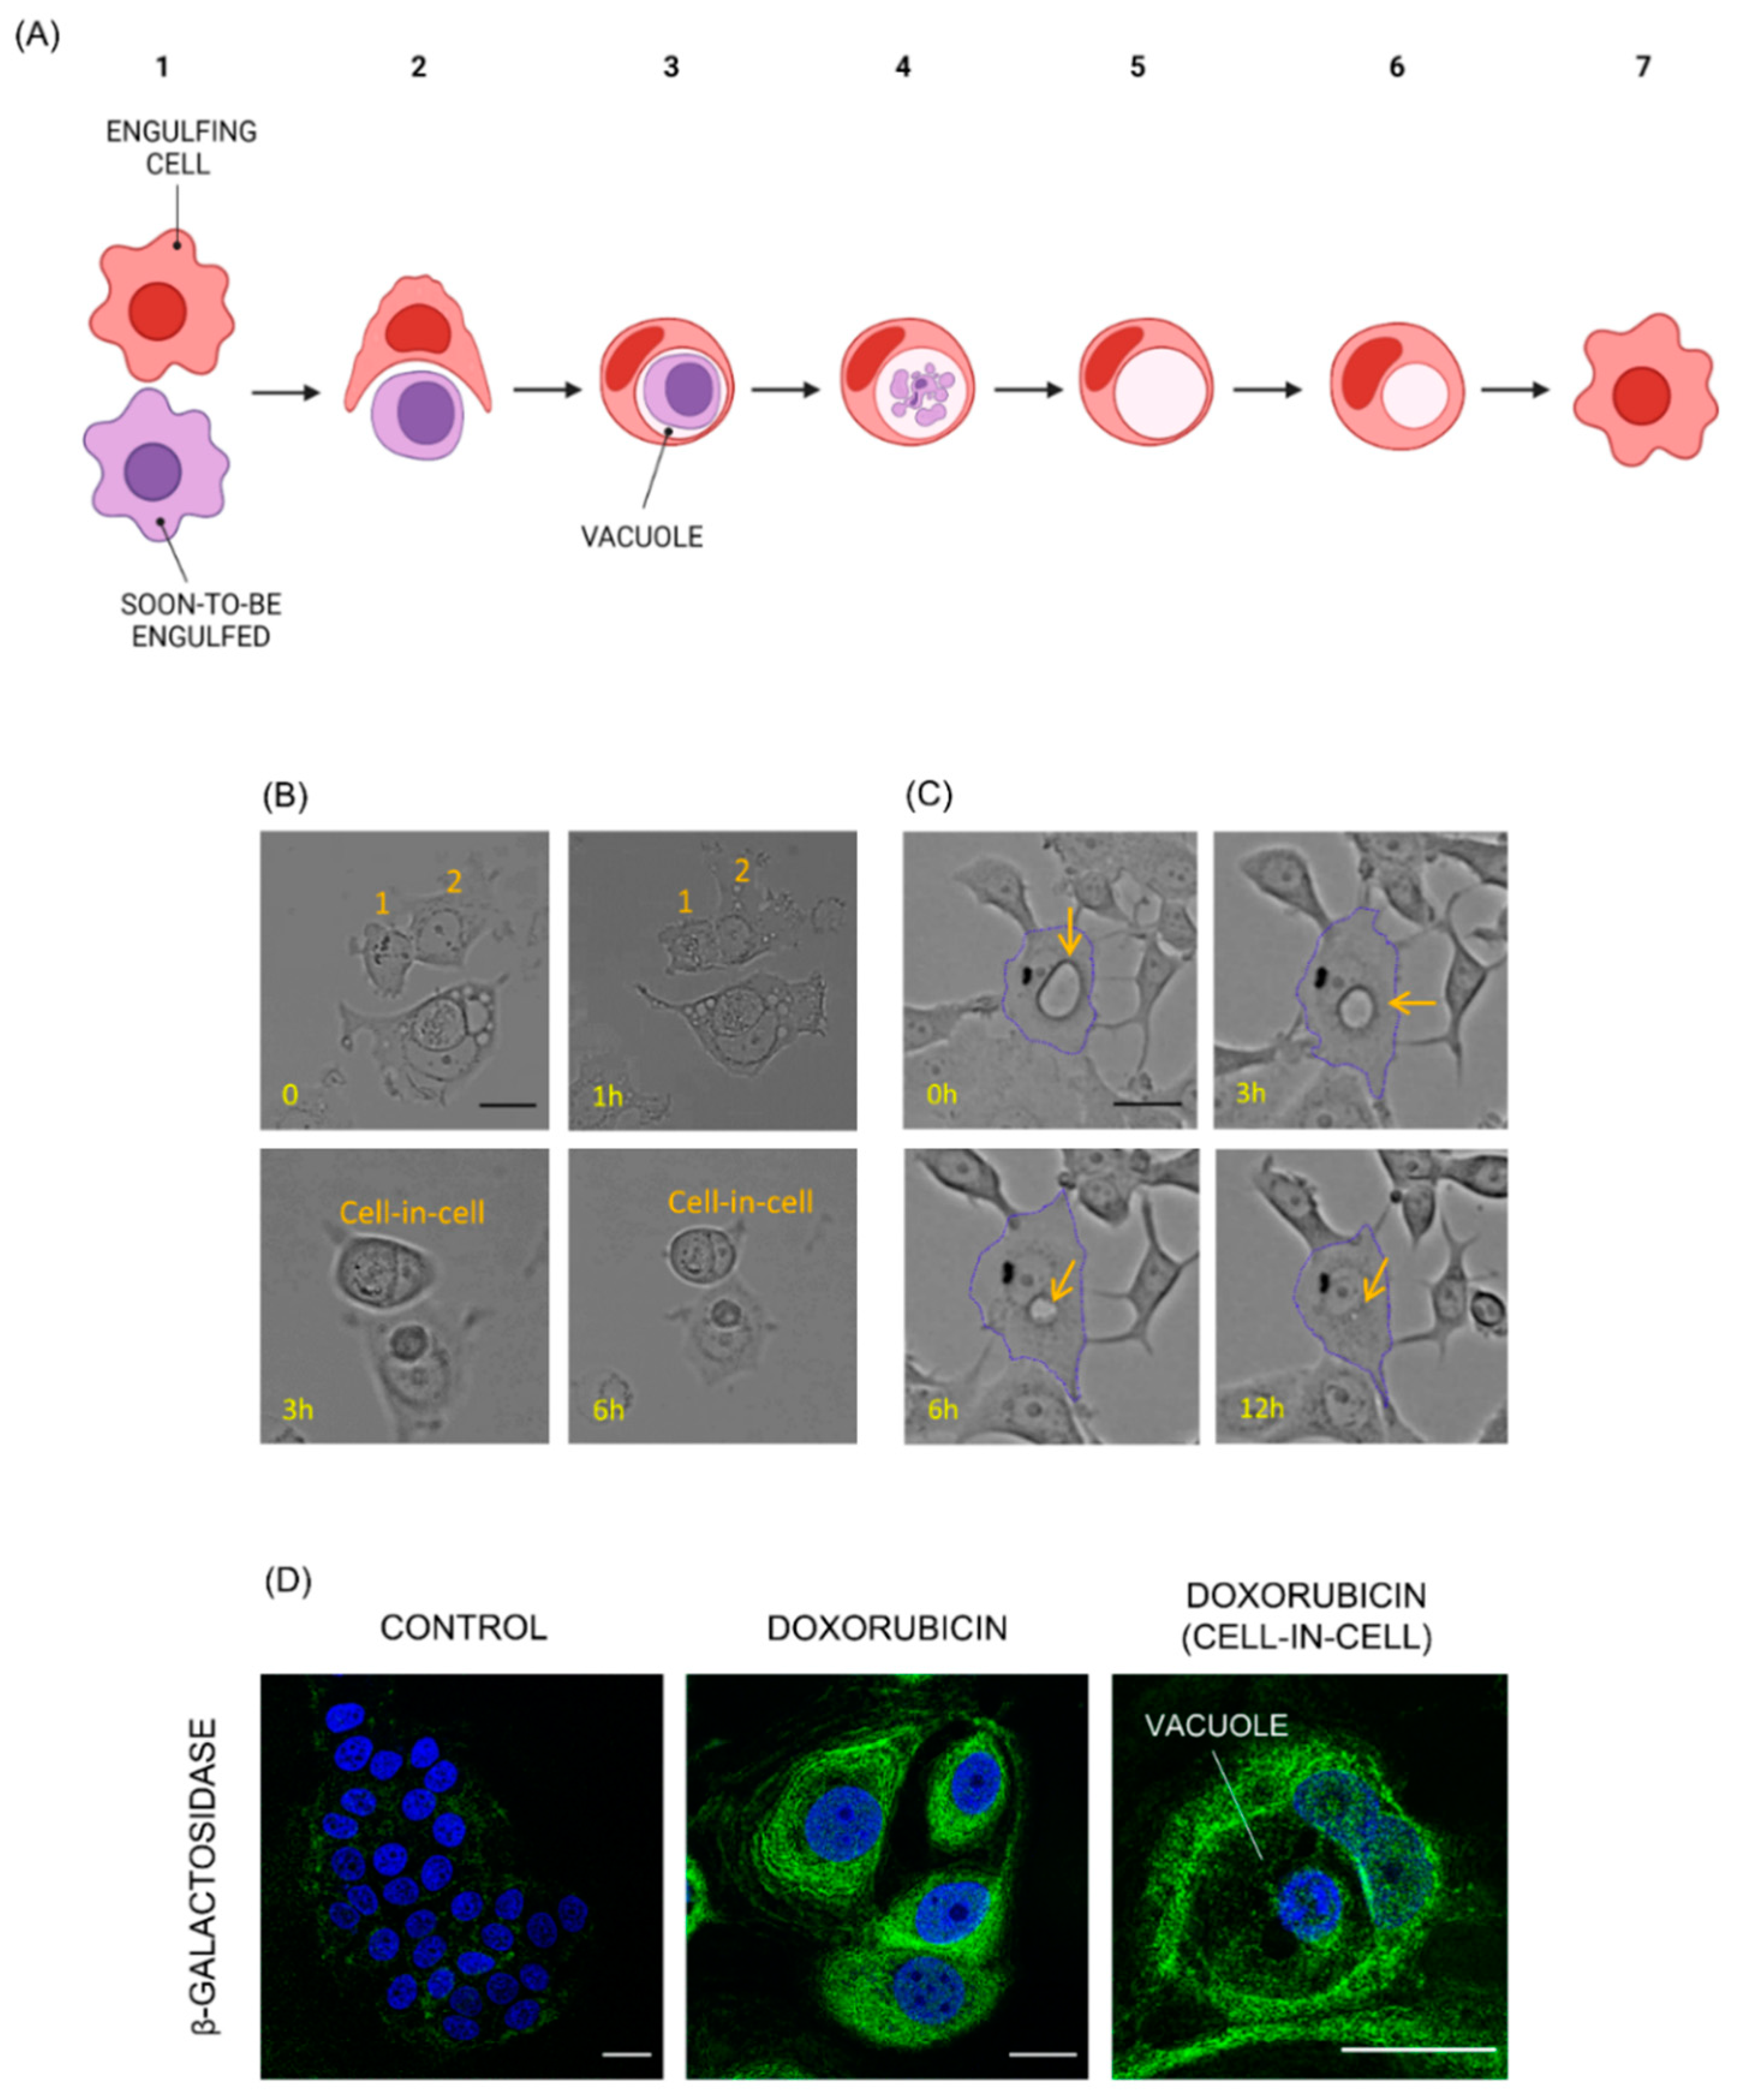
3.1. MCF7 Doxorubicin-Induced Senescent Cells Engulf Neighboring, Vital Cells
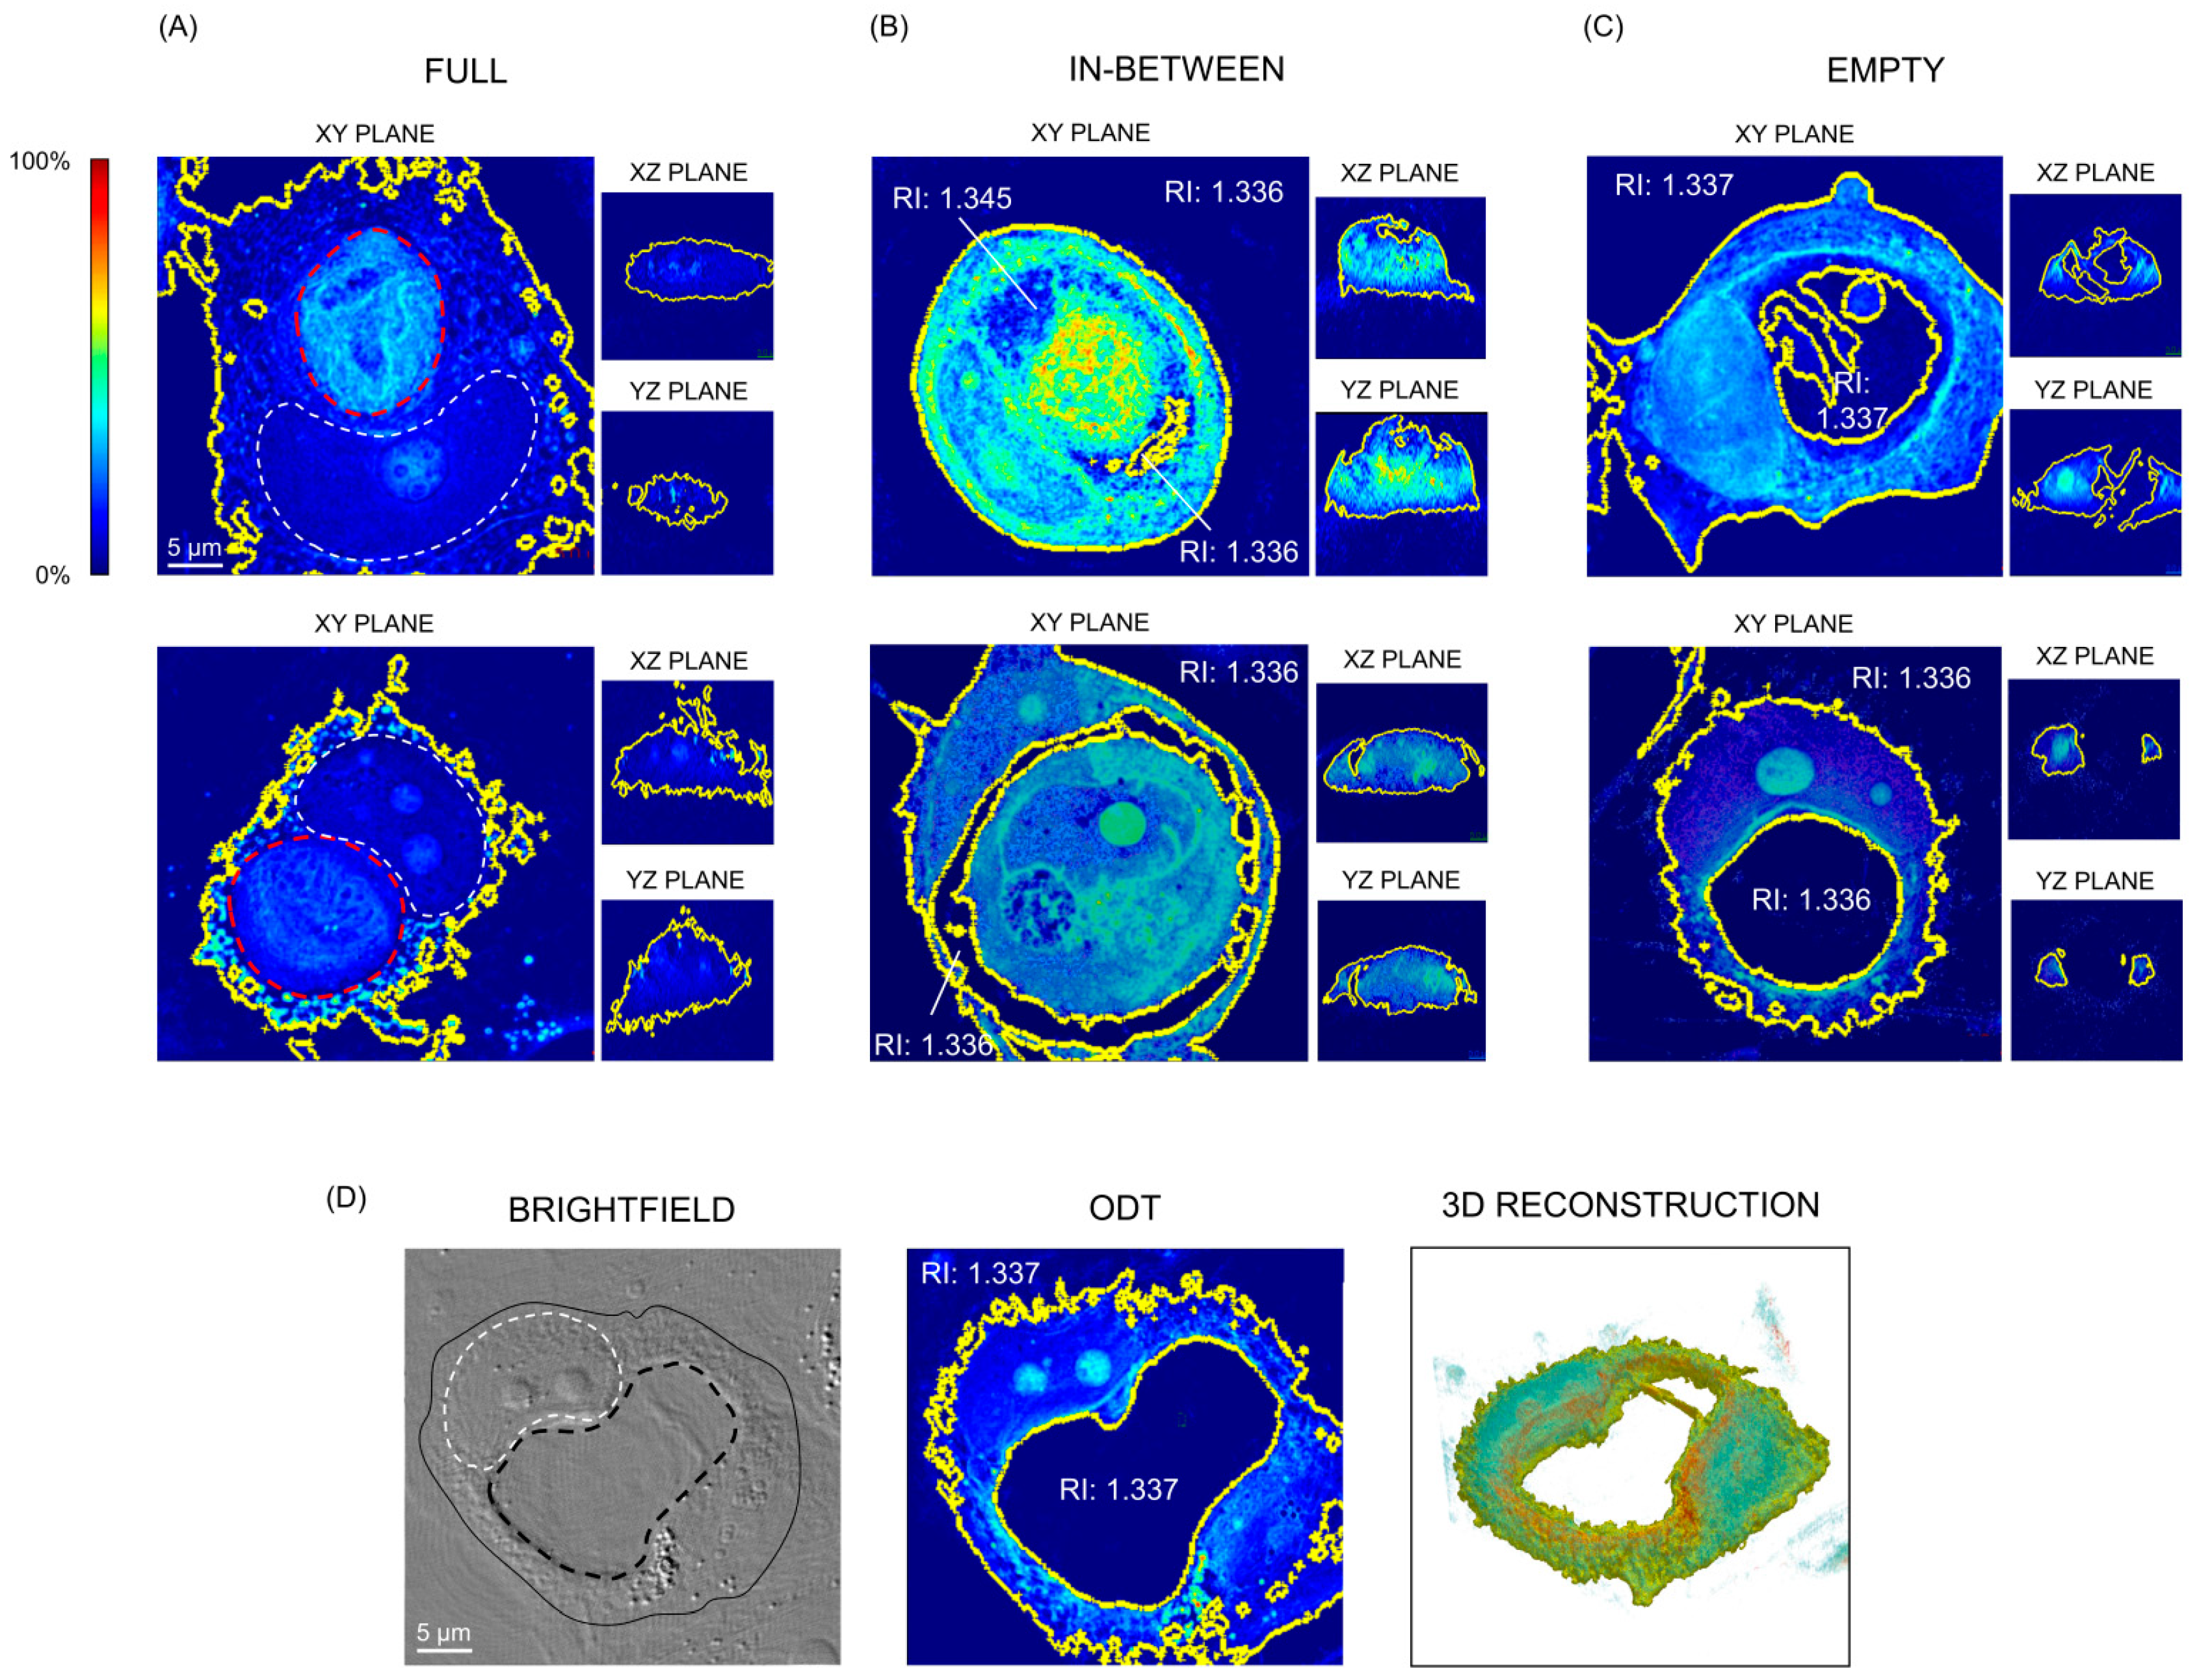
3.2. The Density of Vacuoles Measured by Optical Diffraction Tomography Is Comparable to That of the Aqueous Medium
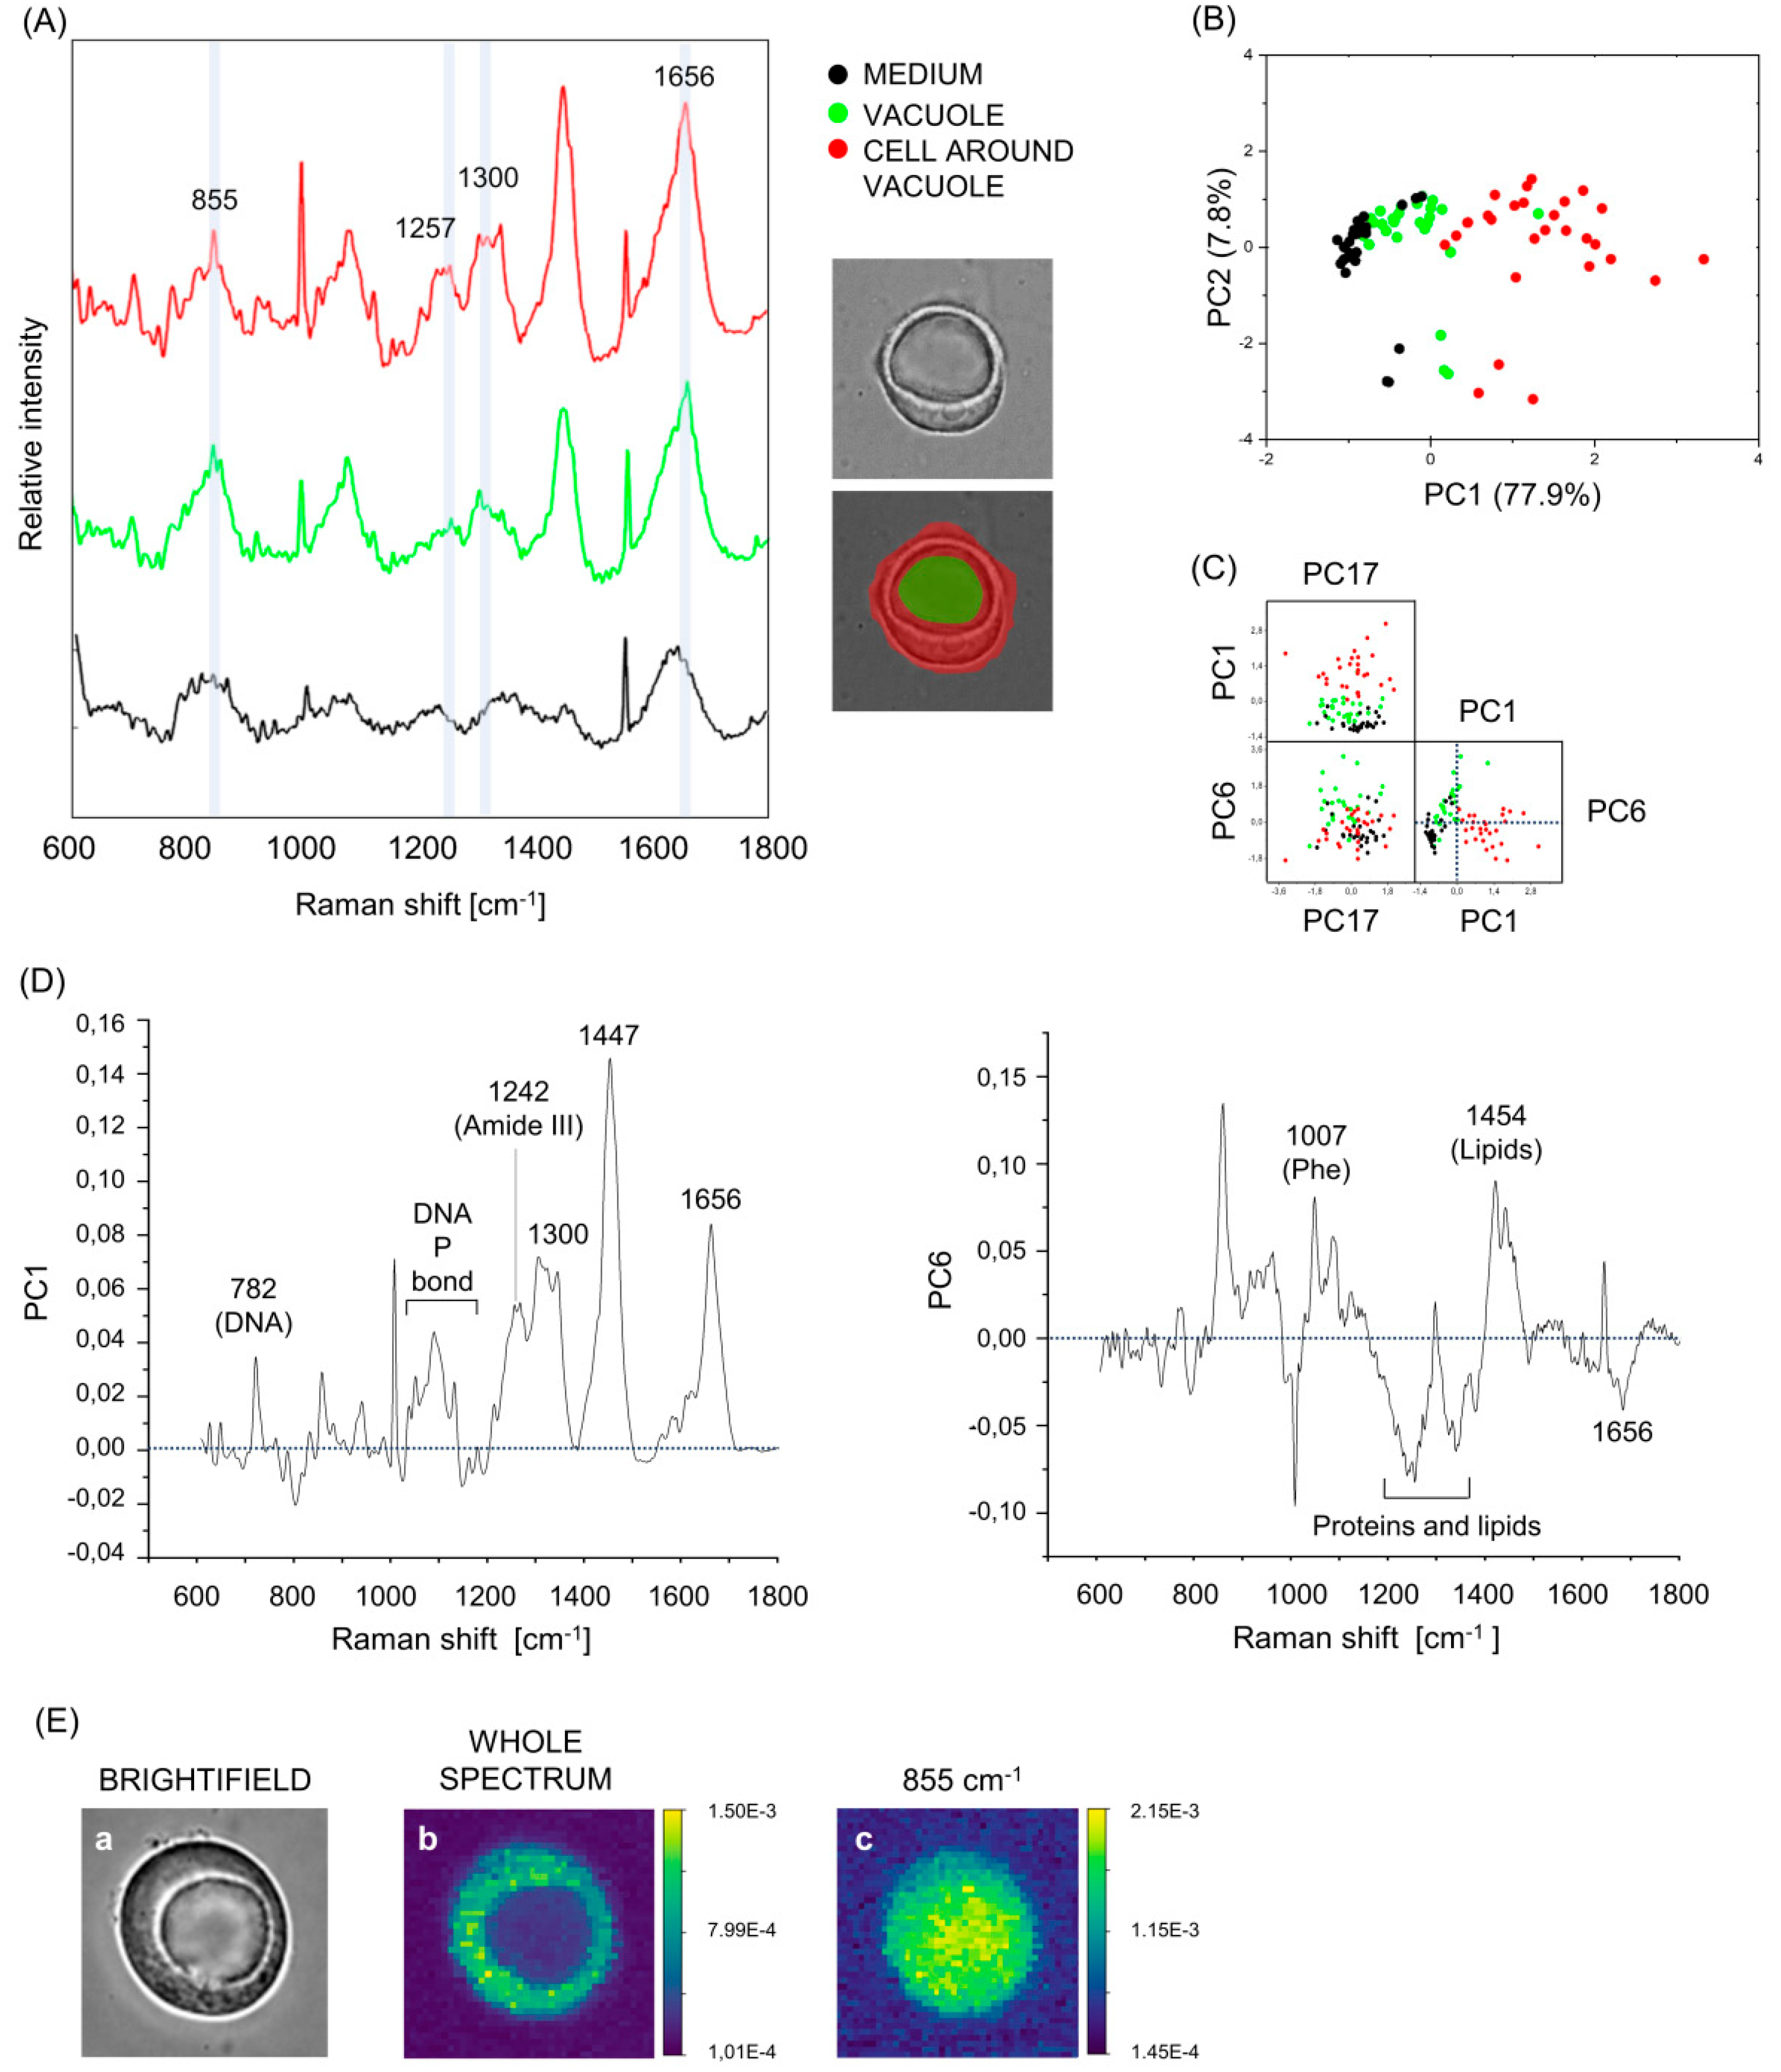
3.3. Raman Spectroscopy Measures Show That Vacuoles Contain Low-Concentrated Biomolecules
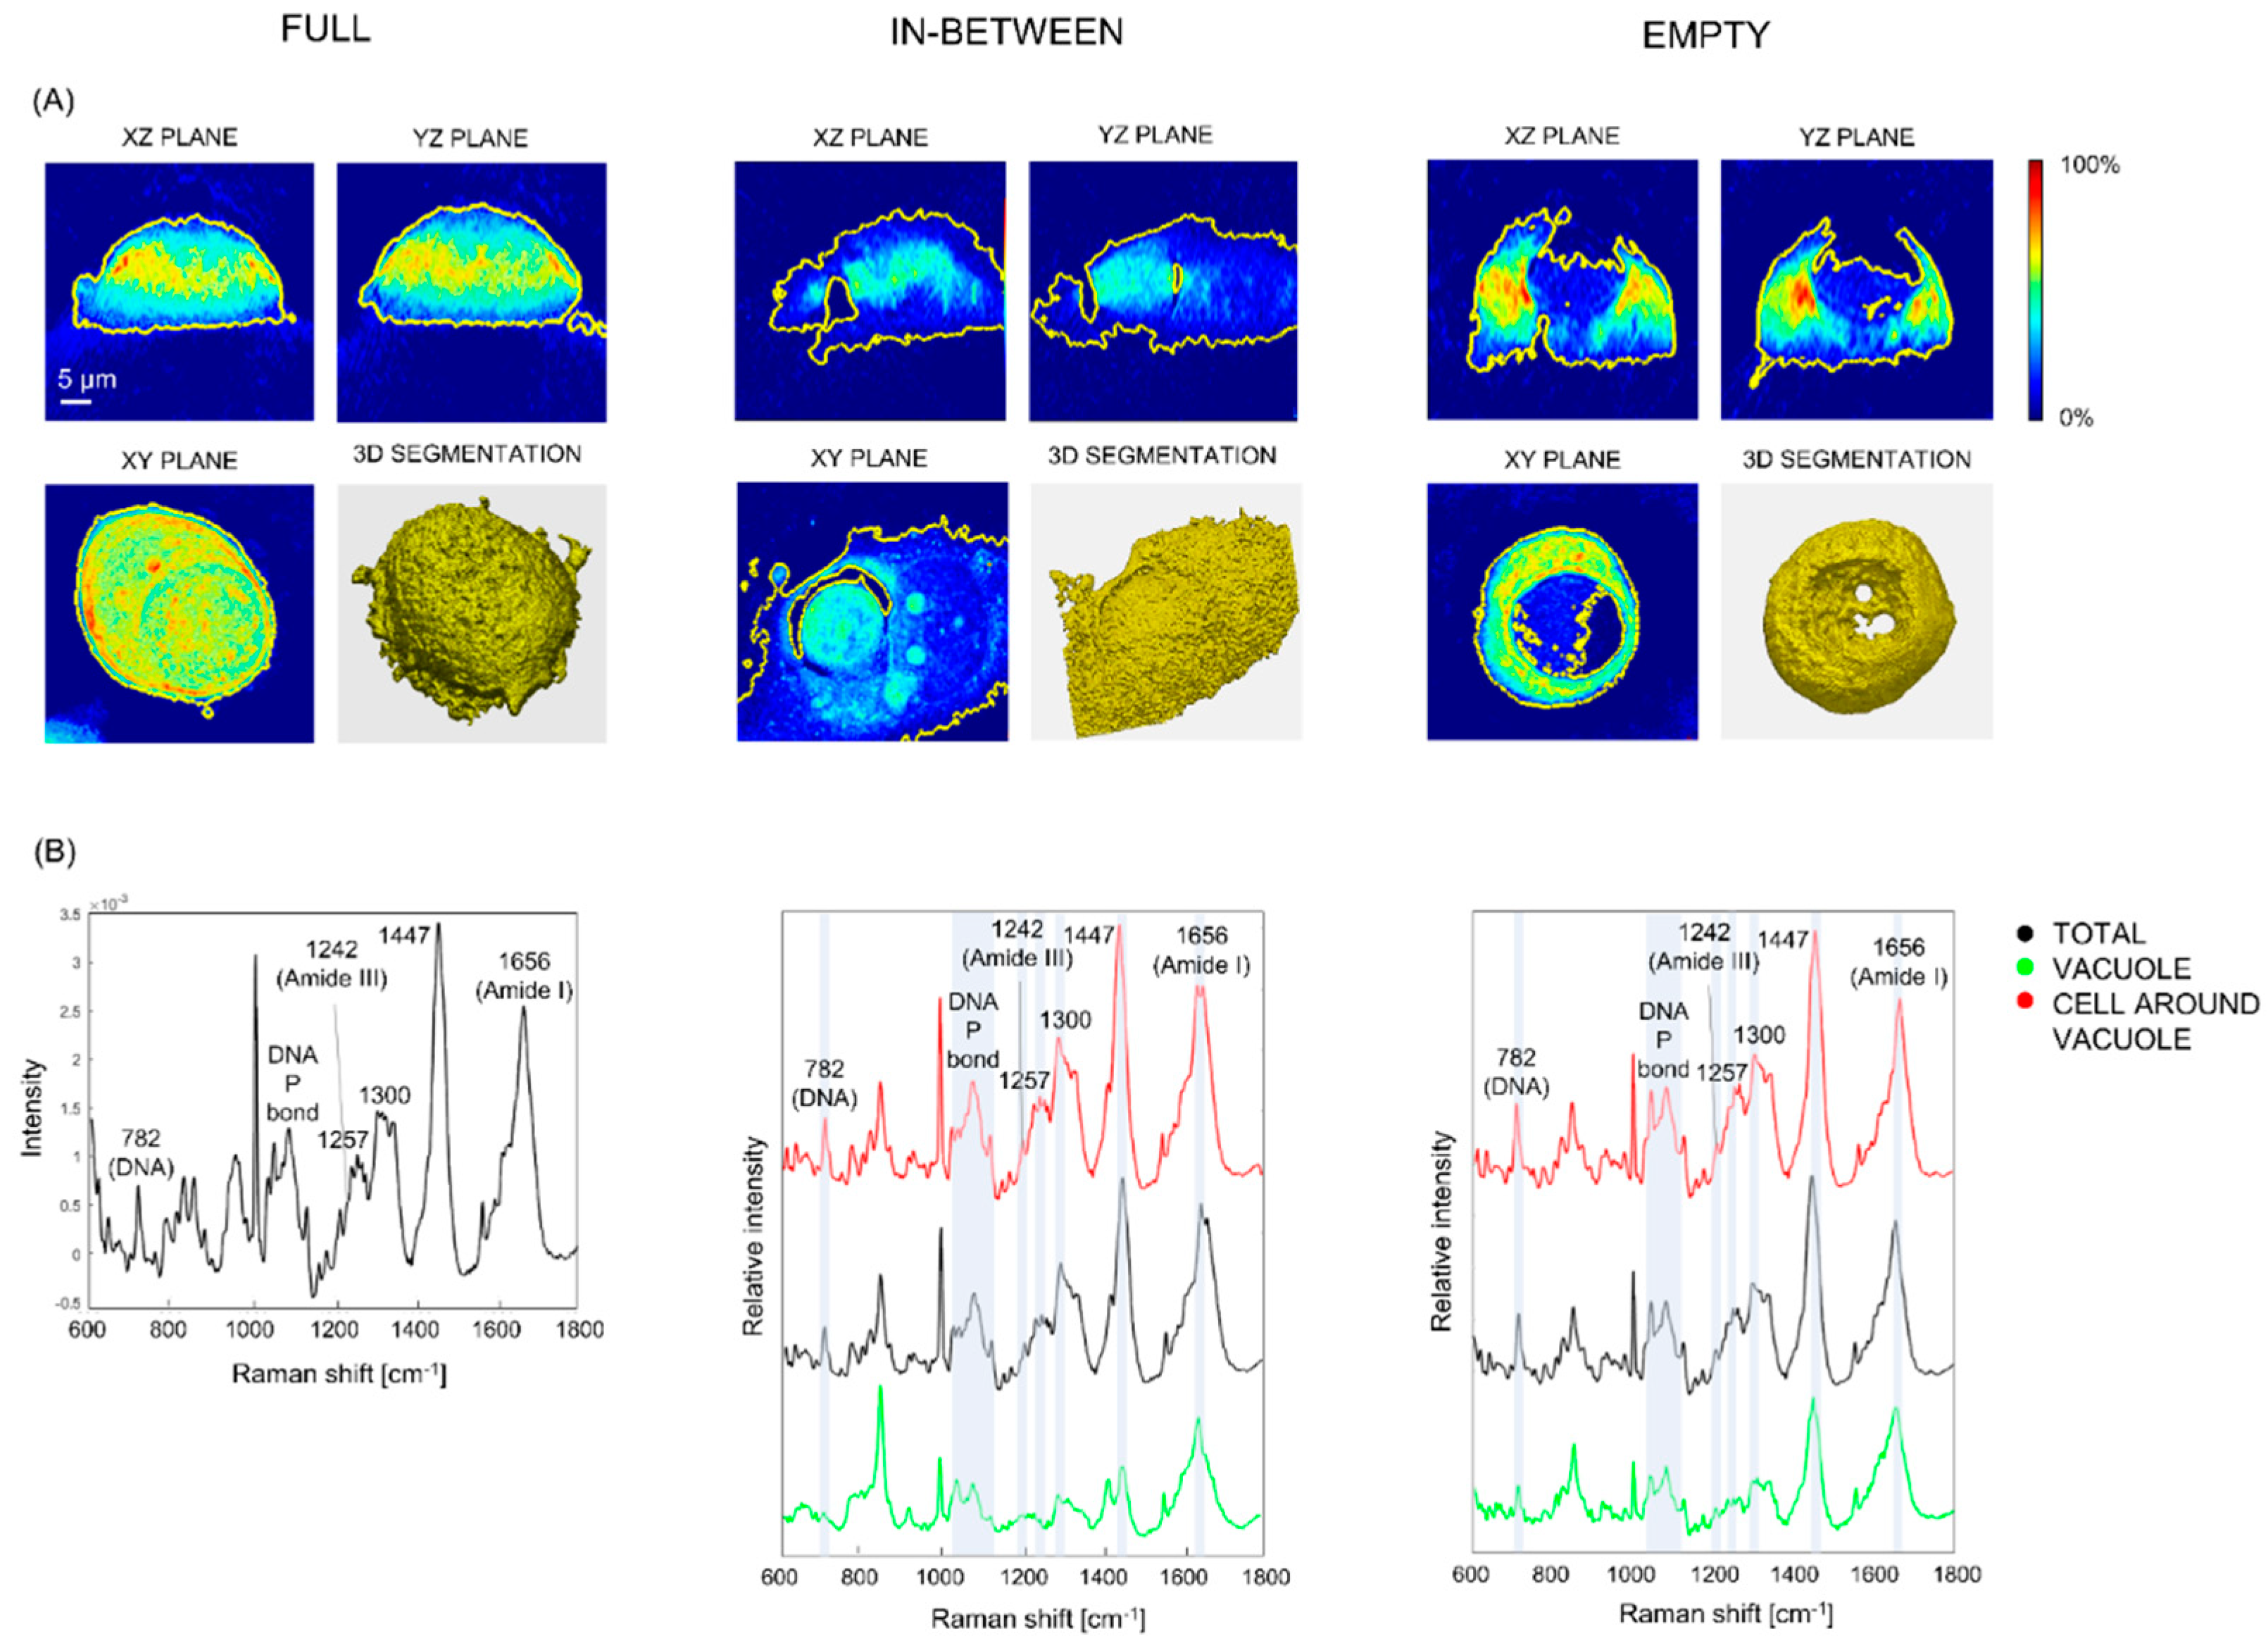
3.4. Vacuoles, Cells Surrounding the Vacuole and Aqueous Medium Can Be Distinguished on the Base of Their Raman Fingerprint
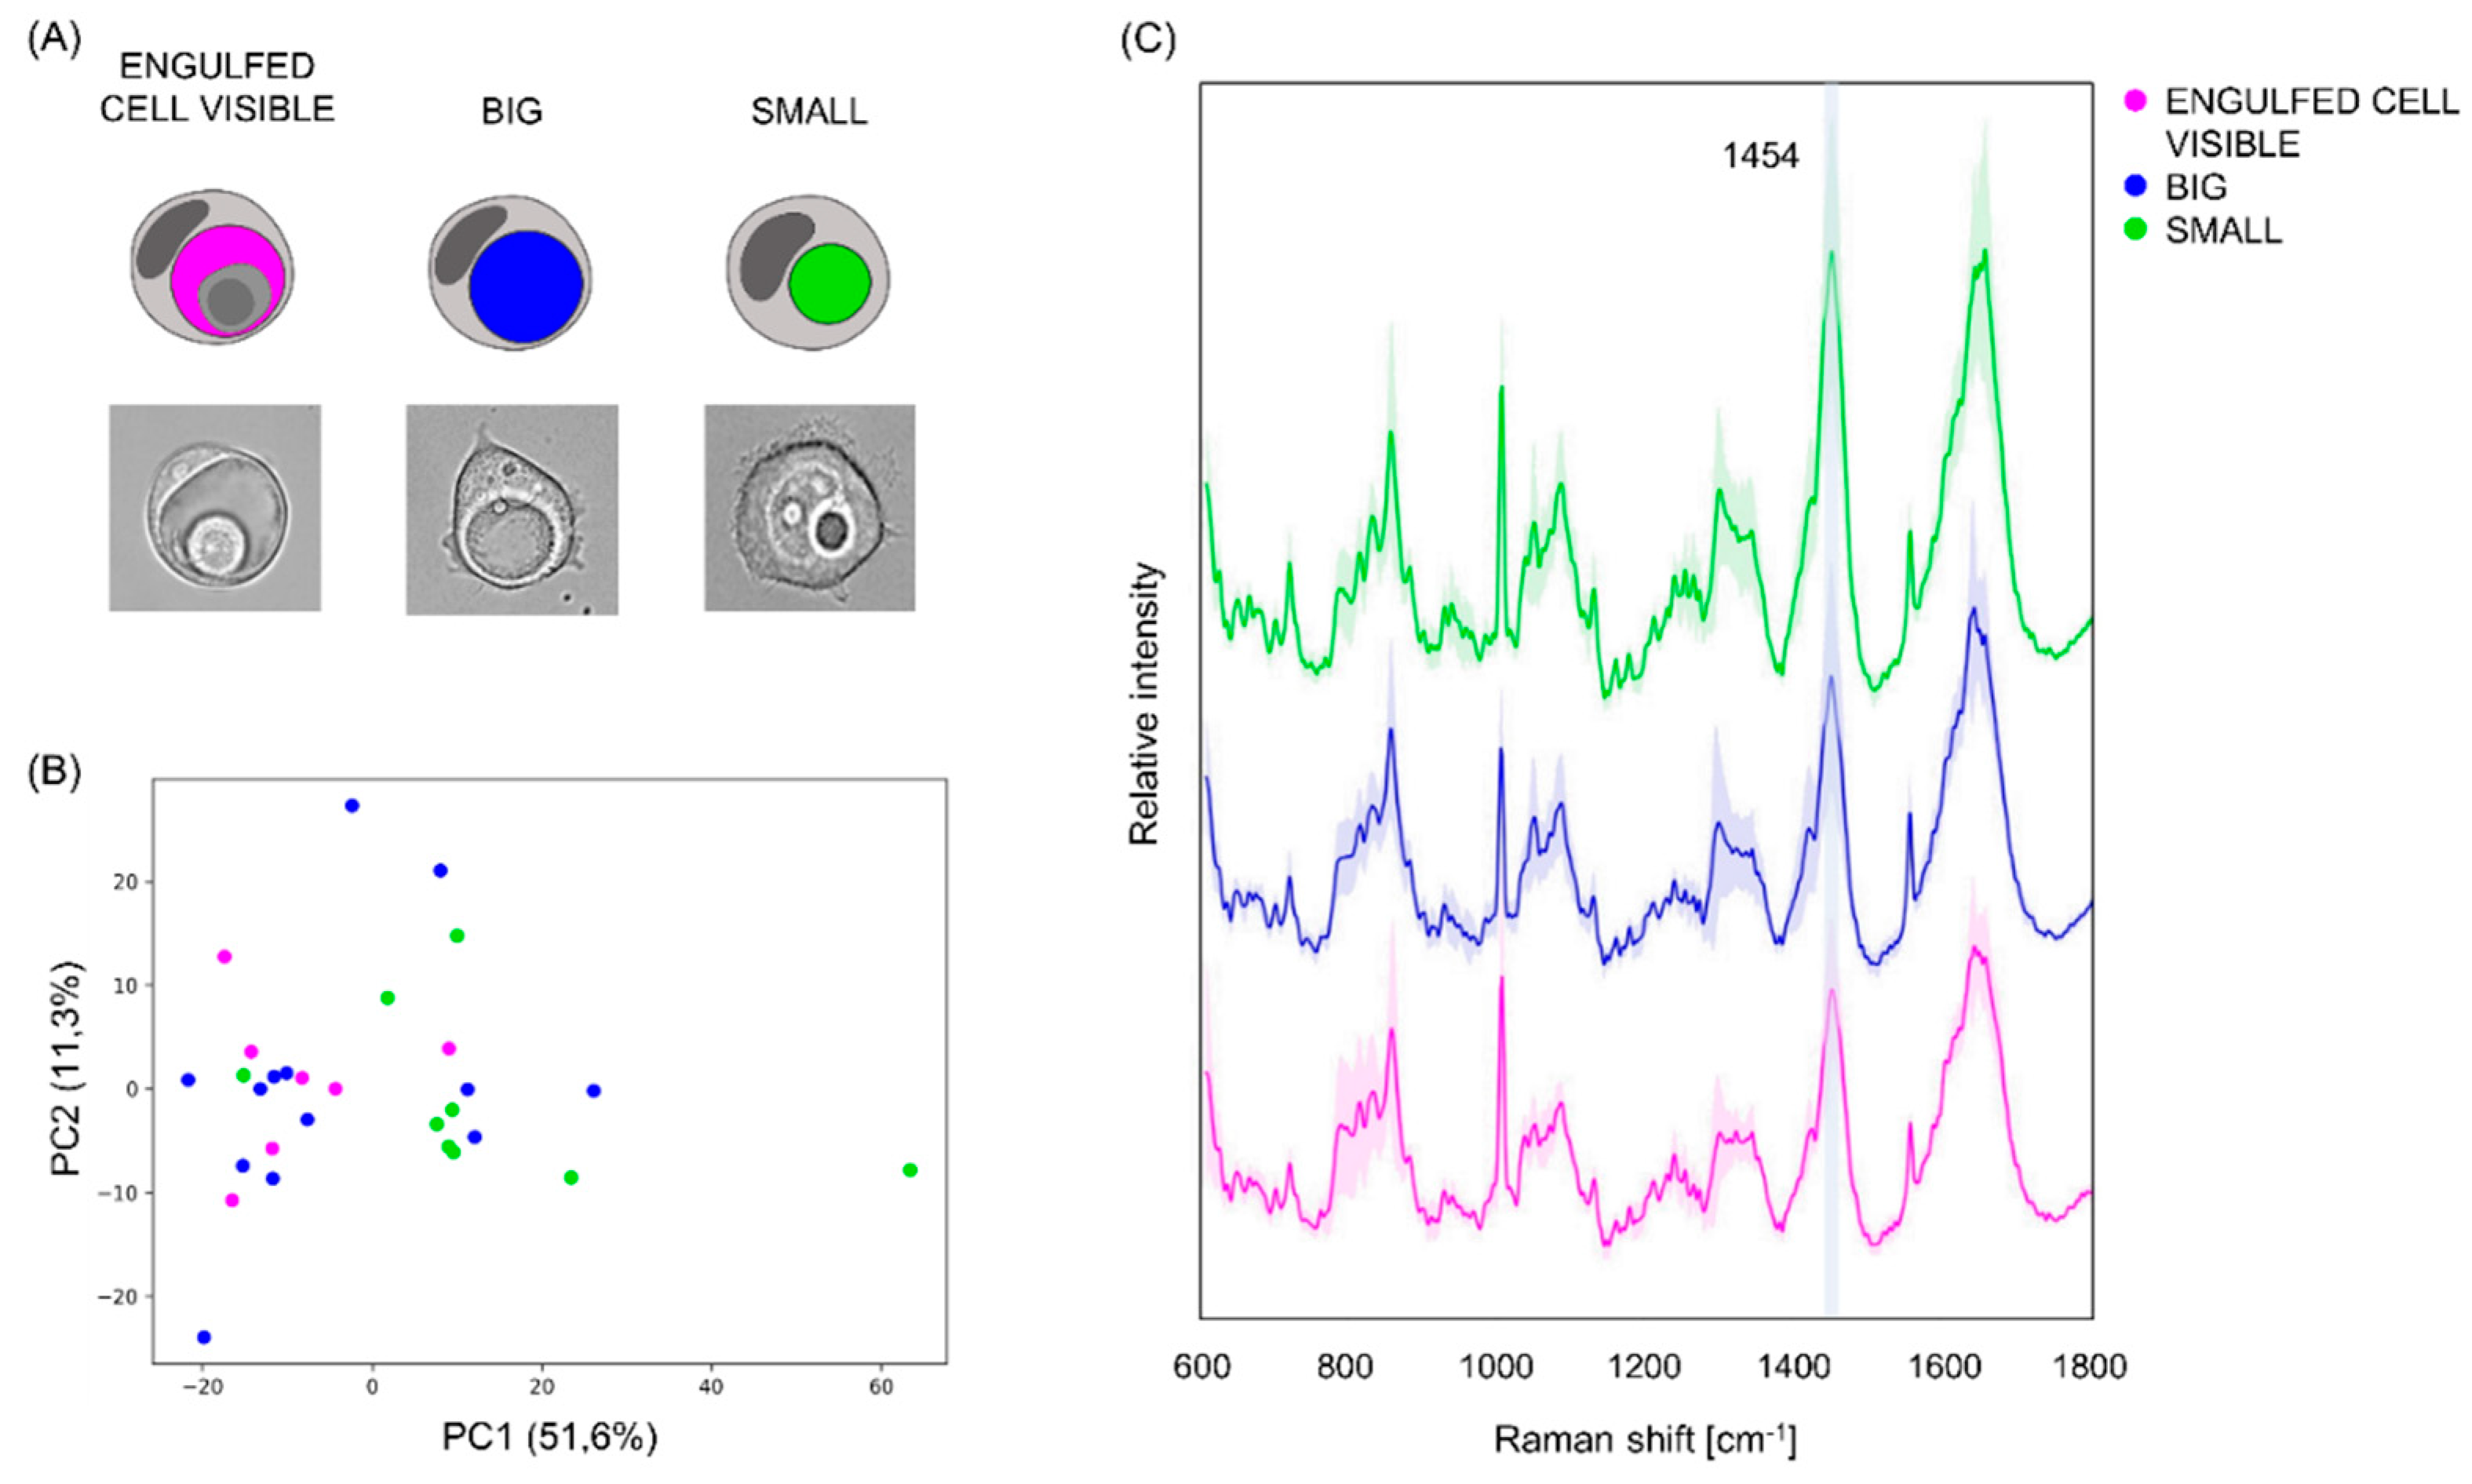
3.5. Vacuoles in Different Phases of the Engulfing Process Can Be Partially Separated on the Base of Their Raman Spectra
4. Discussion
Supplementary Materials
Author Contributions
Funding
Institutional Review Board Statement
Informed Consent Statement
Data Availability Statement
Acknowledgments
Conflicts of Interest
References
- Goetz, M.P.; Kalari, K.R.; Suman, V.J.; Moyer, A.M.; Yu, J.; Visscher, D.W.; Dockter, T.J.; Vedell, P.T.; Sinnwell, J.P.; Tang, X.; et al. Tumor Sequencing and Patient-Derived Xenografts in the Neoadjuvant Treatment of Breast Cancer. JNCI: Journal of the National Cancer Institute 2017, 109. [CrossRef]
- Wang, Y.; Xu, Y.; Chen, J.; Ouyang, T.; Li, J.; Wang, T.; Fan, Z.; Fan, T.; Lin, B.; Xie, Y. TP53 Mutations Are Associated with Higher Rates of Pathologic Complete Response to Anthracycline/Cyclophosphamide-Based Neoadjuvant Chemotherapy in Operable Primary Breast Cancer: TP53 Mutations and Response to Neoadjuvant Chemotherapy. Int. J. Cancer 2016, 138, 489–496. [CrossRef]
- Ungerleider, N.A.; Rao, S.G.; Shahbandi, A.; Yee, D.; Niu, T.; Frey, W.D.; Jackson, J.G. Breast Cancer Survival Predicted by TP53 Mutation Status Differs Markedly Depending on Treatment. Breast Cancer Res 2018, 20, 115. [CrossRef]
- Liao, C.; Xiao, Y.; Liu, L. The Dynamic Process and Its Dual Effects on Tumors of Therapy-Induced Senescence. Cancer Manag Res 2020, 12, 13553–13566. [CrossRef]
- Bresci, A.; Kim, J.H.; Ghislanzoni, S.; Manetti, F.; Wu, L.; Vernuccio, F.; Ceconello, C.; Sorrentino, S.; Barman, I.; Bongarzone, I.; et al. Noninvasive Morpho-Molecular Imaging Reveals Early Therapy-Induced Senescence in Human Cancer Cells. Sci. Adv. 2023, 9, eadg6231. [CrossRef]
- Tonnessen-Murray, C.A.; Frey, W.D.; Rao, S.G.; Shahbandi, A.; Ungerleider, N.A.; Olayiwola, J.O.; Murray, L.B.; Vinson, B.T.; Chrisey, D.B.; Lord, C.J.; et al. Chemotherapy-Induced Senescent Cancer Cells Engulf Other Cells to Enhance Their Survival. J Cell Biol 2019, 218, 3827–3844. [CrossRef]
- Bauer, M.F.; Hildebrand, L.S.; Rosahl, M.-C.; Erber, R.; Schnellhardt, S.; Büttner-Herold, M.; Putz, F.; Ott, O.J.; Hack, C.C.; Fietkau, R.; et al. Cell-In-Cell Structures in Early Breast Cancer Are Prognostically Valuable. Cells 2022, 12, 81. [CrossRef]
- Fais, S.; Overholtzer, M. Cell-in-Cell Phenomena in Cancer. Nat Rev Cancer 2018, 18, 758–766. [CrossRef]
- Su, Y.; Ren, H.; Tang, M.; Zheng, Y.; Zhang, B.; Wang, C.; Hou, X.; Niu, Z.; Wang, Z.; Gao, X.; et al. Role and Dynamics of Vacuolar PH during Cell-in-Cell Mediated Death. Cell Death Dis 2021, 12, 119. [CrossRef]
- Shubin, A.V.; Demidyuk, I.V.; Komissarov, A.A.; Rafieva, L.M.; Kostrov, S.V. Cytoplasmic Vacuolization in Cell Death and Survival. Oncotarget 2016, 7, 55863–55889. [CrossRef]
- Wada, Y. Vacuoles in Mammals: A Subcellular Structure Indispensable for Early Embryogenesis. BioArchitecture 2013, 3, 13–19. [CrossRef]
- Dong, D.; Huang, X.; Li, L.; Mao, H.; Mo, Y.; Zhang, G.; Zhang, Z.; Shen, J.; Liu, W.; Wu, Z.; et al. Super-Resolution Fluorescence-Assisted Diffraction Computational Tomography Reveals the Three-Dimensional Landscape of the Cellular Organelle Interactome. Light Sci Appl 2020, 9, 11. [CrossRef]
- Jensen, E.C. Use of Fluorescent Probes: Their Effect on Cell Biology and Limitations. Anat Rec 2012, 295, 2031–2036. [CrossRef]
- Sandoz, P.A.; Tremblay, C.; Equis, S.; Pop, S.; Pollaro, L.; Cotte, Y.; Van Der Goot, F.G.; Frechin, M. Label Free 3D Analysis of Organelles in Living Cells by Refractive Index Shows Pre-Mitotic Organelle Spinning in Mammalian Stem Cells; Cell Biology, 2018;
- Bakhshandeh, S.; Taïeb, H.M.; Schlüßler, R.; Kim, K.; Beck, T.; Taubenberger, A.; Guck, J.; Cipitria, A. Optical Quantification of Intracellular Mass Density and Cell Mechanics in 3D Mechanical Confinement. Soft Matter 2021, 17, 853–862. [CrossRef]
- Du, J.; Su, Y.; Qian, C.; Yuan, D.; Miao, K.; Lee, D.; Ng, A.H.C.; Wijker, R.S.; Ribas, A.; Levine, R.D.; et al. Raman-Guided Subcellular Pharmaco-Metabolomics for Metastatic Melanoma Cells. Nat Commun 2020, 11, 4830. [CrossRef]
- Kang, J.W.; Lue, N.; Kong, C.-R.; Barman, I.; Dingari, N.C.; Goldfless, S.J.; Niles, J.C.; Dasari, R.R.; Feld, M.S. Combined Confocal Raman and Quantitative Phase Microscopy System for Biomedical Diagnosis. Biomed. Opt. Express 2011, 2, 2484. [CrossRef]
- Kang, J.W.; Nguyen, F.T.; Lue, N.; Dasari, R.R.; Heller, D.A. Measuring Uptake Dynamics of Multiple Identifiable Carbon Nanotube Species via High-Speed Confocal Raman Imaging of Live Cells. Nano Lett. 2012, 12, 6170–6174. [CrossRef]
- Kang, J.; Singh, S.; Nguyen, F.; Lue, N.; Sung, Y.; So, P.; Dasari, R. Investigating Effects of Proteasome Inhibitor on Multiple Myeloma Cells Using Confocal Raman Microscopy. Sensors 2016, 16, 2133. [CrossRef]
- Singh, S.P.; Kang, S.; Kang, J.W.; So, P.T.C.; Dasari, R.R.; Yaqoob, Z.; Barman, I. Label-Free Characterization of Ultra Violet-Radiation-Induced Changes in Skin Fibroblasts with Raman Spectroscopy and Quantitative Phase Microscopy. Sci Rep 2017, 7, 10829. [CrossRef]
- Kobayashi-Kirschvink, K.J.; Gaddam, S.; James-Sorenson, T.; Grody, E.; Ounadjela, J.R.; Ge, B.; Zhang, K.; Kang, J.W.; Xavier, R.; So, P.T.C.; et al. Raman2RNA: Live-Cell Label-Free Prediction of Single-Cell RNA Expression Profiles by Raman Microscopy; Genomics, 2021;
- Shafei, A.; El-Bakly, W.; Sobhy, A.; Wagdy, O.; Reda, A.; Aboelenin, O.; Marzouk, A.; El Habak, K.; Mostafa, R.; Ali, M.A.; et al. A Review on the Efficacy and Toxicity of Different Doxorubicin Nanoparticles for Targeted Therapy in Metastatic Breast Cancer. Biomedicine & Pharmacotherapy 2017, 95, 1209–1218. [CrossRef]
- Argenziano, M.; Gigliotti, C.L.; Clemente, N.; Boggio, E.; Ferrara, B.; Trotta, F.; Pizzimenti, S.; Barrera, G.; Boldorini, R.; Bessone, F.; et al. Improvement in the Anti-Tumor Efficacy of Doxorubicin Nanosponges in In Vitro and in Mice Bearing Breast Tumor Models. Cancers 2020, 12, 162. [CrossRef]
- Kang, J.W.; Nguyen, F.T.; Lue, N. Temporal Imaging of Live Cells by High-Speed Confocal Raman Microscopy. Materials 2021, 14, 3732. [CrossRef]
- Singh, H.; Bishen, K.A.; Garg, D.; Sukhija, H.; Sharma, D.; Tomar, U. Fixation and Fixatives: Roles and Functions—A Short Review. Dental Journal of Advance Studies 2019, 07, 051–055. [CrossRef]
- Hobro, A.J.; Smith, N.I. An Evaluation of Fixation Methods: Spatial and Compositional Cellular Changes Observed by Raman Imaging. Vibrational Spectroscopy 2017, 91, 31–45. [CrossRef]
- Li, Y.; Almassalha, L.M.; Chandler, J.E.; Zhou, X.; Stypula-Cyrus, Y.E.; Hujsak, K.A.; Roth, E.W.; Bleher, R.; Subramanian, H.; Szleifer, I.; et al. The Effects of Chemical Fixation on the Cellular Nanostructure. Experimental Cell Research 2017, 358, 253–259. [CrossRef]
- Bouzy, P.; O’Grady, S.; Madupalli, H.; Tecklenburg, M.; Rogers, K.; Palombo, F.; Morgan, M.P.; Stone, N. A Time-Course Raman Spectroscopic Analysis of Spontaneous in Vitro Microcalcifications in a Breast Cancer Cell Line. Laboratory Investigation 2021, 101, 1267–1280. [CrossRef]
- Tang, M.; Xia, L.; Wei, D.; Yan, S.; Du, C.; Cui, H.-L. Distinguishing Different Cancerous Human Cells by Raman Spectroscopy Based on Discriminant Analysis Methods. Applied Sciences 2017, 7, 900. [CrossRef]
- Özdemir, A.; Şimay Demir, Y.D.; Yeşilyurt, Z.E.; Ark, M. Senescent Cells and SASP in Cancer Microenvironment: New Approaches in Cancer Therapy. In Advances in Protein Chemistry and Structural Biology; Elsevier, 2023; Vol. 133, pp. 115–158 ISBN 978-0-443-15820-9.
- Coppé, J.-P.; Desprez, P.-Y.; Krtolica, A.; Campisi, J. The Senescence-Associated Secretory Phenotype: The Dark Side of Tumor Suppression. Annu. Rev. Pathol. Mech. Dis. 2010, 5, 99–118. [CrossRef]
- Tonnessen-Murray, C.A.; Jackson, J.G. Engulfment and Cannibalism Drive Persistence of Chemotherapy-Treated Tumor Cells: Can They Be Targeted? Molecular & Cellular Oncology 2020, 7, 1688601. [CrossRef]
- Contorno, S.; Darienzo, R.E.; Tannenbaum, R. Evaluation of Aromatic Amino Acids as Potential Biomarkers in Breast Cancer by Raman Spectroscopy Analysis. Sci Rep 2021, 11, 1698. [CrossRef]
- Mehta, N.; Shaik, S.; Prasad, A.; Chaichi, A.; Sahu, S.P.; Hasan, S.M.A.; Donnarumma, F.; Murray, K.K.; Devireddy, R.; Gartia, M.R. Multimodal Label-Free Monitoring of Adipogenic Stem Cell Differentiation Using Endogenous Optical Biomarkers; Biophysics, 2020;
- Martins, I.; Raza, S.Q.; Voisin, L.; Dakhli, H.; Law, F.; De Jong, D.; Allouch, A.; Thoreau, M.; Brenner, C.; Deutsch, E.; et al. Entosis: The Emerging Face of Non-Cell-Autonomous Type IV Programmed Death. Biomedical Journal 2017, 40, 133–140. [CrossRef]
- Krajcovic, M.; Krishna, S.; Akkari, L.; Joyce, J.A.; Overholtzer, M. MTOR Regulates Phagosome and Entotic Vacuole Fission. MBoC 2013, 24, 3736–3745. [CrossRef]
- Lozano-Torres, B.; Estepa-Fernández, A.; Rovira, M.; Orzáez, M.; Serrano, M.; Martínez-Máñez, R.; Sancenón, F. The Chemistry of Senescence. Nat Rev Chem 2019, 3, 426–441. [CrossRef]
- Mitruka, M.; Gore, C.R.; Kumar, A.; Sarode, S.C.; Sharma, N.K. Undetectable Free Aromatic Amino Acids in Nails of Breast Carcinoma: Biomarker Discovery by a Novel Metabolite Purification VTGE System. Front. Oncol. 2020, 10, 908. [CrossRef]
- Bagheri, P.; Hoang, K.; Fung, A.A.; Hussain, S.; Shi, L. Visualizing Cancer Cell Metabolic Dynamics Regulated With Aromatic Amino Acids Using DO-SRS and 2PEF Microscopy. Front. Mol. Biosci. 2021, 8, 779702. [CrossRef]
- Herranz, N.; Gil, J. Mechanisms and Functions of Cellular Senescence. Journal of Clinical Investigation 2018, 128, 1238–1246. [CrossRef]
- Llop-Hernández, À.; Verdura, S.; Cuyàs, E.; Menendez, J.A. Nutritional Niches of Cancer Therapy-Induced Senescent Cells. Nutrients 2022, 14, 3636. [CrossRef]
- Kang, J.W.; So, P.T.C.; Dasari, R.R.; Lim, D.-K. High Resolution Live Cell Raman Imaging Using Subcellular Organelle-Targeting SERS-Sensitive Gold Nanoparticles with Highly Narrow Intra-Nanogap. Nano Lett. 2015, 15, 1766–1772. [CrossRef]
- Polli, D.; Kumar, V.; Valensise, C.M.; Marangoni, M.; Cerullo, G. Broadband Coherent Raman Scattering Microscopy. Laser & Photonics Reviews 2018, 12, 1800020. [CrossRef]
Disclaimer/Publisher’s Note: The statements, opinions and data contained in all publications are solely those of the individual author(s) and contributor(s) and not of MDPI and/or the editor(s). MDPI and/or the editor(s) disclaim responsibility for any injury to people or property resulting from any ideas, methods, instructions or products referred to in the content. |
© 2023 by the authors. Licensee MDPI, Basel, Switzerland. This article is an open access article distributed under the terms and conditions of the Creative Commons Attribution (CC BY) license (http://creativecommons.org/licenses/by/4.0/).


