Preprint
Article

Assessing the Benefits of Lifestyle Influences on Cardiovascular Health After Acute Coronary Syndrome

Altmetrics

Downloads

123

Views

54

Comments

0

Submitted:

09 October 2023

Posted:

11 October 2023

You are already at the latest version

Alerts
Abstract
Objective: The objective of our study was to explore the potential benefits of combining moderate alcohol consumption with regular vigorous physical activity on HDL-cholesterol levels and its potential positive impact on cardiovascular health. Material and method: The study comprised two groups: group A (102 patients) who consumed 1 gram of alcohol per day, specifically red wine, and increased their exercise levels in addition to their standard medical treatment, and group B (108 patients) who adhered only to their standard medical treatment. The patients were monitored for a year, during which various clinical parameters were observed. Results:Our study showed that moderate alcohol consumption, particularly red wine, along with increased physical activity levels, was associated with enhancements in exercise tolerance and elevated levels of HDL-cholesterol. Our findings suggest the efficacy of the intervention in improving lipid profiles, with the group that consumed alcohol as part of their treatment scheme, generally experiencing more pronounced positive effects. Statistically significant differences between groups in terms of angina evolution, AMI recurrence, or arrhythmias evolution were not found. However, there were important differences in terms of EF improvement and quality of life, with the alcohol consuming group displaying greater improvements in both aspects. Conclusions:In conclusion, our study emphasizes the potential benefits of combining moderate alcohol consumption, specifically red wine, with increased physical activity levels for improving exercise tolerance and enhancing HDL-cholesterol levels. However, further research and clinical trials are essential to fully understand the mechanisms and optimize the integration of these lifestyle elements for improved cardiovascular health outcomes.
Keywords: 
Subject: Medicine and Pharmacology  -   Cardiac and Cardiovascular Systems

Introduction

The recurrence of acute coronary syndrome, arising from atherogenesis, stands as a formidable negative prognostic determinant following a major coronary event. This recurrent condition poses significant challenges in managing patients who have already suffered from a coronary event, necessitating comprehensive strategies to mitigate its potential adverse outcomes.
In the quest for effective prevention strategies, numerous global studies have been dedicated to addressing the recurrence of acute coronary syndrome. These initiatives encompass multifaceted approaches, ranging from targeted lipid-lowering treatments [1,2,3,4] to comprehensive rehabilitation programs that integrate physical exercises to enhance cardiac performance [5,6,7,8]. Lifestyle adjustments, such as stress management, smoking cessation, and adopting a low-fat diet, in addition to the use of beta-blockers and angiotensin-converting enzyme inhibitors (ACEI), are also integral components of these preventive strategies. [3,9,10,11] Furthermore, the prevention of heart failure, diastolic dysfunction, or ventricular aneurysms is equally crucial, often necessitating invasive treatment approaches. [3,9,10,11]
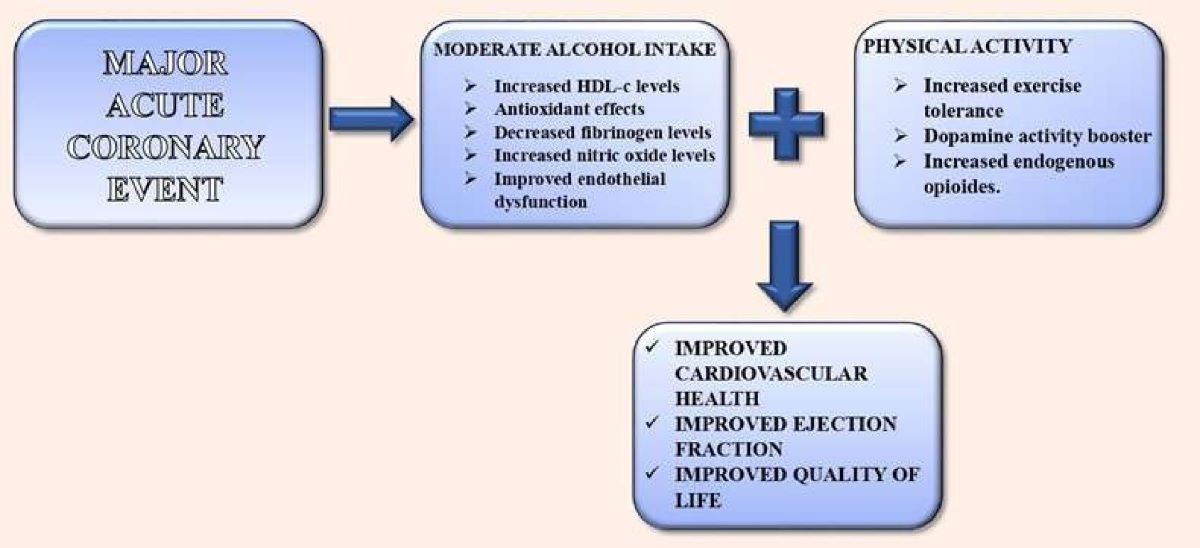
To recommend the moderate alcohol consumption (1 gram/day), we considered the established benefits associated with alcohol intake, including the elevation of HDL-cholesterol levels [12,13,14,15,16,17,18,19,20,21], the influence on platelet adhesion [13] through the antioxidant effects of resveratrol and quercetin [13,14,19,22], and the reduction of fibrinogen levels, while enhancing the production of nitric oxide [22]. These combined effects contribute to the stabilization of atherosclerotic plaques and the improvement of endothelial dysfunction. [3,4,9,10,22]
The study aims to delve into the impacts of moderate alcohol consumption and increased physical activity on cardiovascular health, seeking to fill existing knowledge gaps and contribute to evidence-based practices in cardiovascular care.
As we progress in our understanding of how alcohol consumption and exercise intertwine, it becomes imperative to discern the intricate ways in which their combined effects can be harnessed to positively impact cardiovascular health and potentially extend their benefits beyond. Through careful examination and rigorous clinical trials, we aspire to unlock valuable insights that could revolutionize the approach to preventive measures and optimize patient outcomes in the realm of cardiovascular health.

Materials and methods

A total number of 210 patients were included in the study (120 men, 90 women), aged between 48 to 82 years old. It was an observational, retrospective study, taking place over the course of one year (July 2022 – August 2023). The study sample was selected from among the patients who were diagnosed with an acute coronary event in the Cardiology Department, six months prior to the beginning of the study, based on the clinical and paraclinical examinations. The study population available was 513 patients, out of which we had chosen 210 participants who met the inclusion criteria.
The study protocol was approved by the ethics committee of Bihor County Clinical Emergency Hospital.
The inclusion criteria were:
Acute myocardial infarction (AMI) diagnosis;
Clinical presentation (chest pain over 30 minutes, dyspnea, diaphoresis, etc.);
Ami-specific electrocardiographic findings;
Elevated cardiac enzyme levels;
Treatment compliance and adherence;
Daily alcohol intake (1 gram/day) or no alcohol consumption after discharge from the hospital;
Regular physical activity or decreased/no physical activity after discharge.
The exclusion criteria were:
Other major coronary event diagnosis (unstable angina, ischemic heart failure, sudden death);
Treatment non-adherence and non-compliance.
The participants were divided into two groups:
-
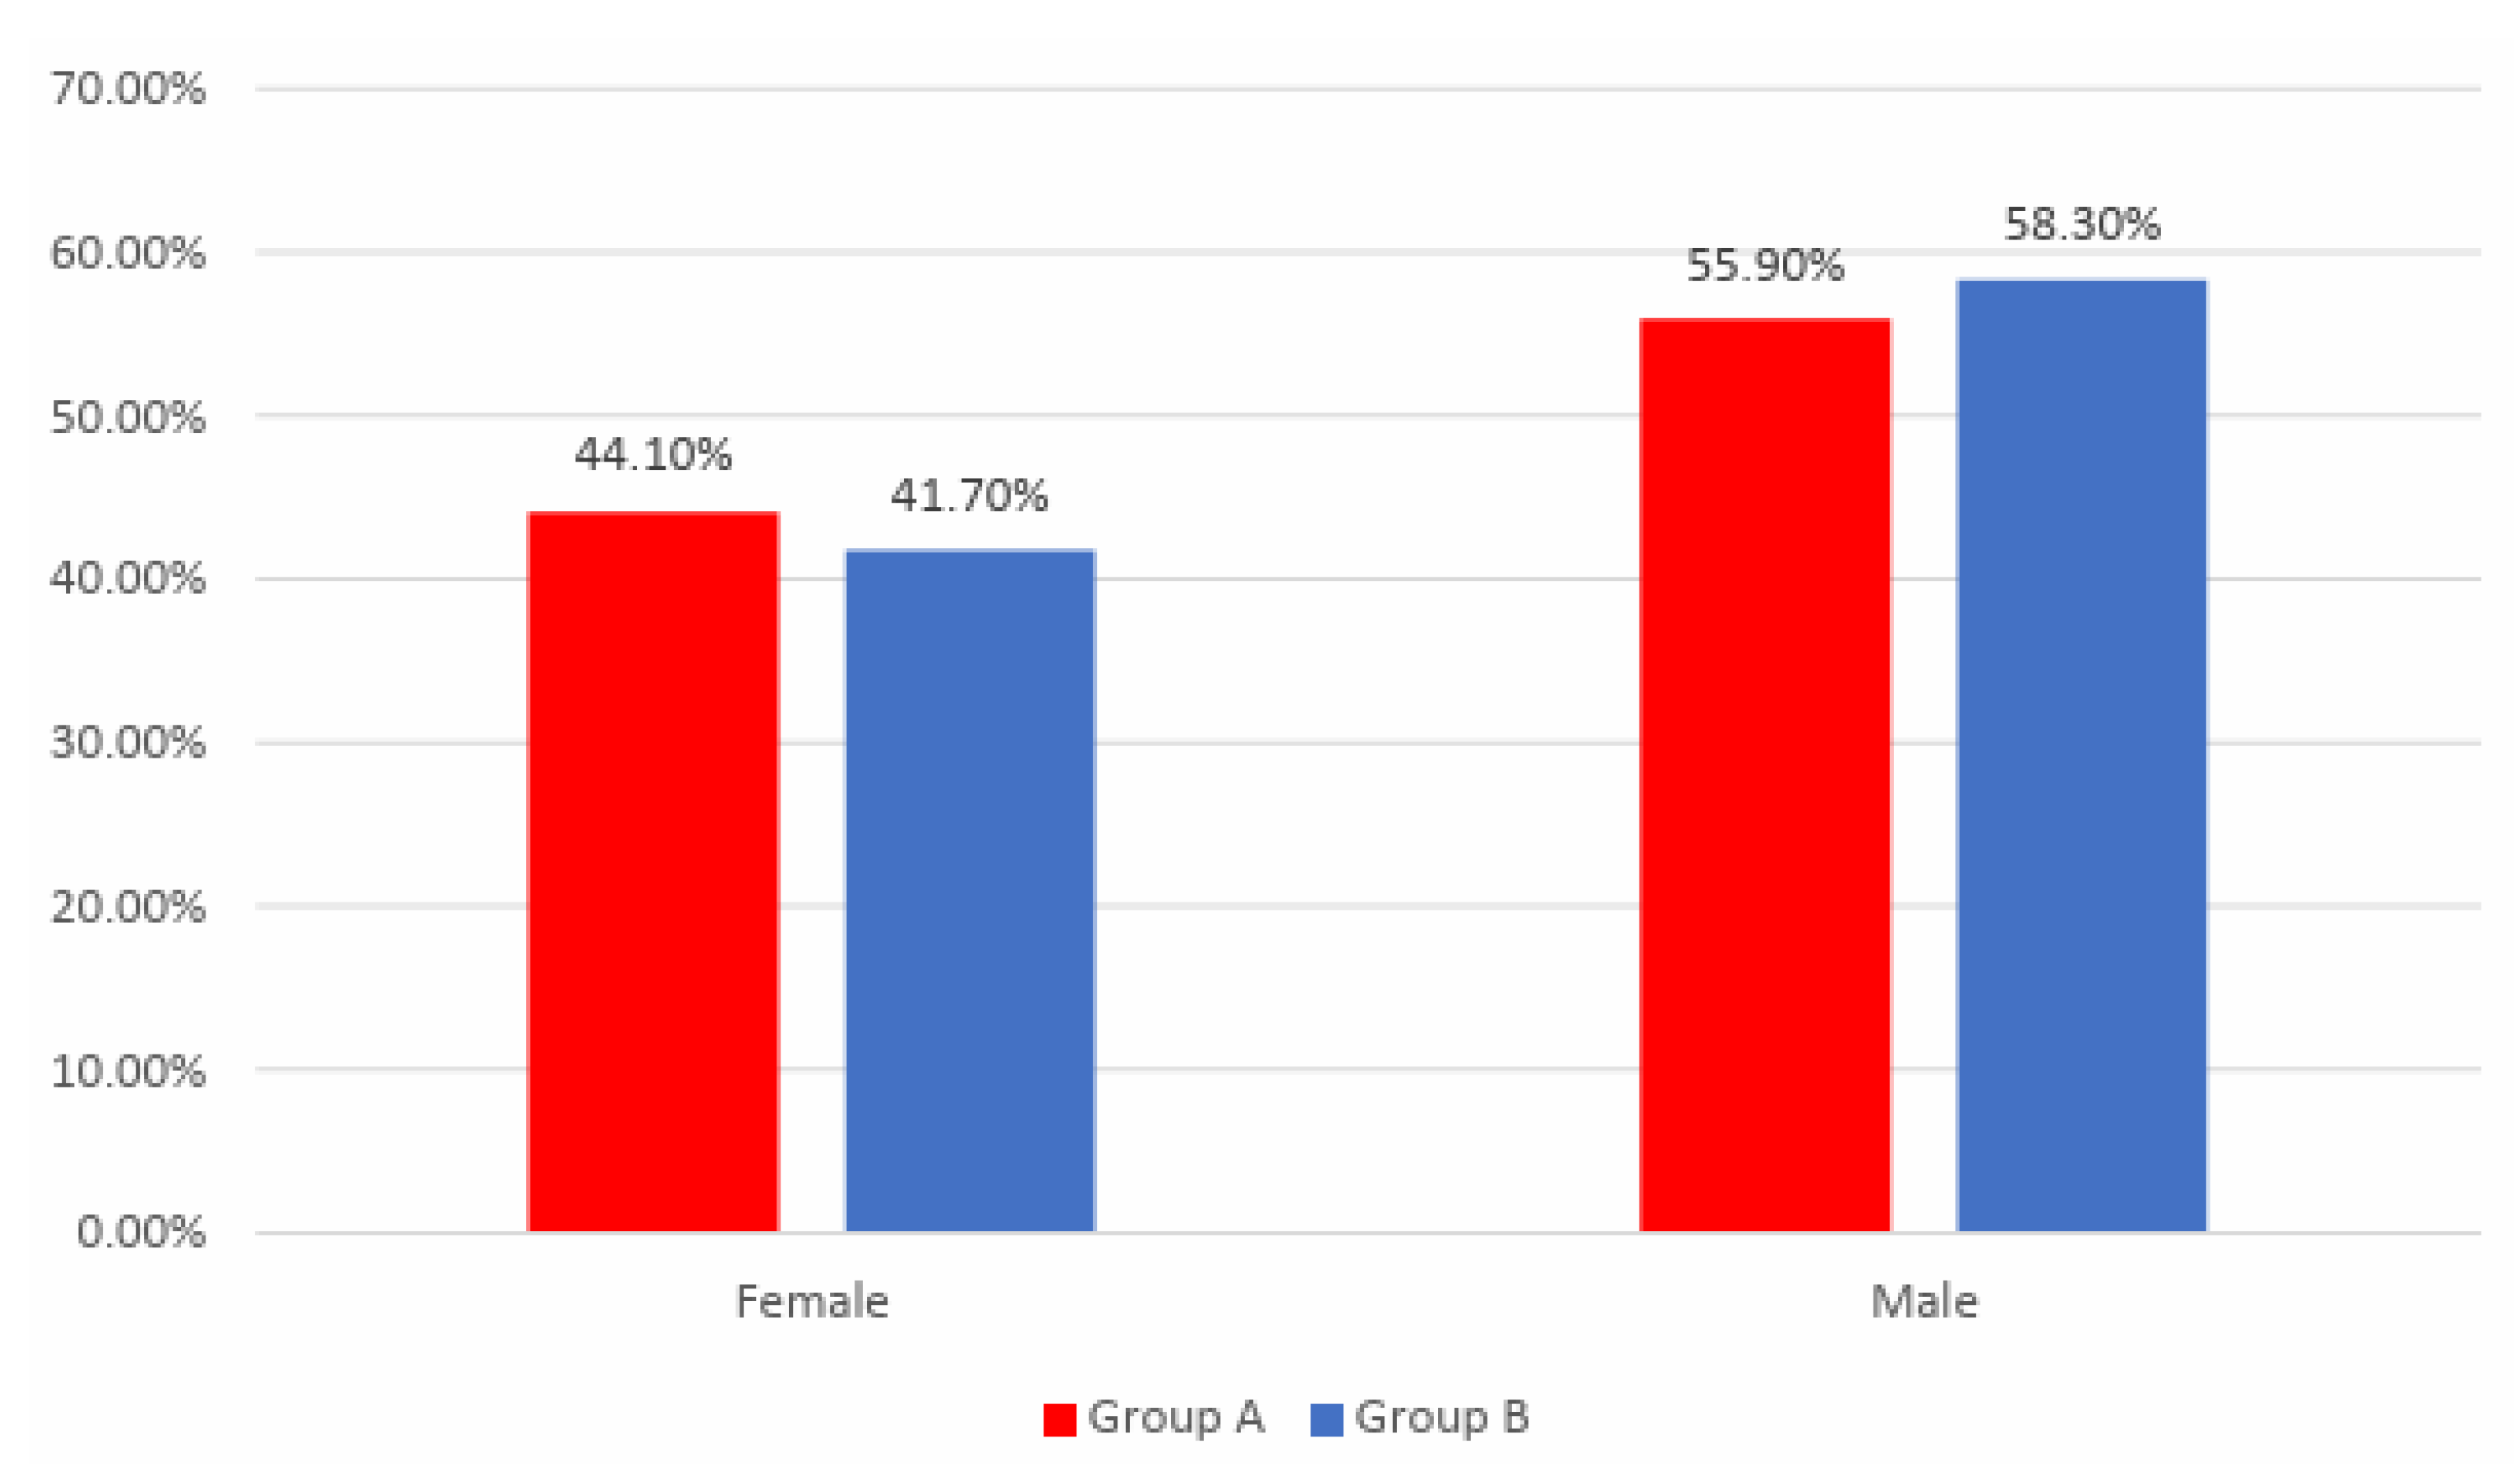
group A, the treatment group, consisted of 102 patients (57 men – 55,88% and 45 women – 44,11%), diagnosed with acute myocardial infarction, based on clinical presentations, electrocardiographic findings, and elevated cardiac enzyme levels, who consumed 1 gram of alcohol per day, more specifically red wine, along their concurrent therapy, while also increasing their exercise levels.
-
group B comprised 108 patients (63 men – 58,33% and 45 women – 41,66%), diagnosed with AMI, based on clinical presentations, EKG findings and elevated cardiac enzyme levels, solely adhering to their standard medical treatment regimen.
The average age for group A was 56,8 ± 7,1 years old, and 59,4 ± 6,7 years old for group B.
The standard medical treatment regimen consisted of beta-blockers, antiplatelet agents, ACEI, statins, nitrates, and antiarrhythmic drugs.
During the hospitalization period of patients who experienced major coronary events, we studied the following parameters: AMI affected area, systolic disfunction and arrythmias.
The two patient groups did not exhibit significant differences in terms of age, the affected area by AMI, and the post-major coronary event progression.
We monitored both cohorts for one year, starting with the hospitalization period for AMI and continuing with outpatient ward data, as well as discussions with the patients’ primary care physicians. Throughout this period, we observed the ensuing clinical parameters:
Enhancement in exercise tolerance, ascertained by tracking activity levels using a cicloergometric bicycle, and the increment of the walking perimeter;
Elevated levels of hdl-cholesterol;
Levels of ldl-cholesterol and triglycerides;
Stability of the atherosclerotic plaques, gauged through the incidence of angina episodes, ami recurrence affecting the same or distinct areas, or instances of arrythmias;
Evolution of the ejection fraction;
Improvements in the quality of life.
All the data from the study was analyzed using IBM SPSS Statistics 25 and illustrated using Microsoft Office Excel/Word 2021. Quantitative variables were tested for normal distribution using the Shapiro-Wilk Test and were written as averages with standard deviations or medians with interquartile ranges. Quantitative independent variables with non-parametric distribution were tested between groups using Mann-Whitney U tests. Quantitative variables with non-parametric distribution measured on related samples were tested between measurements (beginning vs. end of study) using the Related-Samples Wilcoxon Signed Rank Test.
Qualitative variables were written as counts or percentages and differences between independent groups were tested using Fisher’s Exact test. Z-tests with Bonferroni corrections were used to further detail the results obtained in the contingency tables. Differences between qualitative variables measured on related samples were tested between measurements (beginning vs. end of study) using the Related-Samples McNemar / Marginal Homogeneity Tests (with further McNemar tests with Bonferroni correction).
The statistically significant value was considered a value of p˂0.05.

Results

Data analysis

Data from Figure 1 shows the distribution of the patients according to analyzed groups and gender. Gender frequencies between the analyzed groups were not statistically significant in this study (p=0.781).
Data from Table 1 shows the comparison of age between analyzed groups. Distribution of age was non-parametric in both groups (p<0.05). Differences between groups were statistically significant (p=0.043), patients in Group A were significantly younger (median age = 65, IQR = 59-72) in comparison to patients in Group B (median age = 67.5, IQR = 60.25-74.75).
Data from Table 2 shows the distribution of the patients according to analyzed groups and AMI affected territory. Frequencies of different AMI affected territory between the analyzed groups were not statistically significant in this study (p=0.897).
Data from Table 3 shows the distribution of the patients according to analyzed groups and existence of systolic disfunction during hospitalization. Frequencies of systolic disfunction during hospitalization between the analyzed groups were not statistically significant in this study (p=1.000).
Data from Table 4 shows the distribution of the patients according to analyzed groups and existence of arrythmias during hospitalization. Frequencies of arrythmias during hospitalization between the analyzed groups were not statistically significant in this study (p=0.556).
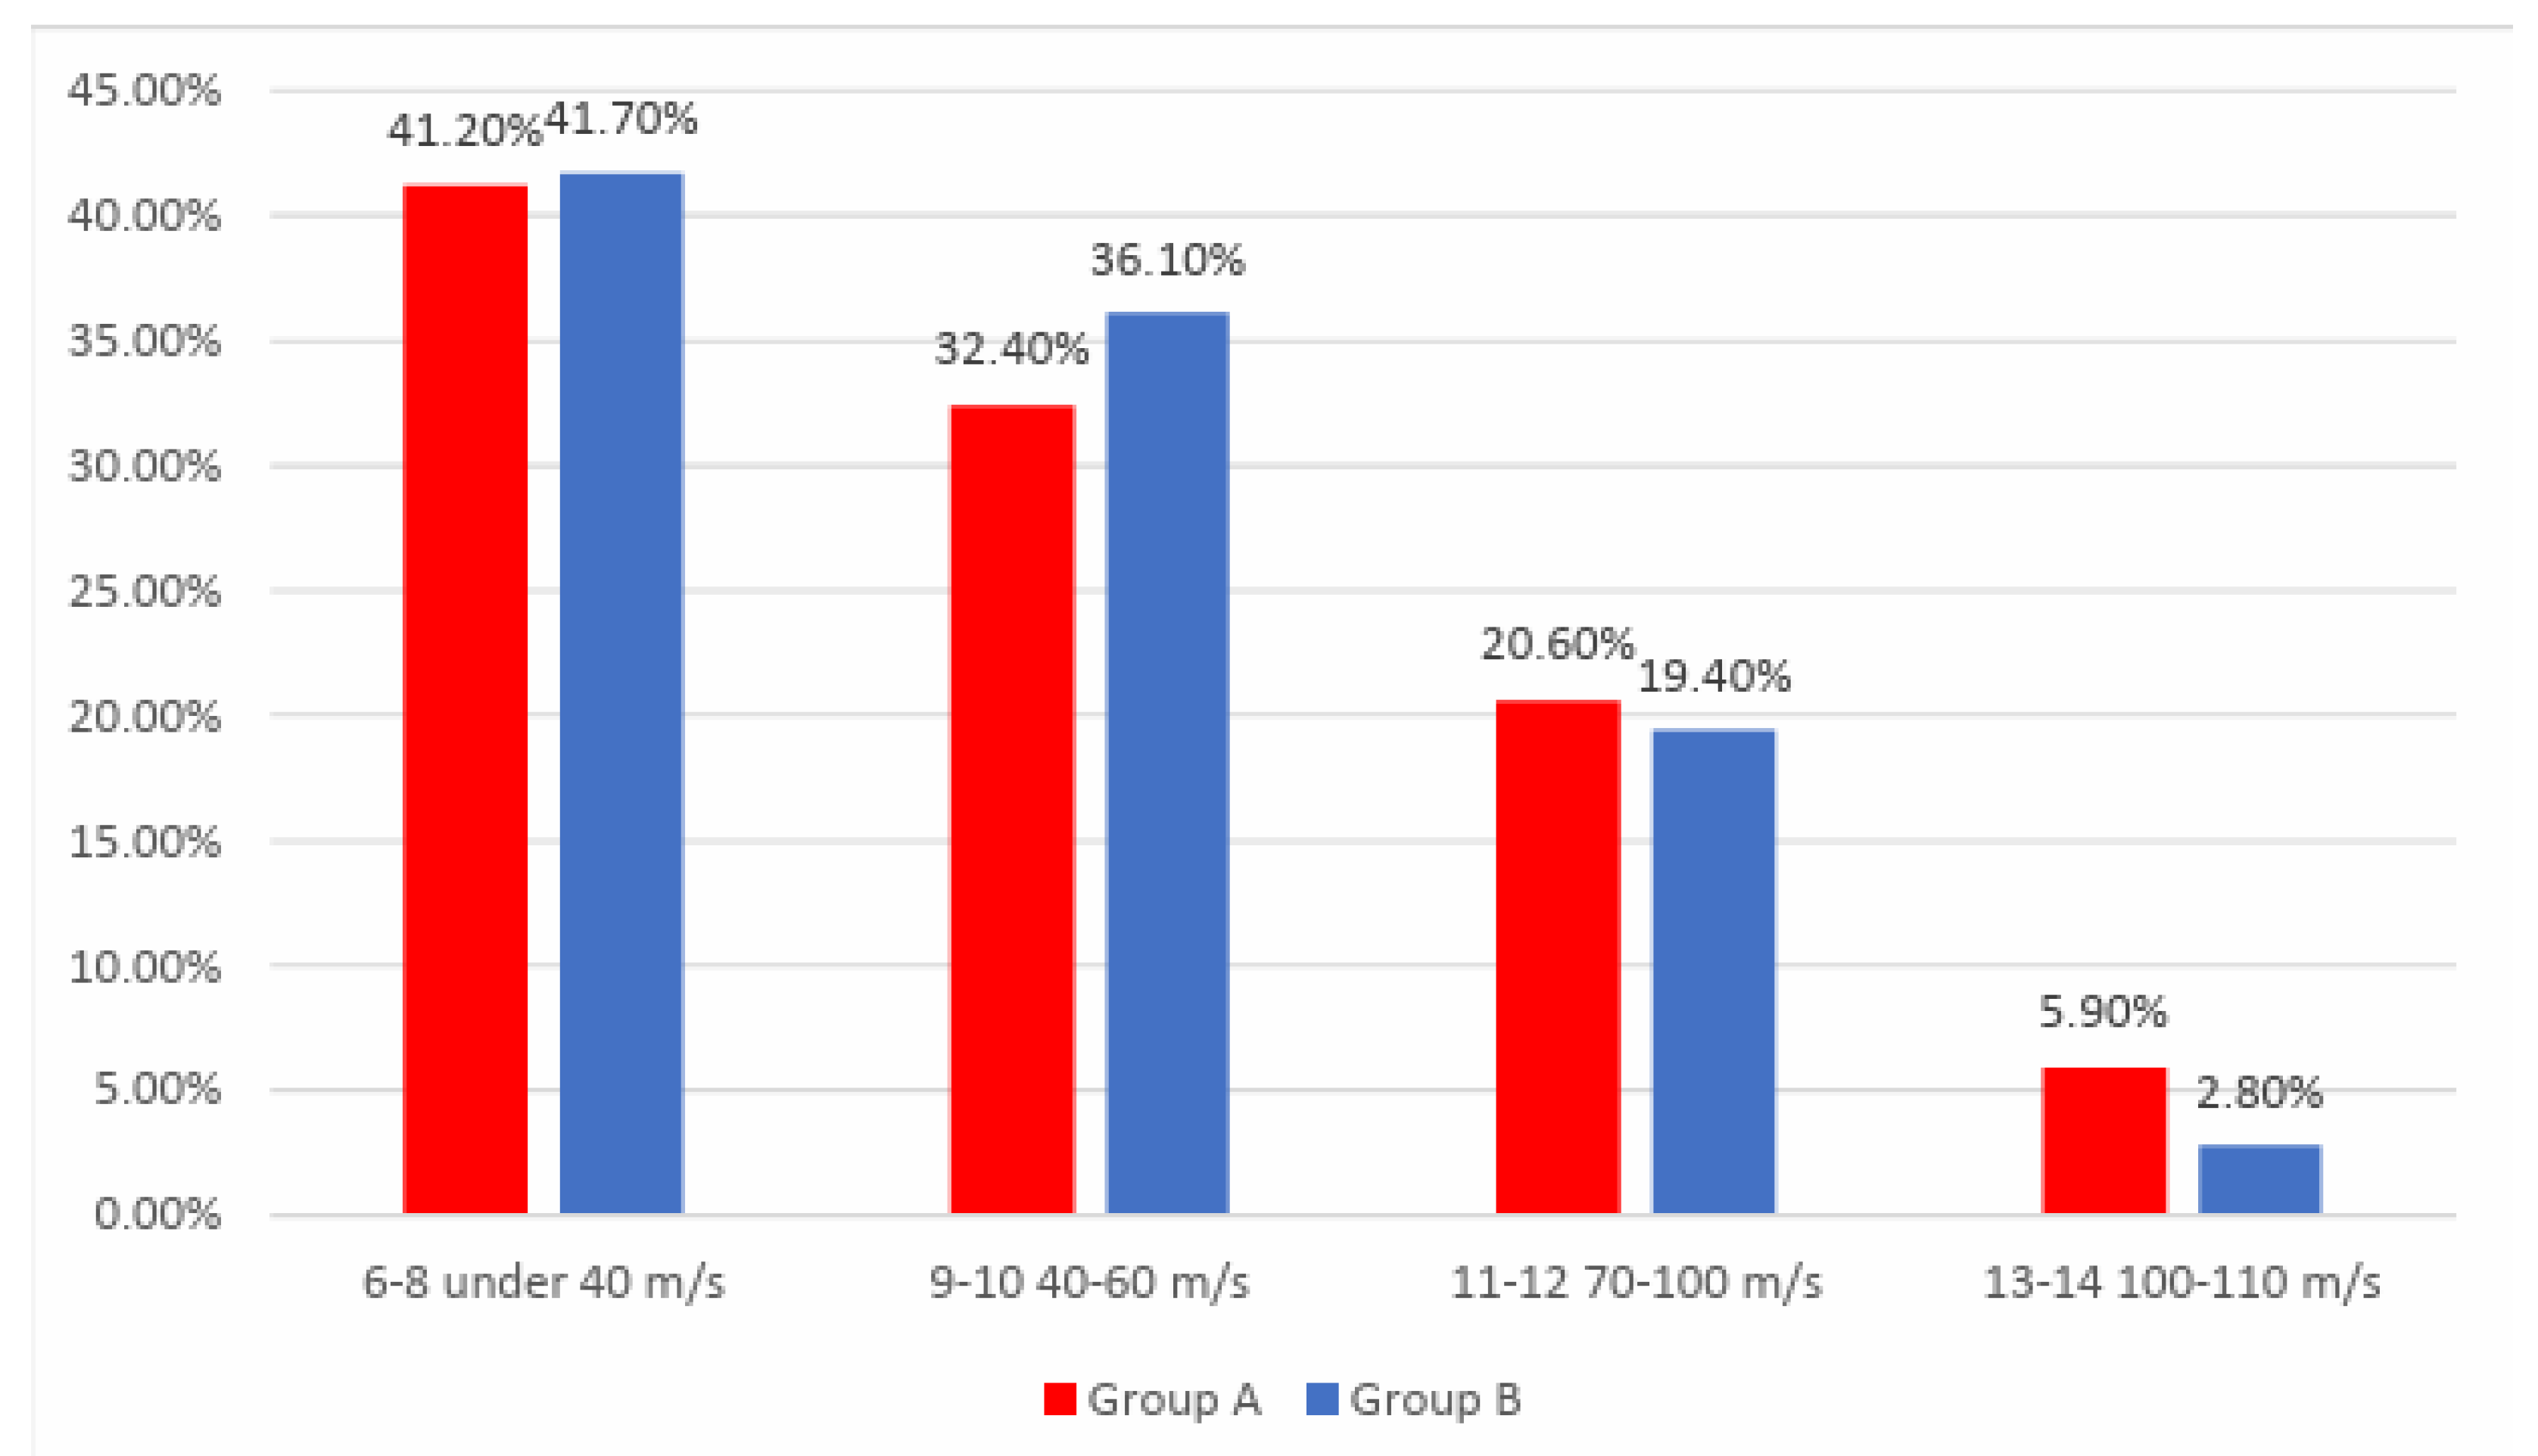
Data from Figure 2 shows the distribution of the patients according to analyzed groups and exercise tolerance at the beginning of the study. Frequencies of exercise tolerance at the beginning of the study between the analyzed groups were not statistically significant in this study (p=0.725).
Data from Table 5 shows the distribution of the patients according to analyzed groups and exercise tolerance at the end of the study. Differences between groups were statistically significant (p=0.007) and Z-tests with Bonferroni correction showed that patients with an exercise tolerance of 6-8 under 40 m/s at the end of the study were significantly more frequent in Group B than in Group A (16.7% vs. 2.9%).
Data from Table 6 and Table 7 shows the distribution of the patients in Group A according to the exercise tolerance at the beginning and end of the study. Differences between the frequencies of exercise tolerance between the beginning and end of the study were statistically significant (p<0.001) and post-hoc McNemar’s Tests with Bonferroni correction showed the following for the patients in Group A:
-
Frequency of exercise tolerance of 6-8 under 40 m/s significantly decreased at the end of the study (41.2% vs. 2.9%) (p<0.001);
-
Frequency of exercise tolerance of 9-10 40-60 m/s was not significantly different at the end of the study from the beginning (p=1.000);
-
Frequency of exercise tolerance of 11-12 70-100 m/s significantly increased at the end of the study (20.6% vs. 41.2%) (p=0.012);
-
Frequency of exercise tolerance of 13-14 100-110 m/s significantly increased at the end of the study (5.9% vs. 23.5%) (p=0.001).
Data from Table 8 and Table 9 shows the distribution of the patients in Group B according to the exercise tolerance at the beginning and end of the study. Differences between the frequencies of exercise tolerance between the beginning and end of the study were statistically significant (p<0.001) and the following observations were made for the patients in Group B:
-
Frequency of exercise tolerance of 6-8 under 40 m/s significantly decreased at the end of the study (41.7% vs. 16.7%) (p<0.001);
-
Frequency of exercise tolerance of 9-10 40-60 m/s was not significantly different at the end of the study from the beginning (p=1.000);
-
Frequency of exercise tolerance of 11-12 70-100 m/s significantly increased at the end of the study (19.4% vs. 36.1%) (p=0.008);
-
Frequency of exercise tolerance of 13-14 100-110 m/s significantly increased at the end of the study (2.8% vs. 16.7%) (p<0.001).
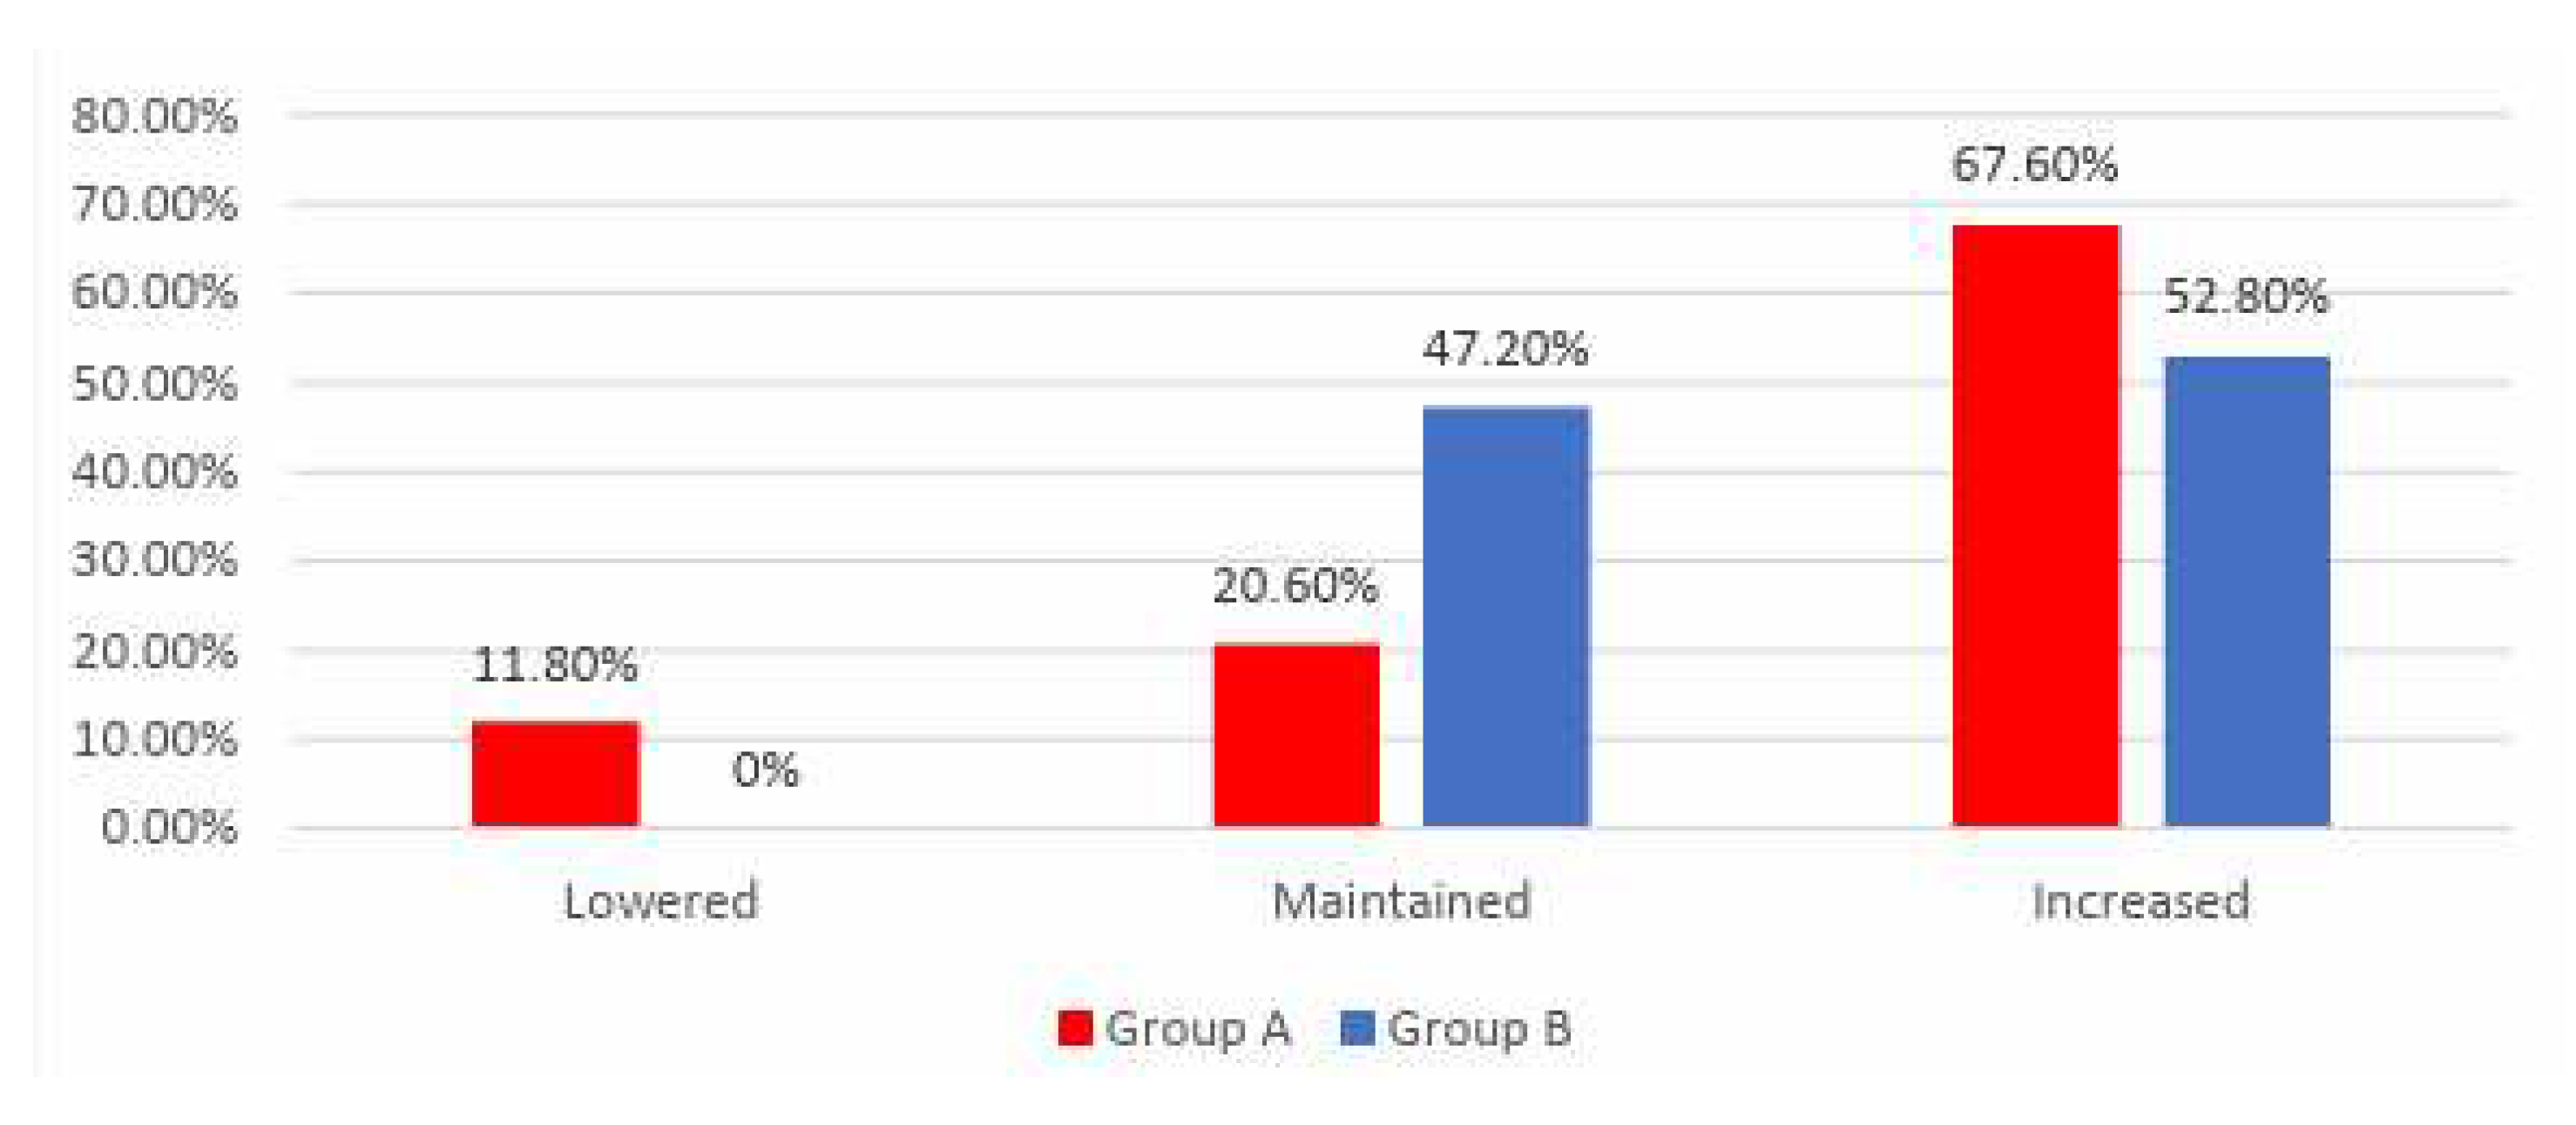
Data from Figure 3 shows the distribution of the patients according to analyzed groups and evolution of exercise tolerance. Differences between groups were statistically significant (p<0.001) and the following were observed:
-
Patients with lowered exercise tolerance at the end of the study were significantly more frequent in Group A than in Group B (11.8% vs. 0%);
-
Patients with increased exercise tolerance at the end of the study were significantly more frequent in Group A than in Group B (67.6% vs. 52.8%);
-
Patients with maintained exercise tolerance at the end of the study were significantly more frequent in Group B than in Group A (47.2% vs. 20.6%);
-
According to the results presented above and those in Table 6 and 8, the results showed that in Group B the exercise tolerance was maintained more frequently or raised at the end of the study, while in Group A the evolution of exercise tolerance was more variable, being more frequently lowered or raised at the end of the study.
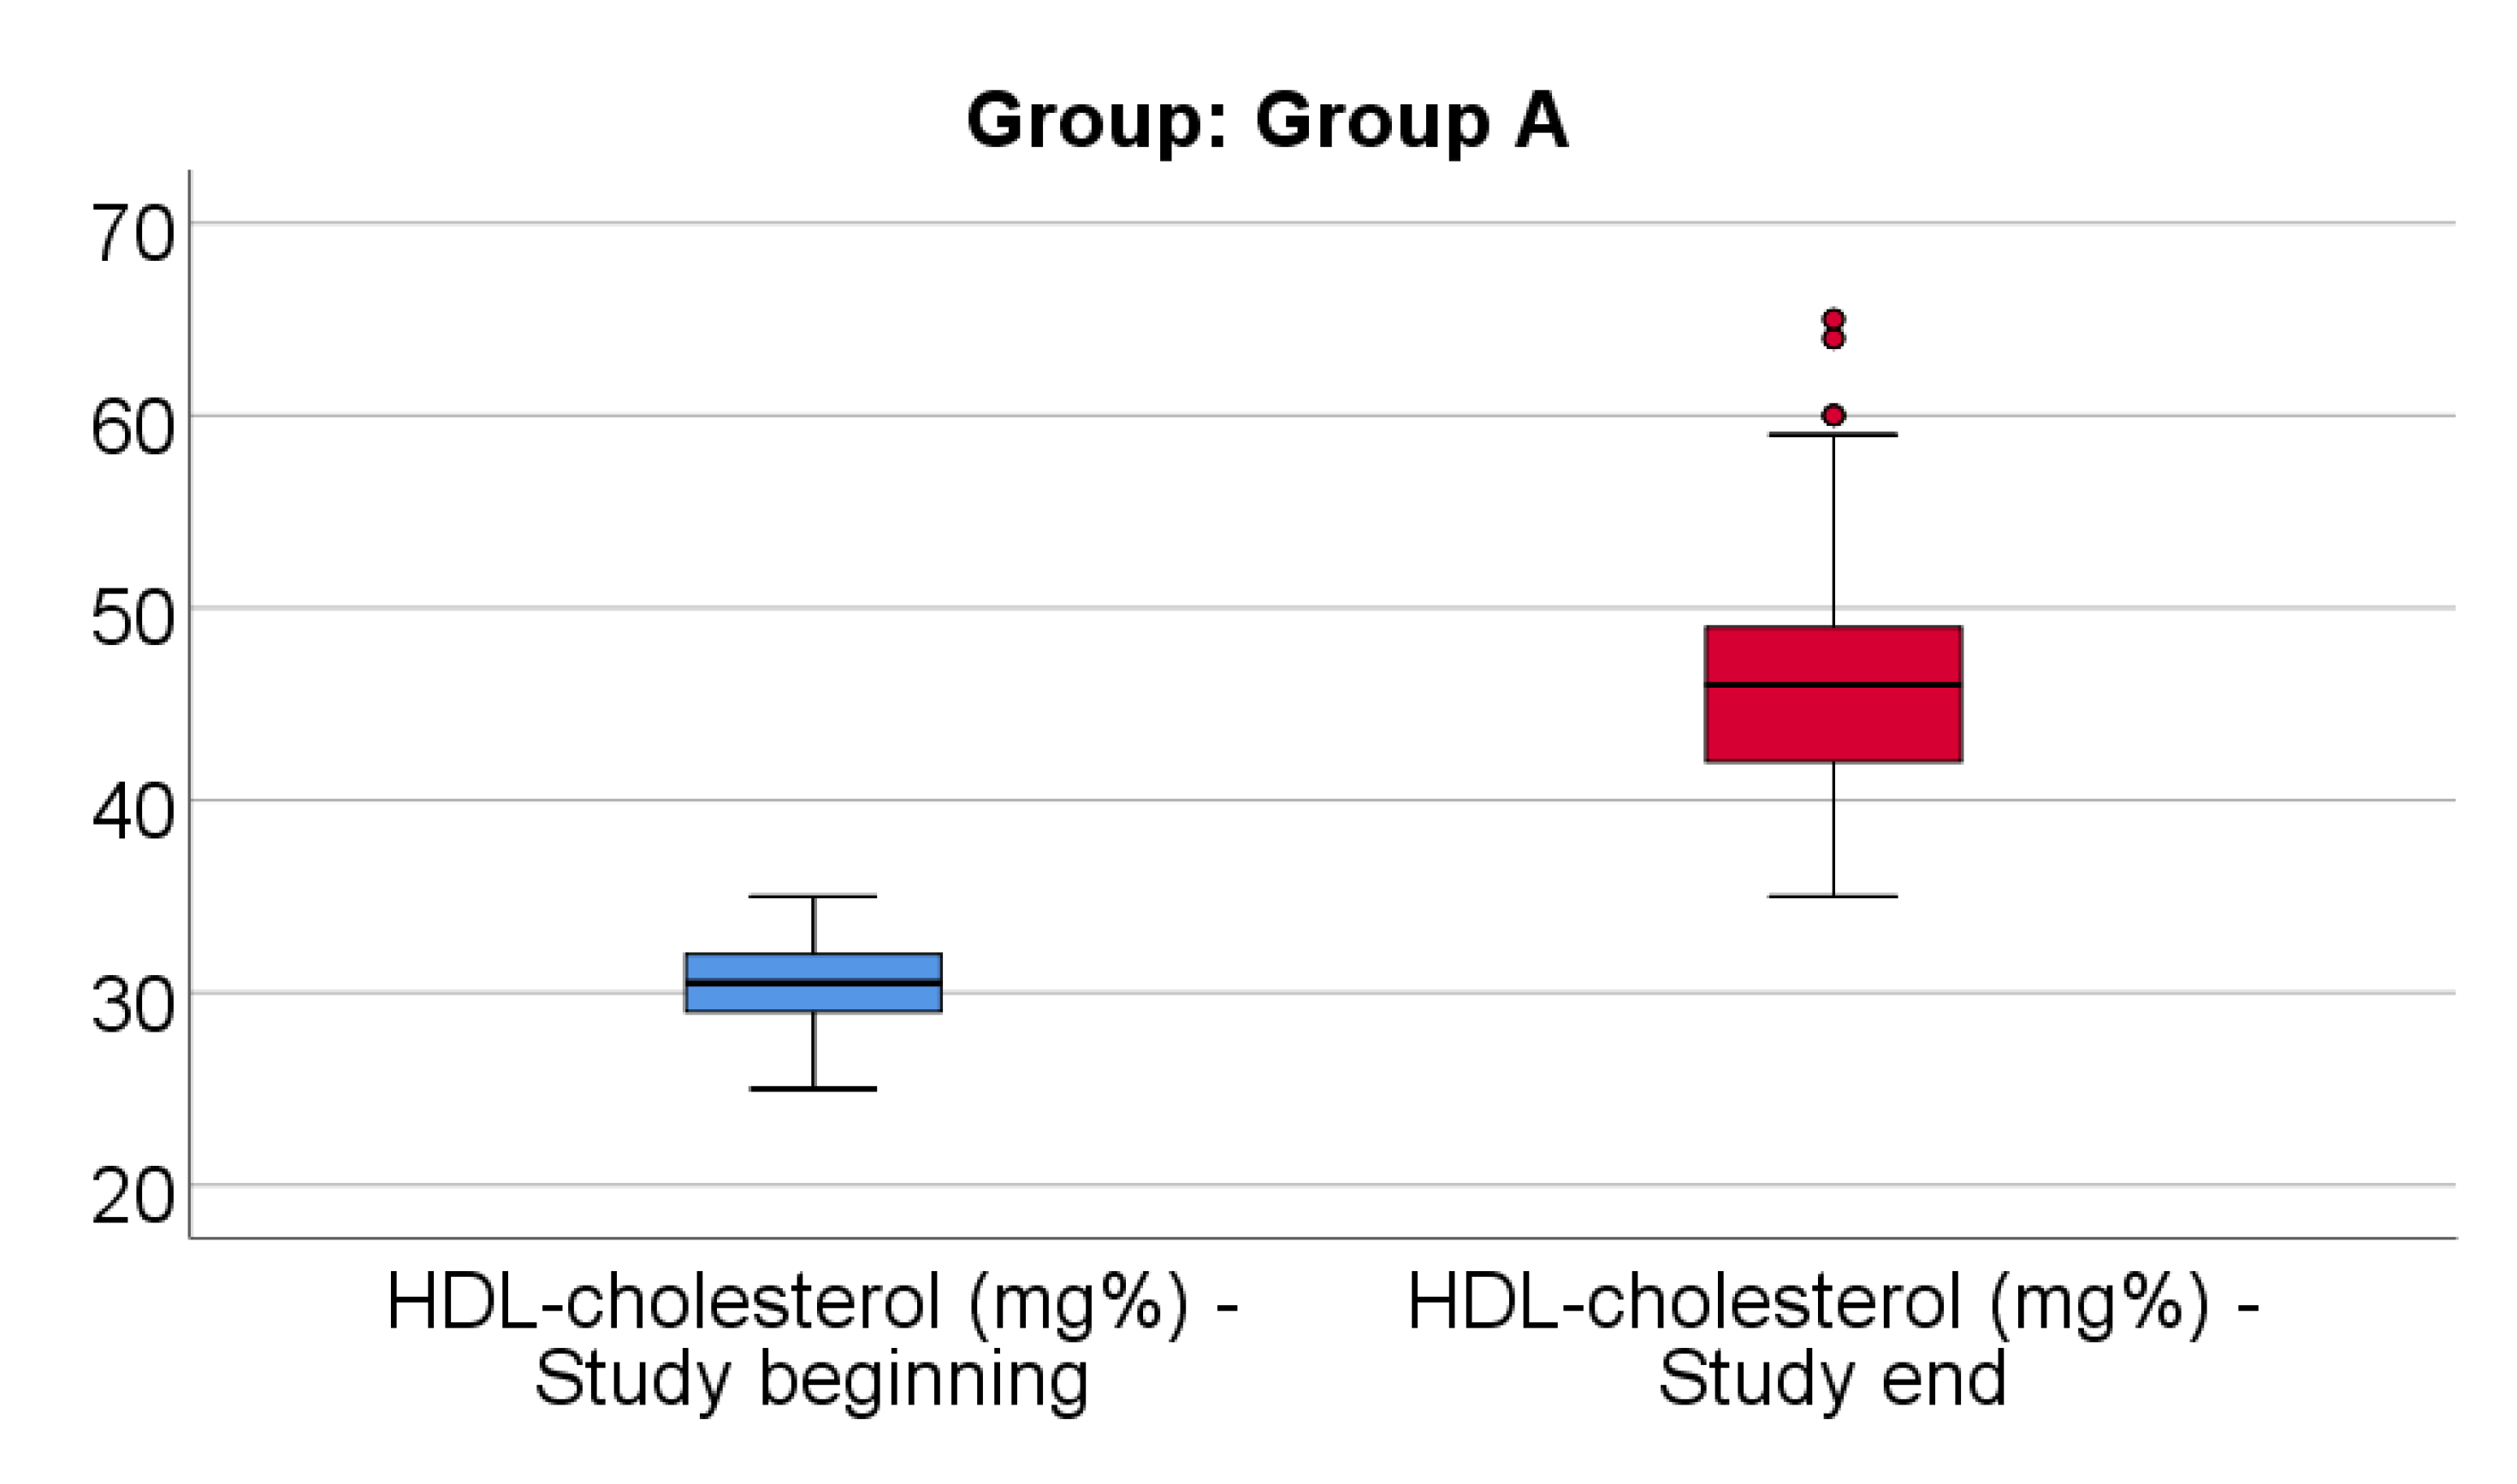
Data from Figure 4 shows the comparison of HDL-cholesterol from the beginning to end of the study in patients from Group A. Distribution of HDL-cholesterol was non-parametric in both measurements (p<0.05). Differences between the related measurements were statistically significant (p<0.001), therefore HDL-cholesterol at the end of the study was significantly higher (median = 46, IQR= 42-49) in comparison to the value at the beginning of the study (median = 30.5, IQR = 29-32), the difference between the two measurements being significant (median difference = 14.5, IQR = 11-21 mg/dl and increase % reported for the HDL-cholesterol at the beginning of the study: median % increase: 47.52 %, IQR = 35.3-73.3).
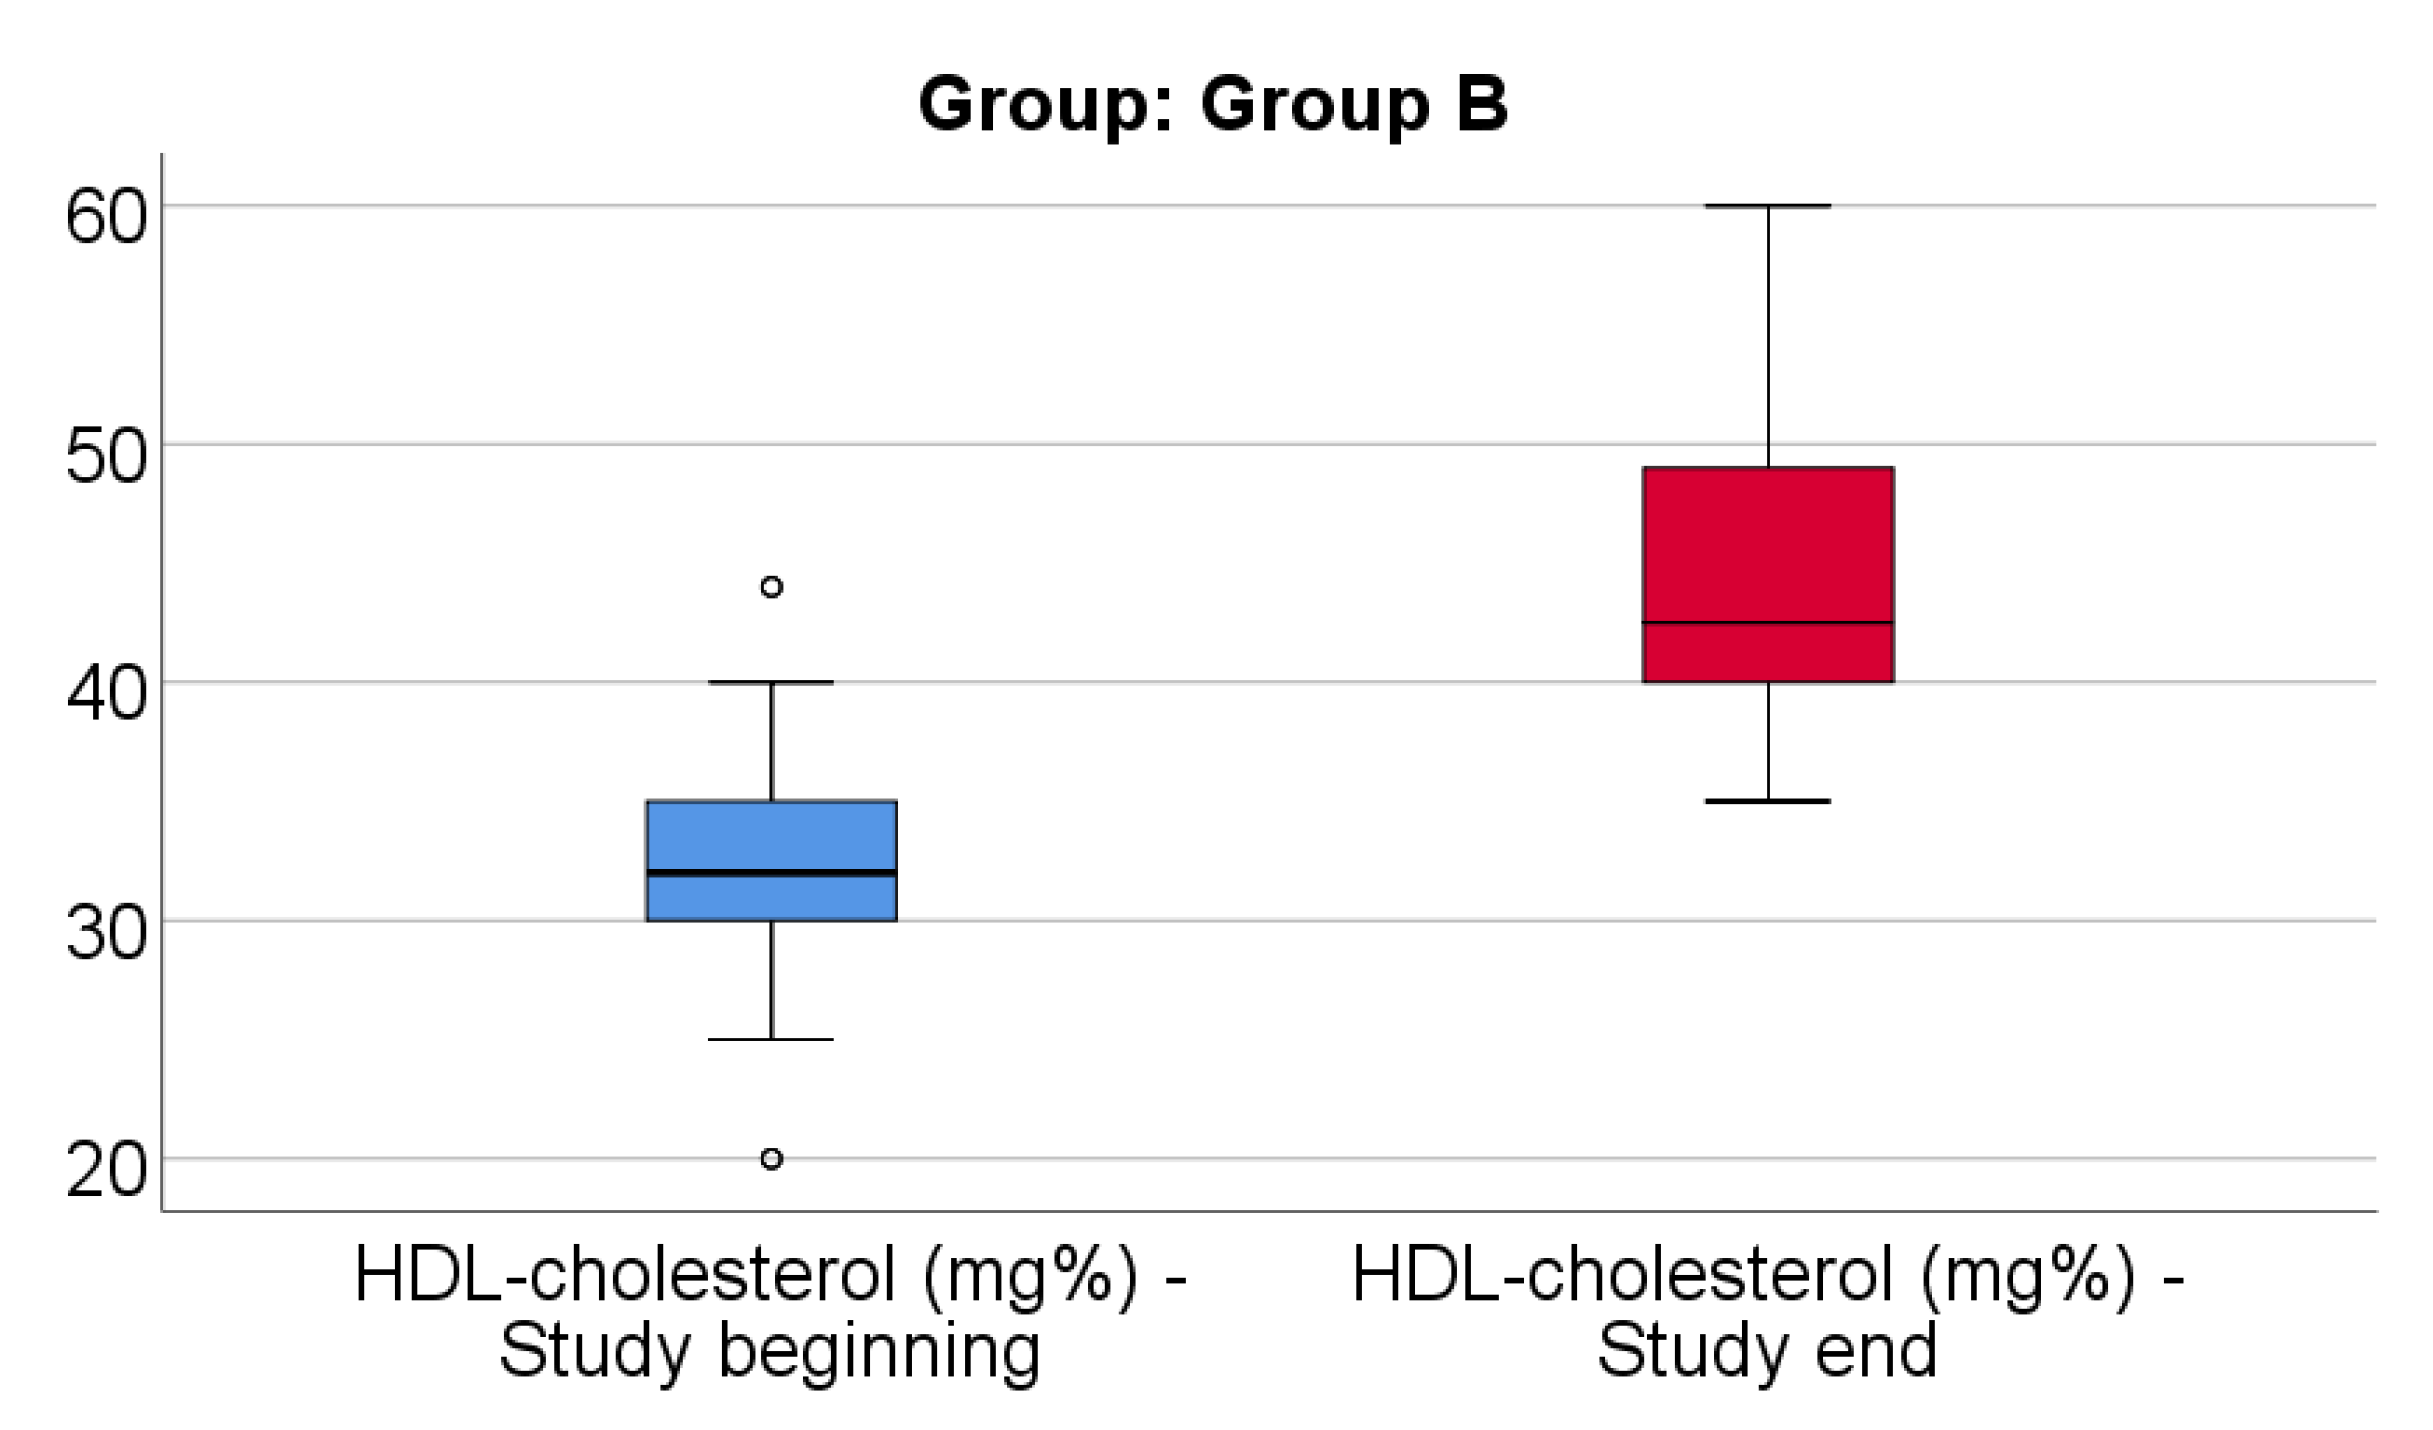
Data from Figure 5 shows the comparison of HDL-cholesterol from the beginning to end of the study in patients from Group B. Distribution of HDL-cholesterol was non-parametric in both measurements (p<0.05). Differences between the related measurements were statistically significant (p<0.001), therefore HDL-cholesterol at the end of the study was significantly higher (median = 42.5, IQR= 40-49) in comparison to the value at the beginning of the study (median = 32, IQR = 30-35), the difference between the two measurements being significant (median difference = 12, IQR = 4.25-17 mg/dl and increase % reported for the HDL-cholesterol at the beginning of the study: median % increase: 38.18 %, IQR = 11.26-62.15).
Data from Table 10 shows the comparison of HDL-cholesterol evolution between analyzed groups. Distribution of HDL-cholesterol difference was non-parametric in both groups (p<0.05). Differences between groups were statistically significant (p<0.001/ p<0.001) for both the absolute value of the HDL-cholesterol difference and the increase percentage reported for the HDL-cholesterol at the beginning of the study.
As such, patients in Group A had a significantly higher increase of HDL-cholesterol at the end of study from the beginning (median = 14.5 mg/dl, IQR = 11-21, % - median = 47.52, IQR = 35.3-73.3) in comparison to patients in Group B (median = 12 mg/dl, IQR = 4.25-17, % - median = 38.18, IQR = 11.26-62.15).
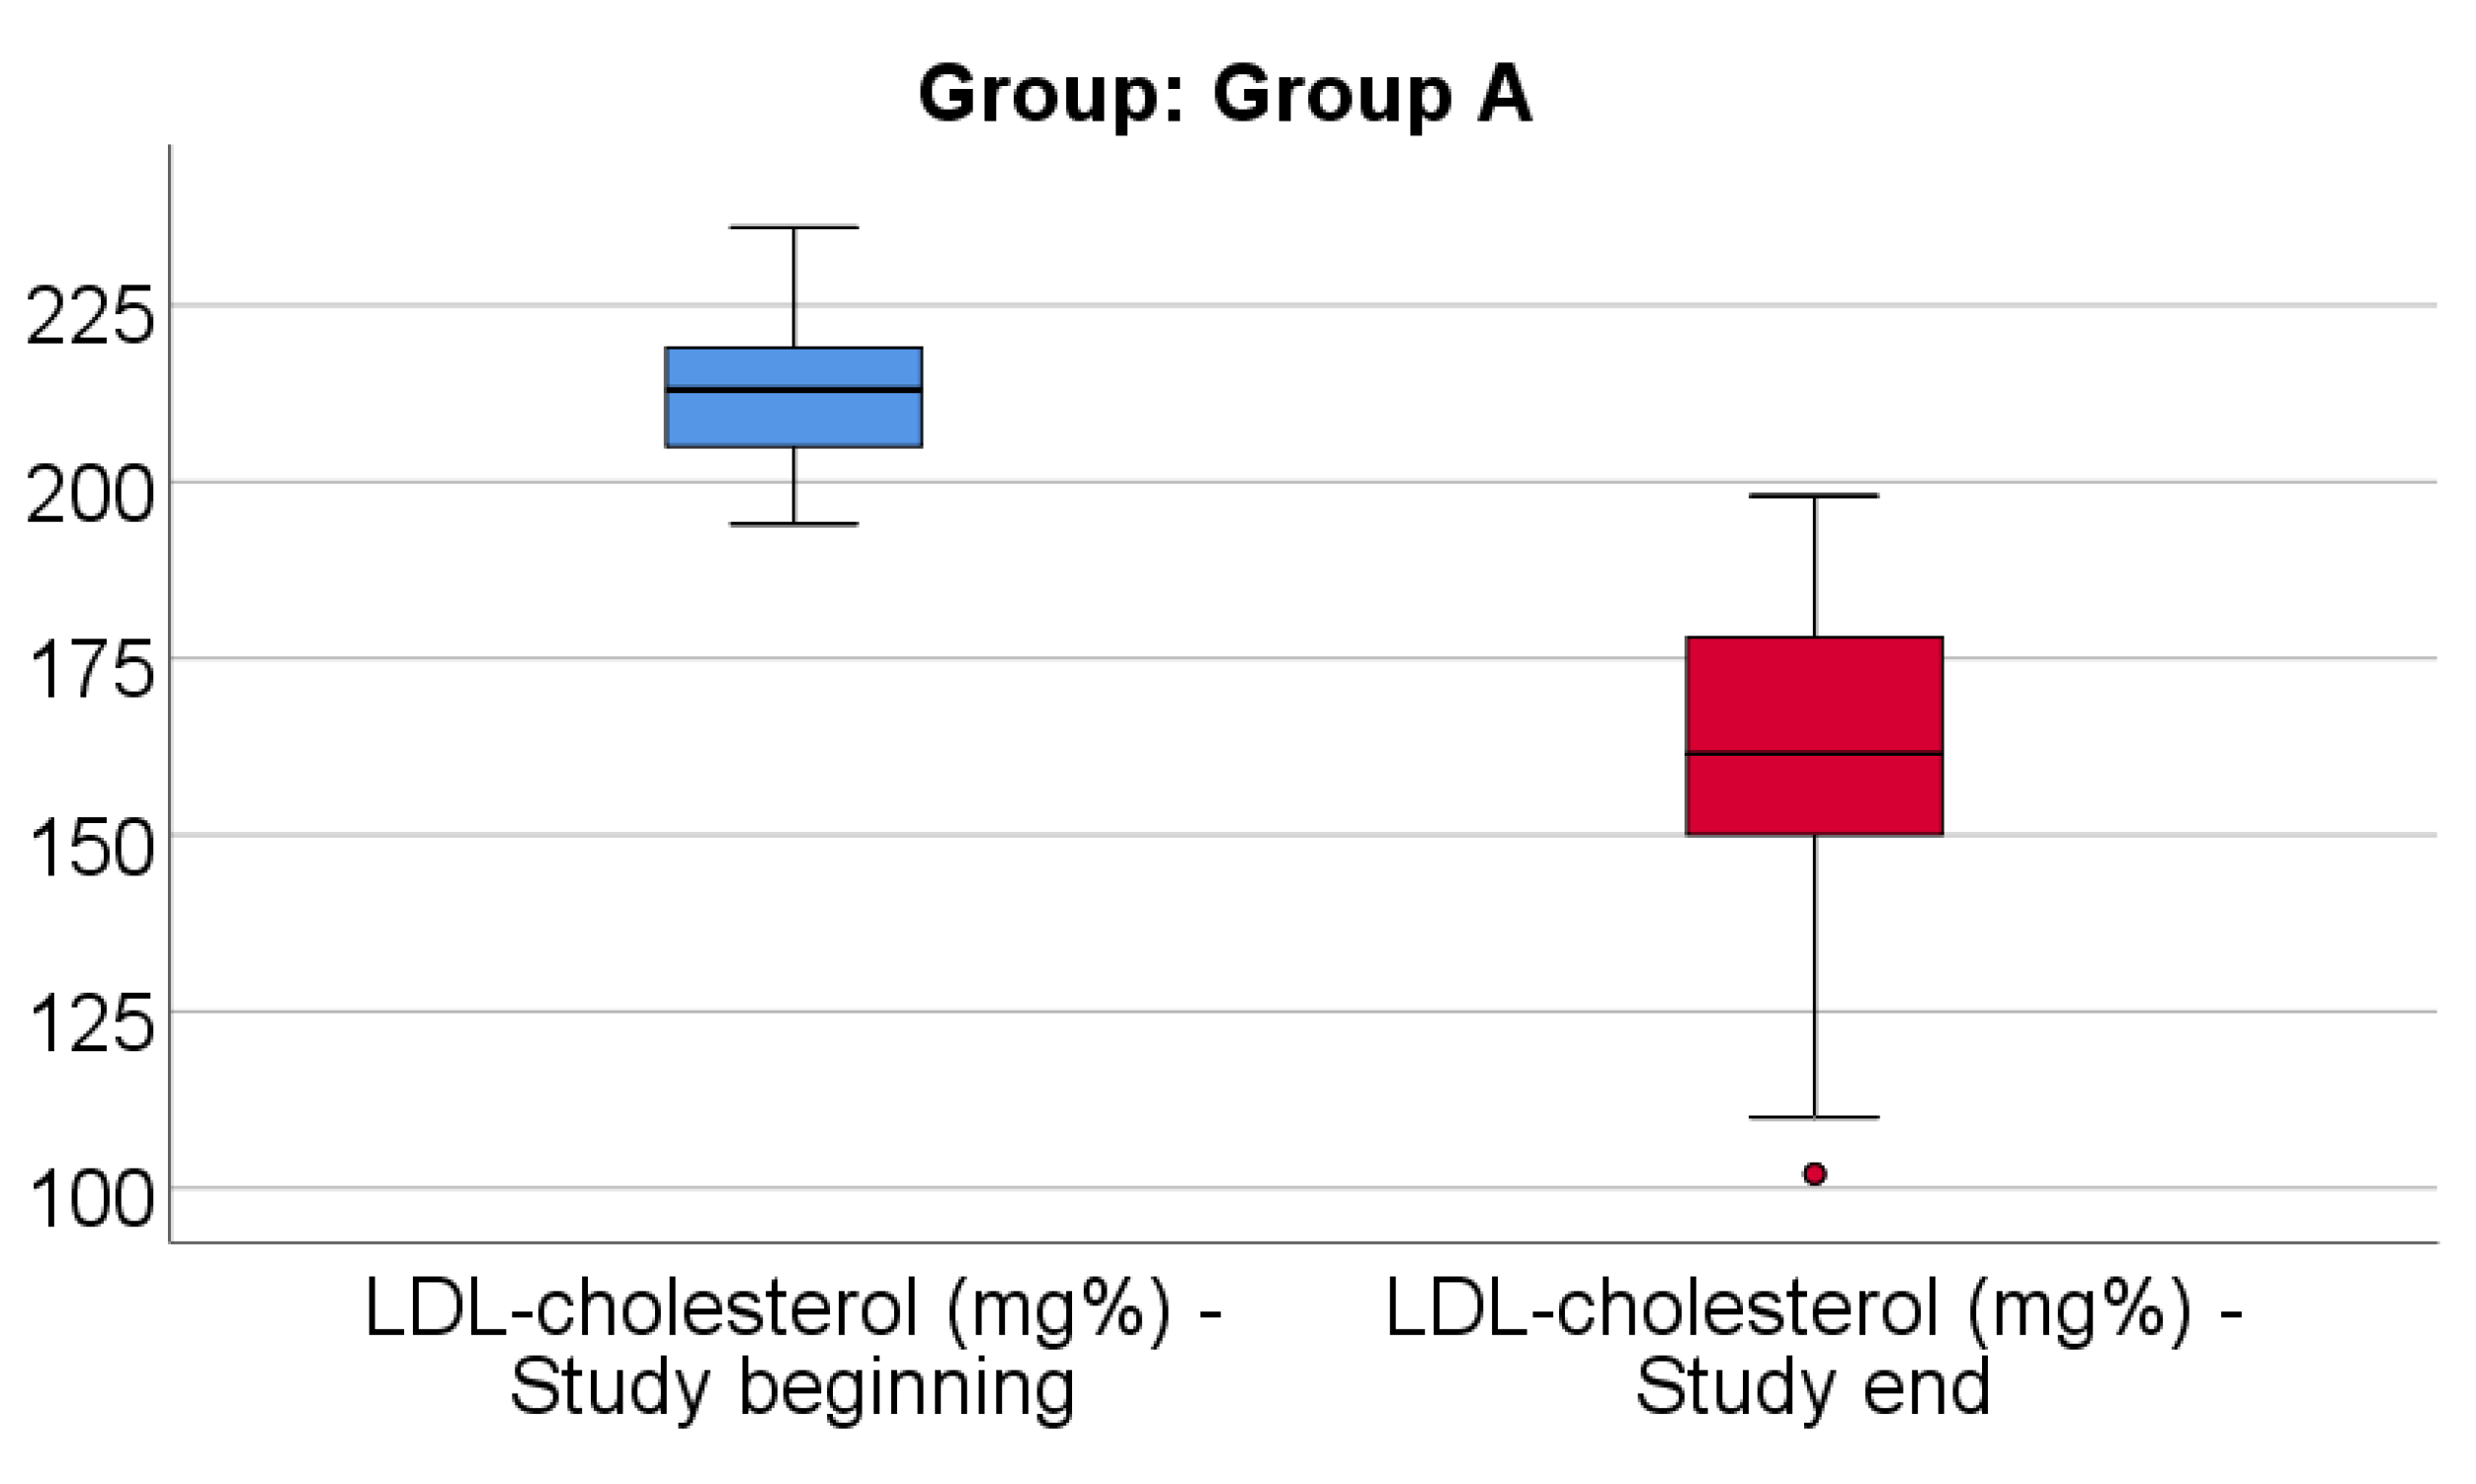
Data from Figure 6 shows the comparison of LDL-cholesterol from the beginning to end of the study in patients from Group A. Distribution of LDL-cholesterol was non-parametric in both measurements (p<0.05). Differences between the related measurements were statistically significant (p<0.001), therefore LDL-cholesterol at the end of the study was significantly lower (median = 161.5, IQR= 150-178) in comparison to the value at the beginning of the study (median = 213, IQR = 205-219), the difference between the two measurements being significant (median difference = -46.5, IQR = -69 - -35 mg/dl and decrease % reported for the LDL-cholesterol at the beginning of the study: median % decrease: -22.3 %, IQR = -31.3 - -16.7).
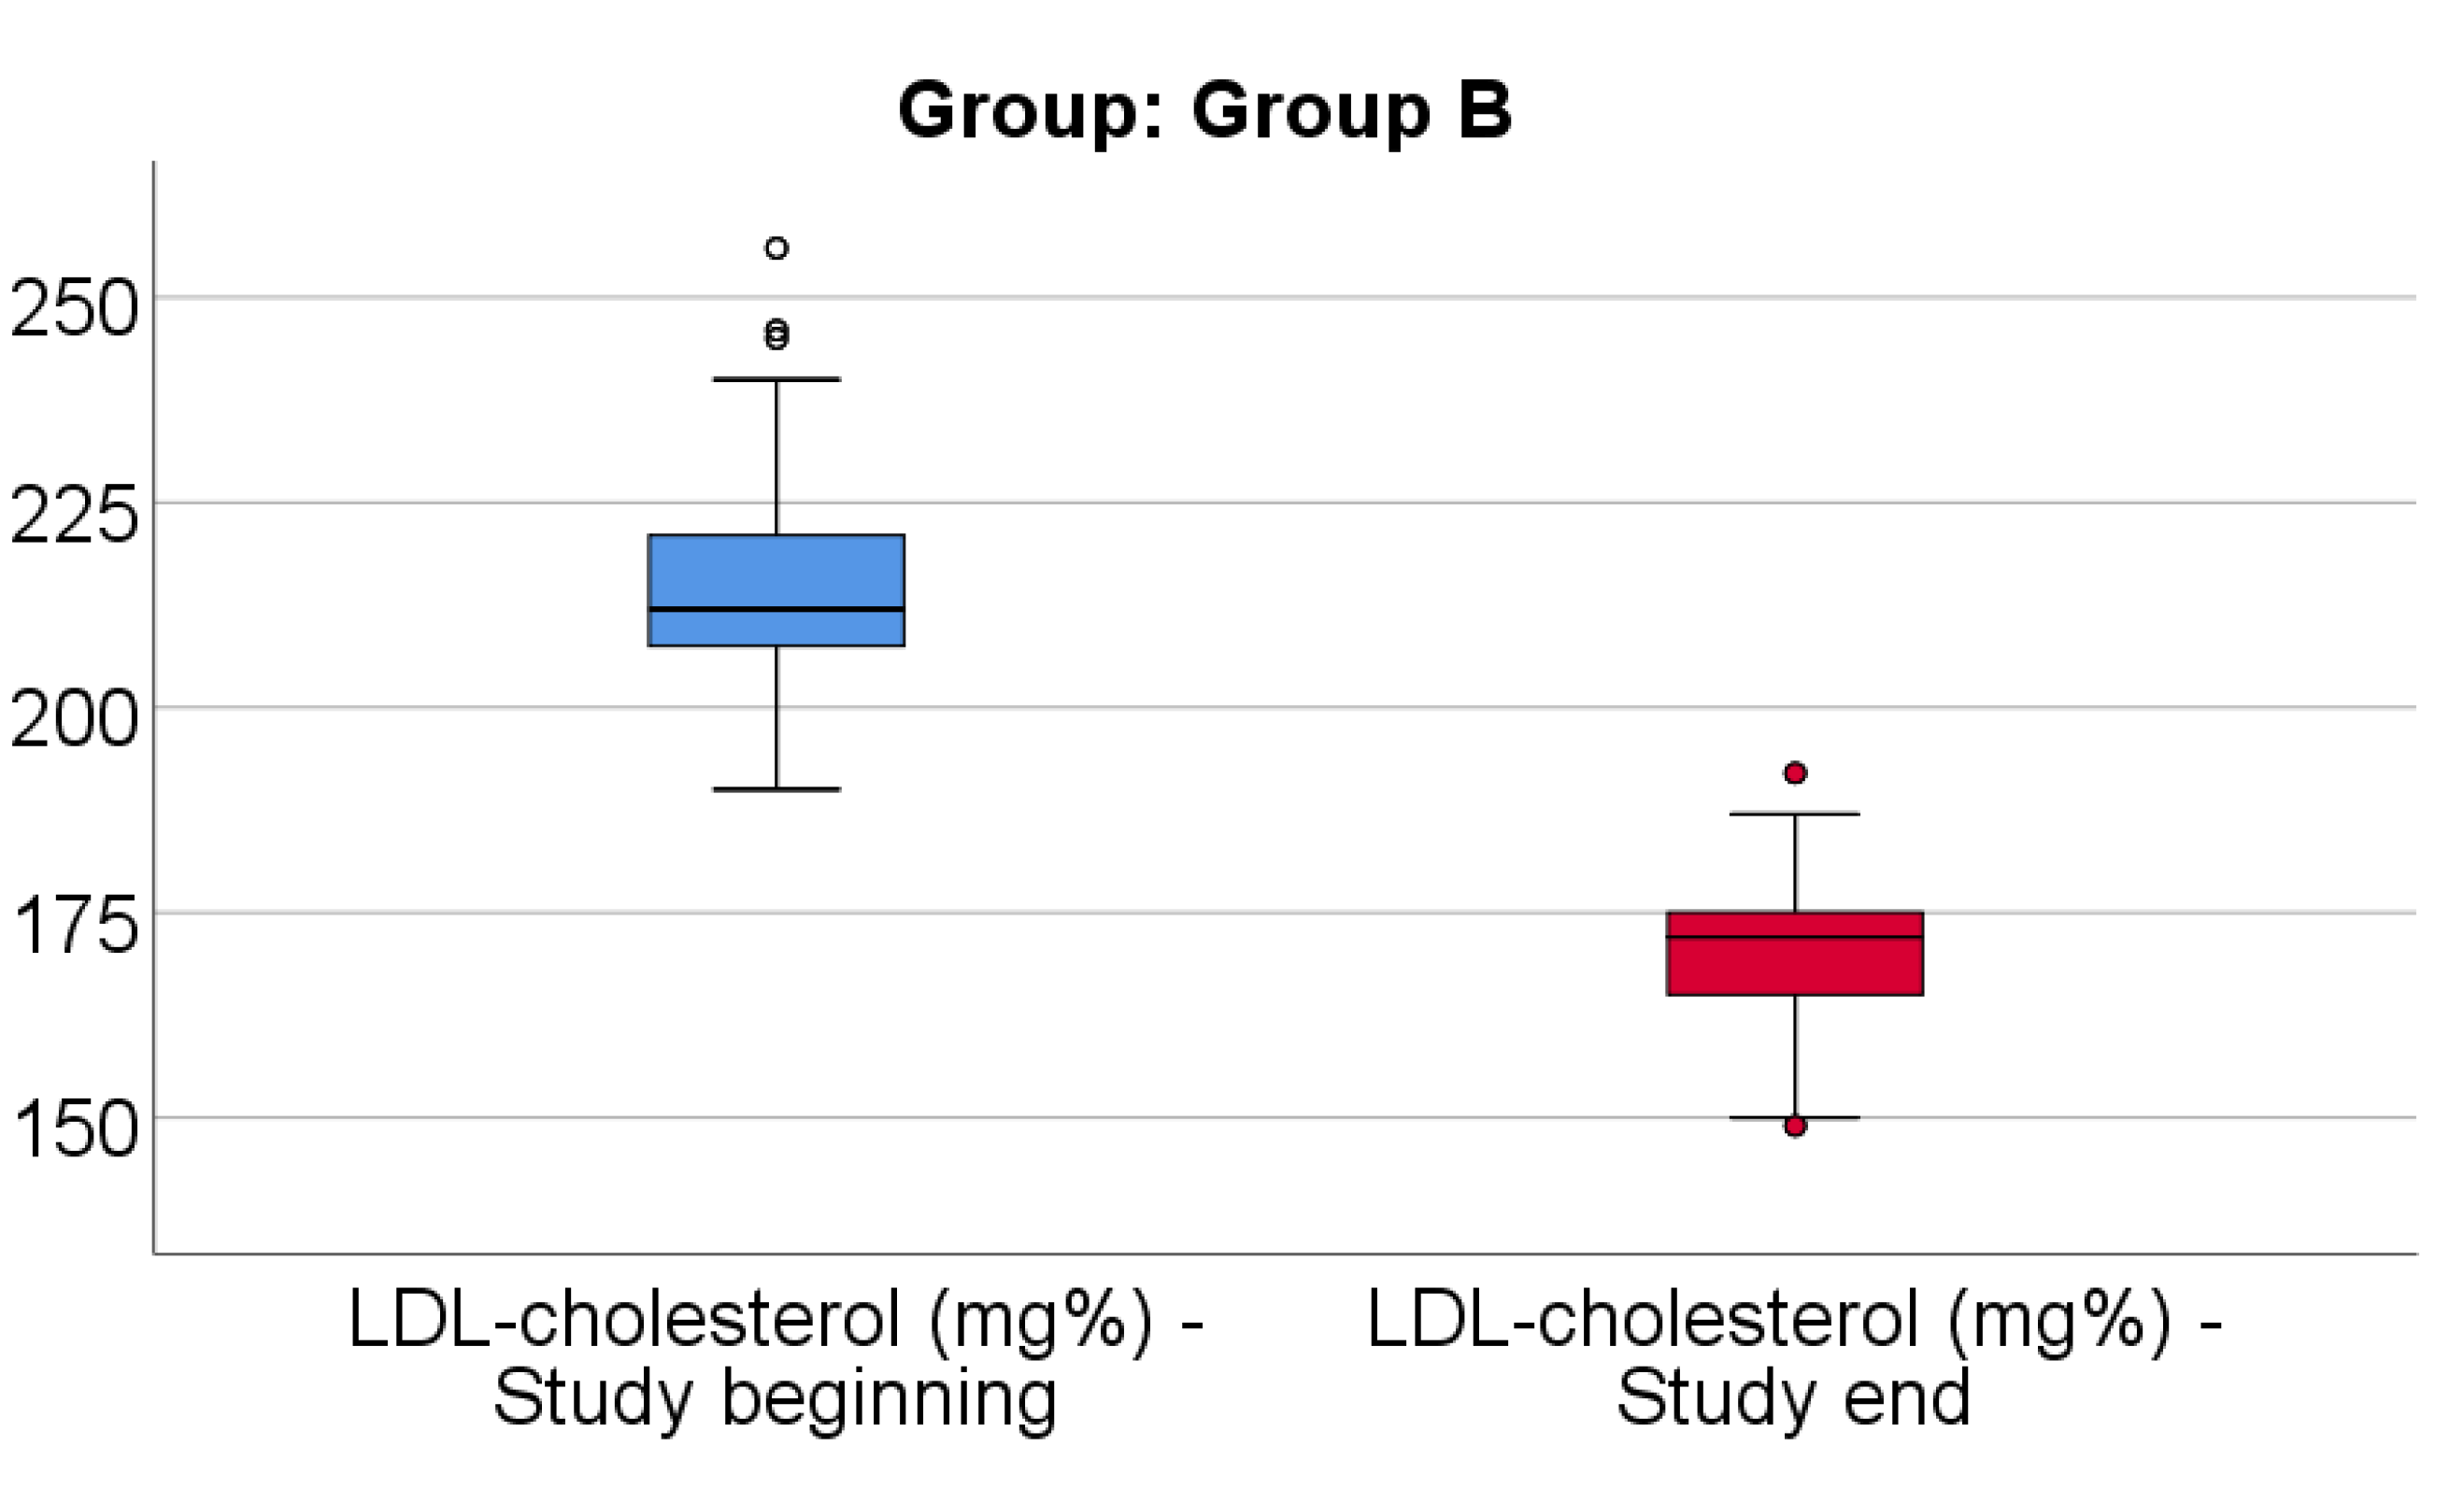
Data from Figure 7 shows the comparison of LDL-cholesterol from the beginning to end of the study in patients from Group B. Distribution of LDL-cholesterol was non-parametric in both measurements (p<0.05). Differences between the related measurements were statistically significant (p<0.001), therefore LDL-cholesterol at the end of the study was significantly lower (median = 172, IQR= 165-175) in comparison to the value at the beginning of the study (median = 212, IQR = 206.75-221), the difference between the two measurements being significant (median difference = -41, IQR = -59.5 - -33 mg/dl and decrease % reported for the LDL-cholesterol at the beginning of the study: median % decrease: -19.2 %, IQR = -25.9 - -15.6).
Data from Table 11 shows the comparison of LDL-cholesterol evolution between analyzed groups. Distribution of LDL-cholesterol difference was non-parametric in both groups (p<0.05). Differences between groups were statistically significant (p=0.024/ p=0.008) for both the absolute value of the LDL-cholesterol difference and the decrease percentage reported for the LDL-cholesterol at the beginning of the study.
As such, patients in Group A had a significantly higher decrease of LDL-cholesterol at the end of study from the beginning (median = -46.5 mg/dl, IQR = -69 - -35, % - median = -22.3, IQR = -31.3 - -16.6) in comparison to patients in Group B (median = -41 mg/dl, IQR = -59.5 - -33, % - median = -19.2, IQR = -25.9 - -15.6).
Data from Table 12 shows the comparison of triglycerides from the beginning to end of the study in patients from Group A. Distribution of triglycerides was non-parametric in both measurements (p<0.05). Differences between the related measurements were statistically significant (p<0.001), therefore triglycerides at the end of the study were significantly lower (median = 184.5, IQR= 180-188) in comparison to the value at the beginning of the study (median = 285.5, IQR = 282-294), the difference between the two measurements being significant (median difference = -103, IQR = -110 - -97 mg/dl and decrease % reported for the triglycerides at the beginning of the study: median % decrease: -35.78 %, IQR = -37.58 - -34.6).
Data from Table 13 shows the comparison of triglycerides from the beginning to end of the study in patients from Group B. Distribution of triglycerides was non-parametric in both measurements(p<0.05). Differences between the related measurements were statistically significant (p<0.001), therefore triglycerides at the end of the study were significantly lower (median = 213.5, IQR= 210-221) in comparison to the value at the beginning of the study (median = 305, IQR = 301.25-310), the difference between the two measurements being significant (median difference = -91.5, IQR = -99.5 - -84.25 mg/dl and decrease % reported for the triglycerides at the beginning of the study: median % decrease: -30 %, IQR = -31.82 - -27.78).
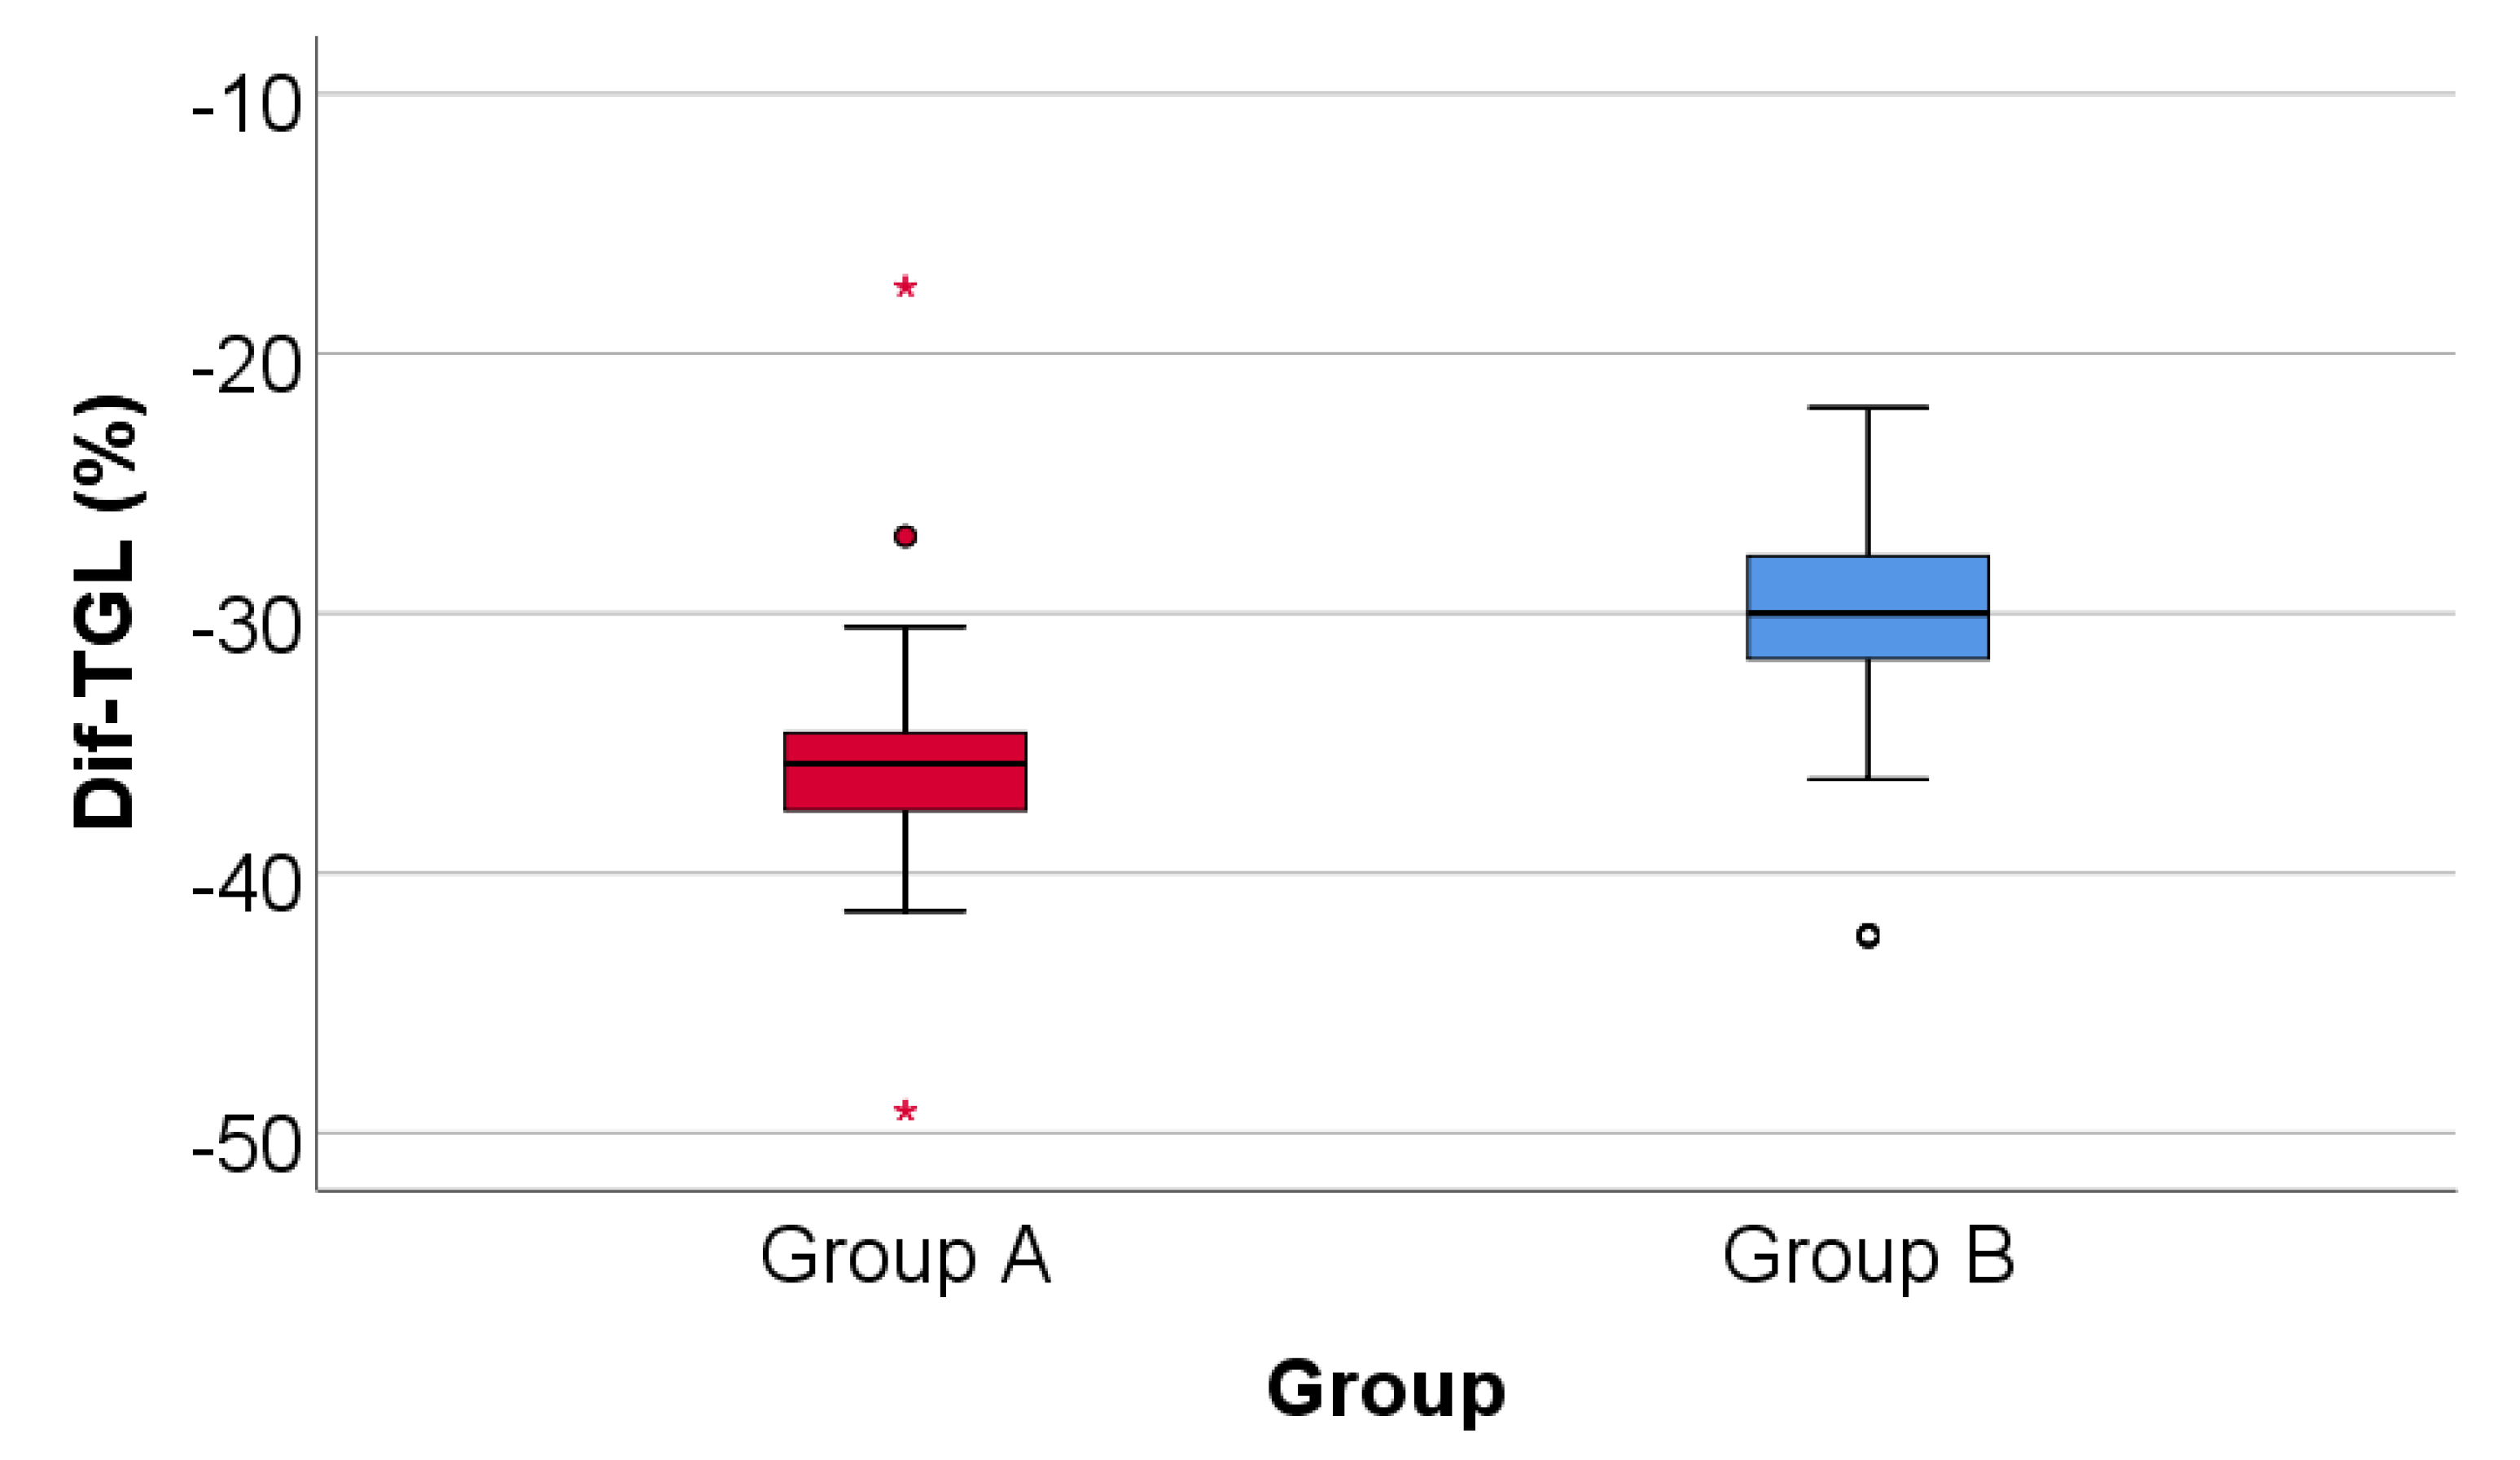
Data from Figure 8 shows the comparison of triglycerides evolution between analyzed groups. Distribution of triglycerides difference was non-parametric in both groups (p<0.05). Differences between groups were statistically significant (p<0.001/ p<0.001) for both the absolute value of the triglycerides difference and the decrease percentage reported for the triglycerides at the beginning of the study.
Patients in Group A had a significantly higher decrease of triglycerides at the end of study from the beginning (median = -103 mg/dl, IQR = -110 - -97, % - median = -35.78, IQR = -37.58 - -34.6) in comparison to patients in Group B (median = -91.5 mg/dl, IQR = -99.5 - -84.25, % - median = -30, IQR = -31.82 - -27.7).
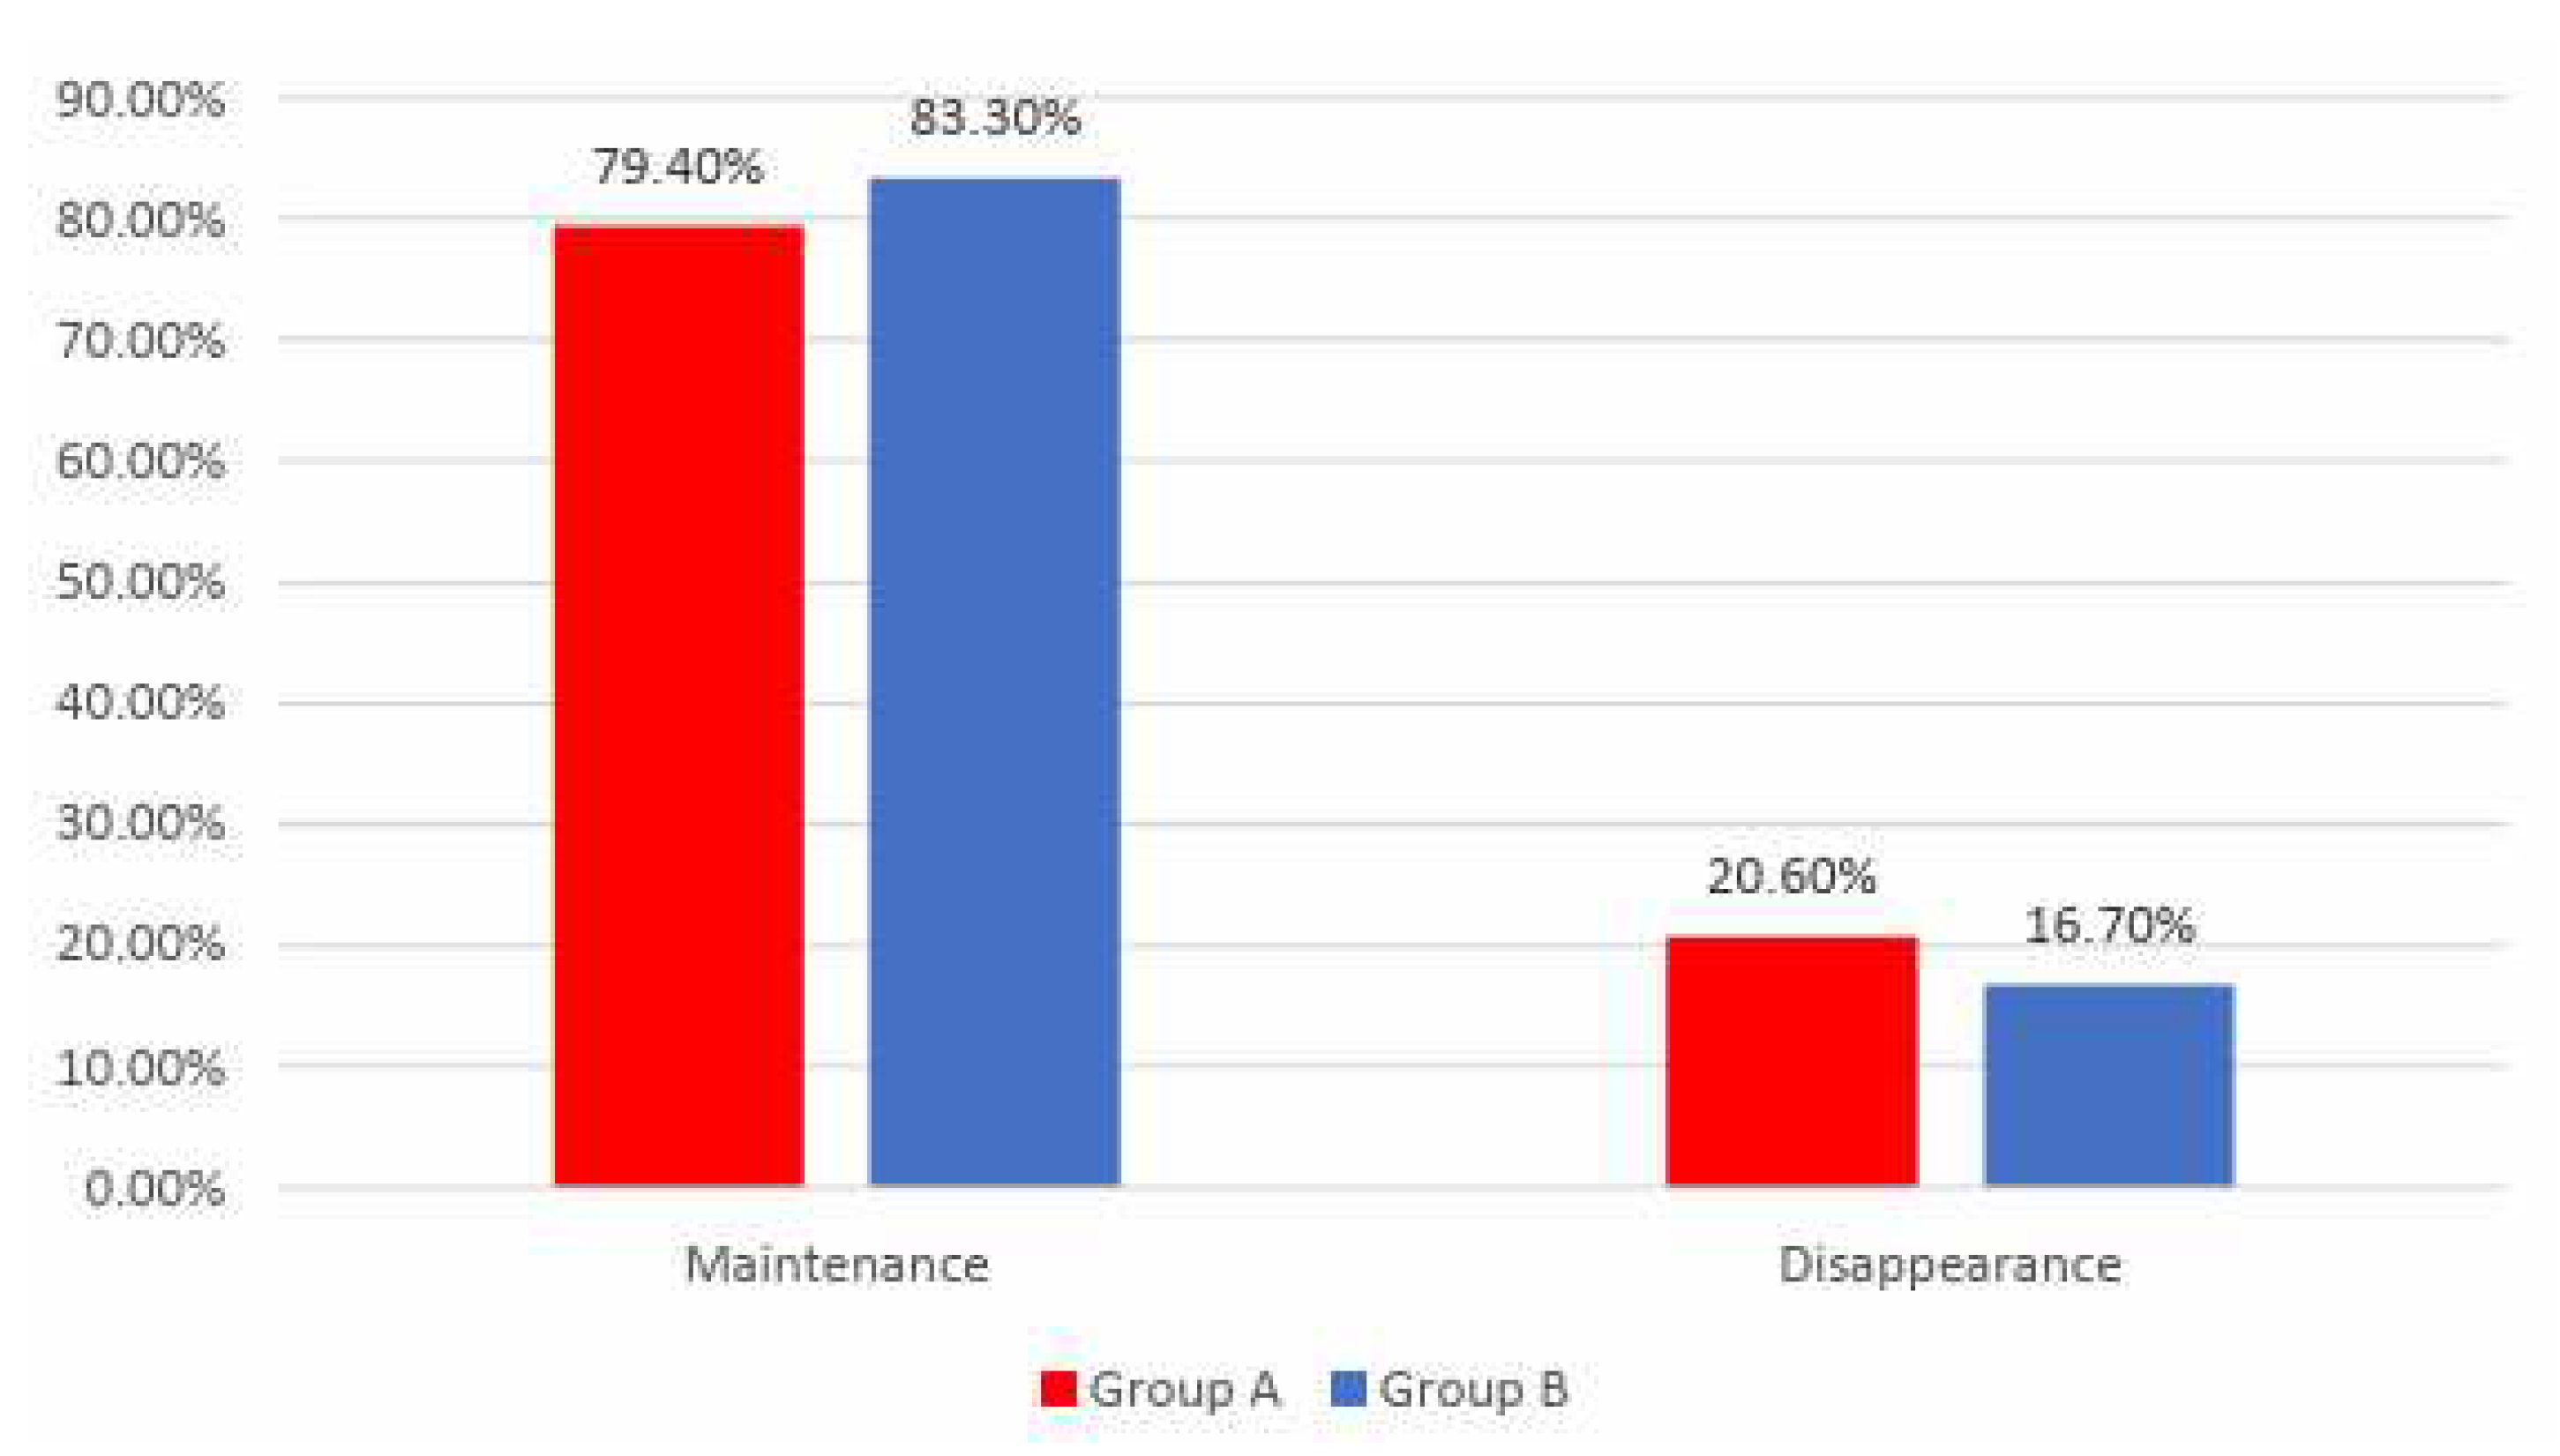
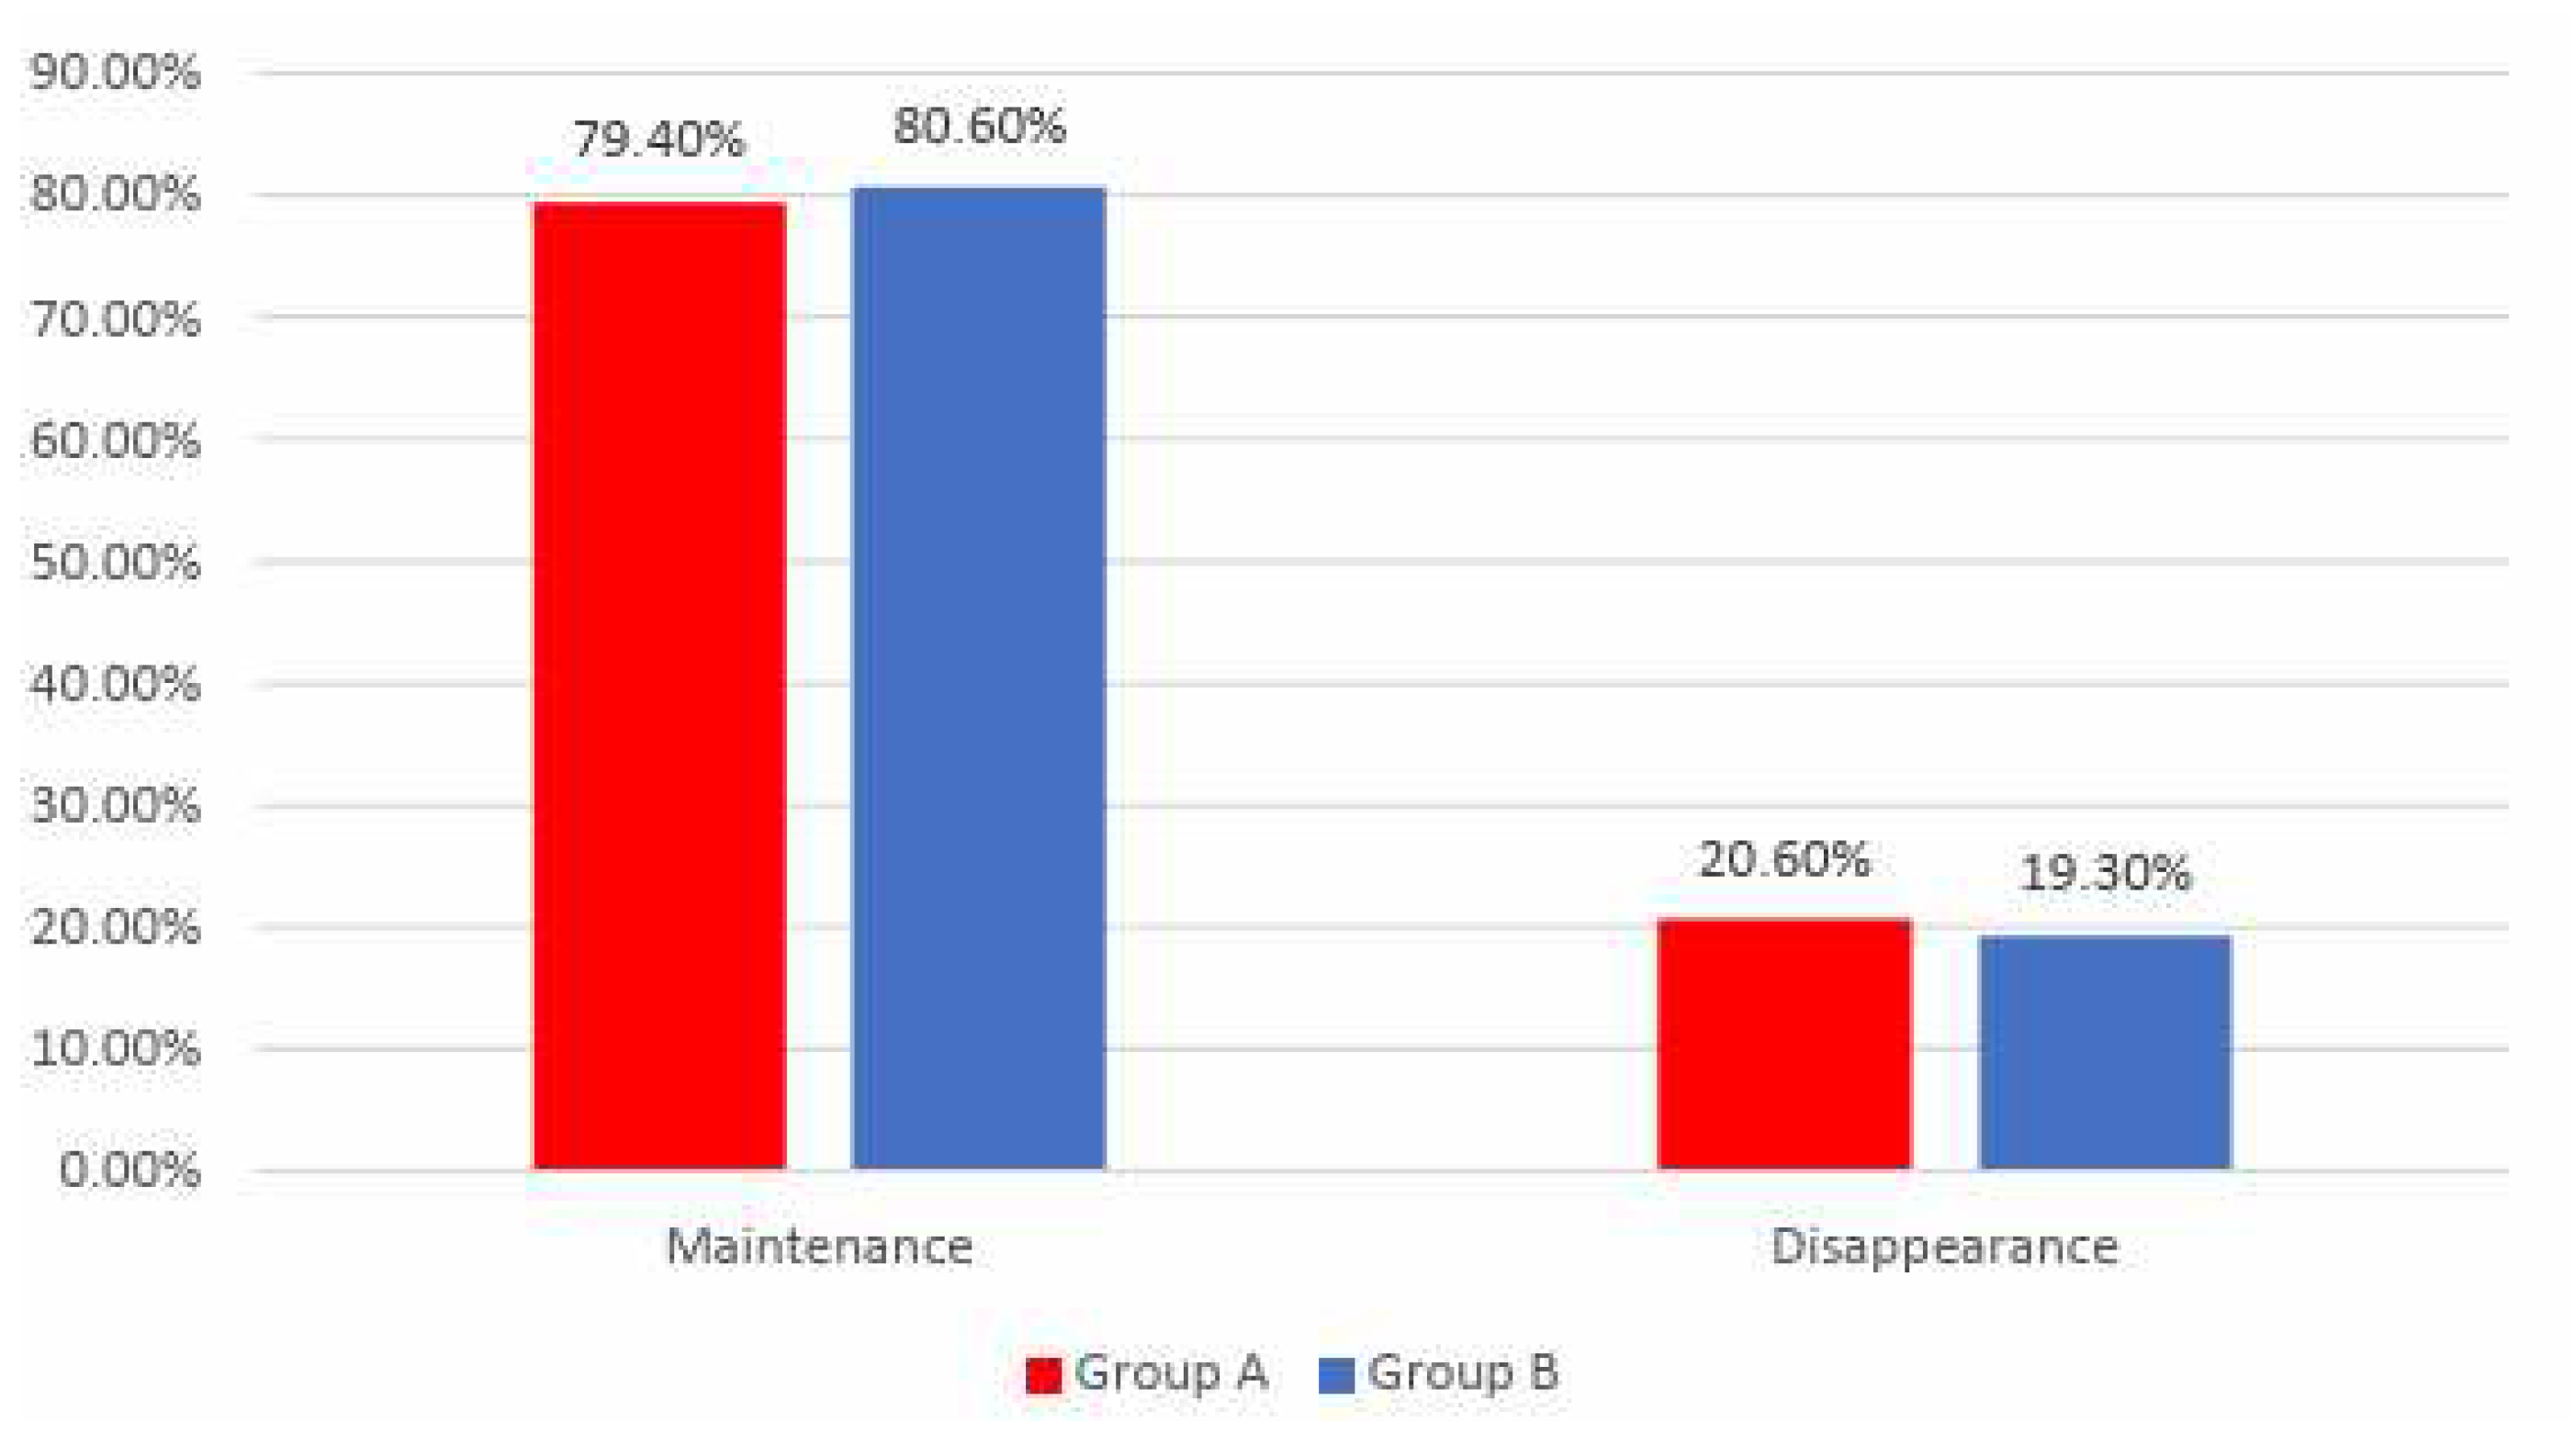
Data from Figure 9 shows the distribution of the patients according to analyzed groups and evolution of angina. Differences between groups were not statistically significant (p=0.483) therefore, although in an important proportion of the patients, angina disappeared at the end of the study, the frequency of the angina disappearance was not significantly different between analyzed groups.
Data from Figure 10 shows the distribution of the patients according to analyzed groups and AMI recurrence. Differences between groups were not statistically significant (p=0.596), as such, frequencies of AMI recurrence between the analyzed groups were not statistically significant in this study.
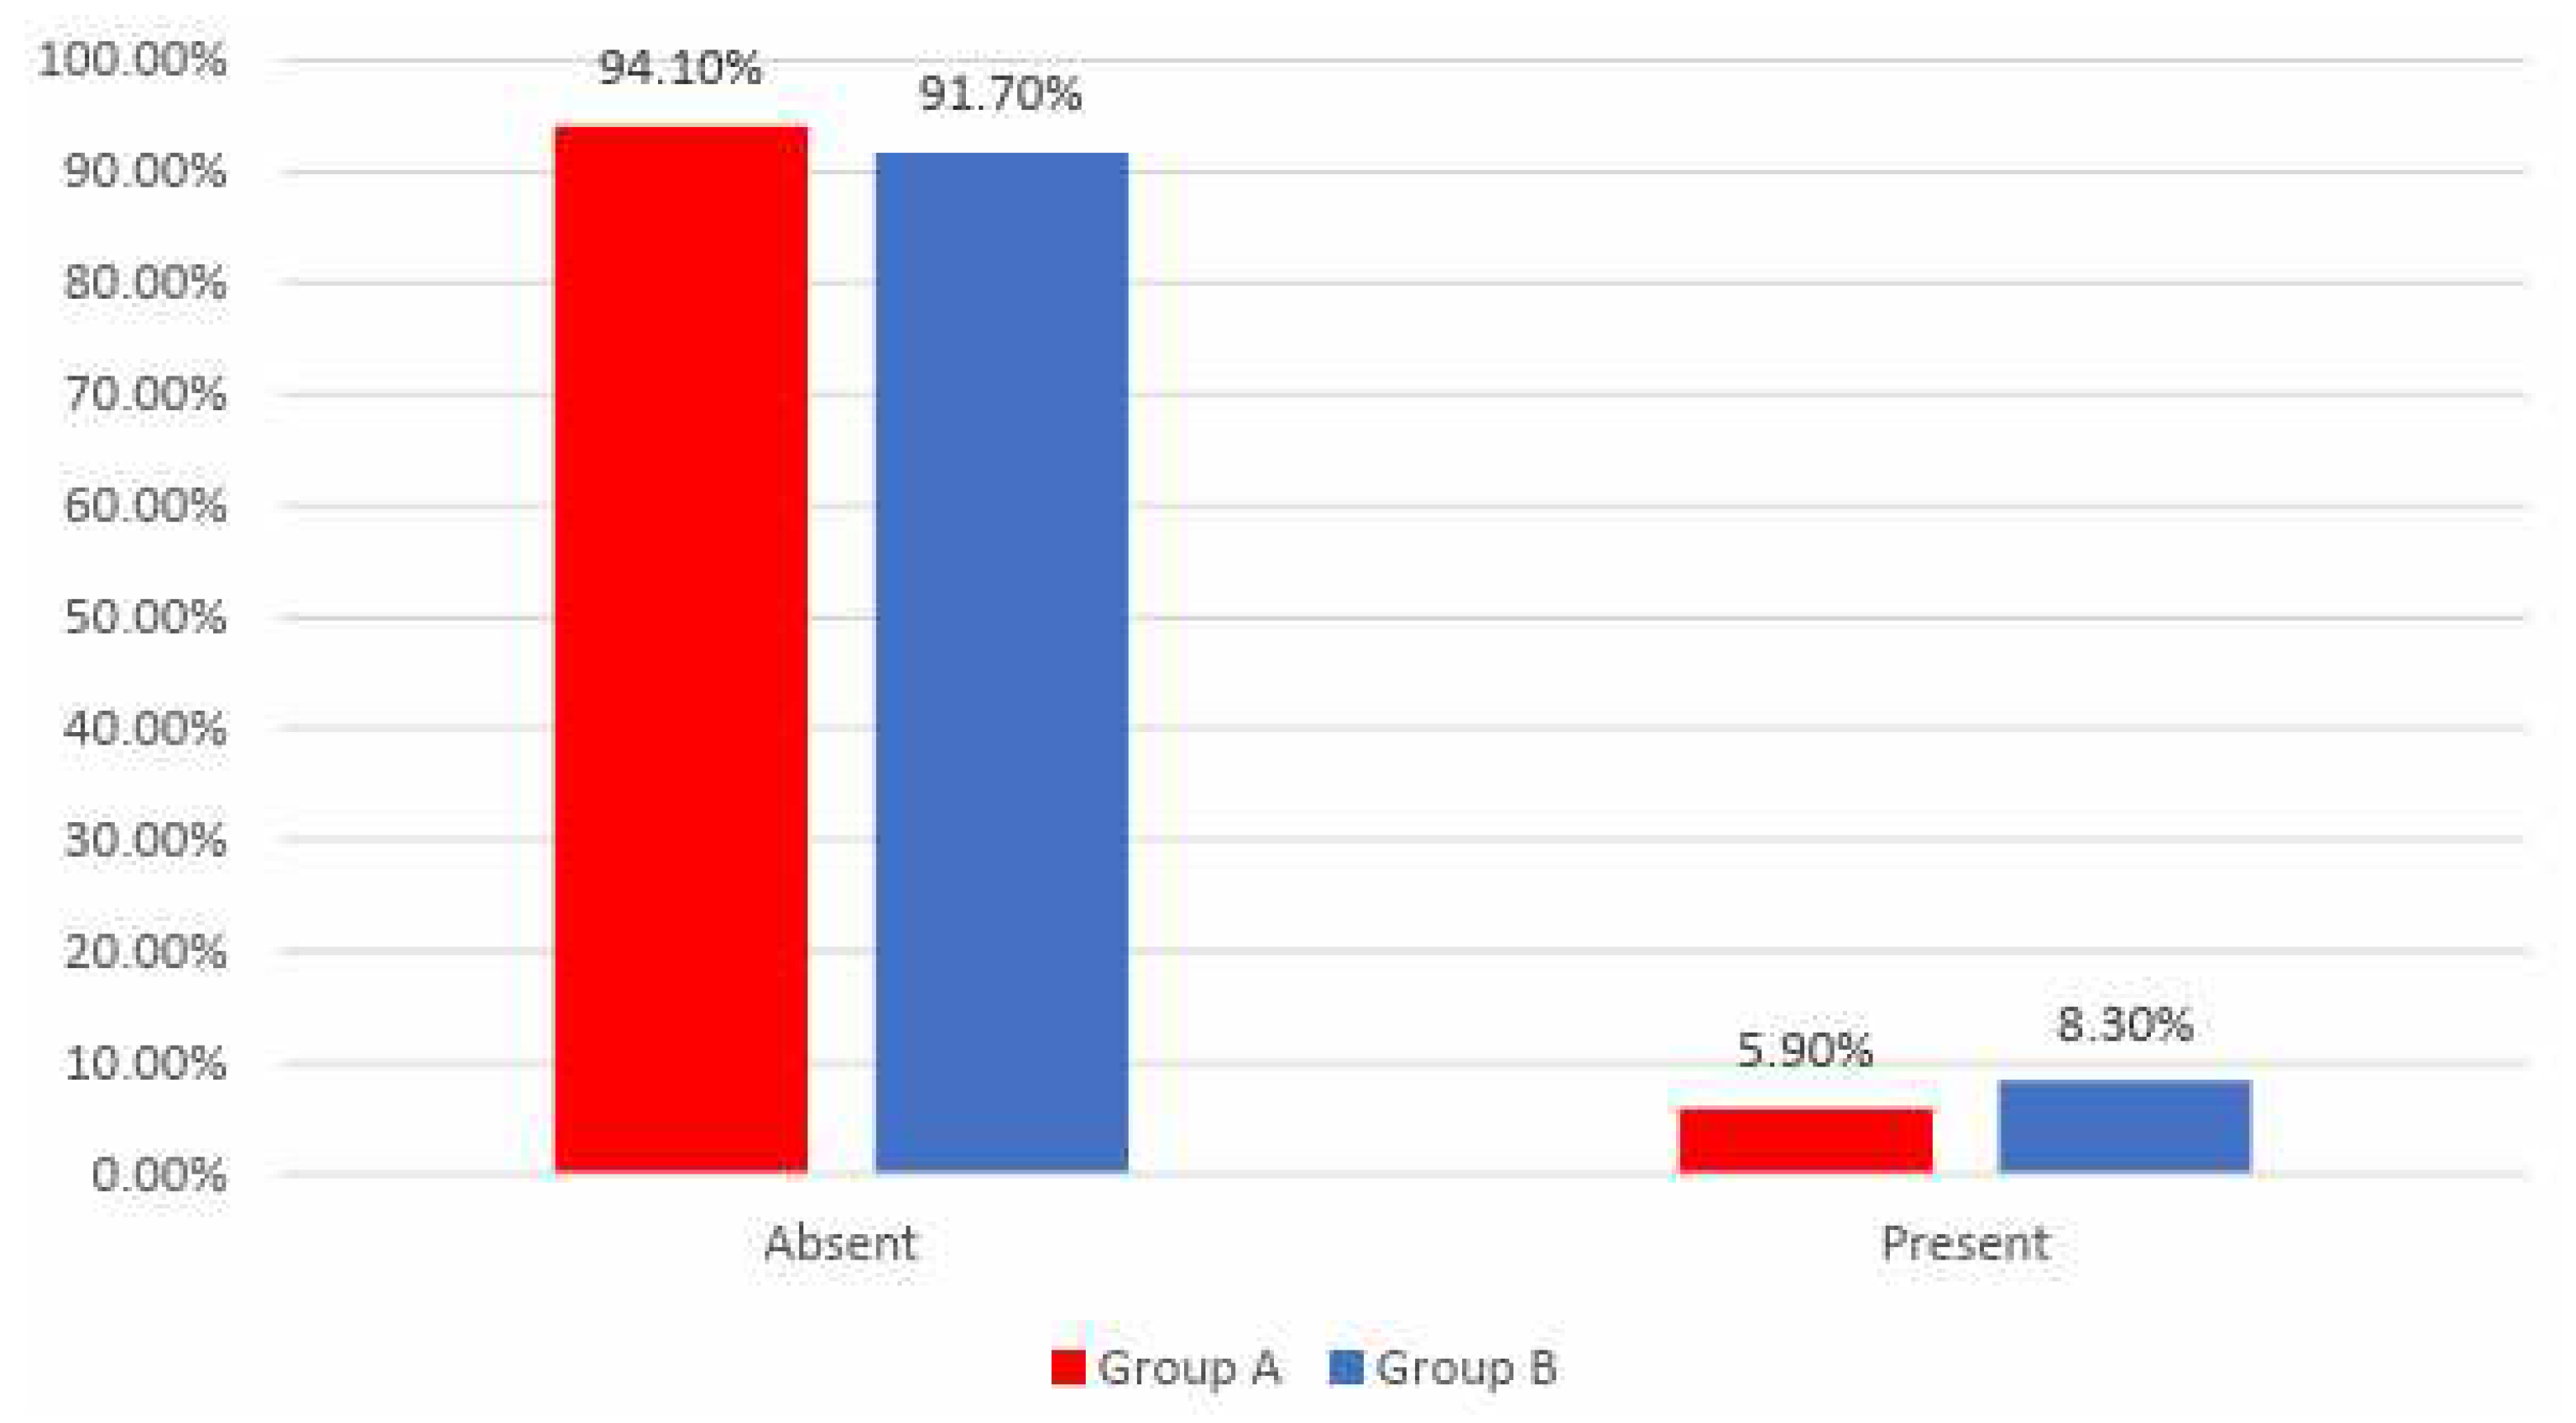
Data from Figure 11 shows the distribution of the patients according to analyzed groups and evolution of arrythmias. Differences between groups were not statistically significant (p=0.864) therefore, although in an important proportion of the patients, arrythmias disappeared at the end of the study, the frequency of the arrythmias disappearance was not significantly different between analyzed groups.
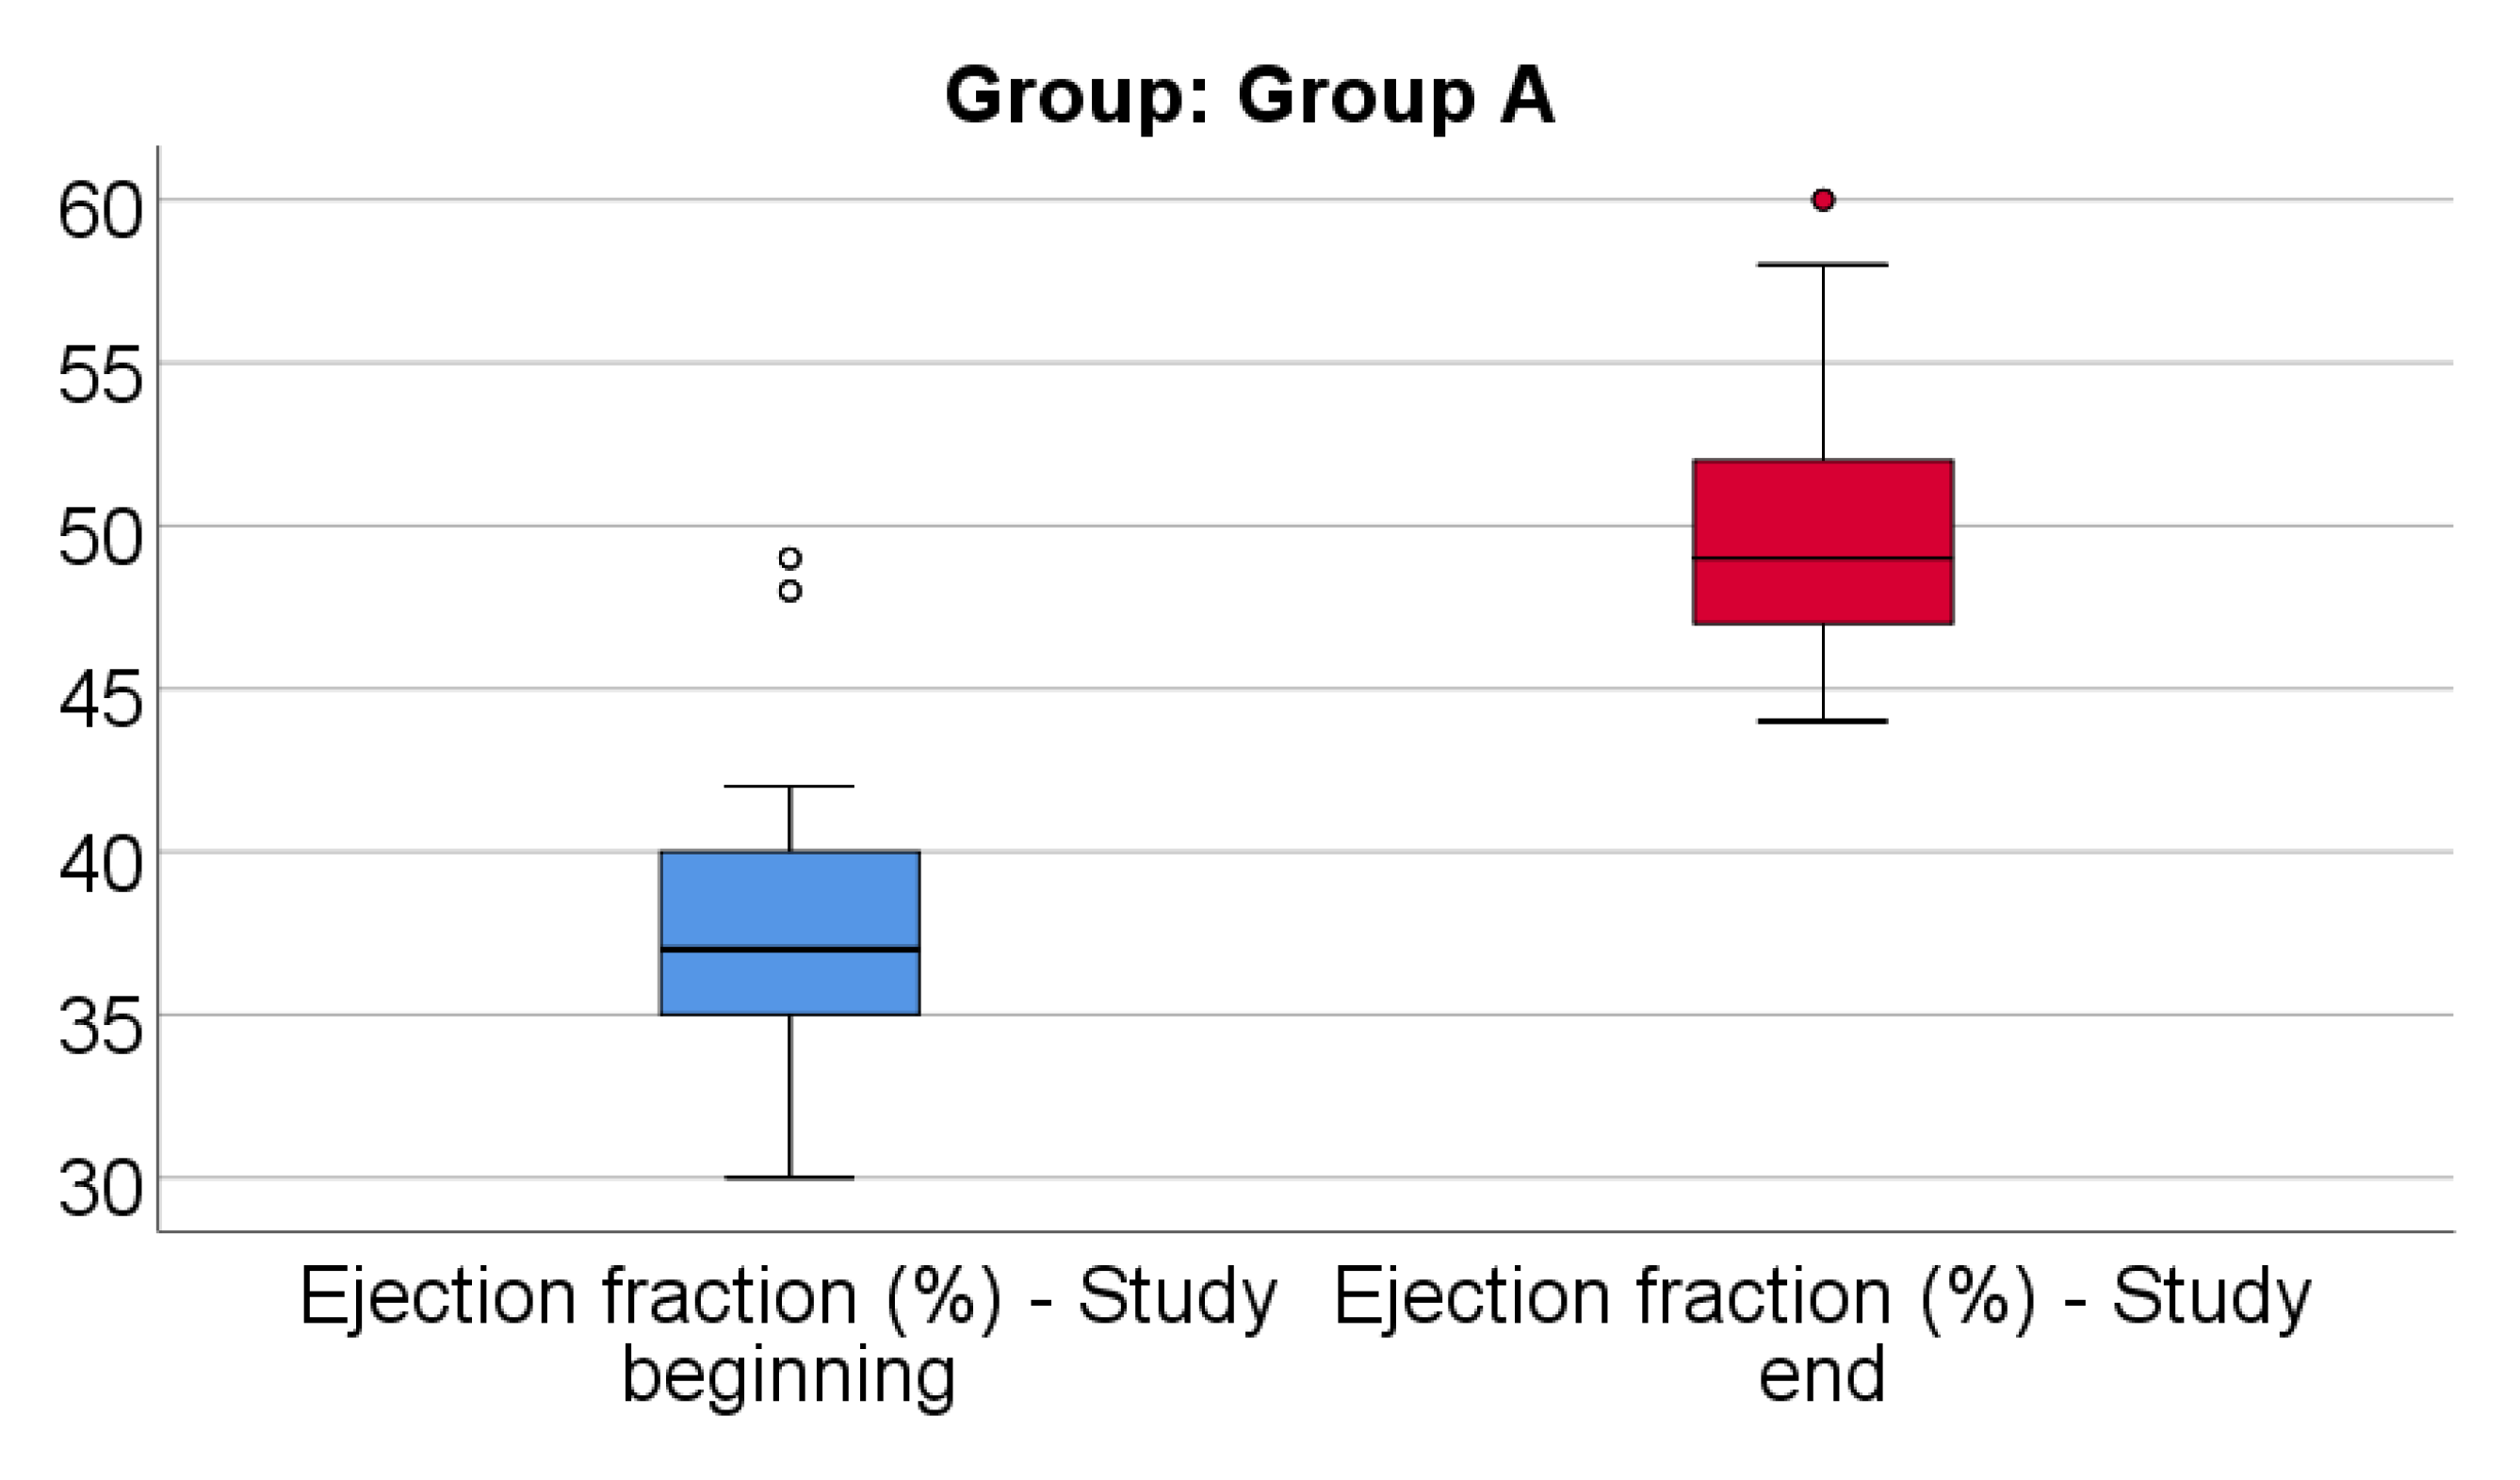
Data from Figure 12 shows the comparison of EF from the beginning to end of the study in patients from Group A. Distribution of EF was non-parametric in both measurements (p<0.05). Differences between the related measurements were statistically significant (p<0.001), therefore EF at the end of the study were significantly higher (median = 49, IQR= 47-52) in comparison to the value at the beginning of the study (median = 37, IQR = 35-40), the difference between the two measurements being significant (median difference = 11, IQR = 9-13 and increase % reported for the EF at the beginning of the study: median % increase: 30.57 %, IQR = 22.5-37.14).
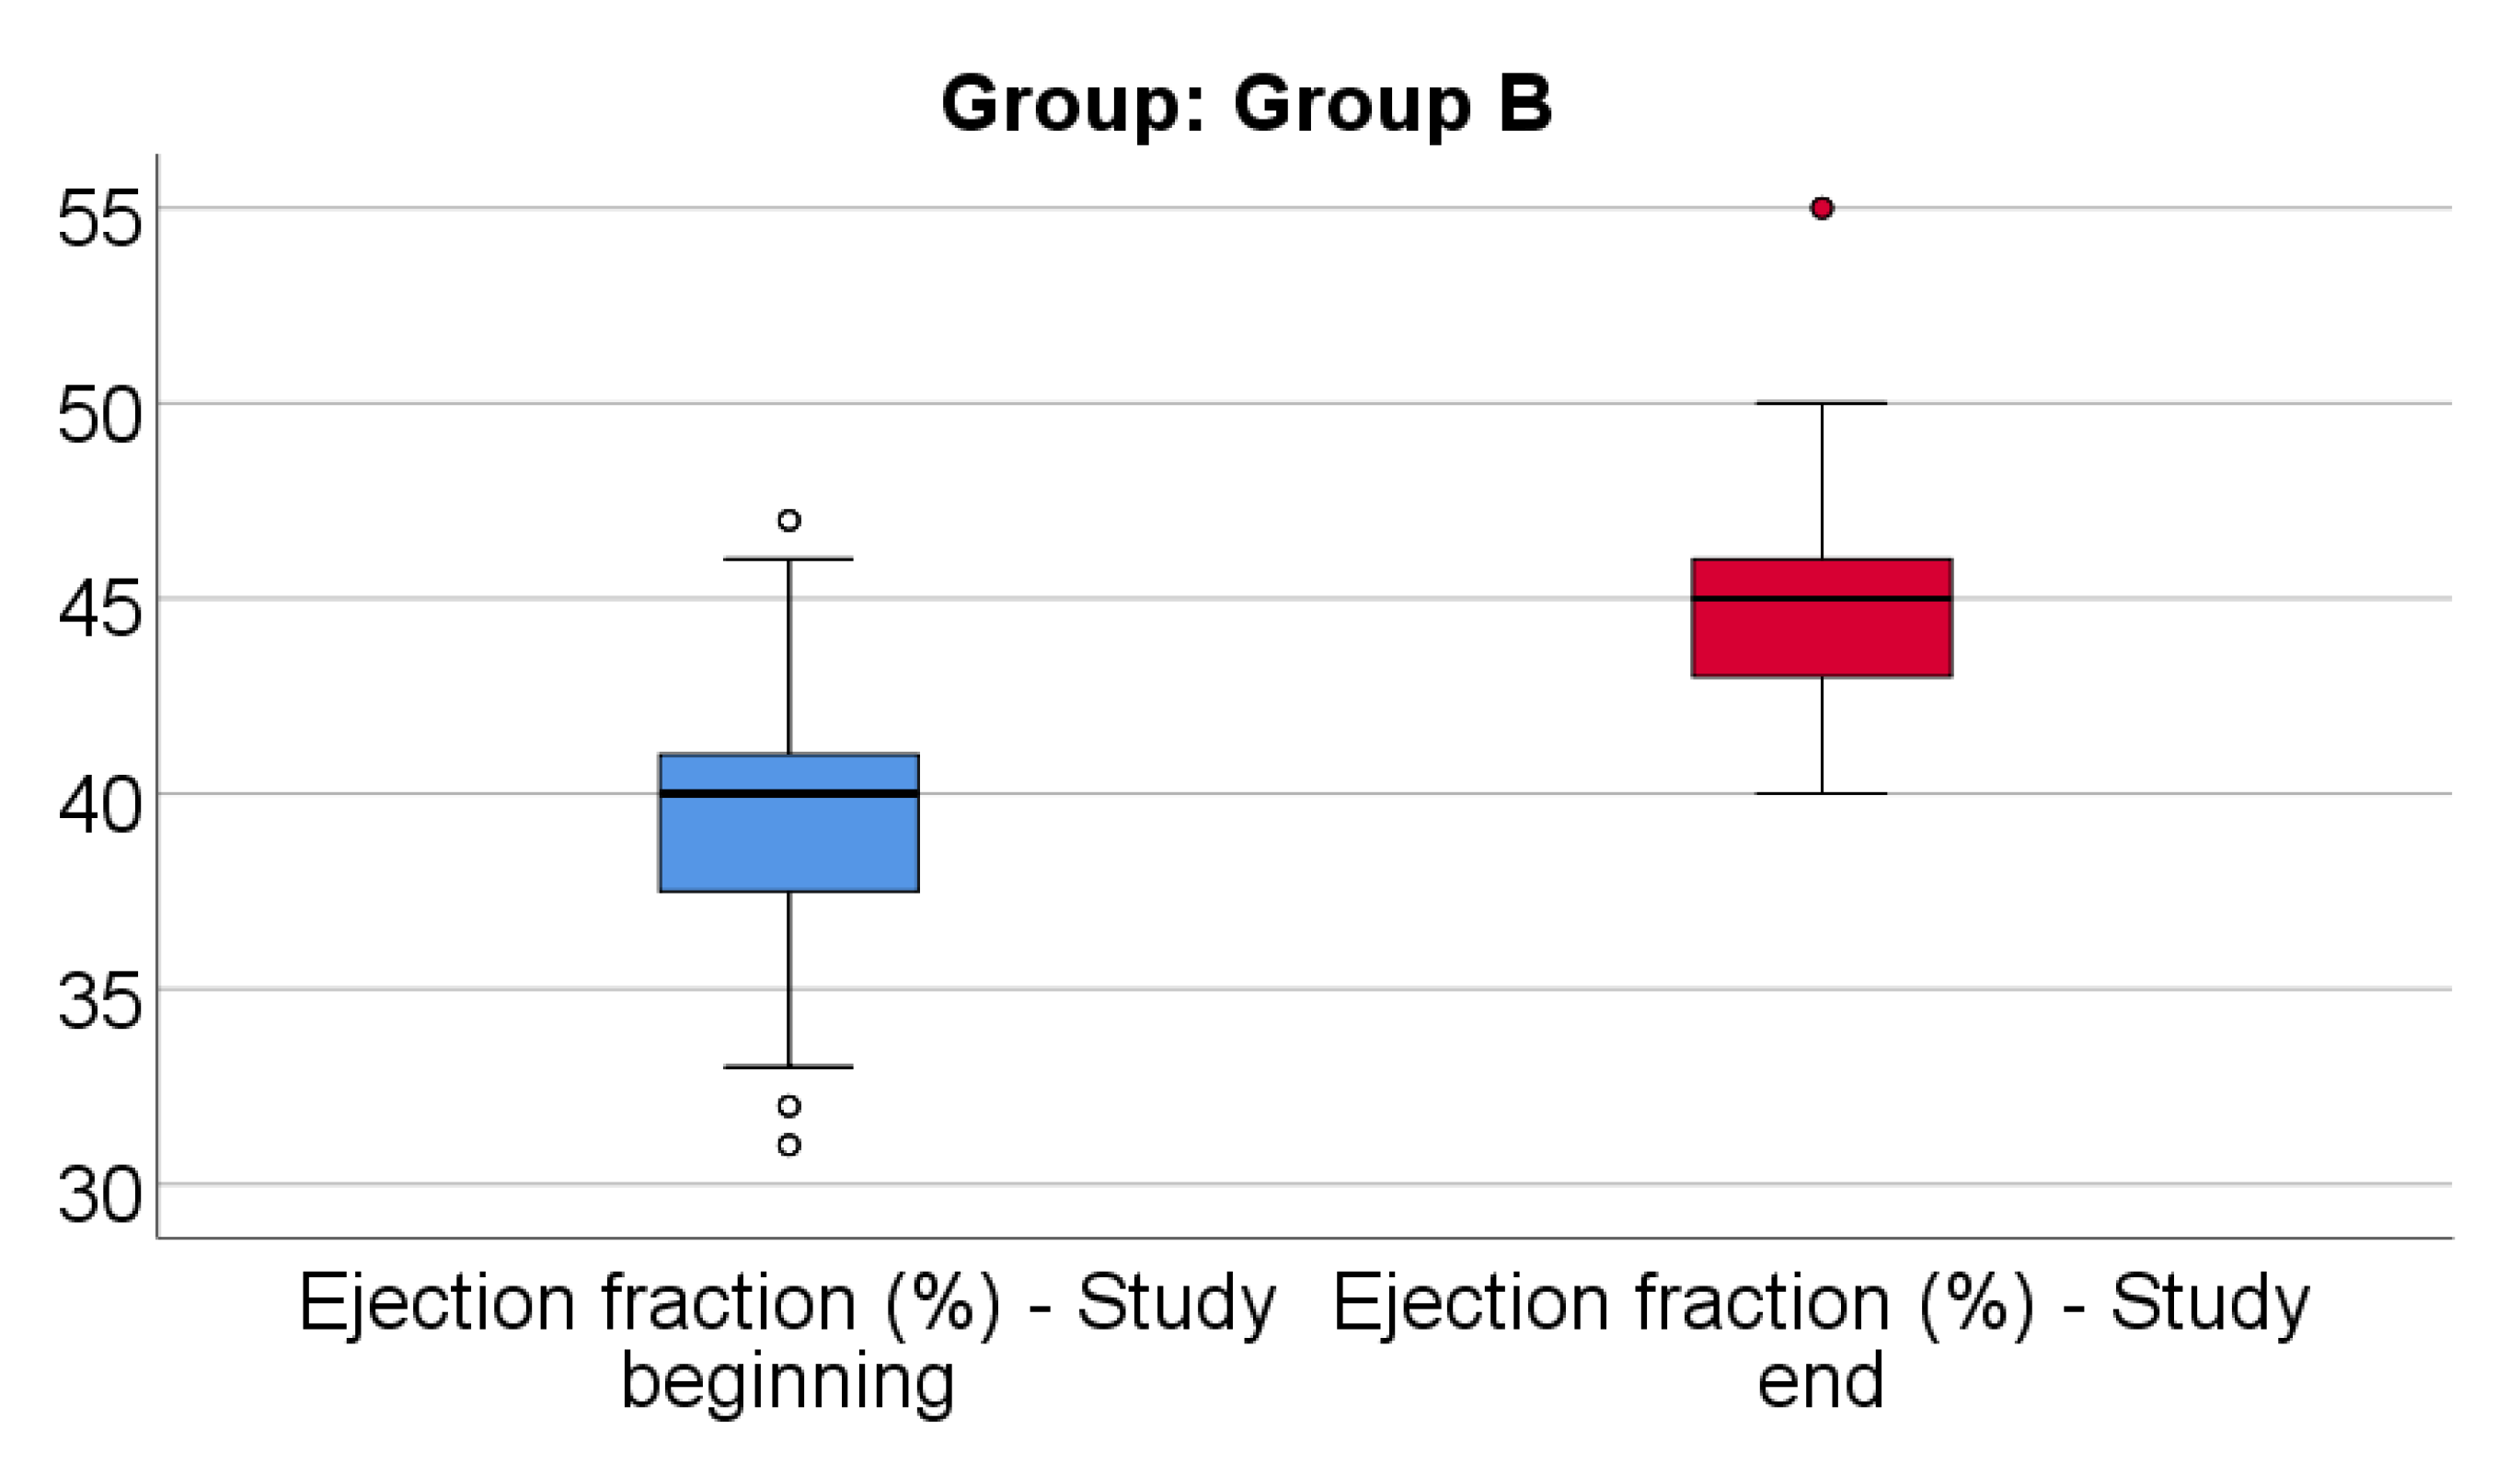
Data from Figure 13 shows the comparison of EF from the beginning to end of the study in patients from Group B. Distribution of EF was non-parametric in both measurements (p<0.05). Differences between the related measurements were statistically significant (p<0.001), therefore EF at the end of the study was significantly higher (median = 45, IQR= 43-46) in comparison to the value at the beginning of the study (median = 40, IQR = 37.25-41), the difference between the two measurements being significant (median difference = 5, IQR = 2-8 and increase % reported for the EF at the beginning of the study: median % increase: 12.5 %, IQR = 5.16-21.34).
Data from Table 14 shows the comparison of EF evolution between analyzed groups. Distribution of EF difference was non-parametric in both groups (p<0.05). Differences between groups were statistically significant (p<0.001/ p<0.001) for both the absolute value of the EF difference and the decrease percentage reported for the EF at the beginning of the study.
Patients in Group A had a significantly higher increase of EF at the end of study from the beginning (median = 11, IQR = 9-13, % - median = 30.57, IQR = 22.5-37.14) in comparison to patients in Group B (median = 5, IQR = 2-8, % - median = 12.5, IQR = 5.16-21.34).
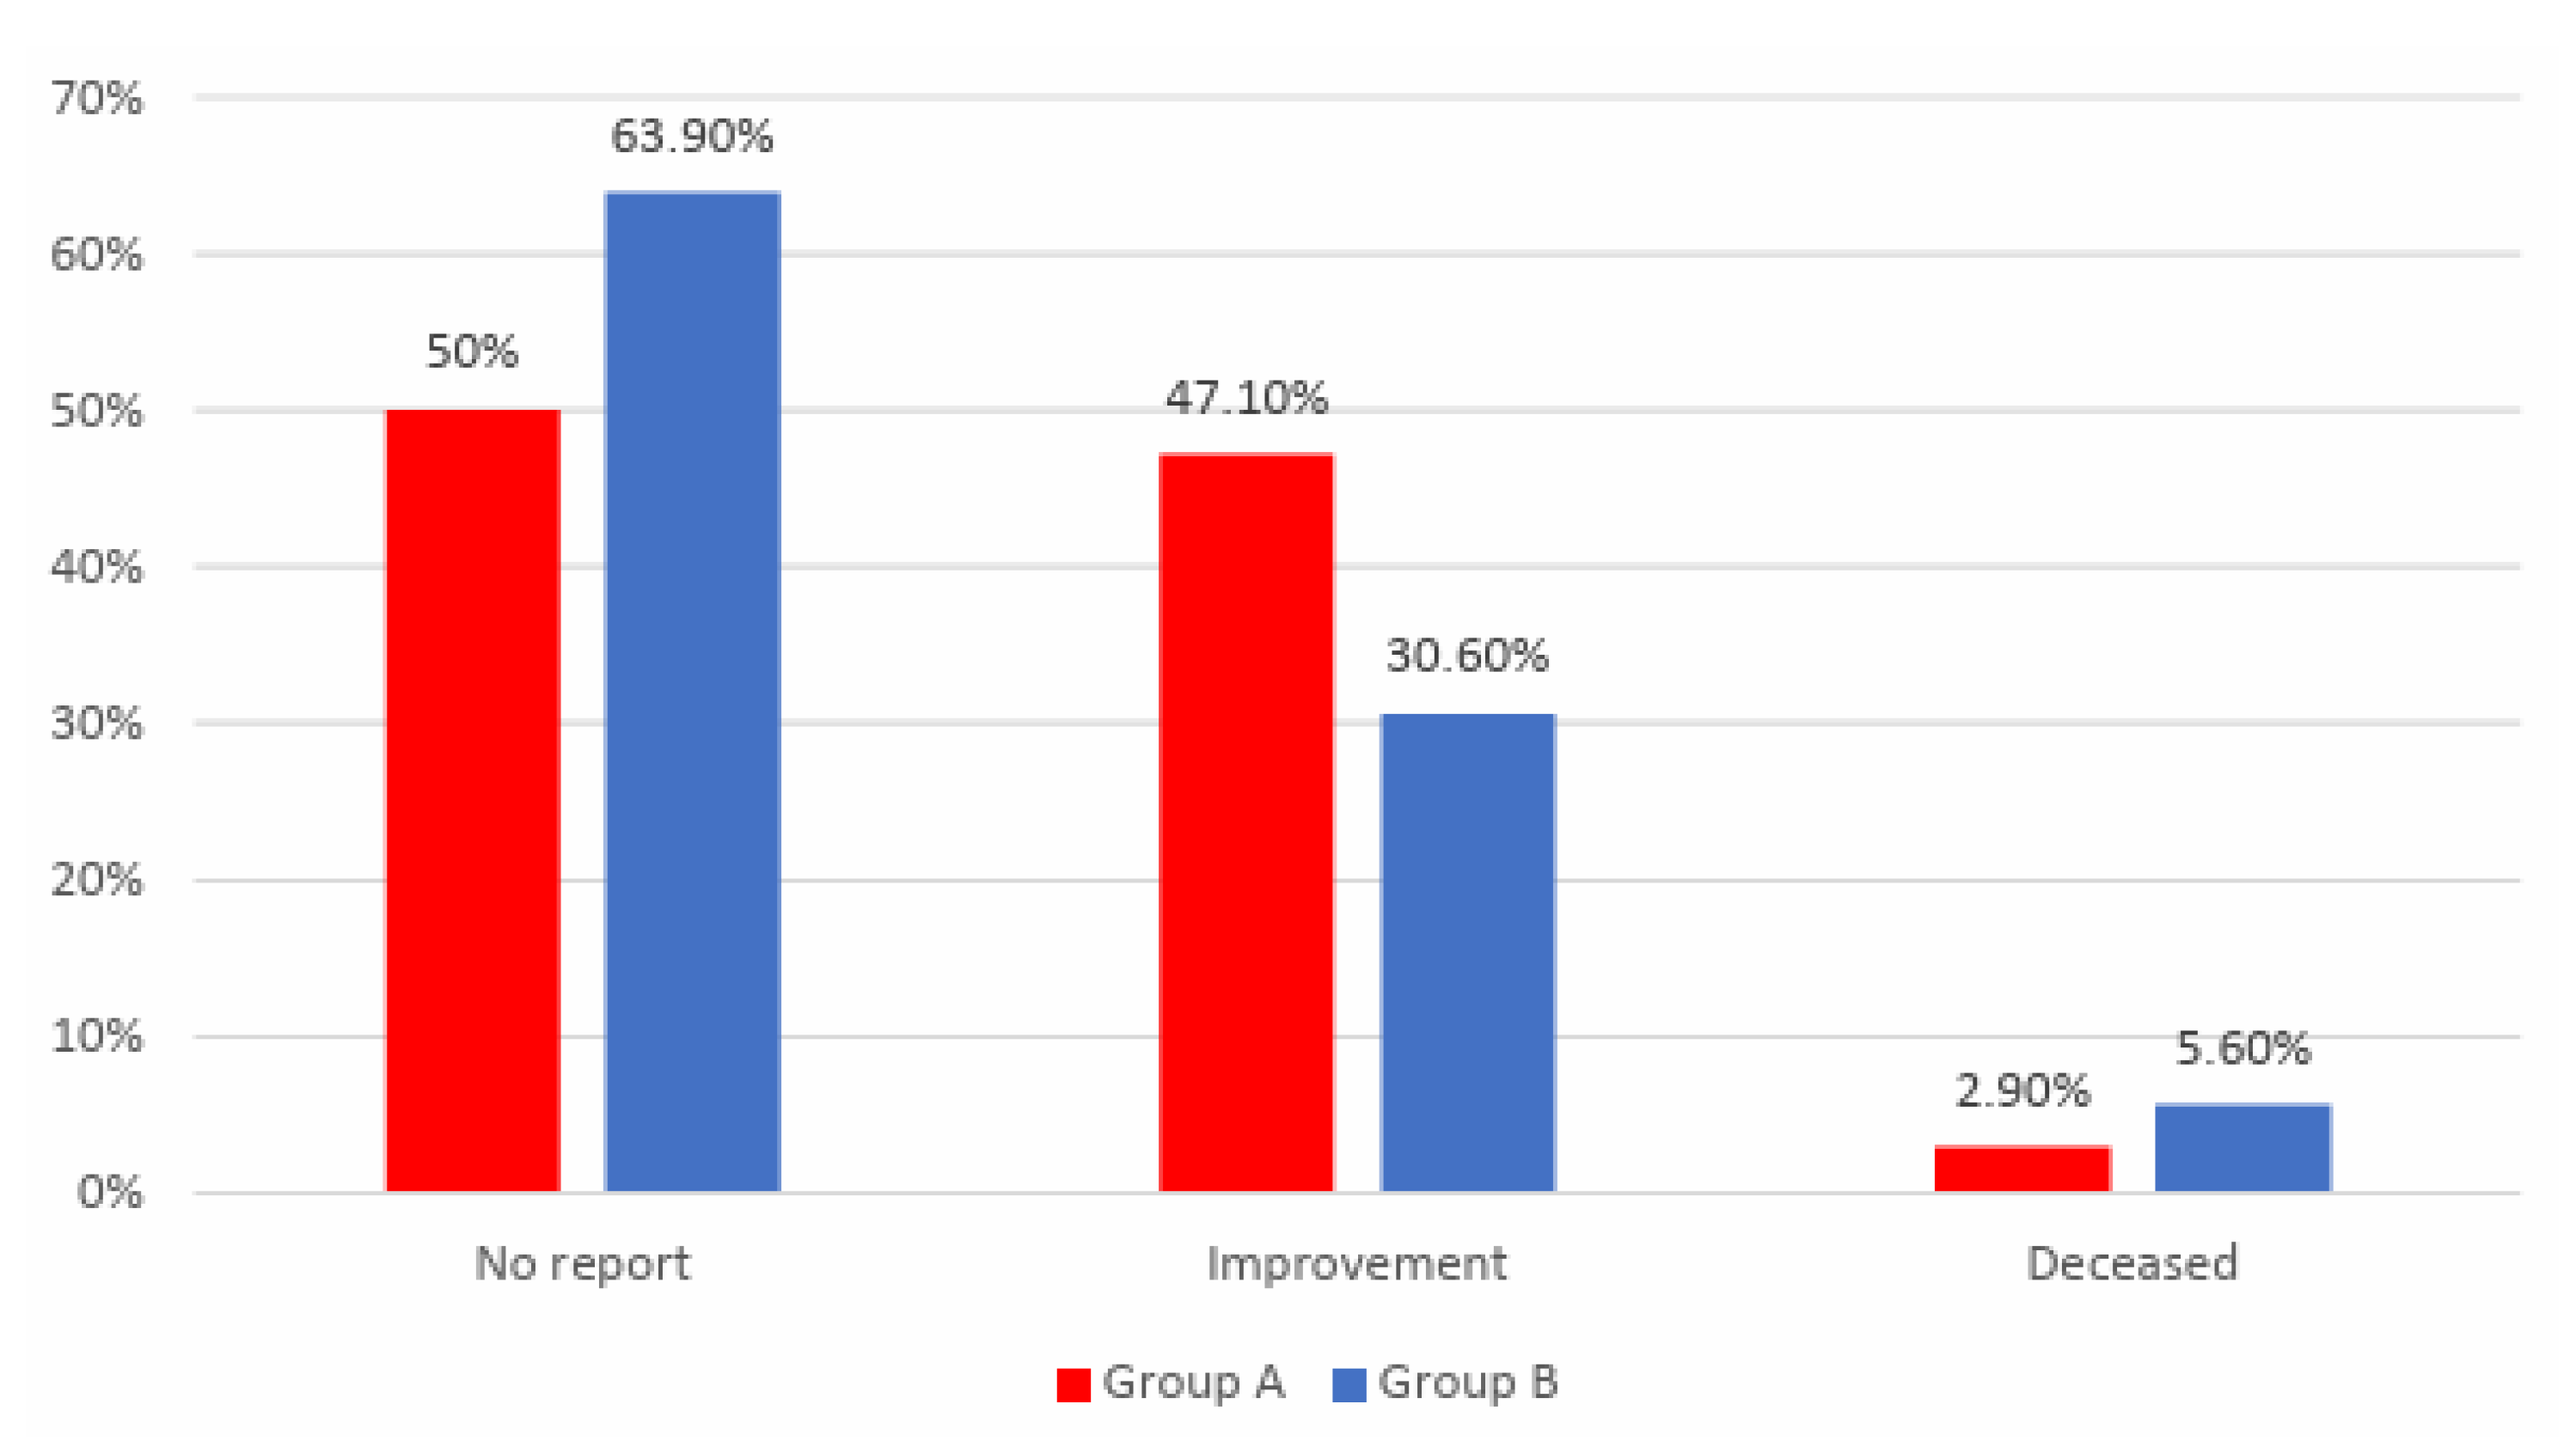
Data from Table 15 and Figure 14 shows the distribution of the patients according to analyzed groups and quality of life. Differences between groups are statistically significant (p=0.039). The patients that reported no improvement at the end of the study were significantly more frequent in Group B than in Group A (63.9% vs. 50%) while patients that reported an improvement at the end of the study were significantly more frequent in Group A than in Group B (47.1% vs. 30.6%). The frequency of mortality was not significantly different between groups (5.6% vs. 2.9%, p=0.500).
Discussions

The study limitations are as follows:
  • The study sample is relatively small (210 participants), which may limit the generalizability of the findings to a broader population. A larger and more diverse sample might provide a more accurate representation of the effects observed.
  • The study is retrospective and observational, which implies inherent limitations related to causality and control over variables. A randomized controlled trial would provide stronger evidence for the observed effects.
  • The selection of participants from a specific Cardiology department and the inclusion criteria may introduce selection bias, potentially affecting the representativeness of the sample and the study's results.
  • Some data, such as exercise tolerance and alcohol consumption, are self-reported by participants, introducing potential recall bias or inaccuracies in reporting.
  • The study assumes treatment compliance and adherence to prescribed medication and lifestyle changes. However, actual compliance might vary, affecting the results and conclusions.
  • The study does not thoroughly account for all potential confounding variables that could impact the results, such as other lifestyle factors, dietary habits, or concurrent medical conditions.
  • The study's one-year duration might not capture long-term effects or changes in health outcomes that could manifest beyond this timeframe.
The findings of our study underscore the variable aspect of exercise tolerance in patients who consumed moderate quantities of alcohol post a major coronary event. These fluctuations might be due to the patients’ adherence to the treatment regime, as well as their motivation and compliance with the medical recommendations. However, despite the variable evolution in the treatment group, the abstinence group clearly displayed a lower increase in the exercise tolerance compared to the alcohol consuming cohort.
The more frequently elevated exercise tolerance found in alcohol drinkers in our study suggests a positive link between physical activity and moderate alcohol consumption. To date, little research has explored the relationship between alcohol use and physical activity, thus it is very difficult to discern whether the positive effect of alcohol intake on exercise tolerance is due to people’s tendency to engage in physical activity more frequently if alcohol is also consumed, or the alcohol’s neurochemical effects. [23,24] Both exercise and alcohol activate the mesocorticolimbic pathway, boosting dopamine activity and increasing endogenous opioids. [23,24] Numerous population-based studies have proven that individuals who consume moderate quantities of alcohol are likely to exercise more often, compared to abstainers. [23,25,26,27]
Considering the overlapping effects of alcohol and exercise, it is no wonder that physical activity is currently being studied as a therapy method for Alcohol Use Disorder (AUD). [23] Thus, more clinical trials and evidence-based studies are needed to fill the gaps in understanding how exactly alcohol and exercise are linked, and the way we can use their combined effects to positively impact cardiovascular health, and not only. [23]
Regarding the serum lipids, a meta-analysis from 2011 summarized the effects of alcohol consumption on the cardiovascular profile, depending on genetic variants. [28] Despite the genetical implications, a significant dose-response relationship was observed for HDL-c in all study groups with alcohol intake, in comparison to no alcohol use. However, in this particular work, alcohol consumption did not considerably influence the levels of LDL-c, total cholesterol, triglycerides, apolipoprotein-A1 (apo-A1),or specific inflammation biomarkers (such as C-reactive protein, interleukin-6, tumor necrosis factor α). Moreover, despite the rising interest in differences between beer, wine and hard liquors, the type of alcoholic beverage did not generate any significant changes regarding the levels of cardiac and inflammation biomarkers. [29,30,31] In contrast, a randomized, cross-over, clinical trial described the effects of moderate intake of red wine, and its polyphenolic content, on serum lipids, with a decrease in LDL-c levels, an increase in HDL-c, and no changes in total cholesterol and TGs. [12]
In the WOBASZ study, the favorable effect of alcohol intake on the levels of HDL-c, as well as the lower likelihood of diabetes associated with moderate consumption, was counterbalanced by the negative effect on blood pressure, homocysteinaemia, and triglycerides as well, in patients with an intake higher than 15 g of ethanol daily. [17] However, the cardio-protective effects of moderate alcohol consumption are reinforced in numerous other studies, the possible mechanism, once again, being the proven increase in HDL-c levels. [32,33,34]
The relation between alcohol consumption patterns and their effects on the lipid profile remains highly controversial and debatable, with the effect of alcohol on LDL-c and triglycerides not being completely elucidated. [31,35,36,37,38,39,40,41]
In this study, the stability of the atherosclerotic plaque was evaluated through angina instances, AMI recurrences and arrythmia episodes. Although statistically insignificant in our study, several works have highlighted the effects of moderate alcohol consumption on the risk of angina, AMI, and arrythmias, over the years.
A large cohort study from 2017 demonstrated that the risk of unstable angina, AMI, heart failure, and sudden cardiac death, was higher in abstainers compared to moderate alcohol consumers. Additionally, heavy drinkers also displayed an increased prevalence of fatal AMI, heart failure, and sudden coronary death, but a lower risk of stable angina. [42] Overall, alcohol abuse is associated with frequent hospitalizations for heart failure, as well as emergency department visits. [43]
However, an interesting observation is that alcohol consumption, regardless of dose, might be inversely associated with the risk of AMI in high- and middle-income countries. [44,45] Another meta-analysis displayed an inverse association between alcohol drinkers and AMI incidence, more pronounced for the non-fatal outcomes. [46] Another work suggests that occasional (heavy) drinkers actually present a higher risk of AMI compared to regular moderate consumers. [47,48] Women especially seem to display lower risk of AMI when moderate alcohol intake is involved, compared to no consumption or heavy drinking. [49]
In terms of arrythmias, several studies have shown that the risk of AF is more elevated in drinking individuals, even moderate consumers, compared to abstainers. [50,51,52,53] However, more recent data indicates that 10-12 g of alcohol per drink, 6-7 drinks per week, does not increase the risk of AF. [43,50] These findings are supported by another cohort study, where people drinking 56 g of alcohol per week, more specifically red wine, actually presented the lowest risk of developing AF compared to convinced abstainers. Beer and spirit drinks did not display the same results. [54]
It is certain that alcohol consumption might lead to structural damage to the heart muscle, or alcoholic cardiomyopathy. Left ventricle dilatation, hypertrophy, and impairment, thus a reduction in the ejection fraction, can be caused directly by the toxic effect of alcohol metabolites on the heart muscle. [55] This is a significant risk factor in the appearance of AMI and sudden cardiac death. [56] In the ARIC study, abusive intake is associated with augmented levels of cardiac damage biomarkers, high-sensitivity cardiac troponin T (hs-cTnT) and N-terminal pro B-type natriuretic peptide (NT-proBNP). [57] Another work suggests an inverse correlation between the estimated total lifetime dose of alcohol, muscular strength and ejection fraction, but a direct association with the left ventricular mass. [58]
Low and moderate alcohol consumption may increase quality of life as suggested in the results of our study. This may be attributed to the decreased risk of other comorbidities such as type 2 diabetes, stroke, heart failure, and all-cause mortality. [59,60] Although the frequency of mortality in our group was not statistically significant, studies from specialty literature reveal that even in patients with established CVD, moderate alcohol consumption has been linked to a lower incidence of CV and all-cause mortality. [59,60]

Conclusions

Our study demonstrates that a standardized medical treatment regimen, complemented by the antioxidant effects of moderate alcohol consumption, a progressive increase in physical activity levels, as well as the patient’s compliance to therapy, has a positive impact on the recovery and well-being of patients post major coronary events. This assertion is strongly supported by the outcomes observed in the cohort consuming moderate amounts of alcohol, denoted as group A. The benefits observed in this group encompass frequent enhancements in exercise tolerance, an increase in the ejection fraction of the left ventricle, improvements in the values of the serum lipids, and reported progress in the quality of life.
The enhancement in exercise tolerance among individuals who consume moderate amounts of alcohol suggests a potential beneficial correlation between moderate alcohol consumption and increased physical activity. Further research is essential to establish a definitive link between alcohol intake and exercise patterns. Our study emphasizes the need for a comprehensive exploration of how the synergistic effects of alcohol and exercise can be effectively harnessed to positively influence cardiovascular health and potentially extend their benefits beyond.
The results of our study suggest that moderate alcohol consumption correlates with favorable changes in HDL-cholesterol levels. This finding corresponds with existing data suggesting the potential cardio-protective effects of moderate alcohol consumption. However, it is crucial to acknowledge the ongoing debate regarding the effects of alcohol on LDL-cholesterol and triglycerides. This study contributes to the broader discourse on the relationship between alcohol consumption patterns and their impact on lipid profiles.
Furthermore, our study suggests a potential connection between alcohol consumption and the risk of recurrent cardiovascular events. While the associations are complex,our study underscores the importance of carefully considering alcohol consumption patterns in the context of cardiovascular risk and recurrence.
Low to moderate alcohol consumption was associated with improved quality of life and decreased mortality, affirming previous research. The potential reduction in the risk of comorbidities such as type 2 diabetes, stroke, heart failure, and all-cause mortality suggests the need for further research in this field.
In conclusion, our study encourages a comprehensive approach to cardiovascular health that integrates personalized medical treatment, controlled alcohol consumption, and regular physical activity. However, we acknowledge the need for further extensive research, including controlled clinical trials, to validate and refine our findings and ultimately guide evidence-based practices in the management of patients post major coronary events.

References

  1. Khan, M.S.; Ghumman, G.M.; Baqi, A.; Shah, J.; Aziz, M.; Mir, T.; Tahir, A.; Katragadda, S.; Singh, H.; Taleb, M.; Ali, S.S. Efficacy of pemafibrate versus fenofibrate administration on serum lipid levels in patients with dyslipidemia: Network meta-analysis and systematic review. American Journal of Cardiovascular Drugs. 2023. [CrossRef]
  2. Toth, P.P.; Banach, M. Statins: Then and now. Methodist DeBakey Cardiovascular Journal. 2019, 15, 23. [Google Scholar] [CrossRef] [PubMed]
  3. Tecson, K.M.; Kluger, A.Y.; Cassidy-Bushrow, A.E.; Liu, B.; Coleman, C.M.; Jones, L.K.; Jefferson, C.R.; VanWormer, J.J.; McCullough, P.A. Usefulness of statins as secondary prevention against recurrent and terminal major adverse cardiovascular events. The American Journal of Cardiology. 2022, 176, 37–42. [Google Scholar] [CrossRef] [PubMed]
  4. Kim, K.; Ginsberg, H.N.; Choi, S.H. New, novel lipid-lowering agents for reducing cardiovascular risk: Beyond statins. Diabetes & Metabolism Journal. 2022, 46, 517–532. [Google Scholar] [CrossRef] [PubMed]
  5. Al-Mamari, A. Atherosclerosis and physical activity. Oman Medical Journal. 2009. [Google Scholar] [CrossRef]
  6. Zhuang, Z.; Gao, M.; Yang, R.; Li, N.; Liu, Z.; Cao, W.; Huang, T. Association of Physical Activity, sedentary behaviours and sleep duration with cardiovascular diseases and lipid profiles: A Mendelian randomization analysis. Lipids in Health and Disease. 2020, 19. [Google Scholar] [CrossRef]
  7. Shigdel, R.; Dalen, H.; Sui, X.; Lavie, C.J.; Wisløff, U.; Ernstsen, L. Cardiorespiratory fitness and the risk of first acute myocardial infarction: The hunt study. Journal of the American Heart Association. 2019, 8. [Google Scholar] [CrossRef] [PubMed]
  8. de Koning, I.A.; van Bakel, B.M.; Rotbi, H.; Van Geuns, R.-J.M.; Cramer, G.E.; Pop, G.A.; Eijsvogels, T.; Thijssen, D.H. Association between engagement in exercise training and peak cardiac biomarker concentrations following ST-elevation myocardial infarction. BMJ Open Sport & Exercise Medicine. 2023, 9. [Google Scholar] [CrossRef]
  9. Hung, M.-Y.; Kounis, N.G.; Lu, M.-Y.; Hu, P. Myocardial ischemic syndromes, heart failure syndromes, electrocardiographic abnormalities, arrhythmic syndromes and angiographic diagnosis of coronary artery spasm: Literature review. International Journal of Medical Sciences. 2020, 17, 1071–1082. [Google Scholar] [CrossRef]
  10. Hung, M.-Y.; Hung, M.-J. Relationship between inflammation and vasospastic angina. Medicina. 2023, 59, 318. [Google Scholar] [CrossRef]
  11. Hung, M.-J.; Yeh, C.-T.; Kounis, N.G.; Koniari, I.; Hu, P.; Hung, M.-Y. Coronary artery spasm-related heart failure syndrome: Literature review. International Journal of Molecular Sciences. 2023, 24, 7530. [Google Scholar] [CrossRef]
  12. Chiva-Blanch, G.; Badimon, L. Benefits and risks of moderate alcohol consumption oncardiovascular disease: Current findings and controversies. Nutrients. 2019, 12, 108. [Google Scholar] [CrossRef] [PubMed]
  13. Guo, L.; Zhang, X.; Lv, N.; Wang, L.; Gan, J.; Jiang, X.; Wang, Y. Therapeutic role and potential mechanism of resveratrol in atherosclerosis: TLR4/NF-ΚB/hif-1α. Mediators of Inflammation. 2023, 2023, 1–13. [Google Scholar] [CrossRef] [PubMed]
  14. Leifert, W.R.; Abeywardena, M.Y. Cardioprotective actions of grape polyphenols. Nutrition Research. 2008, 28, 729–737. [Google Scholar] [CrossRef] [PubMed]
  15. Whitfield, J.B.; Heath, A.C.; Madden, P.A.; Pergadia, M.L.; Montgomery, G.W.; Martin, N.G. Metabolic and biochemical effects of low-to-moderate alcohol consumption. Alcoholism: Clinical and Experimental Research. 2012, 37, 575–586. [Google Scholar] [CrossRef] [PubMed]
  16. Huang, S.; Li, J.; Shearer, G.C.; Lichtenstein, A.H.; Zheng, X.; Wu, Y.; Jin, C.; Wu, S.; Gao, X. Longitudinal study of alcohol consumption and HDL concentrations: A community-based study. The American Journal of Clinical Nutrition. 2017, 105, 905–912. [Google Scholar] [CrossRef] [PubMed]
  17. Waśkiewicz, A.; Sygnowska, E. Alcohol intake and cardiovascular risk factor profile in men participating in the WOBASZ study. Kardiologia Polska. 2013, 71, 359–365. [Google Scholar] [CrossRef]
  18. Wilkens, T.L.; Tranæs, K.; Eriksen, J.N.; Dragsted, L.O. Moderate alcohol consumption and lipoprotein subfractions: A systematic review of intervention and observational studies. Nutrition Reviews. 2021, 80, 1311–1339. [Google Scholar] [CrossRef]
  19. Haunschild, R.; Marx, W. On health effects of resveratrol in wine. International Journal of Environmental Research and Public Health. 2022, 19, 3110. [Google Scholar] [CrossRef]
  20. Nicholls, S.J. Exposing the complexity of HDL. Cleveland Clinic Journal of Medicine. 2007, 74, 709–710. [Google Scholar] [CrossRef]
  21. Muntner, P.; Lee, F.; Astor, B.C. Association of high-density lipoprotein cholesterol with coronary heart disease risk across categories of low-density lipoprotein cholesterol: The atherosclerosis risk in communities study. The American Journal of the Medical Sciences. 2011, 341, 173–180. [Google Scholar] [CrossRef]
  22. Deng, Q.; Li, X.X.; Fang, Y.; Chen, X.; Xue, J. Therapeutic potential of quercetin as an antiatherosclerotic agent in Atherosclerotic Cardiovascular Disease: A Review. Evidence-Based Complementary and Alternative Medicine. 2020, 2020, 1–12. [Google Scholar] [CrossRef] [PubMed]
  23. Leasure, J.L.; Neighbors, C.; Henderson, C.E.; Young, C.M. Exercise and alcohol consumption: What we know, what we need to know, and why it is important. Frontiers in Psychiatry. 2015, 6. [Google Scholar] [CrossRef] [PubMed]
  24. Lindholm, S.; Ploj, K.; Franck, J.; Nylander, I. Repeated ethanol administration induces short- and long-term changes in enkephalin and dynorphin tissue concentrations in rat brain. Alcohol. 2000, 22, 165–171. [Google Scholar] [CrossRef] [PubMed]
  25. Smothers, B.; Bertolucci, D. Alcohol consumption and health-promoting behavior in a U.S. household sample: Leisure-time physical activity. Journal of Studies on Alcohol. 2001, 62, 467–476. [Google Scholar] [CrossRef] [PubMed]
  26. French, M.T.; Popovici, I.; Maclean, J.C. Do alcohol consumers exercise more? findings from a national survey. American Journal of Health Promotion. 2009, 24, 2–10. [Google Scholar] [CrossRef] [PubMed]
  27. Lisha, N.E.; Martens, M.; Leventhal, A.M. Age and gender as moderators of the relationship between physical activity and alcohol use. Addictive Behaviors. 2011, 36, 933–936. [Google Scholar] [CrossRef]
  28. Holmes, M.V.; Dale, C.E.; Zuccolo, L.; Silverwood, R.J.; Guo, Y.; Ye, Z.; Prieto-Merino, D.; Dehghan, A.; Trompet, S.; Wong, A.; Cavadino, A.; Drogan, D.; Padmanabhan, S.; Li, S.; Yesupriya, A.; et al. Association between alcohol and cardiovascular disease: Mendelian randomisation analysis based on individual participant data. BMJ. 2014, 349. [Google Scholar] [CrossRef]
  29. Roerecke, M. Alcohol’s impact on the cardiovascular system. Nutrients. 2021, 13, 3419. [Google Scholar] [CrossRef]
  30. Ronksley, P.E.; Brien, S.E.; Turner, B.J.; Mukamal, K.J.; Ghali, W.A. Association of alcohol consumption with selected cardiovascular disease outcomes: A systematic review and meta-analysis. BMJ. 2011, 342, d671–d671. [Google Scholar] [CrossRef]
  31. Minzer, S.; Losno, R.A.; Casas, R. The effect of alcohol on cardiovascular risk factors: Is there new information? Nutrients. 2020, 12, 912. [Google Scholar] [CrossRef] [PubMed]
  32. Zatu, M.C.; van Rooyen, J.M.; Loots, D.T.; Wentzel-Viljoen, E.; Greeff, M.; Schutte, A.E. Self-reported alcohol intake is a better estimate of 5-year change in blood pressure than biochemical markers in low resource settings. Journal of Hypertension. 2014, 32, 749–755. [Google Scholar] [CrossRef] [PubMed]
  33. Kerr, W.C.; Ye, Y. Relationship of life-course drinking patterns to diabetes, heart problems, and hypertension among those 40 and older in the 2005 U.S. National Alcohol Survey. Journal of Studies on Alcohol and Drugs. 2010, 71, 515–525. [Google Scholar] [CrossRef] [PubMed]
  34. Capurso, N.A.; Petrakis, I. Dyslipidemia associated with heavy alcohol use. The American Journal on Addictions. 2016, 25, 188–190. [Google Scholar] [CrossRef]
  35. Mukamal, K.J.; Rimm, E.B.; Stampfer, M.J. Reply to: Mendel’s laws, Mendelian randomization and causal inference in observational data: Substantive and nomenclatural issues. European Journal of Epidemiology. 2020, 35, 725–726. [Google Scholar] [CrossRef] [PubMed]
  36. Mukamal, K.J.; Stampfer, M.J.; Rimm, E.B. Genetic instrumental variable analysis: Time to call mendelian randomization what it is. the example of alcohol and cardiovascular disease. European Journal of Epidemiology. 2019, 35, 93–97. [Google Scholar] [CrossRef]
  37. Davey Smith, G.; Holmes, M.V.; Davies, N.M.; Ebrahim, S. Mendel’s laws, Mendelian randomization and causal inference in observational data: Substantive and nomenclatural issues. European Journal of Epidemiology. 2020, 35, 99–111. [Google Scholar] [CrossRef]
  38. Gmel, G. Beneficial effects of moderate alcohol use—a case for Occam’s Razor? Addiction. 2016, 112, 215–217. [Google Scholar] [CrossRef]
  39. Piano, M.R. Alcohol’s effects on the cardiovascular system. Alcohol research : current reviews.
  40. Voight, B.F.; Kathiresan, S. Plasma HDL cholesterol and risk of myocardial infarction – authors’ reply. The Lancet. 2012, 380, 1991. [Google Scholar] [CrossRef]
  41. Ben-Aicha, S.; Escate, R.; Casaní, L.; Padró, T.; Peña, E.; Arderiu, G.; Mendieta, G.; Badimón, L.; Vilahur, G. High-density lipoprotein remodelled in hypercholesterolaemic blood induce epigenetically driven down-regulation of endothelial HIF-1A expression in a preclinical animal model. Cardiovascular Research. 2019, 116, 1288–1299. [Google Scholar] [CrossRef]
  42. Bell, S.; Daskalopoulou, M.; Rapsomaniki, E.; George, J.; Britton, A.; Bobak, M.; Casas, J.P.; Dale, C.E.; Denaxas, S.; Shah, A.D.; Hemingway, H. Association between clinically recorded alcohol consumption and initial presentation of 12 cardiovascular diseases: Population based cohort study using linked Health Records. BMJ. 2017. [Google Scholar] [CrossRef]
  43. Nishimura, M.; Bhatia, H.; Ma, J.; Dickson, S.D.; Alshawabkeh, L.; Adler, E.; Maisel, A.; Criqui, M.H.; Greenberg, B.; Thomas, I.C. The impact of substance abuse on heart failure hospitalizations. The American Journal of Medicine. 2020, 133. [Google Scholar] [CrossRef]
  44. Mukamal, K.J.; Conigrave, K.M.; Mittleman, M.A.; Camargo, C.A.; Stampfer, M.J.; Willett, W.C.; Rimm, E.B. Roles of drinking pattern and type of alcohol consumed in coronary heart disease in men. New England Journal of Medicine. 2003, 348, 109–118. [Google Scholar] [CrossRef]
  45. Smyth, A.; Teo, K.K.; Rangarajan, S.; O’Donnell, M.; Zhang, X.; Rana, P.; Leong, D.P.; Dagenais, G.; Seron, P.; Rosengren, A.; Schutte, A.E.; Lopez-Jaramillo, P.; Oguz, A.; Chifamba, J.; Diaz, R.; et al. Alcohol consumption and cardiovascular disease, cancer, injury, admission to hospital, and mortality: A prospective cohort study. The Lancet. 2015, 386, 1945–1954. [Google Scholar] [CrossRef]
  46. Wood, A.M.; Kaptoge, S.; Butterworth, A.S.; Willeit, P.; Warnakula, S.; Bolton, T.; Paige, E.; Paul, D.S.; Sweeting, M.; Burgess, S.; Bell, S.; Astle, W.; Stevens, D.; Koulman, A.; Selmer, R.M.; et al. Risk thresholds for alcohol consumption: Combined analysis of individual-participant data for 599 912 current drinkers in 83 prospective studies. The Lancet. 2018, 391, 1513–1523. [Google Scholar] [CrossRef] [PubMed]
  47. Russell, M.; Fan, A.Z.; Freudenheim, J.L.; Dorn, J.; Trevisan, M. Lifetime drinking trajectories and nonfatal acute myocardial infarction. Alcoholism: Clinical and Experimental Research. 2019, 43, 2384–2394. [Google Scholar] [CrossRef]
  48. Naimi, T.S.; Stadtmueller, L.A.; Chikritzhs, T.; Stockwell, T.; Zhao, J.; Britton, A.; Saitz, R.; Sherk, A. Alcohol, age, and mortality: Estimating selection bias due to premature death. Journal of Studies on Alcohol and Drugs. 2019, 80, 63–68. [Google Scholar] [CrossRef] [PubMed]
  49. Russell, M.; Chu, B.C.; Banerjee, A.; Fan, A.Z.; Trevisan, M.; Dorn, J.M.; Gruenewald, P. Drinking patterns and myocardial infarction: A linear dose-response model. Alcoholism: Clinical and Experimental Research. 2009, 33, 324–331. [Google Scholar] [CrossRef] [PubMed]
  50. Gallagher, C.; Hendriks, J.M.L.; Elliott, A.D.; Wong, C.X.; Rangnekar, G.; Middeldorp, M.E.; Mahajan, R.; Lau, D.H.; Sanders, P. Alcohol and incident atrial fibrillation – a systematic review and meta-analysis. International Journal of Cardiology 2017, 246, 46–52. [Google Scholar] [CrossRef] [PubMed]
  51. Kodama, S.; Saito, K.; Tanaka, S.; Horikawa, C.; Saito, A.; Heianza, Y.; Anasako, Y.; Nishigaki, Y.; Yachi, Y.; Iida, K.T.; Ohashi, Y.; Yamada, N.; Sone, H. Alcohol consumption and risk of atrial fibrillation. Journal of the American College of Cardiology. 2011, 57, 427–436. [Google Scholar] [CrossRef] [PubMed]
  52. Larsson, S.C.; Drca, N.; Wolk, A. Alcohol consumption and risk of atrial fibrillation. Journal of the American College of Cardiology. 2014, 64, 281–289. [Google Scholar] [CrossRef] [PubMed]
  53. Samokhvalov, A.V.; Irving, H.M.; Rehm, J. Alcohol consumption as a risk factor for atrial fibrillation: A systematic review and meta-analysis. European Journal of Cardiovascular Prevention & Rehabilitation. 2010, 17, 706–712. [Google Scholar] [CrossRef] [PubMed]
  54. Tu, S.J.; Gallagher, C.; Elliott, A.D.; Linz, D.; Pitman, B.M.; Hendriks, J.M.L.; Lau, D.H.; Sanders, P.; Wong, C.X. Risk thresholds for total and beverage-specific alcohol consumption and incident atrial fibrillation. JACC: Clinical Electrophysiology. 2021, 7, 1561–1569. [Google Scholar] [CrossRef] [PubMed]
  55. Fernández-Solà, J. The effects of ethanol on the heart: Alcoholic cardiomyopathy. Nutrients. 2020, 12, 572. [Google Scholar] [CrossRef]
  56. Weintraub, R.G.; Semsarian, C.; Macdonald, P. Dilated cardiomyopathy. The Lancet. 2017, 390, 400–414. [Google Scholar] [CrossRef]
  57. Lazo, M.; Chen, Y.; McEvoy, J.W.; Ndumele, C.; Konety, S.; Ballantyne, C.M.; Sharrett, A.R.; Selvin, E. Alcohol consumption and cardiac biomarkers: The atherosclerosis risk in communities (ARIC) study. Clinical Chemistry. 2016, 62, 1202–1210. [Google Scholar] [CrossRef]
  58. Urbano-Marquez, A.; Estruch, R.; Navarro-Lopez, F.; Grau, J.M.; Mont, L.; Rubin, E. The effects of alcoholism on skeletal and cardiac muscle. New England Journal of Medicine. 1989, 320, 409–415. [Google Scholar] [CrossRef]
  59. O’Keefe, E.L.; DiNicolantonio, J.J.; O’Keefe, J.H.; Lavie, C.J. Alcohol and CV health: Jekyll and Hyde J-Curves. Progress in Cardiovascular Diseases. 2018, 61, 68–75. [Google Scholar] [CrossRef]
  60. Costanzo, S.; Di Castelnuovo, A.; Donati, M.B.; Iacoviello, L.; de Gaetano, G. Alcohol consumption and mortality in patients with cardiovascular disease. Journal of the American College of Cardiology. 2010, 55, 1339–1347. [Google Scholar] [CrossRef]
Figure 1. Distribution of the patients according to analyzed groups and gender.
Preprints 87380 g001
Figure 2. Distribution of the patients according to analyzed groups and exercise tolerance at the beginning of the study.
Preprints 87380 g002
Figure 3. Distribution of the patients according to analyzed groups and evolution of exercise tolerance.
Preprints 87380 g003
Figure 4. Comparison of HDL-cholesterol from the beginning to end of the study in patients from Group A.
Preprints 87380 g004
Figure 5. Comparison of HDL-cholesterol from the beginning to end of the study in patients from Group B.
Preprints 87380 g005
Figure 6. Comparison of LDL-cholesterol from the beginning to end of the study in patients from Group A.
Preprints 87380 g006
Figure 7. Comparison of LDL-cholesterol from the beginning to end of the study in patients from Group B.
Preprints 87380 g007
Figure 8. Comparison of triglyceridesevolution (%) between analyzed groups.
Preprints 87380 g008
Figure 9. Distribution of the patients according to analyzed groups and evolution of angina.
Preprints 87380 g009
Figure 10. Distribution of the patients according to analyzed groups and AMI recurrence.
Preprints 87380 g010
Figure 11. Distribution of the patients according to analyzed groups and evolution of arrythmias.
Preprints 87380 g011
Figure 12. Comparison of EF from the beginning to end of the study in patients from Group A.
Preprints 87380 g012
Figure 13. Comparison of EF from the beginning to end of the study in patients from Group B.
Preprints 87380 g013
Figure 14. Distribution of the patients according to analyzed groups and quality of life.
Preprints 87380 g014
Table 1. Comparison of age between analyzed groups.
Group Average ± SD Median (IQR) Average Rank p*
Group A (p=0.038**) 64.82 ± 8.46 65 (59-72) 96.76 0.043
Group B (p=0.004**) 67.17 ± 9.14 67.5 (60.25-74.75) 113.75
Table 2. Distribution of the patients according to analyzed groups and AMI affected territory.
Territory/Group Group A Group B p*
Nr. Percent Nr. Percent
Anterior 21 20.6% 27 25% 0.897
Anteroseptal 27 26.5% 24 22.2%
High lateral 6 5.9% 6 5.6%
Inferior 21 20.6% 24 22.2%
Lateral 18 17.6% 15 13.9%
Posteroinferior 9 8.8% 12 11.1%
Table 3. Distribution of the patients according to analyzed groups and existence of systolic disfunction during hospitalization.
Systolic disfunction /Group Group A Group B p*
Nr. Percent Nr. Percent
Absent 54 52.9% 57 52.8% 1.000
Present 48 47.1% 51 47.2%
Table 4. Distribution of the patients according to analyzed groups and existence of arrythmias during hospitalization.
Arrythmias /Group Group A Group B p*
Nr. Percent Nr. Percent
Absent 72 70.6% 72 66.7% 0.556
Present 30 29.4% 36 33.3%
Table 5. Distribution of the patients according to analyzed groups and exercise tolerance at the end of the study.
Tolerance/Group Group A Group B p*
Nr. Percent Nr. Percent
6-8 under 40 m/s 3 2.9% 18 16.7% 0.007
9-10 40-60 m/s 33 32.4% 33 30.6%
11-12 70-100 m/s 42 41.2% 39 36.1%
13-14 100-110 m/s 24 23.5% 18 16.7%
Table 6. Distribution of the patients in Group A according to the exercise tolerance at the beginning and end of the study.
Tolerance / Time Beginning of the study p*
6-8 9-10 11-12 13-14
Nr. Percent Nr. Percent Nr. Percent Nr. Percent
End 6-8 3 7.1% 0 0% 0 0% 0 0% <0.001
9-10 15 35.7% 6 18.2% 9 42.9% 3 50%
11-12 18 42.9% 15 45.5% 9 42.9% 0 0%
13-14 6 14.3% 12 36.4% 3 14.3% 3 50%
Table 7. Post-hoc comparison between exercise tolerance at the beginning and end of the study.
Tolerance 6-8 under 40 m/s 9-10 40-60 m/s 11-12 70-100 m/s 13-14 100-110 m/s
Beginning 42 (41.2%) 33 (32.4%) 21 (20.6%) 6 (5.9%)
End 3 (2.9%) 33 (32.4%) 42 (41.2%) 24 (23.5%)
p* <0.001 1.000 0.012 0.001
Table 8. Distribution of the patients in Group B according to the exercise tolerance at the beginning and end of the study.
Tolerance / Time Beginning of the study p*
6-8 9-10 11-12 13-14
Nr. Percent Nr. Percent Nr. Percent Nr. Percent
End 6-8 18 40% 0 0% 0 0% 0 0% <0.001
9-10 18 40% 15 38.5% 0 0% 0 0%
11-12 9 20% 15 38.5% 15 71.4% 0 0%
13-14 0 0% 9 23.1% 6 28.6% 3 100%
Table 9. Post-hoc comparison between exercise tolerance at the beginning and end of the study.
Tolerance 6-8 under 40 m/s 9-10 40-60 m/s 11-12 70-100 m/s 13-14 100-110 m/s
Beginning 45 (41.7%) 39 (36.1%) 21 (19.4%) 3 (2.8%)
End 18 (16.7%) 33 (30.6%) 39 (36.1%) 18 (16.7%)
p* <0.001 1.000 0.008 <0.001
Table 10. Comparison of HDL-cholesterol evolution between analyzed groups.
Group/Dif-HDL Average ± SD Median (IQR) Average Rank p*
Group A (p<0.001**) 16.91 ± 8.34 14.5 (11-21) 122.04 <0.001
Group B (p<0.001**) 11.78 ± 8.14 12 (4.25-17) 89.88
Group/Dif-HDL (%) Average ± SD Median (IQR) Average Rank p*
Group A (p<0.001**) 56.72 ± 30.55 47.52 (35.3-73.3) 121.65 <0.001
Group B (p<0.001**) 39.26 ± 29.56 38.18 (11.26-62.15) 90.25
Table 11. Comparison of LDL-cholesterol evolution between analyzed groups.
Group/Dif-LDL Average ± SD Median (IQR) Average Rank p*
Group A (p=0.001**) -52.62 ± 23.26 -46.5 (-69 - -35) 95.75 0.024
Group B (p<0.001**) -45.42 ± 17.7 -41 (-59.5 - -33) 114.71
Group/Dif-LDL (%) Average ± SD Median (IQR) Average Rank p*
Group A (p=0.001**) -24.56 ± 10.5 -22.3 (-31.3 - -16.6) 93.99 0.008
Group B (p=0.001**) -20.67 ± 6.94 -19.2 (-25.9 - -15.6) 116.38
Table 12. Comparison of triglycerides from the beginning to end of the study in patients from Group A.
Parameter Average ± SD Median (IQR) p*
Triglycerides - Beginning (p<0.001**) 285.03 ± 15.26 285.5 (282-294) <0.001
Triglycerides - End (p<0.001**) 182.85 ± 8.98 184.5 (180-188)
Difference – Triglycerides -102.18 ± 16.79 -103 (-110 - -97) -
Difference – Triglycerides (%) -35.65 ± 4.79 -35.78 (-37.58 - -34.6) -
Table 13. Comparison of triglycerides from the beginning to end of the study in patients from Group B.
Parameter Average ± SD Median (IQR) p*
Triglycerides - Beginning (p<0.001**) 308.31 ± 14.84 305 (301.25-310) <0.001
Triglycerides - End (p=0.006**) 214.69 ± 10.52 213.5 (210-221)
Difference – Triglycerides -93.61 ± 18.07 -91.5 (-99.5 - -84.25) -
Difference – Triglycerides (%) -30.22 ± 4.49 -30 (-31.82 - -27.78) -
Table 14. Comparison of EF evolution between analyzed groups.
Group/Dif-EF Average ± SD Median (IQR) Average Rank p*
Group A (p<0.001**) 11.94 ± 5.72 11 (9-13) 140.44 <0.001
Group B (p<0.001**) 5.47 ± 4.23 5 (2-8) 72.50
Group/Dif-EF (%) Average ± SD Median (IQR) Average Rank p*
Group A (p<0.001**) 33.27 ± 19.26 30.57 (22.5-37.14) 138.41 <0.001
Group B (p<0.001**) 14.7 ± 12.18 12.5 (5.16-21.34) 74.42
Table 15. Distribution of the patients according to analyzed groups and quality of life.
Quality of life /Group Group A Group B p*
Nr. Percent Nr. Percent
No report 51 50% 69 63.9% 0.039
Improvement 48 47.1% 33 30.6%
Deceased 3 2.9% 6 5.6%
Disclaimer/Publisher’s Note: The statements, opinions and data contained in all publications are solely those of the individual author(s) and contributor(s) and not of MDPI and/or the editor(s). MDPI and/or the editor(s) disclaim responsibility for any injury to people or property resulting from any ideas, methods, instructions or products referred to in the content.
Copyright: This open access article is published under a Creative Commons CC BY 4.0 license, which permit the free download, distribution, and reuse, provided that the author and preprint are cited in any reuse.
Prerpints.org logo

Preprints.org is a free preprint server supported by MDPI in Basel, Switzerland.

Subscribe

© 2024 MDPI (Basel, Switzerland) unless otherwise stated