1. Introduction
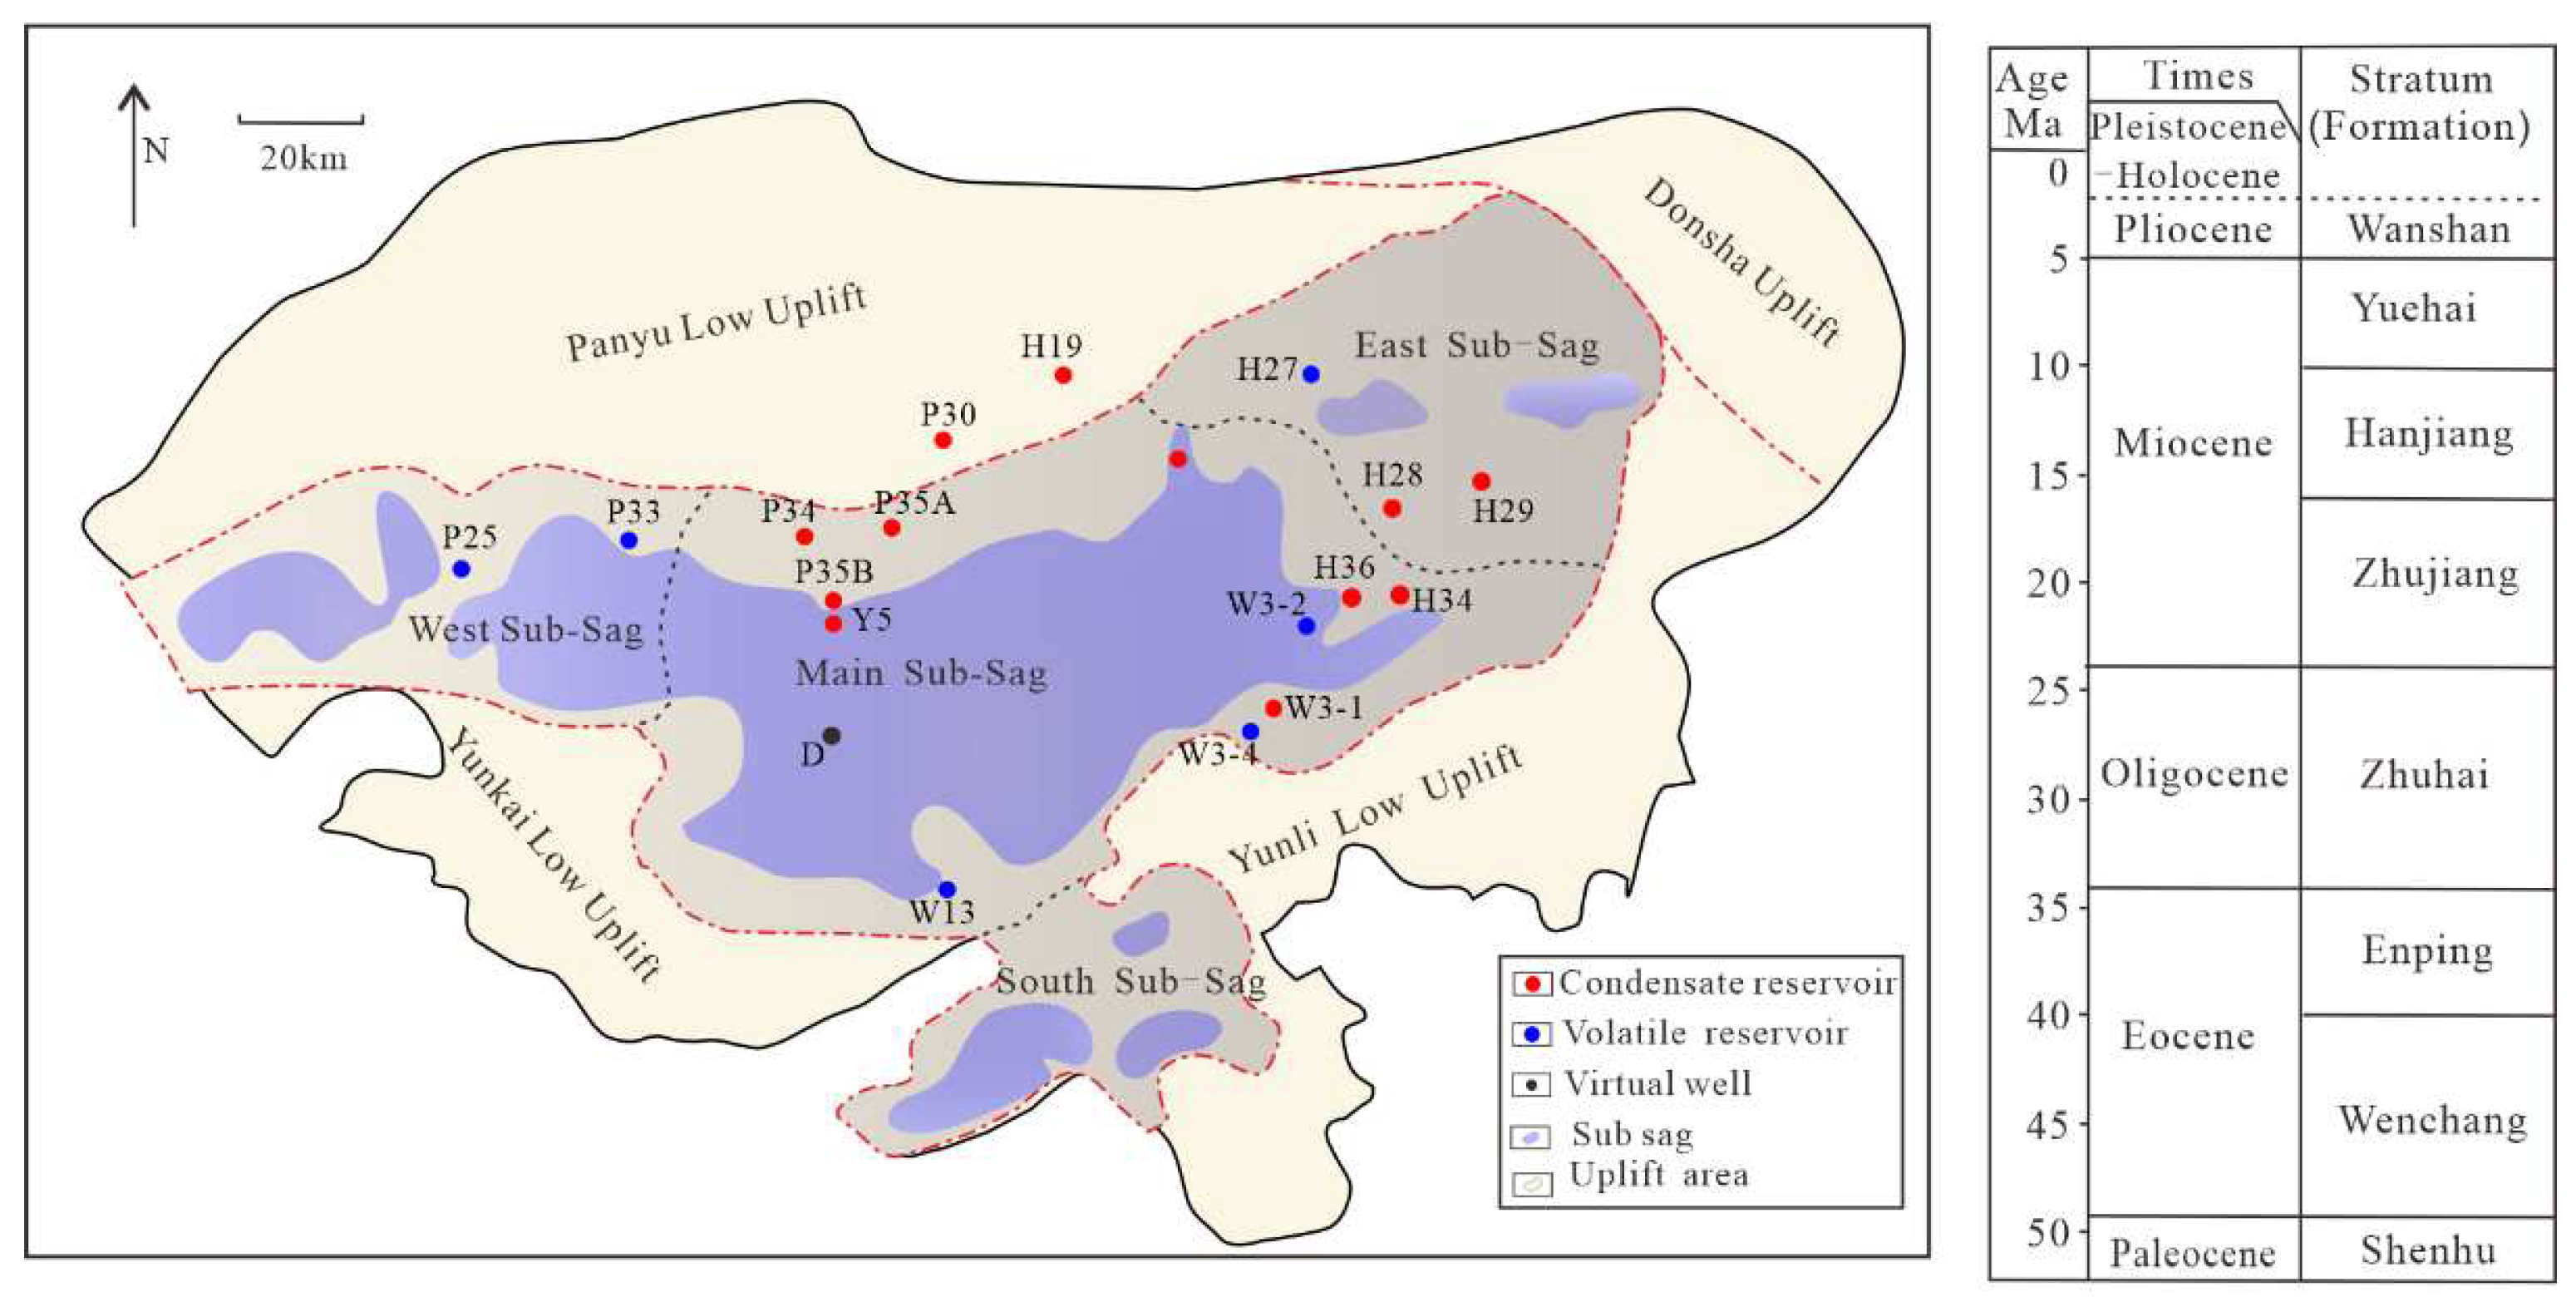
The Baiyun Sag is located in the deep–water area of the northern continental slope of the South China Sea, and it is a secondary structural unit inside the Zhu II Depression of the Pearl River Mouth Basin (
Figure 1). The water depth of the Baiyun Sag varies greatly, and the Baiyun Sag can be divided into four sub–sags: the Baiyun main sub–sag, the west sub–sag, the east sub–sag and the south sub–sag [
1]. The Baiyun Sag has the most complete Mesozoic and Cenozoic strata in the Pearl River Mouth Basin. The deep–water area of Baiyun Sag has been proven to be a gas–rich sag [
2], which has the characteristics of concurrent oil and gas generation and is dominated by kerogen degradation gas. Among them, commercial gas reservoirs in Baiyun Sag are mainly found in the northern part of Baiyun main sag to Panyu low uplift and the W3-4 to H29 nose–shaped structural belt in the eastern part of Baiyun main sag, all of which are located in the uplift areas. The gas–rich strata are concentrated in the lower Zhujiang Formation, and only at the H19 area are there shallow natural gas accumulations in the Hanjiang Formation–Yuehai Formation. From the northern part of Baiyun main sag to the Panyu low uplift, condensate gas reservoirs with high gas–oil ratios are predominant, while the gas–oil ratios of W3-4, H28, and H29 condensate gas reservoirs in the eastern part of Baiyun main sag is relatively lower. It can be seen that the maturity of natural gas in the condensate gas reservoirs in the two zones is different.
There is a lack of research on the gas generation characteristics of the main gas source rocks in this area and the contribution of gas sources to accumulation. Multiple sets of source rocks in Wenchang–Enping Formation have reached the high–over mature stage under the “hot basin” system with high heat flow and high geothermal gradient in Baiyun Sag [
3], and have a complete oil and gas generation sequence of light oil, kerogen degradation gas, and crude oil cracking gas. Scholars have great disputes about the contribution to accumulation of different gas source rocks in the study area [
4,
5]. In general, scholars have different opinions mainly because relatively few exploratory wells have encountered Paleogene mudstone in this area, and there is a lack of actual drilling data on source rocks in this area. Besides, the study area is located in the ocean–continent transition zone, with various types of coal measures and lacustrine source rocks, and there is a lack of systematic research on the gas generation characteristics of different types of source rocks.
The chemical kinetic theory was introduced by scholars such as Maier [
6]and Allred [
7], and it was applied to the dry distillation process of shale oil and coal in the early stage. Since the 1970s, it has been widely used in the study of the hydrocarbon generation process of kerogen in source rocks [
8]. The research on hydrocarbon generation kinetics of OM has experienced three stages: basic understanding, rapid development, and in–depth understanding. The characteristics and contents of the research range from the establishment of the initial model and the optimization of parameters to the wide application in the evaluation of oil and gas resources, and then to the study of the hydrocarbon generation kinetics of single compounds and the influence of the uncertainty of kinetic parameters on the results of geological applications [
9]. At present, there are four kinds of common kinetic models, including the overall reaction model [
7], the Friedman reaction model [
10,
11,
12], the sequential reaction model [
13,
14], and the parallel reaction model [
15,
16]. This study comprehensively considers various factors such as model principle, model accuracy, and application difficulty, and selected the parallel first–order reaction model. Scholars have demonstrated the applicability and practicability of a limited number of parallel first–order reaction models [
17]. The isotope fractionation kinetic model is based on the hydrocarbon generation kinetic model, combined with the geological background, the natural gas accumulation model and gas source can be clarified [
18,
19,
20,
21].
Regarding the above problems, this study took the Y5 well area as an example to carry out the study on the kinetics of natural gas generation and carbon isotope fractionation, and the process of natural gas generation and carbon isotope fractionation was characterized quantitatively. The genetic type and source of natural gas were clarified by combining the thermal simulation results and geochemical characteristics of natural gas in the study area.
2. Materials and Methods
2.1. Sample and experiment
7 samples, including 4 source rock samples (
Table 1) and 3 crude oil samples, from the Pearl River Mouth Basin were selected for hydrocarbon generation experiments. The organic matter (OM) type of two source rock samples from the W well area is type II
1, and the gas produced is a mixture of kerogen degradation gas and crude oil cracking gas. The OM types of source rocks from the P well area and H well area is type II
2 and type II1–II2 respectively, and the gas produced is mainly kerogen degradation gas. The selection of different types of gas source rocks can provide a basis for the establishment of a chart for determining the genesis of natural gas. A normal crude oil sample F14 from the semi–deep lacustrine facies of the Wenchang Formation, a heavy oil sample F7 from the shallow lacustrine facies to semi–deep lacustrine facies of the Zhujiang Formation, and a condensate oil sample Y25 from shallow lacustrine facies of the Zhujiang Formation were selected, respectively.
This study designed and carried out a gold tube thermal simulation experiment with variable pressure to reflect the true evolution characteristics of hydrocarbon generation under geological conditions. A total of 12 pressure points (60MPa-115MPa, with a pressure setting interval of about 5MPa) were set in this experiment, and the temperature was raised from 200°C to 600°C at a heating rate of 2°C/h and 20°C/h, respectively. One autoclave would be taken out at every object temperature point with a temperature interval of about 25°C, and the gold tube in it was taken out while it was cooling. Then the gold tube was placed in a special gas collection system for the GC analysis and the isotope analysis.
2.2. Establishment and calibration of natural gas generation and carbon isotope kinetic models
2.2.1. Hydrocarbon generation kinetic model
The parallel first–order reaction model assumes that the hydrocarbon generation process of OM is composed of N parallel first–order reactions [
17]. The activation energy, pre–exponential factor and the original hydrocarbon generation potential of OM corresponding to each reaction is
Ei,
Ai, and
Xi0, i=1, 2, 3, ...,
N. When a certain reaction time t is reached, the hydrocarbon generation amount of the
i–th reaction is
Xi, then:
In formula (1),
Ki is the reaction rate constant of the
i–th hydrocarbon generation reaction, which can be obtained according to the Arrhenius formula:
Since the pyrolysis experiment of OM under laboratory conditions adopts a constant rate of temperature rise (assuming that the rate of temperature increase is
D, °C·min
–1), it can be obtained:
Combining the above formulas, the hydrocarbon generation amount of the i–th reaction can be obtained.
The total hydrocarbon generation amount of N parallel reactions is:
In the formula (5), X is the total amount of hydrocarbon generation of all N parallel reactions; N is the number of parallel first–order reactions.
2.2.2. Kinetic model of carbon isotope fractionation
Scholars systematically compared the current isotope kinetic models [
22], and it has been confirmed that the isotope kinetic model based on the Cramer III model has an ideal simulation effect for the quantitative description and geological application of isotope fractionation. In this isotope kinetic model,
12CH
4 and
13CH
4 are regarded as two different products, and their kinetic parameters are calculated respectively. In the Gramer III model, the formation of methane is regarded as the result of n first–order reactions. For each reaction, the generating rates of
12CH
4 and
13CH
4 are different:
The carbon isotope ratio model of cumulatively produced methane is:
Among them, ki12c and ki13c are the generation rate coefficient of 12CH4 and 13CH4 of the i-th reaction; ci12c and ci13c is the cumulative 12CH4 and 13CH4 production at the time t of the i-th reaction; fi012c and fi013c is the hydrocarbon generation potential of 12CH4 and 13CH4 of the i-th reaction, which is equal to the product of the corresponding reaction fraction and the total hydrocarbon generation potential.
3. Results
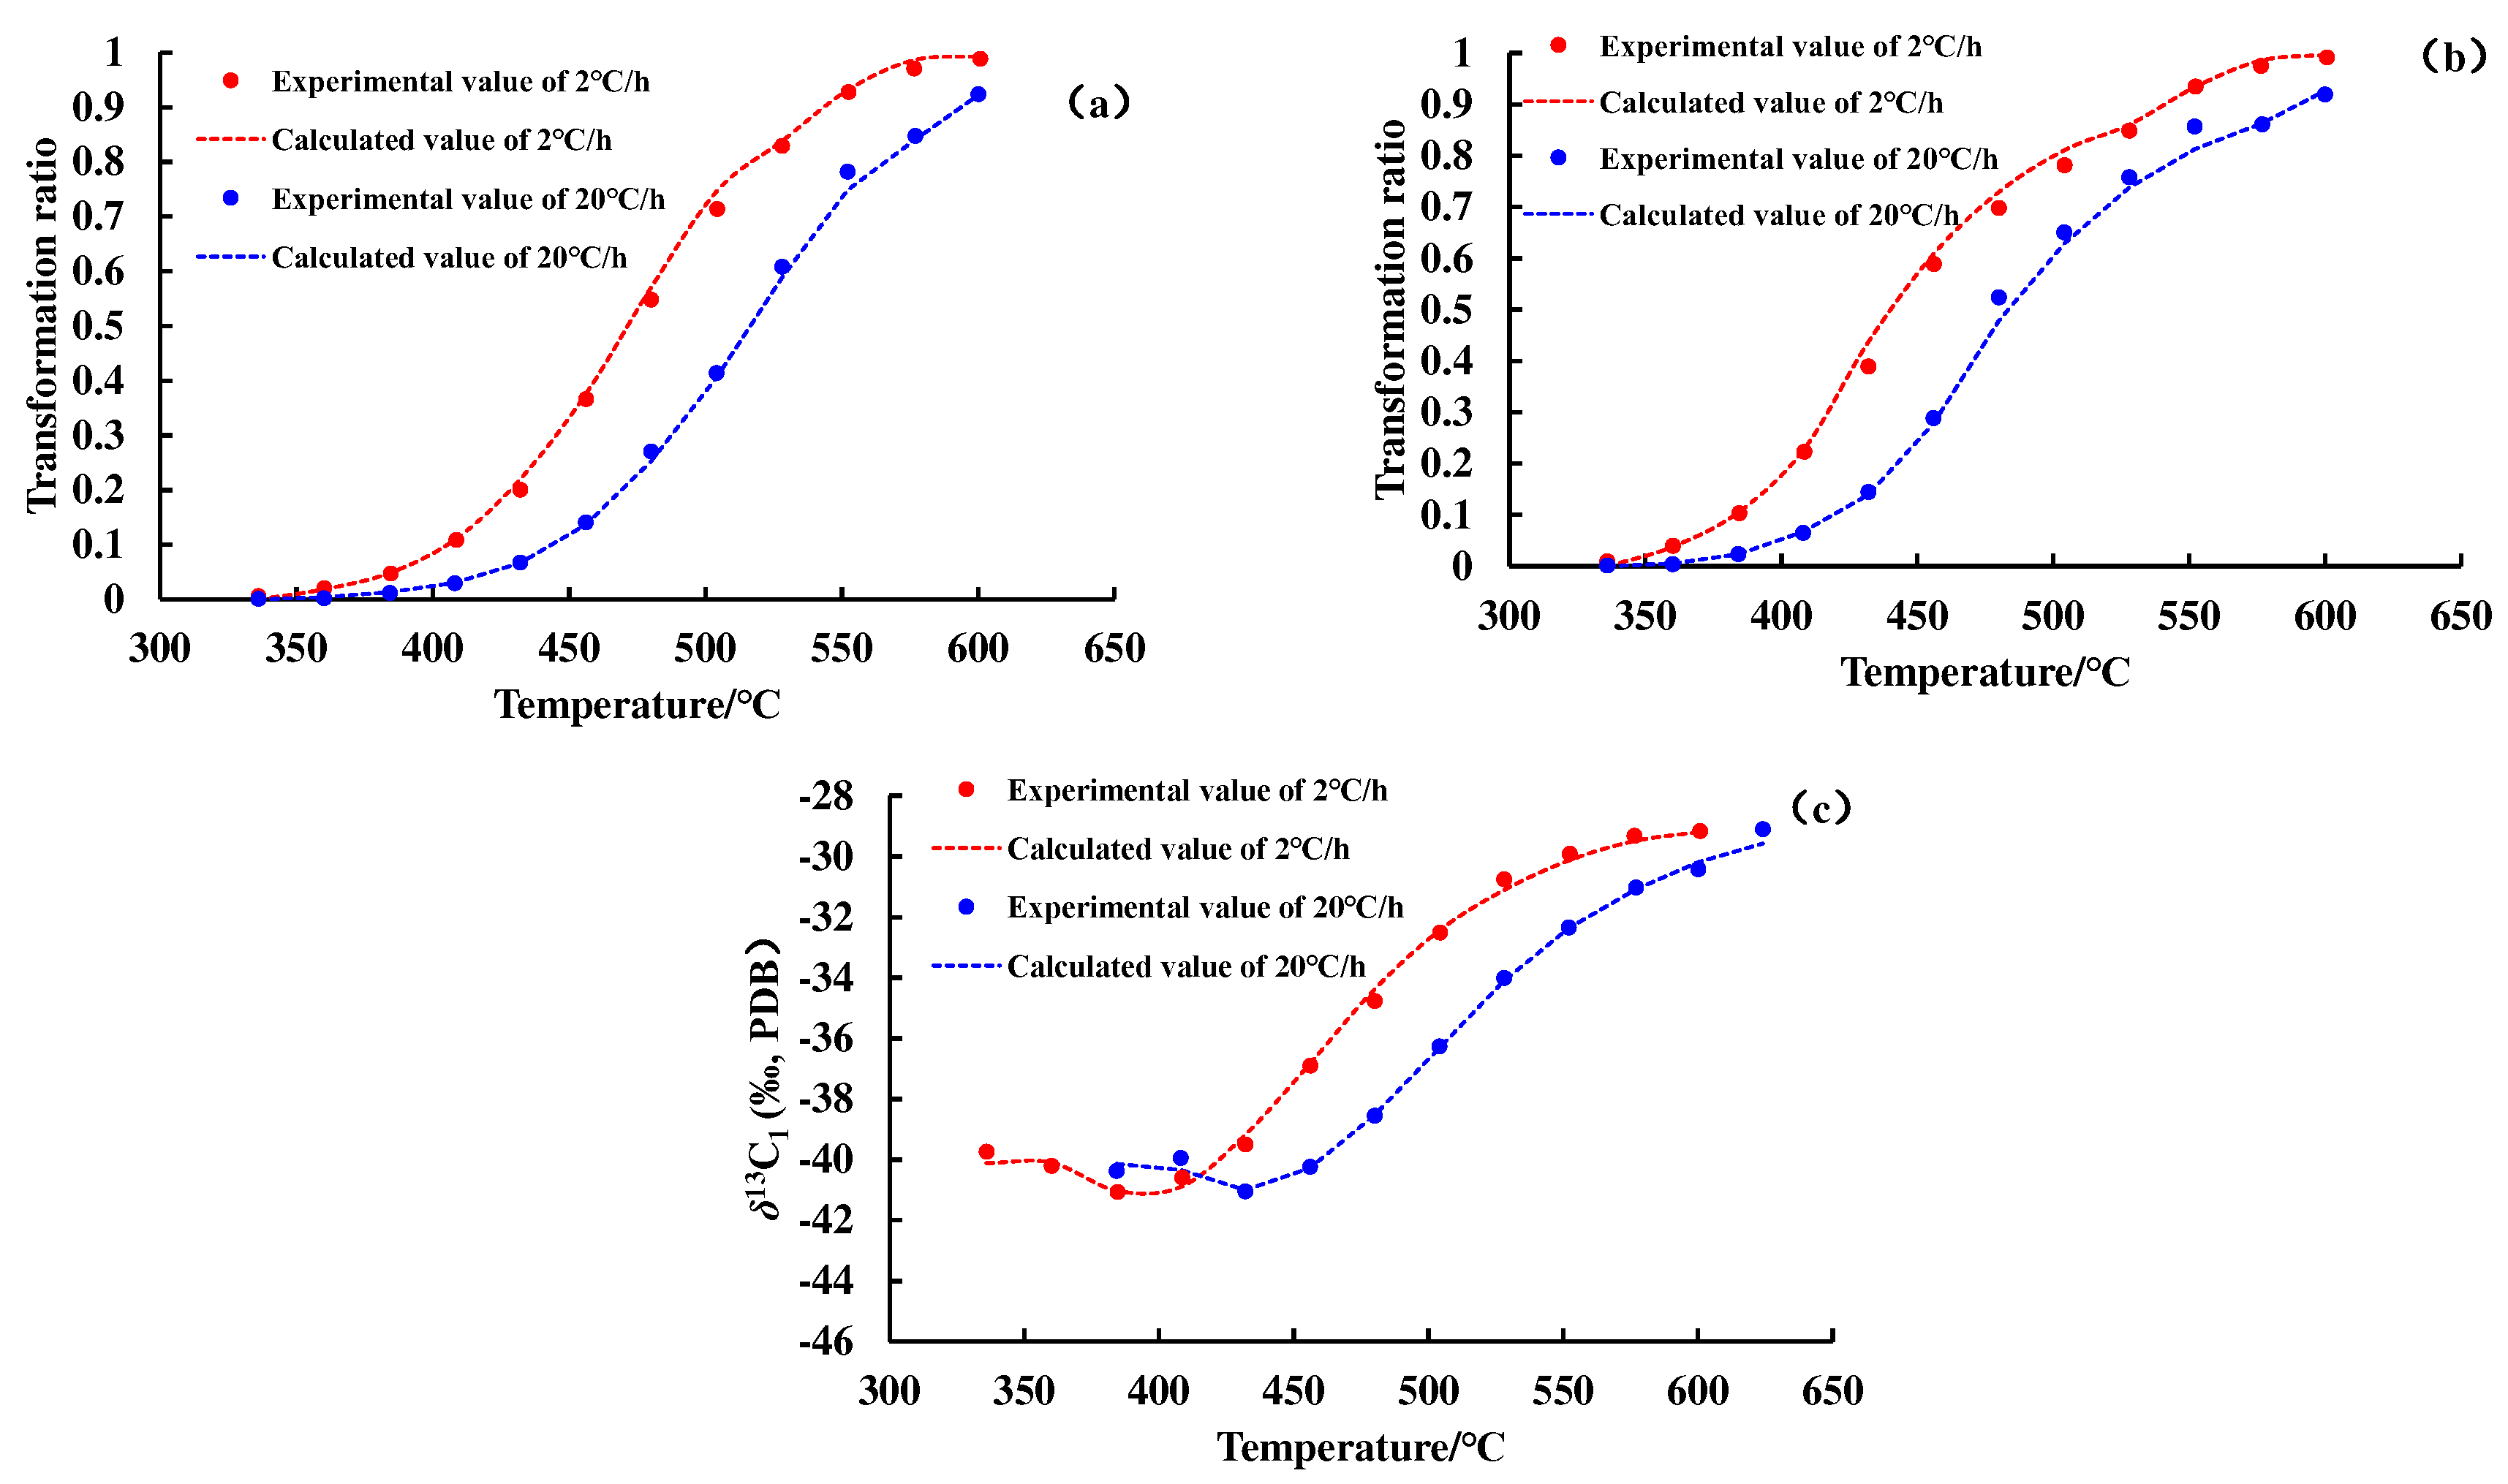
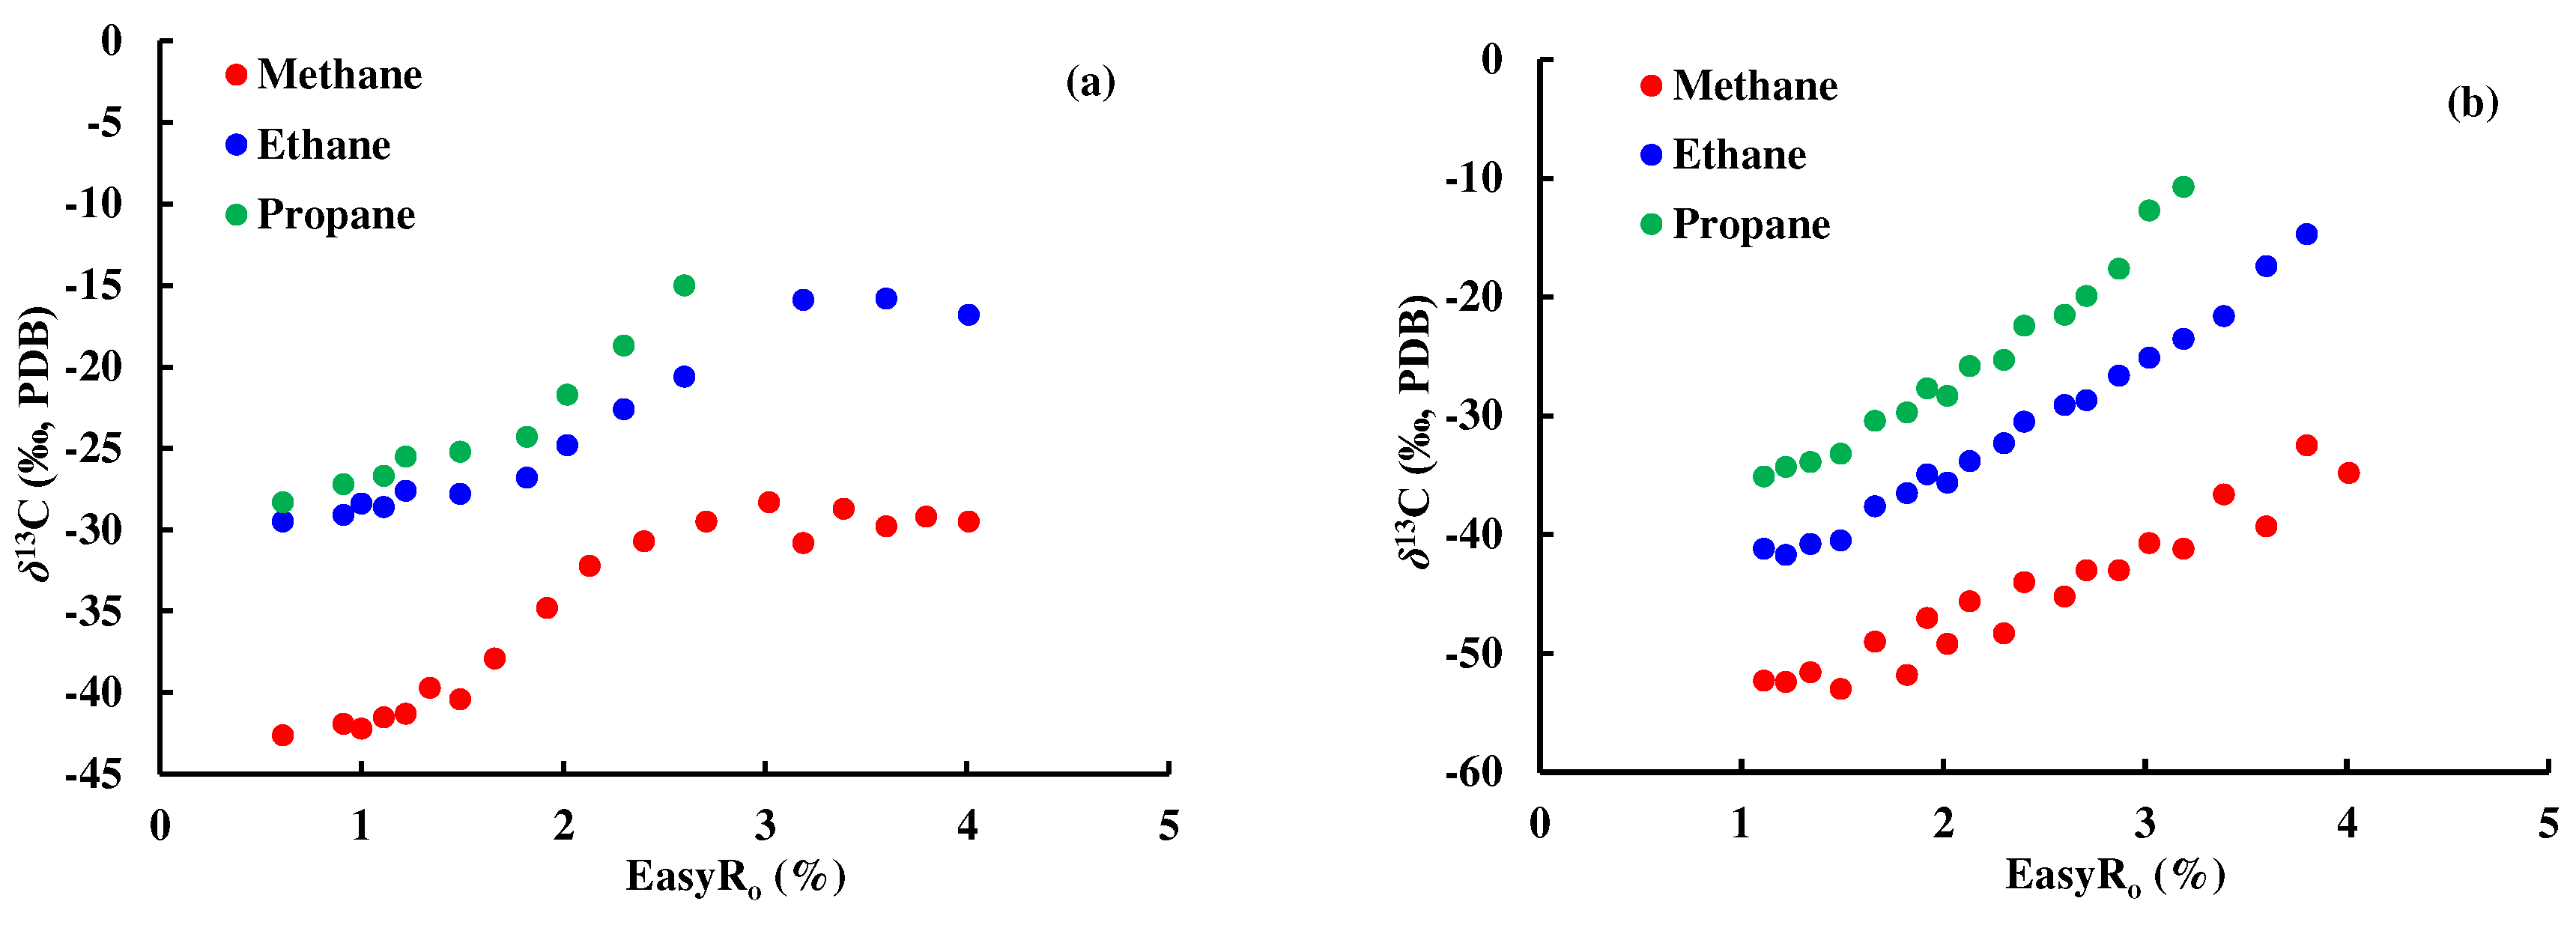
Figure 2 and
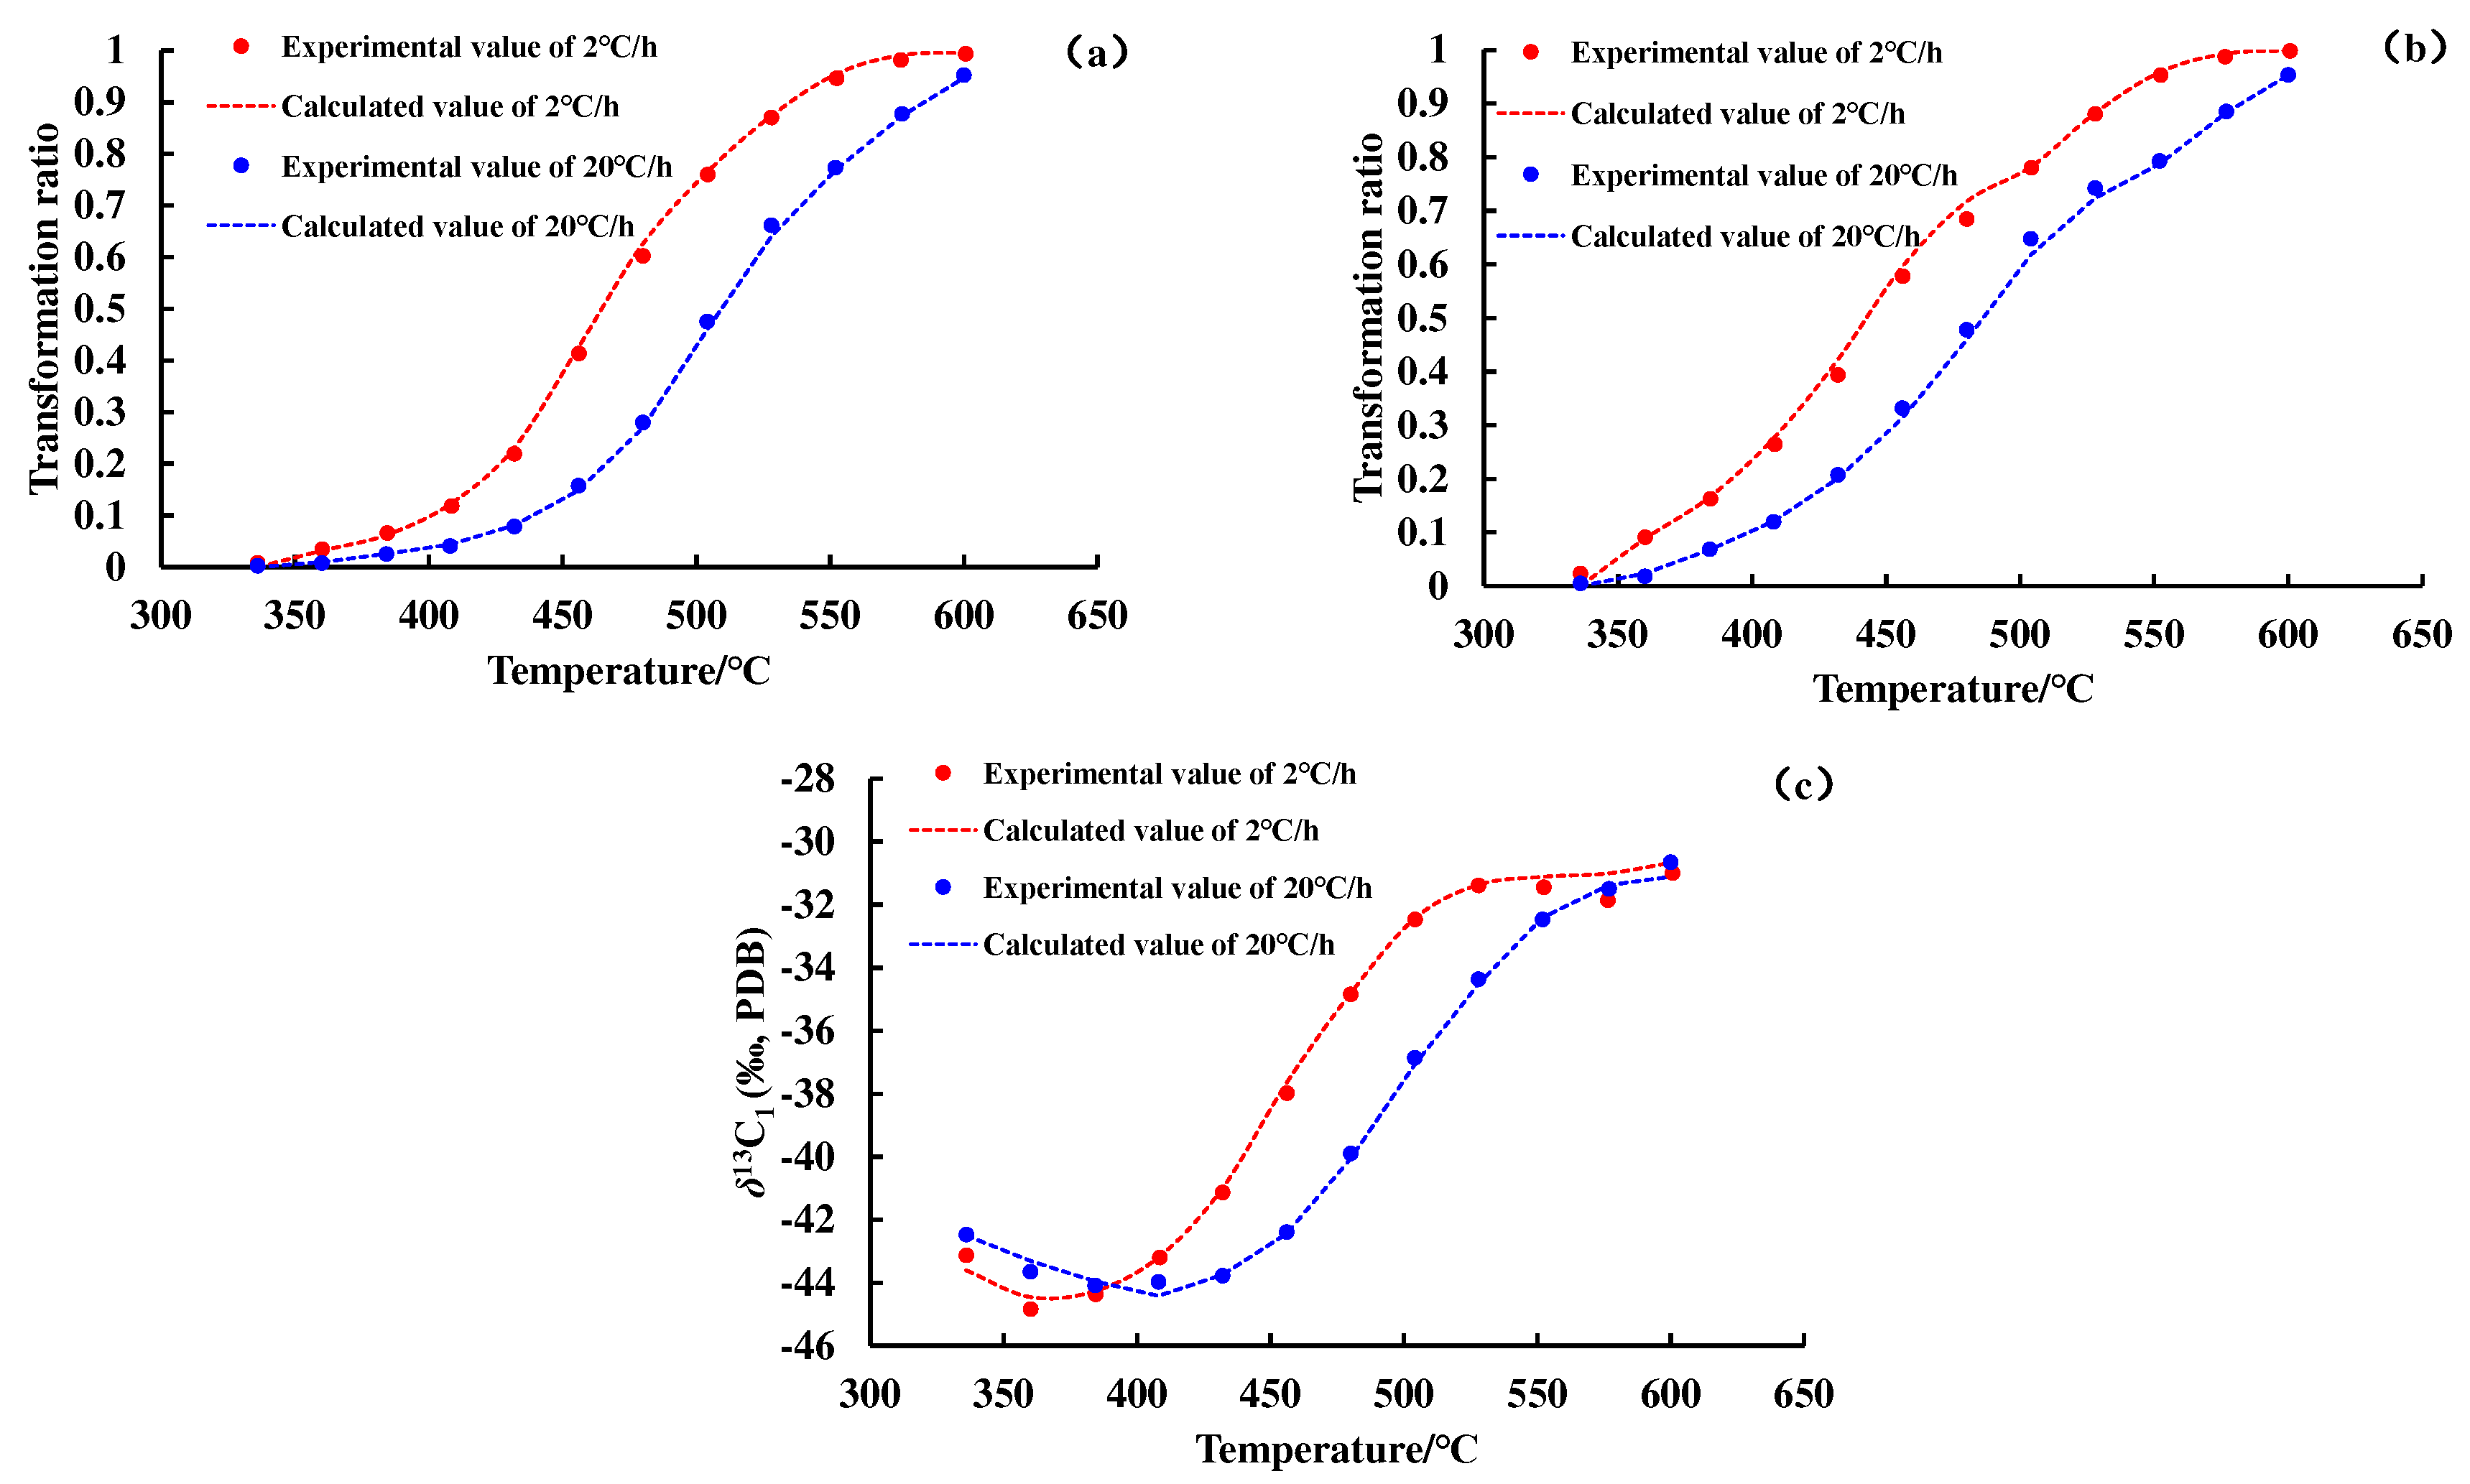
Figure 3 show the conversion rate curves of methane and total gas (C
1–5) and the carbon isotope value evolution curve of methane. As the degree of thermal evolution increases, the conversion rate of OM to methane and total gas (C
1–5) gradually increases. The carbon isotope values of methane show an overall upward trend, but there is a weak downward trend in the early stage of thermal evolution of OM.
The transformation ratio curves and the carbon isotope value evolution curves of methane and C
1–5 calculated by the hydrocarbon generation kinetic model and the Cramer III model are shown in
Figure 2 and
Figure 3. A nice match for the experiment data reflects the feasibility of the hydrocarbon generation kinetic model and isotope fractionation kinetic model, and lays a foundation for subsequent geologic applications. The kinetic parameters of
12CH
4,
13CH
4, and C
1–5 generated from the pyrolysis of different samples are shown in
Figure 4 and
Figure 5.
4. Discussion
4.1. Identification of natural gas genetic types
4.1.1. Research based on the criteria for determining the genesis of natural gas
Prinzhofer et al. proposed to identify the genesis of natural gas based on the ratio of ethane to propane content and their difference of carbon isotope [
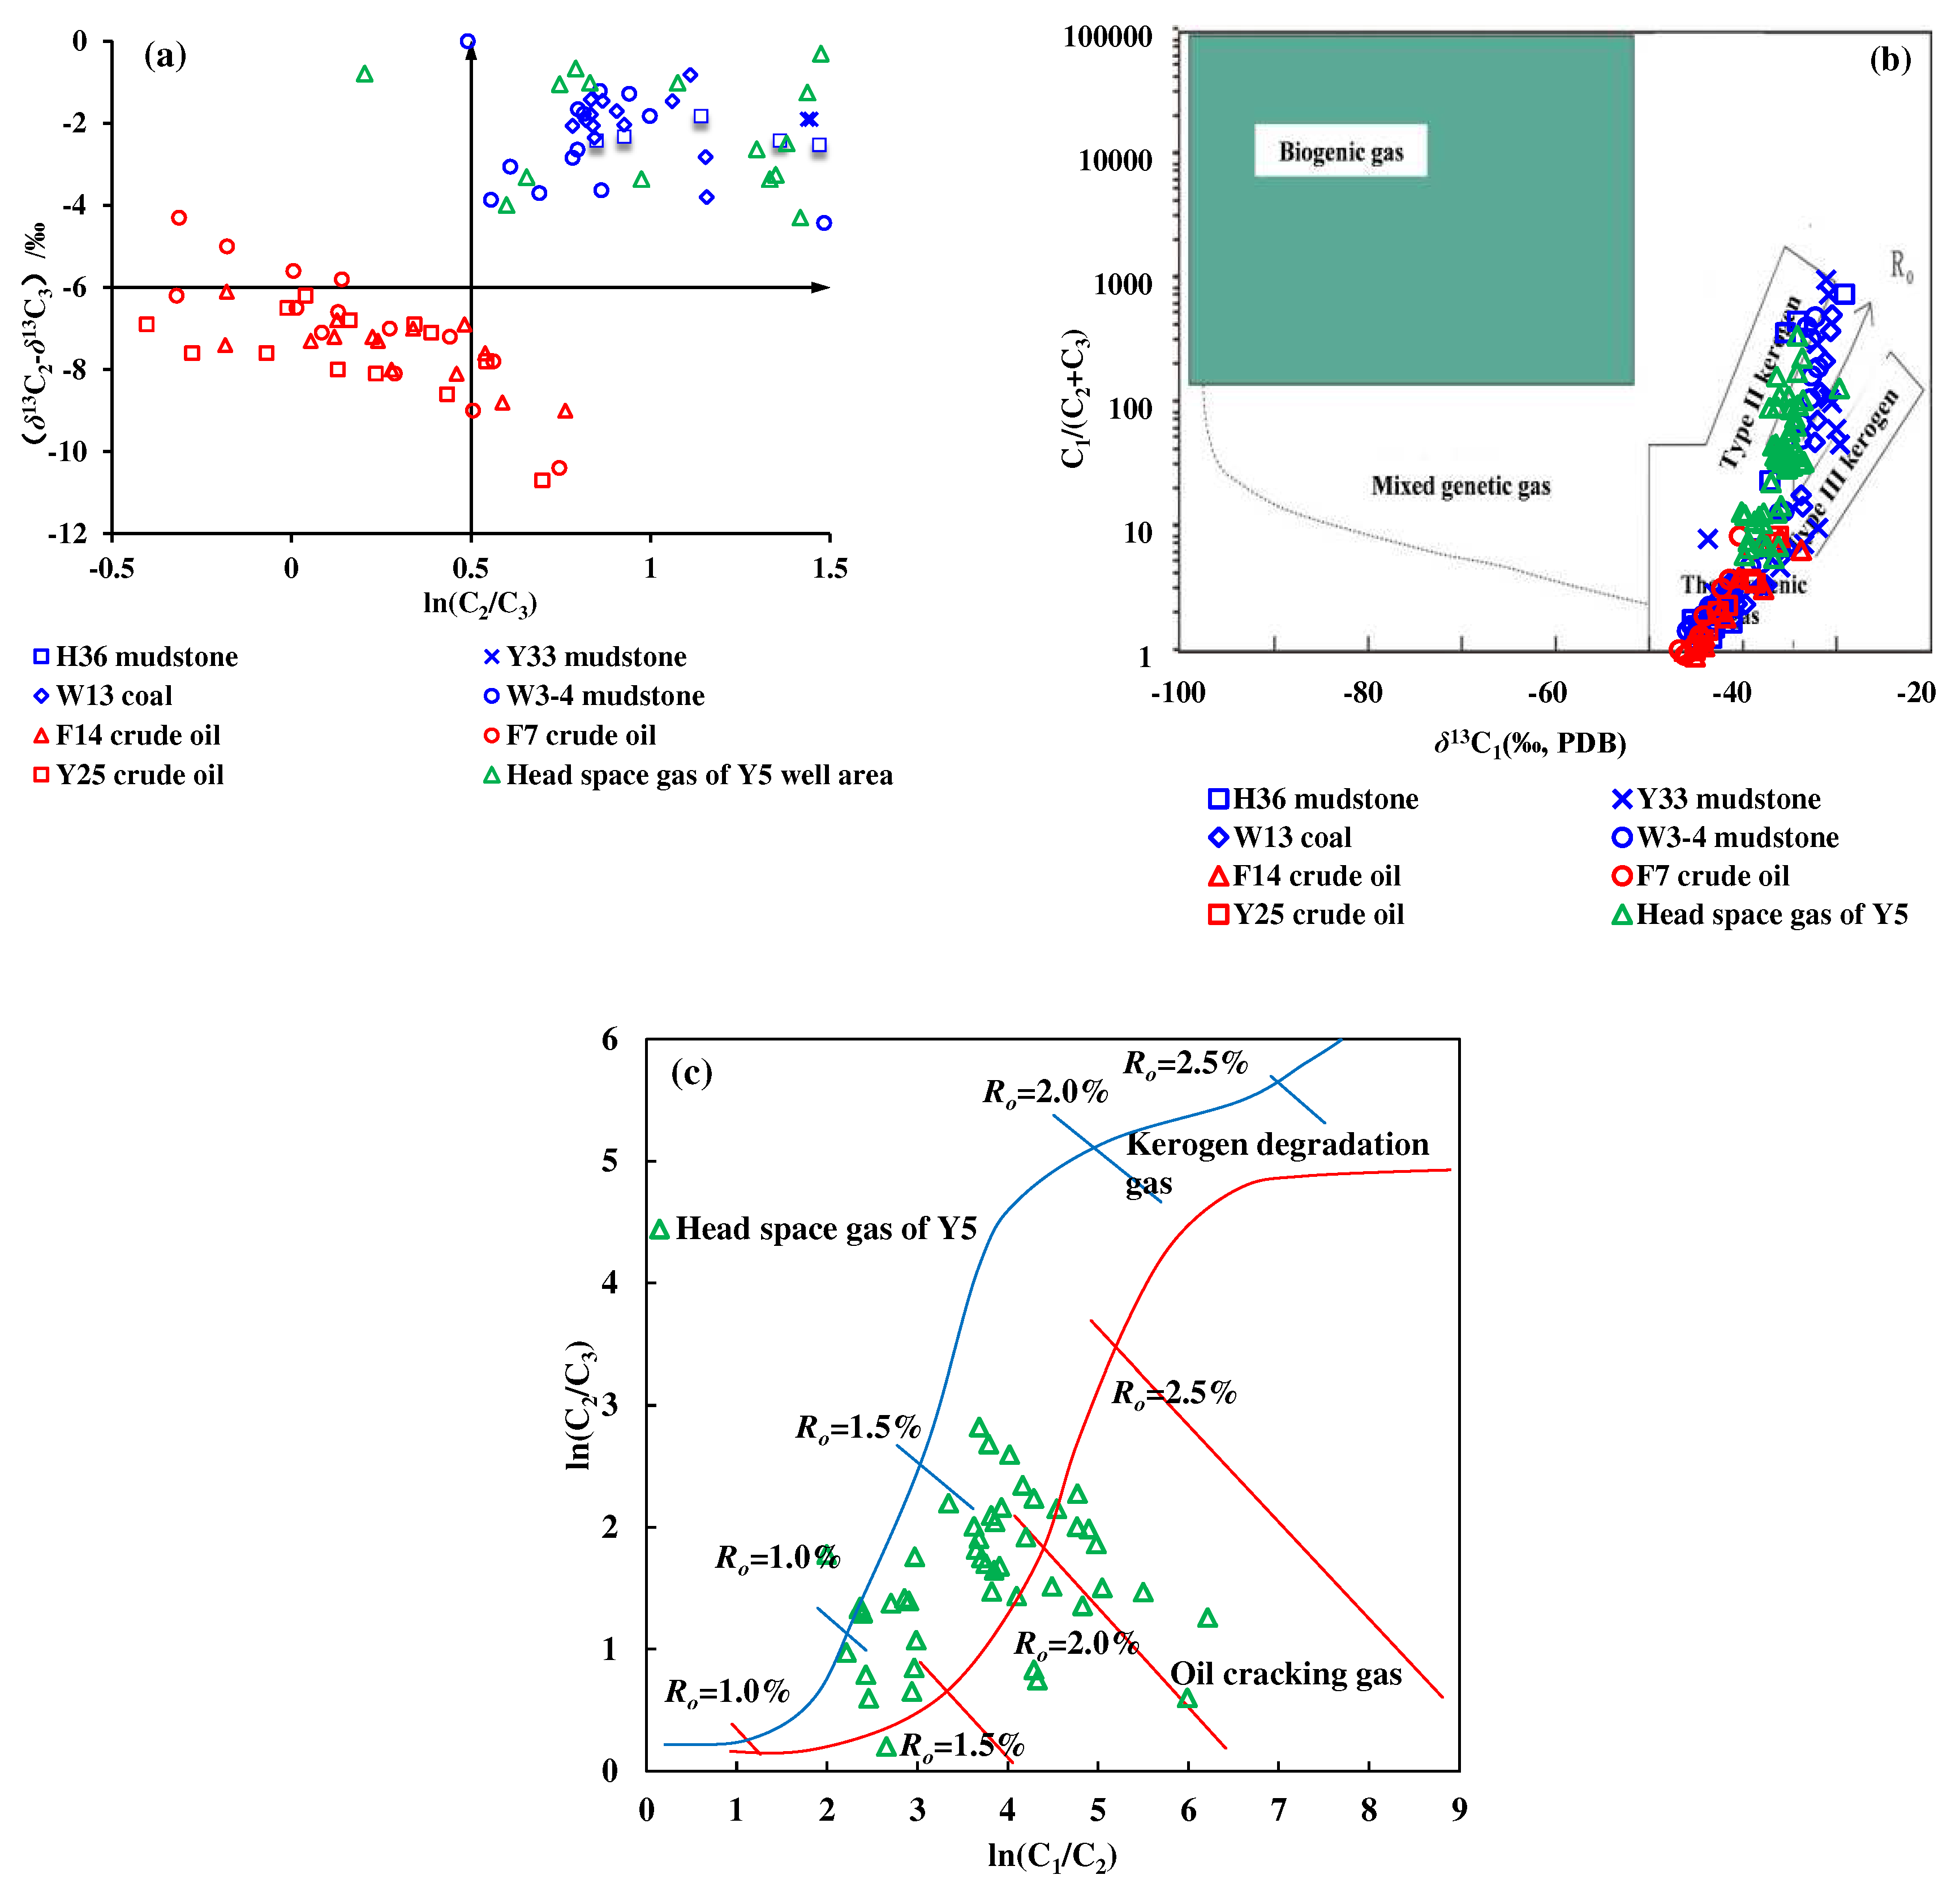
23]. In this study, based on the thermal simulation experiment of kerogen degradation gas and crude oil cracking gas, the discriminant chart of kerogen degradation gas and crude oil cracking gas was revised. As shown in
Figure 6a, the thermal simulation gas from source rocks (mixed gas produced by primary degradation of kerogen and secondary cracking of oil) has the characteristics of a small carbon isotopic gap (–6‰ <
δ13C
2 –
δ13C
3 < 0‰), and a high content ratio (ln(C
2/C
3) > 0.5) between ethane and propane. The carbon isotopic gap between ethane and propane remained stable with the increase of content ratio on the whole. Correspondingly, crude oil cracking gas has the characteristics of a large carbon isotopic gap (
δ13C
2–
δ13C
3<–6‰), and a low content ratio (ln(C
2/C
3) < 0.6) between ethane and propane. The carbon isotopic gap between ethane and propane decreases with the increase of content ratio on the whole. The geochemical characteristics of natural gas in the Y5 well area is generally consistent with that of the gas generated from the source rock thermal simulation, showing a mixture of kerogen degradation gas and crude oil cracking gas.
The natural gas genesis discrimination chart based on the relationship between C
1/(C
2+C
3) and
δ13C
1 [
24] can also be used to discriminate the genesis of natural gas in the Y5 well area. As shown in
Figure 6b, the data points of crude oil cracking gas are all located in the lower left corner of thermogenic gas, with a low C
1/(C
2+C
3) ratio (< 50), and a light carbon isotopic value of methane (–35‰ <
δ13C
1 < –50‰). The kerogen degradation gas has the same characteristics as the crude oil cracking gas in the low maturity stage. But in the high maturity stage, the kerogen degradation gas shows the characteristics of a high C
1/(C
2+C
3) ratio and heavy methane carbon isotopic value, which are clearly different from those of crude oil cracking gas. The characteristics of both kerogen degradation gas in the high mature stage and the natural gas in the Y5 well area is between the characteristics of typical Type II and Type III kerogen degradation gas.
According to the above, it can be seen that the natural gas in the Y5 well area is a mixture of kerogen degradation gas and crude oil cracking gas, and it needs to be further confirmed which is the main kind. Li et al. discovered that affected by the differences in structure and activation energy of gas generation between crude oil and kerogen, the C
2/C
3 ratio of crude oil cracking gas is lower than that of kerogen degradation gas at the same stage of evolution, and the C
1/C
2 ratio of crude oil cracking gas at low/medium maturity (
Ro < 1.0%) and over maturity (
Ro > 2.0%) stages is smaller than that of kerogen degradation gas [
25]. It can be seen from
Figure 6c that the natural gas in the Y5 well area is mainly kerogen degradation gas.
Dai established the relationship between the carbon isotope value of methane and maturity based on statistical data [
26]. Oil–type gas and coal–type gas follow the formula
δ13C
1=15.80log
Ro–42.20 and
δ13C
1=14.12log
Ro–34.39, respectively. Using these formulas, the maturity of source rocks can be calculated from the carbon isotope value of methane. It can be seen from
Figure 7 that the
Ro values calculated by using the coal–type gas formula are basically consistent with or slightly higher than those of the source rock (some natural gas originates from the source rock with higher maturity in the center of the sag). However, the
Ro values calculated by the of oil–type gas formula is higher than those of the source rock, and the
Ro values calculated below the ZH440 layer are between 4% and 8%, which is inconsistent with the geological condition of the study area. However, ultraviolet (UV) fluorescence observation revealed the presence of cracking residual asphalt in the reservoir pores of in Y5 well area, which proved that a certain amount of crude oil was charged in the early stage and cracked into gas in the later stage. In summary, the natural gas in the Y5 well area on the northern slope of Baiyun Sag is mainly kerogen degradation gas, and may contain a small amount of crude oil cracking gas.
4.1.2. Discrimination based on isotope sequence reversal of natural gas
Part of the natural gas in the Y5 well area has the characteristics of
δ13C
2 >
δ13C
3 (
Figure 7), while the gas in the thermal simulation experiment shows a normal carbon isotope sequence (
Figure 8a,b). Studies by Dai have shown that mixed sources are the main reason for the reversal of natural gas isotopic sequences [
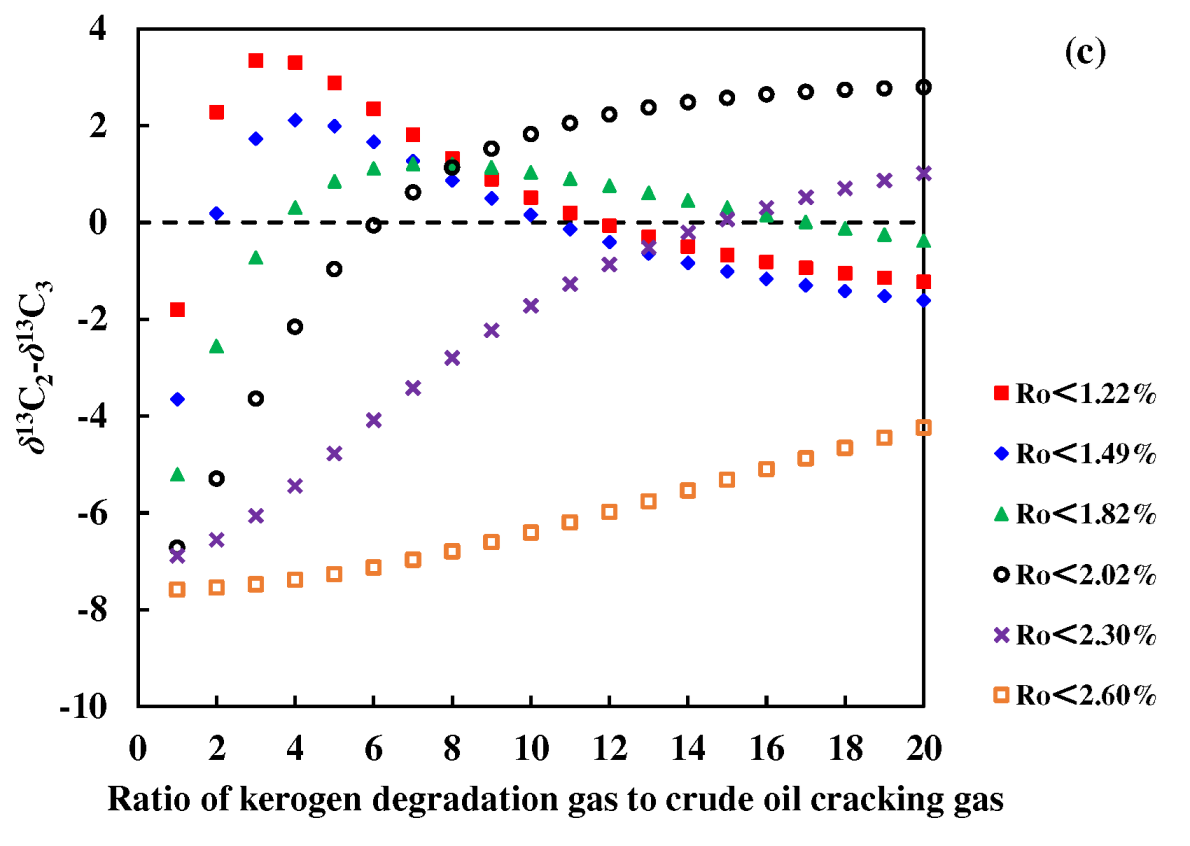
26]. This study calculated the isotopic composition of gas mixture of Y33 source rock pyrolysis gas (representing kerogen degradation gas) and F14 crude oil cracking gas. The results showed that the mixing of kerogen degradation gas and crude oil cracking gas can cause the reversal of the isotopic sequence of ethane and propane but does not affect the isotopic sequence of methane and ethane. It was also found that the higher the maturity of gas, the lower the proportion of crude oil cracking gas that needs to be mixed for reversal. When the
Ro is 1.22%, the mixing ratio of kerogen degradation gas to crude oil cracking gas is 2:1 corresponding to the reversal of ethane and propane isotope sequence, and the corresponding ratio is 15:1 when
Ro is 2.30% (
Figure 8c).
4.2. Discussion on the gas source
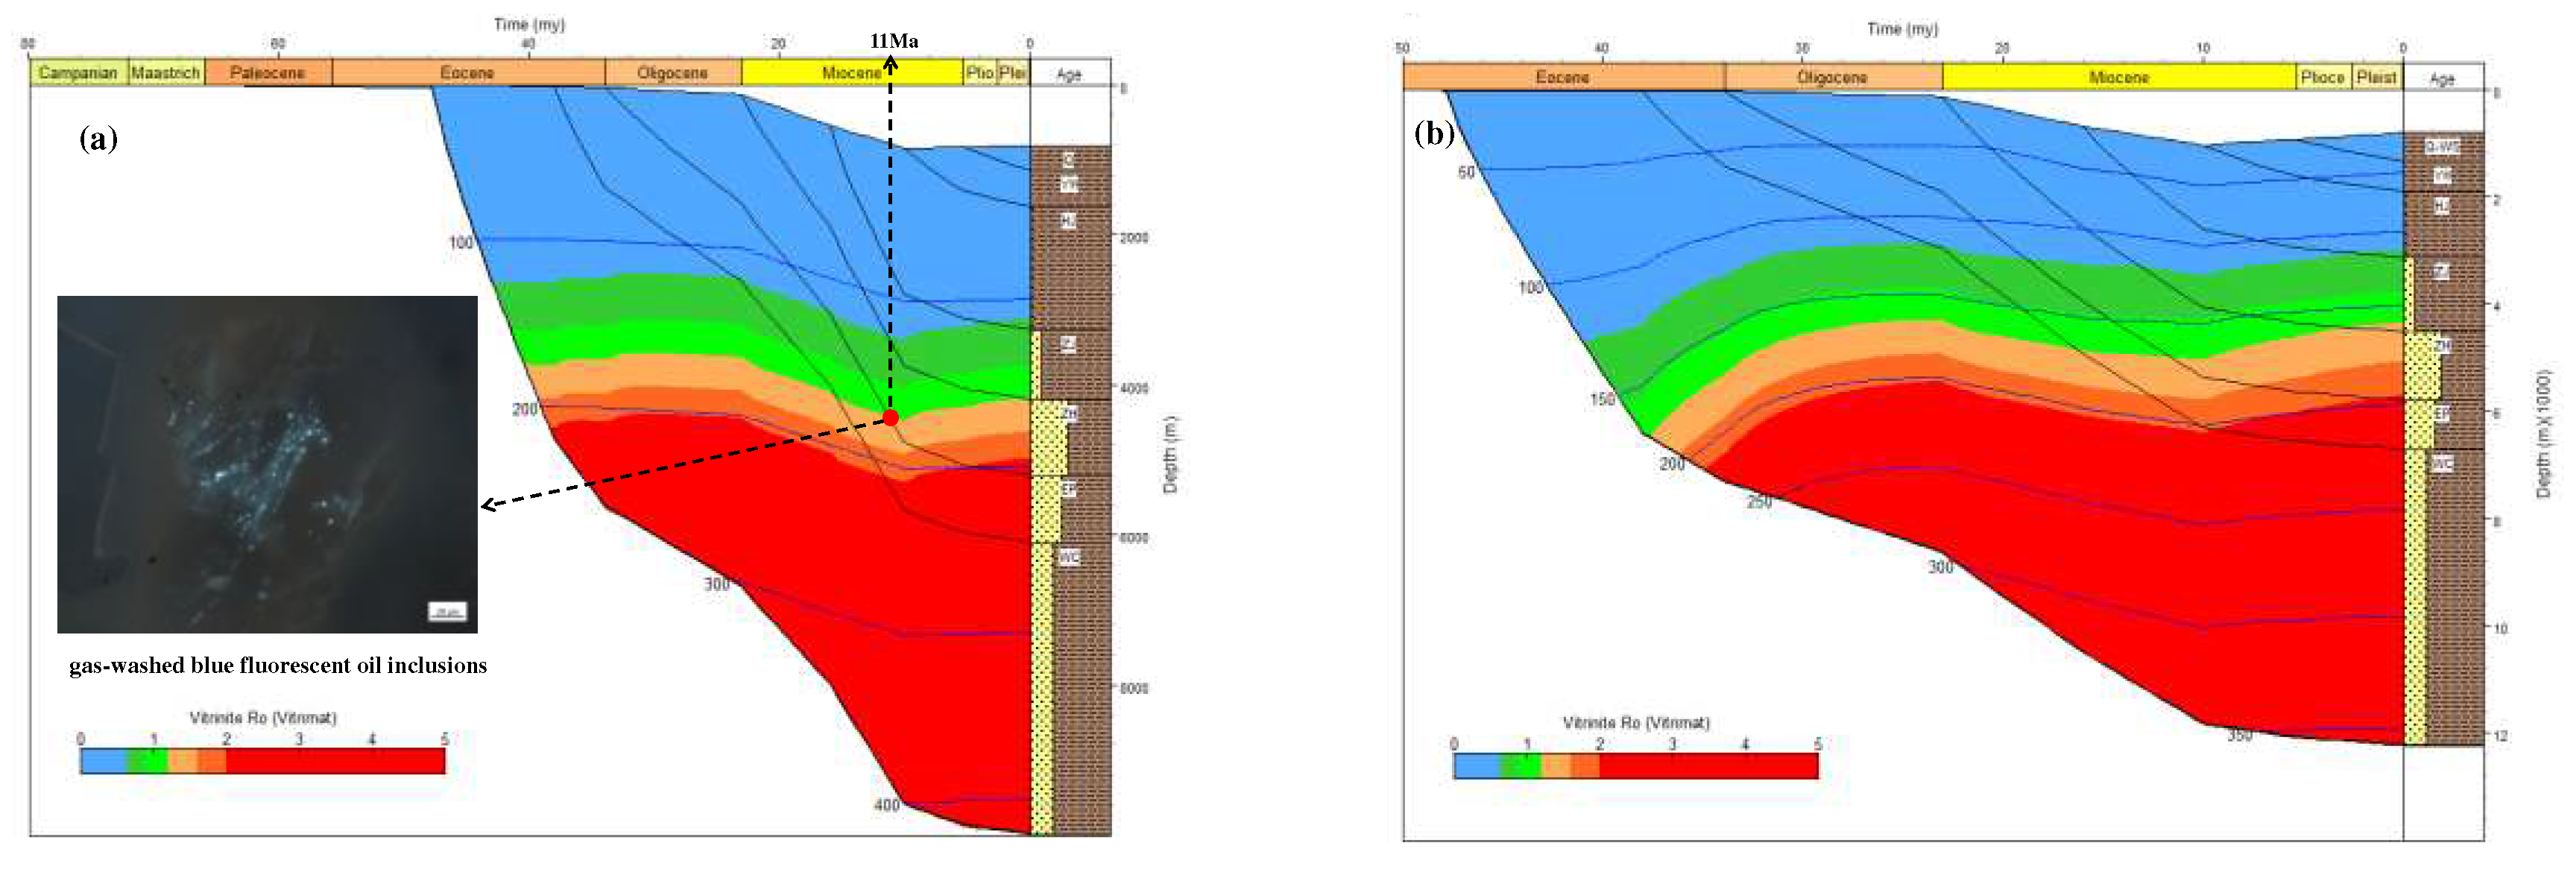
Combining the carbon isotope kinetic parameters of methane with the thermal history information of the Well Y5 and Well D (
Figure 9), the carbon isotope value curves of natural gas generated accumulatively from different geologic times to the present were acquired (
Figure 10). The homogenization temperature of the saline inclusions associated with the gas-washed oil inclusions with blue fluorescent in the Y5 well area is 170 °C–180 °C, which corresponds to the start time of natural gas charging is 11Ma (
Figure 9a). It can be seen from
Figure 10 that during the thermal evolution of OM, the carbon isotope of natural gas gradually becomes heavier. Since 11 Ma, the carbon isotope value of methane generated from the source rocks in Enping Formation and Wenchang Formation ranges from –42‰ to –28‰, which is consistent with the carbon isotope value of methane in Well Y5. It shows that the natural gas in the Y5 well area mainly comes from delta to shallow lacustrine facies source rocks. From shallow to deep, the drying coefficient of natural gas increases gradually, and the carbon isotope value gradually becomes heavier, reflecting that the high–quality reservoirs in the shallower layer accumulated natural gas generated in the early stage, and the tight reservoirs in the deeper layer mainly accumulated natural gas generated in the late stage.
5. Conclusions
Based on the data from thermal simulation experiment, this study revised the discriminant chart of the genesis of natural gas, the genetic type and source of natural gas in the Y5 well area on the northern slope of Baiyun Sag were clarified by combining the thermal simulation results and the method of carbon isotope kinetic. This research shows that:
The natural gas in the Y5 well area on the northern slope of Baiyun Sag is mainly kerogen degradation gas, mixed with a small amount of oil cracking gas. The mixing of these two types of natural gas results in the reversal of the isotopic sequences of ethane and propane, and the higher the maturity of the natural gas, the lower the proportion of cracking gas from crude oil required for the reversal.
The exist of blue fluorescent oil inclusions in Y5 well area indicated gas washing occurred at 11Ma. The isotopic values of gas generated since 11Ma from the Enping Formation coal measures and Wenchang Formation shallow lake mudstone range from -44.3‰ to -29‰, which is basically consistent with the actual isotopic composition of natural gas in the Y5 well area. The high–quality reservoirs in the shallower strata accumulated natural gas generated in the early stage, and the tight reservoirs in the deeper strata mainly accumulated natural gas generated in the late stage.
Author Contributions
Conceptualization, G.P. and C.C.; methodology, J.L.; software, C.C.; validation, L.Z., X.W. and H.S.; formal analysis, Y.H.; investigation, C.C.; resources, L.Z.; data curation, X.W.; writing—original draft preparation, G.P.; writing—review and editing, J.L.; visualization, J.L.; supervision, J.L.; project administration, G.P.; funding acquisition, J.L. All authors have read and agreed to the published version of the manuscript.
Funding
This research was funded by the National Natural Science Foundation of China, grant number 42172145.
Institutional Review Board Statement
Not applicable.
Informed Consent Statement
Not applicable.
Data Availability Statement
Not applicable.
Conflicts of Interest
The authors declare no conflict of interest.
References
- Zhu, J.; Shi, H.; He, M.; Pang, X.; Yang, S.; Li, Z. Origins and Geochemical Characteristics of Gases in LW3-1-1 Well in the Deep Sea Region of Baiyun Sag,Pearl River Mouth Basin. Natural Gas Geoscience 2008, 19, 229–233. [Google Scholar]
- Zhang, G.; Yang, H.; Chen, Y.; Ji, M.; Sun, Y. The Baiyun Sag: A giant rich gas-generation sag in the deepwater area of the Pearl River Mouth Basin. Natural Gas Industry 2014.
- Lijun, M.I.; Zhongtao, Z.; Xiong, P.; Jun, L.; Bo, Z.; Qing, Z.; Xuan, F.; Ltdshenzhen, C.C.; Development, C.D. Main controlling factors of hydrocarbon accumulation in Baiyun Sag at northern continental margin of South China Sea. Petroleum Exploration and Development 2018.
- Zhu, J.; Shi, H.; Pang, X.; Zhang, Z.; Long, Z.; Liu, B.; Shi, Y. Discussion on Natural Gas Generation and Giant-Medium Size Gas Field Formation in Baiyun Sag. Natural Gas Geoscience 2012, 23, 19–27. [Google Scholar]
- Xiong, P.; Jianye, R.; Jinyun, Z.; Jun, L.; Peng, Y.U.; Baojun, L. Petroleum geology controlled by extensive detachment thinning of continental margin crust: A case study of Baiyun sag in the deep-water area of northern South China Sea. Petroleum Exploration and Development 2018, 14. [Google Scholar]
- Maier, C.G.; Zimmerly, S.R. Chemical dynamics of the transformation of the organic matter to bitumen in oil shale. 1924.
- Allred, V.D. Shale oil developments: Kinetics of oil shale pyrolysis. Chem.eng.prog 1966. [Google Scholar]
- Tissot, B.; Welte, D. Petroleum formation and occurrence. Springer-Verlag. Earth Science Reviews, 1984. [Google Scholar]
- Wang, M.; Lu, S.F.; Dong, Q.; Xue, H.T.; Huang, L.M. Comparison on hydrocarbon generation kinetic models. Journal of China University of Petroleum (Edition of Natural Science) 2011, 35, 12–18. [Google Scholar]
- Klomp, U.C.; Wright, P.A. A new method for the measurement of kinetic parameters of hydrocarbon generation from source rocks. Org. Geochem. 1990, 16, 49–60. [Google Scholar] [CrossRef]
- Dieckmann, V. Modelling petroleum formation from heterogeneous source rocks: The influence of frequency factors on activation energy distribution and geological prediction. Marine & Petroleum Geology 2005, 22, 375–390. [Google Scholar]
- Zhang, X.; Jong, W.D.; Preto, F. Estimating kinetic parameters in TGA using B-spline smoothing and the Friedman method. Biomass Bioenerg. 2009, 33, 1435–1441. [Google Scholar] [CrossRef]
- Behar, F.S.; Kressmann, S.; Rudkiewicz, J.L.; Vandenbroucke, M. Experimental simulation in a confined system and kinetic modelling of kerogen and oil cracking. Org. Geochem. 1992, 19, 173–189. [Google Scholar] [CrossRef]
- Behar, F.; Lorant, F.; Lewan, M. Role of NSO compounds during primary cracking of a Type II kerogen and a Type III lignite. Organic Geochemistry: A Publication of the International Association of Geochemistry and Cosmochemistry 2008, 39. [Google Scholar] [CrossRef]
- Ungerer, P. State of the art of research in kinetic modelling of oil formation and expulsion. Org. Geochem. 1990, 16, 1–25. [Google Scholar] [CrossRef]
- Burnham, A.K.; Schmidt, B.J.; Braun, R.L. A test of the parallel reaction model using kinetic measurements on hydrous pyrolysis residues. Org. Geochem. 1995, 23, 931–939. [Google Scholar] [CrossRef]
- Shuangfang, L.; Xin, C.; Xiaotai, F. Chemical Kinetic Models of the Hydrocarbon Generation by Coal Organic Matter in the Taibei seg and Its Initial Application. Acta Sedimentologica Sinica 1997.
- Cramer, B.; Faber, E.; Gerling, P. Reaction Kinetics of Stable Carbon Isotopes in Natural Gas-Insights from Dry, Open System Pyrolysis Experiments. Energy Fuels 2001, 15, 517–532. [Google Scholar] [CrossRef]
- Zou, Y.R.; Zhao, C.; Wang, Y.; Zhao, W.; Shuai, Y. Characteristics and origin of natural gases in the Kuqa Depression of Tarim Basin, NW China. Org. Geochem. 2006, 37, 280–290. [Google Scholar] [CrossRef]
- Jijun, L.I.; Shuangfang, L.U.; Wei, W.U.; Haitao, X.; Qingxia, X.U.; Jie, G.; Yinghua, Y.U. Water Role and Its Influence on Hydrogen Isotopic Composition of Natural Gas during Gas Generation. Acta Geologica Sinica (English Edition) 2011, 8. [Google Scholar]
- Zhang, C.; Luo, D.; Wei, C. Controlling factors of natural gas accumulation in the Amu Darya Basin, Central Asia. Oil & Gas Geology 2015. [Google Scholar]
- Shuangfang, L.; Jijun, L.; Haitao, X.; Guangyu, H. COMPARISON OF FRACTIONATION MODELS OF CARBON ISOTOPE. Natural Gas Industry 2006.
- Prinzhofer, A.A.; Huc, A.Y. Genetic and post-genetic molecular and isotopic fractionations in natural gases. Chem. Geol. 1995, 126, 281–290. [Google Scholar] [CrossRef]
- Whiticar, M.J. Carbon and hydrogen isotope systematics of bacterial formation and oxidation of methane - ScienceDirect. Chem. Geol. 1999, 161, 291–314. [Google Scholar] [CrossRef]
- Li, J.; Wang, X.; Hou, L.; Chen, C.; Guo, J.; Yang, C.; Wang, Y.; Li, Z.; Cui, H.; Hao, A. Geochemical characteristics and resource potential of shale gas in Sichuan Basin, China. Journal of Natural Gas Geoscience 2021, 6, 313–327. [Google Scholar] [CrossRef]
- Dai, J.X. Identification of various alkane gases. Science in China 1992, 35, 1246–1257. [Google Scholar]
|
Disclaimer/Publisher’s Note: The statements, opinions and data contained in all publications are solely those of the individual author(s) and contributor(s) and not of MDPI and/or the editor(s). MDPI and/or the editor(s) disclaim responsibility for any injury to people or property resulting from any ideas, methods, instructions or products referred to in the content. |
© 2023 by the authors. Licensee MDPI, Basel, Switzerland. This article is an open access article distributed under the terms and conditions of the Creative Commons Attribution (CC BY) license (http://creativecommons.org/licenses/by/4.0/).
