1. Introduction
Urban development in mountainous regions, open–pit mining, and transportation infrastructure construction often lead to vegetation loss and increased soil erosion on slopes. Geologically weak areas with steep slopes can experience severe disasters like landslides and collapses. Hence, there is a critical need to accelerate slope re-vegetation and bolster slope stability [
1,
2]. Many areas are currently grappling with low soil moisture content (MC) and desiccation–induced vegetation decline or degradation. Planting vegetation is the preferred approach to reconcile water resource conflicts, address ecological concerns, and prevent soil erosion [
3,
4].
China is among the countries with the higher incidence of landslides and the most severe soil erosion. The vigorous development of the national economy has led to the emergence of a large number of artificial slopes in resource development and large–scale infrastructure construction, resulting in serious soil erosion and desertification and exacerbating the degradation of the ecosystem. With the increase in the scale of construction, a landslide is no longer a local issue in a certain region or range, but a global problem affecting the overall goal of China’s ecological environment construction [
5,
6]. Achieving the sustainable development strategy goal of balancing economic construction and environmental protection is urgently needed. Civil engineering measures were often used for slope protection in the past by preventing slope instability and damage, but it caused permanent damage to the ecology as the original natural vegetation on the slope never recovered [
7,
8]. Vegetation plays a significant role compared with other engineering methods such as improving the eco–environment, reducing water loss and soil erosion, conserving water sources, and consolidating slopes. It is an effective measure for economic and environmentally friendly prevention and control. Applying plants to improve the stability of slopes is the future direction for slope protection.
In recent years, research on the mechanism of vegetation–based slope protection has also yielded fruitful results both domestically and internationally. Scholars have conducted numerous studies on the mechanical properties and mechanisms of root–soil fixation using both indoor and outdoor experiments as well as numerical simulations. These experiments mainly involve direct shear, in situ shear, triaxial compression, and unconfined compressive strength tests. Prior research confirms that root–soil interactions can enhance soil shear strength [
9,
10,
11,
12]. Therefore, an in–depth exploration of herbaceous plant root–soil interactions in mountainous zones is warranted to establish a scientific foundation for enhancing slope stability and preventing soil erosion [
13,
14,
15,
16]. Herbaceous vegetation eco–slope protection technology presents an economically and environmentally viable method for soil reinforcement aligning with sustainability principles. This approach fortifies soil consolidation and mitigates shallow landslides [
17]. Existing literature [
18,
19,
20] have proposed quantitative evaluation methods for different plant roots effects on soil reinforcement. In slope stability analyses [
21,
22,
23], following the Mohr–Coulomb strength theory, the extra cohesion provided by plant root systems gauges soil reinforcement effectiveness. Zhang et al. studied the plant root system impacts on soil internal friction angle and cohesion via triaxial compression tests [
24,
25,
26,
27,
28]. Lian et al. conducted indoor triaxial shear tests on undisturbed loess with different MC and remolded loess with roots. Their analysis explored how different root distribution modes impact the shear strength performance of remolded loess [
29]. Zhou et al. conducted shear tests on herbaceous root–soil composites in loess areas. They investigated the relationship between shear displacement and strength of soil–root composites at different depths and soil MCs, further analyzing the mechanical friction effect between roots and soil [
30]. Ma et al. conducted compression and triaxial compression tests on cohesionless root and soil system–reinforced composite soil under wet–dry cycling conditions, and analyzed and explored the impact of root system and wet–dry cycling number on the shear strength indexes of soil–reinforced composites [
31]. Xu et al. conducted in–depth research on the shear characteristics of the native soil–root composite of the dominant species belonging to the family
Iridaceae, Genus Iris, in the source area of the Lanniqing landslide in Zhaotong, using direct shear tests. The results were compared and analyzed with the results of indoor reshaping composite tests using the same moisture content [
32]. Scholars like Dupuy et al. employed numerical simulation methods to explore erosion resistance and soil reinforcement effects of root–soil composites, considering shear, tensile properties, and root distribution patterns [
33]. Slope instability occurs when shear stress in the slope surpasses the soil shear strength. Slope instability and failure often lead to crack formation, expansion, and aggregation. Due to the challenging nature of field tests for slope instability, numerical simulations offer an effective alternative [
34]. In summary, the key factors affecting plant slope stability include shear and tensile properties of root–soil composites and root distribution patterns. Besides triaxial shear tests, indoor direct shear tests are also commonly used to determine the shear strength of soil–root composites. However, their major drawback lies in potential discrepancies between artificially determined shear failure planes and the actual weakest shear planes.
In this study, a consolidated undrained tests series was conducted using a triaxial compression apparatus on intact powdery clay samples with and without the herbaceous chrysanthemum root systems at different sampling depths. We conducted significance testing and correlation analysis in R software and performed, finite element simulations to assess the effectiveness of slope protection under different working conditions. The results indicated the stress–strain relationship, the contribution of different factors, and the influence of the variables on slope stability of herbaceous chrysanthemum root–reinforced soil for different soil moisture contents (MCs) and root contents (RCs). The study comprehensively evaluated the efficacy of herbaceous chrysanthemum root system reinforcement on powdery clay slopes, thus providing a scientific basis for studying and applying plant root systems’ erosion resistance and soil reinforcement effects.
2. Methods and Materials
2.1. Test Equipment
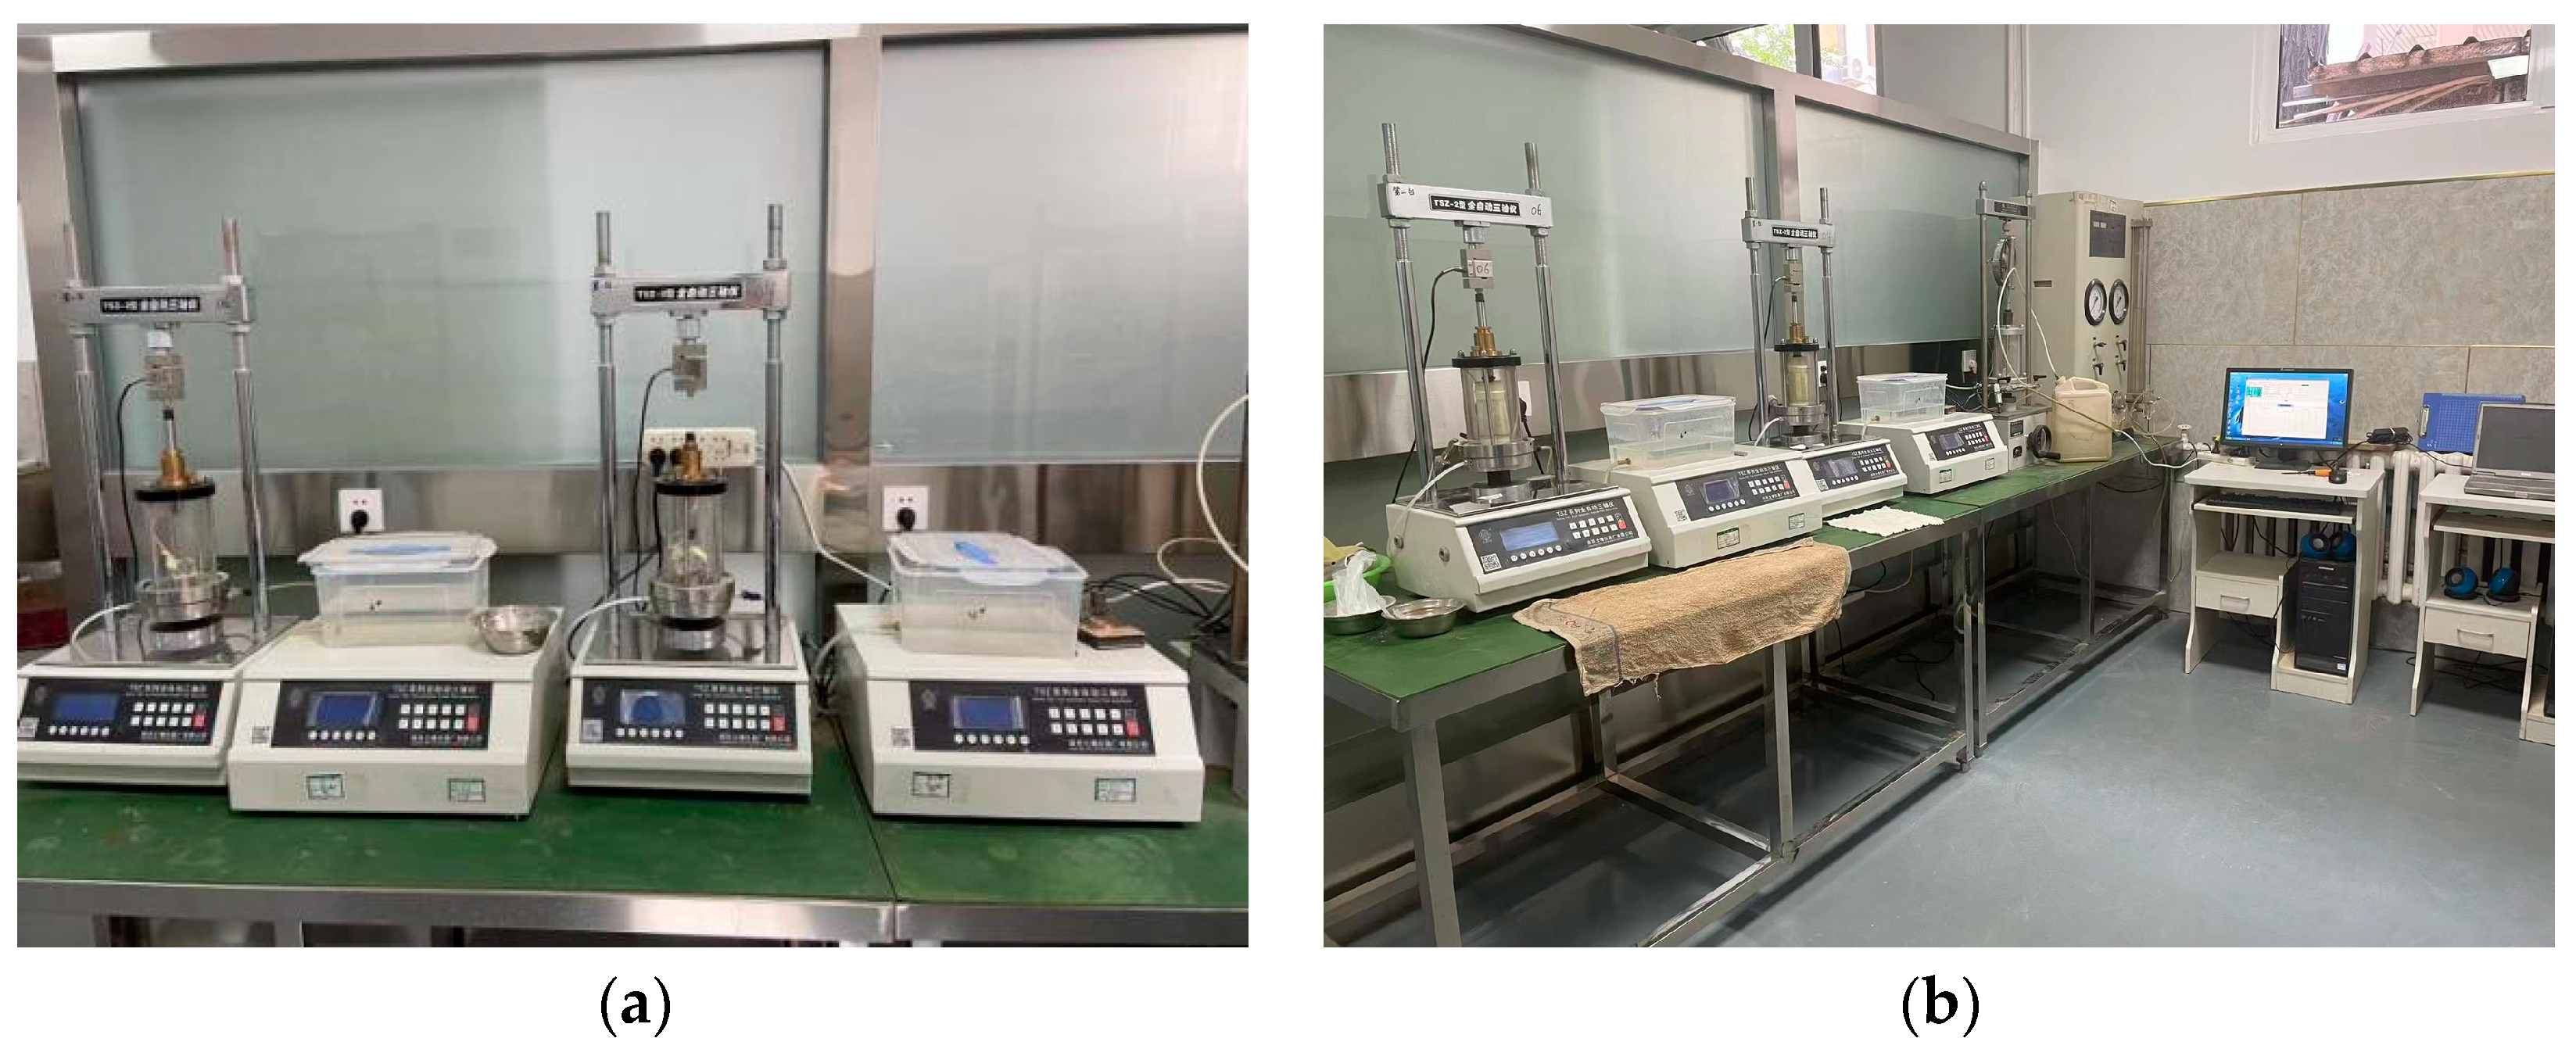
The TSZ–2 triaxial shear equipment was used for this experiment. This apparatus comprises a mainframe system and a backpressure system. Vertical strain is controlled through a stepper motor with continuous speed adjustment, ensuring precise generation of strain and displacement. Backpressure is regulated using a precision hydraulic circuit system comprised “precision digital pistons,” facilitating accurate application of confining pressure and measurement of volumetric changes and drainage. The instrument’s key specifications include: specimen diameter (39.1 mm, 61.8 mm), maximum axial load capacity 30 kN, maximum shear rate 2.4 mm/min.
Figure 1 depict the instrument setup.
2.2. Experimental Site
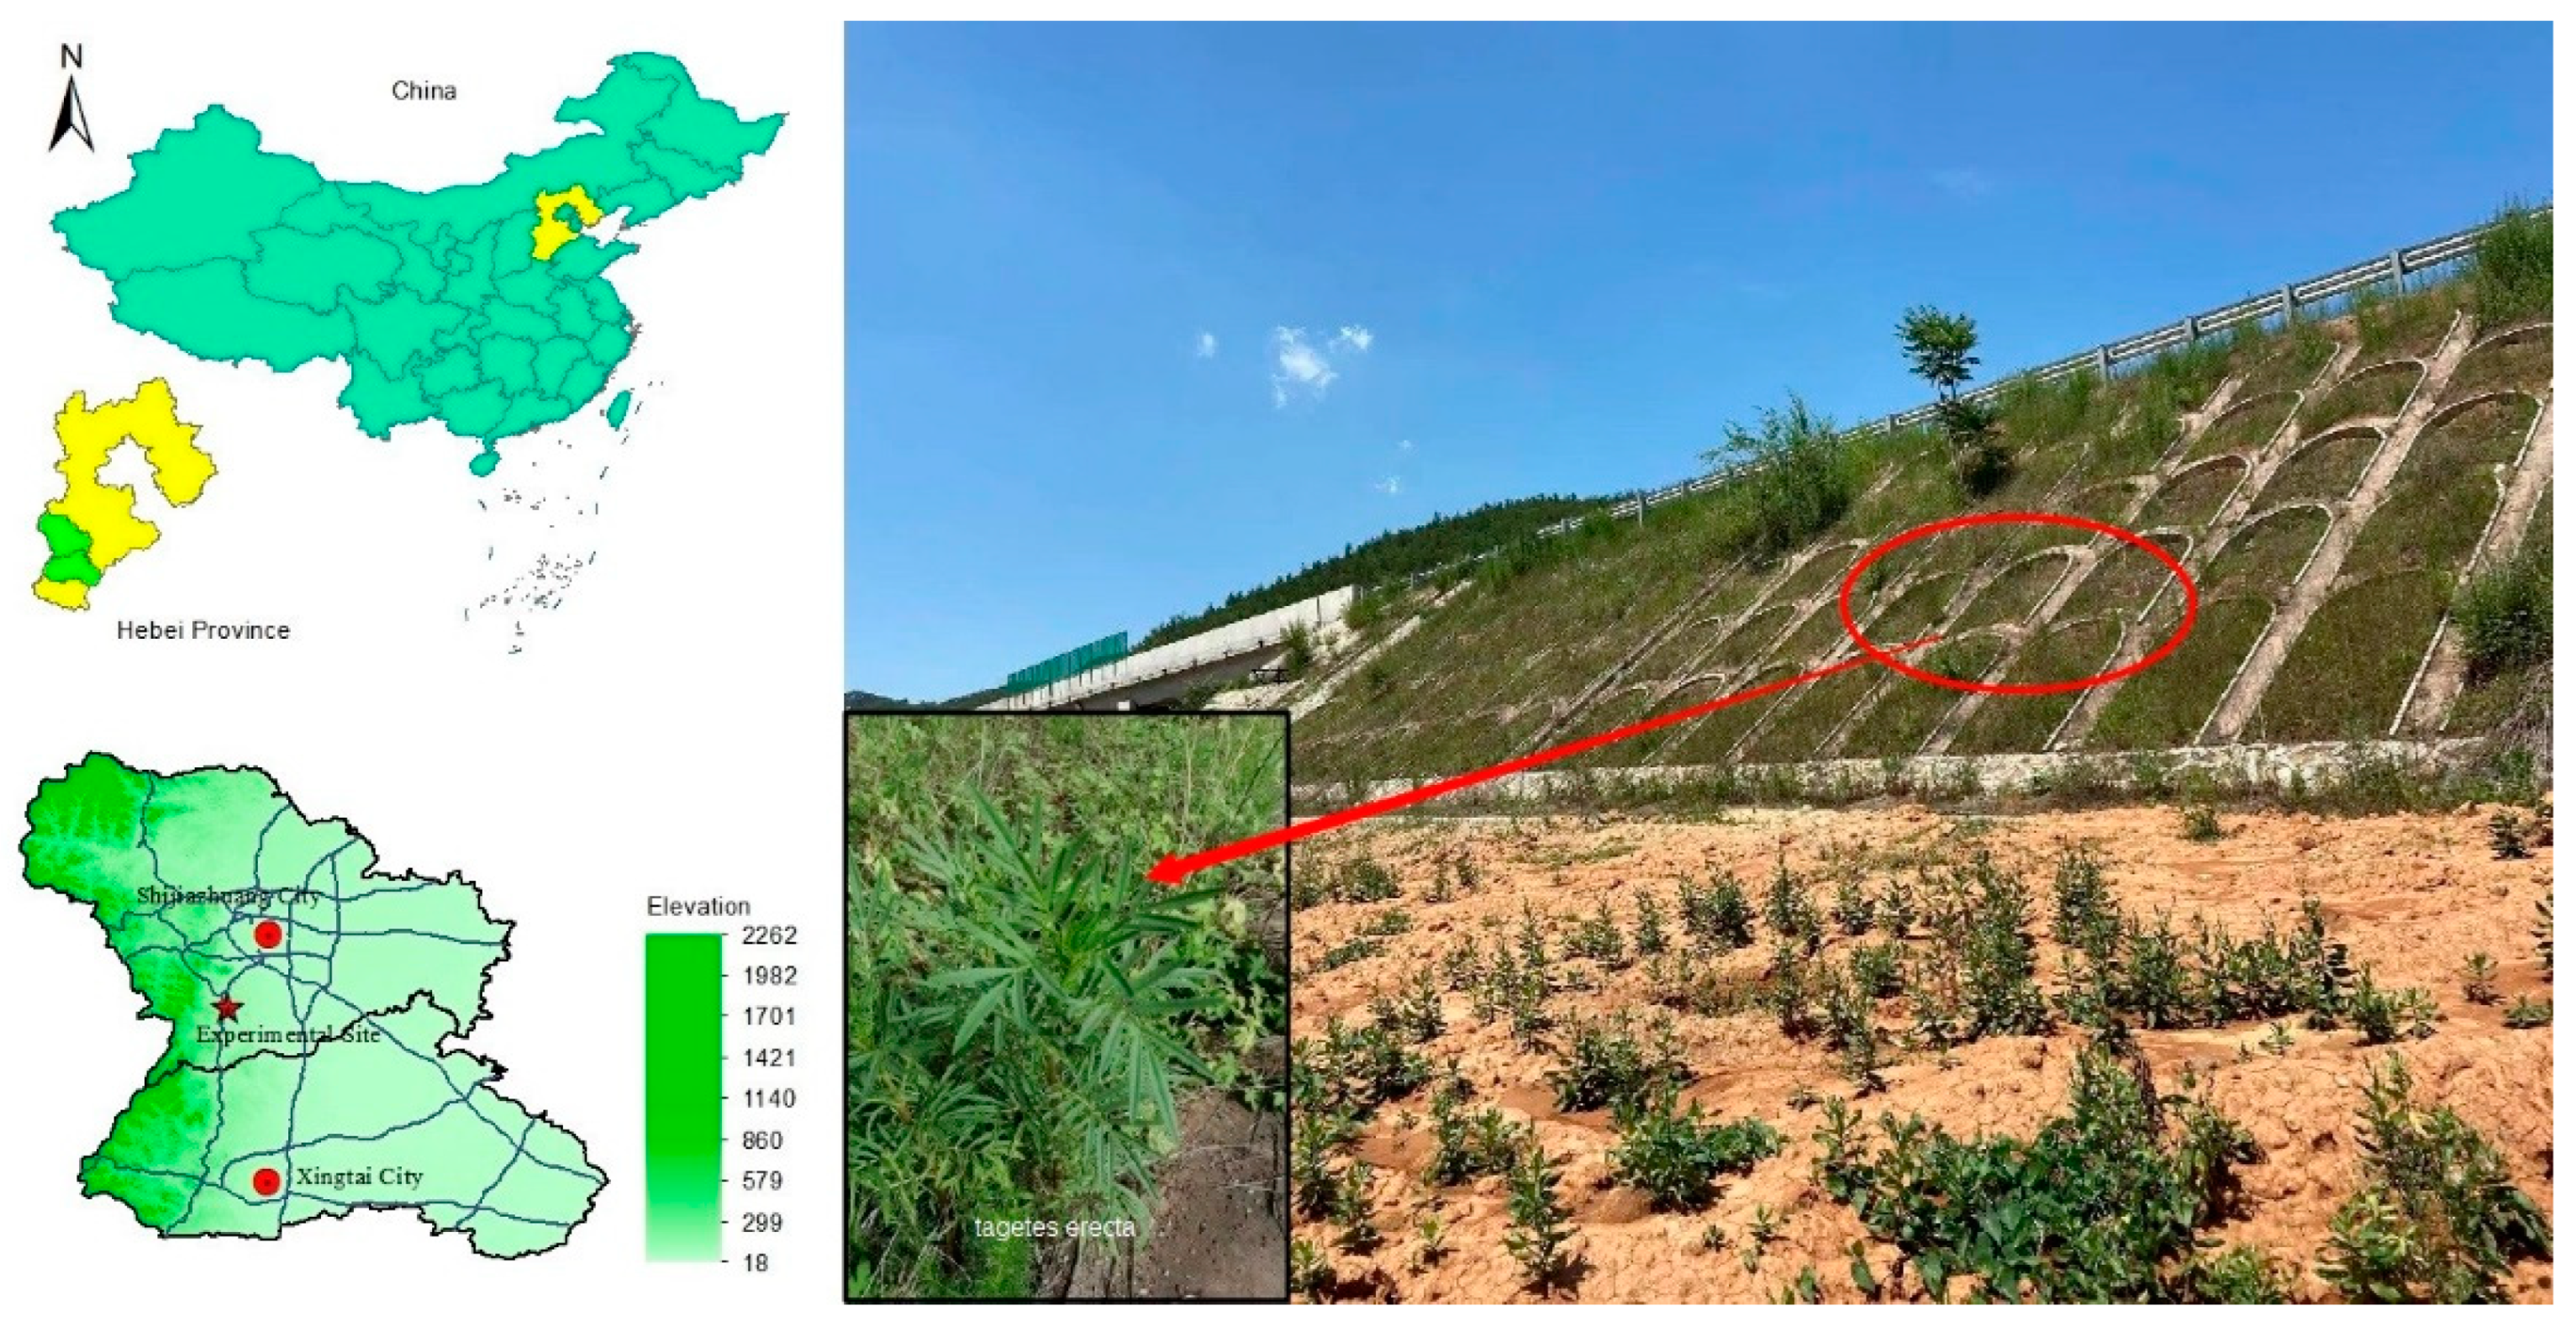
The experimental site, situated in Xingtai, Hebei Province, China, was chosen from the K35+373 section of the S75 Taihang Mountain Expressway in Xingtai (114°18′E, 37°45′N), Hebei Province, China. Found in a low mountainous region, the site’s ground elevation was 244.06–258.66 m as the road traverses the ridge line. The terrain has significant undulations. Due to its location on a slope, surface runoff quickly accumulates in the lower areas of the site during rainfall. Rainwater primarily flows and drains towards the low–lying areas along the bedrock surface or weathered fractures, with limited infiltration into soil layers. Consequently, groundwater storage is not feasible in this location, resulting in relatively simple hydrogeological conditions and scant groundwater presence. To facilitate ecological restoration on the slopes, a of herbaceous plant mix was selected, including
Purple alfalfa,
Bermuda grass,
Kummerowia striata,
Wild mugwort, and
Tagetes erecta. Among them,
Tagetes erecta characterized by its dense foliage, well–developed roots, and patchy growth, effectively combats rainfall–induced soil erosion. This plant has displayed notable success in soil and water restoration in northern regions. The experimental site and samples of
Tagetes erecta are shown in
Figure 2.
2.3. Sample Preparation
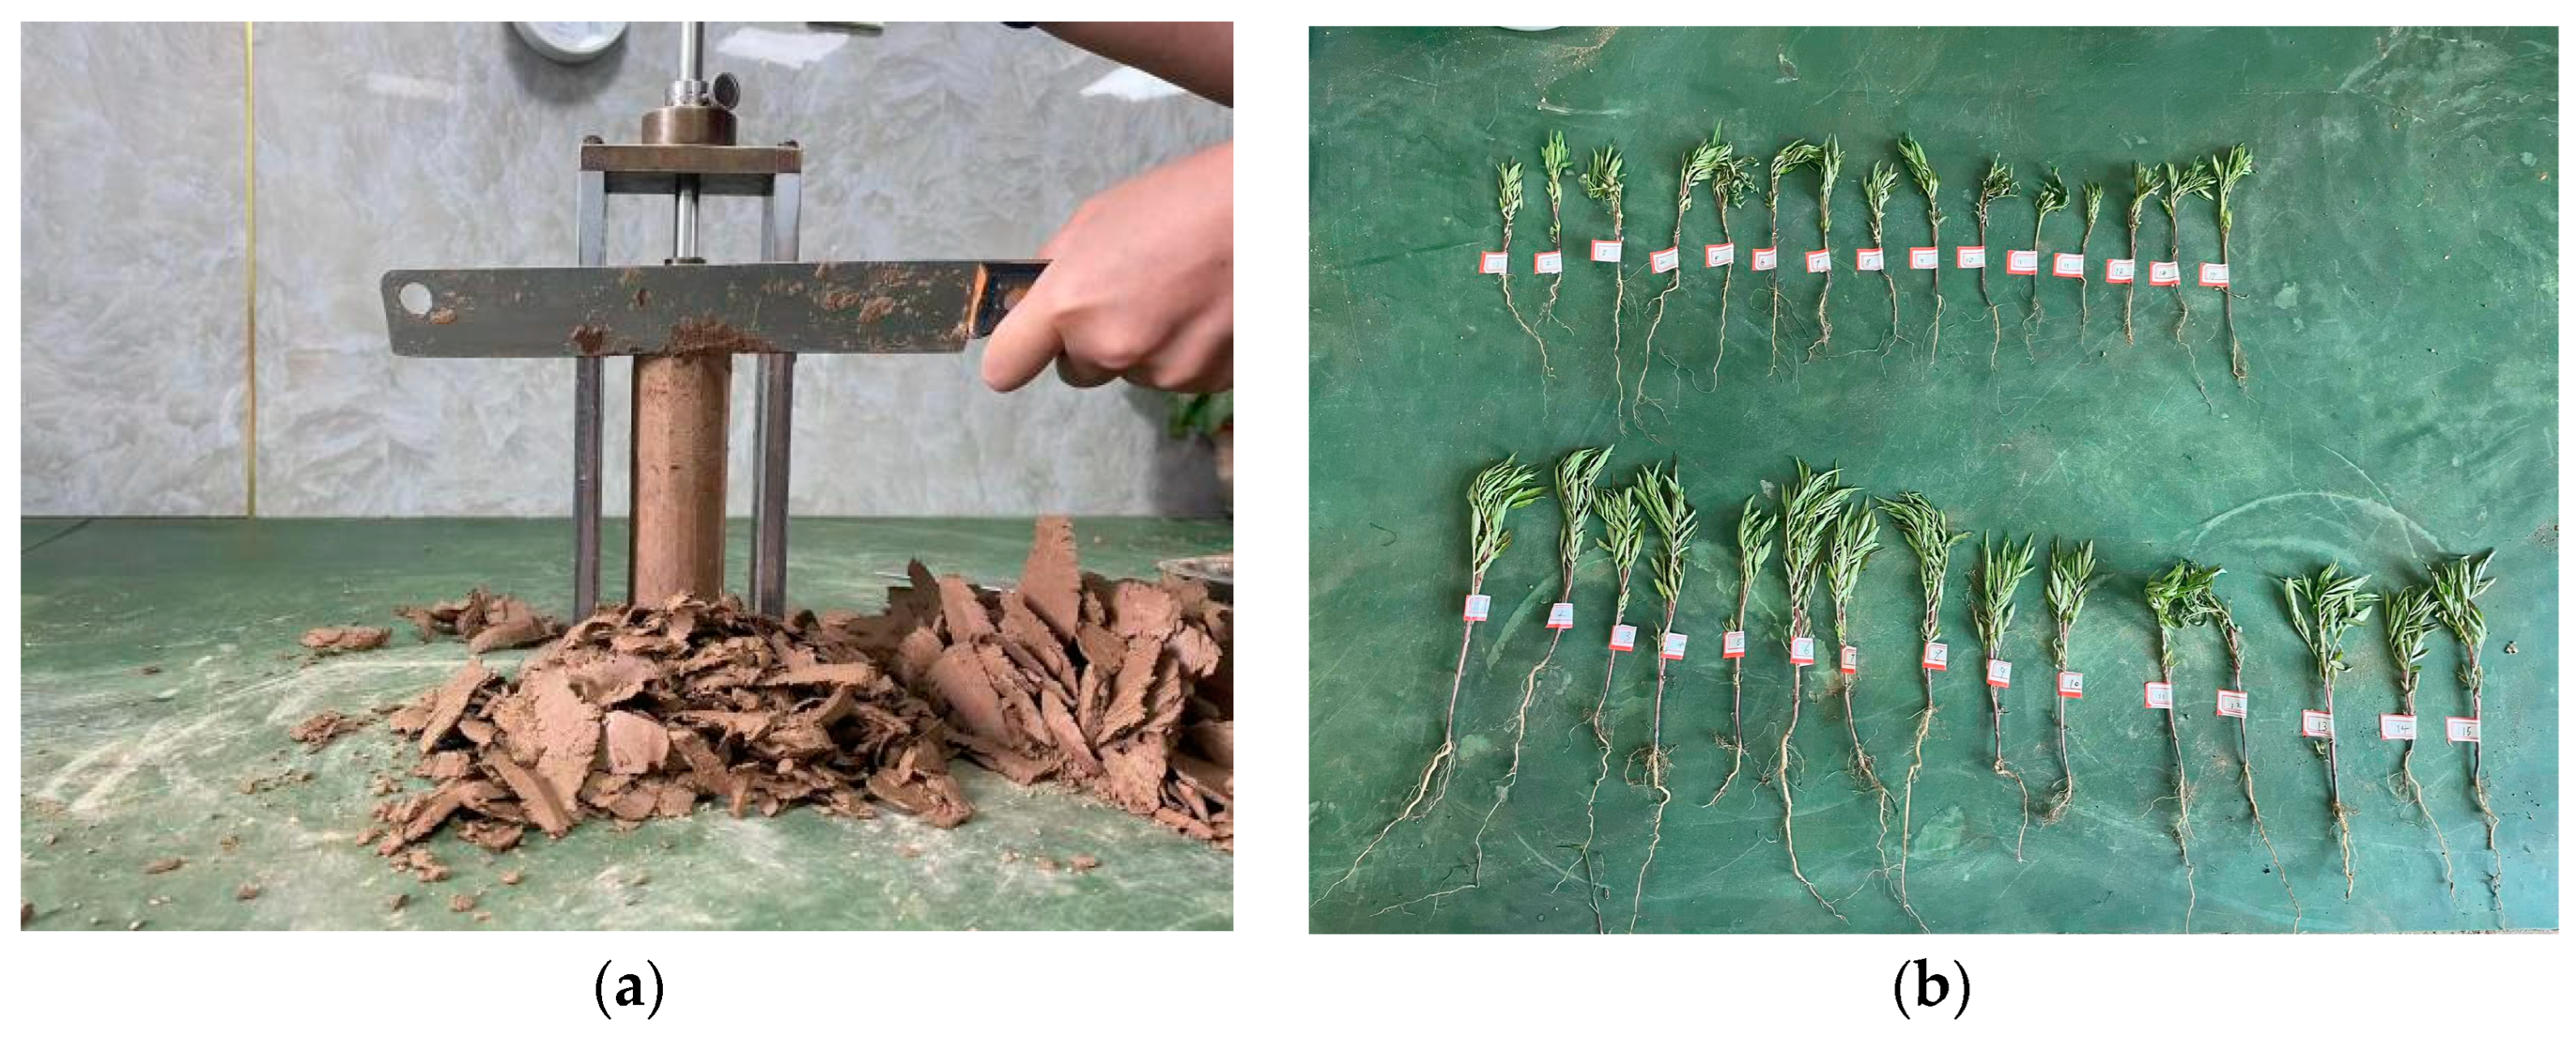
Undisturbed soil samples were collected from a uniformly vegetated, gently sloping area within the experimental site. Sampling focused on the top 0.8 m below ground level. The surrounding soil was carefully excavated to the required depth. The soil was then shaped into 20 cm cubic blocks using a wire saw and cutting knife. These samples were airtight–sealed in cling film and transported to the geotechnical testing center. The sample preparation of USRS samples followed the “Standard Methods for Geotechnical Testing” and “Specifications for Highway Geotechnical Testing” guidelines. The soil blocks were trimmed with a cutting knife to form standardized samples, 80 mm and 39.1 mm in height and diameter respectively. The sample preparation and plant samples are shown in
Figure 3.
2.4. Experimental Design
Tagetes erecta, a herbaceous plant with a shallow root system, was selected to determine the shear strength indexes of undisturbed soil with a root system (USRS) and rootless undisturbed soil (RUS). USRS samples were acquired at distinct depths while preserving their natural structure and MC. The sampling depths and corresponding MC were: 0–20 cm (16.7%), 20–40 cm (23.4%), and 40–60 cm (28.6%). Each depth yielded twenty soil samples. Undrained triaxial shear tests were performed under three levels of confining pressure: 50, 100, and 200 kPa, utilizing the consolidated undrained method at a shear rate of 0.08 mm/min.
The chosen
Tagetes erecta variant had a relatively lengthy primary root measuring 10–20 cm, while lateral roots were shorter, mostly 8–10 cm. The mass root ratio of each sample was determined using the mass percentage method. The clayey silt sample parameters and indicators are detailed in
Table 1. Four representative samples were used per group in the experiment. Each type of RC retains three similar RC data for subsequent correlation analysis. Upon completing all tests, the triaxial shear results of undisturbed root–containing soil were compared and analyzed under equivalent confining pressures and RC conditions. When there is a peak in the strain–stress curve, name the failure deviation stress
as the deviation stress corresponding to the peak. However, if the testing curve exhibits continuous hardening and does not have a peak, the deviatoric stress corresponding to 15% of the axial strain value was used as
.
2.5. Shear Strength Expression of the Soil–Root Composite
The soil shear strength is not constant; rather it increases with increasing normal stress σ on the shear moving surface. Coulomb summarized the failure phenomena and the influencing factors of soil, and proposed the shear strength calculation formula as:
where
is the shear stress on the shear sliding plane (kPa),
is the frictional strength (kPa),
is the internal friction angle (°), and
is the cohesion (kPa).
Based on reinforced soil principles, domestic scholars have analyzed the stressed state of the herbaceous plant soil–root composite, by treating the plant root distribution in the soil as a three–dimensional distribution of reinforcing fibers. The reinforcement process provides additional cohesion
to the soil. Furthermore, the wrapping effect of the root–system restricts the lateral deformation of the soil, thereby effectively improving the bearing capacity of the slope soil [
35,
36]. Here, the soil shear strength of the soil is expressed as:
where
is the additional cohesion (kPa),
is the tensile stress on roots (N),
is the contact area between a single root and the surrounding soil (m
2),
is the angle between the shearing direction and the root (°),
is the original angle (°) between the shearing plane and the root (°), and
is the shear deformation ratio.
In contrast, foreign scholars believe that the cohesion of the soil–root composite is collectively borne by the internal particles of the soil and the constraints between the root and the soil. The shear strength index of the soil–root composite is defined as the combination of the comprehensive
and the comprehensive
. The total cohesion is the sum of the cohesion due to roots and the soil’s own cohesion [
26,
37]:
where
is the comprehensive cohesion (kPa),
is the cohesion due to roots (kPa), and
is the soil cohesion (kPa).
2.6. Data processing and visualization
The Hmisc package in the R software was used for correlation and significance analysis, and a non–parametric Wilcox test and multiple linear regression models were implemented in R software. The visualization of the correlation analysis results and the significance tests were performed using the corrplot package and ggpubr package in R software, respectively. We used the MIDAS GTS geotechnical and tunnel finite element analysis software to simulate different parameters and working conditions. The Mohr–Coulomb was used to simulate the soil behavior.
3. Results
3.1. Stress-Strain Relationship of USRS
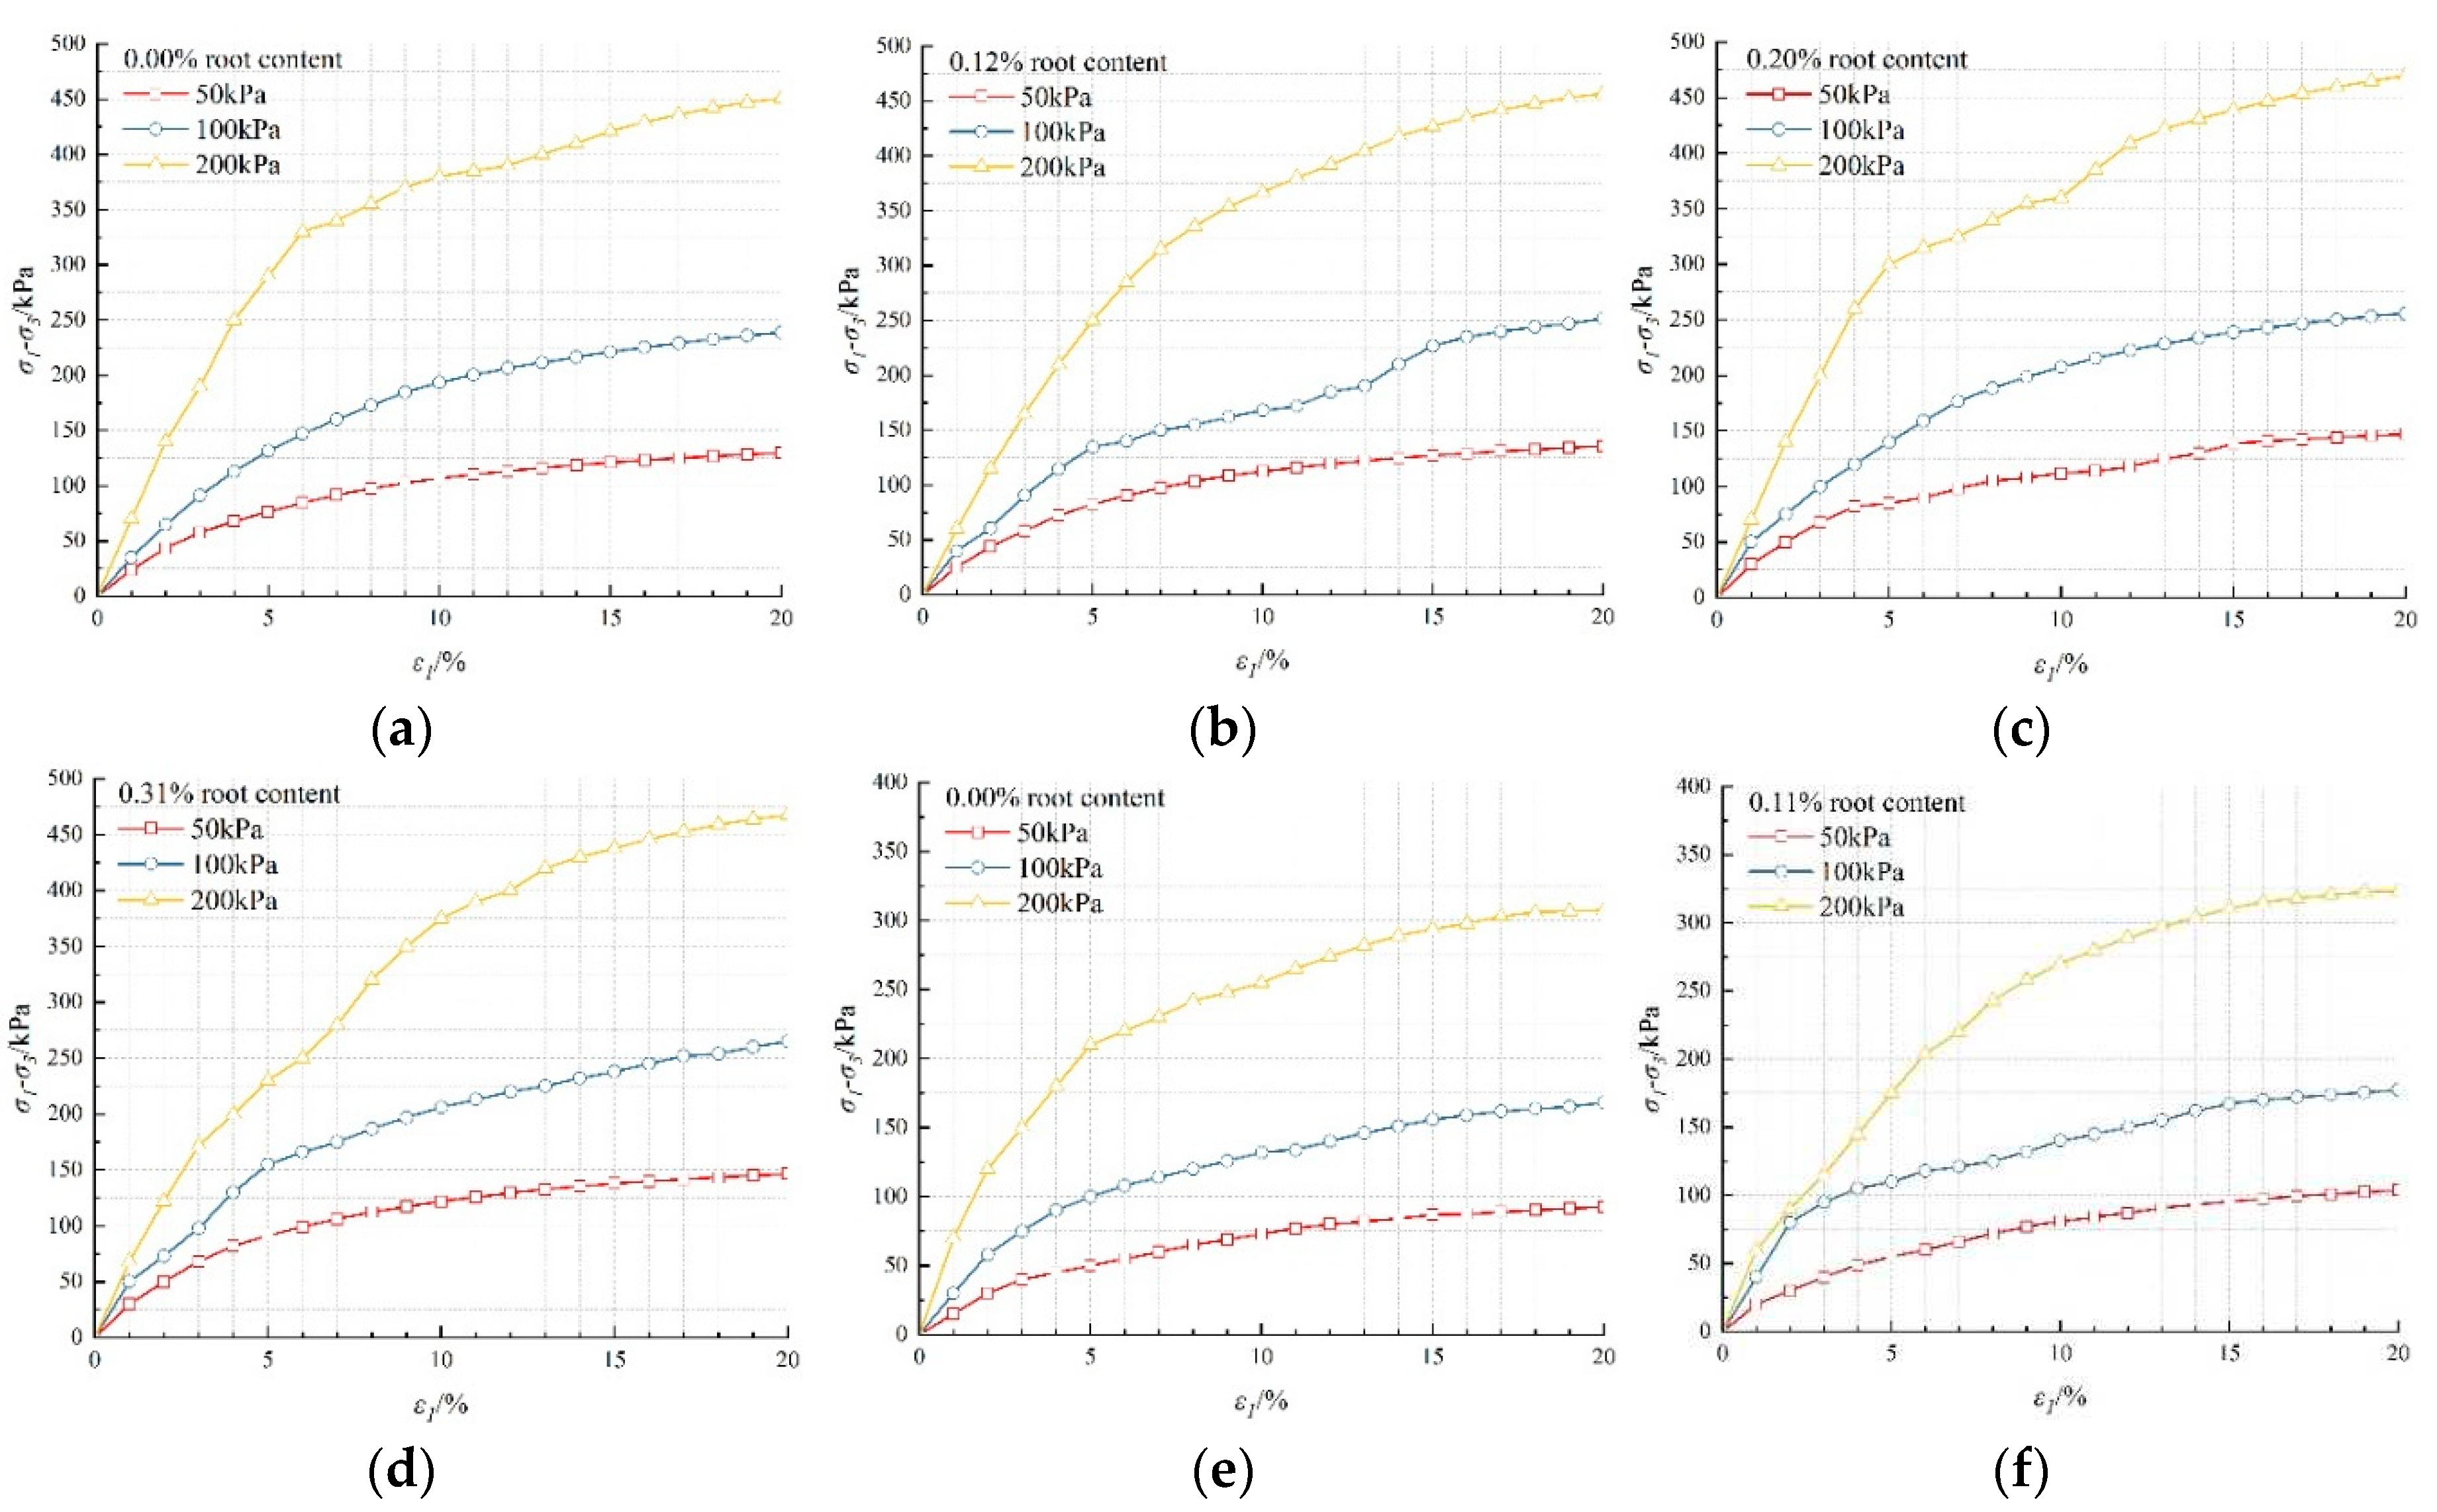
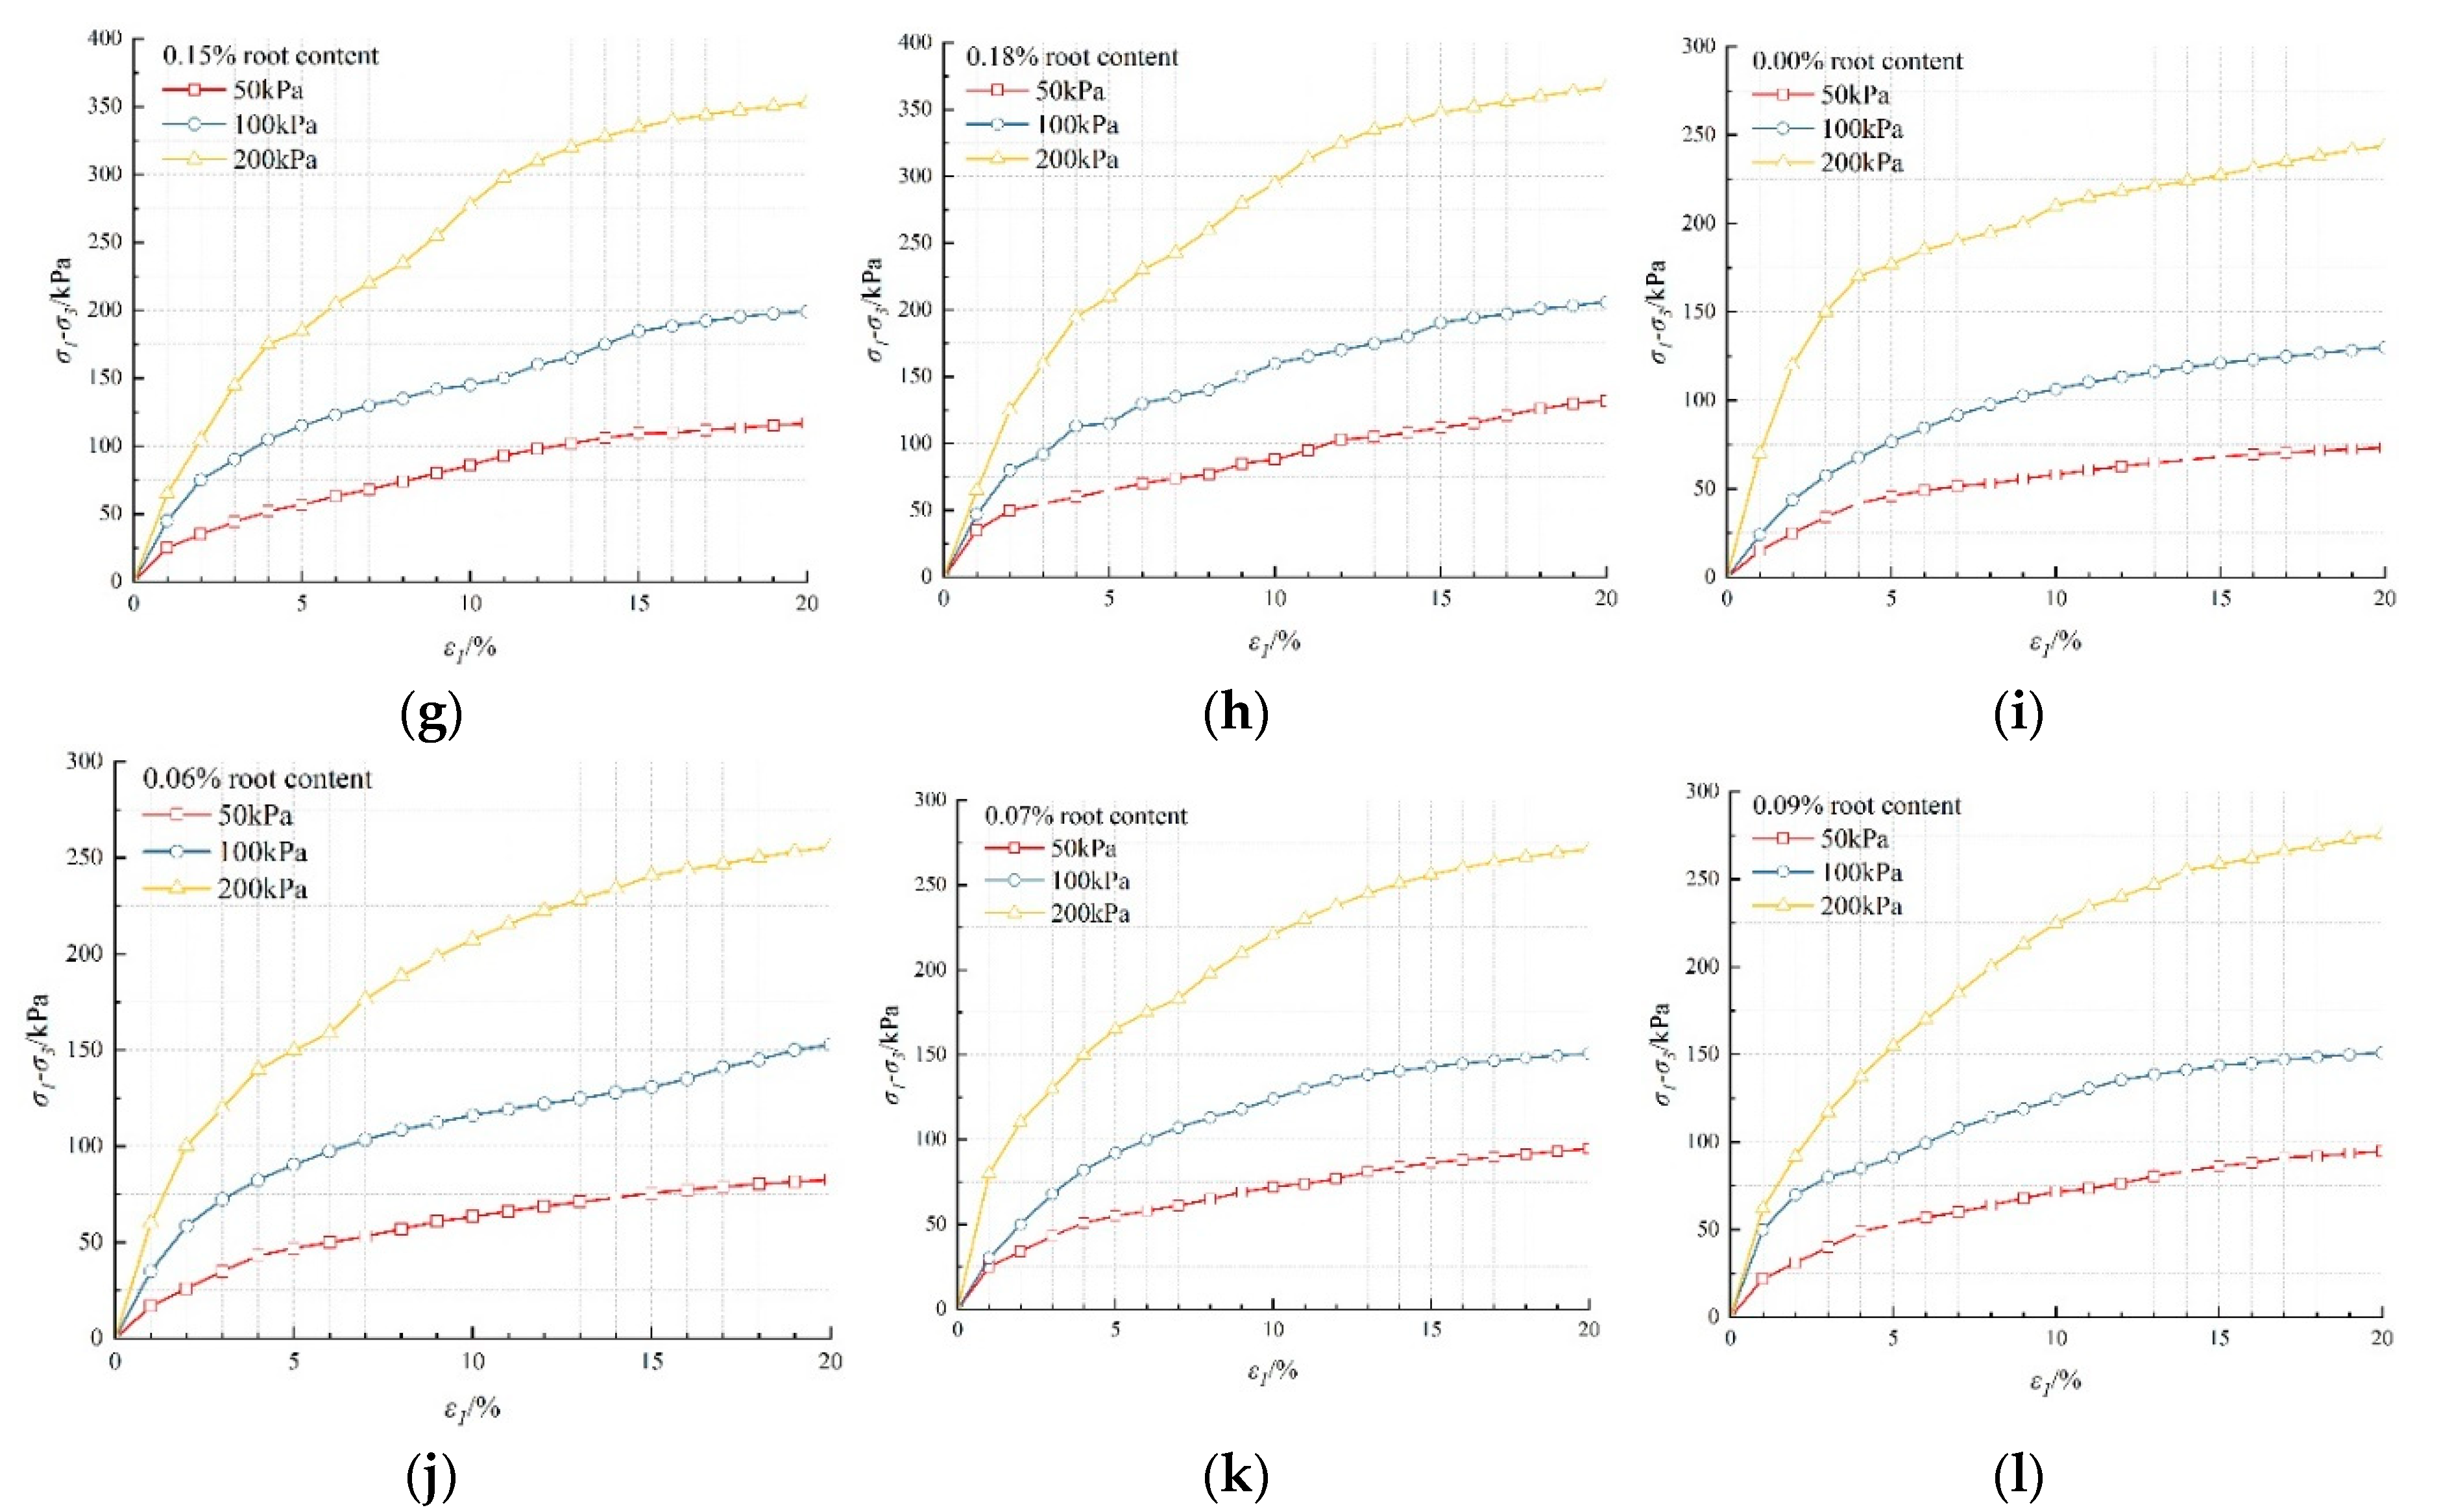
The stress–strain curves of RUS with different depths, MC, and RC, and USRS are shown in
Figure 4.
Figure 4 illustrates intriguing parallels in stress–strain relationships across three groups: USRS and RUS, both exhibiting strain hardening characteristics. The insights gathered highlight the following: 1) Axial strain nonlinearly surges with increasing differential principal stresses (deviator stress). 2) As the axial strain remains constant, deviator stress increases in tandem with increasing confining pressure. 3) Decreasing confining pressure results in a flatter stress–strain curve, while increased confining pressure steepens it. 4) Interestingly, USRS demonstrates a lower deviator stress increase in comparison to rootless soil samples as axial strain increases.
3.2. Strength Characteristics of USRS
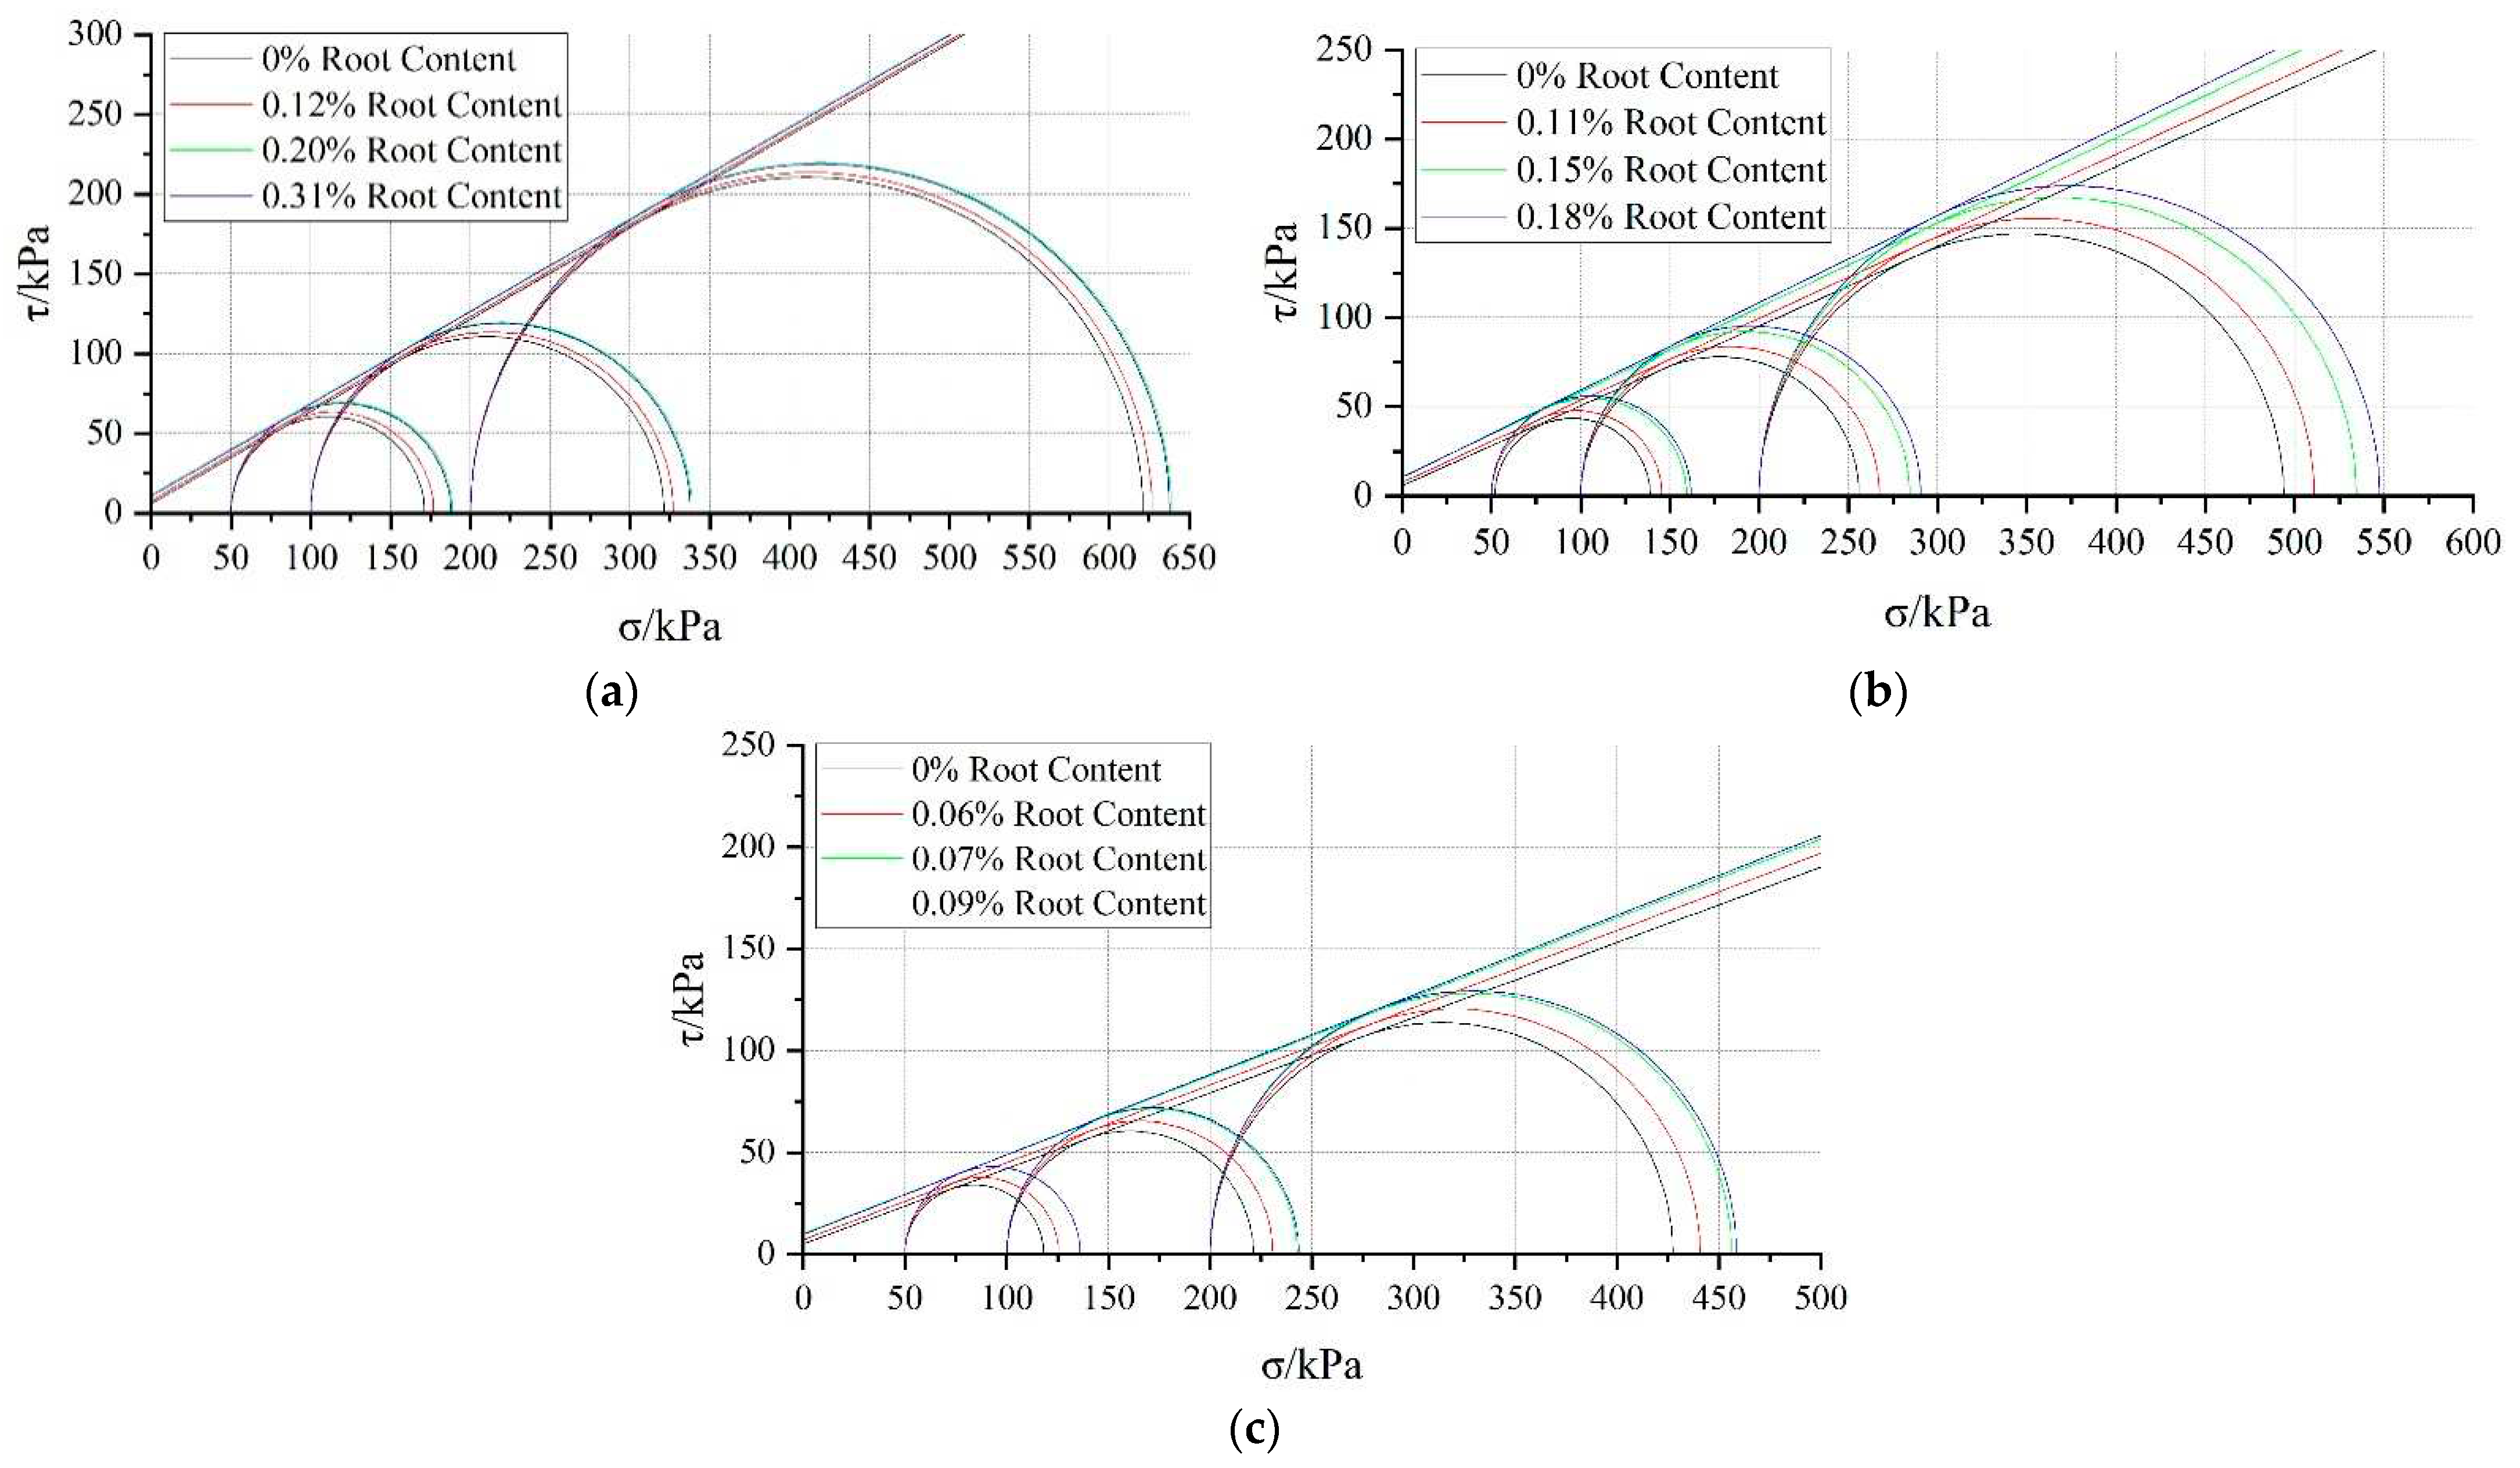
Upon examining the stress–strain relationship in
Figure 4 and leveraging the Mohr–Coulomb strength theory, the shear strength tangents were plotted, as shown in
Figure 5. The specifics of USRS’s shear strength index and deviator stress at failure under varying MCs are shown in
Table 2.
According to
Figure 5, the shear strength tangents of root–contained undisturbed soil are very close for the three different MC levels when the RC stands at 0.20% and 0.31%, 0.15% and 0.18%, and 0.07% and 0.09%, respectively. Therefore, under the same stress conditions, the shear strength of root–containing undisturbed soil increases with the increasing RC. However, an intriguing shift occurs when RC surpasses the thresholds of 0.31%, 0.18%, and 0.09%, respectively, the shear strength of the soil–root composite stabilizes.
From
Table 2, it can be observed that the shear strength index of RUS decreases gradually with increasing MC. The shear strength index of root–composite soil is closely related to the MC and RC, with the cohesion and its additional increment increasing initially and then decreasing with an increase in RC under the same MC. However, the internal friction angle gradually decreases with increasing MC and gradually increases with increasing RC. Under the same MC and RC, the shear resistance of the soil–root composite increases with increasing confining pressure. Under the same MC, the shear strength of the soil–root composite gradually increases with increasing RC. The increase in soil MC leads to a decrease in the shear strength of the soil–root composite.
3.3. Significance and correlation analysis of shear resistance indicators and influencing factors
3.3.1. Significance analysis of shear resistance indicators and influencing factors
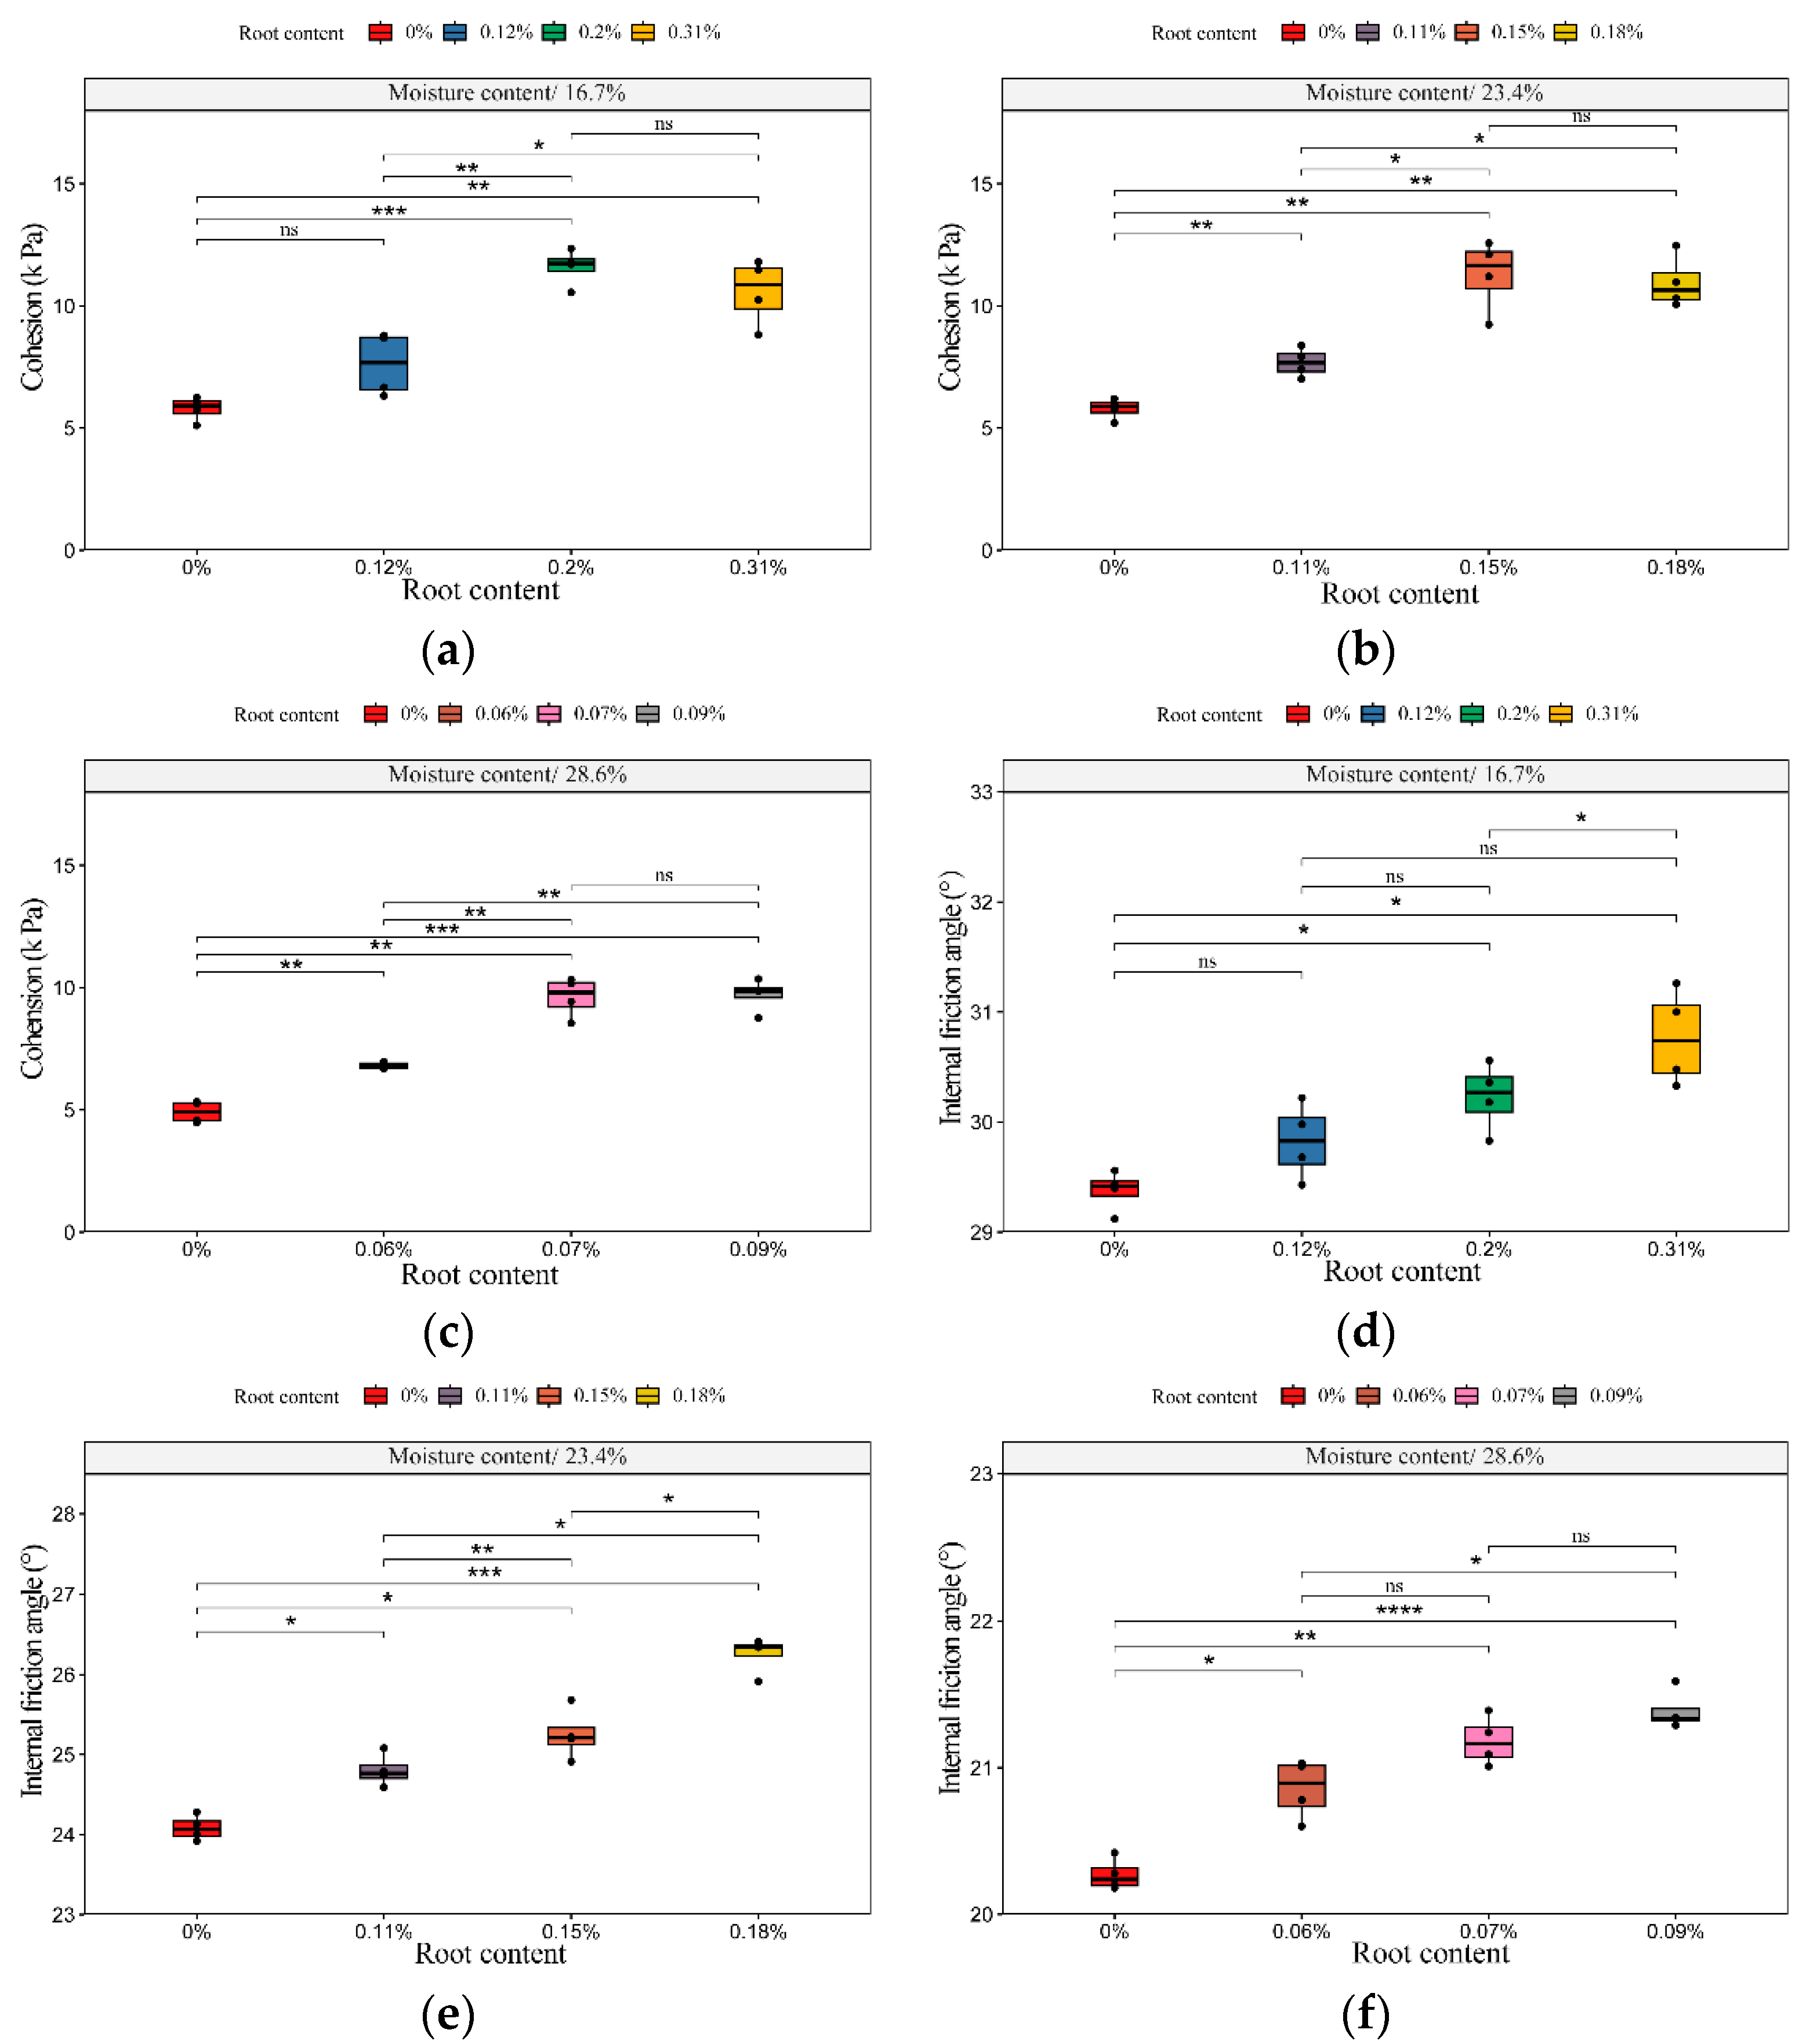
The results of the influence of different RCs on the shear strength index of undisturbed soil for different MCs (root burial depth) are shown in
Figure 6.
Figure 6 (a) shows that the cohesion of undisturbed soil is the highest for an RC of 0.2%, followed by 0.31% and 0.12%. The correlation between the cohesion of RUS and undisturbed soil is highly significant for RCs of 0.2% and 0.31% and not significant for an RC of 0.12%. The correlation between the cohesion of undisturbed soil with RCs of 0.12% and 0.2% is highly significant, while the correlation between the cohesion of undisturbed soil with RCs of 0.12% and 0.31% is very significant. The correlation between the cohesion of undisturbed soil with RCs of 0.2% and 0.31% is statistically insignificant. At the same MC, the median value increases as the RC increases, and decreases slightly when the RC reaches 0.31%. it decreases slightly. The same trend in cohesion is observed at other levels. The cohesive force exhibits a slow downward trend with an increase in the MC and root burial depth.
As shown in
Figure 6 (f), the internal friction angle of undisturbed soil is the highest at an RC of 0.09% RC, followed by 0.07% and 0.06% RC. The RUS has the lowest, the internal friction angle. The correlation between the internal friction angle of RUS and undisturbed soil is highly significant for RCs of 0.07% and 0.09%. The correlation between the internal friction angle of RUS and USRS with an RC of 0.06% is significant. The correlation between the internal friction angle of USRS with RCs of 0.06% and 0.09% is statistically significant, whereas that for RCs of 0.06% and 0.07% and RCs of 0.07% and 0.09% is statistically insignificant. At the same MC, the median value increases as the RC increases, indicating a continuous increase in the internal friction angle. As the MC and root burial depth increase, the internal friction angle shows a significant downward trend. This trend, is significantly different from the cohesion trend.
The results indicate that other analyses than a significance test are required to determine the factors influencing the shear strength index.
3.3.2. Correlation analysis between shear resistance indicators and influencing factors
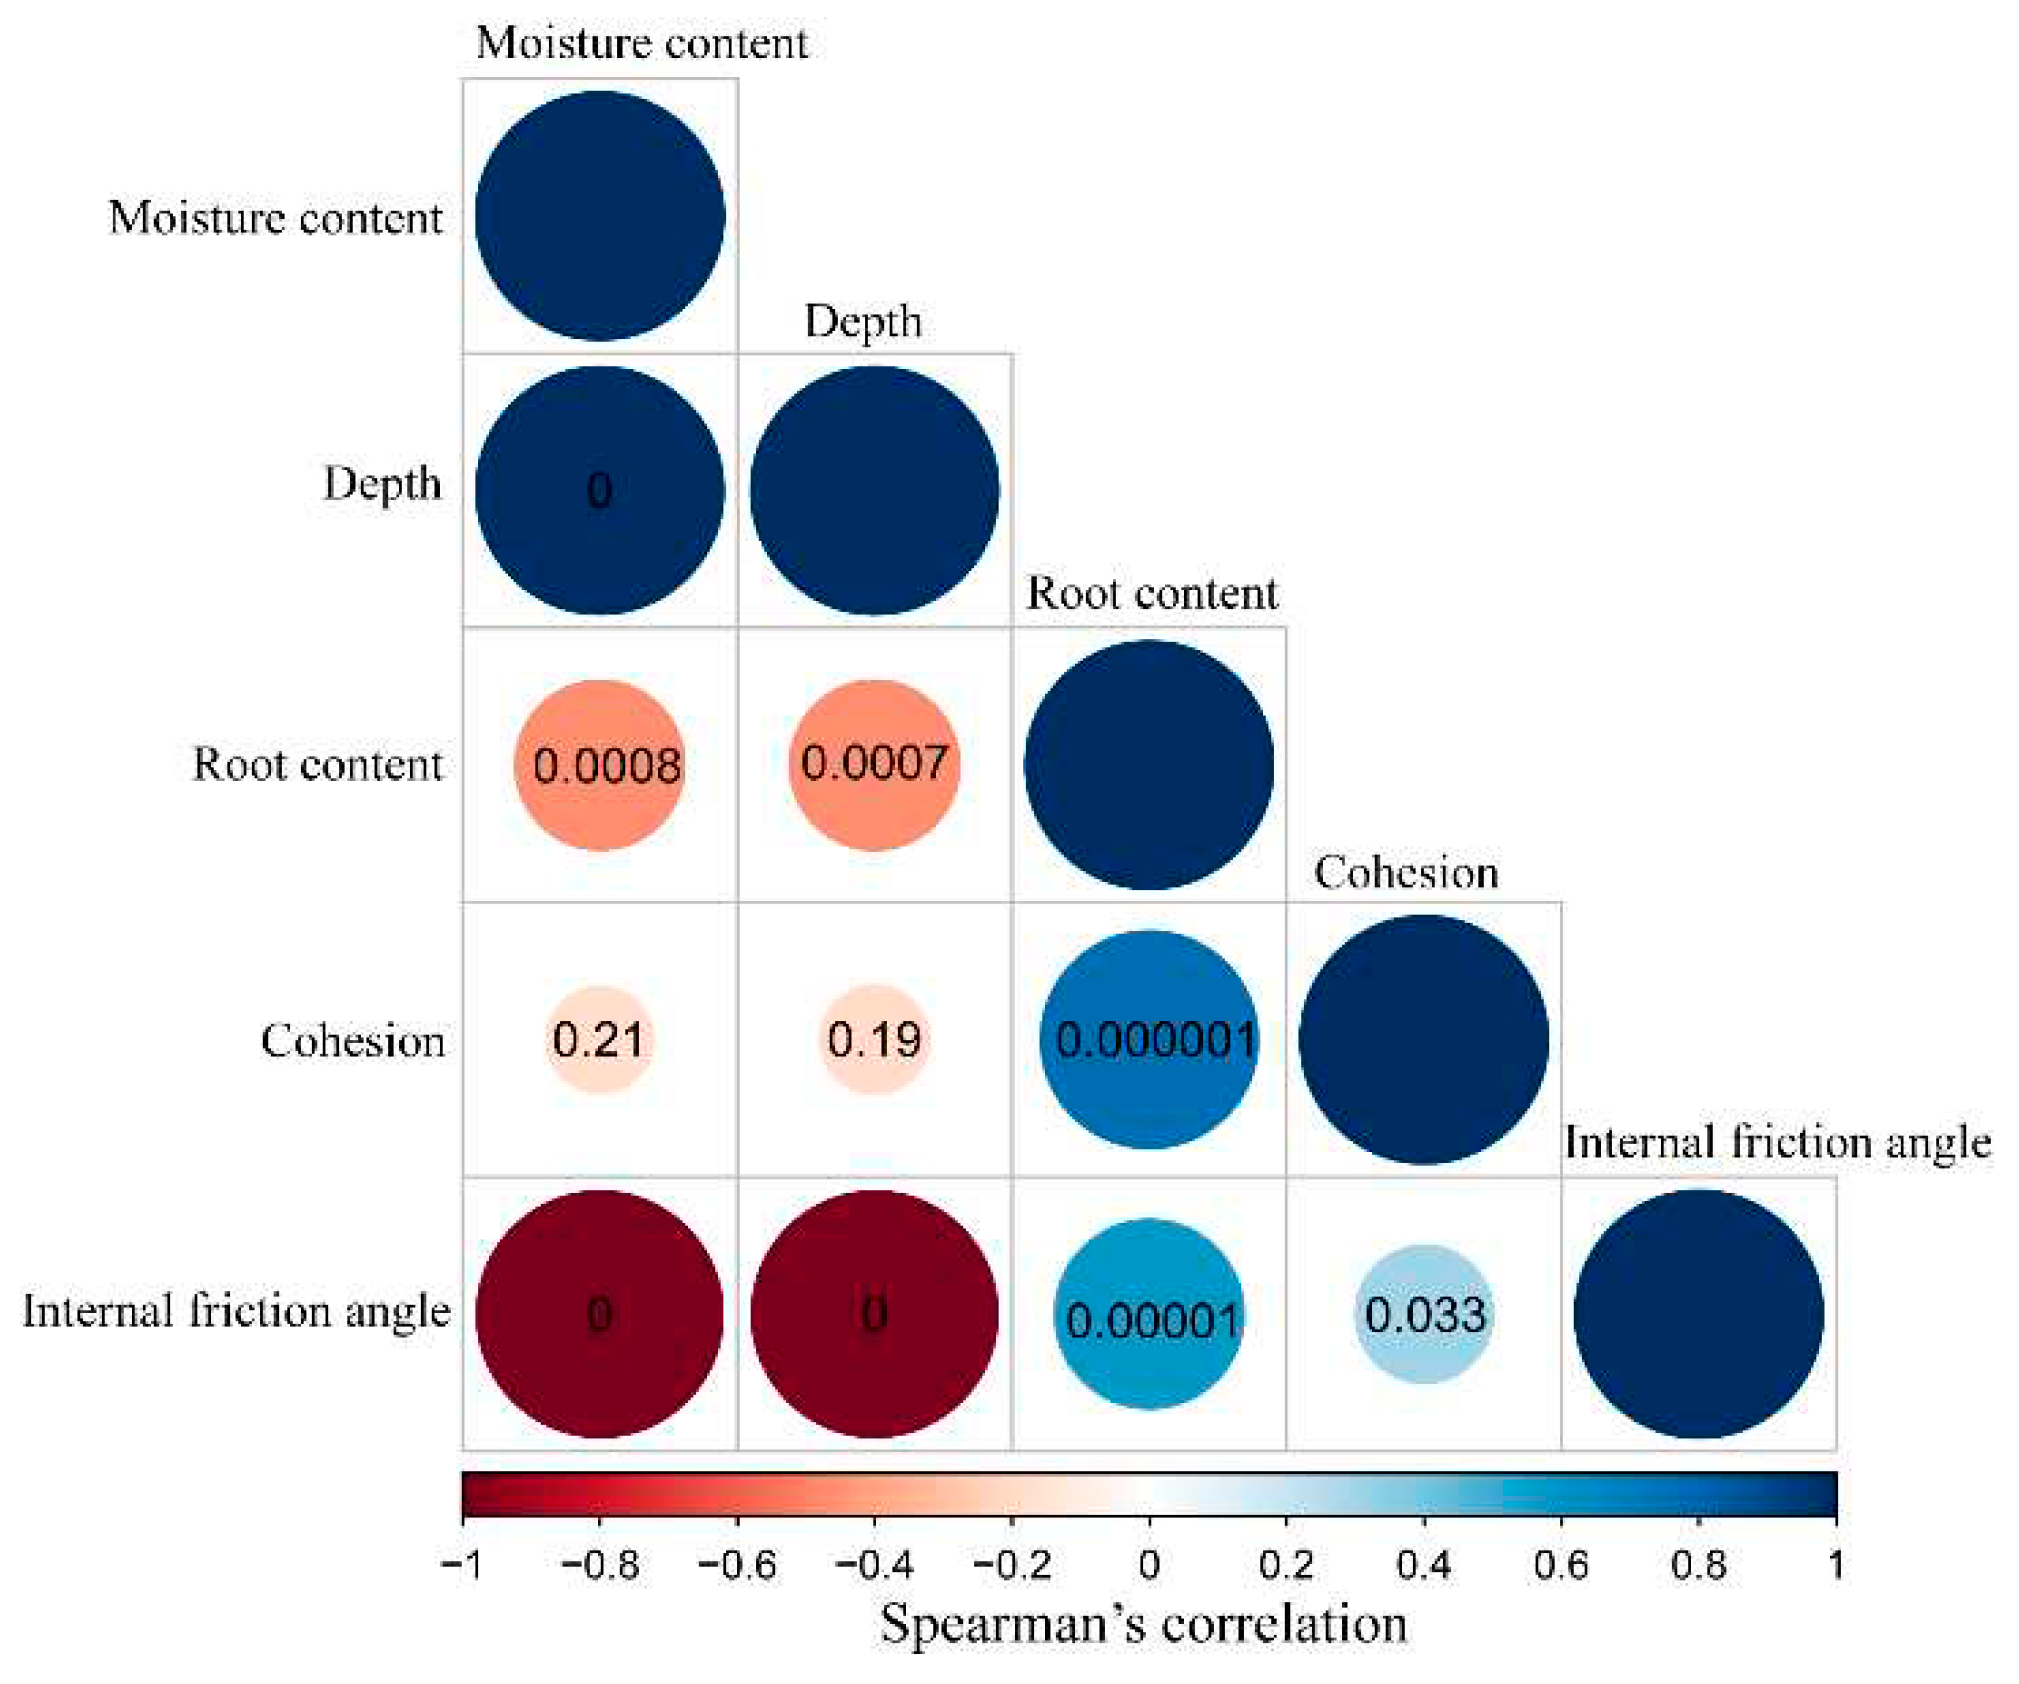
The correlation analysis results between the shear indicators and influencing factors are shown in
Figure 7. The MC shows a strong positive correlation with the root burial depth (p = 0), and the MC and root burial depth show a strong negative correlation with the internal friction angle (p = 0). The MC and root burial depth show a low negative correlation with the cohesion (p > 0.1), and the MC and root burial depth show a significant negative correlation with the RC (p < 0.001). The RC shows a strong positive correlation with the cohesion and the internal friction angle (p ≤ 0.00001). The cohesion shows a weak positive correlation with the internal friction angle (0.01 < p < 0.05).
The three key parameters affecting the shear strength of USRS are RC, MC, and root burial depth. A high MC promotes a deeper root system, and the RC decreases with an increase in soil depth. The reinforcement performance of the soil decreases with increasing depth. As the cohesion decreases, the rate of decrease in the internal friction angle increases. A positive correlation exists between the RC and the shear strength indicators for shallow soil with a high RC. This type of soil has high slope stability. Due to the strong positive correlation between the MC and the root burial depth, as well as the same correlation trend with other influencing factors, one of the parameters is chosen for the subsequent analysis.
3.3.3. Multiple linear regression analysis results
Linear models I and II were established with RC and MC as independent variables and the cohesion or internal friction angle of undisturbed soil as dependent variables. The results are listed in
Table 3. The equations for linear models I and II are
y1=2349.511 ·
x1+11.038 ·
x2+3.474 and
y2=657.5393 ·
x1-70.9555 ·
x2+40.8992, respectively, where x
1 denotes RC and x
2 denotes MC. The p–value indicates that the RC significantly affects the cohesion of undisturbed soil, whereas the influence of MC is relatively small. The influence of the MC on the internal friction angle of undisturbed soil is significant, whereas that of the RC is relatively small.
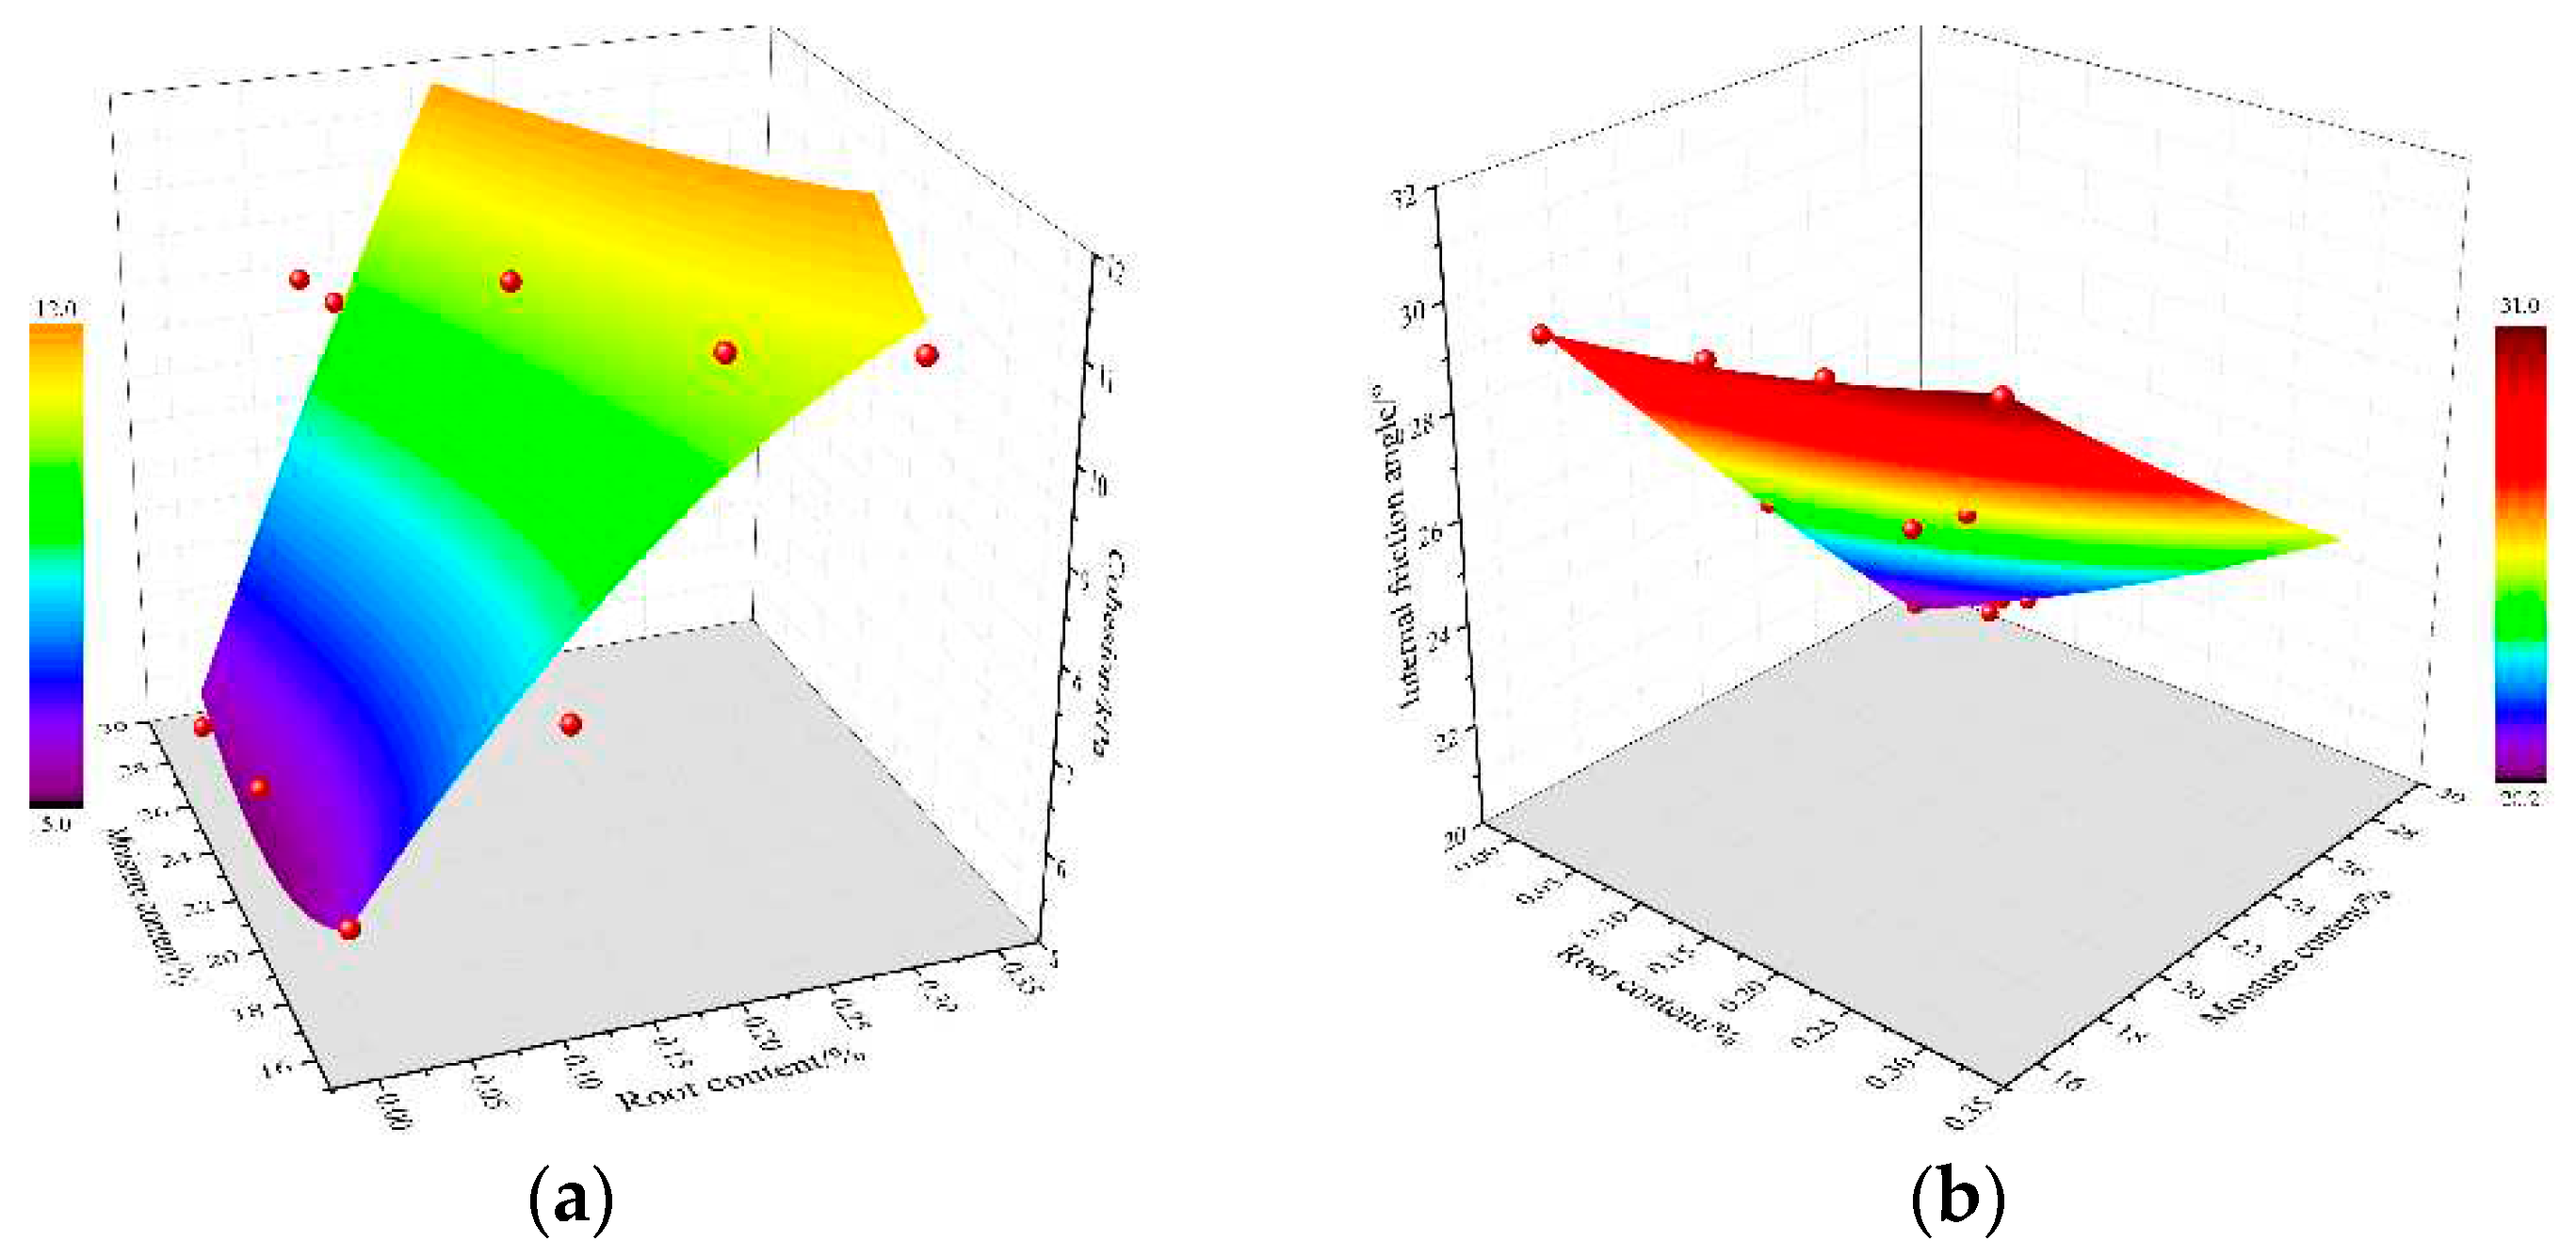
3.3.4.3. D Correlation Between Shear Strength Parameters with RC and MC
The 3D relationship between USRS with different RCs and MCs is indicated in
Figure 8. The surface–fitting results of the correlation data in
Figure 8 are presented in
Table 4. The internal friction angle or cohesion was evaluated using the equation
Y =
Z +
A·
r +
B·
w +
C·
r2 +
D·
w2 +
E·
r·
w, where
r represents RC,
w represents MC, and
Y represents internal friction angle or cohesion. The goodness of fit for the relationship of the shear strength index with RC and MC was
R2 > 0.83 and
R2 > 0.99, respectively, indicating a high level of reliability in the fitting results. RC played a major role in cohesion, whereas MC played a major role in internal friction angle.
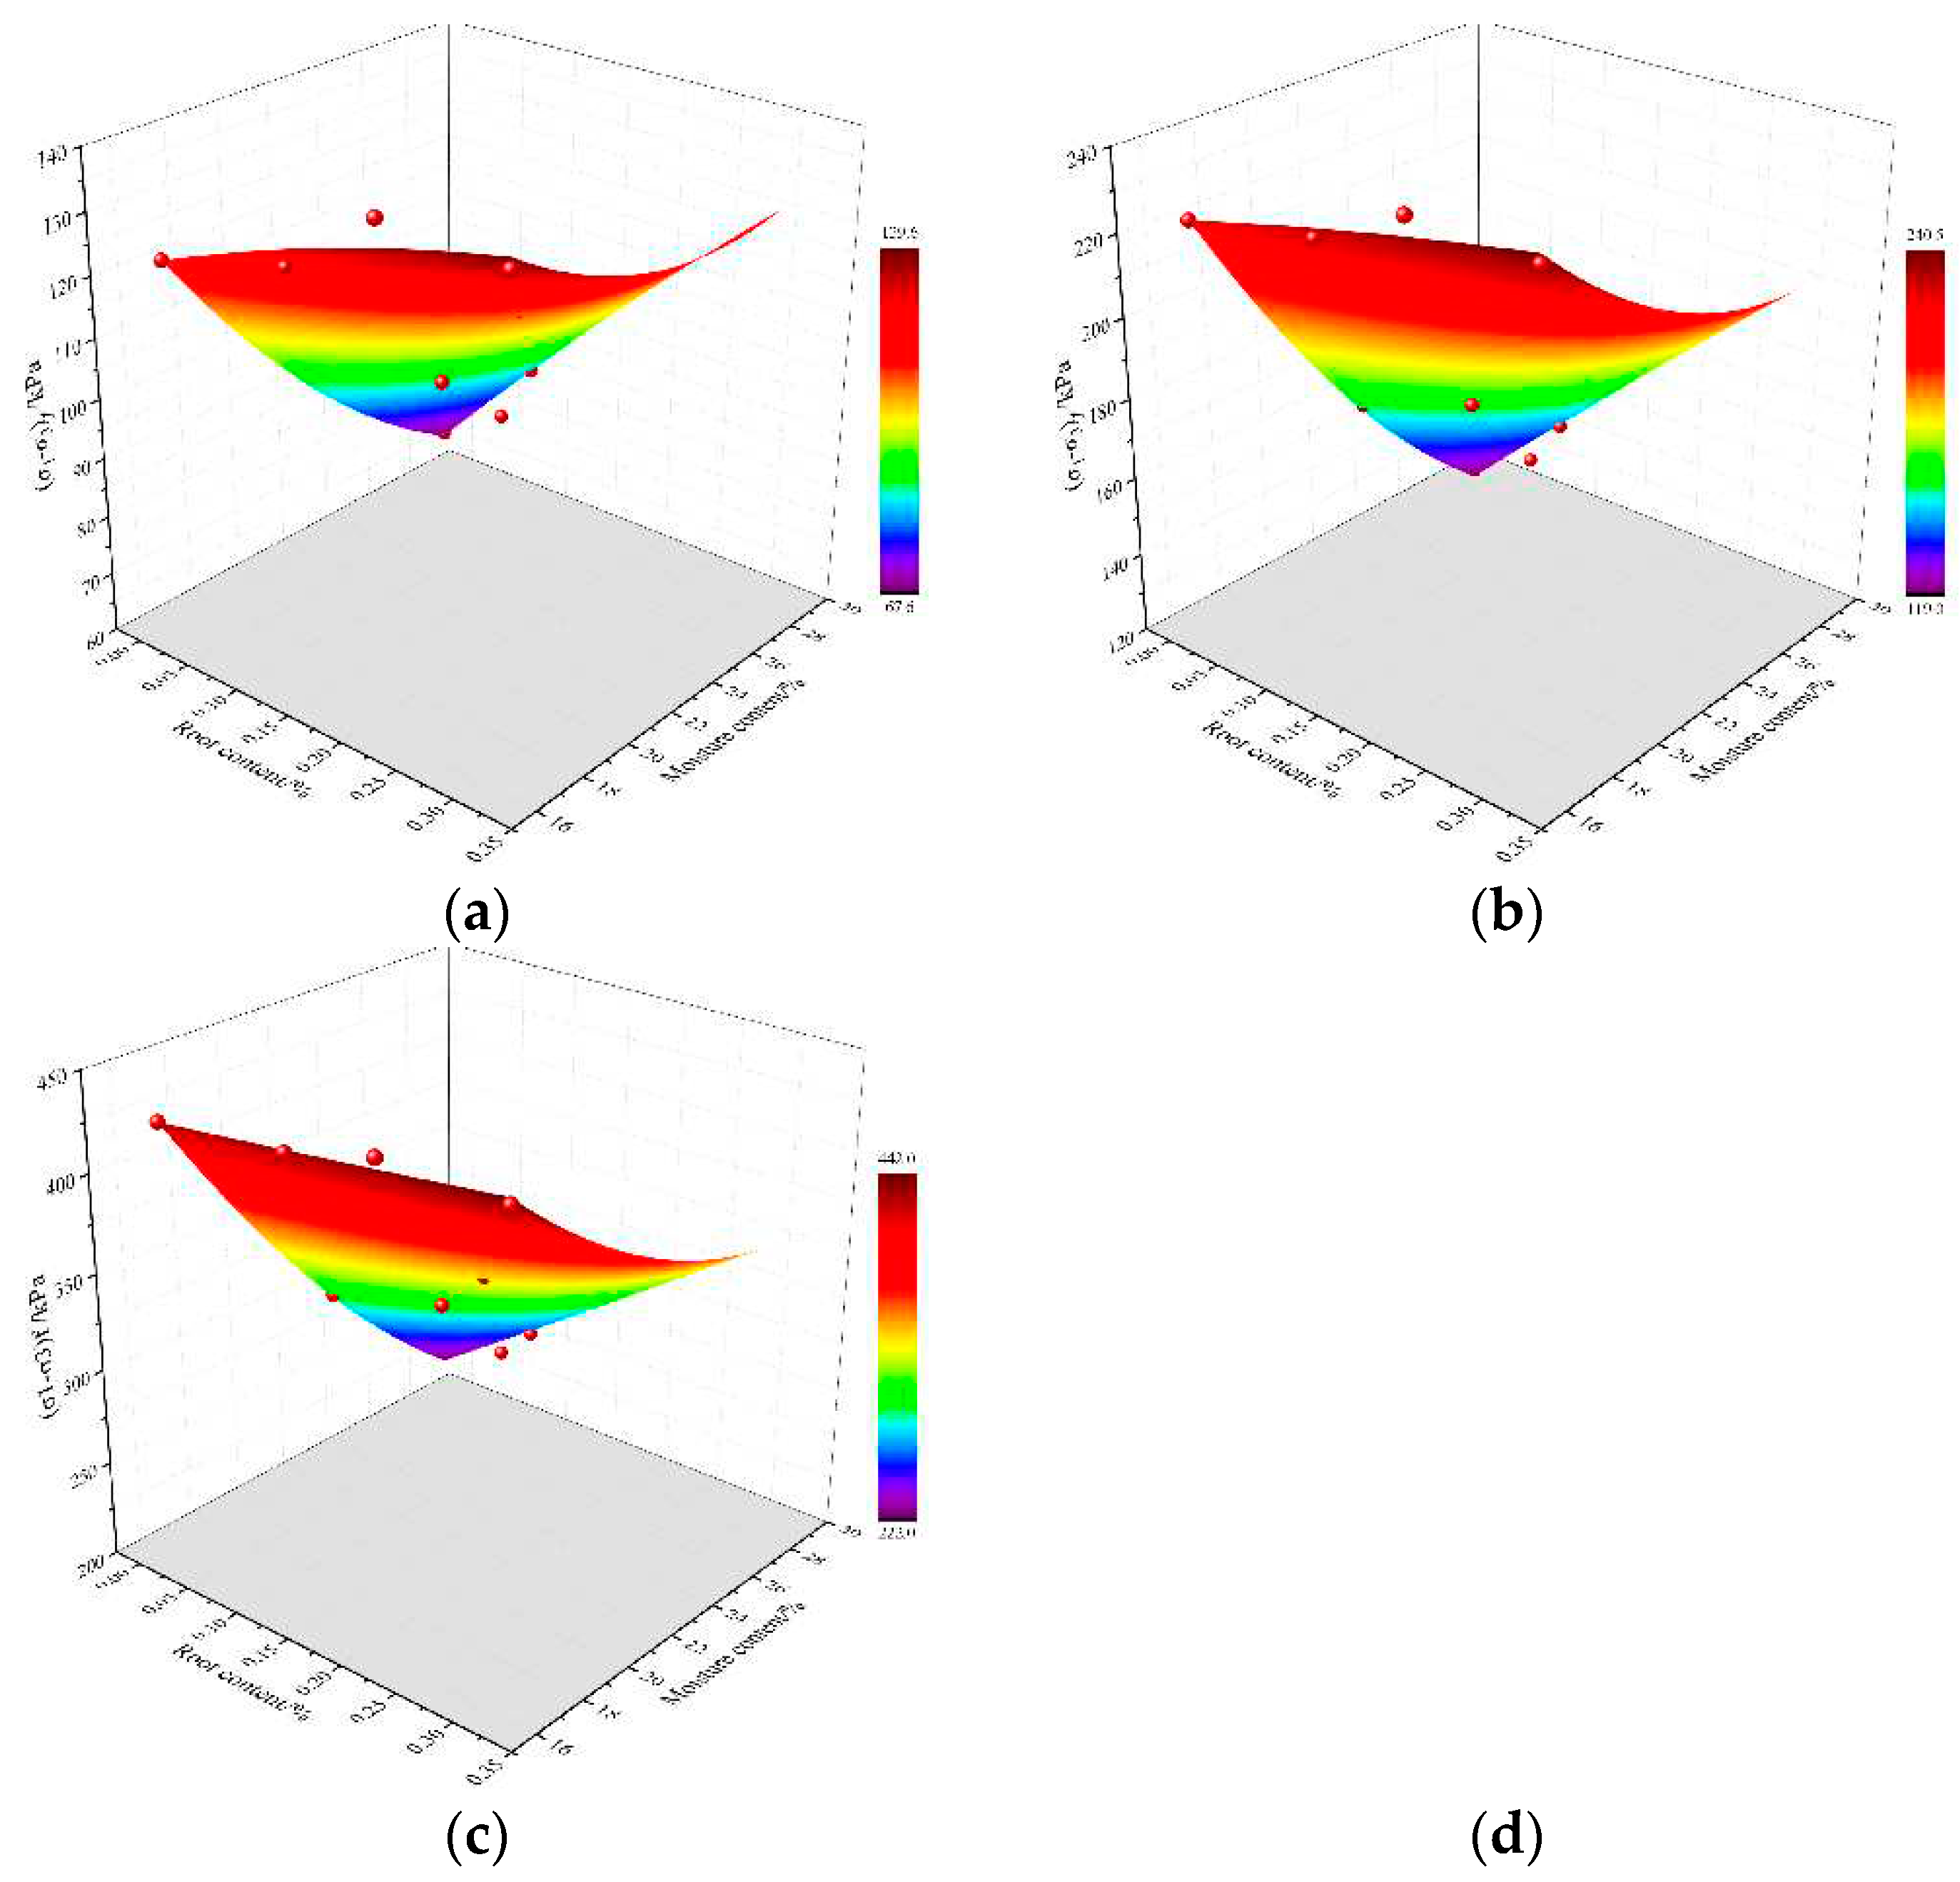
The relationship of the failure deviation stress of USRS with RC and MC under different confining pressure conditions is displayed in
Figure 9. The surface-fitting results of the correlation data in
Figure 9 are presented in
Table 5. The failure deviation stress was evaluated using the equation
Y = Z + A·r + B·w + C·r2 + D·w2 + E·r·w, where
r represents RC,
w represents MC, and
Y represents failure deviation stress.
The goodness of fit for the relationship between RC, MC, and failure deviation stress was R2 > 0.96, indicating a high level of reliability in the fitting results. The fitting degree approached 1 with an increase in the confining pressure, indicating that the effects of the increase in RC on deviating stress and decrease in MC on deviating stress were basically mutually offset.
3.4. Slope stability of plant roots
3.4.1. Slope conditions and geometric model
The strength reduction finite element method is commonly used to solve nonlinear problems in slope engineering, and the shear strength index is derived to obtain the safety coefficient of the slope. Numerical analysis of slope stability was conducted using 24 models with different working conditions for silty clay slopes with different RCs, root depths, and slopes. The simulation conditions are listed in
Table 6. The finite element model for calculating the slope in experimental area is shown in
Figure 10. The model has 8248 units and 418947 nodes. We applied horizontal displacement constraints to the left and right boundaries of the model, vertical constraints to the front and rear boundaries, and horizontal and vertical constraints to the bottom boundary. The parameter values of the slope soil were measured in the laboratory, with a MC of 16.9%, an elastic modulus of 25.23 MPa, a cohesive force of 5.2 kPa, an internal friction angle of 20.3°, a density of 1.85 kg/m
3, and a Poisson’s ratio of 0.3. The slope angles were 40°, 45°, and 50°.
3.4.2. Results for different working conditions
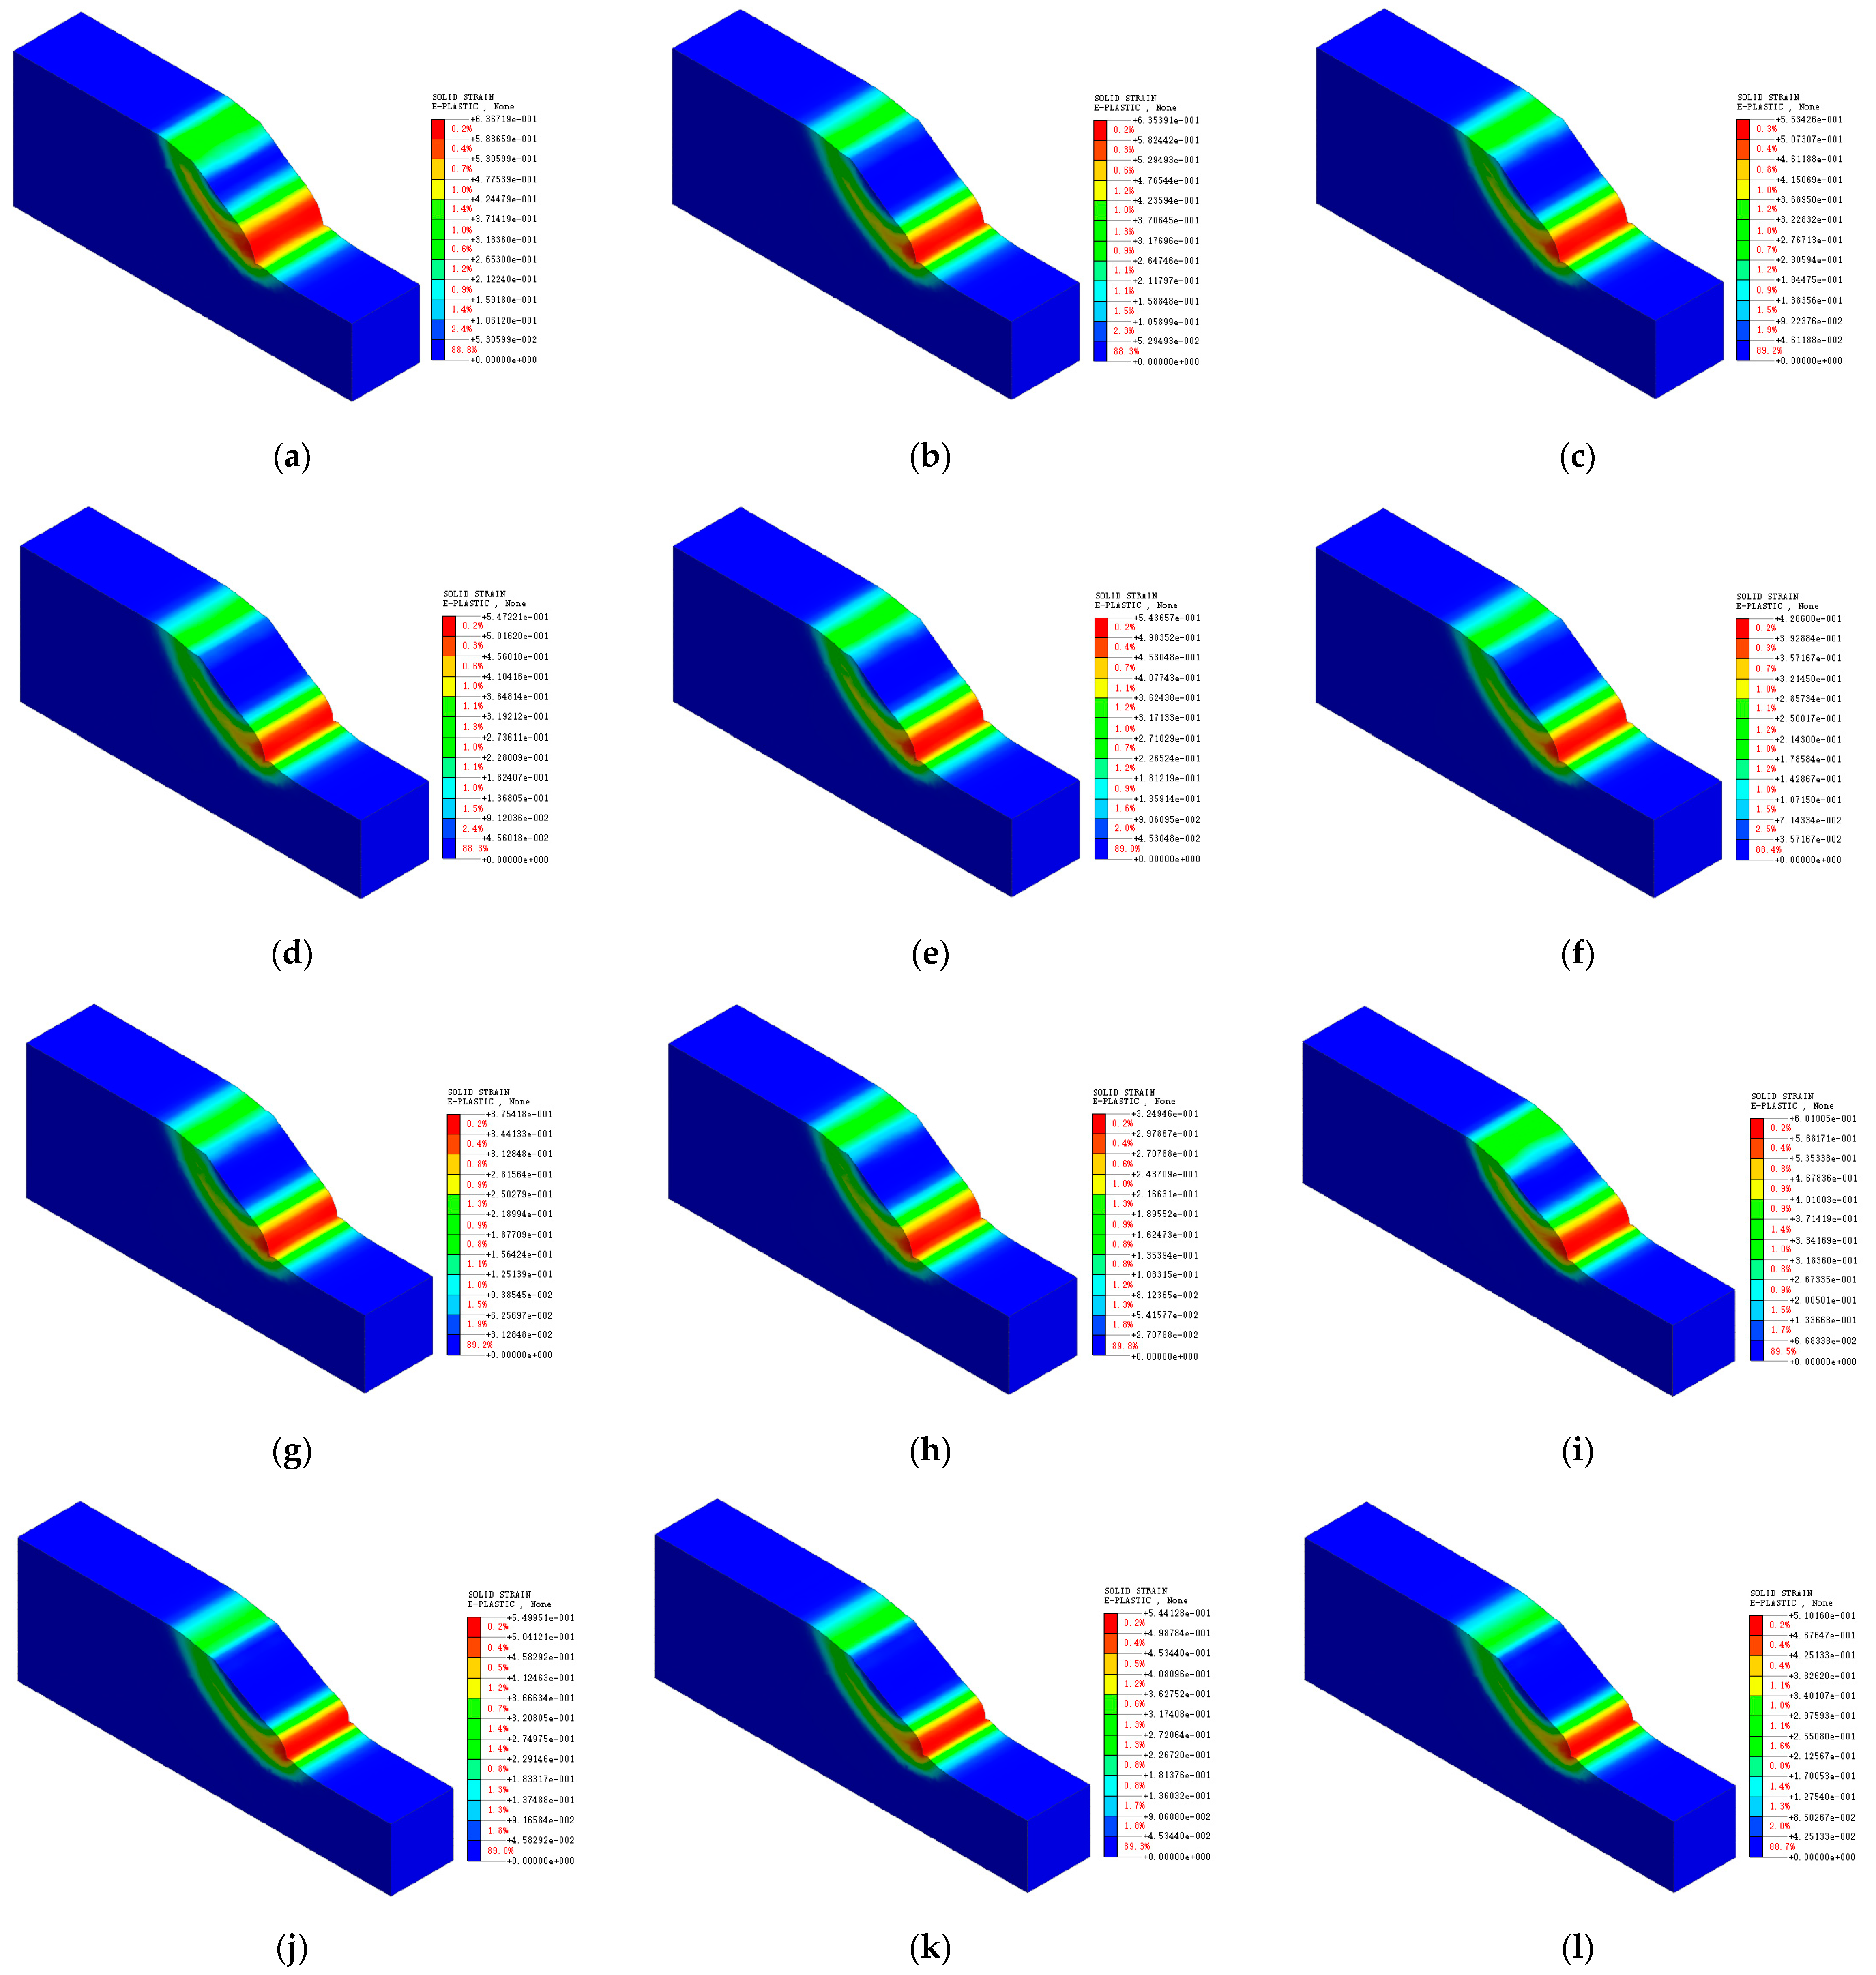
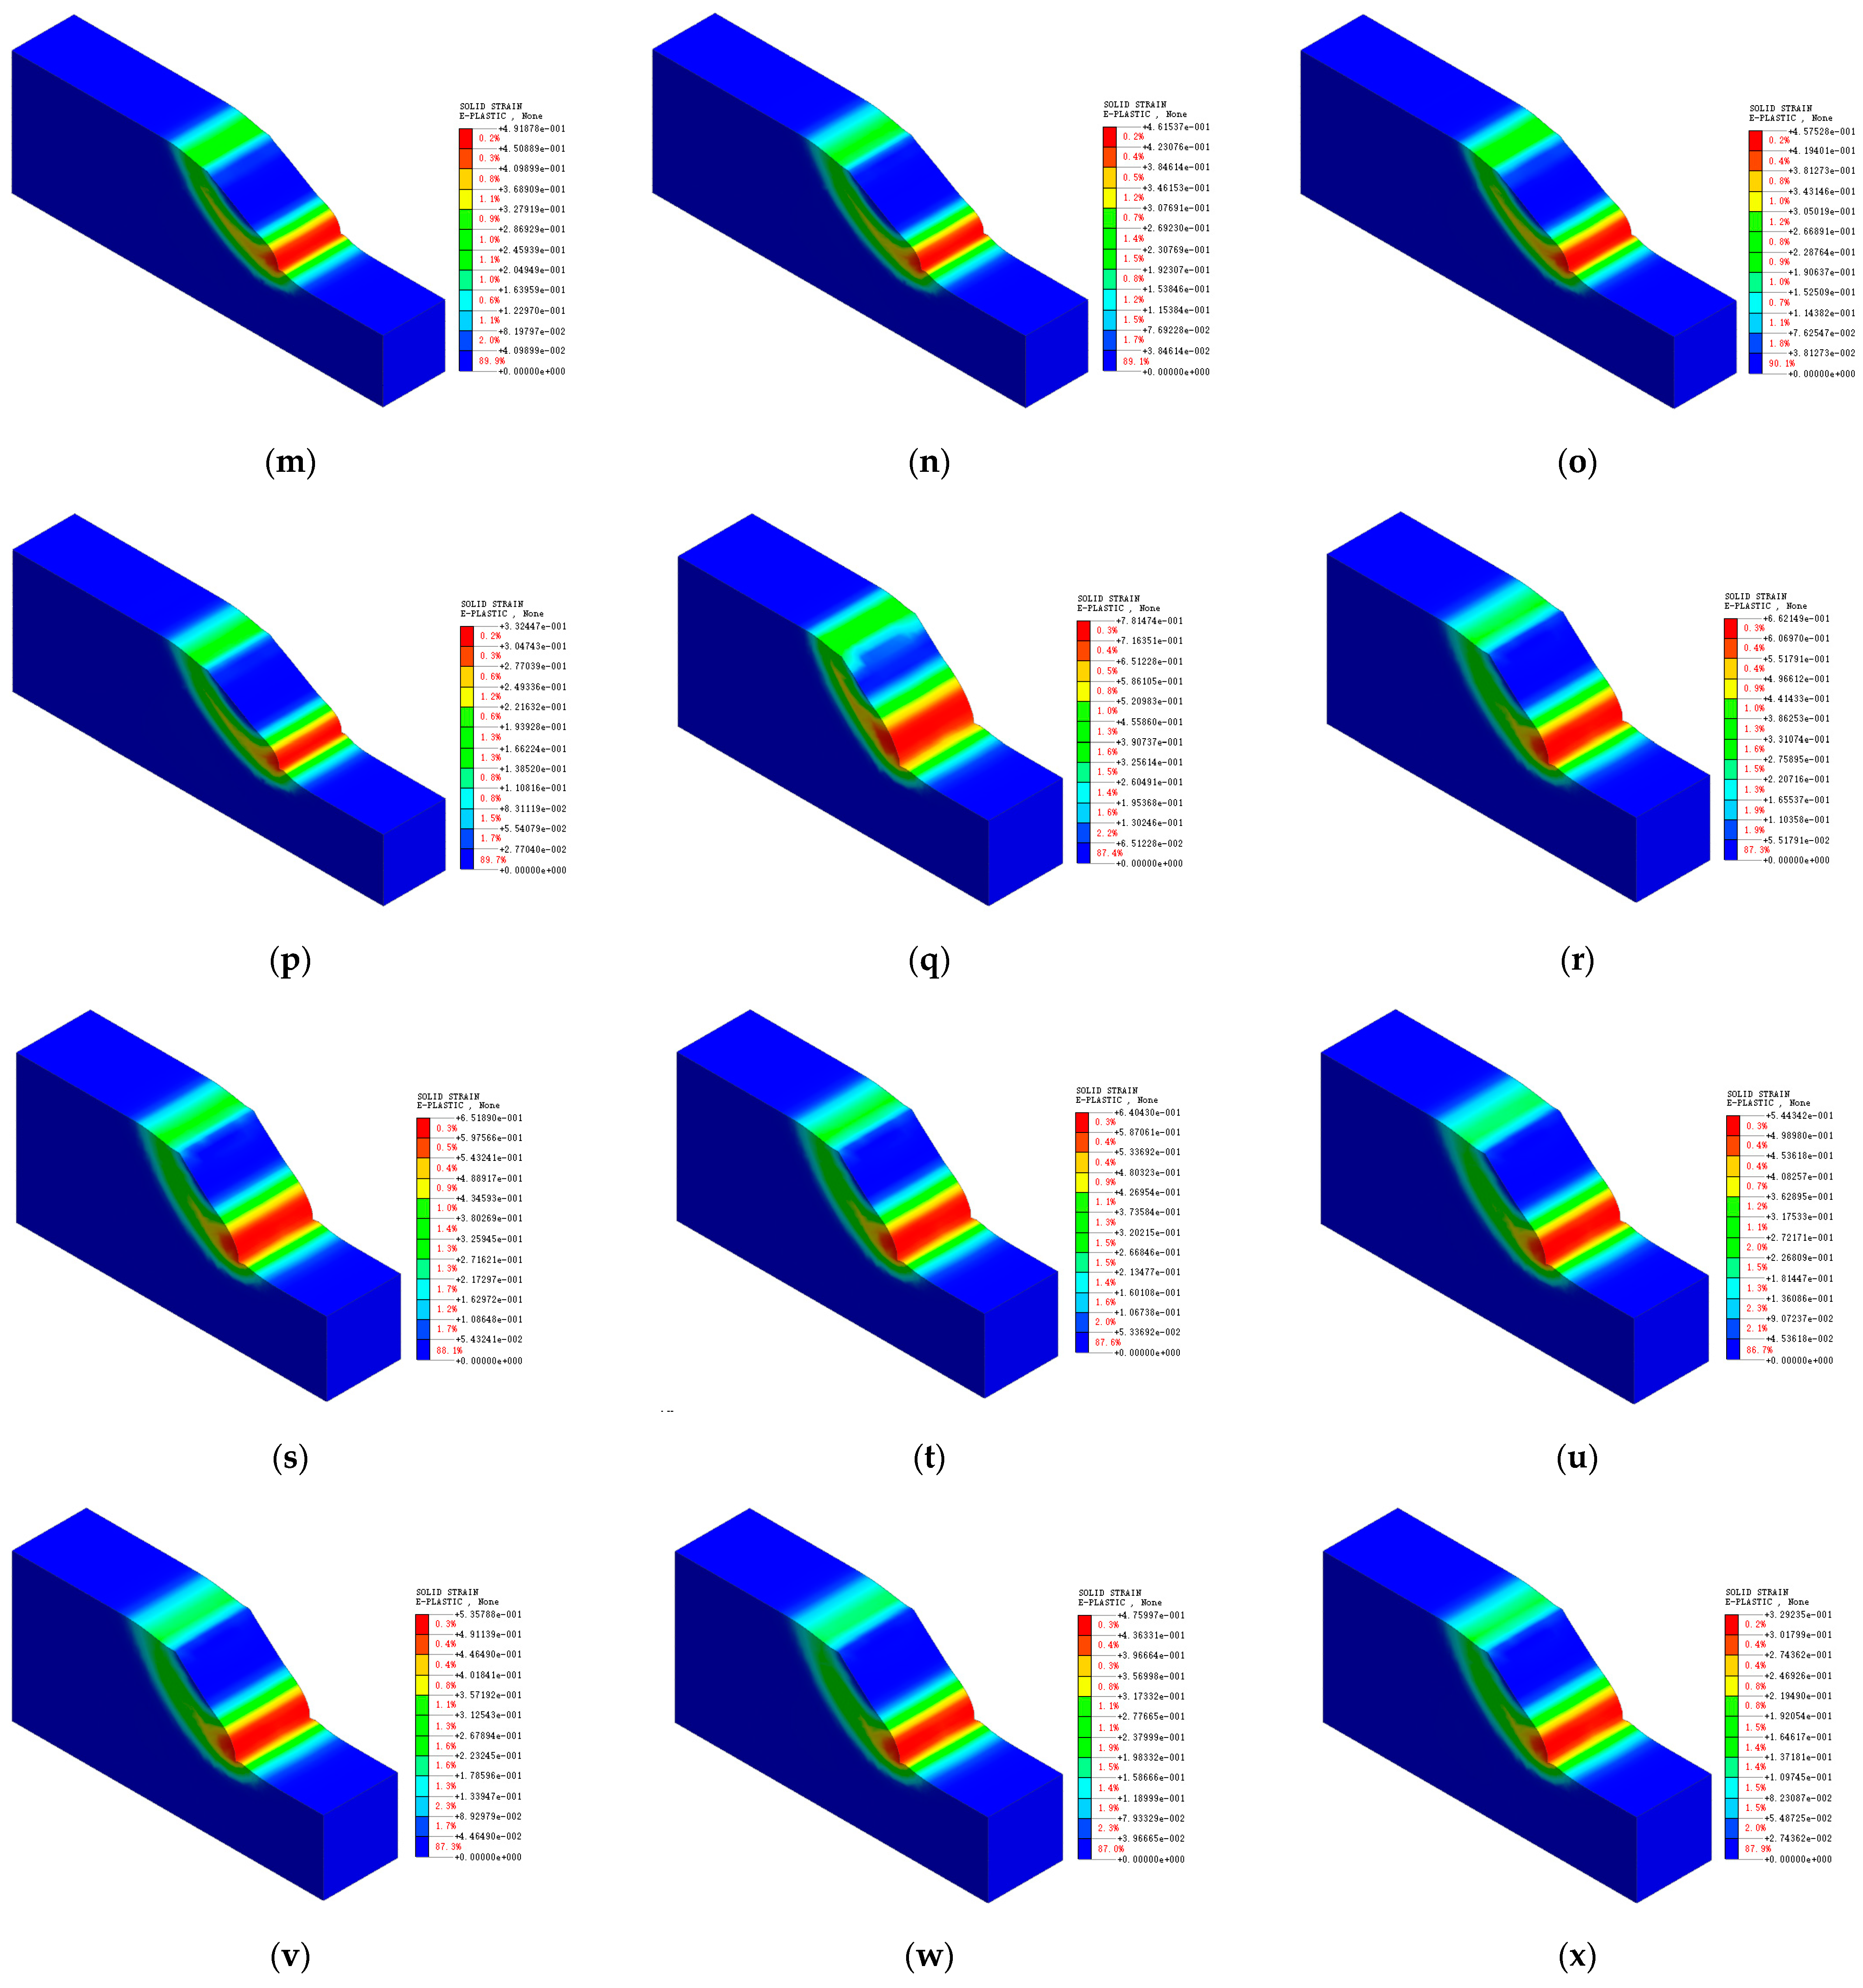
The equivalent plastic strain cloud diagram of slope instability under various working conditions is shown in
Figure 11, and the maximum horizontal displacement (MHD), maximum vertical displacement (MVD), and maximum plastic strain during instability are listed in
Table 7. The plastic zone occurs at the foot of the slope when the bare slope is unstable, and the maximum equivalent plastic strain (MEPS) is 0.781 when the slope is unstable at a 50° angle. Under the same working conditions, the MEPS increases with the slope. The MEPS is 44.7%, 49%, and 57.9% lower for the vegetated than for the bare slopes for the three slope angles, respectively. Although the root system reduces the equivalent plastic strain of the slope, the slope gradient affects the plastic strain. Unlike the bare slope, the slope has no continuous plastic zone on the sliding surface. As the depth of the root system increases, the range of the plastic deformation zone narrows, and the zone develops in the depth direction. These results indicate that herbaceous plant roots can prevent the deformation of shallow soil on slopes, reducing the risk of shallow landslides.
Table 7 shows that the plant roots affect the displacement of the potential sliding surfaces in the x and z directions. The maximum horizontal and vertical displacements (MHD and MVD) of the 40° slope are 13.9% and 14.8% lower, respectively, for the vegetated than for the bare slopes. Those of the 45° and 50° slopes are 13.1%, 12.9%, 12.6%, and 14.3%, lower, respectively. The reason is that the root–system increases the tensile strength and the surrounding soil, resulting in higher compressive strength. Different RCs, root burial depths, and slope gradients result in different stiffness values of the shallow slope while limiting the horizontal and vertical displacements. The friction between the soil and roots converts the shear stress into tensile stress and prevents lateral deformation of the soil. Therefore, the horizontal displacement of the slope is significantly lower than the vertical displacement for the USRS.
Figure 12 shows that the slopes with three different slope angles exhibit similar trends in the relationship between the plant root parameters and safety coefficients, i.e., the RC and root burial depth are positively correlated with the slope safety coefficient, whereas the slope gradient is negatively correlated with the slope safety coefficient. The specific characteristics are as follows: 1) The safety coefficient is higher for vegetated slopes than for bare slopes. 2) If the slope gradient is constant, the safety coefficient increases with an increase of plant in the root burial depth. 3) If the slope gradient and root depth are constant, the safety coefficient increases with an increase in RC. 4) For the same RC or root burial depth, an increase in the slope gradient causes a decrease in the safety coefficient. 5) The safety coefficient is 8.3%, 11.2%, and 3.2% higher, respectively, for vegetated than bare slopes at different slope gradients.
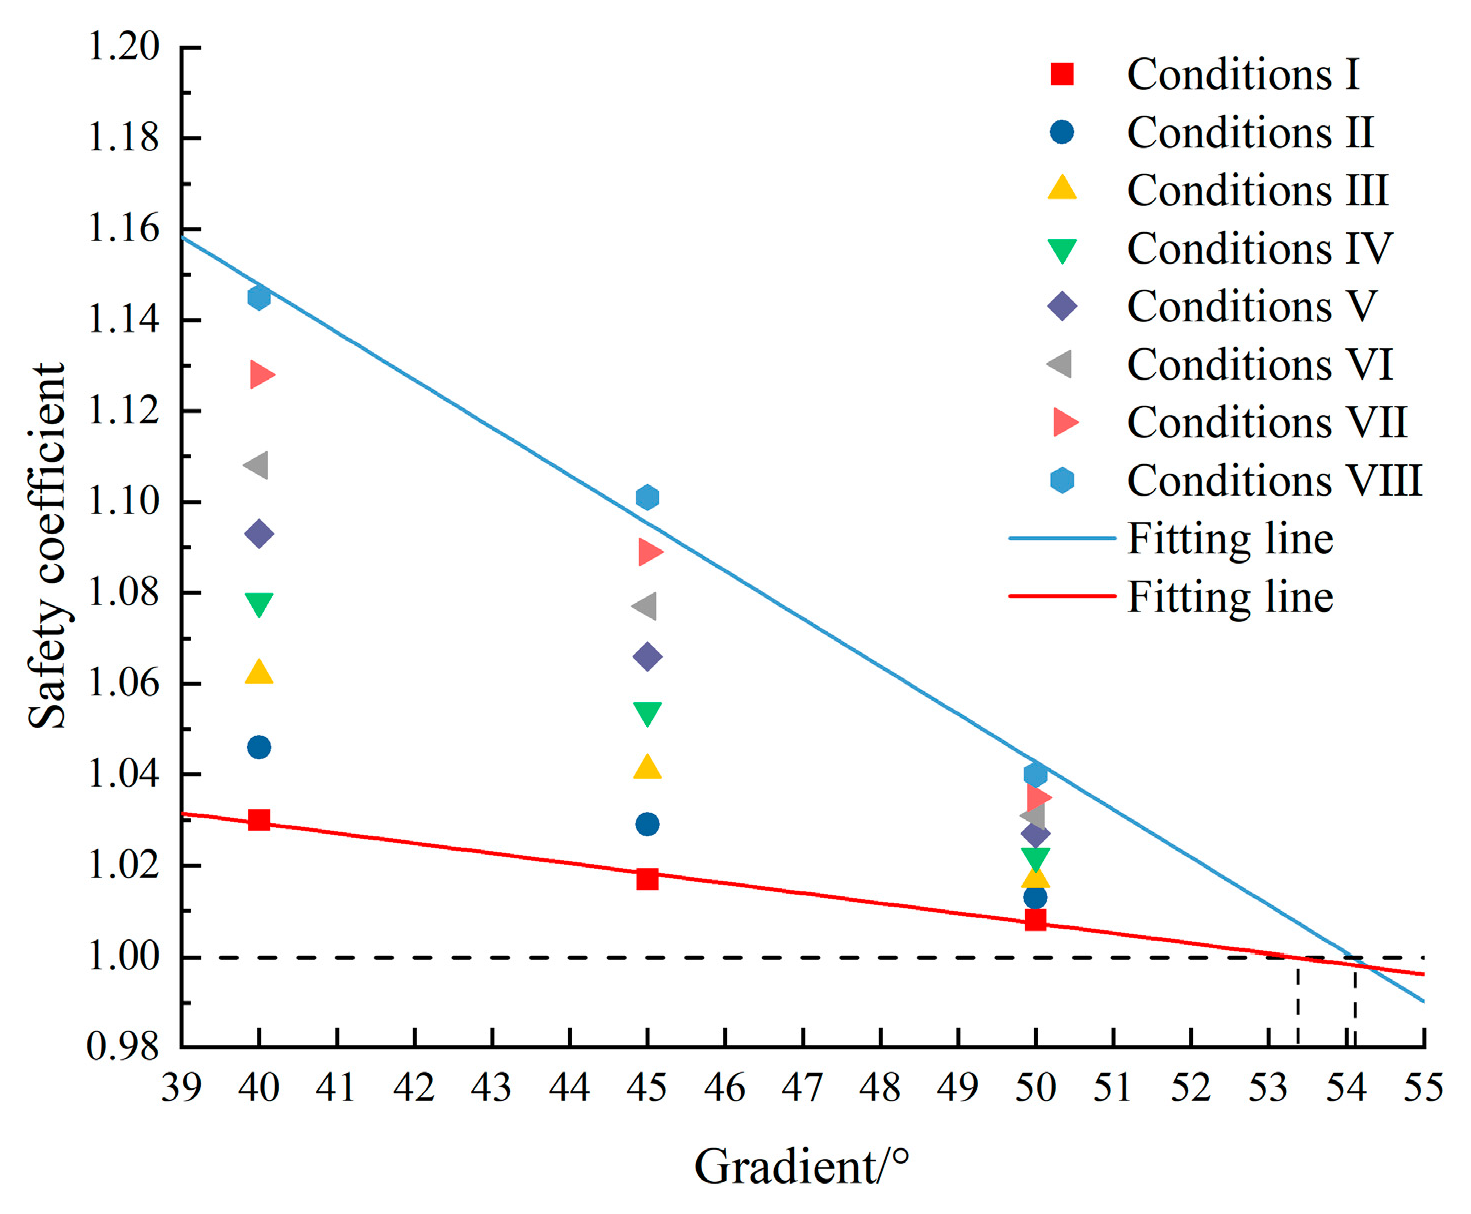
Figure 13 shows the linear fits of the safety coefficients for different slope gradients under the same operating conditions. The RC and root burial depth are positively correlated with the slope of the line. When the slope safety coefficient reaches the critical value of 1.0, the slope gradient of the fitted curve is 0.8° larger for condition VIII than for condition I, indicating a 1.5% increase in the slope gradient of bare soil.
The reinforcement effect by the root system results in a 3.2%–11.2% increase in the safety coefficient and improved stability of slopes with a gradient exceeding 1.5%. Therefore, using roots for slope reinforcement prevents the sliding surface from moving within the buried depth range of the root–system and improves slope stability.
4. Discussion
4.1. Root–soil Synergy Mechanism
After analyzing the alterations in the root system of USRS following shear deformation, distinct friction marks were noted on the primary root surfaces. Additionally, minor fractures were observed in the lateral roots. This observation implies that, under shear forces, the roots and soil collaboratively endure the load. Due to divergent material properties of roots and soil, evident interlocking arises during initial deformation. As shear force gradually increases, the roots gradually slide or tend to slide in the soil, relying on frictional resistance to counteract movement. The primary roots experience tensile deformation, with the frictional resistance transferring the force to the surrounding soil mass along the direction of the main roots. Meanwhile, frictional resistance distribution along lateral roots can inhibit the lateral deformation. Consequently, plant roots effectively suppress the emergence and expansion of tensile cracks in the soil, thereby enhancing soil strength. In practical slope engineering, embedding a specific volume of roots beneath potential sliding surfaces notably mitigates shallow landslide risks.
4.2. Influence of Test Methods on Shear Strength Parameters of USRS
In earlier studies, due to challenges in preparing soil samples, indoor direct shear tests were usually used to assess the reinforcement impact of USRS [
38,
39,
40]. These tests aimed to ascertain the cohesion, internal friction angle, and shear strength of the soil–root composite. However, indoor and outdoor direct shear tests have significant defects in the testing process that results in: (1) The shear failure surface is artificially fixed and can only be sheared along the horizontal interface between the upper and lower boxes, not necessarily the weakest shear plane of the soil sample; (2) Non–uniform shear strain and shear stress distribution inside the specimen arise during shearing; (3) The shear surface of the soil sample gradually shrinks during the shearing process, yet shear strength computations are grounded in the original cross–sectional area of the soil sample. To enhance testing validity, this study adopted triaxial tests to determine shear strength parameters for both USRS and RUS. This method, more practical in nature, guarantees that the shear failure surface is the weakest plane. Consequently, results gain enhanced credibility, thus providing a scientific basis for evaluating the shallow stability of real–world ecological slope protection projects.
Investigating the impact of RC on soil–root composite material strength often involves employing remolded soil tests [
41,
42]. However, the evaluation of RC’s influence on shear strength indicators through indoor shear tests of remolded soil–root composites presents challenges [
43]. This complexity arises from the multifaceted nature of shear strength in soil-root composites, influenced not only by plant species and natural environment but also by many factors encompassing soil type, particle shape and gradation, void ratio, interparticle binding material, density, and MC. In particular, remolded soil samples fail to capture the original growth morphology and natural distribution of plant roots within the soil. Moreover, they do not faithfully represent synergetic characteristics of the soil–root interface during the shearing process. Therefore, investigating shear strength attributes in soil–root composites via remolded soil samples, including determining the “optimal RC” [
44,
45,
46], can only provide theoretical basis for vegetation selection in ecological slope protection projects. It is almost impossible and unrealistic to determine the “optimal RC” for USRS.
4.3. Comparison of Shear Strength between USRS and RUS
Based on the statistics of the experimental data in
Table 3, it can be concluded that, at an MC of 16.7%, the RC ranges from 0.12% to 0.31%. In the confining pressure range of 50 to 200 kPa, USRS exhibits a deviation stress amplification compared to RUS during failure ranges from 4.2% to 14.6%. At an MC of 23.4%, the RC varies between 0.11% and 0.18%. In the same confining pressure range, the deviation stress amplification of USRS compared to RUS during failure ranges from 18.3% to 28.8%. Furthermore, with an MC of 28.6%, the RC falls within the range of 0.06% to 0.09%. Within the confining pressures ranges of 50 to 200 kPa, the deviation stress amplification of USRS relative to RUS during failure ranges from 13.7% to 26.6%. Notably, the maximum deviation stress at the shear failure for USRS can be up to 1.29 times higher than that of the RUS. Thus, a significant improvement in soil shear strength due to plant roots is evident.
4.4. Factors affecting slope stability
Many factors affect slope stability, including internal factors, such as the rock and soil properties and geological conditions, and external factors, such as hydrogeological conditions, weathering, earthquakes, and human factors. The stability of shallow slopes can be increased by planting vegetation and other methods. Slopes with plant roots on the slope surface are more stable than those with root systems at the foot or top of the slope [
9]. The reinforcement effect of plant roots improves slope stability and reduces the range of influence of the sliding surface. The factors affecting slope stability include the RC, root burial depth, and slope gradient.
Jia et al. conducted a numerical analysis and found that the safety coefficient of slopes was substantially influenced by the plant spacing. The stability of slopes with a plant spacing of 5 m was consistent with that of bare slopes [
47]. Temgoua et al. observed that tree spacing improved slope stability [
48]. Although these studies confirm that an increase in the cohesive force provided by plant roots reduces slope instability, high–density herbaceous plants are often planted on roadbed slopes. As the RC of the surface soil increases, the frictional force at the root–soil interface transfers the shear stress of the shallow soil to the deep soil, improving the soil strength of shallow slopes.
Temgoua et al. found that the root depth and the resulting increase in the cohesive force increase slope stability [
48], consistent with our research results. The RC of plants increased cohesion, and a deeper root burial depth increased the slope safety coefficient. Temgoua’s model considers 2.1 m as the critical depth of the main root. In contrast, our calculation model focused on shallow slopes planted with herbaceous plants, with a maximum root depth of 0.6 m. Most sliding surfaces are located 1 m or below the surface [
49]. The root system only reinforces the soil when the root burial depth reaches the soil layer below the sliding surface.
Our model parameters affected slope stability. The Poisson’s ratio had a negligible effect on the safety coefficient, and the elastic modulus only influenced slope deformation and displacement [
50]. The slope gradient significantly affected the safety coefficient of the slope; it decreased as the slope gradient increased. These results indicated that the RC and root burial depth affected slope stability. Our results are consistent with those of –Jia et al., who found that the slope safety coefficients for different root structures decreased with an increase in the slope, and those of Tafti et al., who observed that plant roots increased the safety coefficient [
47,
51].
5. Conclusions
An indoor experimental study with a triaxial shear apparatus was used to investigate the shear strength characteristics of RUS and USRS of Tagetes erecta. We analyzed the influences of the RC, MC, and stress on the shear strength of the soil–root system. Significance tests and correlation analysis were conducted to assess which factors affected the soil’s shear resistance. The effectiveness of plant root slope protection was simulated under 24 working conditions, and the main factors affecting slope stability were determined. The study’s key findings are as follows:
(1) Both RUS and USRS exhibit strain–hardening characteristics during the stress–strain shearing process. Axial strain non–linearly increases with increased deviator stress. Compared to RUS, the deviator stress increase for USRS decreased with the increasing axial strain.
(2) With consistent MC and RC, soil–root composite shear performance increases with increasing confining pressure. The shear strength of the soil–root composite decreases with increasing MC. Within identical MC conditions, shear strength gradually increases with increasing RC.
(3) The shear strength index of the soil–root composite closely correlates with MC and RC. For identical MC, cohesion and its added increment rise, peak, and then decline after an initial increase as RC escalates. Simultaneously, the internal friction angle gradually decreases with increasing MC, while gradually increasing with increasing RC.
(4) A strong correlation exists between cohesion, internal friction angle of USRS, and RC.
(5) The maximum deviator stress during the failure of USRS can reach up to 1.29 times that of RUS.
(6) The results of multiple linear regression analysis between the shear resistance indicators and the influencing factors were consistent with the results of the significance and correlation analyses. The RC significantly influenced the cohesion of undisturbed soil, whereas the effect of the MC was relatively small. The influence of the MC on the internal friction angle of undisturbed soil was significant, whereas the impact of the RC was negligible. The ranking of the factors influencing the cohesion based on the correlation strength was RC (+) > root burial depth (–) > MC (–). The ranking of the factors influencing the internal friction angle was MC (–) > root burial depth (–) > RC (+).
(7) The equivalent plastic strain and the maximum displacement in the x and z directions decreased with an increase in the RC. The maximum equivalent plastic strain was 57.9 % lower for the vegetated slope than for the bare slope at a slope gradient of 50°. The reduction ratio of the maximum displacement was similar in the x and z directions under different working conditions.
(8) The bare slope had the lowest safety coefficient. The RC and root depth were positively correlated, and the slope gradient was negatively correlated with the safety coefficient. The RC and root depth were positively correlated with the slope of the safety coefficient under the same working conditions. The reinforcement effect by the plant root system resulted in a 3.2%–11.2% increase in the safety coefficient and improved stability of slopes with a gradient exceeding 1.5%.
In summary, using herbaceous plants for slope protection improved the shear performance of shallow slopes. It is necessary to use structural roadbed slope protection methods to improve slope stability.
Author Contributions
Conceptualization, B.W. (Bingyu Wang); methodology, B.W. (Bingyu Wang); software, B.W. (Bingyu Wang); validation, S.W. (Shijie Wang); resources, S.W. (Shijie Wang); data curation, B.W. (Bingyu Wang); writing—original draft preparation, B.W. (Bingyu Wang); writing—review and editing, B.W. (Bingyu Wang) and S.W. (Shijie Wang); visualization, B.W. (Bingyu Wang); project administration, S.W. (Shijie Wang); funding acquisition, S.W. (Shijie Wang). All authors have read and agreed to the published version of the manuscript.
Funding
This research was funded by the Hebei Province Construction Science and Technology Research Guidance Plan Project, China, grant number 2016-236.
Institutional Review Board Statement
Not applicable.
Informed Consent Statement
Not applicable.
Data Availability Statement
The analyzed datasets are available from the corresponding author on reasonable request.
Acknowledgments
The authors would like to sincerely thank Soil Mechanics Laboratory, China Ordnance Industry North Survey, Design and Research Institute Co., Ltd. for providing test equipment to ensure subsequent data collection.
Conflicts of Interest
The authors declare no conflict of interest.
References
- Wang, Y. J.; Smith, J. V.; Nazem, M. Effect of various rainfall conditions on the roadside stabilisation of slopes in Gippsland. Int. J. Civ. Eng. 2023, 21, 173-192. [CrossRef]
- Ghestem, M.; Veylon, G.; Bernard, A.; Vanel, Q.; Stokes, A. Influence of plant root system morphology and architectural traits on soil shear resistance. Plant Soil. 2013, 377, 43-61. [CrossRef]
- Stokes, A.; Atger, C.; Bengough, A. G.; Fourcaud, T.; Sidle, R. C. Desirable plant root traits for protecting natural and engineered slopes against landslides. Plant Soil. 2009, 324, 1-30. [CrossRef]
- Stokes, A.; Douglas, G. B.; Fourcaud, T.; Giadrossich, F.; Gillies, C.; Hubble, T.; Kim, J. H.; Loades, K. W.; Mao, Z.; McIvor, I. R.; Mickovski, S. B.; Mitchell, S.; Osman, N.; Phillips, C.; Poesen, J.; Polster, D.; Preti, F.; Raymond, P.; Rey, F.; Schwarz, M.; Walker, L. R. Ecological mitigation of hillslope instability: ten key issues facing researchers and practitioners. Plant Soil. 2014, 377, 1-23. [CrossRef]
- Genet, M.; Stokes, A.; Salin, F.; Mickovski, S. B.; Fourcaud, T.; Dumail, J.-F.; Beek, R. V. The influence of cellulose content on tensile strength in tree roots. Plant and Soil. 2005, 278, 1-9. [CrossRef]
- Liu, J. X.; Yang, C. H.; Gan, J. J.; Liu, Y. T.; Wei, L.; Xie, Q. Stability analysis of road embankment slope subjected to rainfall considering runoff-unsaturated seepage and unsaturated fluid–solid coupling. Int. J. Civ. Eng. 2017, 15, 865-876. [CrossRef]
- Lozada, C.; Mendoza, C.; Amortegui, J. V. Physical and numerical modeling of clayey slopes reinforced with roots. Int. J. Civ. Eng. 2022, 20, 1115-1128. [CrossRef]
- Hales, T. C.; Miniat, C. F. Soil moisture causes dynamic adjustments to root reinforcement that reduce slope stability. Earth Surf. Processes Landforms 2017, 42, 803-813. [CrossRef]
- Ji, J. N.; Kokutse, N.; Genet, M.; Fourcaud, T.; Zhang, Z. Q. Effect of spatial variation of tree root characteristics on slope stability. A case study on Black Locust (Robinia pseudoacacia) and Arborvitae (Platycladus orientalis) stands on the Loess Plateau, China. Catena 2012, 92, 139-154. [CrossRef]
- Loades, K. W.; Bengough, A. G.; Bransby, M. F.; Hallett, P. D. Planting density influence on fibrous root reinforcement of soils. Ecological Engineering. 2010, 36, 276-284. [CrossRef]
- Mickovski, S. B.; Hallett, P. D.; Bransby, M. F.; Davies, M. C. R.; Sonnenberg, R.; Bengough, A. G. Mechanical reinforcement of soil by willow roots: Impacts of root properties and root failure mechanism. Soil Science Society of America Journal. 2009, 73, 1276-1285. [CrossRef]
- Rasool, A. M.; Aziz, M. Advanced triaxial tests on partially saturated soils under unconfined conditions. Int. J. Civ. Eng. 2020, 18, 1139-1156. [CrossRef]
- Schwarz, M.; Cohen, D.; Or, D. Root-soil mechanical interactions during pullout and failure of root bundles. Journal of Geophysical Research. 2010, 115, (F04035). [CrossRef]
- Waldron, L. J. The shear resistance of root-permeated homogeneous and stratified soil. Soil Science Society of America Journal. 1977, 41, 843-849. [CrossRef]
- Tosi, M. Root tensile strength relationships and their slope stability implications of three shrub species in the Northern Apennines (Italy). Geomorphology 2007, 87, 268-283. [CrossRef]
- Su, H.; Hang, Y. J.; Song, Y. S.; Mao, K. M.; Wu, D. Y.; Qiu, X. Seismic response of anchor + hinged block ecological slope by shaking table tests. Adv. Mater. Sci. Eng. 2018, 2018, 1-13. [CrossRef]
- Genet, M.; Kokutse, N.; Stokes, A.; Fourcaud, T.; Cai, X. H.; Ji, J. N.; Mickovski, S. Root reinforcement in plantations of Cryptomeria japonica D. Don: effect of tree age and stand structure on slope stability. Forest Ecology and Management. 2008, 256, 1517-1526. [CrossRef]
- Wu, T. H.; McKinnell, W. P.; Swanston, D. N. Strength of tree roots and landslides on Prince of Wales Island, Alaska. Can. Geotech. J. 1979, 16, 19-33. [CrossRef]
- Ekanayake, J. C.; Phillips, C. J. A method for stability analysis of vegetated hillslopes an energy approach. Can. Geotech. J. 1999, 36, 1172-1184. [CrossRef]
- Operstein, V.; Frydman, S. The influence of vegetation on soil strength. Ground Improv 2000, 4, 81-89. [CrossRef]
- Bischetti, G. B.; Chiaradia, E. A.; Epis, T.; Morlotti, E. Root cohesion of forest species in the Italian Alps. Plant Soil 2009, 324, 71-89. [CrossRef]
- Hubble, T. C. T.; Docker, B. B.; Rutherfurd, I. D. The role of riparian trees in maintaining riverbank stability: A review of Australian experience and practice. Ecological Engineering 2010, 36, 292-304. [CrossRef]
- Masi, E. B.; Segoni, S.; Tofani, V. Root reinforcement in slope stability models: A review. Geosciences 2021, 11, 212. [CrossRef]
- Zhang, C. B.; Chen, L. H.; Liu, Y. P.; Ji, X. D.; Liu, X. P. Triaxial compression test of soil–root composites to evaluate influence of roots on soil shear strength. Ecological Engineering 2010, 36, 19-26. [CrossRef]
- Wu, T. H.; Beal, P. E.; Lan, C. C. In-situ shear test of soil-root systems. Geotech. Eng. 1988a, 114, 1376-1394.
- Wu, T. H.; Watson, A. In situ shear tests of soil blocks with roots. Can. Geotech. J. 1998b, 35, 579-590. [CrossRef]
- Zhang, X. M.; Wang, Y. J.; Xia, Y. P.; Wu, Y.; Chen, L. Shear strengths of undisturbed and remolded soils of typical vegetations in Jinyun Mountain of Chongqing City. Trans. Chin. Soc. Agric. Eng. 2006, 22, 6-9. [CrossRef]
- Wei, J.; Shi, B. L.; Li, J. L.; Li, S. S.; He, X. B. Shear strength of purple soil bunds under different soil water contents and dry densities: A case study in the Three Gorges Reservoir Area, China. Catena 2018, 166, 124-133. [CrossRef]
- Lian, B. Q.; Peng, J. B.; Zhan, H. B.; Wang, X. G. Mechanical response of root-reinforced loess with various water contents. Soil and Tillage Research 2019, 193, 85-94. [CrossRef]
- Zhou, X.; Wei, Y.; Li, D. R.; Jiang, J.; Zhang, C. B. Strengthening effects of alfalfa roots on soil shear resistance in loess region. Science of Soil and Water Conservation 2019, 17, 53-59. [CrossRef]
- Ma, Q.; Wu, N. Z.; Xiao, H. L.; Li, Z.; Li, W. T. Effect of Bermuda grass root on mechanical properties of soil under dry–wet cycles. Bulletin of Engineering Geology and the Environment 2021, 80, 7083-7097. [CrossRef]
- Xu, Z. H.; Zhang, Y.; Tao, Z. P.; Zha, L. L.; Chen, Y. Y. Mechanical characteristics of undisturbed roots-soil composites from the source area of Lanniqing landslide, Zhaotong. Journal of Soil and Water Conservation 2022, 36, 128-134. [CrossRef]
- Dupuy, L.; Fourcaud, T.; Stokes, A. A numerical investigation into factors affecting the anchorage of roots in tension. European Journal of Soil Science 2005, 56, 319-327. [CrossRef]
- Cohen, D.; Lehmann, P.; Or, D. Fiber bundle model for multiscale modeling of hydromechanical triggering of shallow landslides. Water Resources Research 2009, 45, W10436. [CrossRef]
- Yang, H. L. Study on the protection skill of zoology and environment aimed at slope in the collapse loess area. Chang’an University, China, 2006.
- Yan, Z. X.; Song, Y.; Jiang, P.; Wang, H. Y. Preliminary study on interaction between plant frictional root and rock-soil mass. Technological sciences 2010, 53, 1938-1942. [CrossRef]
- Bruce, A.; Rutherfurd, I. D. The distribution and strength of riparian tree roots in relation to riverbank reinforcement. Hydrol. Process. 2001, 15, 63-79. [CrossRef]
- Ge, R. L.; Zhang, C. F.; Meng, Z. J.; Si, Q.; Wu, Y. D. The shear property comparison of three roots-soil composites Journal of Soil and Water Conservation 2014, 28, 85-90. [CrossRef]
- Li, Y. Z.; Fu, J. T.; Yu, D. M.; Hu, X. S.; Zhu, H. L.; Li, G. Y.; Hu, X. T. Mechanical effects of halophytes roots and optimal root content for slope protection in cold and arid environment. Chinese Journal of Rock Mechanics and Engineering 2015, 34, 1370-1383. [CrossRef]
- Chen, J.; Huang, J. D.; Chen, Z. W.; Chen, Q. T.; Fan, J. P.; Wu, G. W.; Ma, X. S.; Chen, J. Y. Research of plant protection on granite residual soil slope in north area of Guangzhou. Journal of Zhongkai University of Agriculture and Engineering 2016, 29, 18-22. [CrossRef]
- Dołżyk-Szypcio, K. Direct shear test for coarse granular soil. Int. J. Civ. Eng. 2019, 17, 1871-1878. [CrossRef]
- Wang, Y. Z.; Liu, X. F.; Zhang, Z. K.; Ma, D. G.; Cui, Y. Q. Experimental research on influence of root content on strength of undisturbed and remolded grassroots-reinforced soil. Chinese Journal of Geotechnical Engineering 2015, 37, 1405-1410. [CrossRef]
- Zhu, H. B.; Zhao, H., R,; Bai, L. Z.; Ma, S. A.; Zhang, X.; Li, H. Mechanical characteristics of rice root–soil complex in rice–wheat rotation area. Agriculture 2022, 12, 1045. [CrossRef]
- Chen, C. F.; Liu, H. X.; Li, Y. P. Study on grassroots-reinforced soil by laboratory triaxial test. Rock and Soil Mechanics 2007, 28, 2041-2045. [CrossRef]
- Chen, J.; Lei, X. W.; Huang, J. D.; Li, Y.; Lv, J. G.; Qiu, J. H. Experimental research on reinforcement mechanism of herbs root system on granite residual soil slope. Journal of Soil and Water Conservation 2018, 32, 104-108. [CrossRef]
- Hu, Q. Z.; Zhou, Z.; Xiao, B. L.; Xiao, H. L. Experimental research on relationship between root weight and shearing strength in Soil. Soil Eng. Foundation 2010, 24, 85-87. [CrossRef]
- Jia, X. C.; Zhang, W.; Wang, X. H.; Jin, Y. H.; Cong, P. T. Numerical analysis of an explicit smoothed particle finite element method on shallow vegetated slope stability with different root architectures. Sustainability 2022, 14, 11272. [CrossRef]
- Temgoua, A. G. T.; Kokutse, N. K.; Kavazović, Z. Influence of forest stands and root morphologies on hillslope stability. Ecol. Eng. 2016, 95, 622-634. [CrossRef]
- Arnone, E.; Caracciolo, D.; Noto, L. V.; Preti, F.; Bras, R. L. Modeling the hydrological and mechanical effect of roots on shallow landslides. Water Resour. Res. 2016, 52, 8590-8612. [CrossRef]
- Zheng, Y. R.; Chen, Z., Y.; Wang, G. X.; Ling, T. Q. Engineering treatment of slope and landslide. People’s Communications Publishing House: Beijing, 2010.
- Emadi-Tafti, M.; Ataie-Ashtiani, B.; Hosseini, S. M. Integrated impacts of vegetation and soil type on slope stability: A case study of Kheyrud Forest, Iran. Ecol. Modell. 2021, 446,109498. [CrossRef]
Figure 1.
Instrument setup: (a) TSZ–2 fully automatic triaxial shear apparatus; (b) Microcomputer data acquisition and processing system.
Figure 1.
Instrument setup: (a) TSZ–2 fully automatic triaxial shear apparatus; (b) Microcomputer data acquisition and processing system.
Figure 2.
Experimental site and Tagetes erecta sample.
Figure 2.
Experimental site and Tagetes erecta sample.
Figure 3.
The sample preparation and plant samples: (a) Preparation of soil samples containing roots (USRS); (b) Tagetes erecta sample.
Figure 3.
The sample preparation and plant samples: (a) Preparation of soil samples containing roots (USRS); (b) Tagetes erecta sample.
Figure 4.
Stress–strain curve of rootless undisturbed soil (RUS) and undisturbed soil with root system (USRS): (a) RUS (Ⅰ); (b) 0.12% root content (RC) (Ⅰ); (c) 0.20% RC (Ⅰ); (d) 0.31% RC (Ⅰ); (e) RUS (Ⅱ); (f) 0.11% RC (Ⅱ); (g) 0.15% RC (Ⅱ); (h) 0.18% RC (Ⅱ); (i) RUS (Ⅲ); (j) 0.06% RC (Ⅲ); (k) 0.07% RC (Ⅲ); (l) 0.09% RC (Ⅲ). Note: Ⅰ refers to the depth of 0–20 cm, Ⅱ refers to the depth of 20–40 cm, Ⅲ refers to the depth of 40–60 cm.
Figure 5.
Shear strength envelope: (a) Ⅰ; (b) Ⅱ; (c) Ⅲ. Note: Ⅰ refers to the depth of 0–20 cm, Ⅱ refers to the depth of 20–40 cm, Ⅲ refers to the depth of 40–60 cm.
Figure 5.
Shear strength envelope: (a) Ⅰ; (b) Ⅱ; (c) Ⅲ. Note: Ⅰ refers to the depth of 0–20 cm, Ⅱ refers to the depth of 20–40 cm, Ⅲ refers to the depth of 40–60 cm.
Figure 6.
Summary of the cohesive force and internal friction angle data of undisturbed soil for different MCs and RCs: (a) Cohesive force of undisturbed soil for different RCs ( 0%, 0.12%, 0.20%, and 0.31% ) at condition Ⅰ; (b) Cohesive force of undisturbed soil for different RCs ( 0%, 0.11%, 0.15%, and 0.18% ) at condition Ⅱ; (c) Cohesive force of undisturbed soil for different RCs ( 0%, 0.06%, 0.07%, and 0.09% ) at condition Ⅲ; (d) Internal friction angle of undisturbed soil for different RCs ( 0%, 0.12%, 0.20%, and 0.31% ) at condition Ⅰ; (e) Internal friction angle of undisturbed soil for different RCs ( 0%, 0.11%, 0.15%, and 0.18% ) at condition Ⅱ; (f) Internal friction angle of undisturbed soil for different RCs ( 0%, 0.06%, 0.07%, and 0.09% ) at condition Ⅲ. Note: condition Ⅰ refers to the depth of 0–20 cm, condition Ⅱ refers to the depth of 20–40 cm, condition Ⅲ refers to the depth of 40–60 cm.
Figure 7.
Correlation analysis results between the shear strength index and the RC, MC, and root burial depth. Note: blue represents a positive correlation, red represents a negative correlation, a darker color represents a higher correlation, and the size of the circle represents the absolute value of the correlation; the number represents the p–value.
Figure 8.
Relationship of shear strength index with RC and MC: (a) cohesion; (b) internal friction angle.
Figure 8.
Relationship of shear strength index with RC and MC: (a) cohesion; (b) internal friction angle.
Figure 9.
Relationship of failure deviation stress with RC and MC: (a) σ3: 50 kPa; (b) σ3: 100 kPa; (c) σ3: 200 kPa.
Figure 9.
Relationship of failure deviation stress with RC and MC: (a) σ3: 50 kPa; (b) σ3: 100 kPa; (c) σ3: 200 kPa.
Figure 10.
Finite element model of the slope with a slope gradient of 45°.
Figure 10.
Finite element model of the slope with a slope gradient of 45°.
Figure 11.
Equivalent plastic strain cloud diagram of slope instability under various working conditions: (a) condition Ⅰ; (b) condition Ⅱ; (c) condition Ⅲ; (d) condition Ⅳ; (e) condition Ⅴ; (f) condition Ⅵ; (g) condition Ⅶ; (h) condition Ⅷ; (i) condition Ⅰ*; (j) condition Ⅱ*; (k) condition Ⅲ*; (l) condition Ⅳ*; (m) condition Ⅴ*; (n) condition Ⅵ*; (o) condition Ⅶ*; (p) condition Ⅷ*; (q) condition Ⅰ**; (r) condition Ⅱ**; (s) condition Ⅲ**; (t) condition Ⅳ**; (u) condition Ⅴ**; (v) condition Ⅵ**; (w) condition Ⅶ**; (x) condition Ⅷ**.
Figure 12.
Slope safety coefficients under different working conditions: (a) =40°; (b) =45°; (c) =50°.
Figure 12.
Slope safety coefficients under different working conditions: (a) =40°; (b) =45°; (c) =50°.
Figure 13.
Slope safety coefficients for 8 working conditions and different slope gradients. Note: I–VIII represents different working conditions but not different slope gradients.
Figure 13.
Slope safety coefficients for 8 working conditions and different slope gradients. Note: I–VIII represents different working conditions but not different slope gradients.
Table 1.
Sample group parameter indicators for roots and soil.
Table 1.
Sample group parameter indicators for roots and soil.
| Root content (RC) |
Depth/cm |
Moisture content (MC)/% |
Dry density/
(g/cm3) |
Average root diameter/mm |
Main root system length/cm |
| 0% |
0–20 |
16.7 |
1.58 |
/ |
/ |
| 0.12% |
2.7 |
11.4 |
| 0.20% |
2.1 |
13.2 |
| 0.31% |
2.4 |
14.6 |
| 0% |
20–40 |
23.4 |
1.42 |
/ |
/ |
| 0.11% |
1.1 |
3.6 |
| 0.15% |
0.8 |
4.3 |
| 0.18% |
0.7 |
3.9 |
| 0% |
40–60 |
28.6 |
1.33 |
/ |
/ |
| 0.06% |
0.3 |
0.9 |
| 0.07% |
0.4 |
0.7 |
| 0.09% |
0.3 |
0.8 |
Table 2.
Parameters related to shear strength of undisturbed soil with a root system (USRS).
Table 2.
Parameters related to shear strength of undisturbed soil with a root system (USRS).
| Depth of undisturbed soil sample /cm |
MC /% |
RC/% |
Internal friction angle/(°) |
Cohesion/kPa |
Additional cohesion of root–system/kPa |
Failure deviation stress/kPa |
| σ3=50 |
σ3=100 |
σ3=200 |
| 0–20 |
16.7 |
0 |
29.2 |
6.1 |
0 |
121.1 |
221.1 |
421.1 |
| 0.12 |
29.8 |
7.8 |
1.7 |
127.0 |
227.0 |
427.0 |
| 0.20 |
30.2 |
11.2 |
5.1 |
138.8 |
238.8 |
438.8 |
| 0.31 |
30.9 |
10.9 |
4.8 |
137.8 |
237.8 |
437.8 |
| 20–40 |
23.4 |
0 |
24.1 |
5.8 |
0 |
86.9 |
155.9 |
293.9 |
| 0.11 |
24.7 |
7.6 |
1.8 |
95.5 |
167.3 |
310.9 |
| 0.15 |
25.4 |
10.8 |
5.0 |
109.3 |
184.4 |
334.6 |
| 0.18 |
26.1 |
10.4 |
4.6 |
111.9 |
190.5 |
347.6 |
| 40–60 |
28.6 |
0 |
20.3 |
5.2 |
0 |
68.1 |
121.2 |
227.4 |
| 0.06 |
20.8 |
7.1 |
1.9 |
75.6 |
130.7 |
240.8 |
| 0.07 |
21.2 |
10.1 |
3.0 |
86.1 |
142.8 |
256.1 |
| 0.09 |
21.4 |
9.8 |
2.7 |
86.2 |
143.6 |
258.5 |
Table 3.
Results of linear regression analysis.
Table 3.
Results of linear regression analysis.
| Linear model. |
Shear strength
index |
influence factor |
Estimate |
Standard Error |
t–value |
p–value |
| Ⅰ |
|
Intercept |
3.474 |
1.343 |
2.586 |
0.0130 * |
| RC |
2349.511 |
276.746 |
8.490 |
6.75×10⁻¹¹ *** |
| MC |
11.038 |
5.066 |
2.179 |
0.0346 * |
| Ⅱ |
|
Intercept |
40.8992 |
0.3427 |
119.343 |
2×10-16 *** |
| RC |
657.5393 |
70.6059 |
9.313 |
4.61×10⁻¹² *** |
| MC |
–70.9555 |
1.2926 |
–54.894 |
2×10-16 *** |
Table 4.
Fitting calculation and analysis of the shear strength indicators of undisturbed soil–root complex.
Table 4.
Fitting calculation and analysis of the shear strength indicators of undisturbed soil–root complex.
| Y |
Y = Z + A·r + B·w + C·r2 + D·w2 + E·r·w |
R2
|
| Z |
A |
B |
C |
D |
E |
|
17.584 |
5.135 |
1.066 |
27.182 |
0.023 |
1.802 |
0.836 |
|
43.901 |
11.233 |
0.944 |
9.345 |
0.004 |
0.831 |
0.998 |
Table 5.
Fitting calculation and analysis of the failure strength of undisturbed soil–root complex.
Table 5.
Fitting calculation and analysis of the failure strength of undisturbed soil–root complex.
σ3
/kPa |
Y
/kPa
|
Y = Z + A·r + B·w + C·r2 + D·w2 + E·r·w
|
R2
|
| Z |
A |
B |
C |
D |
E |
| 50 |
|
277.442 |
105.327 |
12.213 |
65.507 |
0.171 |
11.101 |
0.968 |
| 100 |
493.908 |
216.918 |
20.883 |
38.040 |
0.272 |
17.367 |
0.986 |
| 200 |
926.933 |
439.798 |
38.229 |
16.760 |
0.476 |
29.880 |
0.992 |
Table 6.
Simulation conditions.
Table 6.
Simulation conditions.
| Conditions |
Root burial depth/cm |
RC/% |
| Ⅰ |
Ⅰ* |
Ⅰ** |
0 |
0 |
| Ⅱ |
Ⅱ* |
Ⅱ** |
0–20 |
0.12 |
| Ⅲ |
Ⅲ* |
Ⅲ** |
0–20 |
0.20 |
| Ⅳ |
Ⅳ* |
Ⅳ** |
0–20 |
0.31 |
| Ⅴ |
Ⅴ* |
Ⅴ** |
0–20,20–40 |
0.12,0.11 |
| Ⅵ |
Ⅵ* |
Ⅵ** |
0–20,20–40 |
0.31,0.18 |
| Ⅶ |
Ⅶ* |
Ⅶ** |
0–20,20–40,40–60 |
0.12,0.11,0.06 |
| Ⅷ |
Ⅷ* |
Ⅷ** |
0–20,20–40,40–60 |
0.31,0.18,0.09 |
Table 7.
Maximum horizontal and vertical displacements (MHD and MVD) for different working conditions and maximum equivalent plastic strain (MEPS) during instability.
Table 7.
Maximum horizontal and vertical displacements (MHD and MVD) for different working conditions and maximum equivalent plastic strain (MEPS) during instability.
| Conditions |
MEPS during instability |
Decreasing proportion/% |
MHD/m |
MHD reduction ratio/% |
MVD/m |
MVD reduction ratio/% |
| Ⅰ |
0.636719 |
— |
0.032375 |
— |
0.114286 |
— |
| Ⅱ |
0.635391 |
0.2 |
0.031437 |
2.9 |
0.113143 |
1.0 |
| Ⅲ |
0.553426 |
13.1 |
0.030902 |
4.6 |
0.110315 |
3.5 |
| Ⅳ |
0.547221 |
14.1 |
0.030469 |
5.9 |
0.107667 |
5.8 |
| Ⅴ |
0.543657 |
14.6 |
0.029738 |
8.1 |
0.105729 |
7.5 |
| Ⅵ |
0.428600 |
32.7 |
0.029411 |
9.2 |
0.102663 |
10.2 |
| Ⅶ |
0.375418 |
41.0 |
0.028764 |
11.2 |
0.101534 |
11.2 |
| Ⅷ |
0.324946 |
49.0 |
0.028131 |
13.1 |
0.099503 |
12.9 |
| Ⅰ* |
0.601005 |
— |
0.023168 |
— |
0.111812 |
— |
| Ⅱ* |
0.549951 |
8.5 |
0.022704 |
2.0 |
0.110247 |
1.4 |
| Ⅲ* |
0.544128 |
9.5 |
0.022046 |
4.8 |
0.107160 |
4.2 |
| Ⅳ* |
0.510160 |
15.1 |
0.021649 |
6.6 |
0.105874 |
5.3 |
| Ⅴ* |
0.491878 |
18.2 |
0.021173 |
8.6 |
0.102803 |
8.1 |
| Ⅵ* |
0.461537 |
23.2 |
0.020537 |
11.4 |
0.100131 |
10.4 |
| Ⅶ* |
0.457528 |
23.9 |
0.020188 |
12.9 |
0.097727 |
12.6 |
| Ⅷ* |
0.332447 |
44.7 |
0.019946 |
13.9 |
0.095284 |
14.8 |
| Ⅰ** |
0.781474 |
— |
0.019870 |
— |
0.119784 |
— |
| Ⅱ** |
0.662149 |
15.3 |
0.019314 |
2.8 |
0.116310 |
2.9 |
| Ⅲ** |
0.651890 |
16.6 |
0.019101 |
3.9 |
0.113635 |
5.1 |
| Ⅳ** |
0.640430 |
18.0 |
0.018796 |
5.4 |
0.110681 |
7.6 |
| Ⅴ** |
0.544342 |
30.3 |
0.018476 |
7.0 |
0.109020 |
9.0 |
| Ⅵ** |
0.535788 |
31.4 |
0.018033 |
9.2 |
0.105750 |
11.7 |
| Ⅶ** |
0.475997 |
39.1 |
0.017690 |
11.0 |
0.104164 |
13.0 |
| Ⅷ** |
0.329235 |
57.9 |
0.017372 |
12.6 |
0.102601 |
14.3 |
|
Disclaimer/Publisher’s Note: The statements, opinions and data contained in all publications are solely those of the individual author(s) and contributor(s) and not of MDPI and/or the editor(s). MDPI and/or the editor(s) disclaim responsibility for any injury to people or property resulting from any ideas, methods, instructions or products referred to in the content. |
© 2023 by the authors. Licensee MDPI, Basel, Switzerland. This article is an open access article distributed under the terms and conditions of the Creative Commons Attribution (CC BY) license (http://creativecommons.org/licenses/by/4.0/).
