1. Introduction
Candida spp is an etiological agent frequently isolated as a cause of infections [1,2]; a situation that represents a health problem that must be successfully managed at the population care level; additionally, the approach to infections generated by Candida spp represents a challenge associated with pharmacological resistance to drugs that are usually considered first line in the antifungal therapeutic arsenal and that correspond to the so-called azoles, a group represented by fluconazole [3,4].
Resistance can be caused by multiple factors, for example, frequent exposure of the fungus to antifungal agents, where its ability to evolve and adapt to hostile environments ensures its survival. In addition, the exposure of the biological agent to the conventional mechanisms of action of the drugs and the lack of new antifungal active principles with alternative mechanisms of action, make the treatment complex given the growing resistance, which is due to adaptive biological structural and functional adjustments of the fungi, which translates into a decrease in pharmacological effectiveness [3,5].
Typically, the mechanism of action of the azoles is the blockage of the cytochrome P450 enzyme complex associated with lanosterol 14-alpha-desmethylase. This enzyme converts lanosterol into the fungal wall structural intermediate ergosterol. From a molecular perspective, the free nitrogen atom located in the azole ring binds to the iron atom of the heme group of the enzyme lanosterol 14-alpha-desmethylase, and it is precisely in the enzymatic pocket of the complex where Candida induces structural changes that limit the access of azoles to the protein [6].
A mechanism associated with resistance involves the extrusion of drugs from inside the fungal cell; in which proteins or pumps belonging to two superfamilies, ATP Binding Cassette, and MFS, which are encoded by genes CDR1, SNQ2, PDH1, and MDR respectively, intervene [7–16]. Another mechanism of resistance is associated with alterations in the expression and mutations of genes encoding enzymes involved in the ergosterol biosynthesis pathway, such as lanosterol 14-alpha-demethylase and C-5 desaturase, which is responsible for synthesizing toxic sterols that accumulate in the fungus when exposed to azoles. The ERG11 gene encodes for the enzyme lanosterol 14-alpha-demethylase and its overexpression and/or mutations are associated with resistance whose biological basis responds to the maintenance of the integrity of the fungal membrane in the presence of azole and to the decrease in the affinity between the azole and the enzyme that serves as a pharmacological target, On the other hand, mutations in the ERG3 gene coding for the C-5 desaturase enzyme have been described as mechanisms associated with resistance, because the enzyme loses activity and stops synthesizing toxic sterols in the presence of azoles, which facilitates the survival of the fungus; At the same time, activation of synthesis routes of constituent compounds of the fungal membrane has been found [17–20].
Overall, the mechanisms described allow the fungus to avoid or reduce the effectiveness of azoles, a situation that implies the need for research to improve the understanding of the phenomenon from a molecular perspective and to make the problem visible to advance in its comprehensive approach. In this study, using reverse transcriptase polymerase chain reaction (RT-qPCR), the expression of ERG3, ERG11, SNQ2, and CgCDR1 genes of C. glabrata was evaluated and high-level computational and data analysis routes were used to contribute to the understanding and explanation of the phenomenon of interest.
2. Materials and Methods
2.1. Type of Study
A general experimental approach was carried out, with a contribution to the explanatory level.
2.2. Strains and sample handling conditions
Sixteen strains of C. glabrata, collected in a previous study conducted in an intensive care unit in the city of Manizales by the Biosalud Research Group of the Universidad de Caldas, were used; these strains were tested to confirm the species and determine their viability.
2.3. Sample selection and analysis groups
Gene expression experiments followed the guidelines proposed in the Minimum Information for Publication of Quantitative Real-Time PCR Experiments (MIQE) guidelines. The strains were plated on potato dextrose agar (PDA, Scharlau Microbiology) and identification was performed on the Vitek 2 compact (Biomerieux). Then, each strain was tested for antifungal susceptibility using the protocols proposed by The Clinical and Laboratory Standards Institute (CLSI) [21]. According to the results obtained, the strains were classified into two susceptibility groups: Dose-Dependent Sensitive with a MIC of < 32 µg/mL and resistant with a MIC of 64 µg/mL.
2.4. Macrodilution assay with fluconazole and without fluconazole
Each strain was subjected to a macrodilution assay according to the protocol proposed by CLSI, liquid Sabouraud was used as the culture medium. All tubes were incubated at 35 °C until the logarithmic phase of yeast growth occurred, at which time each tube was read to establish its minimum inhibitory concentration, the size of the cell pellet for each fluconazole concentration was compared with the positive control, and the cells were collected from the tube in which cell growth was greater than 50%; The cell concentration was adjusted to a value between 2 x 10⁸ and 3 x 10⁸ yeasts/mL, a process that was also carried out with the tube corresponding to the positive control. The tubes were centrifuged to obtain the yeast sediment, which was stored in Eppendorf tubes free of DNAsa and RNAsa, adding RNA later (RNAaseZap solution, Ambion - RNA technology), to be kept at -80 °C until the moment of RNA extraction.
2.5. RNA extraction
To obtain RNA, the protocol proposed in the extraction kit used (RiboPure - Yeast Kit, Ambion RNA technology) was followed and the manufacturer's recommendations were followed.
2.6. RNA extraction quality criteria
The solution with RNA was subjected to 1% agarose gel electrophoresis to observe the integrity of the genetic material, the RNA was considered not degraded when two bands appeared in the gel. Measurement of RNA purity was performed on the UVIS Drop UVS99™ spectrophotometer (Avans Biotechnology) with absorbance readings of samples at 230, 260, and 280 nm. Those RNAs with a 260:280 and 260: 230 ratios greater than or equal to 2 were considered to be of high purity and were subsequently used in RT-qPCR.
To assess the presence of DNA after DNAase I treatment, PCR amplification of one of the RNA samples was performed without reverse transcription, and in the presence of a universal primer for C. glabrata, it was evaluated whether there was residual DNA amplification. DNA-contaminated strains were subjected to a new DNAase I treatment.
2.7. Standardization of the protocol
For standardization, the C. albicans ATCC 90028. strain was used as a reference for a sensitive strain and a strain from the fluconazole-resistant group was randomly selected. All procedures were performed according to previously established guidelines to ensure adequate purity of the reactions and thus avoid contamination with RNA from other microorganisms.
2.8. Reverse Transcription (RT) Protocol
The reverse transcription process was performed on the StepOnePlus Real-Time PCR System thermal cycler (Applied Biosystems), with the following protocol: incubation at 25°C for 10 minutes, then at 42°C for 15 minutes, and finally, the enzyme was inactivated at 85°C for 5 minutes. The RNA obtained was converted to cDNA using the SensiFastTM cDNA kit (Bioline). The manufacturer's instructions were carefully followed, with no modifications to the protocol.
2.9. Selection and optimization of primers for qPCR
Table 1 describes the primers for the reaction for both the reference endogenous control gene and the resistance genes (
ERG3, ERG11, SNQ2, and
CgCDR1) [22–24].
2.10. qPCR experiment
Each of the assays of samples with and without exposure to fluconazole was performed with triple identical repeats on the StepOnePlus Real-Time instrument using the PowerUp SYBR Green Master Mix kit (Applied Biosystem). The specificity of the products of the q-PCR reactions was evaluated by analysis of the dissociation curves (Melting Curve).
Each q-PCR quantification reaction contained: 5 μL PorweUp SYBR Green Master Mix [2X], 0.8 μL of each primer pair, at a final concentration of 0,8 μM, 1 μL of DNAc (DNAc concentration adjusted to 1 ng/μL), the volume was made up to 10 μL with RNAse- and DNAse-free Water. The program consisted of an initial denaturation in two steps: 50°C for two minutes and 95°C for 10 minutes, followed by 40 cycles of denaturation at 95°C for 15 seconds and an extension at 60°C for 1 minute. In order to establish the DNAc dissociation temperature and identify nonspecific amplification reactions, the following parameters were used: 95°C for 15 seconds, 60°C for 1 minute, and 95°C for 15 seconds.
2.11. qPCR reaction analysis
Analysis of the reactions was performed by establishing the difference between the detection threshold crossing cycle (Ct), which exists between the resistance genes analyzed (and the reference endogenous control gene, for which C. albicans ATCC 90028 was used as the reference strain. Gene expression was quantified according to RQ (Relative Quantification). The analysis of the results was performed in the StepOne Plus Real-Time PCR software (Applied Biosystems). This same software allowed us to evaluate the efficiency of each of the reactions.
2.12. Molecular coupling
The molecular docking procedure was carried out using amino acid sequence and tertiary structure prediction for ERG3, ERG11, CDR1, and SNQ2 (Uniprot codes P50860, P50859, Q6FK23 and Q6FQN3). The maximum resolution of the available crystal structures corresponded to 2.0 Å. Protein models were downloaded from the online database CANDIDA-GENOME DATABASE with structural prediction coupled to the ALPHAFOLD program [25,26]. The formats .mol2 for fluconazole and .pdb for the protein structures of interest were used. The analysis generated by the AVOGADRO program version 1.2.0 [27] was used for energetic optimization of the substrate. The exploratory docking process was developed with the open-use programs PyRx-AutoDock Vina version 0.8 and CHIMERA version 1.16 [28]. Molecular outcome metrics were presented with the Delta-Gibbs metric or Gibbs free energy (ΔG kcal/mol).
2.13. Statistical analysis
According to the normality tests of the results of the relative expression of each gene of interest, parametric (T-Stundent) or nonparametric (Wilcoxon Ranges) statisticians were used to determine differences in means or medians. An alpha (α) of 0.05 was established for the level of statistical significance.
The multivariate analysis was based on Fisher's linear discriminant function pathway for the presentation of a predictive classification score for sensitivity (resistant or sensitive dose-dependent) of C. glabrata [29,30]. The variables entering the multivariate model corresponded to gene, strain, mean RQ without fluconazole, and mean RQ with fluconazole. This route proposed the generation of qualitative variables with a numerical value associated with the category (dose-dependent sensitive = 1, resistant = 2; ERG3 gene = 1, CDR1 gene = 2, SNQ2 gene = 3; strain 04-1A = 1, strain 07-1A = 2, strain 109-1A = 3, etc.). Numerical variables (Mean RQ with and without fluconazole) were assumed at their continuous values in the model. Statistical significance was considered with predictive model classification accuracies (discriminant function) ≥ 70%. Biostatistical analysis was supported with the SPSS-licensed licensed-IBM package version 26 [31].
3. Results
3.1. Results of the identical triple qPCR experiment with and without exposure to fluconazole
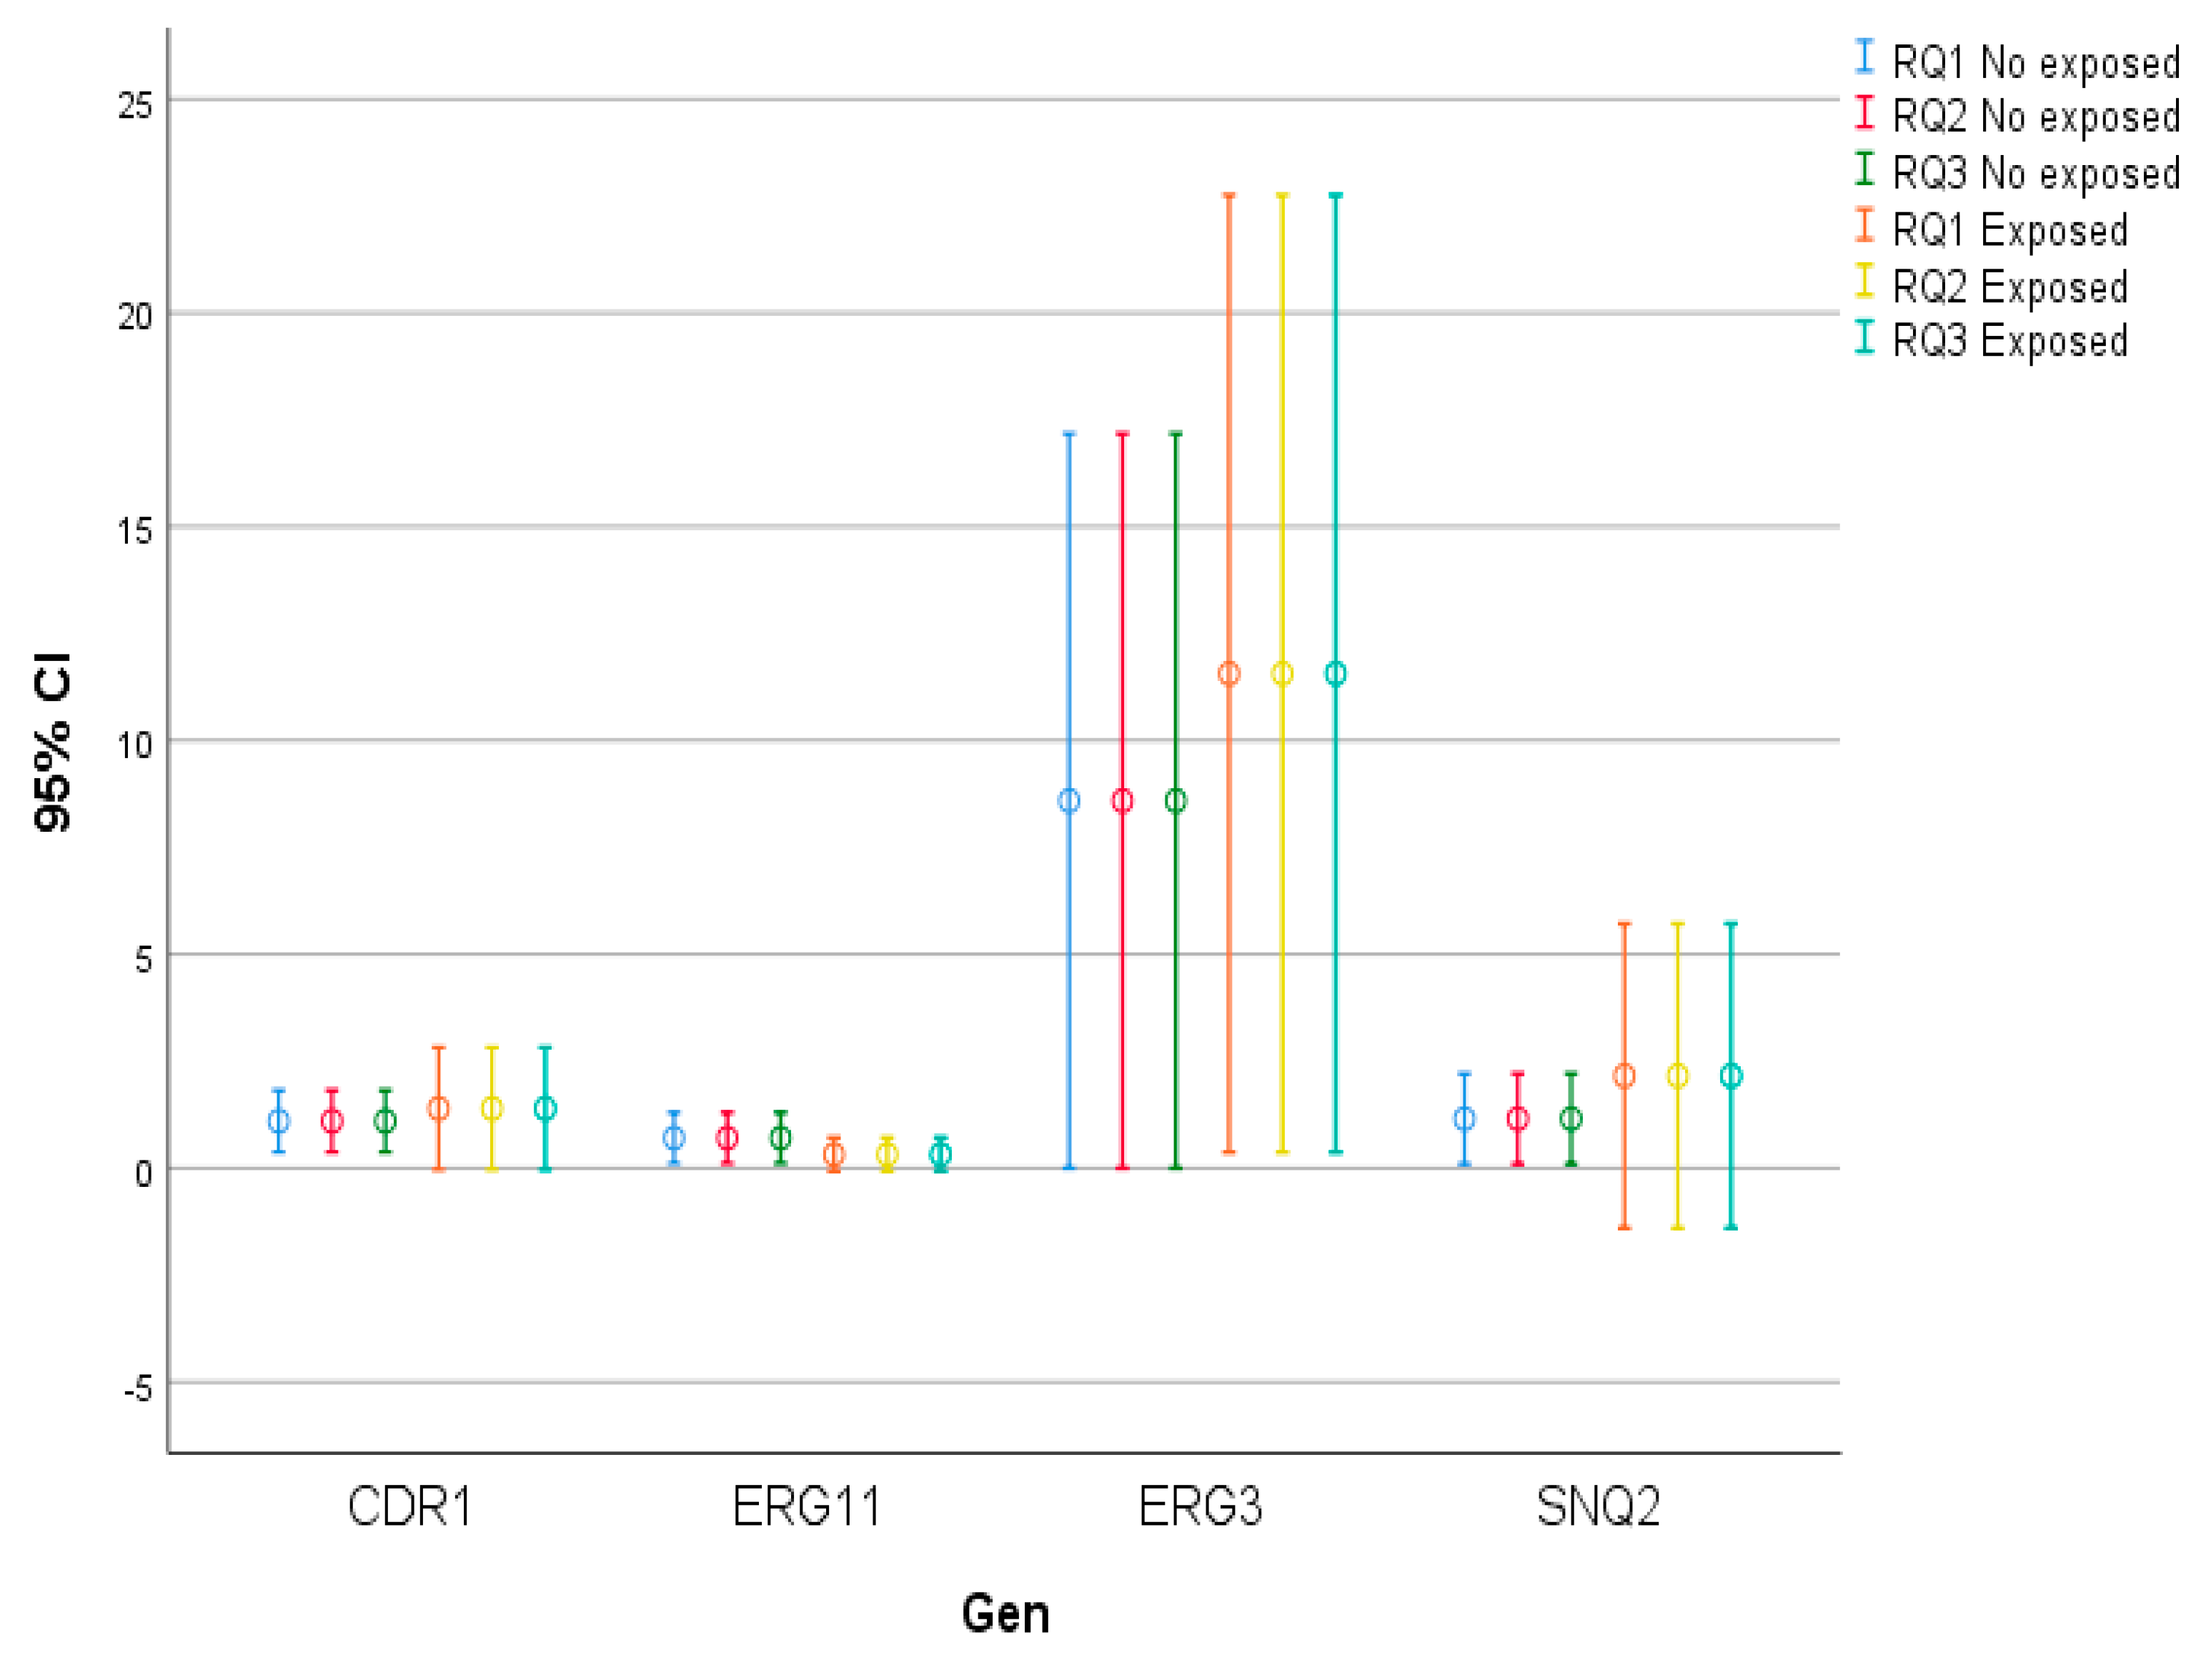
Table 2 and
Figure 1 below show the results of the identical triplicate assays of the qPCR experiment.
3.2. Relative expression analysis
As a result of fluconazole sensitivity testing, the 16 strains were classified as follows: 6 were found to be resistant (Samples: 06-3A, 95-1A,116-5,137-1,184-1A, 65-3) and 10 dose-dependent sensitive (Samples: 11-3A, 04-1A, 16-5A, 24-5A, 25-1A, 20-2A, 14-5A, 07-1A, 68-4, 109-1A). For the analysis of the results of the relative expression of the CDR1, ERG11, ERG3, and SNQ2 genes, the relative expression value of the endogenous URA3 gene, was used as a reference. Additionally, by parametric and non-parametric analysis routes, the medians and/or averages of relative gene expression were compared based on the condition of exposure or not to fluconazole, to determine differences in the level of expression.
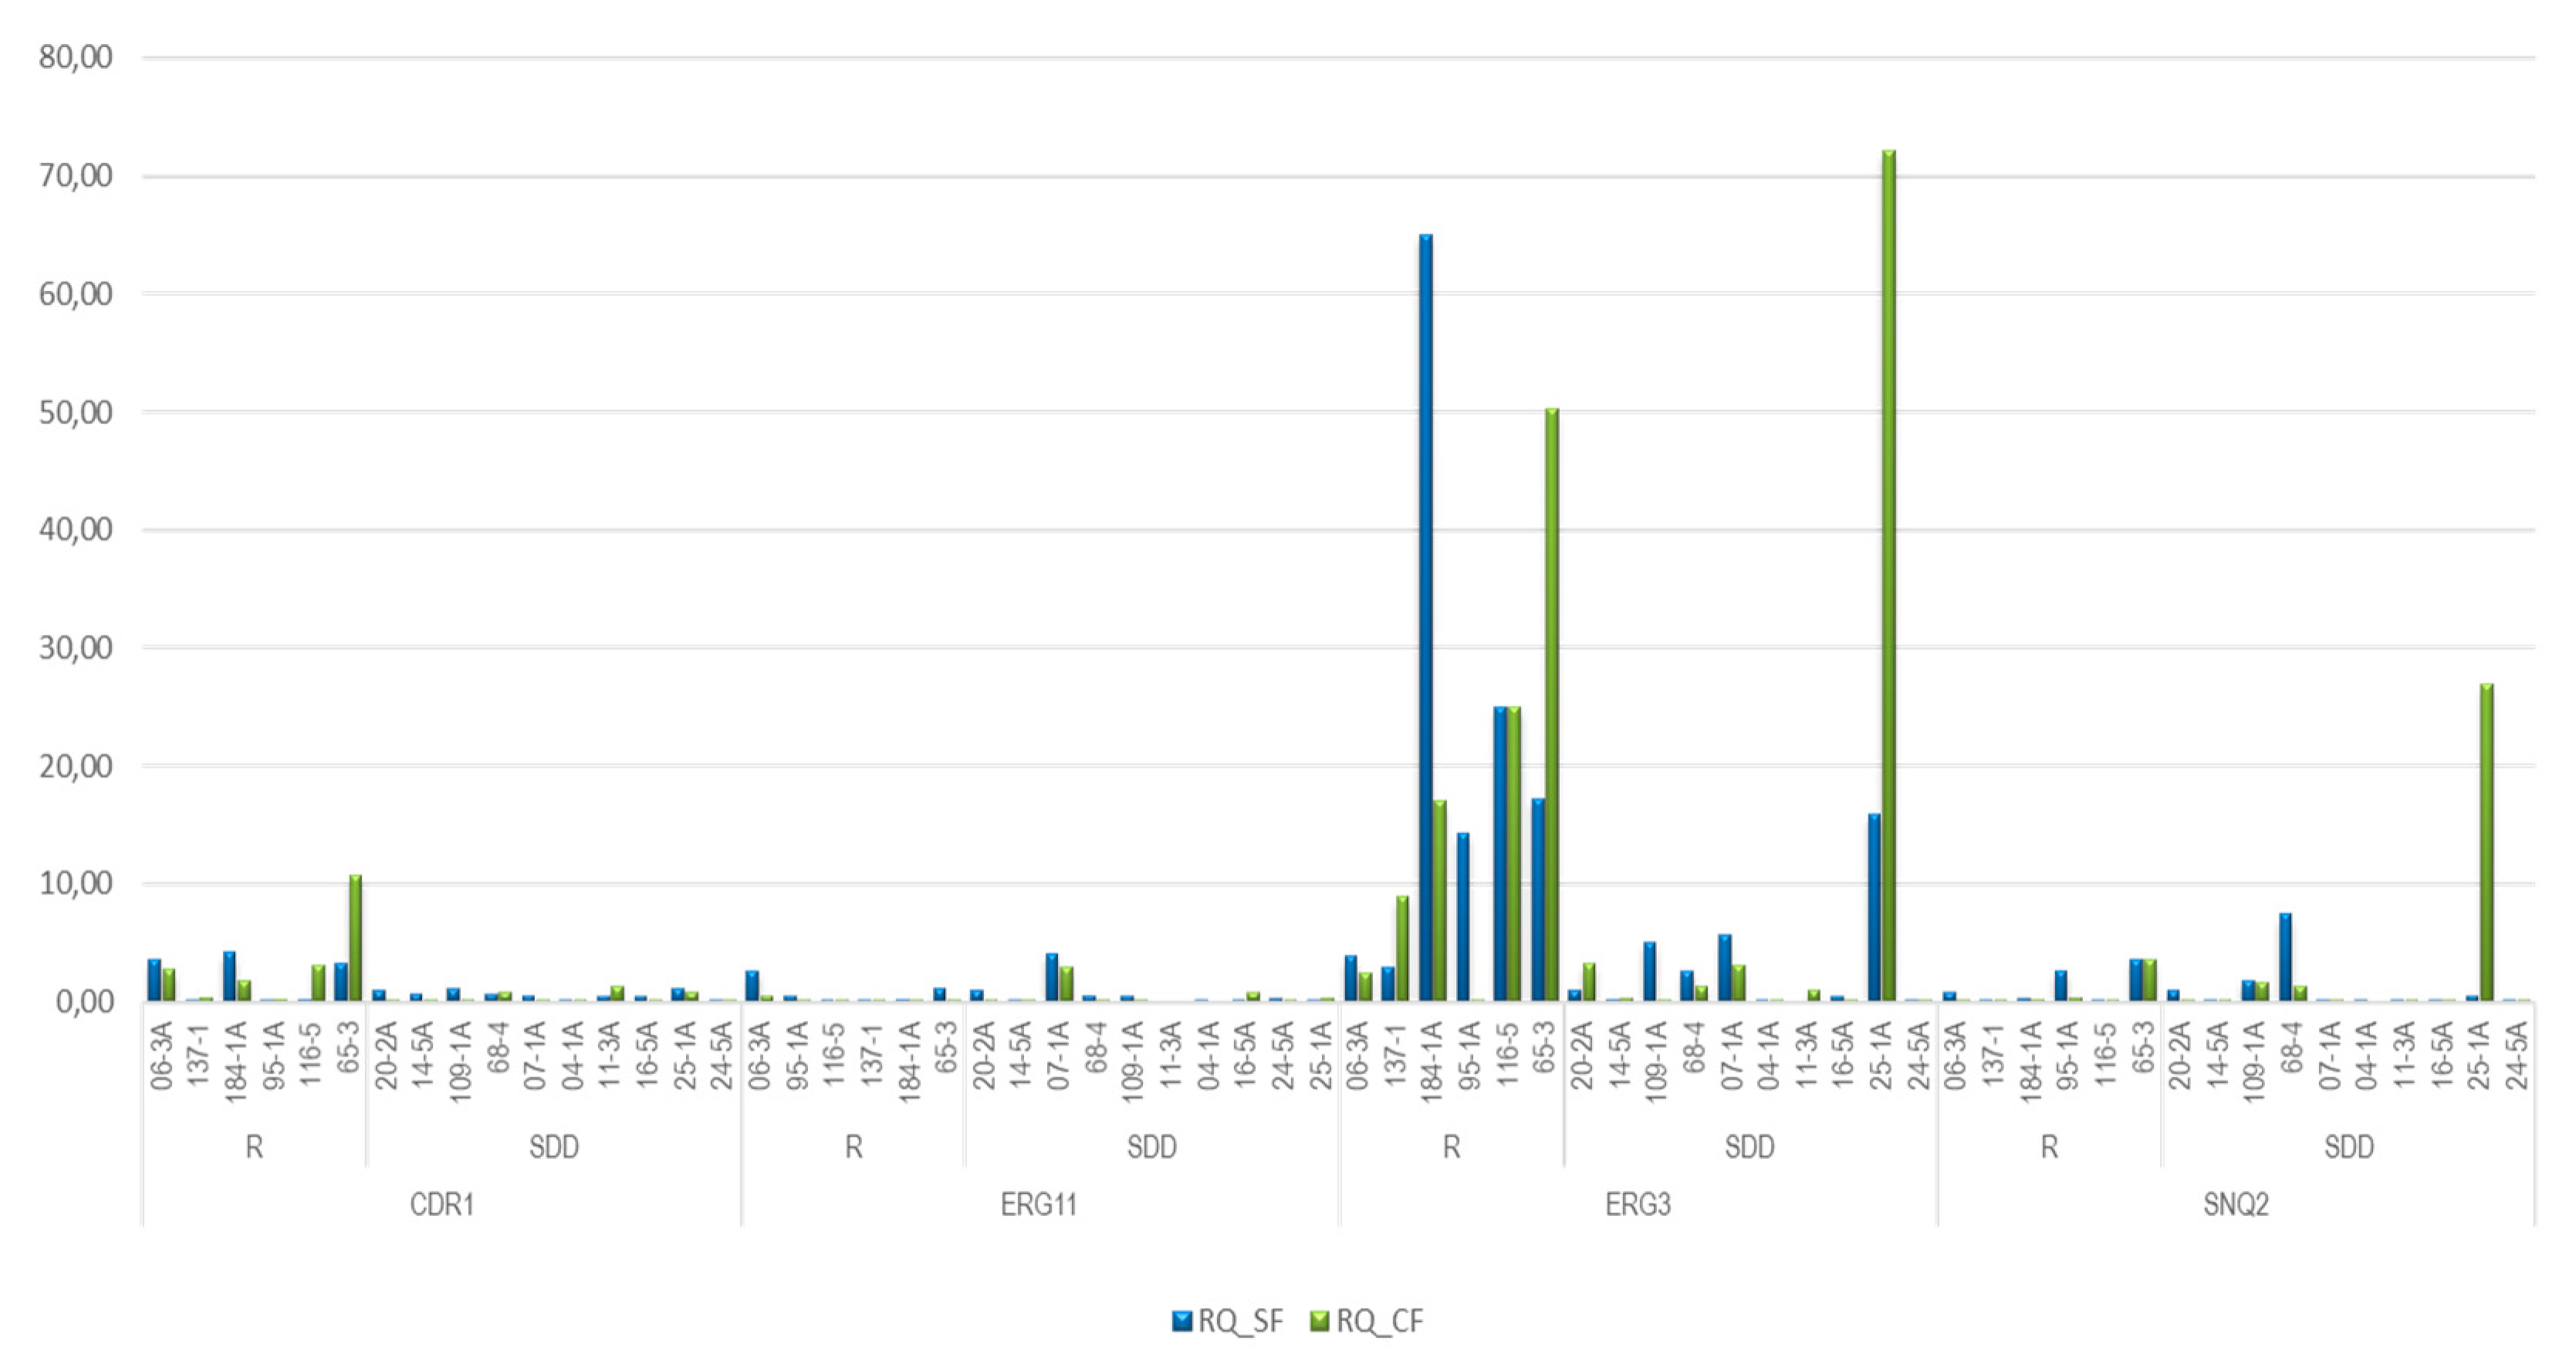
As shown in
Figure 2, the relative expression (RQ) of the genes studied in the 16 strains, under the condition of exposed and non-exposed to fluconazole, independent of the antifungal sensitivity profile, indicated that the relative expression of the exposed strains was higher than that of the non-exposed strains, in
ERG3 (RQ difference between exposed - unexposed strains=1.61 p=0.776), followed by
SNQ2 (RQ difference exposed - unexposed strains= 1 p=0.044) and finally
CDR1 (RQ difference exposed - unexposed strains= 0.3 p=0.523). On the contrary, the
ERG11 gene expression was higher in strains exposed to fluconazole than in non-exposed strains (RQ difference between exposed and non-exposed strains = -0.38, p=0.034).
Out of the 6 strains classified as resistant to fluconazole, independent of antifungal exposure, all overexpressed at least one gene and, interestingly, the ERG3 gene was overexpressed in all of them, the CDR1 gene was overexpressed in 4 (06-3A, 184-1A, 116-5 and 65-3), the ERG11 gene in 2 (06-3A and 65-3) and the SNQ2 gene in 2 strains (95-1A, 65-3).
The strain 65-3 had a higher relative expression of CDR1 and ERG3 genes than other strains, in contrast with a very low relative expression of ERG11 and, additionally, under the condition of no exposure to fluconazole, it overexpressed the 4 genes object of this study, while the same strain exposed to the antifungal did not overexpress the ERG11 gene. A similar phenomenon occurred with strain 06-3A, which without exposure overexpressed the CDR1, ERG11, and ERG3 genes and upon exposure to the antifungal did not overexpress the ERG11 gene.
The descriptive analysis and the results of the parametric and nonparametric tests on the relative expression of the genes under study are reported in
Table 3.
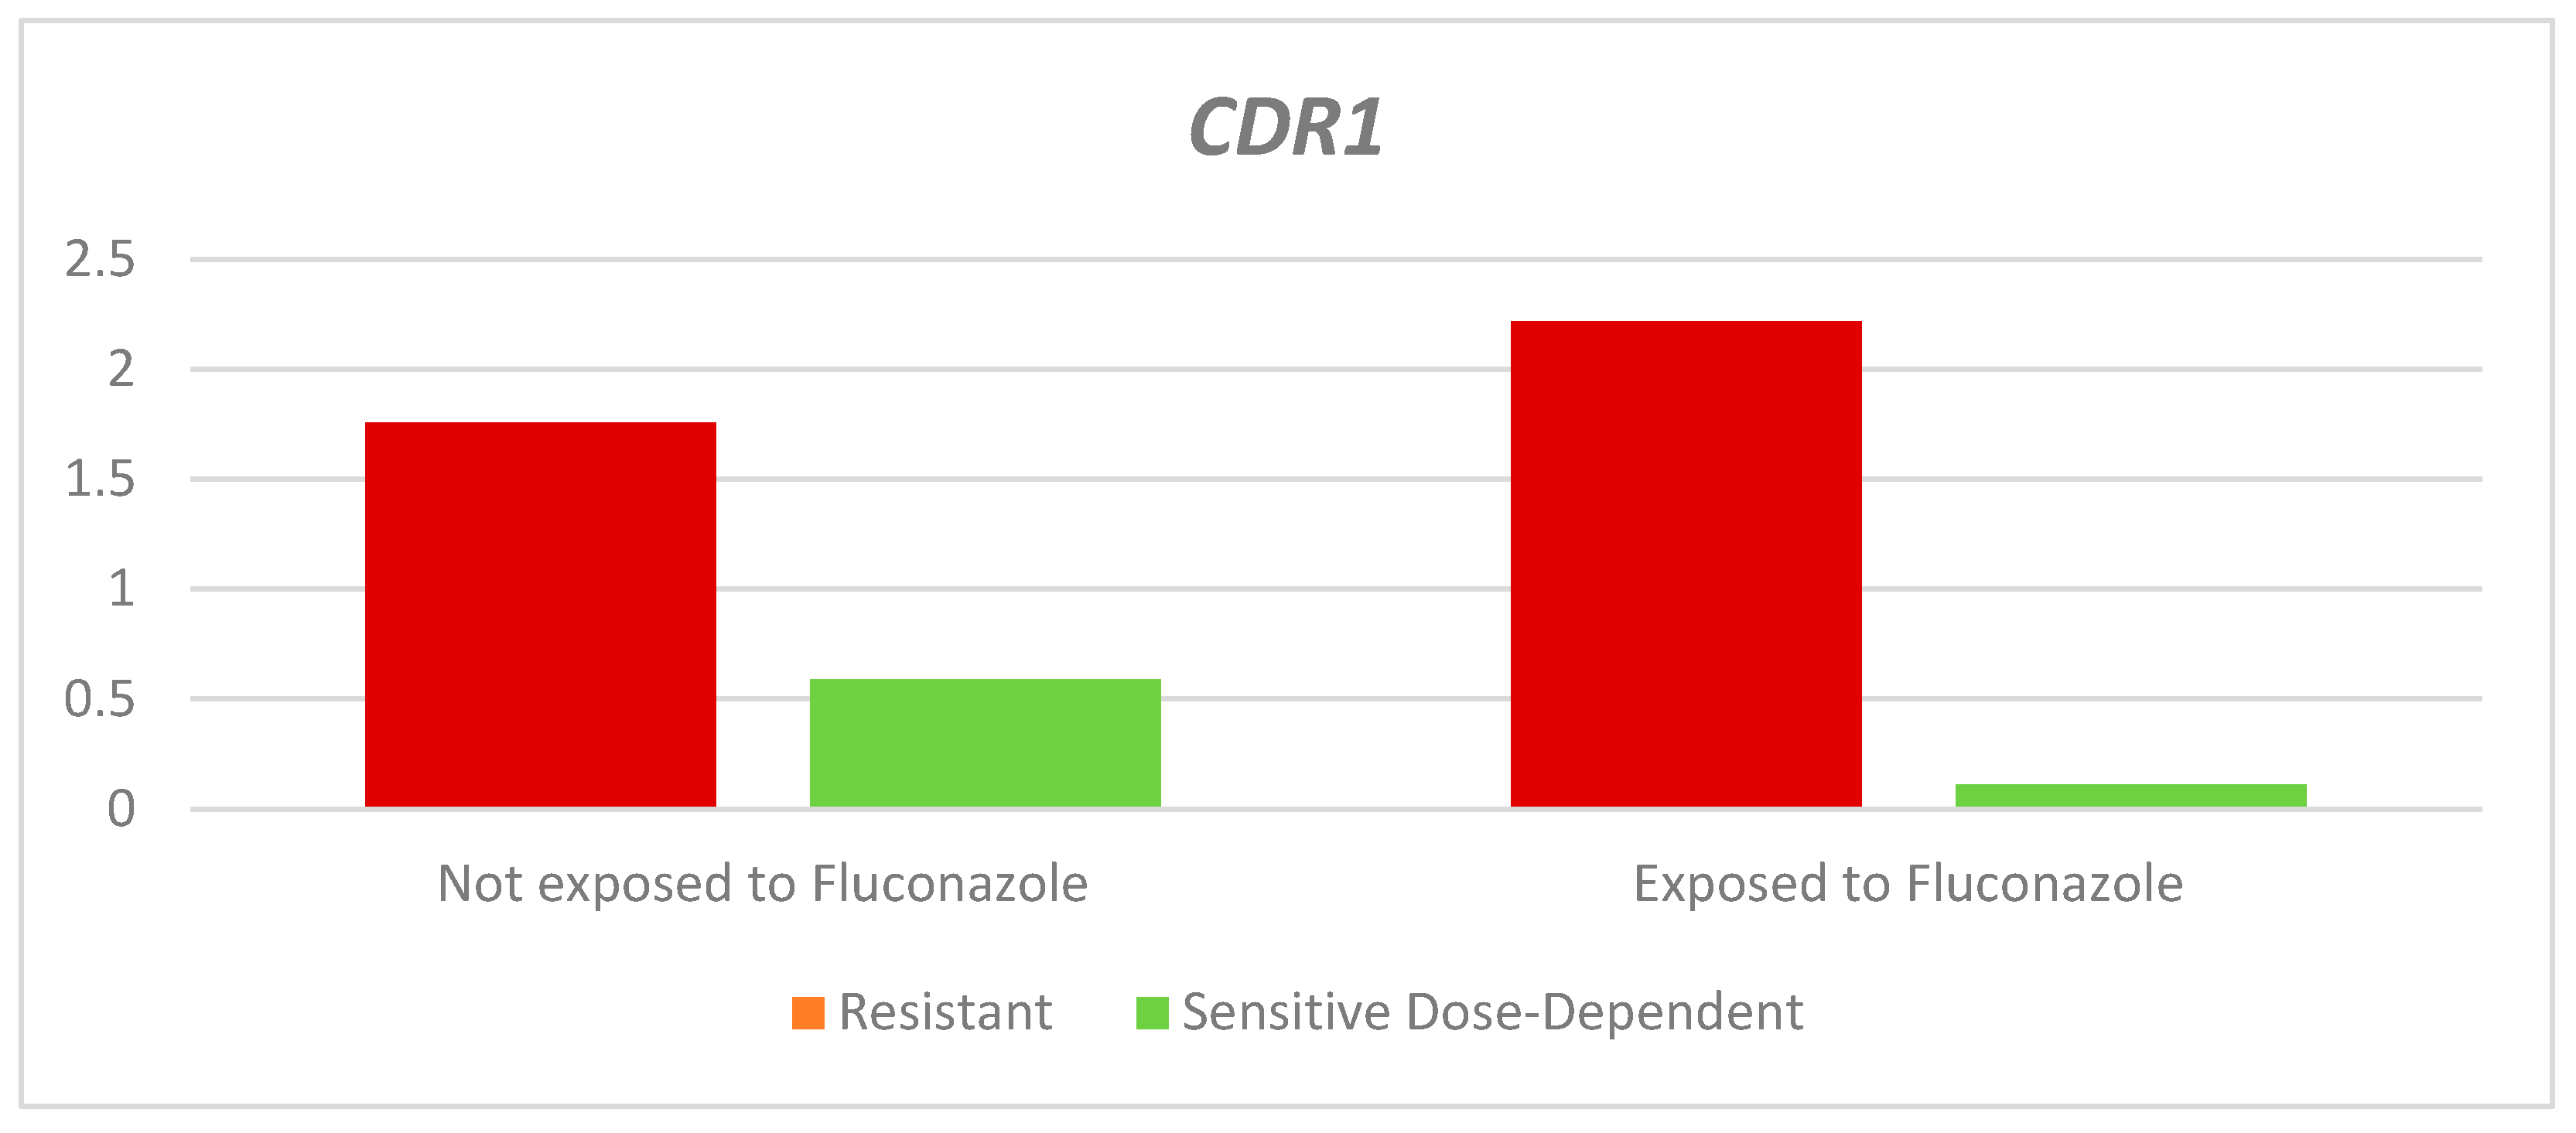
As shown in
Table 3 and
Figure 3, the relative expression of the
CDR1 gene in the resistant strains exposed to fluconazole was higher than in those not exposed; however, this difference was not statistically significant (Exposed: 2.22 - Not exposed: 1.76. p= 0.231). Dose-dependent sensitive strains exposed to fluconazole were found to have lower relative expression than non-exposed strains; this difference was statistically significant (RQ-Dose-dependent sensitive: Exposed: 0.11 - Non-exposed: 0.59. P=0,046).
According to the classification according to the sensitivity profile, a higher median QR was obtained in the resistant strains, both in those exposed and not exposed to fluconazole, than in the dose-dependent sensitive strains.
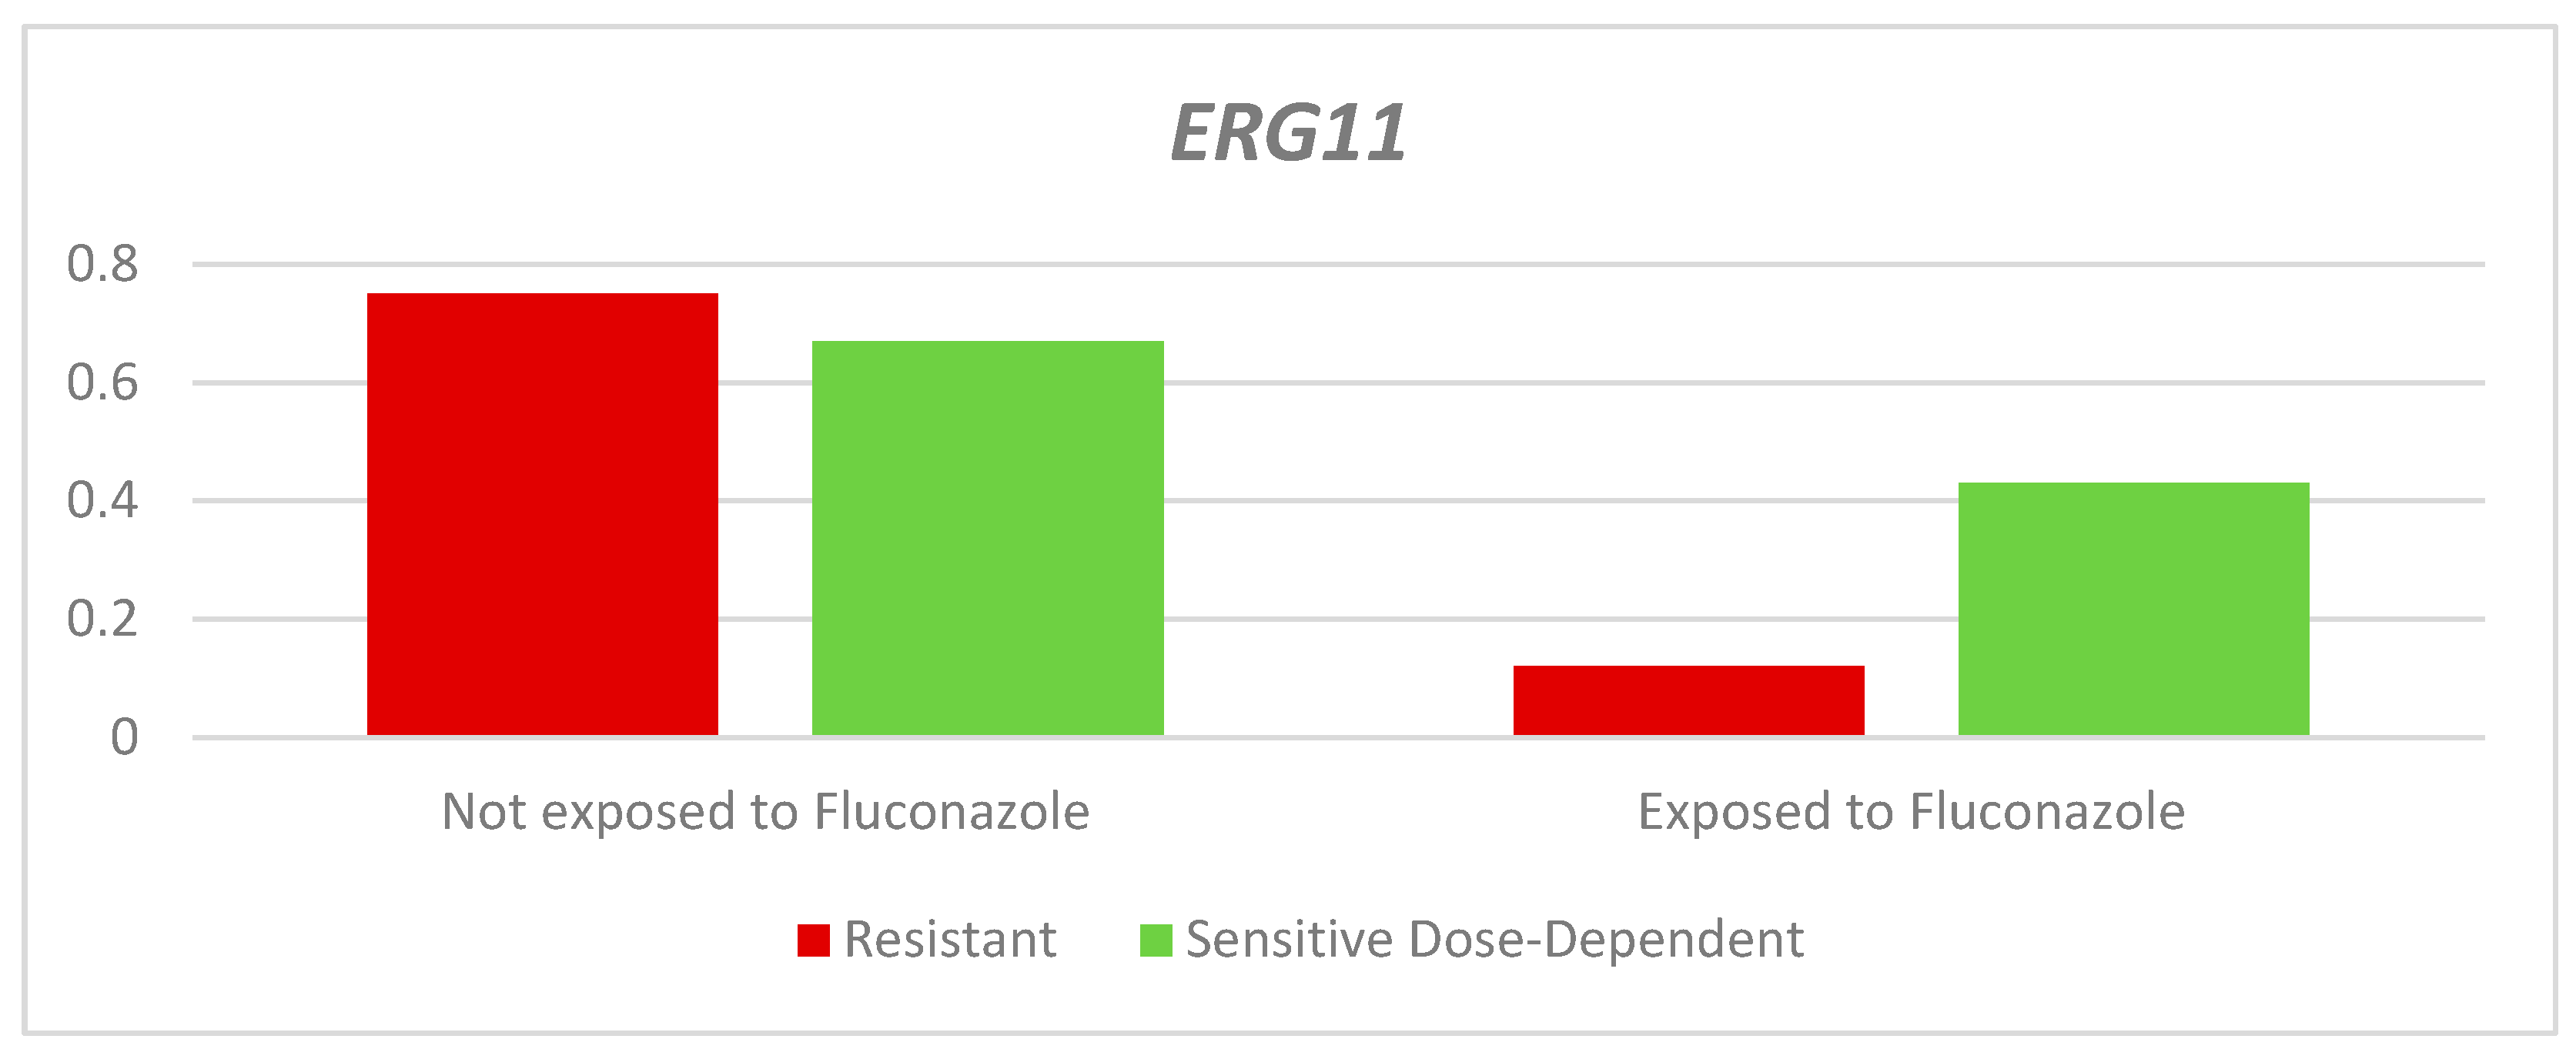
The relative expression of the
ERG11 gene in the dose-dependent resistant and sensitive strains was lower in those exposed to fluconazole than in those not exposed; however, this difference was not significant (RQ-Resistant: Exposed: 0.12 - Unexposed: 0.75. p= 0.065. Dose-dependent RQ-Sensitive: Exposed: 0.43 - Not exposed: 0.67. p= 0.086). Between the two groups according to the sensitivity profile, there was a higher average QR in the dose-dependent sensitive strains than in the resistant strains (
Table 3 and
Figure 4).
On the other hand, the relative expression of the
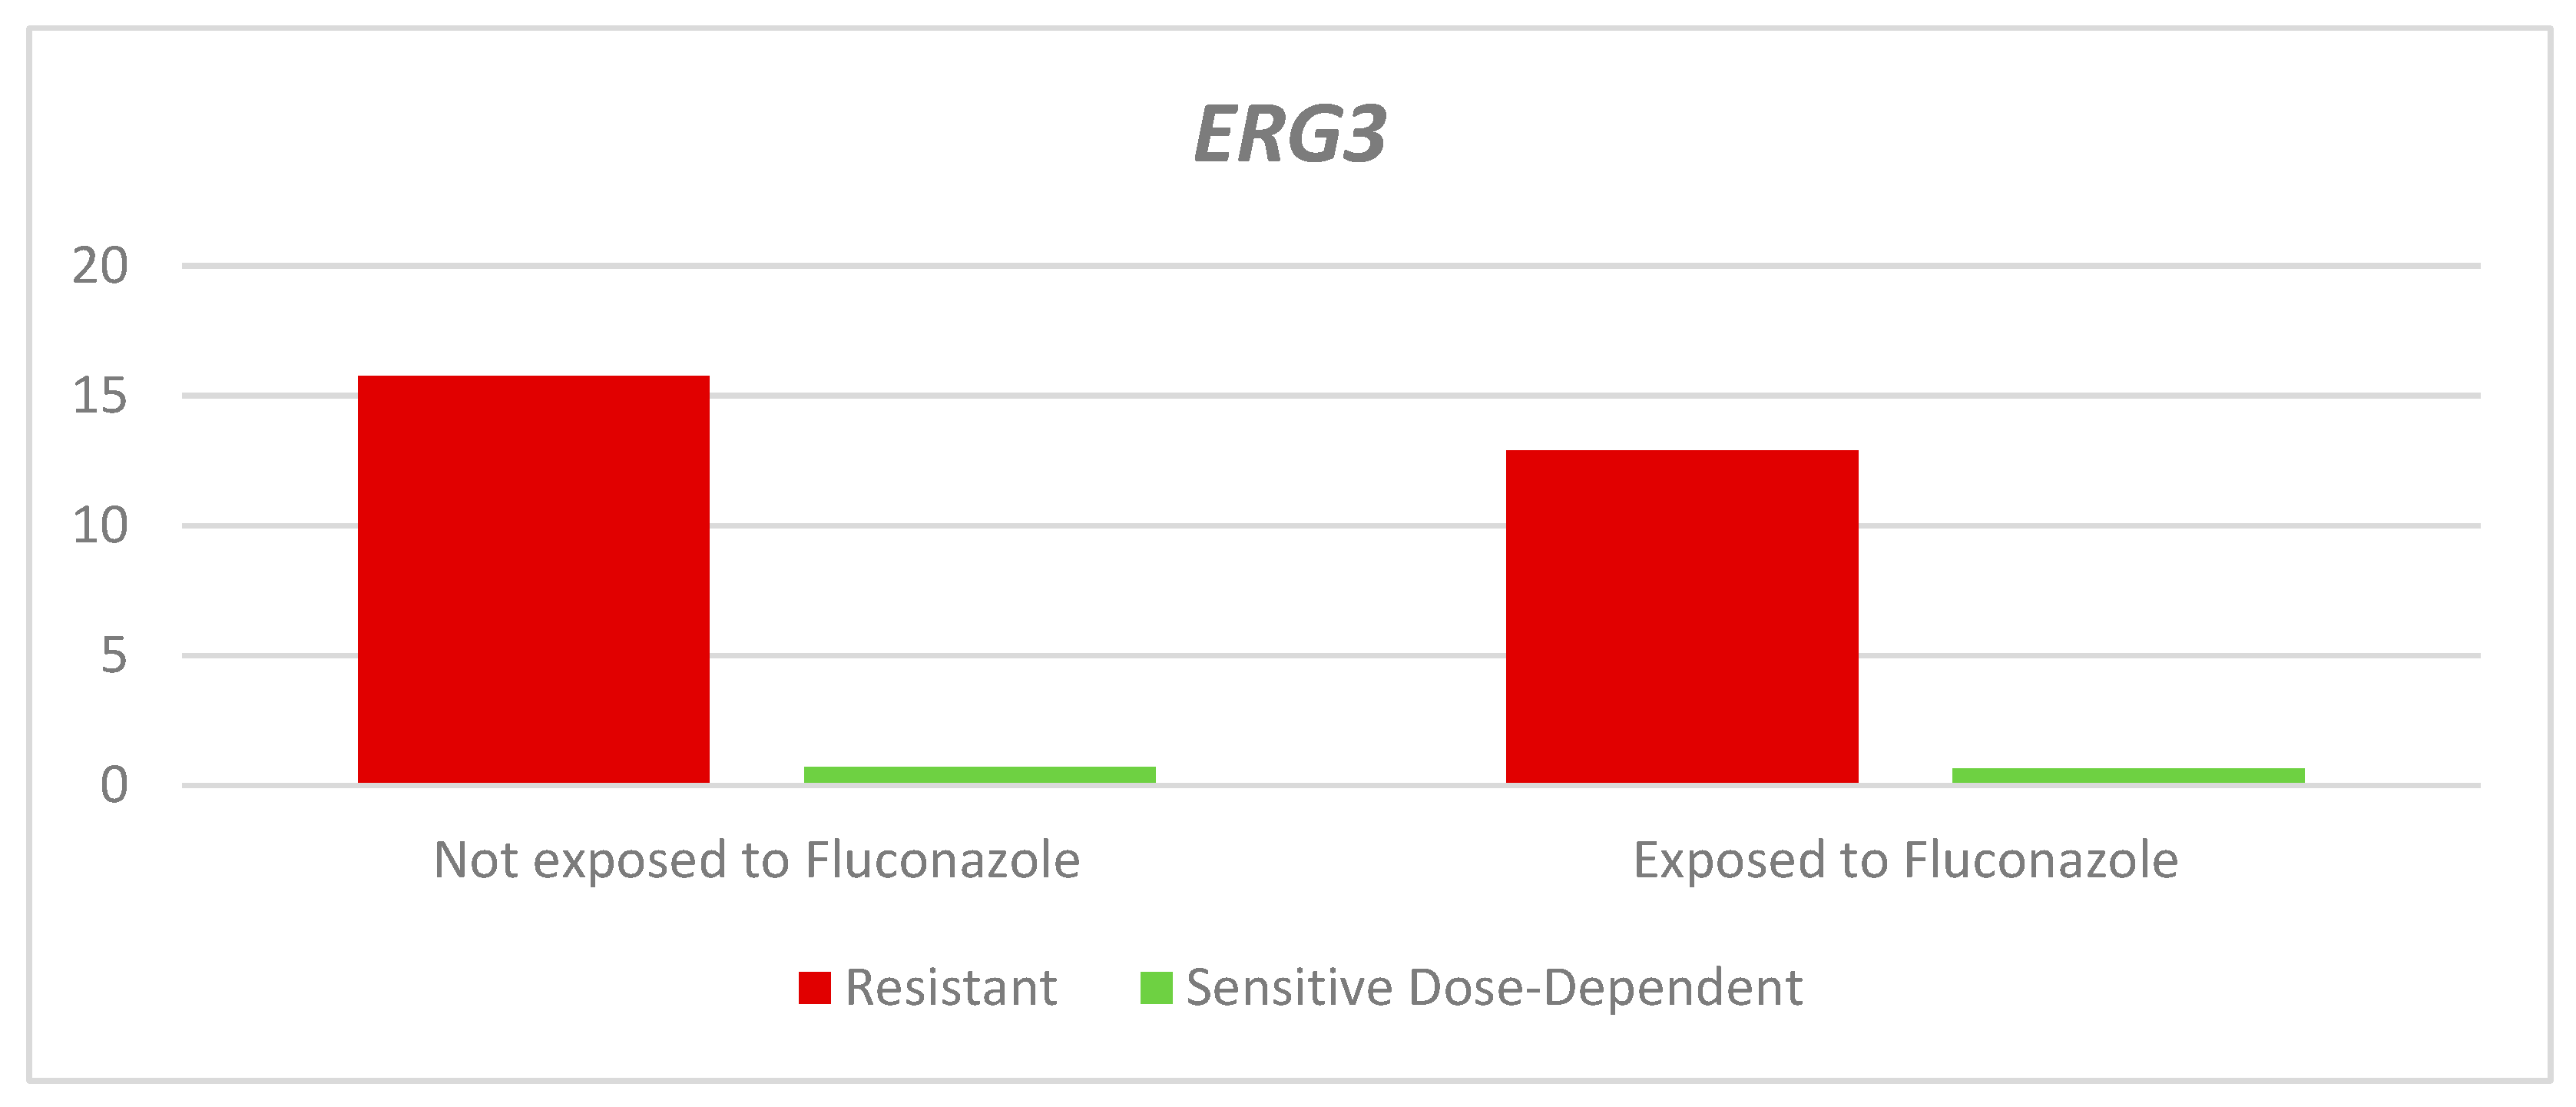
ERG3 gene in the dose-dependent resistant and sensitive strains exposed to fluconazole was lower than in the non-exposed strains, with statistically non-significant differences (RQ-Resistant: Exposed: 12.9 - Unexposed: 15.77 p= 0.343. RQ- Dose-dependent sensitive: Exposed: 0.66 - Not exposed: 0.71. p= 0.399. There was a higher median QR in the resistant strains, both exposed and not exposed to fluconazole than in the dose-dependent sensitive strains, as shown in
Table 3 and
Figure 5.
Finally, the relative expression of the
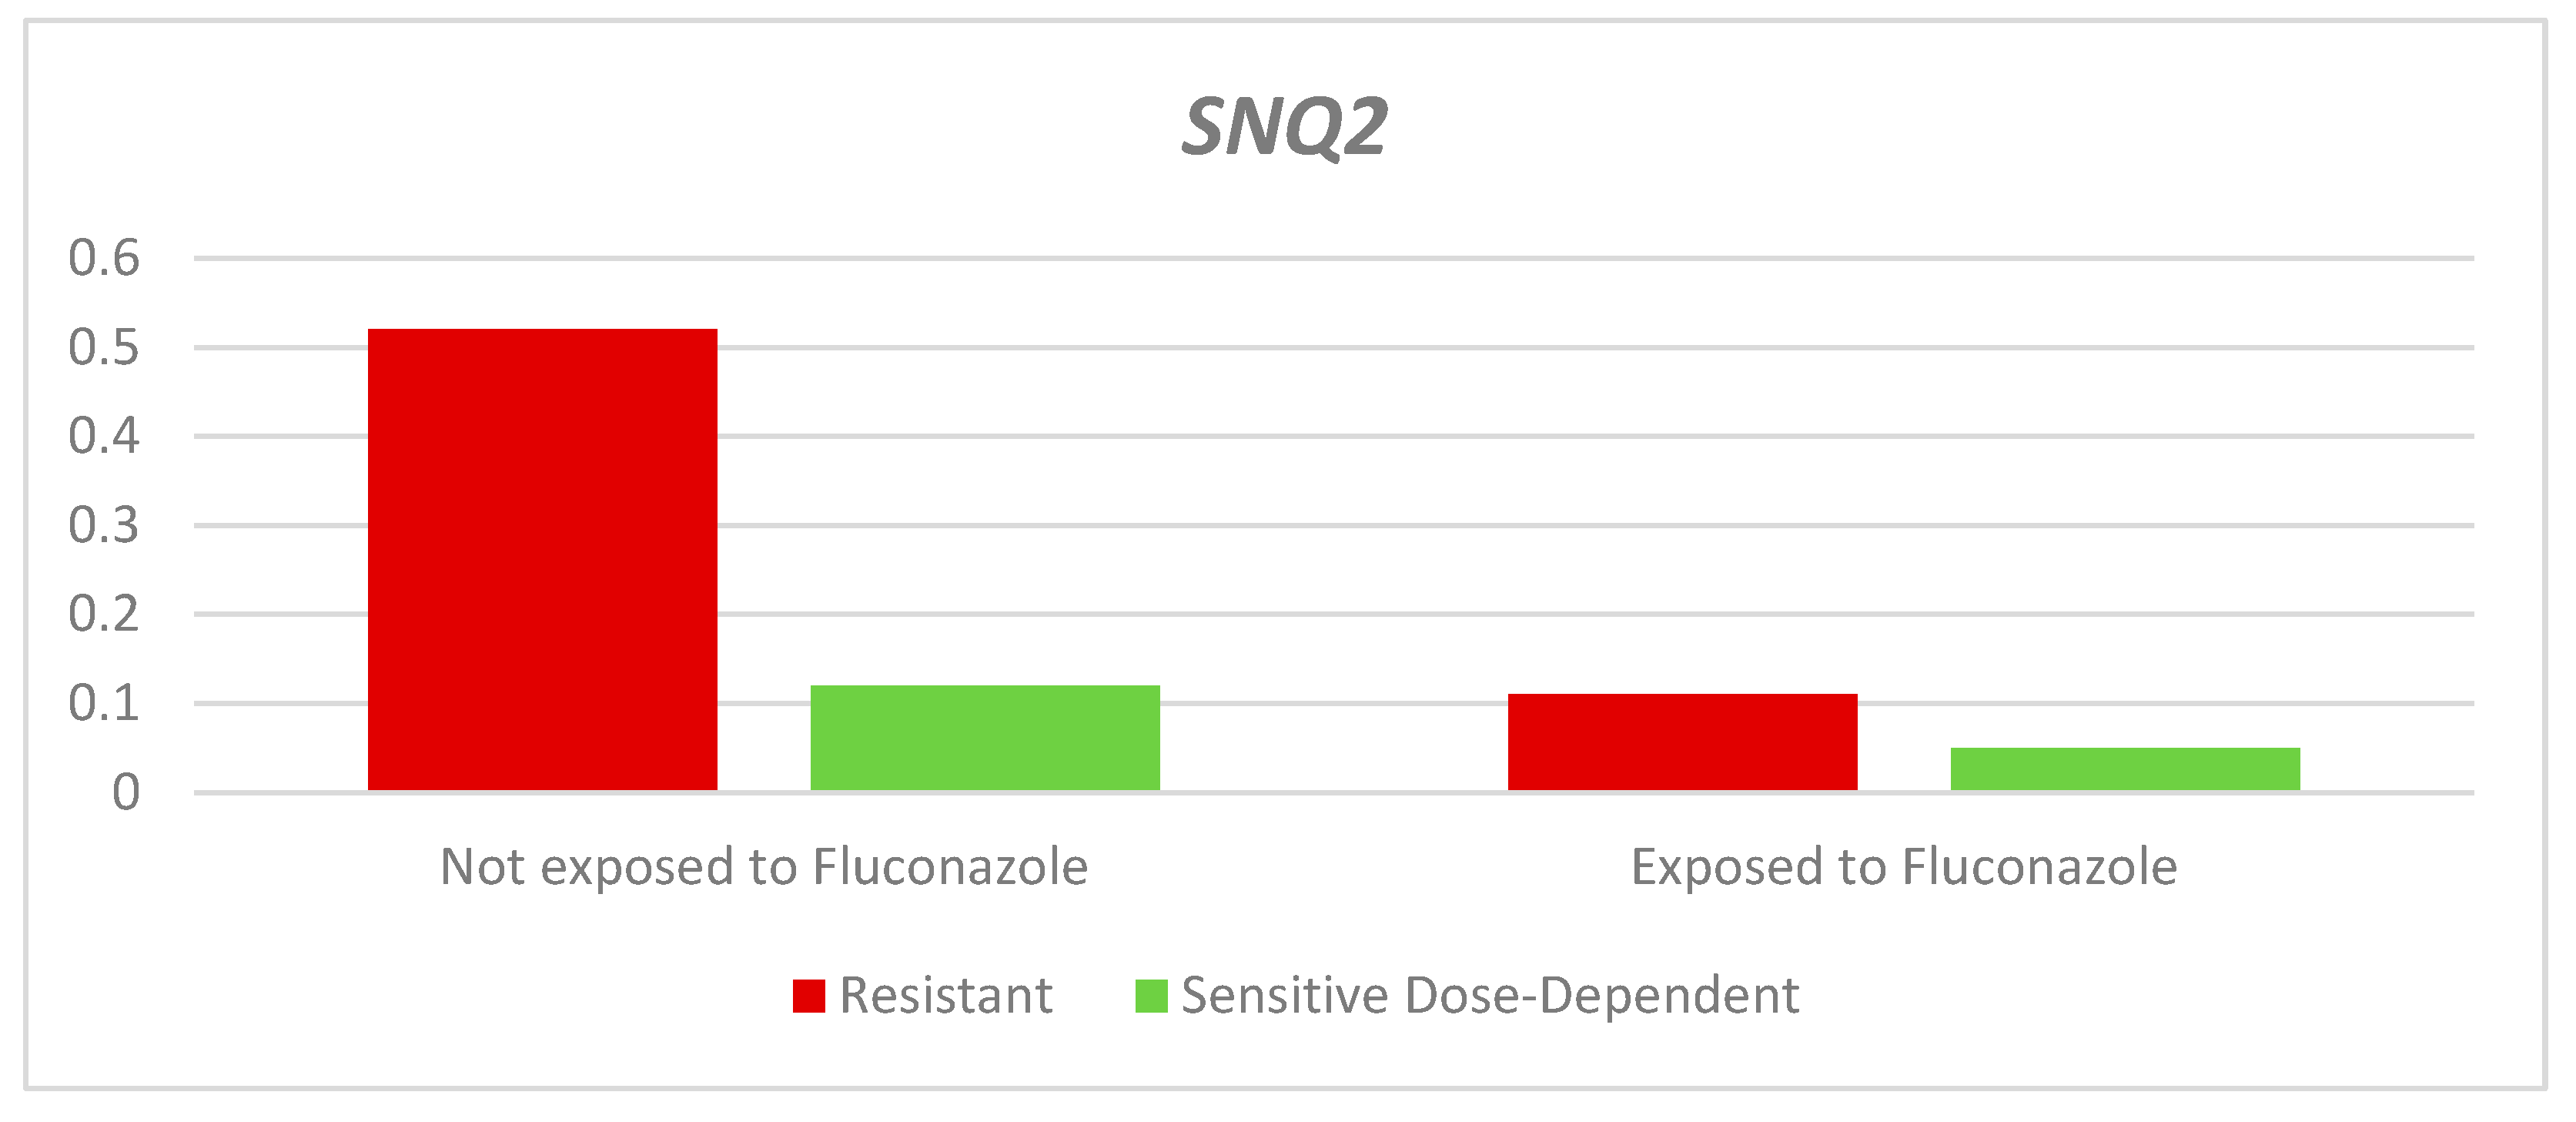
SNQ2 gene in the resistant and dose-dependent sensitive strains was lower in the strains exposed to the antifungal agent; however, the difference was only significant for the resistant group (QR- Resistant: Exposed: 0.11 - Not exposed: 0.52 p= 0.014. QR- Dose-dependent sensitive: Exposed: 0.05 - Not exposed: 0.12. p= 0.166). The median QR was higher in both exposed and unexposed resistant strains compared to dose-dependent sensitive strains (
Table 3 and
Figure 6).
3.3. Results of the predictive model on the susceptibility profile
Multivariate evaluation by Fisher's discriminant function route generated the following coefficients for susceptibility profile classification (
Table 4).
The overall comparative classification result between the original finding of the sensitivity profile by macrodilution testing versus the classification predicted by the model generated classification accuracy in 73.5% of cases.
The use of the coefficients is described in
Table 5 below. If the findings in the research correspond to the
CDR1 gene (categorical value = 2), from
C. glabrata strain 07-1A (categorical value = 2), with a mean RQ without fluconazole of 0.57 and a mean RQ with fluconazole of 0.22; they are replaced with the product of the coefficients and the products are then added together.
The total values are compared, and the upper value defines the predicted profile; in this case, the DDS category is predicted under the characteristics of the example. This classification is considered correct (accuracy) by the model in 73.5% of the cases.
3.4. Molecular Coupling
Molecular processing using basic structural bioinformatics techniques (rigid docking) allowed us to obtain the ΔG values for the relationship between the proteins expressed from
C. glabrata ERG3, ERG11, CDR1, SNQ2, and the substrate fluconazole.
Table 6 describes the findings of the energetic molecular metrics for the main positions (interaction site) between fluconazole and the mentioned proteins.
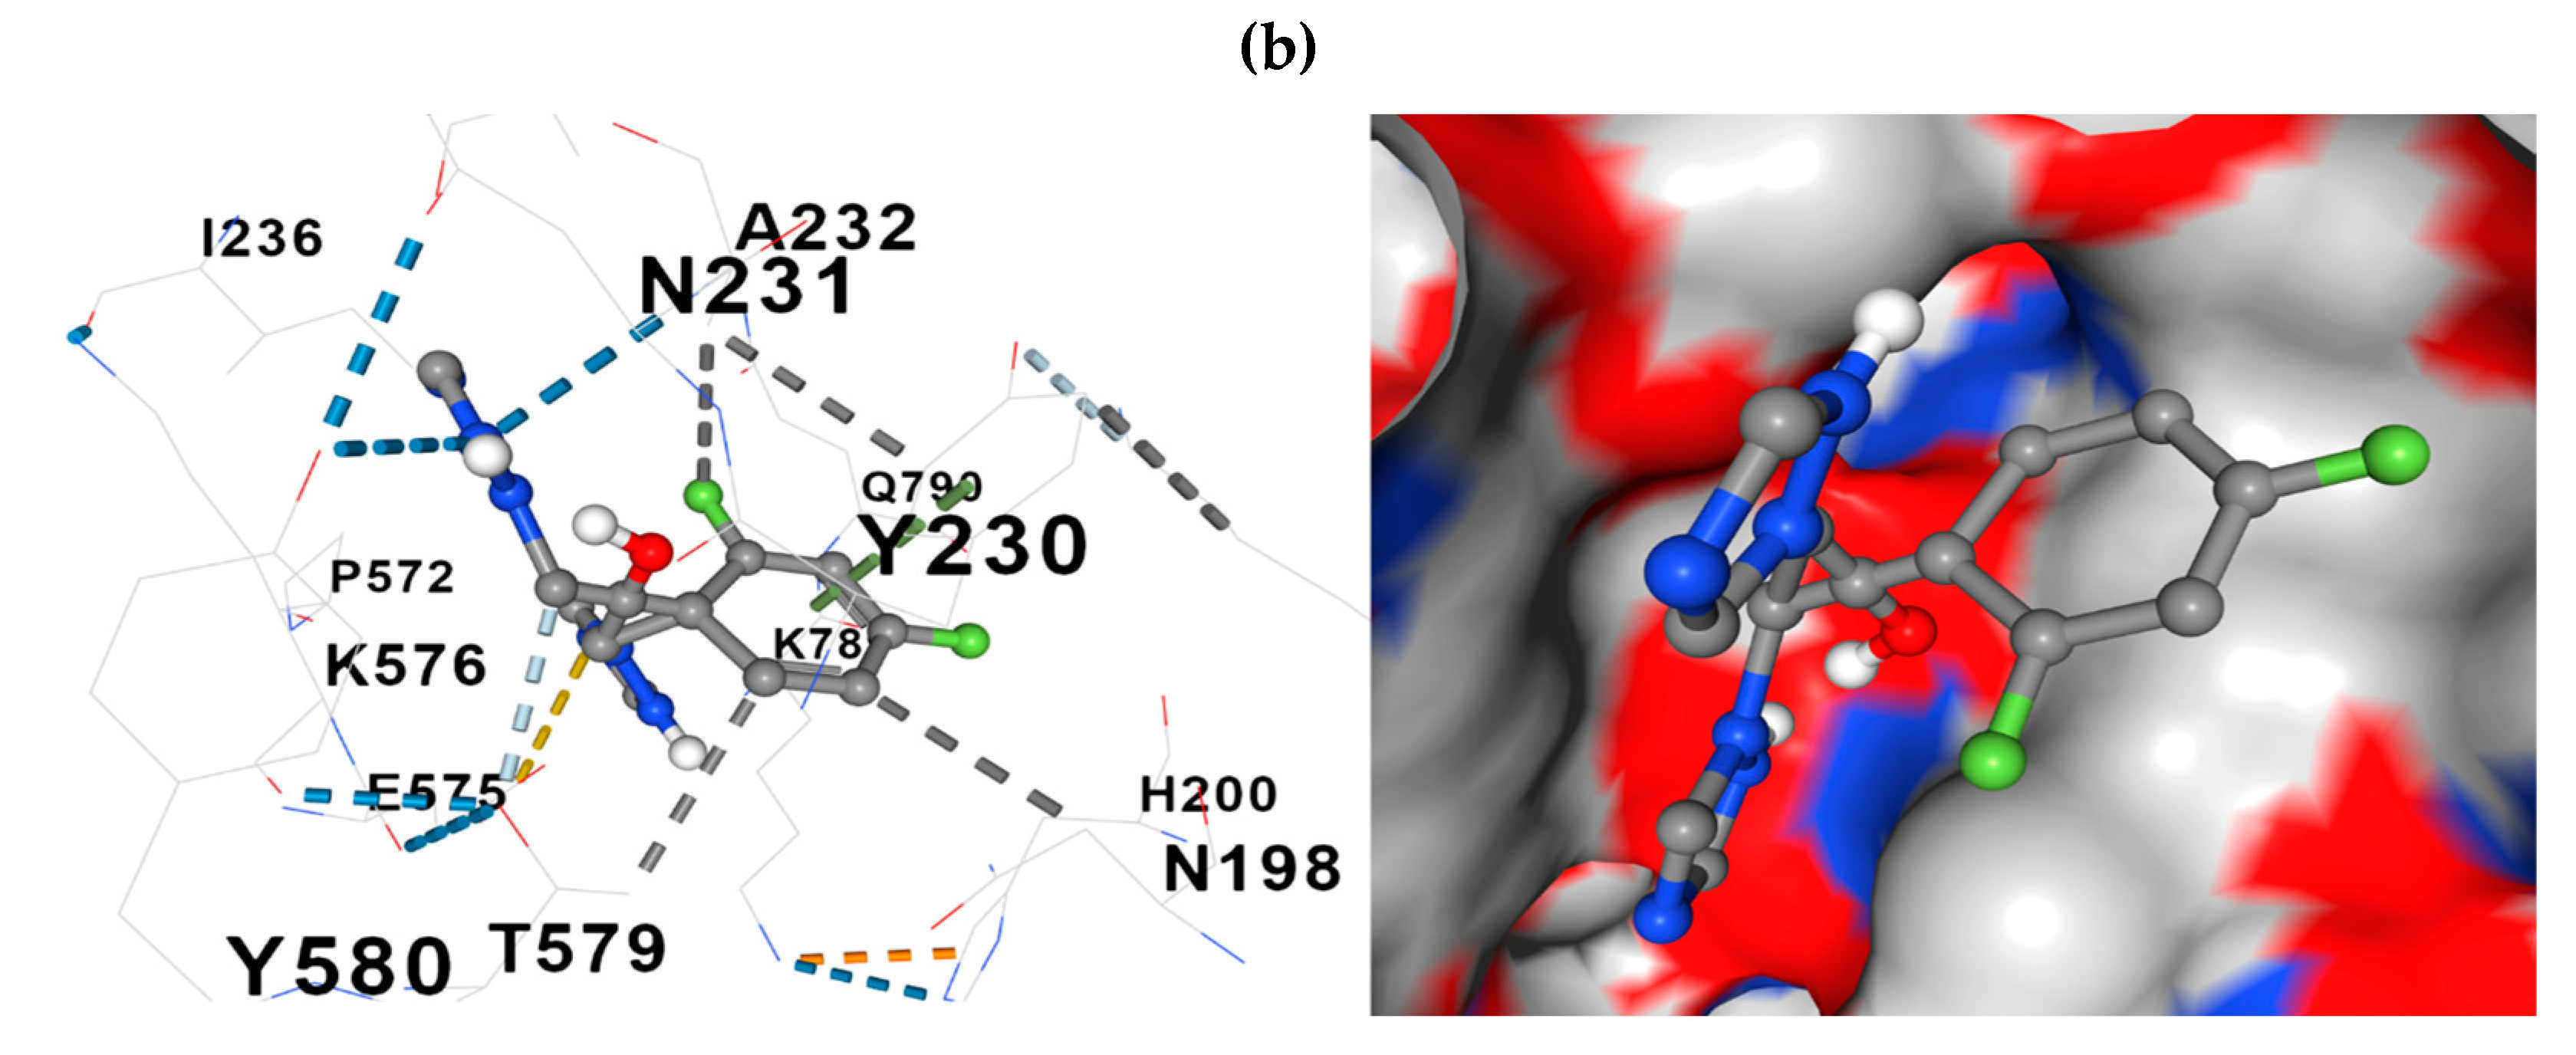
The docking model further revealed the relationships between the constituent amino acids and fluconazole at the docking site. Two representative models of the process are presented in
Figure 7: fluconazole -
ERG11 and fluconazole -
CDR1.
A median number of detected contacts for the fluconazole-ERG11 interaction of 10 and the fluconazole-CDR1, -ERG3, -SNQ2 interaction, a median of 13, stand out in the docking results.
4. Discussion
This study addressed the quantification of the expression of some genes present in the species C. glabrata, which encode either for pharmacological efflux transporters or for enzymes involved in the ergosterol biosynthesis pathway.
The genes coding for efflux transporters addressed in this study were CDR1 and SNQ2, and their expression findings allowed us to identify that regardless of the sensitivity profile to fluconazole, the strains exposed to the antifungal had higher relative expression than those not exposed, so that there was a greater amount of pharmacological efflux transporters willing to decrease the intracellular concentrations of fluconazole in the experimental group intervened with the antifungal; In addition, it was possible to identify that the resistant strains also had a higher expression than those classified as dose-dependent sensitive.
In a complementary perspective, the findings from the molecular perspective allow us to identify that the detected phenotype of activity of C. glabrata, establishes a limited pharmacological response in the scenario of overexpression of the CDR1 gene and that the affinity between fluconazole-SNQ2 is superior concerning the rest of the genes of interest in this study; and although no other research was found in which computational techniques were used to analyze molecular coupling, other studies with similar results were found, in which it has been determined that azole resistance is related to the overexpression of genes that encode for efflux pumps, such as the CDR1 and SNQ2 genes that encode for proteins of the ATP- Binding Cassette (ABC) superfamily [7,10,18,32–37].
Researchers Karl-H, Joseph-N and Tomas-E conducted a study on resistance in C. albicans and identified that deletion of the ERG11 gene was associated with a positive regulation of ERG3 expression, as well as the presence of enzyme inhibitor drugs and genetic lesions in ergosterol biosynthesis caused an increase in ERG3 mRNA levels [38], although this finding does not correspond to the same species, it may biologically behave in a similar way in the Candida genus, since in our study we were able to identify in general very low ERG11 expression values, most of them even lower than 1, which corresponds to the expression of the reference strain, in contrast to much higher ERG3 expression values; also, our results showed overexpression of ERG3 in almost all strains, both resistant and dose-dependent sensitive, a situation that could be extrapolated to lower susceptibility to the action of fluconazole; however, ERG3 expression was highlighted by very high values in those classified as resistant compared to dose-dependent sensitive strains; it is plausible that ERG3 overexpression is an early cellular stress response to try to maintain membrane integrity in the presence of azole-generated blockade of the enzyme encoded by ERG11, particularly in C. glabrata, which is intrinsically less susceptible to fluconazole, a finding consistent with molecular docking results that indicate limited affinity between fluconazole and ERG11 [39–41].
The available studies have focused on investigating loss-of-function mutations of ERG3, which can be a biological response subsequent to overexpression, in which the inactivity of the enzyme encoded by ERG3 derived from loss-of-function mutations results in a decrease in the synthesis of toxic sterol intermediates in the presence of azoles and, of course, favors the survival of the fungus [14,18,20]; However, studies do not focus their interest on the quantification of expression, so that the references that can provide valuable information on ERG3 expression and resistance to azoles/fluconazole in Candida spp and especially in C. glabrata are scarce and the relationship between ERG3 expression levels and azole resistance is not clear.
Exposing resistant strains to the antifungal decreased ERG11 gene expression. The relative expression of the ERG11 gene was low in both resistant and SDD strains, as well as low in strains exposed to the antifungal as in those not exposed; only three strains showed expression levels higher than 1, these results in the expression of the ERG11 gene may be related as one of the biological conditions that explain the lower intrinsic susceptibility of C. glabrata to fluconazole, concerning other Candida species; since it is coherent to think that the low expression of the gene can affect the synthesis of lanosterol 14 alpha-demethylase and result in decreased pharmacological efficacy due to reduction of the pharmacological target [42].
There is little scientific evidence and the studies found do not report the specific values of ERG11 expression in C. glabrata, in order to take the results as a reference and come closer to a better understanding of the phenomenon, which makes it necessary to conduct further research to broaden the conceptual reference.
The analyses in this study were conducted using colonisation strains taken from patients who had not undergone pharmacological interventions with fluconazole, and no information related to clinical variables was collected. These limitations should be considered in future research. In addition, it would be of particular interest to sequence the genetic material in order to not only identify the level of expression, but also to determine the type of genetic variations that may confer resistance.
5. Conclusions
The phenomenon of resistance is complex and depends on many factors specific to the fungus, the host, and the pharmacological intervention. It was possible to identify that strains resistant to fluconazole had an important expression of genes coding for drug efflux pumps, belonging to the ATP-Binding Cassette superfamily and that there was a much higher expression of the ERG3 gene compared to the other genes involved in the analyses. This may be a particular characteristic of the C. glabrata species because of a comparatively low expression of the ERG11 gene; these findings should motivate the continuity of research that favors the integral understanding of the adaptation-resistance dynamics to antimicrobials. To date, no similar work has attempted to understand the phenomenon of resistance through the integration of categorical and numerical variables derived from molecular observation and response to fluconazole in C. glabrata. Therefore, this contribution may be important for the scientific community so that it can be taken as a reference to involve complementary routes that integrate variables around predictive models that complement and streamline the analysis. Additionally, this type of molecular analysis allows integrating the explanatory scenario of the relationship between widely used antimicrobials and the biological activity represented by C. glabrata and considering that this type of study can help the scientific and clinical community to better understand the biological basis of resistance, to provide key elements in the resolution of the problem with a predictive, applicable, and therapeutic precision basis.
Author Contributions
Leidy Yurany Cárdenas Parra: Conceptualization, software, formal analysis, writing—original draft, project administration, funding acquisition, preparation, writing—review and editing, visualization. Ana Elisa Rojas: Conceptualization, validation, investigation, data curation, writing—review and editing, project administration, funding acquisition. Jorge Enrique Pérez: Methodology, supervision, project administration, funding acquisition. Juan Manuel Pérez Agudelo: Conceptualization, software, formal analysis, writing—review and editing, visualization. All authors have read and agreed to the final version of the manuscript.
Funding
This research was funded by UNIVERSIDAD CATÓLICA DE MANIZALES and UNIVERISDAD DE CALDAS.
Institutional Review Board Statement
The study was conducted in accordance with the Declaration of Helsinki, and approved by Ethics Committee of UNIVERSIDAD CATÓLICA DE MANIZALES y UNIVERSIDAD DE CALDAS.
Data Availability Statement
All data generated in this research is available in the manuscript and are available from the corresponding author upon request.
Acknowledgments
To the Universidad Católica de Manizales and Universidad de Caldas.
Conflicts of Interest
The authors of this manuscript, declare that we are independent of funding, commercial, and supporting institutions, and that no interests or values other than those usually associated with research were involved in the conduct of the work or the writing of the manuscript. The funders had no role in the design of the study; in the collection, analyses, or interpretation of data; in the writing of the manuscript, or in the decision to publish the results.
References
- Klingspor L, Ullberg M, Rydberg J, Kondori N, Serrander, L , Swanberg, J.; et al. Epidemiology of fungemia in Sweden: A nationwide retrospective observational survey. Mycoses 2018, 61, 777–785. [CrossRef]
- Hii IM, Liu CE, Lee YL, Liu WL, Wu PF, Hsieh MH; et al. Resistance rates of non-albicans Candida infections in Taiwan after the revision of 2012 Clinical and Laboratory Standards Institute breakpoints. Infect Drug Resist. 2019, 12, 235–240. [CrossRef]
- Yao D, Chen J, Chen W, Li, Z, Hu, X. Mechanisms of azole resistance in clinical isolates of Candida glabrata from two hospitals in China. Infect Drug Resist. 2019, 12, 771–781. [CrossRef]
- Lei, J., Xu, J, Wang, T. In vitro susceptibility of Candida spp. to fluconazole, itraconazole, and voriconazole and the correlation between triazoles susceptibility: Results from a five-year study. J Mycol Medicale. 2018, 28, 310–313. [CrossRef]
- Shahrokhi S, Noorbakhsh F, Rezaie S. Quantification of CDR1 Gene Expression in Fluconazole Resistant Candida Glabrata Strains Using Real-time PCR. Iran J Public Health. 2017, 46, 1118–1122.
- Tortorano AM, Prigitano A, Morroni G, Brescini L., Barchiesi F. Candidemia: Evolution of Drug Resistance and Novel Therapeutic Approaches. Infect Drug Resist. 2021, 14, 5543–5553. [CrossRef]
- Whaley SG, Zhang Q, Caudle KE, Rogers PD. Relative Contribution of the ABC Transporters Cdr1, Pdh1, and Snq2 to Azole Resistance in Candida glabrata. Antimicrob Agents Chemother. 2018, 62, e01070-18. [CrossRef]
- Maheronnaghsh M, Teimoori A, Dehghan P , Fatahinia M. The evaluation of the overexpression of the ERG-11, MDR-1, CDR-1, and CDR-2 genes in fluconazole-resistant Candida albicans isolated from Ahvazian cancer patients with oral candidiasis. J Clin Lab Anal. 2022, 36, e24208. [CrossRef] [PubMed]
- Paul S, Singh S, Sharma D, Chakrabarti A, Rudramurthy SM, Ghosh AK. Dynamics of in vitro development of azole resistance in Candida tropicalis. J Glob Antimicrob Resist. 2020, 22, 553–561. [CrossRef] [PubMed]
- Sakagami T, Kawano T, Yamashita K, Yamada E, Fujino N, Kaeriyama M. ; et al. Antifungal susceptibility trend and analysis of resistance mechanism for Candida species isolated from the bloodstream at a Japanese university hospital. J Infect Chemother Off J Jpn Soc Chemother. 2019, 25, 34–40. [CrossRef]
- Healey KR, Perlin DS. Fungal Resistance to Echinocandins and the MDR Phenomenon in Candida glabrata. J Fungi Basel Switz. 2018, 4, 105. [CrossRef]
- Zare-Bidaki M, Maleki A, Ghanbarzadeh N, Nikoomanesh F. Expression pattern of drug-resistance genes ERG11 and TAC1 in Candida albicans Clinical isolates. Mol Biol Rep. 2022, 49, 11625–11633. [CrossRef]
- Liu, Z., Myers LC. Mediator Tail Module Is Required for Tac1-Activated CDR1 Expression and Azole Resistance in Candida albicans. Antimicrob Agents Chemother. 2017, 61, e01342-17. [CrossRef]
- Feng W, Yang J, Xi Z, Ji Y, Zhu X, Yang L.; et al. Regulatory Role of ERG3 and Efg1 in Azoles-Resistant Strains of Candida albicans Isolated from Patients Diagnosed with Vulvovaginal Candidiasis. Indian J Microbiol. 2019, 59, 514–524. [CrossRef]
- Liu, Z., Myers LC. Candida albicans Swi/Snf and Mediator Complexes Differentially Regulate Mrr1-Induced MDR1 Expression and Fluconazole Resistance. Antimicrob Agents Chemother. 2017, 61, e01344-17. [CrossRef]
- Vu BG, Thomas GH, Moye-Rowley WS. Evidence that Ergosterol Biosynthesis Modulates Activity of the Pdr1 Transcription Factor in Candida glabrata. mBio. 2019, 10, e00934-19. [CrossRef]
- El Said M, Badawi H, Gamal D, Salem D, Dahroug H, El-Far A. Detection of ERG11 gene in fluconazole resistant urinary candida isolates. Egypt J Immunol. 2022, 29, 134–147. [CrossRef]
- Spettel K, Barousch W, Makristathis A, Zeller I, Nehr M, Selitsch B. ; et al. Analysis of antifungal resistance genes in Candida albicans and Candida glabrata using next-generation sequencing. PLoS ONE. 2019, 14, e0210397. [CrossRef]
- Luna-Tapia A, Willems HME, Parker JE, Tournu H, Barker KS, Nishimoto AT; et al. Loss of Upc2p-Inducible ERG3 Transcription Is Sufficient To Confer Niche-Specific Azole Resistance without Compromising Candida albicans Pathogenicity. mBio. 2018, 9, e00225-18. [CrossRef] [PubMed]
- Robbins, N., Cowen LE. Antifungal drug resistance: Deciphering the mechanisms governing multidrug resistance in the fungal pathogen Candida glabrata. Curr Biol CB. 2021, 31, R1520–R1523. [CrossRef]
- Castro Méndez C, García Sánchez E, Martín-Mazuelos E. Actualización de los métodos de estudio de sensibilidad in vitro a los antifúngicos. Enfermedades Infecc Microbiol Clínica. 2019, 37, 32–39. [CrossRef] [PubMed]
- Caudle KE, Barker KS, Wiederhold NP, Xu L, Homayouni R, Rogers PD. Genomewide expression profile analysis of the Candida glabrata Pdr1 regulon. Eukaryot Cell. 2011, 10, 373–383. [CrossRef] [PubMed]
- Silva DB dos S, Rodrigues LMC, Almeida AA de, Oliveira KMP de, Grisolia AB. Novel point mutations in the ERG11 gene in clinical isolates of azole-resistant Candida species. Mem Inst Oswaldo Cruz. 2016, 111, 192–199. [CrossRef] [PubMed]
- Culakova H, Dzugasova V, Valencikova R, Gbelska Y., Subik J. Stress response and expression of fluconazole resistance-associated genes in the pathogenic yeast Candida glabrata deleted in the CgPDR16 gene. Microbiol Res. 2015, 174, 17–23. [CrossRef] [PubMed]
- Skrzypek MS, Binkley J, Binkley G, Miyasato SR, Simison M, Sherlock G. The Candida Genome Database (CGD): incorporation of Assembly 22, systematic identifiers and visualization of high throughput sequencing data. Nucleic Acids Res. 2017, 45.
- Jumper J, Evans R, Pritzel A, Green T, Figurnov M, Ronneberger O; et al. Highly accurate protein structure prediction with AlphaFold. Nature 2021, 596, 583–589. [CrossRef]
- Hanwell MD, Curtis DE, Lonie DC, Vandermeersch T, Zurek E, Hutchison GR. Avogadro: an advanced semantic chemical editor, visualization, and analysis platform. J Cheminformatics. 2012, 4, 17. [CrossRef]
- Pettersen EF, Goddard TD, Huang CC, Couch GS, Greenblatt DM, Meng EC; et al. UCSF Chimera--a visualization system for exploratory research and analysis. J Comput Chem. 2004, 25, 1605–1612. [CrossRef]
- Cheng WC, Chen LH, Jiang CR, Deng YM, Wang DW, Lin CH; et al. Sensible Functional Linear Discriminant Analysis Effectively Discriminates Enhanced Raman Spectra of Mycobacterium Species. Anal Chem. 2021, 93, 2785–2792. [CrossRef]
- Safo SE, Min EJ, Haine L. Sparse linear discriminant analysis for multiview structured data. Biometrics. 2022, 78, 612–623. [CrossRef] [PubMed]
- IBM SPSS Software [Internet]. 2023 [citado 28 de junio de 2023]. Disponible en: https://www.ibm.com/es-es/spss.
- Castanheira M, Deshpande LM, Davis AP, Carvalhaes CG, Pfaller MA. Azole resistance in Candida glabrata clinical isolates from global surveillance is associated with efflux overexpression. J Glob Antimicrob Resist. 2022, 29, 371–377. [CrossRef] [PubMed]
- Gohar AA, Badali H, Shokohi T, Nabili M, Amirrajab N., Moazeni M. Expression Patterns of ABC Transporter Genes in Fluconazole-Resistant Candida glabrata. Mycopathologia. 2017;182(3-4):273-84. [CrossRef]
- Won EJ, Choi MJ, Kim MN, Yong D, Lee WG, Uh Y; et al. Fluconazole-Resistant Candida glabrata Bloodstream Isolates, South Korea, 2008-2018. Emerg Infect Dis. 2021, 27, 779–788. [CrossRef]
- Khalifa HO, Arai T, Majima H, Watanabe A, Kamei K. Genetic Basis of Azole and Echinocandin Resistance in Clinical Candida glabrata in Japan. Antimicrob Agents Chemother. 2020, 64, e00783-20. [CrossRef]
- Biswas C, Marcelino VR, Van Hal S, Halliday C, Martinez E, Wang Q.; et al. Whole Genome Sequencing of Australian Candida glabrata Isolates Reveals Genetic Diversity and Novel Sequence Types. Front Microbiol. 2018, 9, 2946. [CrossRef]
- Godinho CP, Dias PJ, Ponçot E. , Sá-Correia I. The Paralogous Genes PDR18 and SNQ2, Encoding Multidrug Resistance ABC Transporters, Derive From a Recent Duplication Event, PDR18 Being Specific to the Saccharomyces Genus. Front Genet. 2018, 9, 476. [CrossRef]
- Henry KW, Nickels JT, Edlind TD. Upregulation of ERG Genes in Candida Species by Azoles and Other Sterol Biosynthesis Inhibitors. Antimicrob Agents Chemother. 2000, 44, 2693–2700. [CrossRef]
- Iyer KR, Robbins N, Cowen LE. The role of Candida albicans stress response pathways in antifungal tolerance and resistance. iScience. 2022, 25, 103953. [CrossRef] [PubMed]
- Berman, J. , Krysan DJ. Drug resistance and tolerance in fungi. Nat Rev Microbiol. 2020, 18, 319–331. [Google Scholar] [CrossRef]
- Hill JA, O’Meara TR, Cowen LE. Fitness Trade-Offs Associated with the Evolution of Resistance to Antifungal Drug Combinations. Cell Rep. 2015, 10, 809–819. [CrossRef]
- Song JL, Harry JB, Eastman RT, Oliver BG, White TC. The Candida albicans lanosterol 14-alpha-demethylase (ERG11) gene promoter is maximally induced after prolonged growth with antifungal drugs. Antimicrob Agents Chemother. 2004, 48, 1136–1144. [CrossRef]
Figure 1.
Error bars. Triple identical qPCR assays with and without exposure to fluconazole. The figure of error tables is introduced, especially useful for the representation of data that follow a normal distribution, such as the RQ of the ERG11 gene. This is because the traditional figure for representing data that do not follow a normal distribution, such as box-and-whisker plots, does not allow accurate visualisation due to the wide dispersion of the RQ values in the CDR1, ERG3 and SNQ2 genes.
Figure 2.
Relative expression of CDR1, ERG11, ERG3 and SNQ2 genes. Strains exposed Vs Strains not exposed to fluconazole.
Figure 2.
Relative expression of CDR1, ERG11, ERG3 and SNQ2 genes. Strains exposed Vs Strains not exposed to fluconazole.
Figure 3.
Relative expression of the CDR1 gene according to the sensitivity profile and exposure to fluconazole.
Figure 3.
Relative expression of the CDR1 gene according to the sensitivity profile and exposure to fluconazole.
Figure 4.
Relative expression of the ERG11 gene according to sensitivity profile and exposure to fluconazole.
Figure 4.
Relative expression of the ERG11 gene according to sensitivity profile and exposure to fluconazole.
Figure 5.
Relative expression of the ERG3 gene according to the sensitivity profile and exposure to fluconazole.
Figure 5.
Relative expression of the ERG3 gene according to the sensitivity profile and exposure to fluconazole.
Figure 6.
Relative expression of the SNQ2 gene according to the sensitivity profile and exposure to fluconazole.
Figure 6.
Relative expression of the SNQ2 gene according to the sensitivity profile and exposure to fluconazole.
Figure 7.
Comparative representations of the fluconazole - protein of interest docking. (a) 3D presentation of the molecular relationship (docking) between fluconazole and ERG11; (b) Presentation in 3D format of the molecular relationship between fluconazole and CDR1. Hydrophobic interactions with residues are shown with dashed gray lines and with gray surfaces on the protein.
Table 1.
Primer sequence.
Table 1.
Primer sequence.
| GENE |
|
Primer sequence (5’–3’) |
| CgCDR1 |
Forward |
CATACAAGAAACACCAAAGTCGGT-3′ |
| Reverse |
GAGACACGCTAACGTTCACCAC-3′ |
| ERG11 |
Forward |
TCGGTCCATCTCTGTTTCTT |
| Reverse |
GAACACTGGGGTGGTCAAGT |
| ERG 3 |
Forward |
AAGCGTGTGAACAAGGAC |
| Reverse |
GCGTAGGTCTTCTCTGTGA |
| SNQ2 |
Forward |
CGTCCTATGTCTTCCTTACACCATT |
| Reverse |
TTTGAACCGCTTTTGTCTCTGA |
| URA3 |
Forward |
GAAAACCAATCTTTGTGCTTCTCT |
| Reverse |
CATGAGTCTTAAGCAAGCAAATGT |
Table 2.
Results of the identical triplicate assays of the qPCR experiment.
Table 2.
Results of the identical triplicate assays of the qPCR experiment.
| GENE |
Experiment |
RQ No exposed |
RQ Exposed |
| Median |
Medium |
Median |
Medium |
| CDR1 |
First |
0,59 |
1,09 |
0,31 |
1,39 |
| Second |
0,59 |
1,09 |
0,31 |
1,39 |
| Third |
0,59 |
1,09 |
0,31 |
1,39 |
| ERG11 |
First |
0,23 |
0,7 |
0,07 |
0,31 |
| Second |
0,23 |
0,7 |
0,07 |
0,31 |
| Third |
0,23 |
0,7 |
0,07 |
0,31 |
| ERG3 |
First |
3,03 |
8,58 |
1,89 |
11,56 |
| Second |
3,03 |
8,58 |
1,89 |
11,56 |
| Third |
3,03 |
8,58 |
1,89 |
11,56 |
| SNQ2 |
First |
0,21 |
1,15 |
0,05 |
2,15 |
| Second |
0,21 |
1,15 |
0,05 |
2,15 |
| Third |
0,21 |
1,15 |
0,05 |
2,15 |
Table 3.
Relative expression values of CDR1, ERG11, ERG3, and SNQ2 genes according to sensitivity profile and antifungal exposure.
Table 3.
Relative expression values of CDR1, ERG11, ERG3, and SNQ2 genes according to sensitivity profile and antifungal exposure.
Analyzed
Gen |
Antimycotic Exposure |
Resistant
One-tailed analysis |
Sensitive Dose-dependent
One-tailed analysis |
| Media |
Median |
Minimum |
Maximum |
p |
Media |
Median |
Minimum |
Maximum |
p |
| CDR1 |
Fluconazole-free |
1,91 |
1,76 |
0,05 |
4,22 |
0,2311
|
0,6 |
0,59 |
0,04 |
1,09 |
0,0461
|
| With Fluconazole |
3,15 |
2,22 |
0,24 |
10,75 |
0,33 |
0,11 |
0,01 |
1,33 |
| ERG11 |
Fluconazole-free |
0,75 |
0,35 |
0,01 |
2,6 |
0,0652
|
0,67 |
0,22 |
0 |
4,06 |
0,0862
|
| With Fluconazole |
0,12 |
0,04 |
0,01 |
0,49 |
0,43 |
0,08 |
0 |
2,97 |
| ERG3 |
Fluconazole-free |
21,39 |
15,77 |
2,93 |
65 |
0,3431
|
3,09 |
0,71 |
0 |
15,9 |
0,3991
|
| With Fluconazole |
17,28 |
12,94 |
0,01 |
50,3 |
8,1 |
0,66 |
0,01 |
72,12 |
| SNQ2 |
Fluconazole-free |
1,22 |
0,52 |
0,01 |
3,59 |
0,0141
|
1,1 |
0,12 |
0 |
7,4 |
0,1661
|
| With Fluconazole |
0,69 |
0,11 |
0 |
3,59 |
3,03 |
0,05 |
0 |
26,95 |
Table 4.
Coefficients in the classification function for the dose-dependent sensitive (DDS) or resistant profile.
Table 4.
Coefficients in the classification function for the dose-dependent sensitive (DDS) or resistant profile.
| |
GENERAL SENSITIVITY PROFILE |
| Model variables |
Resistant |
DDS |
| Analyzed gene |
4,141 |
3,730 |
| Categorized strain |
0,369 |
0,276 |
| Mean-RQ Fluconazole-Free |
0,363 |
0,302 |
| Media RQ with fluconazole |
E |
0,042 |
| Constant |
-8,009 |
-5,820 |
Table 5.
Use of coefficients in the ranking function for dose-dependent sensitive (DDS) or resistant (DDS) profile.
Table 5.
Use of coefficients in the ranking function for dose-dependent sensitive (DDS) or resistant (DDS) profile.
| |
Sensitivity profile |
Forecasting profile |
| Model variables |
Resistant |
DDS |
Resistant |
DDS |
| Analyzed Gen |
4,141 |
3,730 |
2 × 4,141 |
2 × 3,730 |
| Categorized strain |
0,369 |
0,276 |
2 × 0,369 |
2 × 0,276 |
| Mean-RQ Fluconazole-Free |
0,363 |
0,302 |
0,57 × 0,363 |
0,57 × 0,302 |
| Media RQ with fluconazole |
0,111 |
0,042 |
0,22 × 0,111 |
0,22 × 0,042 |
| Constant |
-8,009 |
-5,820 |
1 × -8,009 |
1 × -5,820 |
| |
|
Total |
1,2425 |
2,3738 |
Table 6.
Representation of the ΔG (kcal/mol) for the various positions generated by the docking model between fluconazole and the proteins of interest in C. glabrata.
Table 6.
Representation of the ΔG (kcal/mol) for the various positions generated by the docking model between fluconazole and the proteins of interest in C. glabrata.
| |
|
Fluconazole |
|
| Protein |
Model |
ΔG (Kcal/mol) |
Number of contacts |
| ERG3 |
1. |
-6,2 |
19 |
| 2. |
-6,1 |
13 |
| 3. |
-6,0 |
6 |
| 4. |
-5,9 |
11 |
| 5. |
-5,8 |
6 |
| ERG11 |
1. |
-2,8 |
12 |
| 2. |
-2,6 |
11 |
| 3. |
-2,5 |
11 |
| 4. |
-2,4 |
10 |
| 5. |
-2,2 |
9 |
| CDR1 |
1. |
-7,0 |
14 |
| 2. |
-6,4 |
14 |
| 3. |
-6,4 |
15 |
| 4. |
-6,2 |
14 |
| 5. |
-6,2 |
11 |
| SNQ2 |
1. |
-7,6 |
17 |
| 2. |
-7,5 |
12 |
| 3. |
-7,4 |
12 |
| 4. |
-7,2 |
11 |
| 5. |
-7,1 |
11 |
|
Disclaimer/Publisher’s Note: The statements, opinions and data contained in all publications are solely those of the individual author(s) and contributor(s) and not of MDPI and/or the editor(s). MDPI and/or the editor(s) disclaim responsibility for any injury to people or property resulting from any ideas, methods, instructions or products referred to in the content. |
© 2023 by the authors. Licensee MDPI, Basel, Switzerland. This article is an open access article distributed under the terms and conditions of the Creative Commons Attribution (CC BY) license (http://creativecommons.org/licenses/by/4.0/).
