1. Introduction
Temperate grasslands are an essential component of terrestrial ecosystems, and they provide a material basis for the development of animal husbandry along with support for human survival [
1,
2]. As global climate change continues, there is a growing trend towards increased frequency of extreme weather events [
3,
4]. In temperate grassland areas, fires and dust events have attracted considerable attention from the scientific community as major natural disasters. Grassland fires refer to the phenomenon in which combustible materials burn and spread under favorable conditions after contact with the fire source, causing varying degrees of damage to the grassland [
5]. Dust weather refer to meteorological disaster in which strong winds sweep over deserts or arid surfaces causing dust to be swept into the air, thereby reducing visibility [
6]. Dust weather is categorized by visibility: floating dust, blowing dust, dust storms, and severe dust storms [
7]. Among them, floating dust and blowing dust are weak dust weather, while dust storms and severe dust storms are strong dust weather [
8,
9]. Grassland fires and strong dust weather, as sudden-onset disaster phenomena, have substantial impacts on grassland ecosystems, biogeochemical cycles, the safety of human life and property, social stability, and economic development due to their high hazard level, wide range, and difficult to predict [
10,
11,
12,
13,
14,
15,
16,
17]. In addition, the effects of grassland fires and dust events may be superimposed or mutually reinforcing, leading to more severe cascading disasters. For example, the occurrence of grassland fires destroys the vegetation cover [
18], which facilitates the occurrence of dust events [
19,
20,
21]. Furthermore, dust events are typically accompanied by strong winds, which have the potential to exacerbate the formation of fires and spread the smoke and sparks generated by the fires over greater distances, thus triggering new fires [
17].Therefore, analyzing the spatiotemporal variation patterns of grassland fires and dust events and further exploring their potential relationships can help in early warning, monitoring, and control of grassland fires and dust events to provide a practical reference for desertification management and global climate change research.
Previous research has focused on the spatial and temporal change patterns and influencing factors of grassland fires and dust events [
5,
9,
22,
23,
24,
25,
26,
27], as well as remote sensing monitoring and early warning [
1,
11,
28,
29,
30,
31], but gaps remain. As a major disturbance factor in grassland ecosystems, fires tend to burn or scorch plants, temporarily reducing vegetation cover, and exposing the soil surface in affected areas [
18]. This dramatically increases soil erodibility, thereby promoting the occurrence of dust events [
19,
20,
21]. However, recent studies have focused on either grassland fires or dust events unilaterally, with few studies analyzing both from a disaster chain perspective. Uncertainties remain regarding the effects of grassland fires on dust weather.
Therefore, using Dornod aimag in Mongolia as the study area, we aimed to (1) analyze the spatiotemporal variation patterns of grassland fires and dust weather, (2) reveal the effect of grassland fires on dust weather, and (3) explore the mechanism by which grassland fires affect dust events.
2. Materials and Method
2.1. Study Area
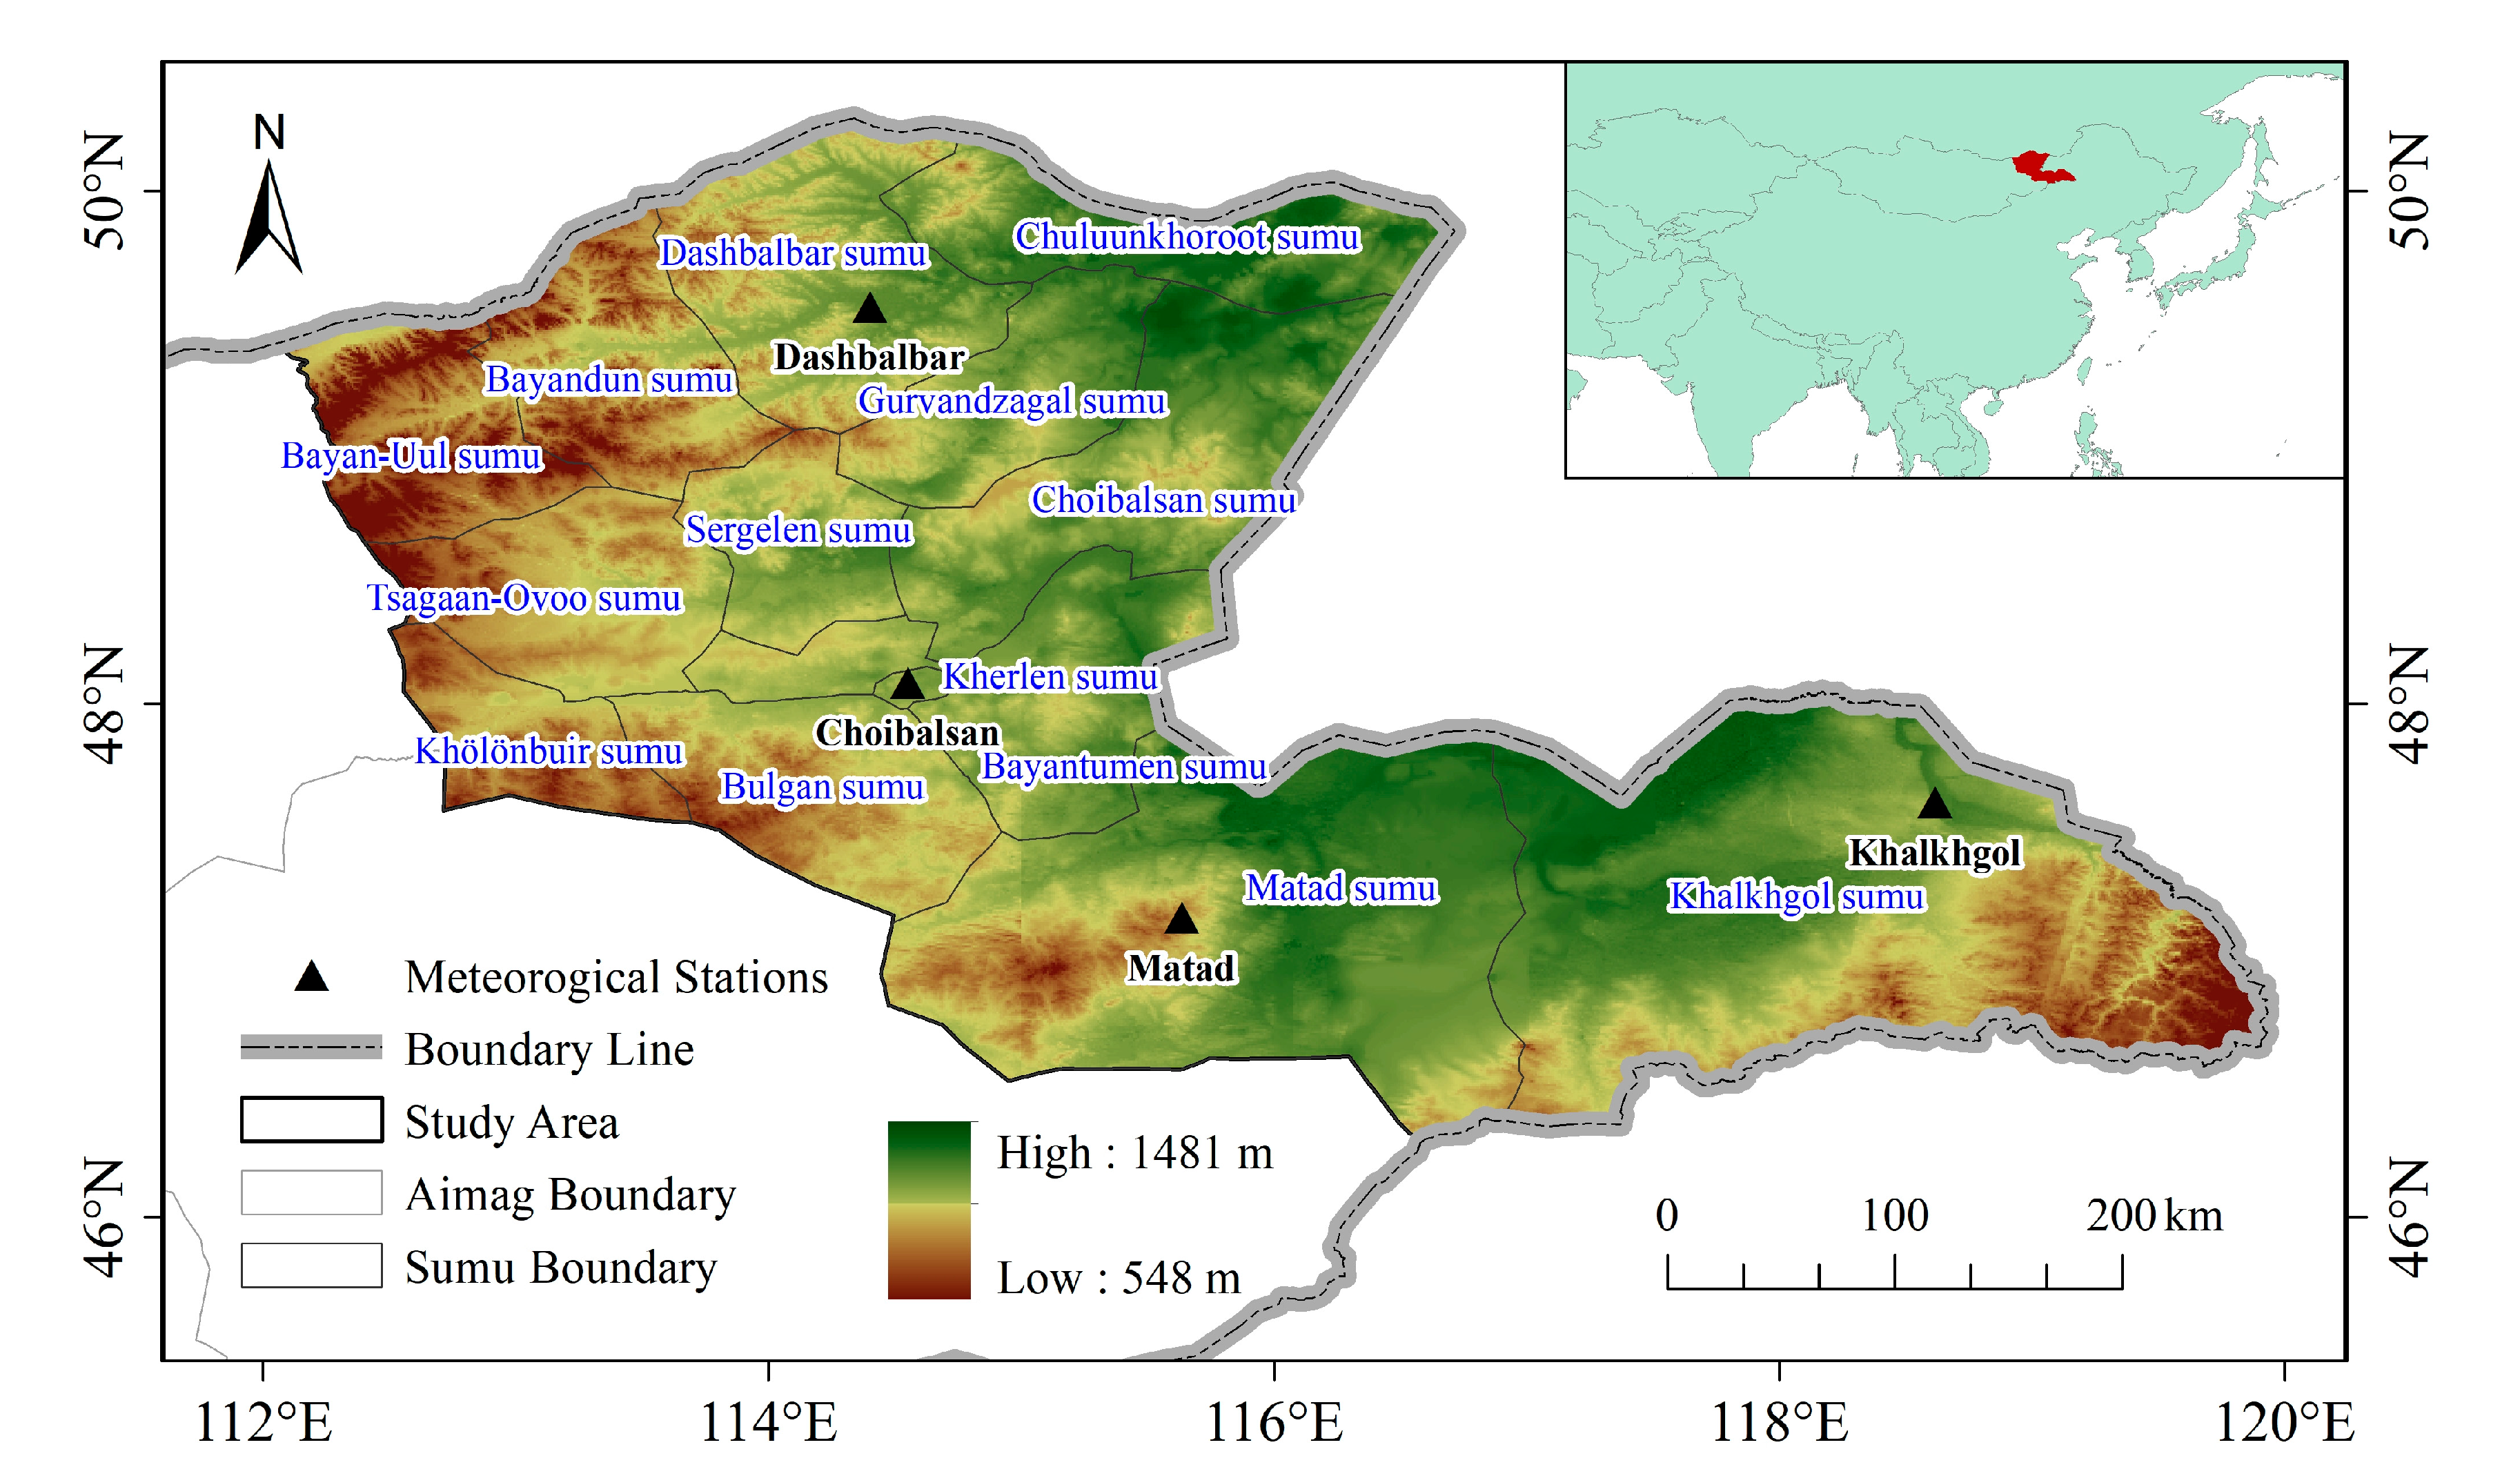
Dornod is an eastern border aimag (province) of Mongolia, bordering the Inner Mongolia Autonomous Region of China to the east and southeast, the Hentii and Sukhbaatar aimags of Mongolia to the west and southwest, and the Outer Baileyier Region of Russia to the north (46° 25’–50° 28 ‘ N; 112° 05’–119° 56’ E). As shown in
Figure 1, the study area has four long-term weather stations that compile detailed and complete dust weather observations and meteorological data. The terrain is dominated by high plains and low hills. The mountainous areas in the northern foothills of the Greater Khingan Mountains in the southeast and the Hentii Mountains in the northwest are low hills, whereas the remainder of the area is a high plain with an elevation of approximately 548–1481 m throughout the area (
Figure 1). The climate is typical continental climate with four distinct seasons including long, cold winters and short, hot summers. Historical meteorological data show that the average annual temperature is -2.3 °C–3.14 °C, while the average temperature in January is -26.39 °C–-15.52 °C, and the average temperature in July is 17.92 °C–23.71 °C. The average annual precipitation is 258–305 mm, with 70 % of the precipitation concentrated in the summer (June–August). The average annual number of days with strong winds (>10.8 m/s) exceeds 26. Most of the area has typical steppe vegetation, which mainly consists of herbaceous plants such as
Stipa grandis and
Stipa sareptana [
32]. In addition, a portion of the area contains meadow steppe vegetation, including herbaceous plants such as
Stipa baicalensis and
Leymus chinensis, as well as some shrubs [
32]. As a result, grassland fires frequently occur because of the high storage of fuel, such as withered grass, coupled with weather and climatic conditions such as low average annual temperatures, significant temperature differences, low precipitation, high evaporation, dry climate, and abundant sunlight.
2.2. Data Sources
2.2.1. Grassland Fire Data
Grassland fire data were obtained from the National Aeronautics and Space Administration (NASA) MODIS MCD64A1 Burnt Area data. It is monthly data with a resolution of 500 m. In the MCD64A1 burn date layer data, “-1” indicates missing, “-2” indicates water, “0” indicates unburned, and “1–366” indicates burn dates [
33,
34].
2.2.2. Dust weather data
The dust weather data were obtained in the form of Surface Synoptic Observations (SYNOP) data reported every 3 or 6 h, using the weather code (ww) as a two-digit number from 00 to 99 [
8,
9]. Among them, 06–09, 30–35, and 98 are the codes related to dust weather, and these data were subjected to strict quality control and accuracy tests. Specifically, ww = 06 indicates the occurrence of floating dust, ww = 07 and ww = 08 indicate the occurrence of blowing dust, and ww = 09, ww = 30–35, and ww = 98 indicate the occurrence of dust storms [
26,
35,
36].
2.2.3. Auxiliary data
We analyzed the mechanisms by which grassland fires affect dust weather using the Normalized Difference Vegetation Index (NDVI), precipitation, and wind vector data as auxiliary data. NDVI data were obtained from the NASA MODIS MOD13A3 vegetation index product. It is monthly data with a spatial resolution of 1 km. Precipitation and wind vectors were derived from the ERA5 reanalysis dataset published by the European Centre for Medium Weather Forecasting. Its spatial resolution is 0.25° × 0.25°.
2.3. Methods
2.3.1. Statistics of Grassland Fire Days, Area and Frequency Based on MCD64A1 Burnt Area data
The Conversion Tools of ESRI ArcGIS 10.8 software and Excel Pivot Table were used to count the grassland fire days and area. First, the MCD64A1 burn date raster data were converted into polygon data, and the burn date data of “1~366” were extracted from them. Then, the extracted polygon data were exported to an Excel file, and the grassland fire days and area per month, season, and year from 2001 to 2022 were counted using a pivot table. The Raster Calculator and Reclassify functions in the Spatial Analyst Tools of ESRI ArcGIS 10.8 software were used to analyze the grassland fire frequency. First, the MCD64A1 burn date raster data were reclassified by reclassifying “-1”, “-2”, and “0” as “0” and reclassifying “1~366” as “1”. Then, the spatial distribution of grassland fire frequency was obtained by summation with a Raster Calculator.
2.3.2. Statistics of Dust Weather Days Based on SYNOP Data
We used an Excel Pivot Table to count the dust weather days in the study area. First, 22 years of data were combined into an Excel file and screened out data with weather codes (ww) of 06 to 09, 30 to 35, and 98. Then, Pivot Tables were used to count the number of floating dust days, blowing dust days, dust storm days, and total dust weather days per month, season, and year from 2001 to 2022 at the four stations. If 1 to 3 of the three types of weather, namely floating dust, blowing dust, and dust storms, occurred in a day, we categorized it as a total dusty weather day.
2.3.3. Analysis of the Grassland Fires Effect on Dust Weather
Under arid climatic conditions, grassland vegetation burned by fires in autumn and winter cannot be quickly restored, thereby affecting the dust weather in the following spring. Therefore, grassland fire days and area from January to May and from September to December of each year and dust weather days (including dust storms and total dust weather) from March to June of each year during 2001–2022 were selected and combined into four datasets (
Table 1). It should be noted that the dust weather days in the study area were derived by combining the data from the four stations and removing duplicates. Finally, a Pearson correlation analysis was performed on the four data sets. The formula is below:
where is the observed value of variable 𝑥, is the mean value of variable 𝑥, is the observed value of variable 𝑦, is the mean value of variable 𝑦.
3. Results
3.1. Spatiotemporal Variation Characteristics of Grassland Fires
3.1.1. Spatial Distribution Characteristics of Grassland Fire Frequency
This study analyzed the spatial distribution characteristics of grassland fire frequency using NASA MODIS MCD64A1 fire data from 2001 to 2022 with grassland fire frequency as an indicator.
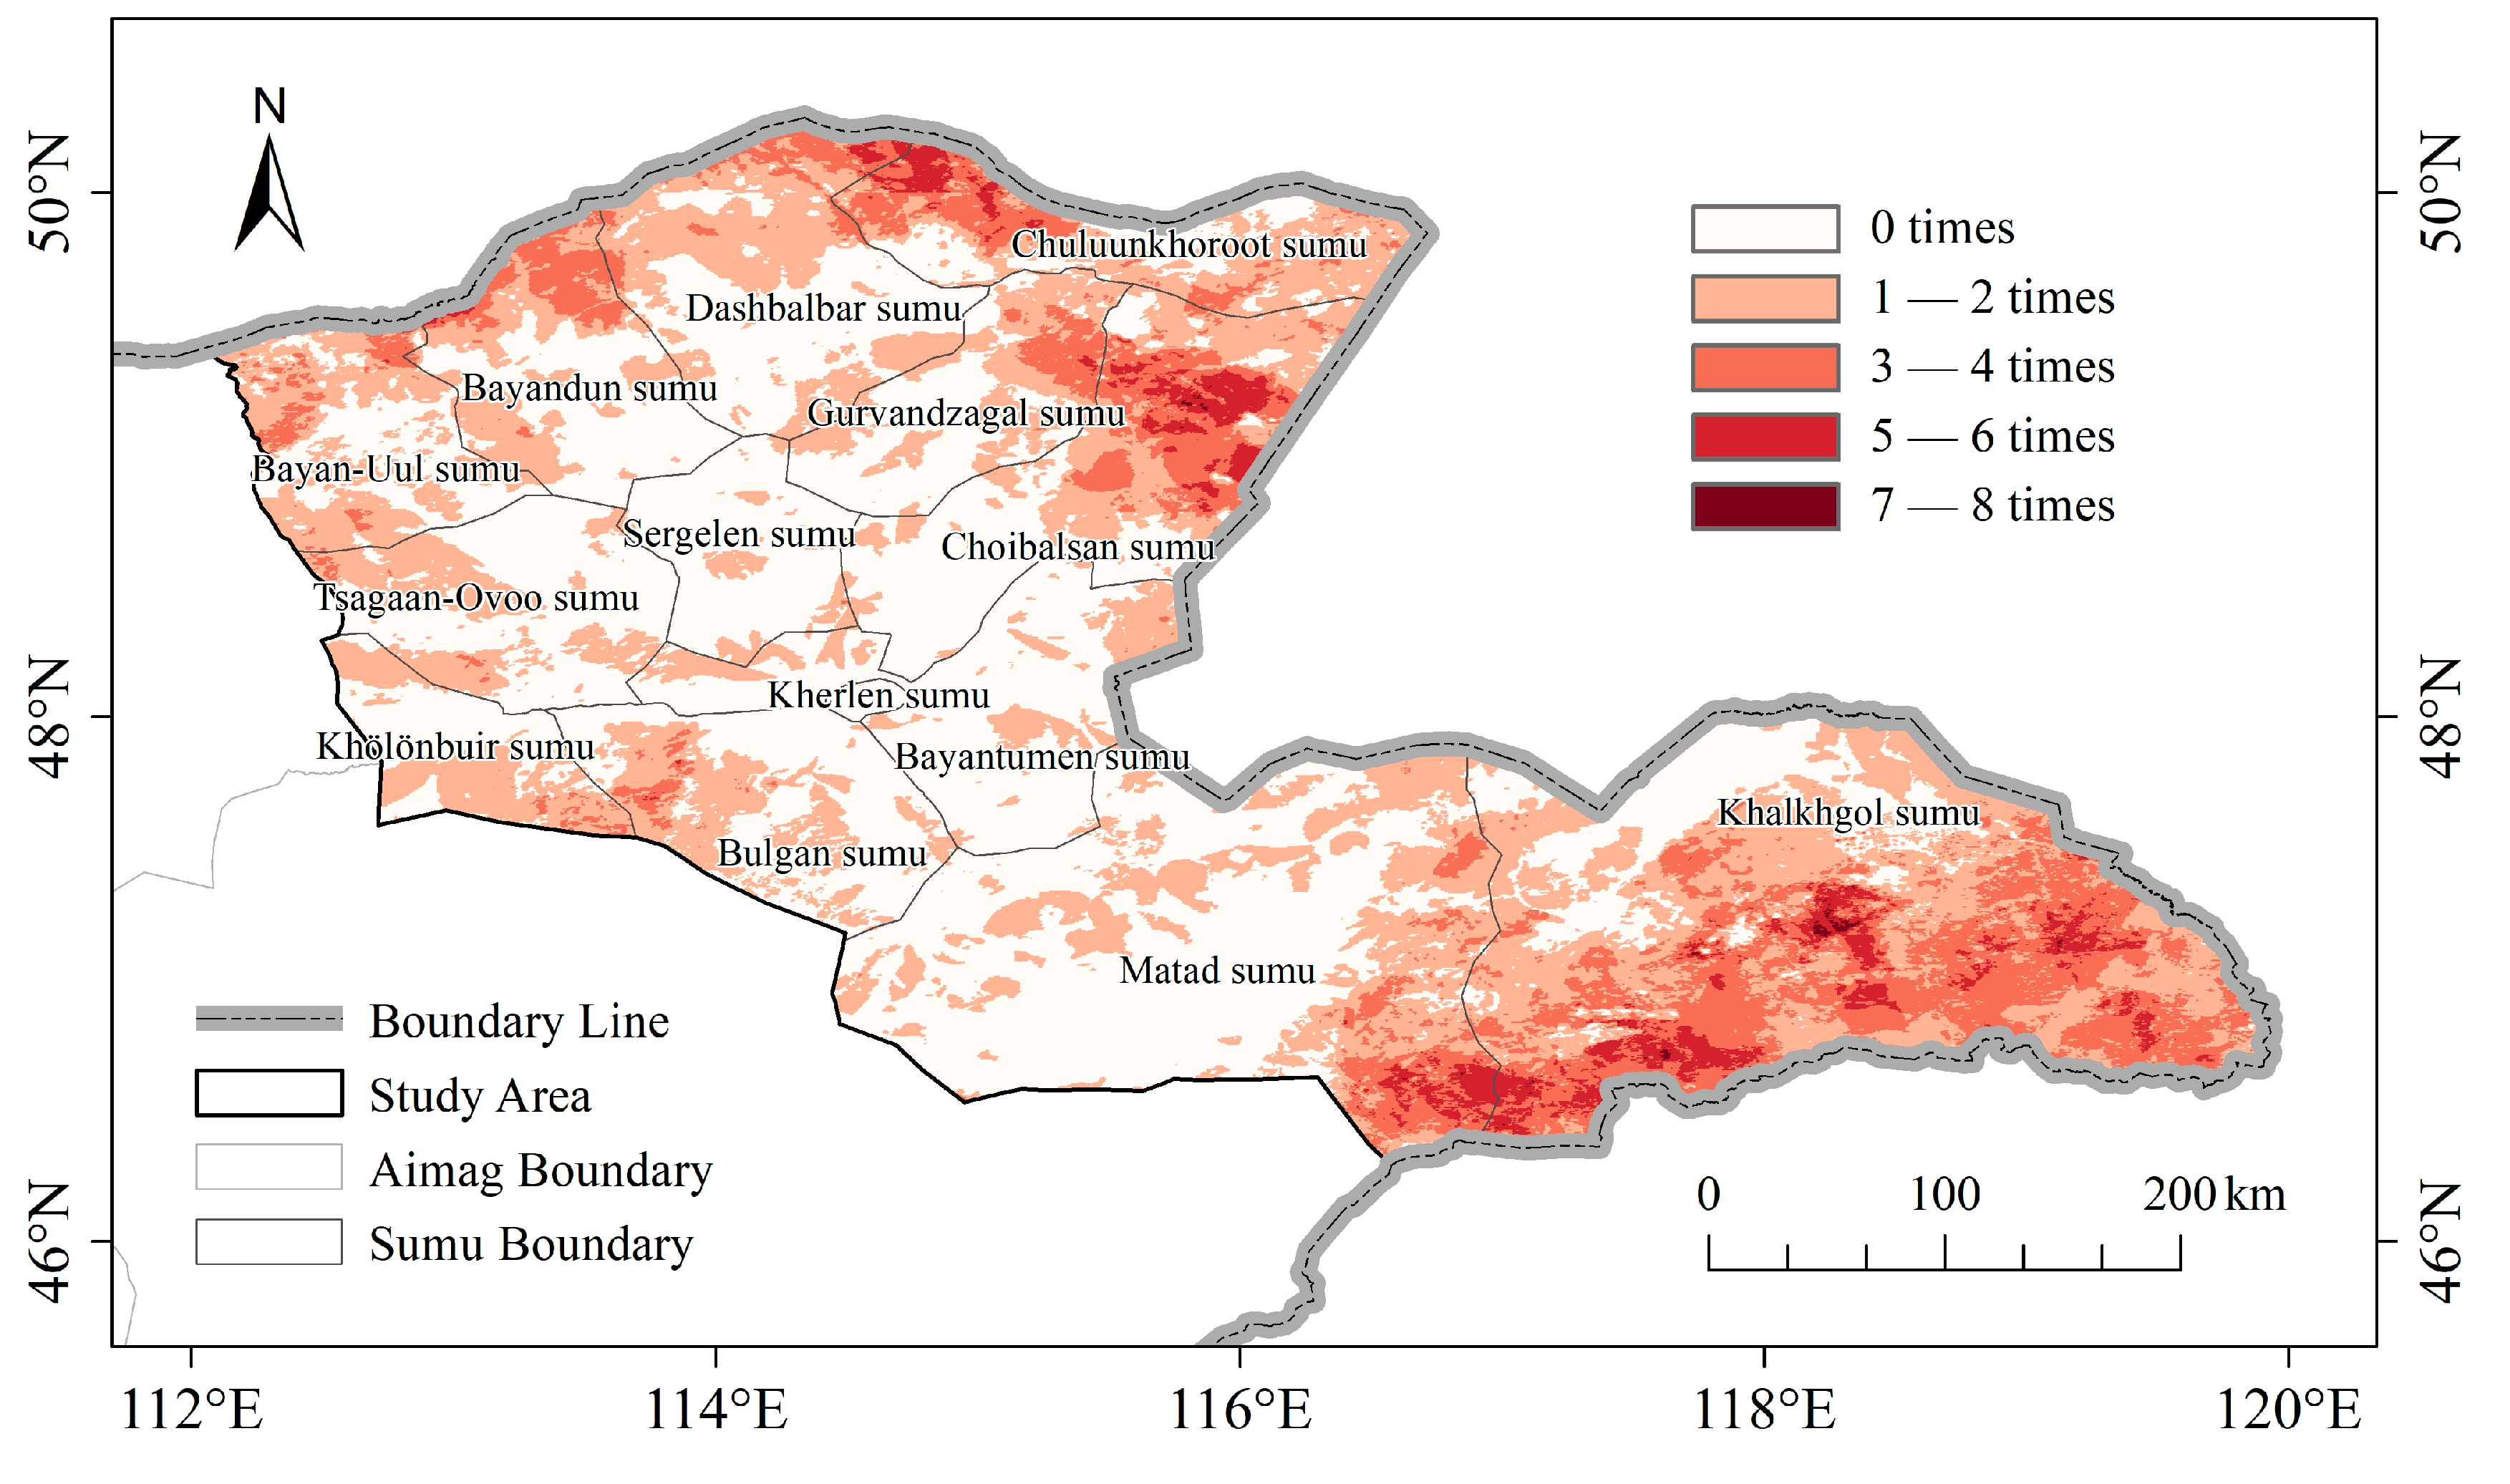
As shown in
Figure 2, all 14 sumu (administrative divisions) in the study area had at least 1–2 grassland fires. The frequency of grassland fires in the northern part of Bayan-Uul sumu, the northern part of Bayandun sumu, the northwestern part of Tsagaan Ovoo sumu, and the southeastern part of Khölönbuir sumu reached a maximum of 3–4. The frequency of grassland fires in the northeastern part of Dashbalbar sumu, the northwestern part of Chuluunkhoroot sumu, and the western part of Bulgan sumu reached a maximum of 5–6. The frequency of grassland fires in the northern part of Choibalsan sumu, the southern part of Khalkhgol sumu, and the southeastern part of Matad sumu reached a maximum of 7–8. Among them, the area with 7–8 fires were small. On the whole, grassland fires in Dornod aimag occurred mainly in the border areas of northern Bayandun sumu, northwestern Chuluunkhoroot sumu, northern Choibalsan sumu, southern Khalkhgol sumu, and southeastern Matad sumu, forming a spatial pattern of more fires in the east than in the west, and more in the north and south.
3.1.2. Intra-annual Variation in Grassland Fire days and Area
To understand the intra-annual variation in grassland fires in the study area, the monthly and seasonal variation characteristics of grassland fire days and area were analyzed using seasonal and monthly average grassland fire days and area as indicators.
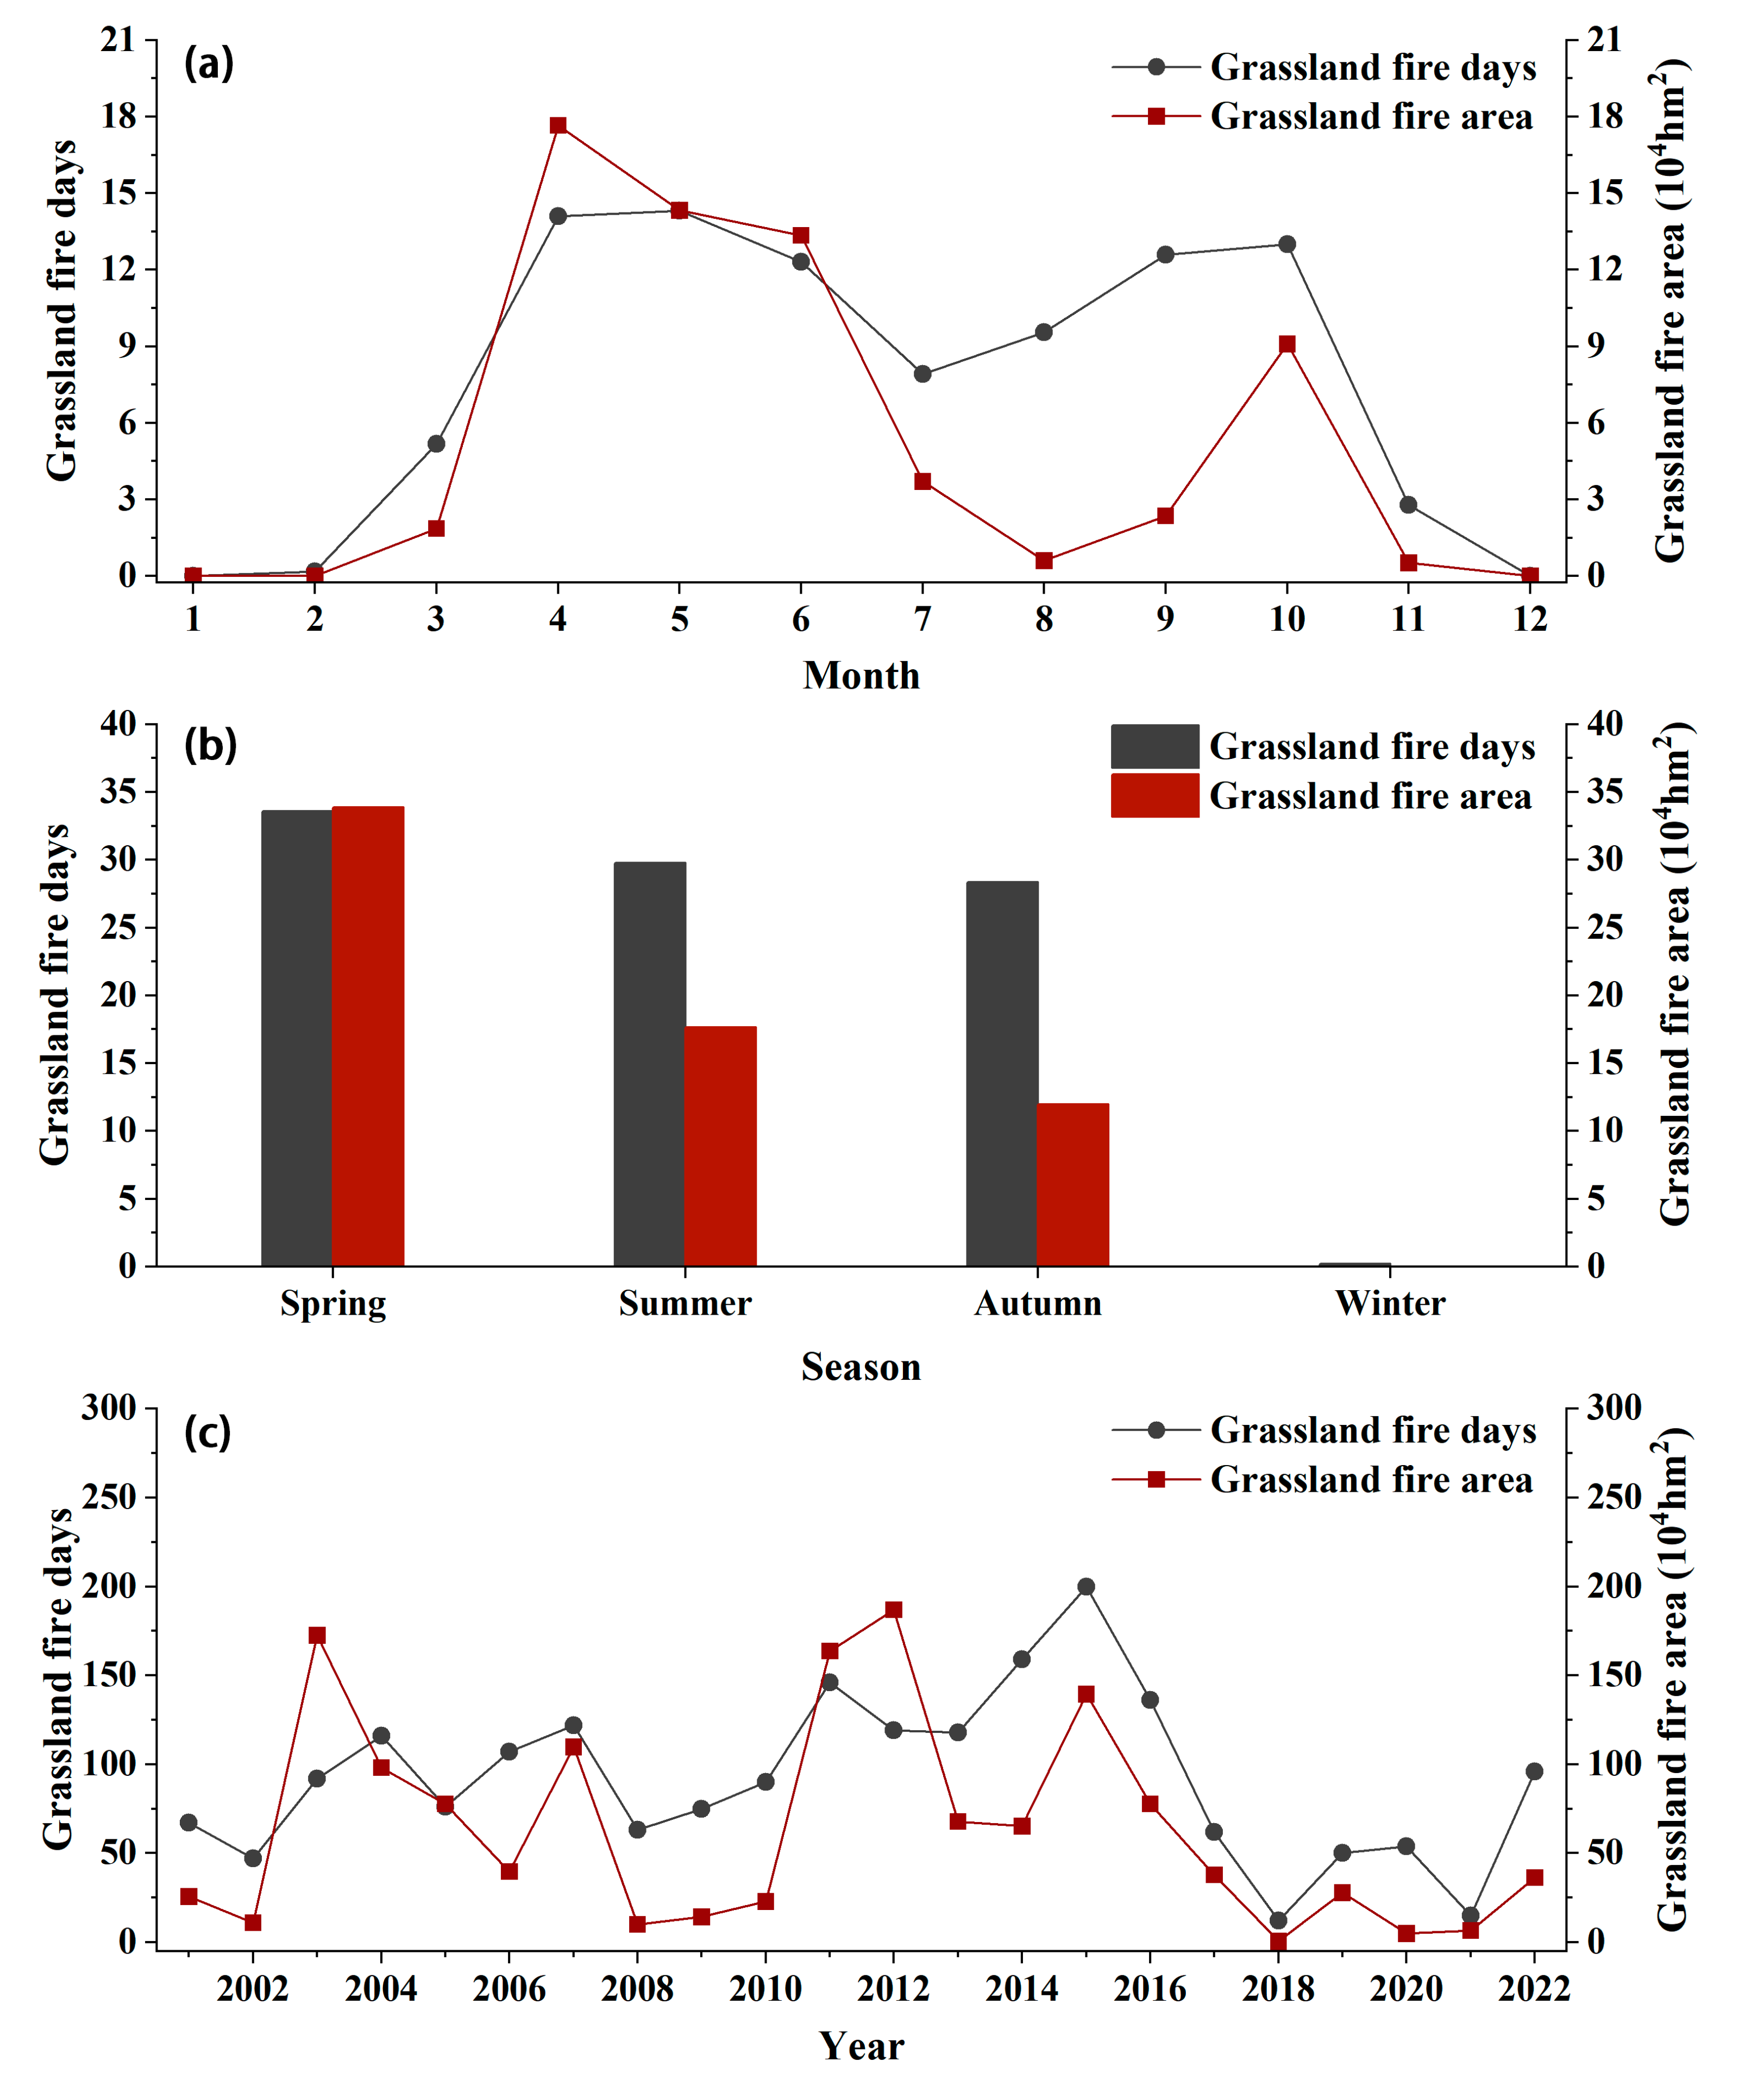
As shown in
Figure 3a, the monthly variation in grassland fire days and area approximately follows a saddle-shaped curve. The grassland fire days was higher in April–June and September–October, reaching 14.09, 14.32, 12.32, 12.55, and 13 days in April, May, June, September, and October, respectively. The grassland fire area was larger in April–June and October, reaching 17.66 × 10
4 hm
2, 14.33 × 10
4 hm
2, 13.35 × 10
4 hm
2, and 9.09 × 10
4 hm
2 in April, May, June, and October, respectively.
As shown in
Figure 3b, on a seasonal scale, grassland fires were the most frequent in spring, with 33.6 grassland fire days and a grassland fire area of about 33.85 × 10
4 hm
2. Secondly were summer (29.8 d and 17.65 × 10
4 hm
2) and autumn (28.4 d and 11.97 × 10
4 hm
2), while there were almost no fires in winter. In summary, grassland fires occurred at a high rate in spring (April to May), summer (June), and autumn (October).
3.1.3. Inter-annual Variation in Grassland Fire days and Area
To understand the inter-annual variation in grassland fires in the study area, the inter-annual variation characteristics of grassland fire days and area were analyzed using the annual average grassland fire days and area as indicators.
As shown in
Figure 3c, the total number of grassland fire days between 2001 and 2022 was 2022, with an annual average of 91.91 d; and the total grassland fire area was 1396.54 × 10
4 hm
2, with an annual average of 63.48 × 10
4 hm
2. During the 22-year study period, the grassland fire days was greater in 2007, 2011, and 2014–2016 and reached a peak of 200 d in 2015, followed by a decreasing trend. The grassland fire area was larger in 2003, 2007, 2011–2012, and 2015 and reached a peak of 186.91 × 10
4 hm
2 in 2012, followed by a decreasing trend. In addition, there was an apparent phenomenon of alternating increases and decreases in the grassland fire days and area.
3.2. Spatiotemporal Variation Characteristics of Dust Weather
3.2.1. Spatial Distribution Characteristics of Dust Weather days
This study analyzed the spatial distribution characteristics of floating dust days, blowing dust days, dust storm days, and total dust weather days separately using the SYNOP dust data from 2001 to 2022 with annual average dust weather days as an indicator.
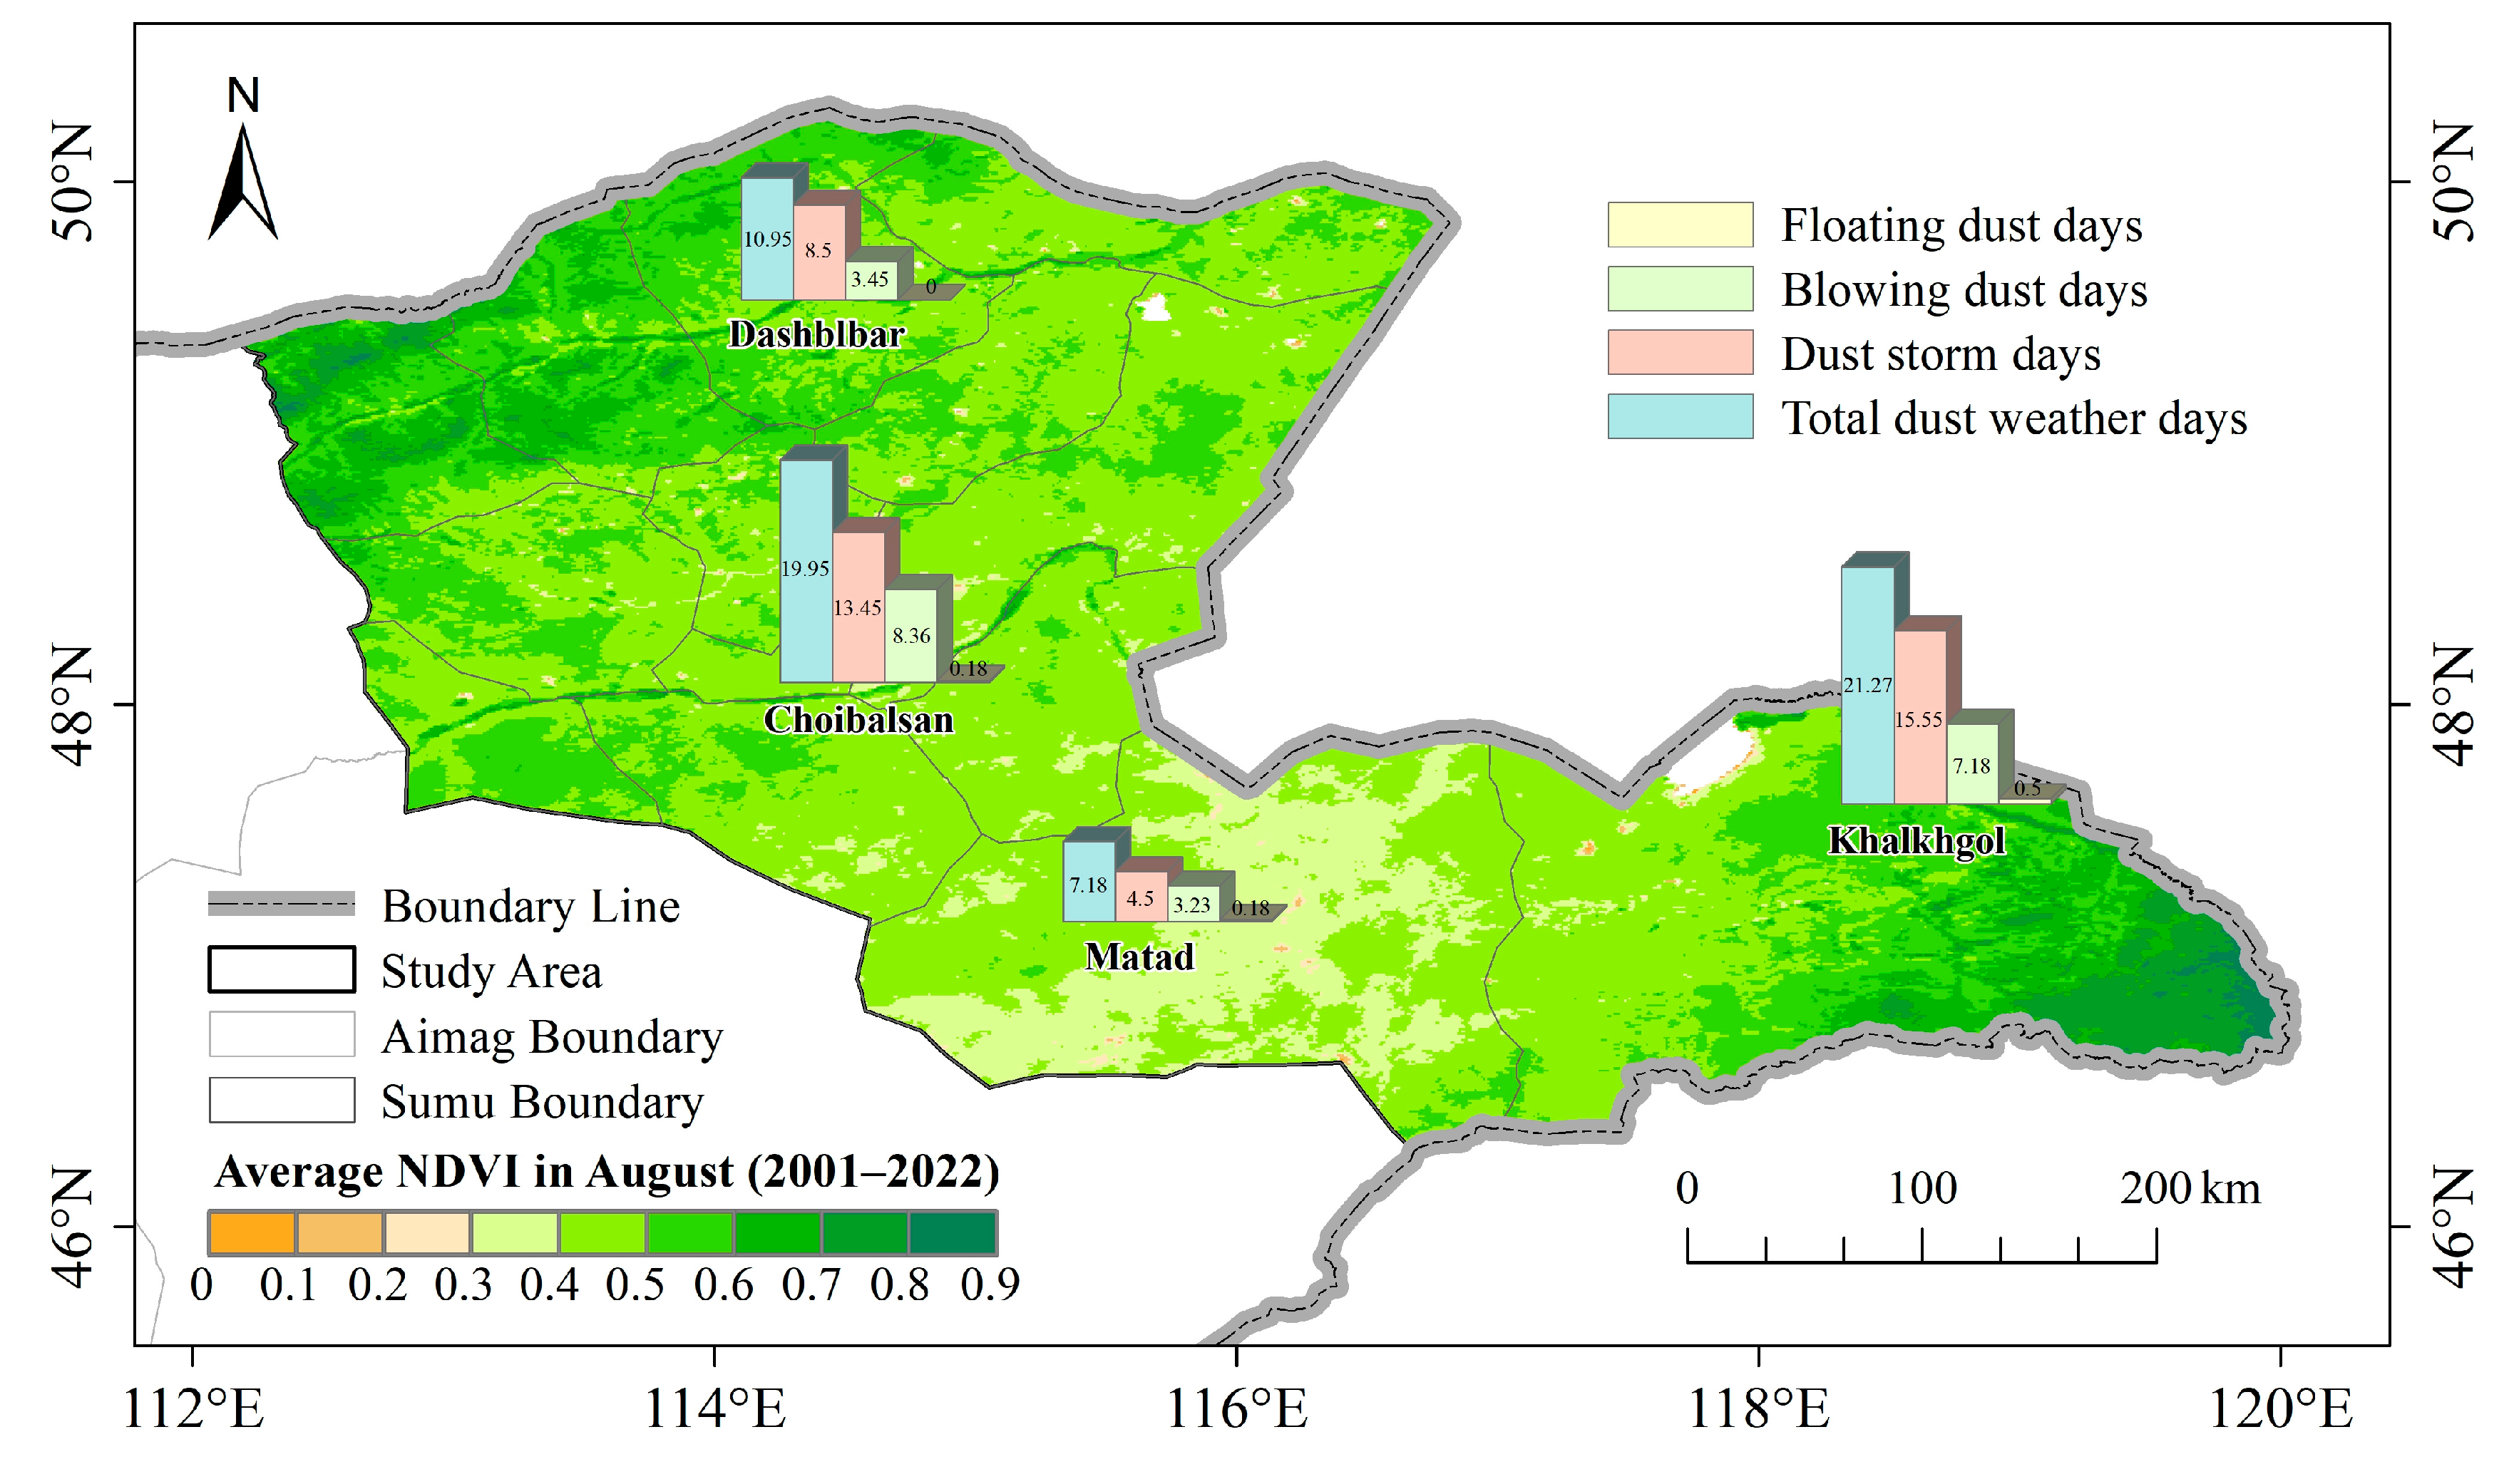
As shown in
Figure 4, there were relatively few floating dust days in the study area, with no station having more than 0.5 d of floating dust. In contrast, there were more blowing dust days, dust storm days, and total dust weather days at each station, mainly at Choibalsan and Khalkh Gol. Specifically, Choibalsan station had the highest number of blowing dust days, whereas Khalkh Gol station had the highest number of dust storm days and total dust weather days. Overall, Choibalsan and Khalkh Gol stations had a greater number of dust weather days, while Dashblbar and Matad stations had fewer.
3.2.2. Intra-annual Variation in Dust Weather days
To understand the intra-annual variation in dust weather in the study area, the monthly and seasonal variation characteristics of floating dust days, blowing dust days, dust storm days, and total dust weather days were analyzed using the seasonal average and monthly average dust weather days, respectively, as indicators.
As shown in
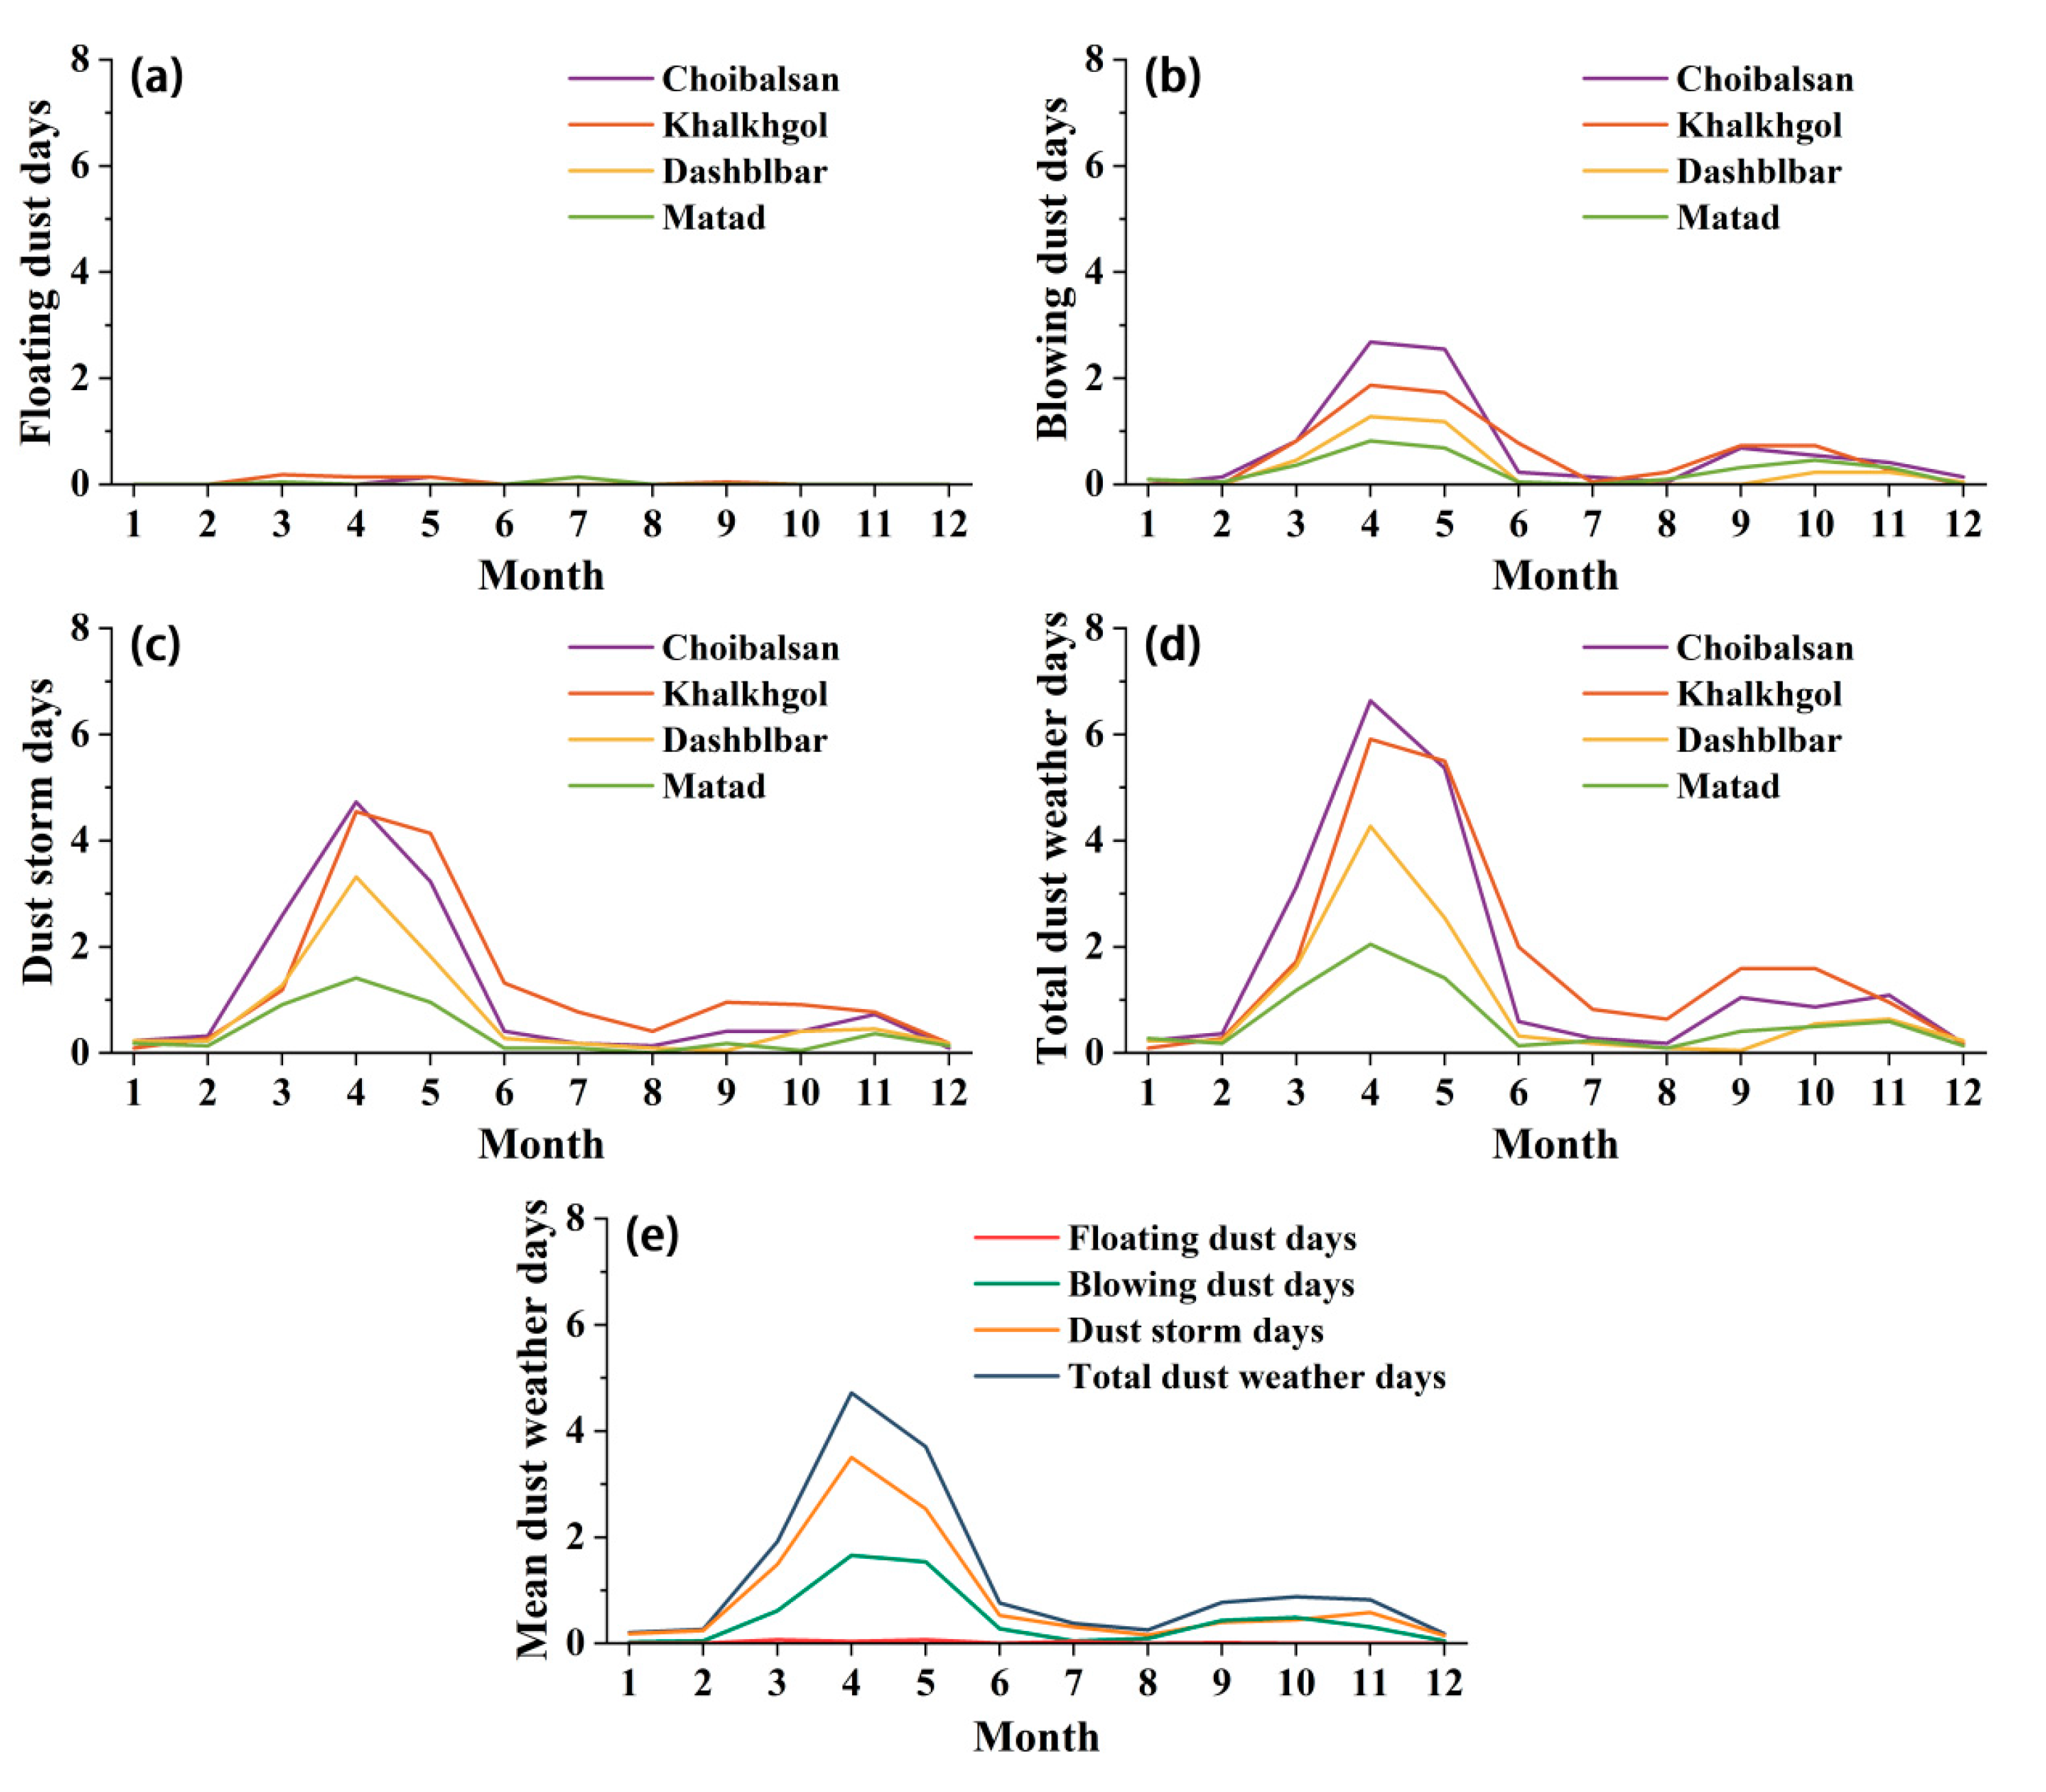
Figure 5a, there were relatively few floating dust days at the four stations, occurring mainly from March to May and in July. In contrast, there were a greater number of blowing dust days, dust storm days, and total dust weather days. These were mainly concentrated from March to May, with the highest number in April (
Figure 5b–e).
As shown in
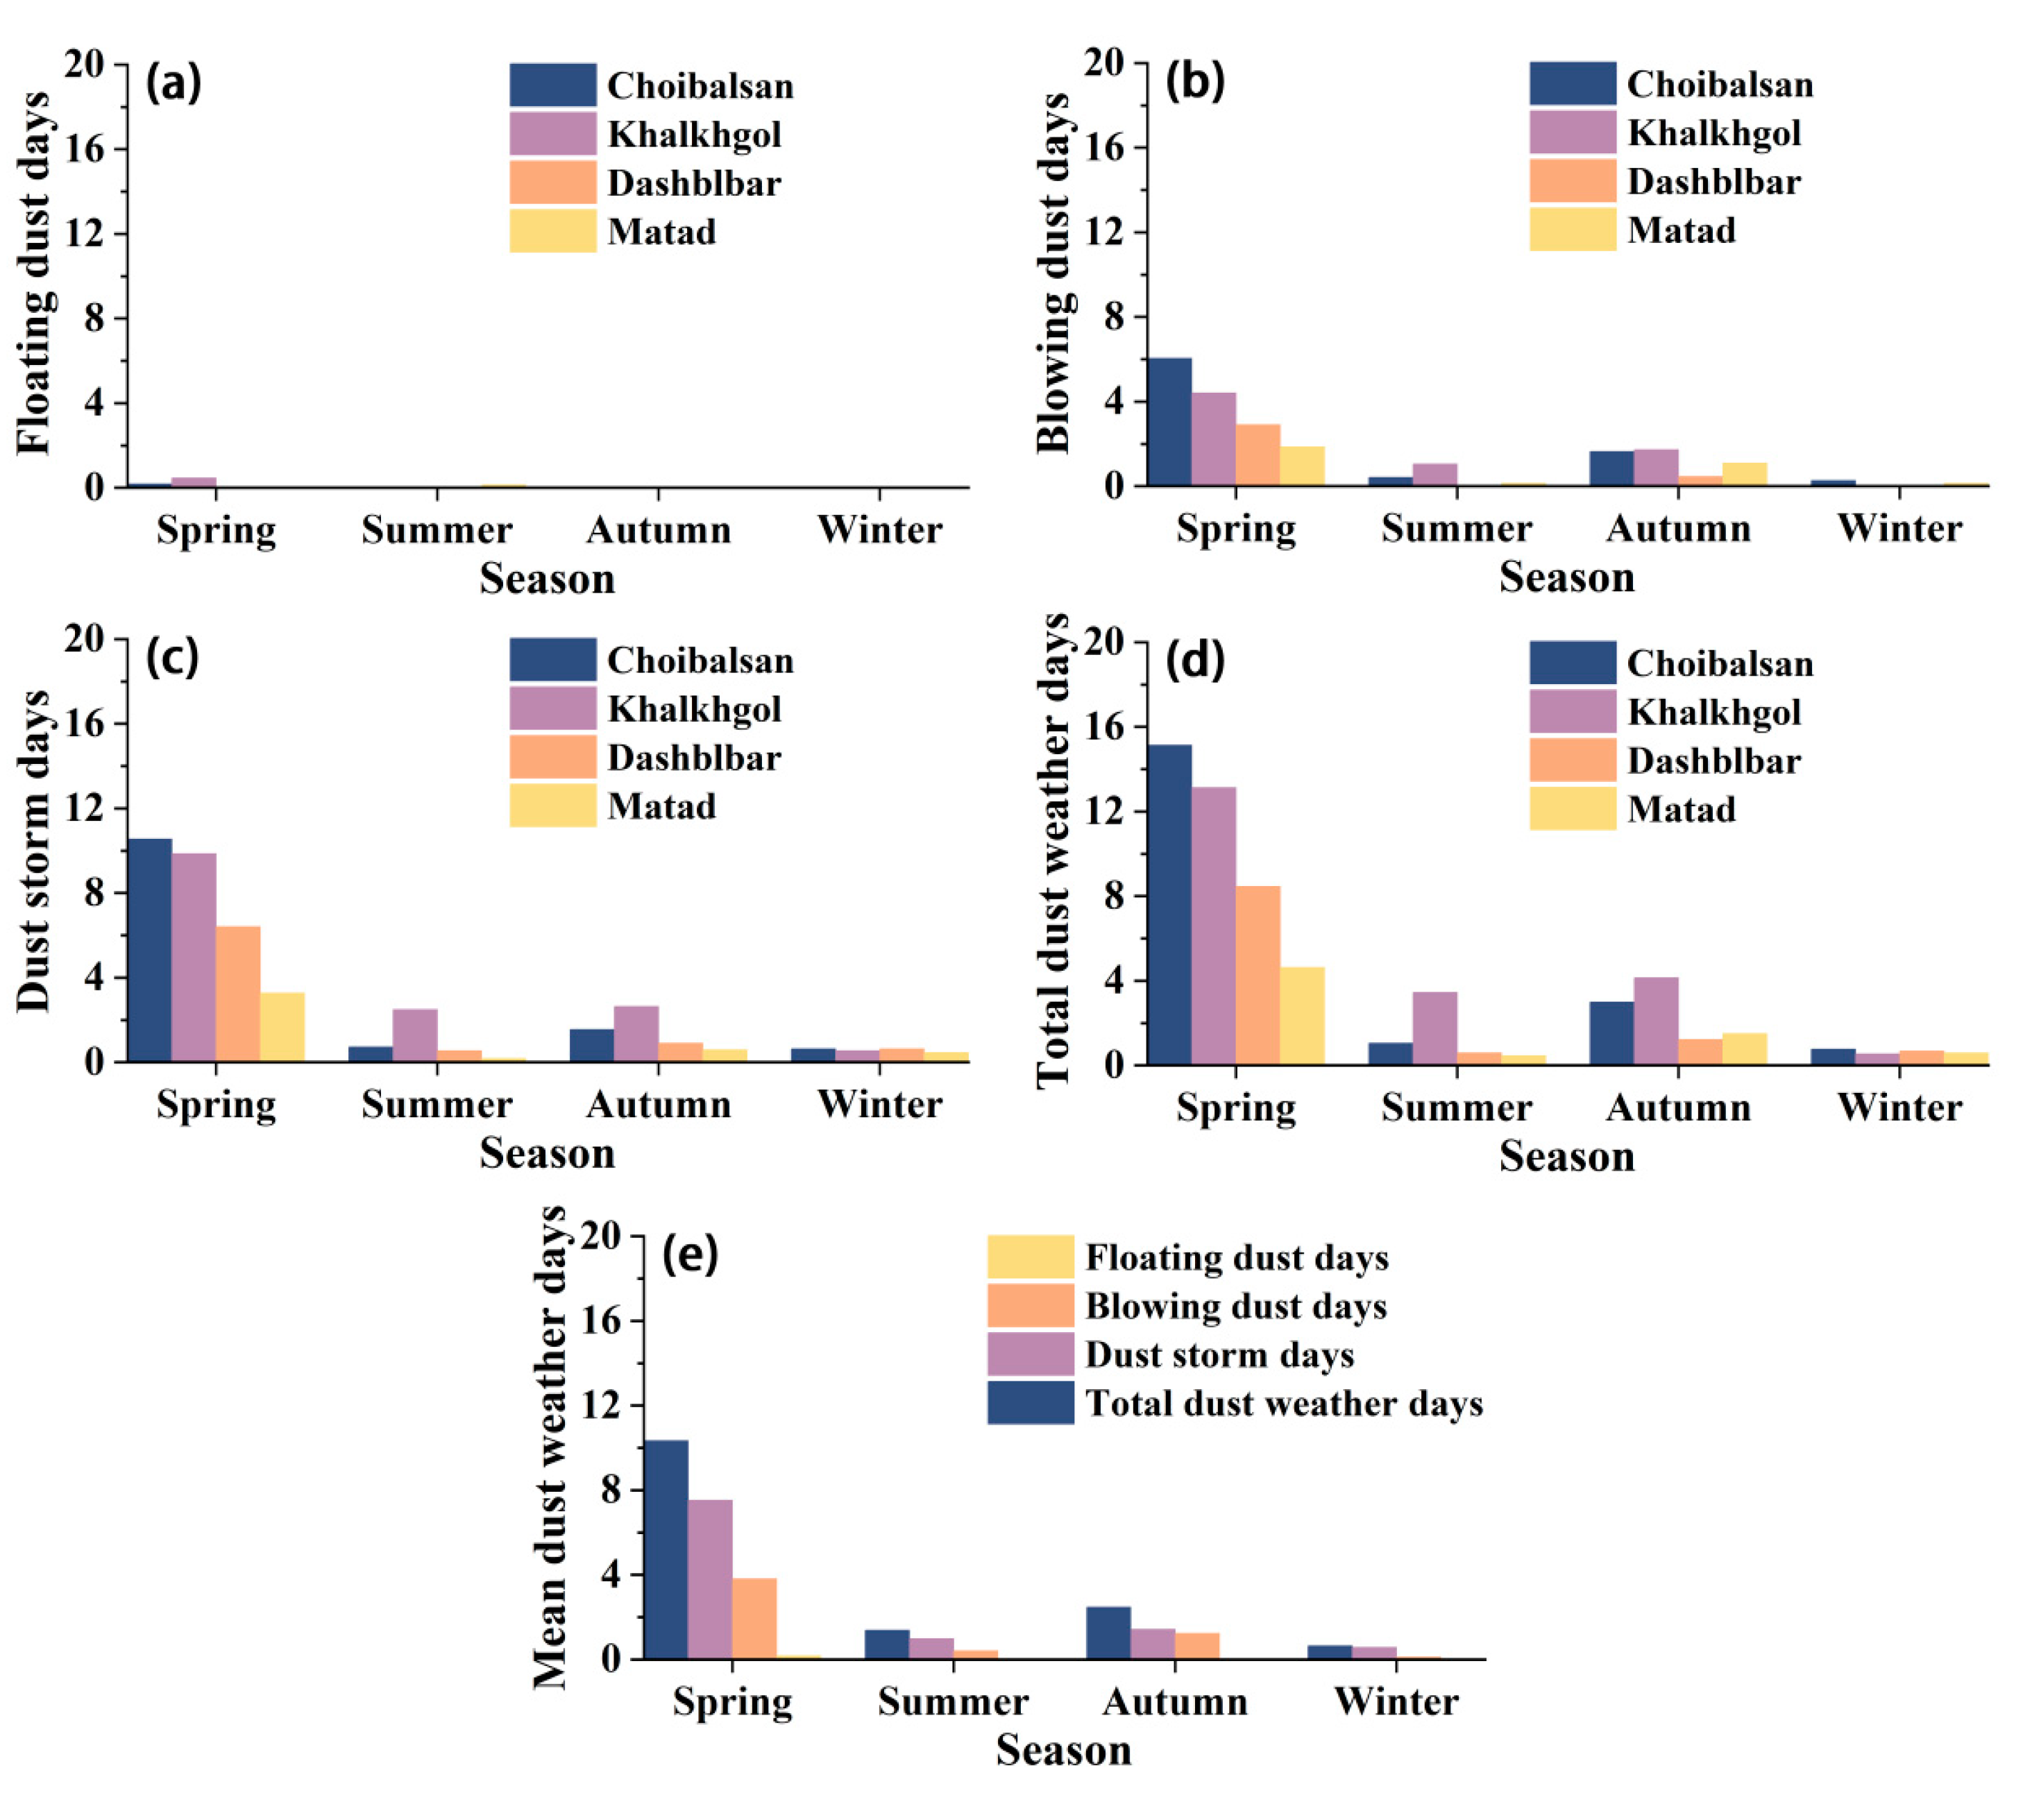
Figure 6a, the floating dust days at Khalkh Gol and Choibalsan stations occurred mainly in spring, whereas the floating dust days at Matad station occurred primarily in summer. Comparatively, each station’s blowing dust days, dust storm days, and total dust weather days were mainly concentrated in the spring (
Figure 6b–d). In general, dust weather days in the study area were mainly concentrated in spring, followed by autumn, with few occurrences in summer and winter (
Figure 6e).
3.2.3. Inter-annual Variation in Dust Weather days
To understand the inter-annual variation in dust weather in the study area, the inter-annual variation characteristics of floating dust days, blowing dust days, dust storm days, and total dust weather days were analyzed separately using the annual average dust weather days as an indicator.
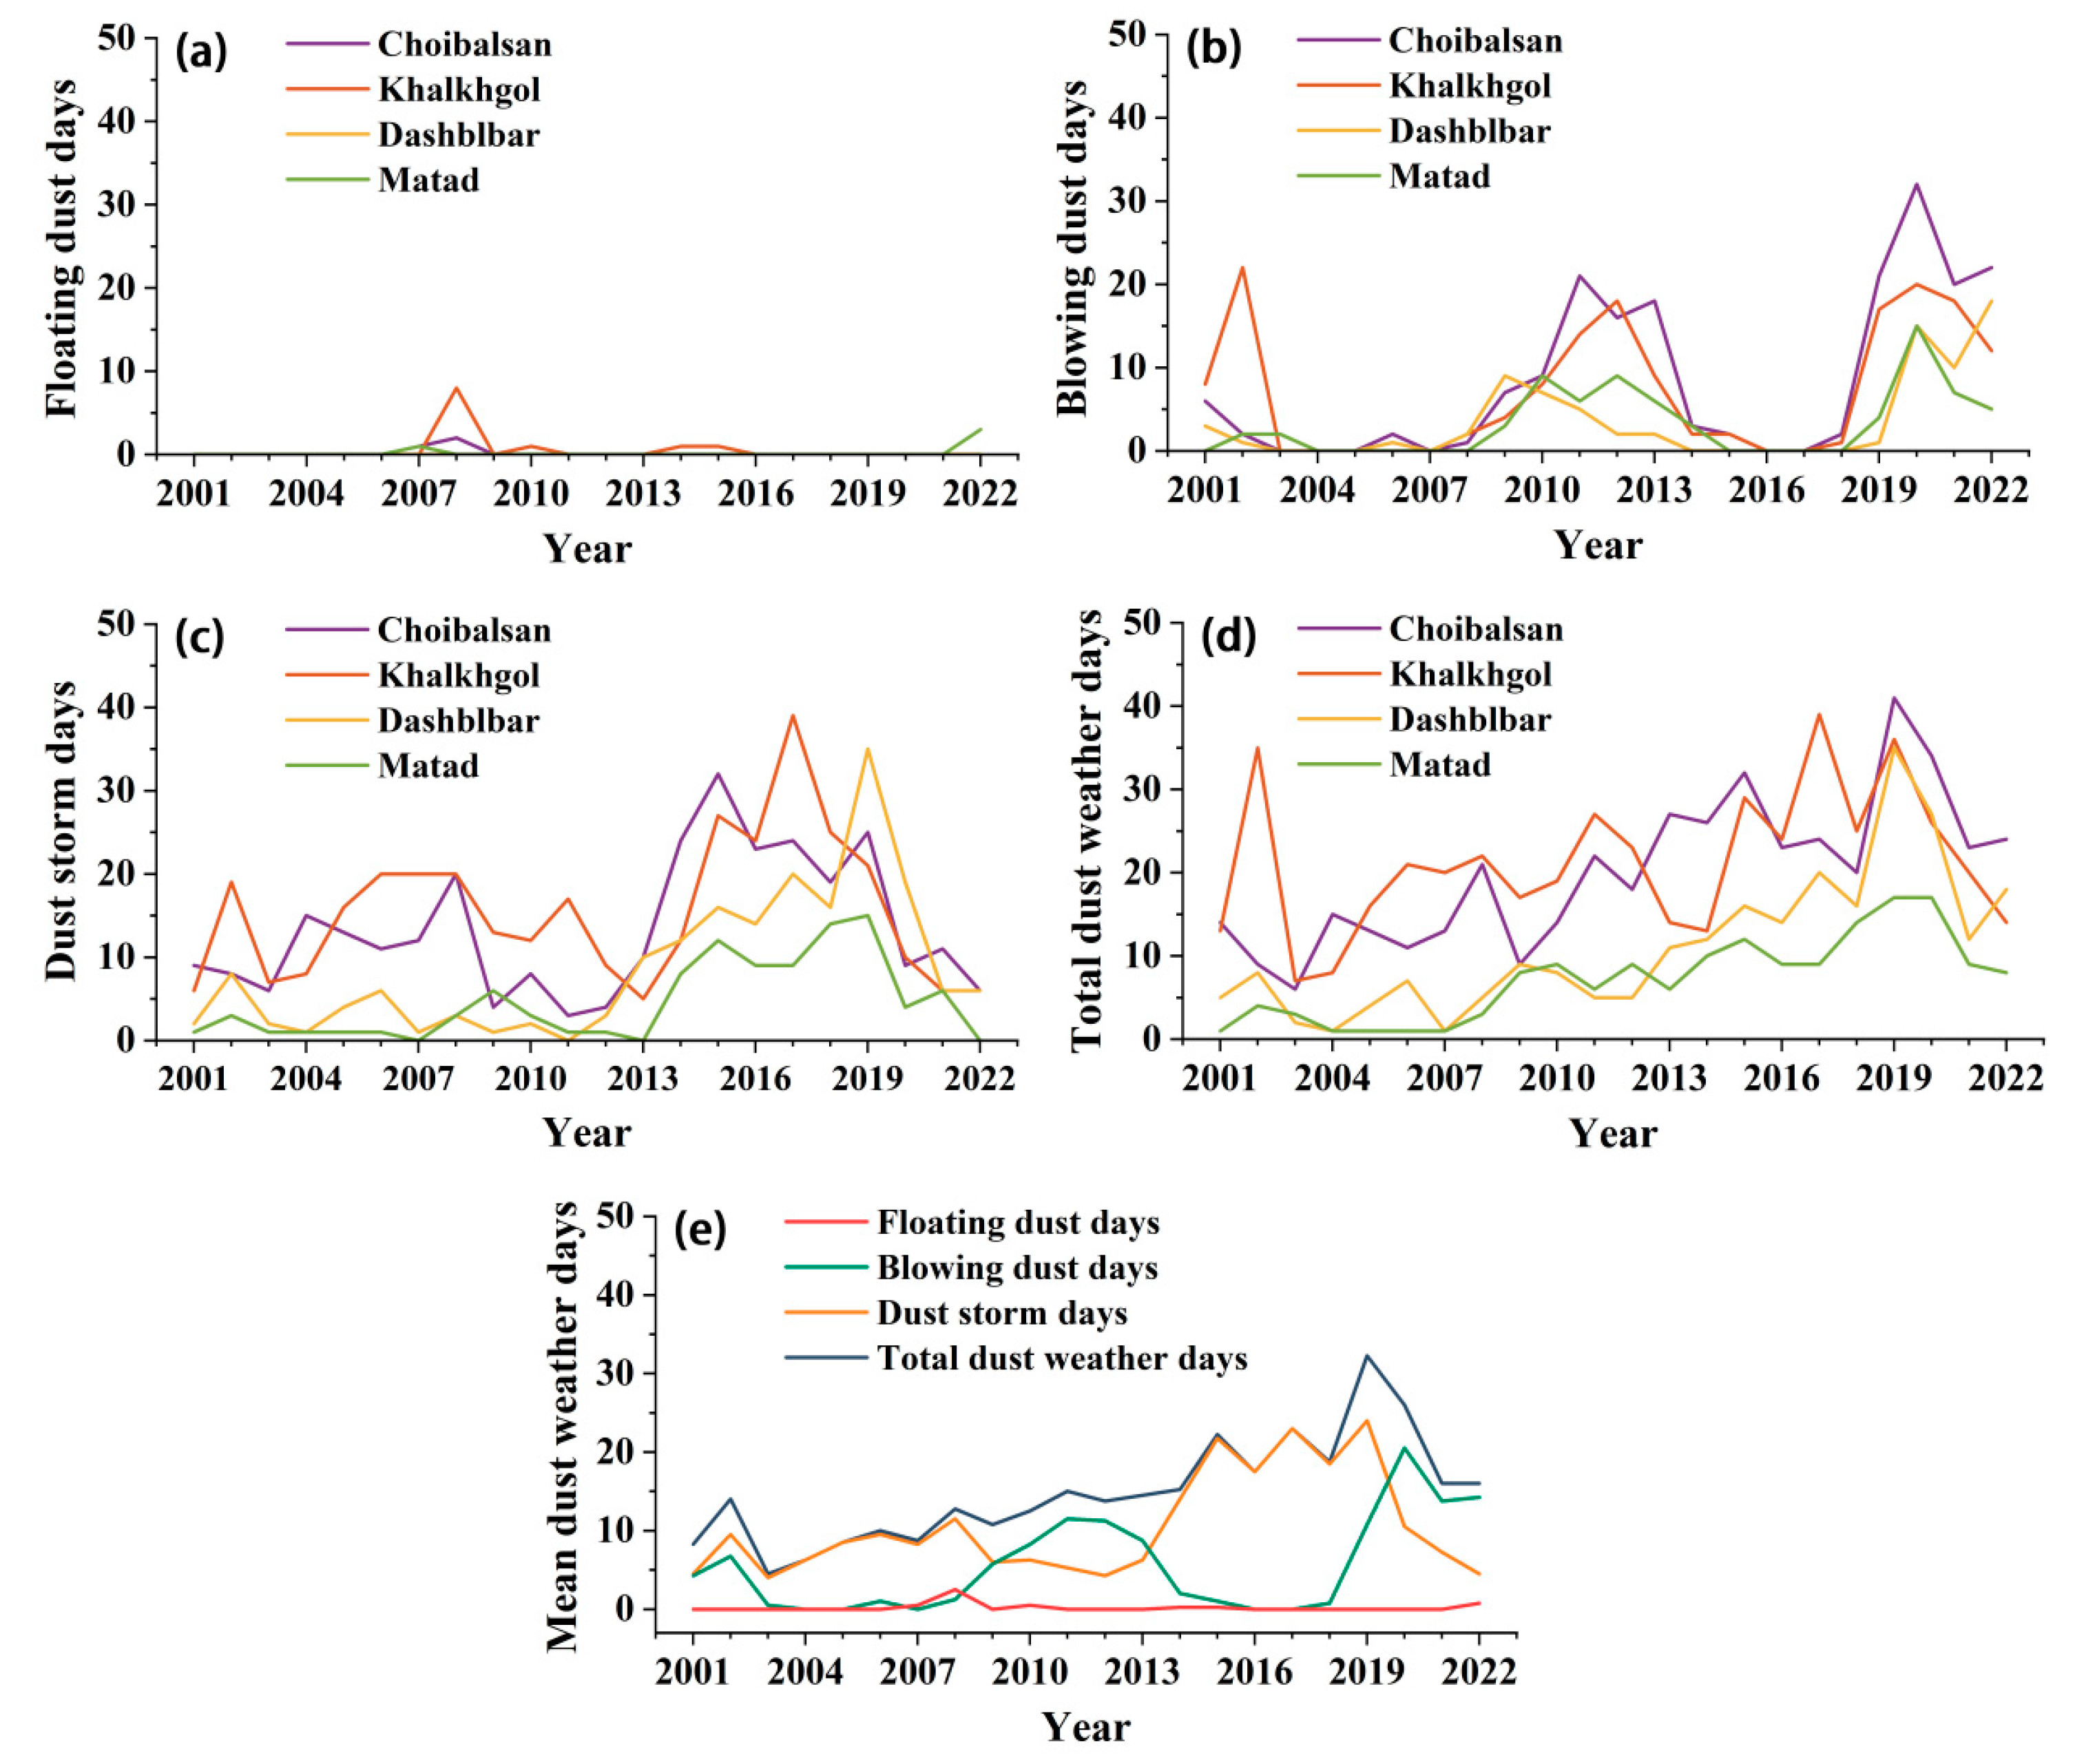
As shown in
Figure 7a–d, the dust weather in the study area from 2001 to 2022 was dominated by blowing dust and dust storms, and floating dust weather rarely occurred. As shown in
Figure 7e, blowing dust days in the study area during the 22-year study occurred more frequently in 2011–2012 and 2019–2022 and reached a peak of 20.5 d in 2020, followed by a decreasing trend. The dust storm days and total dust weather days were more frequent in 2015–2019 and reached a peak of 24 d and 32.25 d, respectively, in 2019, followed by a decreasing trend, which may have been due to the relatively low of grassland fires in the later years of the study (
Figure 3c).
3.3. Effects of Grassland Fires on Dust Weather
3.3.1. Effects of Grassland Fires on Total Dust Weather
To explore the relationship between grassland fires and total dust weather, the correlations between autumn, winter, and spring (September–February, September–March, September–April, and September–May) cumulative grassland fires (days and area) and spring (March, March–April, March–May, and March–June) cumulative total dust weather days were analyzed.
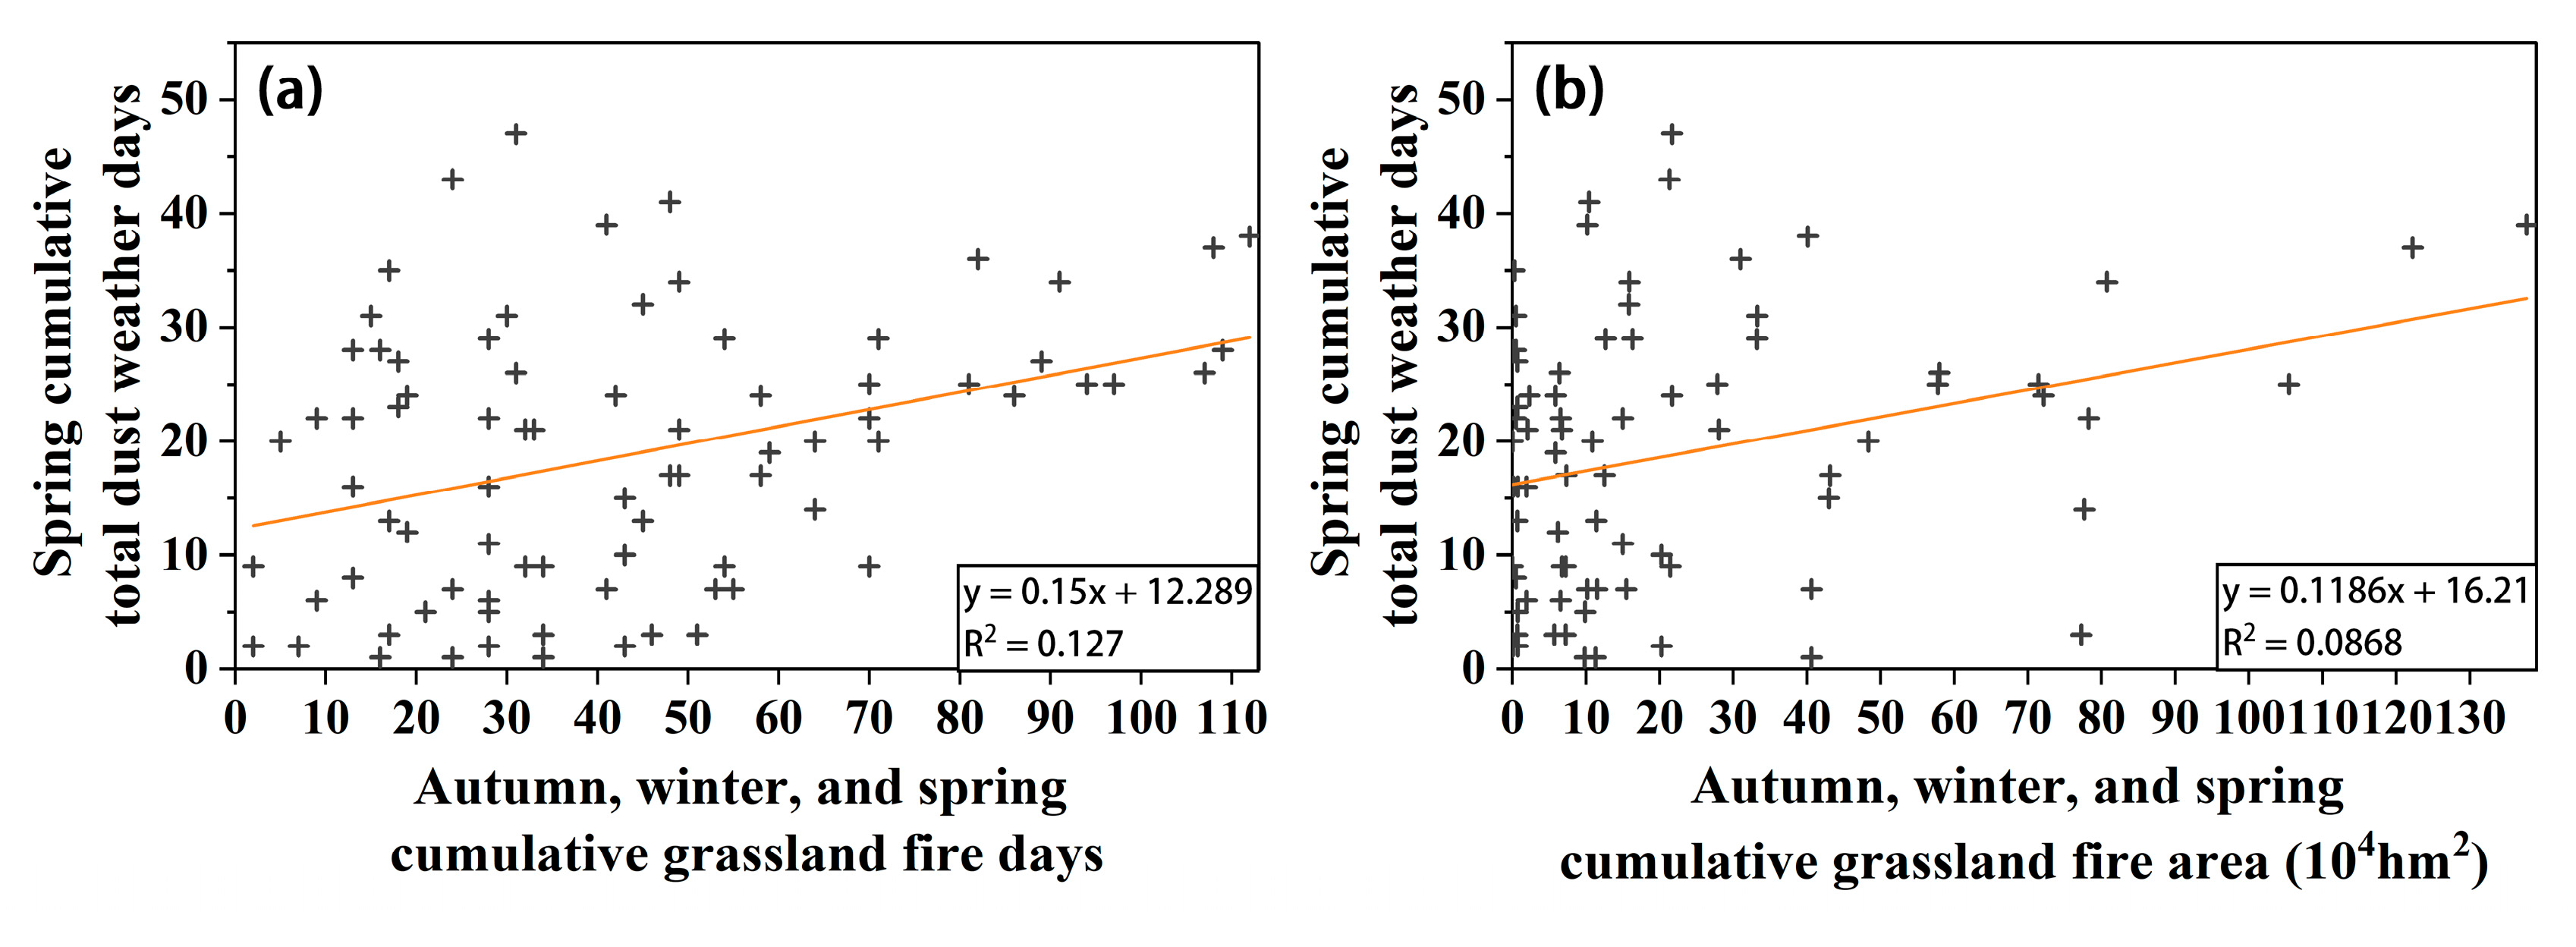
The results show (
Table A1 and
Figure 8) that the correlation coefficient between spring cumulative dust weather days and autumn, winter, and spring cumulative grassland fire days was 0.356 (R
2 = 0.127; p > 0), and the correlation coefficient with autumn, winter, and spring cumulative grassland fire area was 0.295 (R
2 = 0.0868; p > 0), all were positively correlated at 0.01 level. In contrast, the correlations between autumn, winter, and spring cumulative grassland fire days and spring total dust weather days were stronger.
3.3.2. Effects of Grassland Fires on Strong Dust Weather
To explore the relationship between grassland fires and severe dust weather, the correlations between autumn, winter, and spring (September–February, September–March, September–April, and September–May) cumulative grassland fires (days and area) and spring (March, March–April, March–May, and March–June) cumulative dust storm days were analyzed.
The results show (
Table A1 and
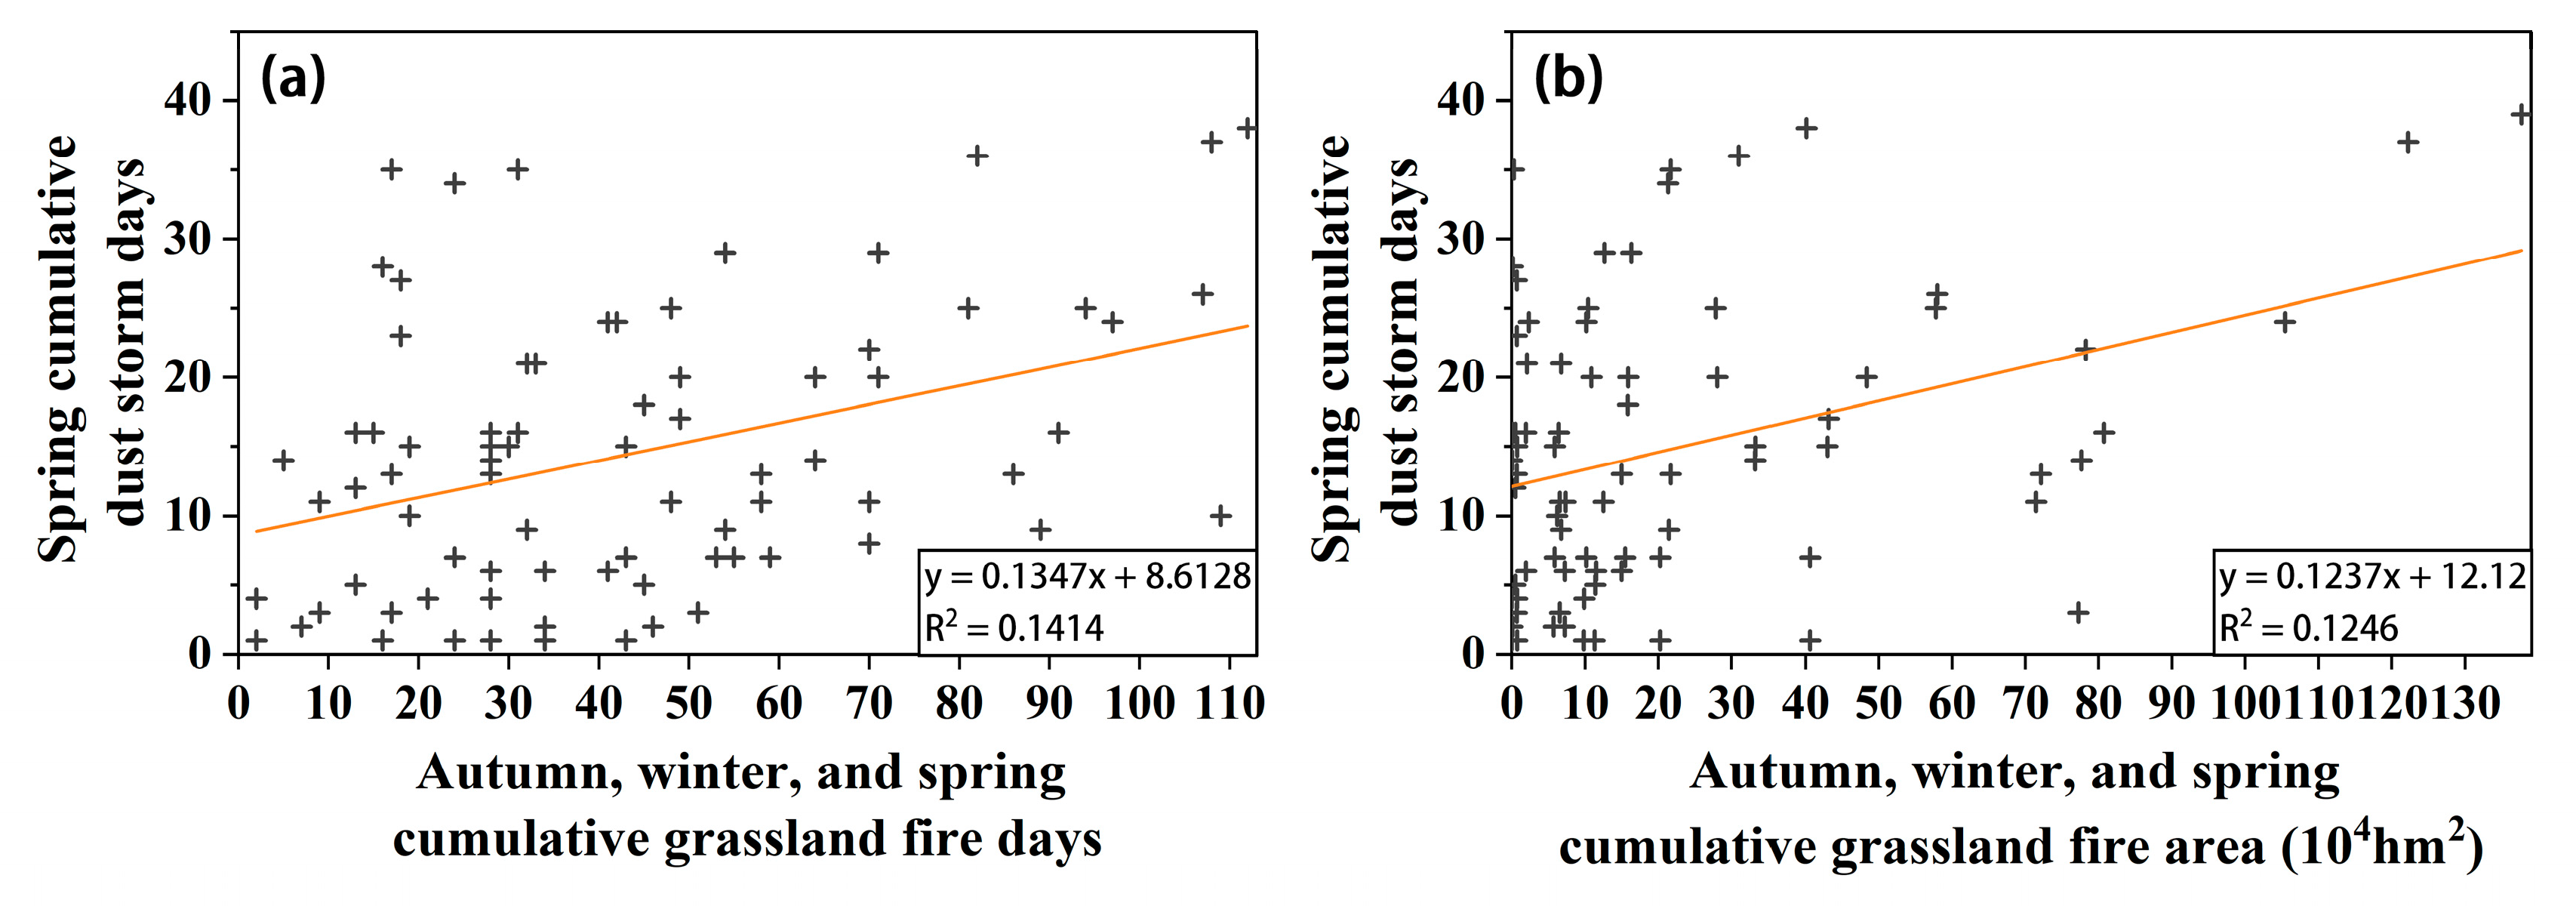
Figure 9) that the correlation coefficient between the spring dust storm days and the autumn, winter, and spring cumulative grassland fire days was 0.376 (R
2 = 0.1414; p > 0), and the correlation coefficient with the autumn, winter, and spring cumulative grassland fire area was 0.353 (R
2 = 0.1246; p > 0), all were positively correlated at the 0.01 level. In contrast, the correlation between the autumn, winter, and spring cumulative grassland fire days and spring cumulative dust storm days was stronger, which was consistent with that of the spring cumulative total dust weather days. In addition, the significance of the correlation between autumn, winter, and spring cumulative grassland fire (both days and area) and the spring cumulative dust storm days (P = 0.0005 and 0.0014) was greater than that of the spring cumulative total dust weather days (P = 0.0011 and 0.0084).
3.4. Analysis of a Representative Example
Based on the analysis results in
Section 3.3, the cumulative grassland fire days and area from September 2014 to April 2015 and the cumulative dust storm days from March to May 2015 were selected as representative examples to explore the mechanism by which grassland fires affect dust weather in detail.
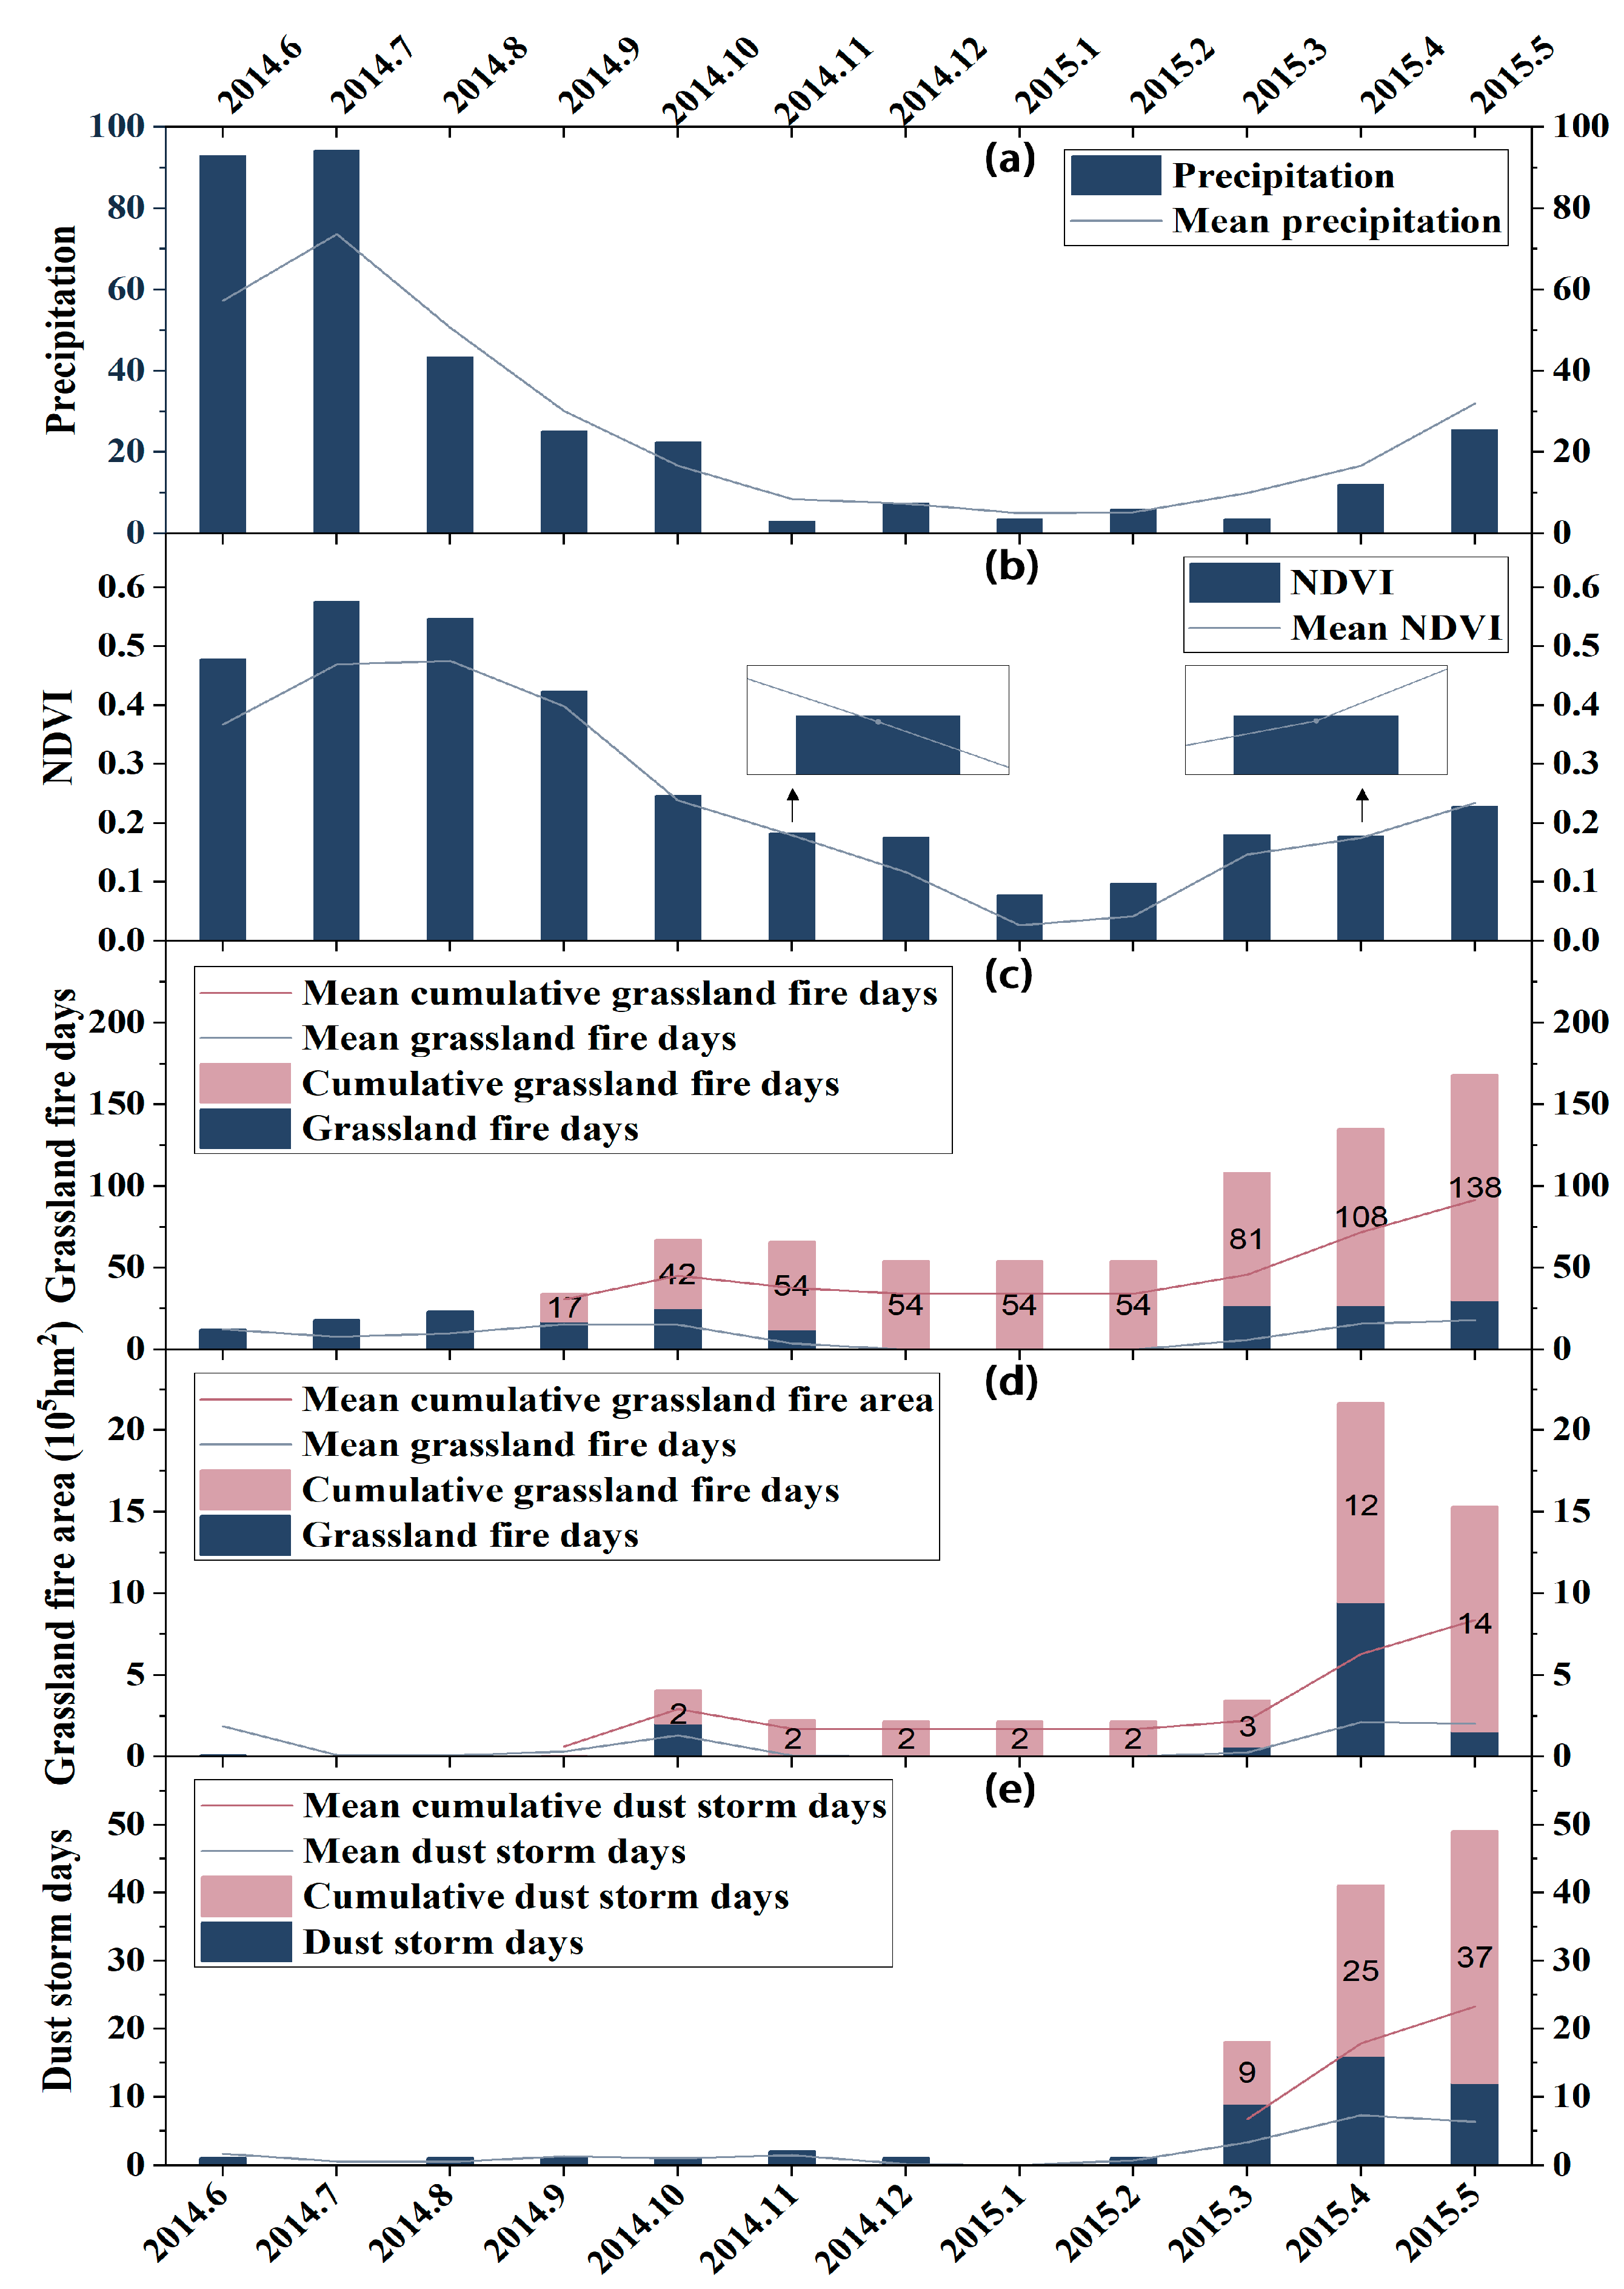
As shown in
Figure 10a, summer precipitation (June to August) was more abundant in Dornod aimag in 2014 and was above the multiyear average. For the steppe region of Mongolia, the lagging effect of vegetation coverage in autumn on summer precipitation was more significant [
37]. As a result, the NDVI was relatively high in autumn 2014 (September to November), and it continued to be high until April 2015 (
Figure 10b). Thus, the large amount of withered grass that accumulated during autumn and winter provided a rich fuel source for the occurrence of grassland fires. In addition, persistent drought conditions in the autumn and winter of 2014 and the early spring of 2015 further exacerbated the fire risk (
Figure 10a). Under these favorable conditions, the cumulative grassland fire days and area between September 2014 and April 2015 reached 108 d and 12.22 × 10
5 hm
2, respectively, which were 1.92 times and 2.92 times higher than the annual averages, respectively (
Figure 10c, d). Consequently, the vegetation coverage in large areas decreased, and the soil surface became exposed, leading to 37 cumulative dust storm days between March and May 2015, which was 2.19 times higher than the multiyear average (
Figure 10e).
However, the causes of dust storms are complex and are affected by many influencing factors and the comprehensive interaction between these factors [
23]. Wind speed is considered the main driving factor of dust storms [
23]. Therefore, it is necessary to further research from the wind speed aspect. As shown in
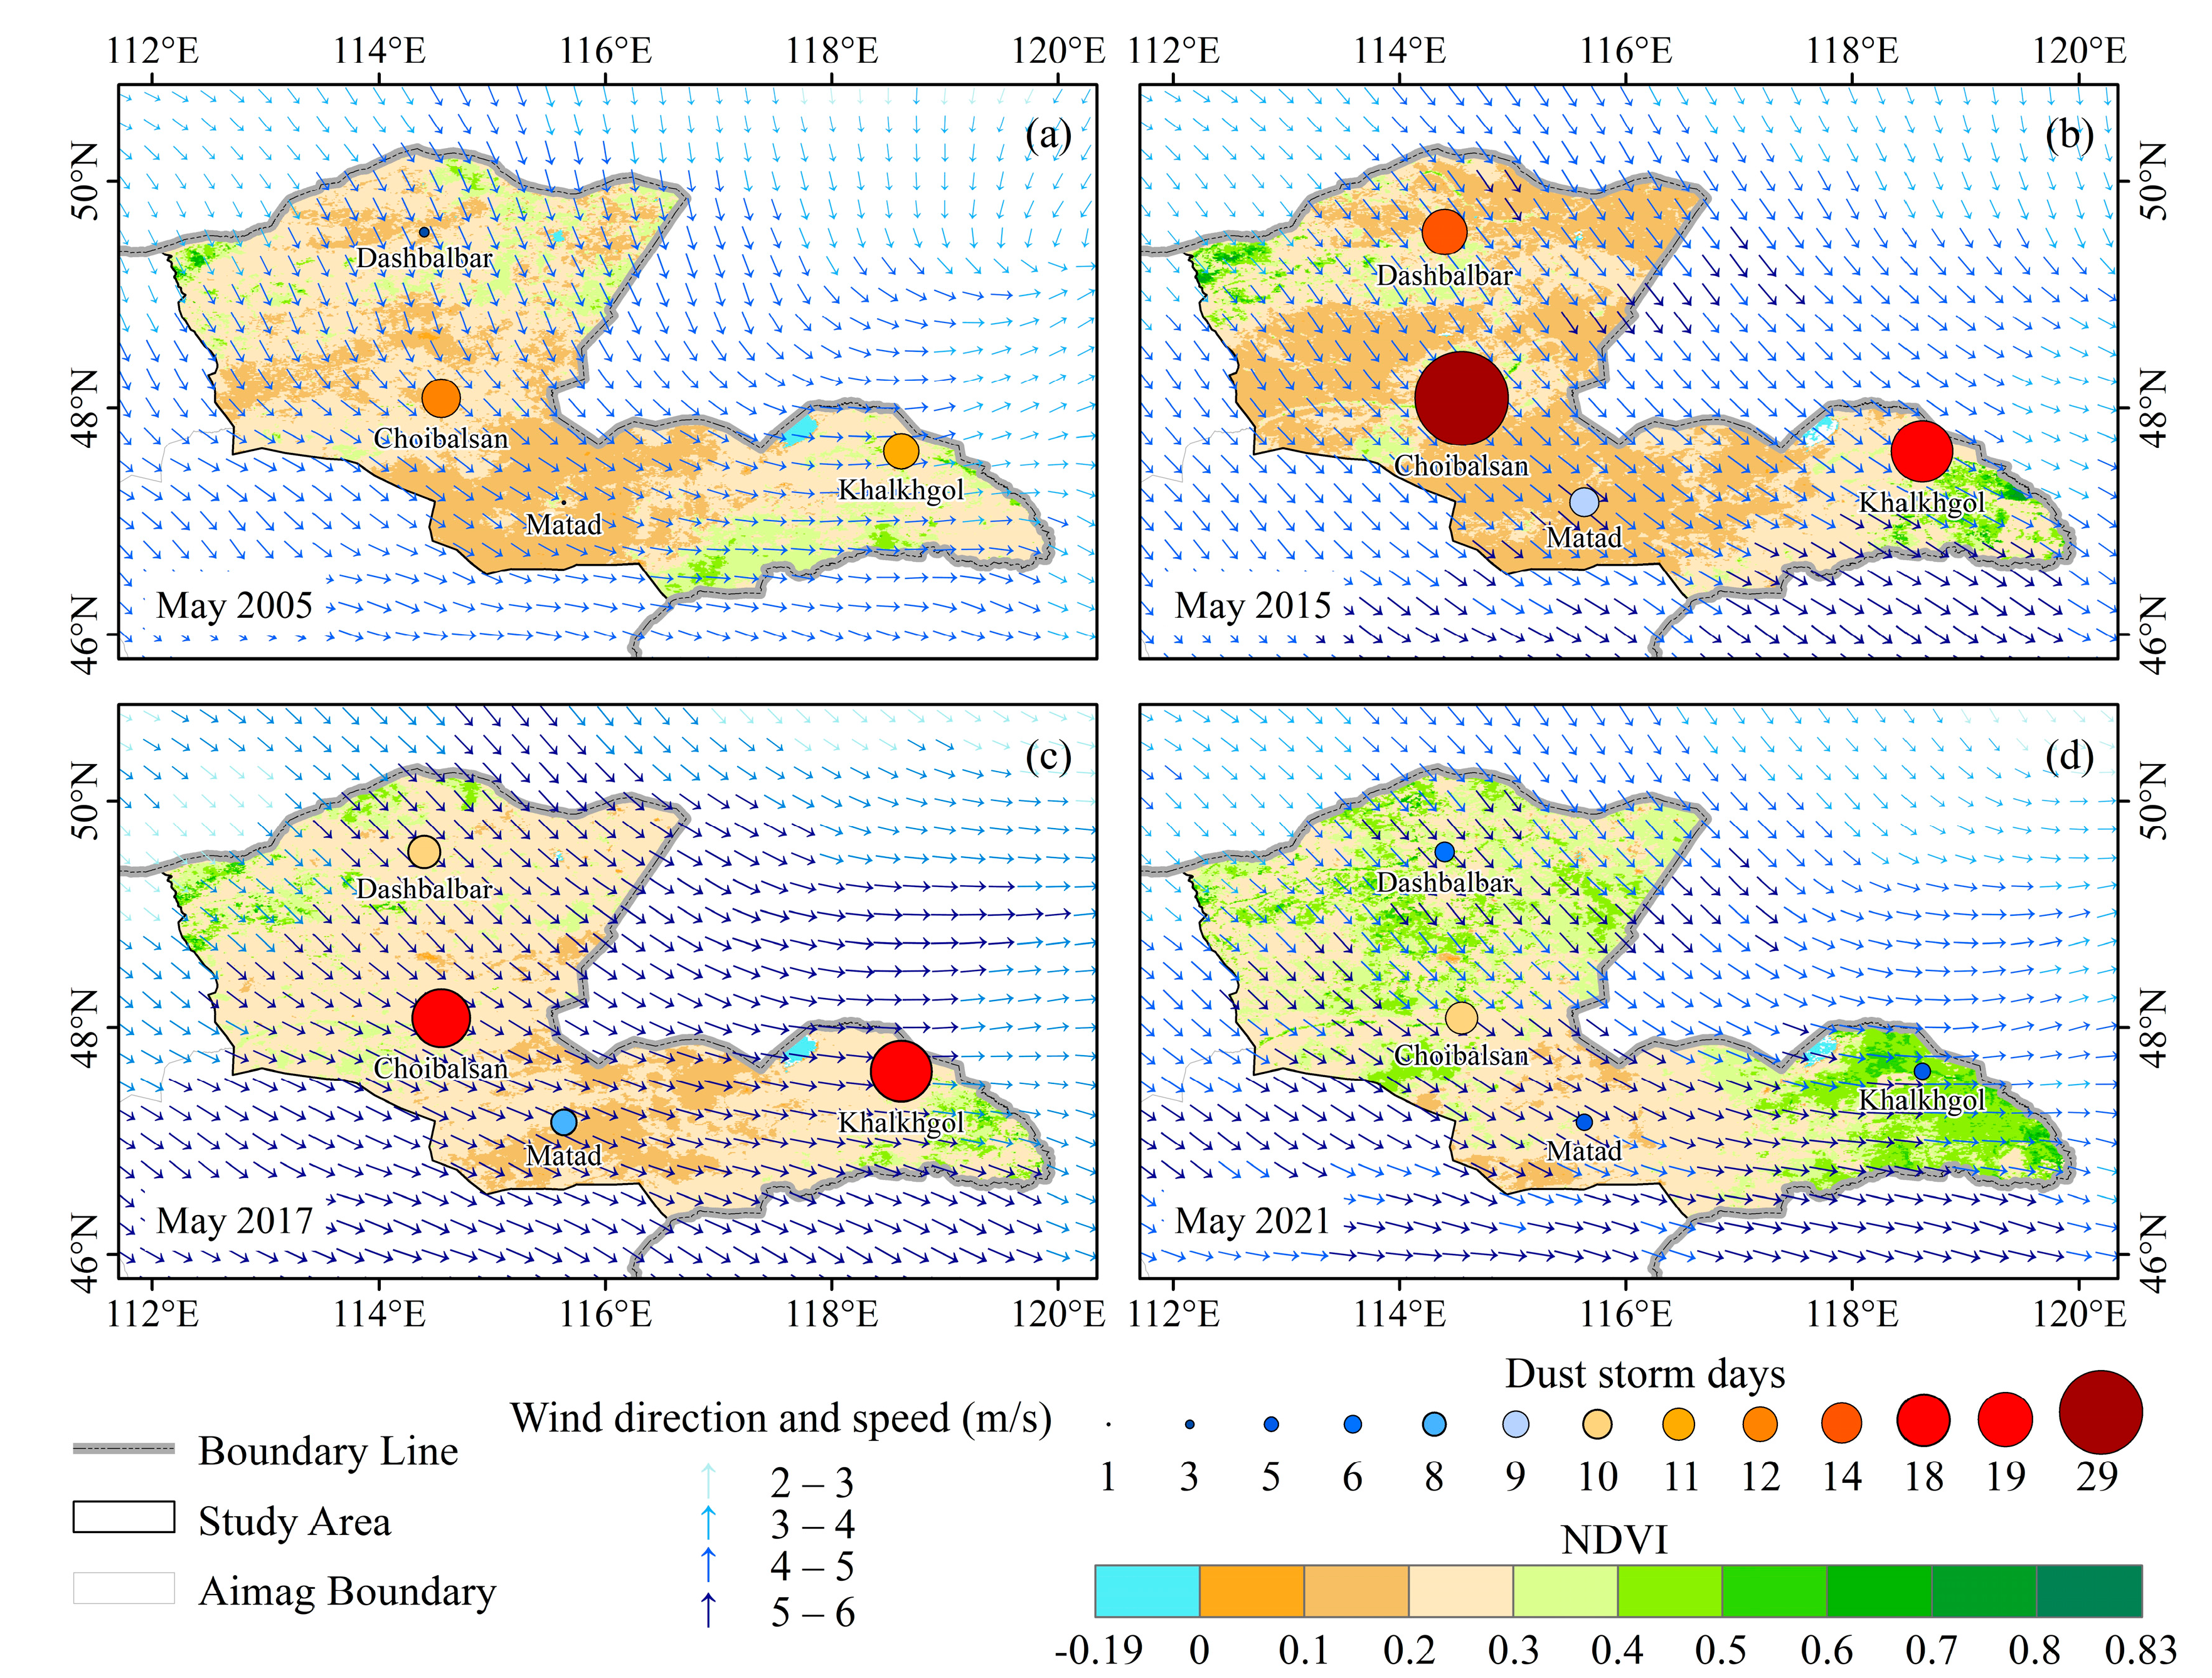
Table 2 and
Figure 11, the cumulative grassland fire days and area were highest from September 2014 to April 2015, resulting in significantly lower vegetation coverage in May 2015. In addition, Wind speeds were similar in May 2005 and May 2015, and higher in May 2017 and May 2021 than in May 2015 (
Figure 11). Under these wind speed conditions, the cumulative dust storm days in May 2015 was still greater than those in May 2005, 2017, and 2021 (
Figure 11). Among them, the cumulative dust storm days in May 2017 at Khalkh Gol station were equal to those in May 2015, which could be attributed to the greater wind speed in May 2017. This analysis further indicates that grassland fires indirectly affect dust storms by reducing vegetation coverage.
4. Discussion
We counted grassland fire days, area and frequency using MCD64A1 fire data and found the spatiotemporal characteristics of grassland fires in Dornod aimag. There was apparent spatial heterogeneity of grassland fires in Dornod aimag, and the higher frequency areas were mainly concentrated in bordering Russia and China, consistent with the results of the majority of previous research [
38]. Most of these areas are meadow steppe, have high fuel reserves due to vegetation grows taller and thicker [
30], and species renewal and biomass increase faster after fires [
34], favoring fire recurrence. Furthermore, these areas are sparsely populated, have limited human resources, and are relatively underdeveloped in firefighting technology [
15,
38]. Therefore, the frequency of grassland fires was higher in these areas. Regarding intra-annual variation, grassland fires occurred at a high rate in spring (April to May), summer (June), and autumn (October). In early spring (late March to early April), snow begins to melt, high temperatures and windy days increase, human activity increases, and grassland fires become more frequent [
5,
15]. In contrast, summer (June–August) is characterized by relatively high precipitation and is not as prone to fires. However, frequent lightning storms and human activity have led to fires in June [
5,
15]. In addition, due to the nomadic lifestyle in Mongolia, pasture vegetation is not harvested in autumn, and the large amount of withered grass leads to more frequent fires in the following spring [
15]. In terms of inter-annual variation, the grassland fire days and area in study area have decreased since 2015, which may be related to the increased surface fuel water content due to permafrost thawing in the region [
15]. In addition, fuel reserves play an essential role in grassland fires, likely to occur when grassland fuel accumulates to a certain level [
15,
22,
38]. Immediately after a fire, there is a substantial reduction in fuel, leading to relative fire absence [
15,
22,
38]. Therefore, there was an apparent phenomenon of alternating increases and decreases in the grassland fire days and area in the study area.
We counted dust weather days using the SYNOP dust data and found dust weather’s spatial and temporal characteristics in Dornod aimag. Dust weather was mainly concentrated at Choibalsan and Khalkh Gol stations, which may be due to differences in land use patterns. Mineral resources near Choibalsan station are relatively abundant [
39], while a large area of farmland is distributed near Khalkh Gol station [
34]. Large-scale mining activities and extensive crop cultivation have resulted in damage to surface vegetation and soil loosening, which contribute to the occurrence of dust to some extent [
40,
41]. In addition, the frequent occurrence of grassland fires near Khalkh Gol station may be one of the reasons for the greater number of dust weather days at this station. Regarding intra-annual variation, the dust weather days were mainly concentrated in spring (March–May), with the highest number in April [
7,
9,
23,
42]. It may be due to the frequent occurrence of grassland fires in the autumn and spring, coupled with drought and low rainfall in the spring, low vegetation coverage, large areas of bare ground, rapidly rising temperatures, and a large number of cold air masses moving southward to make the barometric pressure gradient increase, which was conducive to the occurrence of dust weather [
9,
23,
26,
43]. Moreover, there were apparent inter-annual variations in the dust weather days in the study area, which may have been the result of a combination of meteorological factors (such as wind speed, temperature, and precipitation), underlying surface factors (such as soil moisture and vegetation cover), and human factors (such as land use practices) [
9,
19,
23,
26].
The effect of grassland fire on dust weather was analyzed using the above statistics of grassland fire days and area, total dust weather days, and dust storm days. The study showed that autumn, winter, and spring cumulative grassland fires (both days and area) substantially affected spring total dust weather days and dust storm days, which was similar to the results of Yan Yu [
44]. In contrast, the effect of autumn, winter and spring cumulative grassland fire (both days and area) on spring cumulative dust storm days was found to be more significant. This phenomenon may be related to more windy weather in Dornod aimag. Grassland fires destroy surface vegetation and expose the soil surface [
18]. As the temperature rises, soil moisture evaporates, drying the soil out [
45,
46,
47]. When strong winds occur, the wind sweeps up a large amount of dust on the exposed surface, and wind erosion will be enhanced with the increase in wind speed [
48], causing reduced visibility [
49], thus making it prone to dust storms. In order to strengthen the credibility of the results, we selected representative examples from the analyzed data. The mechanism of grassland fires on dust weather was explored in terms of precipitation, vegetation coverage, grassland fires, dust storms time series, and wind speed conditions, but there are some limitations. Since the grassland fire data is raster data, and the dust data is ground station data, and there are only four stations available in the study area. Therefore, we consider the study area as a whole and focused on the temporal association between grassland fires and dust weather.
5. Conclusions
In this study, Dornod aimag in Mongolia was selected as the study area to analyze the spatiotemporal variation characteristics of grassland fires and dust weather during the period of 2001–2022, evaluate the effect of grassland fires on dust weather, and explore the mechanisms by which grassland fires affect dust weather. The following conclusions were drawn:
1. Grassland fires occurred mainly in the border areas of northern Bayandun sumu, northwestern Chuluunkhoroot sumu, northern Choibalsan sumu, southern Khalkhgol sumu, and southeastern Matad sumu. In terms of intra-annual variation, grassland fires mainly occurred in spring and summer (April to June) and autumn (October). Regarding inter-annual variation, grassland fire days and area peaked in 2015 and 2012, respectively, followed by a decreasing trend.
2. Dust weather was more frequent at Choibalsan and Khalkh Gol stations and less frequent at Dashblbar and Matad stations. In terms of intra-annual variation, dust weather was mainly concentrated in spring months, with the highest in April. Regarding inter-annual variation, blowing dust days peaked in 2020, and the dust storm days and total dust weather days peaked in 2019, after which both showed decreasing trends.
3. Autumn, winter, and spring cumulative grassland fires (both days and area) substantially affected spring total dust weather days and dust storm days, particularly spring cumulative dust storm days.
4. An analysis of typical examples from June 2014 to May 2015 showed that higher precipitation in the summer of 2014 resulted in higher vegetation coverage in autumn and winter, and even in the spring of 2015, with more accumulated fuel providing a sufficient base for grassland fires. As a result, the cumulative grassland fire days was higher, and the area was larger, from September 2014 to April 2015, leading to a considerable increase in the cumulative dust storm days in May 2015.
Author Contributions
Conceptualization, L.W.; methodology, R.F. and E.J.; software, L.W. and E.J.; formal analysis, L.W.; resources, M.Y. and Y.B.; writing—original draft preparation, L.W.; writing—review and editing, L.W., M.Y. and Y.B.; visualization, L.W.; supervision, M.Y., Y.B. and R.F.; project administration, M.Y., Y.B. and R.F.; funding acquisition, M.Y. All authors have read and agreed to the published version of the manuscript.
Funding
This research was funded by the International (Regional) Cooperation and Exchange Program of the National Natural Science Foundation of China (Grant No. 42261144746), the Natural Science Foundation of Inner Mongolia Autonomous Region (Grant No. 2023LHMS04002), the Key R&D and Achievement Transformation Program of Inner Mongolia Autonomous Region (Grant No. 2022YFSH0091), and the Key scientific research projects and soft science research projects for military civilian integration in Inner Mongolia Autonomous Region (Grant No. JMRKX202207).
Data Availability Statement
Acknowledgments
We are grateful to the anonymous reviewers for their comments that have helped to improve the original manuscript.
Conflicts of Interest
The authors declare no conflict of interest.
Appendix A
Table A1.
Correlation analysis between cumulative grassland fire (days and area) and cumulative dust weather (total dust weather days and dust storm days).
Table A1.
Correlation analysis between cumulative grassland fire (days and area) and cumulative dust weather (total dust weather days and dust storm days).
| |
Autumn, winter, and spring cumulative grassland fire days |
Autumn, winter, and spring cumulative grassland fire area |
| Spring cumulative total dust weather days |
0.356***
|
0.295***
|
| Spring cumulative dust storm days |
0.376***
|
0.353***
|
References
- Chen, J.; Wu, Y.; Wu, S.; Xie, L.; Tang, J.; Xu, Z.; Han, X.; Ma, X.; Zheng, W.; Sun, T.; et al. Application of FY-4B Geostationary Meteorological Satellite in Grassland Fire Dynamic Monitoring. IEEE Transactions on Geoscience and Remote Sensing 2023, 61, 1–9. [Google Scholar] [CrossRef]
- Zhang, R.P.; Zhou, J.H.; Guo, J.; Miao, Y.H.; Zhang, L.L. Inversion models of aboveground grassland biomass in Xinjiang based on multisource data. Front Plant Sci 2023, 14, 2. [Google Scholar] [CrossRef] [PubMed]
- Faustino-Eslava, D.V.; Yumul, G.P.; Servando, N.T.; Dimalanta, C.B. The January 2009 anomalous precipitation associated with the “Tail-end of the Cold Front” weather system in Northern and Eastern Mindanao (Philippines): Natural hazards, impacts and risk reductions. Global and Planetary Change 2011, 76, 85–94. [Google Scholar] [CrossRef]
- Wang, T.; Tu, X.; Singh, V.P.; Chen, X.; Lin, K.; Lai, R.; Zhou, Z. Socioeconomic drought analysis by standardized water supply and demand index under changing environment. Journal of Cleaner Production 2022, 347, 1–13. [Google Scholar] [CrossRef]
- Zhou, H.; Wang, Y.; Zhou, G. Temporal and spatial dynamics of grassland fires in Inner Mongolia. Acta Prataculturae Sinica 2016, 25, 16–25. [Google Scholar] [CrossRef]
- Cao, H.; Fu, C.; Zhang, W.; Liu, J. Characterizing Sand and Dust Storms (SDS) Intensity in China Based on Meteorological Data. Sustainability 2018, 10, 1. [Google Scholar] [CrossRef]
- Bao, C.; Yong, M.; Bueh, C.; Bao, Y.; Jin, E.; Bao, Y.; Purevjav, G. Analyses of the Dust Storm Sources, Affected Areas, and Moving Paths in Mongolia and China in Early Spring. Remote Sensing 2022, 14, 4–13. [Google Scholar] [CrossRef]
- Shao, Y.; Klose, M.; Wyrwoll, K.-H. Recent global dust trend and connections to climate forcing. Journal of Geophysical Research: Atmospheres 2013, 118, 2. [Google Scholar] [CrossRef]
- Bao, C.; Yong, M.; Jin, E.; Bao, Y.; Tu, X.; Bao, Y. Regional spatial and temporal variation characteristics of dust in East Asia. Geographical Research 2021, 40, 3002–3015. [Google Scholar] [CrossRef]
- Goudie, A.S. Desert dust and human health disorders. Environ Int 2014, 63, 101–113. [Google Scholar] [CrossRef]
- Sun, K.; Su, Q.; Ming, Y. Dust Storm Remote Sensing Monitoring Supported by MODIS Land Surface Reflectance Database. Remote Sensing 2019, 11, 1–13. [Google Scholar] [CrossRef]
- Yu, S.; Jiang, L.; Du, W.; Zhao, J.; Zhang, H.; Zhang, Q.; Liu, H. Estimation and Spatio-temporal Patterns of Carbon Emissions from Grassland Fires in Inner Mongolia, China. Chinese Geographical Science 2020, 30, 573. [Google Scholar] [CrossRef]
- Ginoux, P.; Prospero, J.M.; Gill, T.E.; Hsu, N.C.; Zhao, M. Global-scale attribution of anthropogenic and natural dust sources and their emission rates based on MODIS Deep Blue aerosol products. Reviews of Geophysics 2012, 50, 1–2. [Google Scholar] [CrossRef]
- Chang, C.; Chang, Y.; Xiong, Z.; Ping, X.; Zhang, H.; Guo, M.; Hu, Y. Predicting Grassland Fire-Occurrence Probability in Inner Mongolia Autonomous Region, China. Remote Sensing 2023, 15, 1–2. [Google Scholar] [CrossRef]
- Bao, Y.; Shinoda, M.; Yi, K.; Fu, X.; Sun, L.; Nasanbat, E.; Li, N.; Xiang, H.; Yang, Y.; DavdaiJavzmaa, B.; et al. Satellite-Based Analysis of Spatiotemporal Wildfire Pattern in the Mongolian Plateau. Remote Sensing 2022, 15, 2–12. [Google Scholar] [CrossRef]
- Rashki, A.; Kaskaoutis, D.G.; Sepehr, A. Statistical evaluation of the dust events at selected stations in Southwest Asia: From the Caspian Sea to the Arabian Sea. Catena 2018, 165, 590–591. [Google Scholar] [CrossRef]
- Wang, Z.; Huang, R.; Yao, Q.; Zong, X.; Tian, X.; Zheng, B.; Trouet, V. Strong winds drive grassland fires in China. Environmental Research Letters 2023, 18, 1–10. [Google Scholar] [CrossRef]
- Idris, M.H.; Kuraji, K.; Suzuki, M. Evaluating vegetation recovery following large-scale forest fires in Borneo and northeastern China using multi-temporal NOAA/AVHRR images. Journal of Forest Research 2017, 10, 101. [Google Scholar] [CrossRef]
- Bao, C.; Yong, M.; Bi, L.; Gao, H.; Li, J.; Bao, Y.; Gomboludev, P. Impacts of Underlying Surface on the Dusty Weather in Central Inner Mongolian Steppe, China. Earth and Space Science 2021, 8, 1–17. [Google Scholar] [CrossRef]
- Sankey, J.B.; Germino, M.J.; Glenn, N.F. Relationships of post-fire aeolian transport to soil and atmospheric conditions. Aeolian Research 2009, 1, 75. [Google Scholar] [CrossRef]
- Whicker, J.J.; Breshears, D.D.; Wasiolek, P.T.; Kirchner, T.B.; Tavani, R.A.; Schoep, D.A.; Rodgers, J.C. Temporal and Spatial Variation of Episodic Wind Erosion in Unburned and Burned Semiarid Shrubland. Journal of Environmental Quality 2002, 31, 599–612. [Google Scholar] [CrossRef]
- Qu, Z.; Zheng, S.; Bai, Y. Spatiotemporal patterns and driving factors of grassland fire on Mongolian Plateau. Chinese Journal of Applied Ecology 2010, 21, 807–813. [Google Scholar] [CrossRef]
- Liu, X.; Song, H.; Lei, T.; Liu, P.; Xu, C.; Wang, D.; Yang, Z.; Xia, H.; Wang, T.; Zhao, H. Effects of natural and anthropogenic factors and their interactions on dust events in Northern China. Catena 2021, 196, 1–9. [Google Scholar] [CrossRef]
- Gavrouzou, M.; Hatzianastassiou, N.; Gkikas, A.; Korras-Carraca, M.-B.; Mihalopoulos, N. A Global Climatology of Dust Aerosols Based on Satellite Data: Spatial, Seasonal and Inter-Annual Patterns over the Period 2005–2019. Remote Sensing 2021, 13, 1–31. [Google Scholar] [CrossRef]
- Li, Y.; Zhao, J.; Guo, X.; Zhang, Z.; Tan, G.; Yang, J. The Influence of Land Use on the Grassland Fire Occurrence in the Northeastern Inner Mongolia Autonomous Region, China. Sensors (Basel) 2017, 17, 1–19. [Google Scholar] [CrossRef] [PubMed]
- Lee, E.-H.; Sohn, B.-J. Recent increasing trend in dust frequency over Mongolia and Inner Mongolia regions and its association with climate and surface condition change. Atmospheric Environment 2011, 45, 4611–4616. [Google Scholar] [CrossRef]
- Liu, M.; Zhao, J.; Guo, X.; Zhang, Z.; Tan, G.; Yang, J. Study on Climate and Grassland Fire in HulunBuir, Inner Mongolia Autonomous Region, China. Sensors (Basel) 2017, 17, 1–14. [Google Scholar] [CrossRef] [PubMed]
- Yang, L.; Hu, Z.; Huang, Z.; Wang, L.; Han, W.; Yang, Y.; Tao, H.; Wang, J. Detection of a Dust Storm in 2020 by a Multi-Observation Platform over the Northwest China. Remote Sensing 2021, 13, 1–18. [Google Scholar] [CrossRef]
- Wickramasinghe, C.; Jones, S.; Reinke, K.; Wallace, L. Development of a Multi-Spatial Resolution Approach to the Surveillance of Active Fire Lines Using Himawari-8. Remote Sensing 2016, 8, 1–13. [Google Scholar] [CrossRef]
- Na, L.; Zhang, J.; Bao, Y.; Bao, Y.; Na, R.; Tong, S.; Si, A. Himawari-8 Satellite Based Dynamic Monitoring of Grassland Fire in China-Mongolia Border Regions. Sensors (Basel) 2018, 18, 1–15. [Google Scholar] [CrossRef]
- He, Y.; Yi, F.; Yin, Z.; Liu, F.; Yi, Y.; Zhou, J. Mega Asian dust event over China on 27–31 March 2021 observed with space-borne instruments and ground-based polarization lidar. Atmospheric Environment 2022, 285, 1–11. [Google Scholar] [CrossRef]
- Lai, Q. Simulation of GPP Based on Solar-induced Chlorophyll Fluorescence and its Response to Drought in Mongolian Plateau. Doctor’ s Thesis, School of Environment, Northeast Normal University, Changchun City, China, 2021.
- Sun, H.; Wang, W.J.; Liu, Z.; Zou, X.; Zhang, Z.; Ying, H.; Dong, Y.; Yang, R. The relative importance of driving factors of wildfire occurrence across climatic gradients in the Inner Mongolia, China. Ecological Indicators 2021, 131, 2. [Google Scholar] [CrossRef]
- Rihan; Zhao; Zhang; Guo; Ying; Deng; Li. Wildfires on the Mongolian Plateau: Identifying Drivers and Spatial Distributions to Predict Wildfire Probability. Remote Sensing 2019, 11, 3–10. [Google Scholar] [CrossRef]
- Takemi, T. Dust storms and cyclone tracks over the arid regions in east Asia in spring. Journal of Geophysical Research 2005, 110, 2. [Google Scholar] [CrossRef]
- Wu, J.; Kurosaki, Y.; Shinoda, M.; Kai, K. Regional Characteristics of Recent Dust Occurrence and Its Controlling Factors in East Asia. Sola 2016, 12, 187–188. [Google Scholar] [CrossRef]
- Du, J.; Bao, G.; Tong, S.; Huang, X.; Wen, D.; Mei, L.; Bao, Y. Variations in vegetation cover and its relationship with climate change and human activities in Mongolia during the period 1982-2015. Acta Prataculturae Sinica 2021, 30, 9–11. [Google Scholar] [CrossRef]
- Xu, S.; Wu, Q.; Qiao, D.; Mu, Y.; Zhang, X.; Liu, Y.; Yang, X.; Shi, Z. Spatiotemporal pattern and effecting factors of wildfire in eastern Mongolia. Journal of Desert Research 2021, 41, 85–89. [Google Scholar] [CrossRef]
- Gerel, O.; Pirajno, F.; Batkhishig, B.; Dostal, J. Mineral Resources of Mongolia; Springer, Singapore, 2021; pp. 1–12.
- Xu, J. Sand-dust storms in and around the Ordos Plateau of China as influenced by land use change and desertification. Catena 2006, 65, 279–284. [Google Scholar] [CrossRef]
- Shen, Z.; Zhang, Q.; Chen, D.; Singh, V.P. Varying effects of mining development on ecological conditions and groundwater storage in dry region in Inner Mongolia of China. Journal of Hydrology 2021, 597, 1–2. [Google Scholar] [CrossRef]
- Fan, B.; Guo, L.; Li, N.; Chen, J.; Lin, H.; Zhang, X.; Shen, M.; Rao, Y.; Wang, C.; Ma, L. Earlier vegetation green-up has reduced spring dust storms. Sci Rep 2014, 4, 2–5. [Google Scholar] [CrossRef]
- An, L.; Che, H.; Xue, M.; Zhang, T.; Wang, H.; Wang, Y.; Zhou, C.; Zhao, H.; Gui, K.; Zheng, Y.; et al. Temporal and spatial variations in sand and dust storm events in East Asia from 2007 to 2016: Relationships with surface conditions and climate change. Sci Total Environ 2018, 633, 455–459. [Google Scholar] [CrossRef] [PubMed]
- Yu, Y.; Ginoux, P. Enhanced dust emission following large wildfires due to vegetation disturbance. Nature Geoscience 2022, 15, 879–883. [Google Scholar] [CrossRef]
- Liu, Y.; Shi, F.; Liu, X.; Zhao, Z.; Jin, Y.; Zhan, Y.; Zhu, X.; Luo, W.; Zhang, W.; Sun, Y.; et al. Influence of Different Meteorological Factors on the Accuracy of Back Propagation Neural Network Simulation of Soil Moisture in China. Sustainability 2022, 14, 1–23. [Google Scholar] [CrossRef]
- Li, X.; Liu, L.; Li, H.; Wang, S.; Heng, J. Spatiotemporal soil moisture variations associated with hydro-meteorological factors over the Yarlung Zangbo River basin in Southeast Tibetan Plateau. International Journal of Climatology 2019, 40, 199–202. [Google Scholar] [CrossRef]
- Deng, Y.; Wang, S.; Bai, X.; Luo, G.; Wu, L.; Cao, Y.; Li, H.; Li, C.; Yang, Y.; Hu, Z.; et al. Variation trend of global soil moisture and its cause analysis. Ecological Indicators 2020, 110, 5–9. [Google Scholar] [CrossRef]
- Zhang, H.; Gao, Y.; Sun, D.; Liu, L.; Cui, Y.; Zhu, W. Wind Erosion Changes in a Semi-Arid Sandy Area, Inner Mongolia, China. Sustainability 2019, 11, 9–11. [Google Scholar] [CrossRef]
- Tatarko, J.; van Donk, S.J.; Ascough, J.C., 2nd; Walker, D.G. Application of the WEPS and SWEEP models to non-agricultural disturbed lands. Heliyon 2016, 2, 2. [Google Scholar] [CrossRef]
Figure 1.
Map of the study area. The background color is the digital elevation model (DEM) of Dornod aimag.
Figure 1.
Map of the study area. The background color is the digital elevation model (DEM) of Dornod aimag.
Figure 2.
Spatial distribution of grassland fire frequency in Dornod aimag (2001–2022).
Figure 2.
Spatial distribution of grassland fire frequency in Dornod aimag (2001–2022).
Figure 3.
Temporal variations in grassland fire days and area in Dornod aimag from 2001 to 2022. (a) Monthly variation; (b) Seasonal variation; (c) Inter-annual variation.
Figure 3.
Temporal variations in grassland fire days and area in Dornod aimag from 2001 to 2022. (a) Monthly variation; (b) Seasonal variation; (c) Inter-annual variation.
Figure 4.
Spatial distribution of dust weather days in Dornod aimag (2001–2022).
Figure 4.
Spatial distribution of dust weather days in Dornod aimag (2001–2022).
Figure 5.
Monthly variations in dust weather days in Dornod aimag from 2001 to 2022. (a) Floating dust days; (b) Blowing dust days; (c) Dust storm days; (d) Total dust weather days; (e) Mean dust weather days.
Figure 5.
Monthly variations in dust weather days in Dornod aimag from 2001 to 2022. (a) Floating dust days; (b) Blowing dust days; (c) Dust storm days; (d) Total dust weather days; (e) Mean dust weather days.
Figure 6.
Seasonal variations in dust weather days in Dornod aimag from 2001 to 2022. (a) Floating dust days; (b) Blowing dust days; (c) Dust storm days; (d) Total dust weather days; (e) Mean dust weather days.
Figure 6.
Seasonal variations in dust weather days in Dornod aimag from 2001 to 2022. (a) Floating dust days; (b) Blowing dust days; (c) Dust storm days; (d) Total dust weather days; (e) Mean dust weather days.
Figure 7.
Inter-annual variations in dust weather days in Dornod aimag from 2001 to 2022. (a) Floating dust days; (b) Blowing dust days; (c) Dust storm days; (d) Total dust weather days; (e) Mean dust weather days.
Figure 7.
Inter-annual variations in dust weather days in Dornod aimag from 2001 to 2022. (a) Floating dust days; (b) Blowing dust days; (c) Dust storm days; (d) Total dust weather days; (e) Mean dust weather days.
Figure 8.
Linear regression of grassland fire and total dust weather. (a) Linear regression of autumn, winter, and spring cumulative grassland fire days and spring cumulative total dust weather days; (b) Linear regression of autumn, winter, and spring cumulative grassland fire area and spring cumulative total dust weather days. (Note: autumn, winter, and spring cumulative grassland fire days are accumulated from September to February/March/April/May of the following year; spring cumulative total dust weather days are accumulated from March to March/April/May/June.).
Figure 9.
Linear regression of grassland fire and dust storm. (a) Linear regression of autumn, winter, and spring cumulative grassland fire days and spring cumulative dust storm days; (b) Linear regression of autumn, winter, and spring cumulative grassland fire area and spring cumulative dust storm days. (Note: autumn, winter, and spring cumulative grassland fire days are accumulated from September to February/March/April/May of the following year; spring cumulative storm days are accumulated from March to March/April/May/June.).
Figure 10.
Time series plot for June 2014 to May 2015. (a) Precipitation; (b) NDVI; (c) Grassland fire days; (d) Grassland fire area; (e) Dust storm days.
Figure 10.
Time series plot for June 2014 to May 2015. (a) Precipitation; (b) NDVI; (c) Grassland fire days; (d) Grassland fire area; (e) Dust storm days.
Figure 11.
Map of dust storm days and wind field. The background is NDVI. (a) Map of dust storm days and wind field for May 2005; (b) Map of dust storm days and wind field for May 2015; (c) Map of dust storm days and wind field for May 2017; (d) Map of dust storm days and wind field for May 2021.
Figure 11.
Map of dust storm days and wind field. The background is NDVI. (a) Map of dust storm days and wind field for May 2005; (b) Map of dust storm days and wind field for May 2015; (c) Map of dust storm days and wind field for May 2017; (d) Map of dust storm days and wind field for May 2021.
Table 1.
Example of analyzed data.
Table 1.
Example of analyzed data.
| Variable 1 |
Variable 2 |
| Cumulative grassland fire days (cumulative grassland fire area), September 2001–February 2002 |
Cumulative total dust weather days (cumulative dust storm days), March 2002 |
| Cumulative grassland fire days (cumulative grassland fire area), September 2001–March 2002 |
Cumulative total dust weather days (cumulative dust storm days), March–April 2002 |
| Cumulative grassland fire days (cumulative grassland fire area), September 2001–April 2002 |
Cumulative total dust weather days (cumulative dust storm days), March–May 2002 |
| Cumulative grassland fire days (cumulative grassland fire area), September 2001–May 2002 |
Cumulative total dust weather days (cumulative dust storm days), March–June 2002 |
| … |
… |
| Cumulative grassland fire days (cumulative grassland fire area), September 2021–May 2022 |
Cumulative total dust weather days (cumulative dust storm days), March–June 2022 |
Table 2.
Cumulative grassland fire days and area from September 2004 to April 2005, September 2014 to April 2015, September 2016 to April 2017, and September 2020 to April 2021.
Table 2.
Cumulative grassland fire days and area from September 2004 to April 2005, September 2014 to April 2015, September 2016 to April 2017, and September 2020 to April 2021.
| |
Cumulative grassland fire days |
Cumulative grassland fire area (105 hm2) |
| September 2004 to April 2005 |
33 |
0.2 |
| September 2014 to April 2015 |
108 |
12.22 |
| September 2016 to April 2017 |
16 |
0.01 |
| September 2020 to April 2021 |
13 |
0.05 |
|
Disclaimer/Publisher’s Note: The statements, opinions and data contained in all publications are solely those of the individual author(s) and contributor(s) and not of MDPI and/or the editor(s). MDPI and/or the editor(s) disclaim responsibility for any injury to people or property resulting from any ideas, methods, instructions or products referred to in the content. |
© 2023 by the authors. Licensee MDPI, Basel, Switzerland. This article is an open access article distributed under the terms and conditions of the Creative Commons Attribution (CC BY) license (http://creativecommons.org/licenses/by/4.0/).
