Submitted:
11 October 2023
Posted:
13 October 2023
You are already at the latest version
Abstract
Keywords:
1. Introduction
2. Materials and Methods
2.1. Experimental Design
2.2. Behavioural testing
2.3. Statistical analysis
3. Results
3.1. Dietary intake and biometry of the dams
3.2. Dietary intake and biometry of the offspring
3.3. Behaviour and cognition function of the adult offspring
4. Discussion
4.1. Dam food intake and biometry
4.2. Offspring food intake and biometry
4.3. Offspring behaviour and cognitive function
5. Conclusions
Supplementary Materials
Author Contributions
Funding
Institutional Review Board Statement
Data Availability Statement
Acknowledgments
Conflicts of Interest
References
- Barker, D.J. The developmental origins of chronic adult disease. Acta paediatrica 2004, 93, 26–33. [Google Scholar] [CrossRef]
- Gluckman, P.D.; Hanson, M.A.; Cooper, C.; Thornburg, K.L. Effect of in utero and early-life conditions on adult health and disease. N Engl J Med 2008, 359, 61–73. [Google Scholar] [CrossRef]
- Miguel, P.M.; Pereira, L.O.; Silveira, P.P.; Meaney, M.J. Early environmental influences on the development of children's brain structure and function. Dev Med Child Neurol 2019, 61, 1127–1133. [Google Scholar] [CrossRef]
- Denison, F.C.; Aedla, N.R.; Keag, O.; Hor, K.; Reynolds, R.M.; Milne, A.; Diamond, A.; Royal College of, O. Gynaecologists. Care of Women with Obesity in Pregnancy: Green-top Guideline No. 72. BJOG 2019, 126, e62–e106. [Google Scholar] [CrossRef]
- Catalano, P.M.; Shankar, K. Obesity and pregnancy: mechanisms of short term and long term adverse consequences for mother and child. BMJ 2017, 356, j1. [Google Scholar] [CrossRef]
- Fowden, A.; Camm, E.; Sferruzzi-Perri, A. Effects of Maternal Obesity On Placental Phenotype. Curr Vasc Pharmacol 2020, 10.2174/1570161118666200513115316. [CrossRef]
- Edlow, A.G. Maternal obesity and neurodevelopmental and psychiatric disorders in offspring. Prenat Diagn 2017, 37, 95–110. [Google Scholar] [CrossRef]
- Marchi, J.; Berg, M.; Dencker, A.; Olander, E.K.; Begley, C. Risks associated with obesity in pregnancy, for the mother and baby: a systematic review of reviews. Obes Rev 2015, 16, 621–638. [Google Scholar] [CrossRef]
- Lopez-Taboada, I.; Gonzalez-Pardo, H.; Conejo, N.M. Western Diet: Implications for Brain Function and Behavior. Front Psychol 2020, 11, 564413. [Google Scholar] [CrossRef]
- Menting, M.D.; van de Beek, C.; Mintjens, S.; Wever, K.E.; Korosi, A.; Ozanne, S.E.; Limpens, J.; Roseboom, T.J.; Hooijmans, C.; Painter, R.C. The link between maternal obesity and offspring neurobehavior: A systematic review of animal experiments. Neurosci Biobehav Rev 2019, 98, 107–121. [Google Scholar] [CrossRef]
- Clark, T.D.; Crean, A.J.; Senior, A.M. Obesogenic diets induce anxiety in rodents: A systematic review and meta-analysis. Obes Rev 2022, 23, e13399. [Google Scholar] [CrossRef]
- Rivera, H.M.; Christiansen, K.J.; Sullivan, E.L. The role of maternal obesity in the risk of neuropsychiatric disorders. Frontiers in neuroscience 2015, 9, 194. [Google Scholar] [CrossRef]
- Rakhra, V.; Galappaththy, S.L.; Bulchandani, S.; Cabandugama, P.K. Obesity and the Western Diet: How We Got Here. Mo Med 2020, 117, 536–538. [Google Scholar] [PubMed]
- Speakman, J.R. Use of high-fat diets to study rodent obesity as a model of human obesity. Int J Obes (Lond) 2019, 43, 1491–1492. [Google Scholar] [CrossRef] [PubMed]
- Marcondes, F.K.; Miguel, K.J.; Melo, L.L.; Spadari-Bratfisch, R.C. Estrous cycle influences the response of female rats in the elevated plus-maze test. Physiol Behav 2001, 74, 435–440. [Google Scholar] [CrossRef]
- UK Research and Innovation, https://www.ukri.org/councils/mrc/guidance-for-applicants/policies-and-guidance-for-researchers/sex-in-experimental-design/#:~:text=Use%20of%20both%20sexes%20is,use%20of%20immortalised%20cell%20lines. Accessed 10 October 2023.
- Napso, T.; Lean, S.C.; Lu, M.; Mort, E.J.; Desforges, M.; Moghimi, A.; Bartels, B.; El-Bacha, T.; Fowden, A.L.; Camm, E.J.; et al. Diet-induced maternal obesity impacts feto-placental growth and induces sex-specific alterations in placental morphology, mitochondrial bioenergetics, dynamics, lipid metabolism and oxidative stress in mice. Acta Physiol (Oxf) 2022, 234, e13795. [Google Scholar] [CrossRef]
- Ogilvie, A.; Shapses, S.; Schlussel, Y. Diet Quality in Overweight/Obese Women: Higher Protein Intake During Weight Loss (P08-014-19). Current developments in nutrition 2019, 3, nzz044.P008-014-019. [Google Scholar] [CrossRef]
- Mort, E.J.; Fordington, S.; Heritage, S.; Fowden, A.L.; Jones, S.; Camm, E.J. Age and an obesogenic diet affect mouse behaviour in a sex-dependent manner. Eur J Neurosci 2023, 58, 2451–2468. [Google Scholar] [CrossRef]
- Walf, A.A.; Frye, C.A. The use of the elevated plus maze as an assay of anxiety-related behavior in rodents. Nature Protocols 2007, 2, 322–328. [Google Scholar] [CrossRef]
- Moy, S.S.; Nadler, J.J.; Perez, A.; Barbaro, R.P.; Johns, J.M.; Magnuson, T.R.; Piven, J.; Crawley, J.N. Sociability and preference for social novelty in five inbred strains: an approach to assess autistic-like behavior in mice. Genes Brain Behav 2004, 3, 287–302. [Google Scholar] [CrossRef]
- Antunes, M.; Biala, G. The novel object recognition memory: neurobiology, test procedure, and its modifications. Cogn Process 2012, 13, 93–110. [Google Scholar] [CrossRef]
- Samuelsson, A.M.; Matthews, P.A.; Argenton, M.; Christie, M.R.; McConnell, J.M.; Jansen, E.H.; Piersma, A.H.; Ozanne, S.E.; Twinn, D.F.; Remacle, C.; et al. Diet-induced obesity in female mice leads to offspring hyperphagia, adiposity, hypertension, and insulin resistance: a novel murine model of developmental programming. Hypertension 2008, 51, 383–392. [Google Scholar] [CrossRef]
- Fernandez-Twinn, D.S.; Alfaradhi, M.Z.; Martin-Gronert, M.S.; Duque-Guimaraes, D.E.; Piekarz, A.; Ferland-McCollough, D.; Bushell, M.; Ozanne, S.E. Downregulation of IRS-1 in adipose tissue of offspring of obese mice is programmed cell-autonomously through post-transcriptional mechanisms. Mol Metab 2014, 3, 325–333. [Google Scholar] [CrossRef]
- John, L.M.; Petersen, N.; Gerstenberg, M.K.; Torz, L.; Pedersen, K.; Christoffersen, B.O.; Kuhre, R.E. Housing-temperature reveals energy intake counter-balances energy expenditure in normal-weight, but not diet-induced obese, male mice. Commun Biol 2022, 5, 946. [Google Scholar] [CrossRef] [PubMed]
- Berthoud, H.R. Homeostatic and non-homeostatic pathways involved in the control of food intake and energy balance. Obesity (Silver Spring) 2006, 14 Suppl 5, 197S–200S. [Google Scholar] [CrossRef] [PubMed]
- Musial, B.; Vaughan, O.R.; Fernandez-Twinn, D.S.; Voshol, P.; Ozanne, S.E.; Fowden, A.L.; Sferruzzi-Perri, A.N. A Western-style obesogenic diet alters maternal metabolic physiology with consequences for fetal nutrient acquisition in mice. J Physiol 2017, 595, 4875–4892. [Google Scholar] [CrossRef]
- Lewandowska, M. Maternal Obesity and Risk of Low Birth Weight, Fetal Growth Restriction, and Macrosomia: Multiple Analyses. Nutrients 2021, 13. [Google Scholar] [CrossRef] [PubMed]
- Coan, P.M.; Vaughan, O.R.; McCarthy, J.; Mactier, C.; Burton, G.J.; Constancia, M.; Fowden, A.L. Dietary composition programmes placental phenotype in mice. J Physiol 2011, 589, 3659–3670. [Google Scholar] [CrossRef] [PubMed]
- Drake, A.J.; Reynolds, R.M. Impact of maternal obesity on offspring obesity and cardiometabolic disease risk. Reproduction 2010, 140, 387–398. [Google Scholar] [CrossRef] [PubMed]
- Kirk, S.L.; Samuelsson, A.M.; Argenton, M.; Dhonye, H.; Kalamatianos, T.; Poston, L.; Taylor, P.D.; Coen, C.W. Maternal obesity induced by diet in rats permanently influences central processes regulating food intake in offspring. PLoS One 2009, 4, e5870. [Google Scholar] [CrossRef]
- Buckley, A.J.; Keseru, B.; Briody, J.; Thompson, M.; Ozanne, S.E.; Thompson, C.H. Altered body composition and metabolism in the male offspring of high fat-fed rats. Metabolism 2005, 54, 500–507. [Google Scholar] [CrossRef]
- Long, N.M.; George, L.A.; Uthlaut, A.B.; Smith, D.T.; Nijland, M.J.; Nathanielsz, P.W.; Ford, S.P. Maternal obesity and increased nutrient intake before and during gestation in the ewe results in altered growth, adiposity, and glucose tolerance in adult offspring. J Anim Sci 2010, 88, 3546–3553. [Google Scholar] [CrossRef]
- Sasaki, A.; de Vega, W.C.; St-Cyr, S.; Pan, P.; McGowan, P.O. Perinatal high fat diet alters glucocorticoid signaling and anxiety behavior in adulthood. Neuroscience 2013, 240, 1–12. [Google Scholar] [CrossRef]
- Abuaish, S.; Spinieli, R.L.; McGowan, P.O. Perinatal high fat diet induces early activation of endocrine stress responsivity and anxiety-like behavior in neonates. Psychoneuroendocrinology 2018, 98, 11–21. [Google Scholar] [CrossRef]
- Balsevich, G.; Baumann, V.; Uribe, A.; Chen, A.; Schmidt, M.V. Prenatal Exposure to Maternal Obesity Alters Anxiety and Stress Coping Behaviors in Aged Mice. Neuroendocrinology 2016, 103, 354–368. [Google Scholar] [CrossRef]
- Sasaki, A.; de Vega, W.; Sivanathan, S.; St-Cyr, S.; McGowan, P.O. Maternal high-fat diet alters anxiety behavior and glucocorticoid signaling in adolescent offspring. Neuroscience 2014, 272, 92–101. [Google Scholar] [CrossRef]
- Janthakhin, Y.; Rincel, M.; Costa, A.M.; Darnaudery, M.; Ferreira, G. Maternal high-fat diet leads to hippocampal and amygdala dendritic remodeling in adult male offspring. Psychoneuroendocrinology 2017, 83, 49–57. [Google Scholar] [CrossRef]
- Farhat, T.; Iannotti, R.J.; Simons-Morton, B.G. Overweight, obesity, youth, and health-risk behaviors. Am J Prev Med 2010, 38, 258–267. [Google Scholar] [CrossRef]
- Zanini, P.; Arbo, B.D.; Niches, G.; Czarnabay, D.; Benetti, F.; Ribeiro, M.F.; Cecconello, A.L. Diet-induced obesity alters memory consolidation in female rats. Physiol Behav 2017, 180, 91–97. [Google Scholar] [CrossRef]
- Page, K.C.; Jones, E.K.; Anday, E.K. Maternal and postweaning high-fat diets disturb hippocampal gene expression, learning, and memory function. Am J Physiol Regul Integr Comp Physiol 2014, 306, R527–537. [Google Scholar] [CrossRef]
- Cordner, Z.A.; Khambadkone, S.G.; Boersma, G.J.; Song, L.; Summers, T.N.; Moran, T.H.; Tamashiro, K.L.K. Maternal high-fat diet results in cognitive impairment and hippocampal gene expression changes in rat offspring. Exp Neurol 2019, 318, 92–100. [Google Scholar] [CrossRef]
- Mucellini, A.B.; Laureano, D.P.; Silveira, P.P.; Sanvitto, G.L. Maternal and post-natal obesity alters long-term memory and hippocampal molecular signaling of male rat. Brain Res 2019, 1708, 138–145. [Google Scholar] [CrossRef]
- Zieba, J.; Uddin, G.M.; Youngson, N.A.; Karl, T.; Morris, M.J. Long-term behavioural effects of maternal obesity in C57BL/6J mice. Physiol Behav 2019, 199, 306–313. [Google Scholar] [CrossRef] [PubMed]
- Liu, X.; Li, X.; Xia, B.; Jin, X.; Zou, Q.; Zeng, Z.; Zhao, W.; Yan, S.; Li, L.; Yuan, S.; et al. High-fiber diet mitigates maternal obesity-induced cognitive and social dysfunction in the offspring via gut-brain axis. Cell Metab 2021, 33, 923–938.e926. [Google Scholar] [CrossRef] [PubMed]
- Raygada, M.; Cho, E.; Hilakivi-Clarke, L. High maternal intake of polyunsaturated fatty acids during pregnancy in mice alters offsprings' aggressive behavior, immobility in the swim test, locomotor activity and brain protein kinase C activity. J Nutr 1998, 128, 2505–2511. [Google Scholar] [CrossRef] [PubMed]
- Ingvorsen, C.; Lelliott, C.J.; Brix, S.; Hellgren, L.I. Effects of maternal high-fat/high sucrose diet on hepatic lipid metabolism in rat offspring. Clin Exp Pharmacol Physiol 2020, 48, 86–95. [Google Scholar] [CrossRef]
- Irving, A.; Harvey, J. Regulation of hippocampal synaptic function by the metabolic hormone leptin: Implications for health and disease. Prog Lipid Res 2021, 82, 101098. [Google Scholar] [CrossRef]
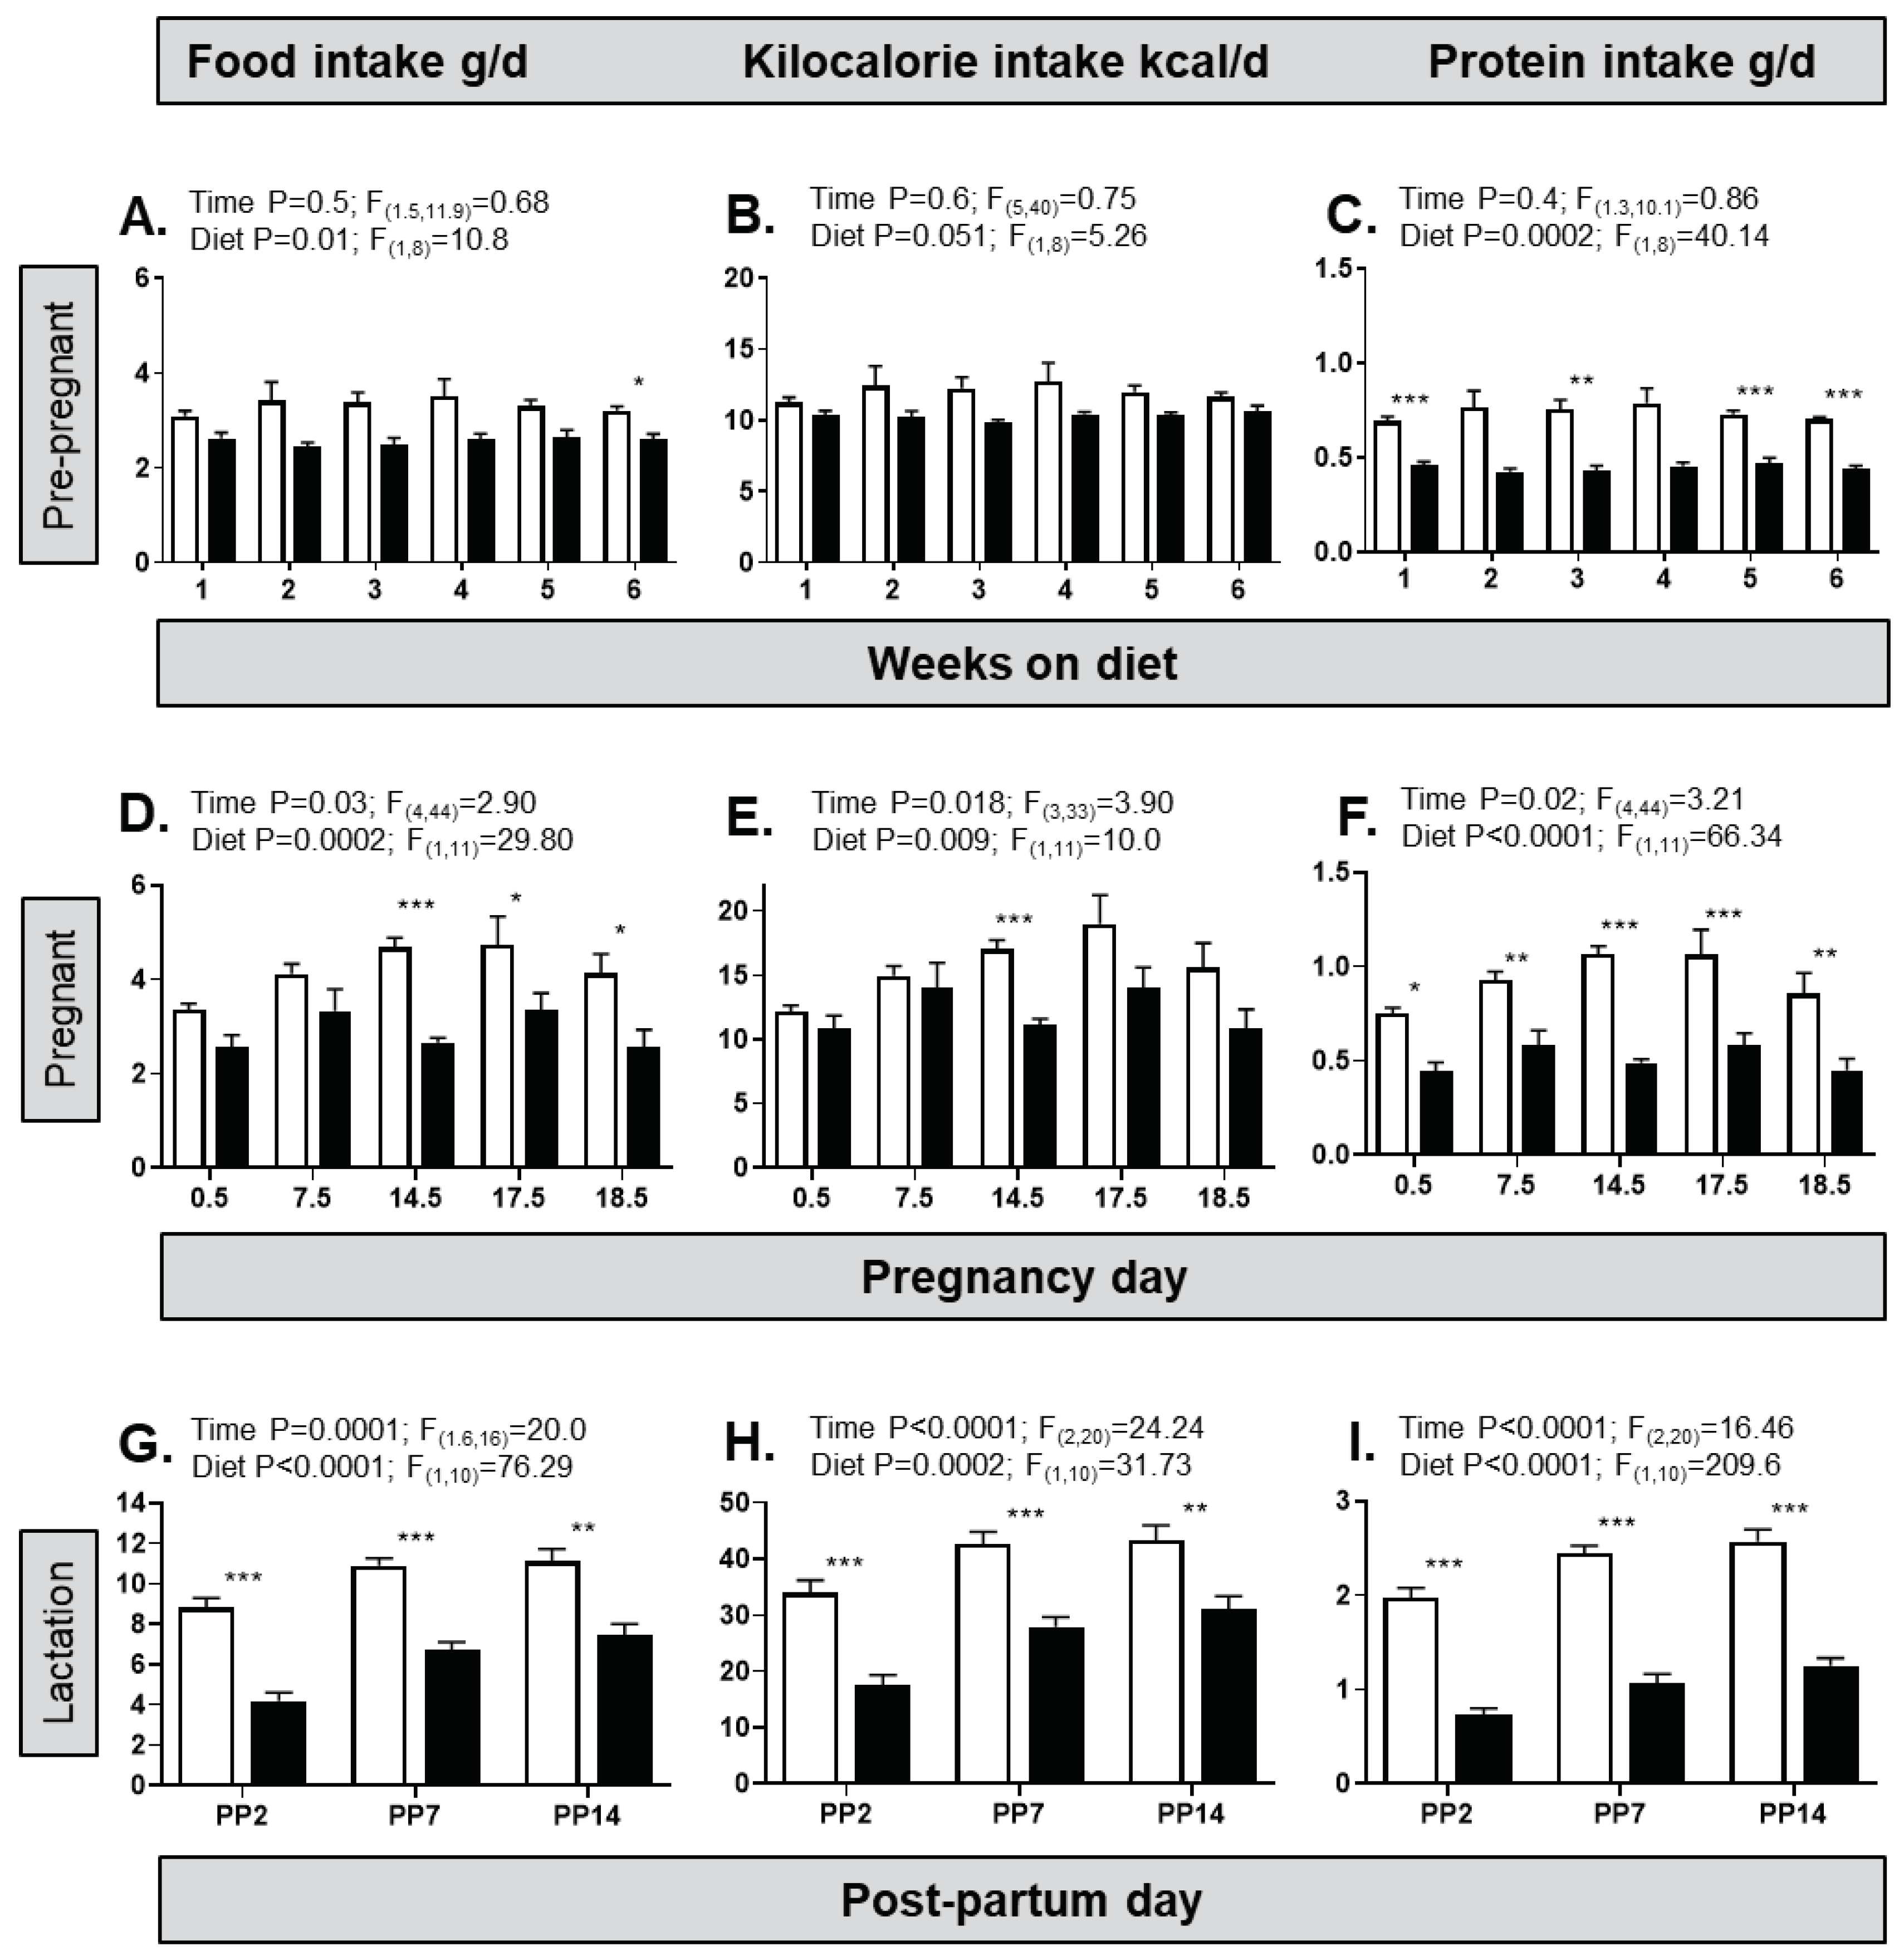
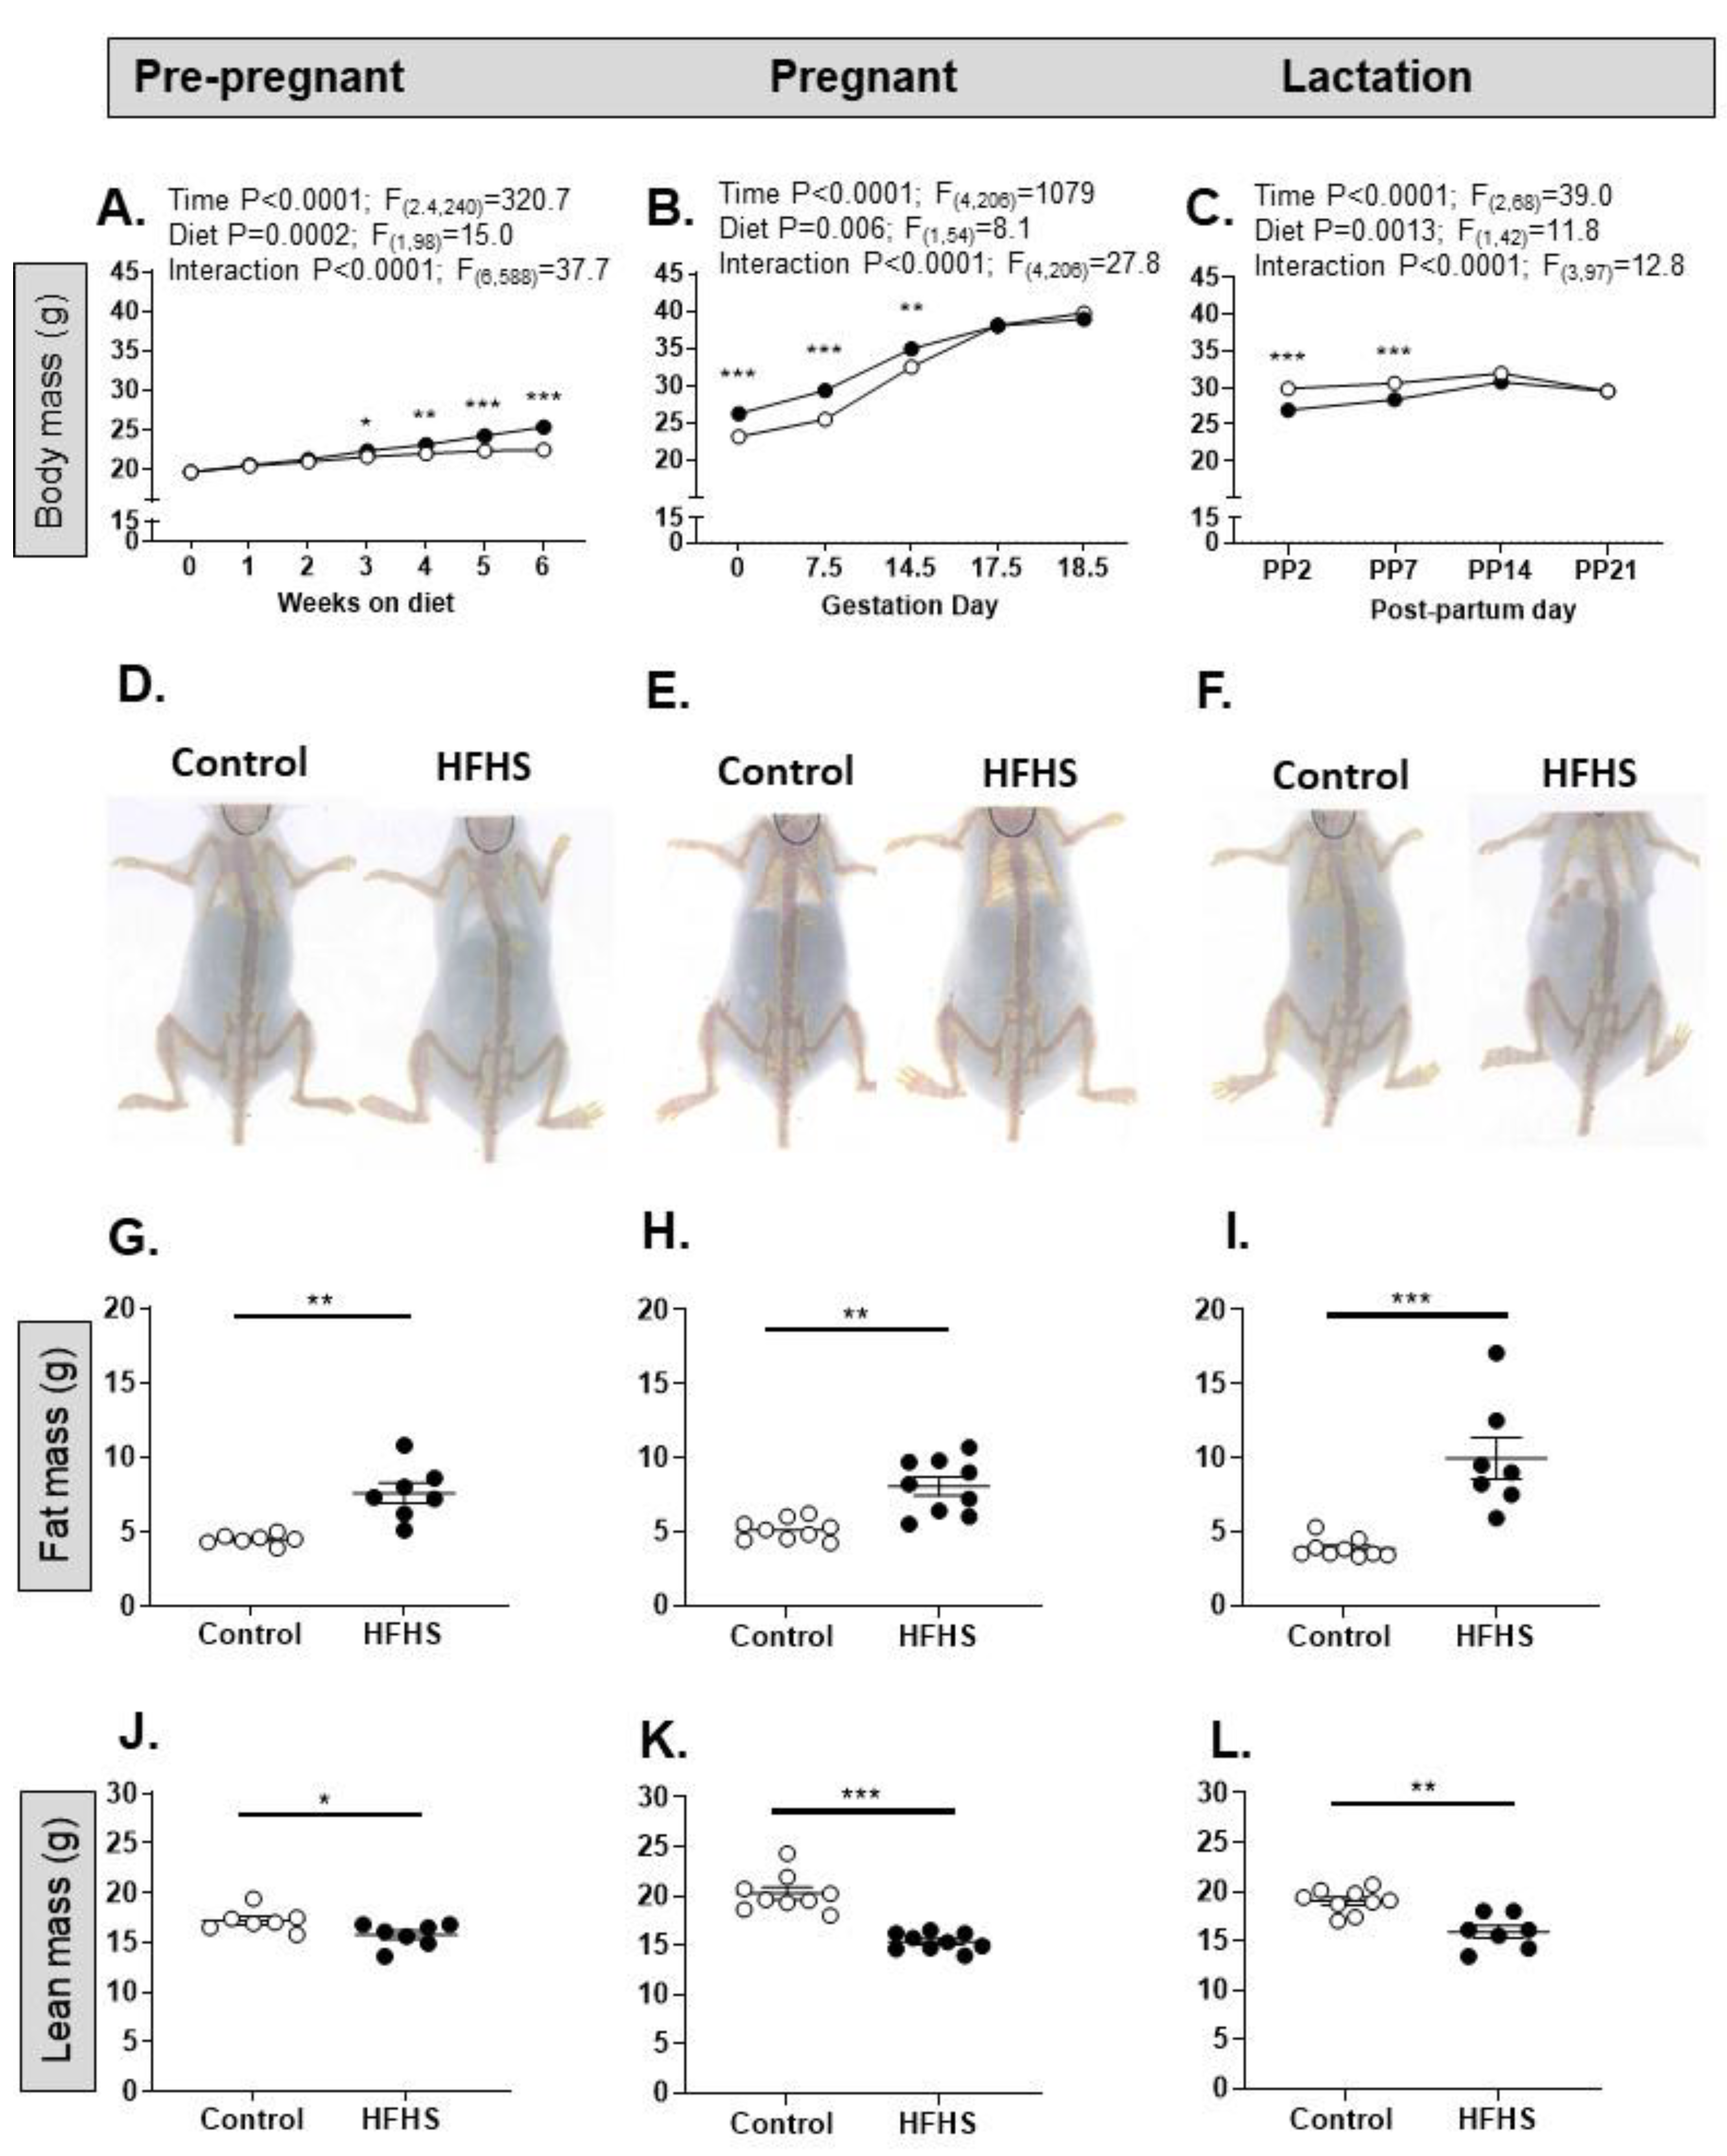
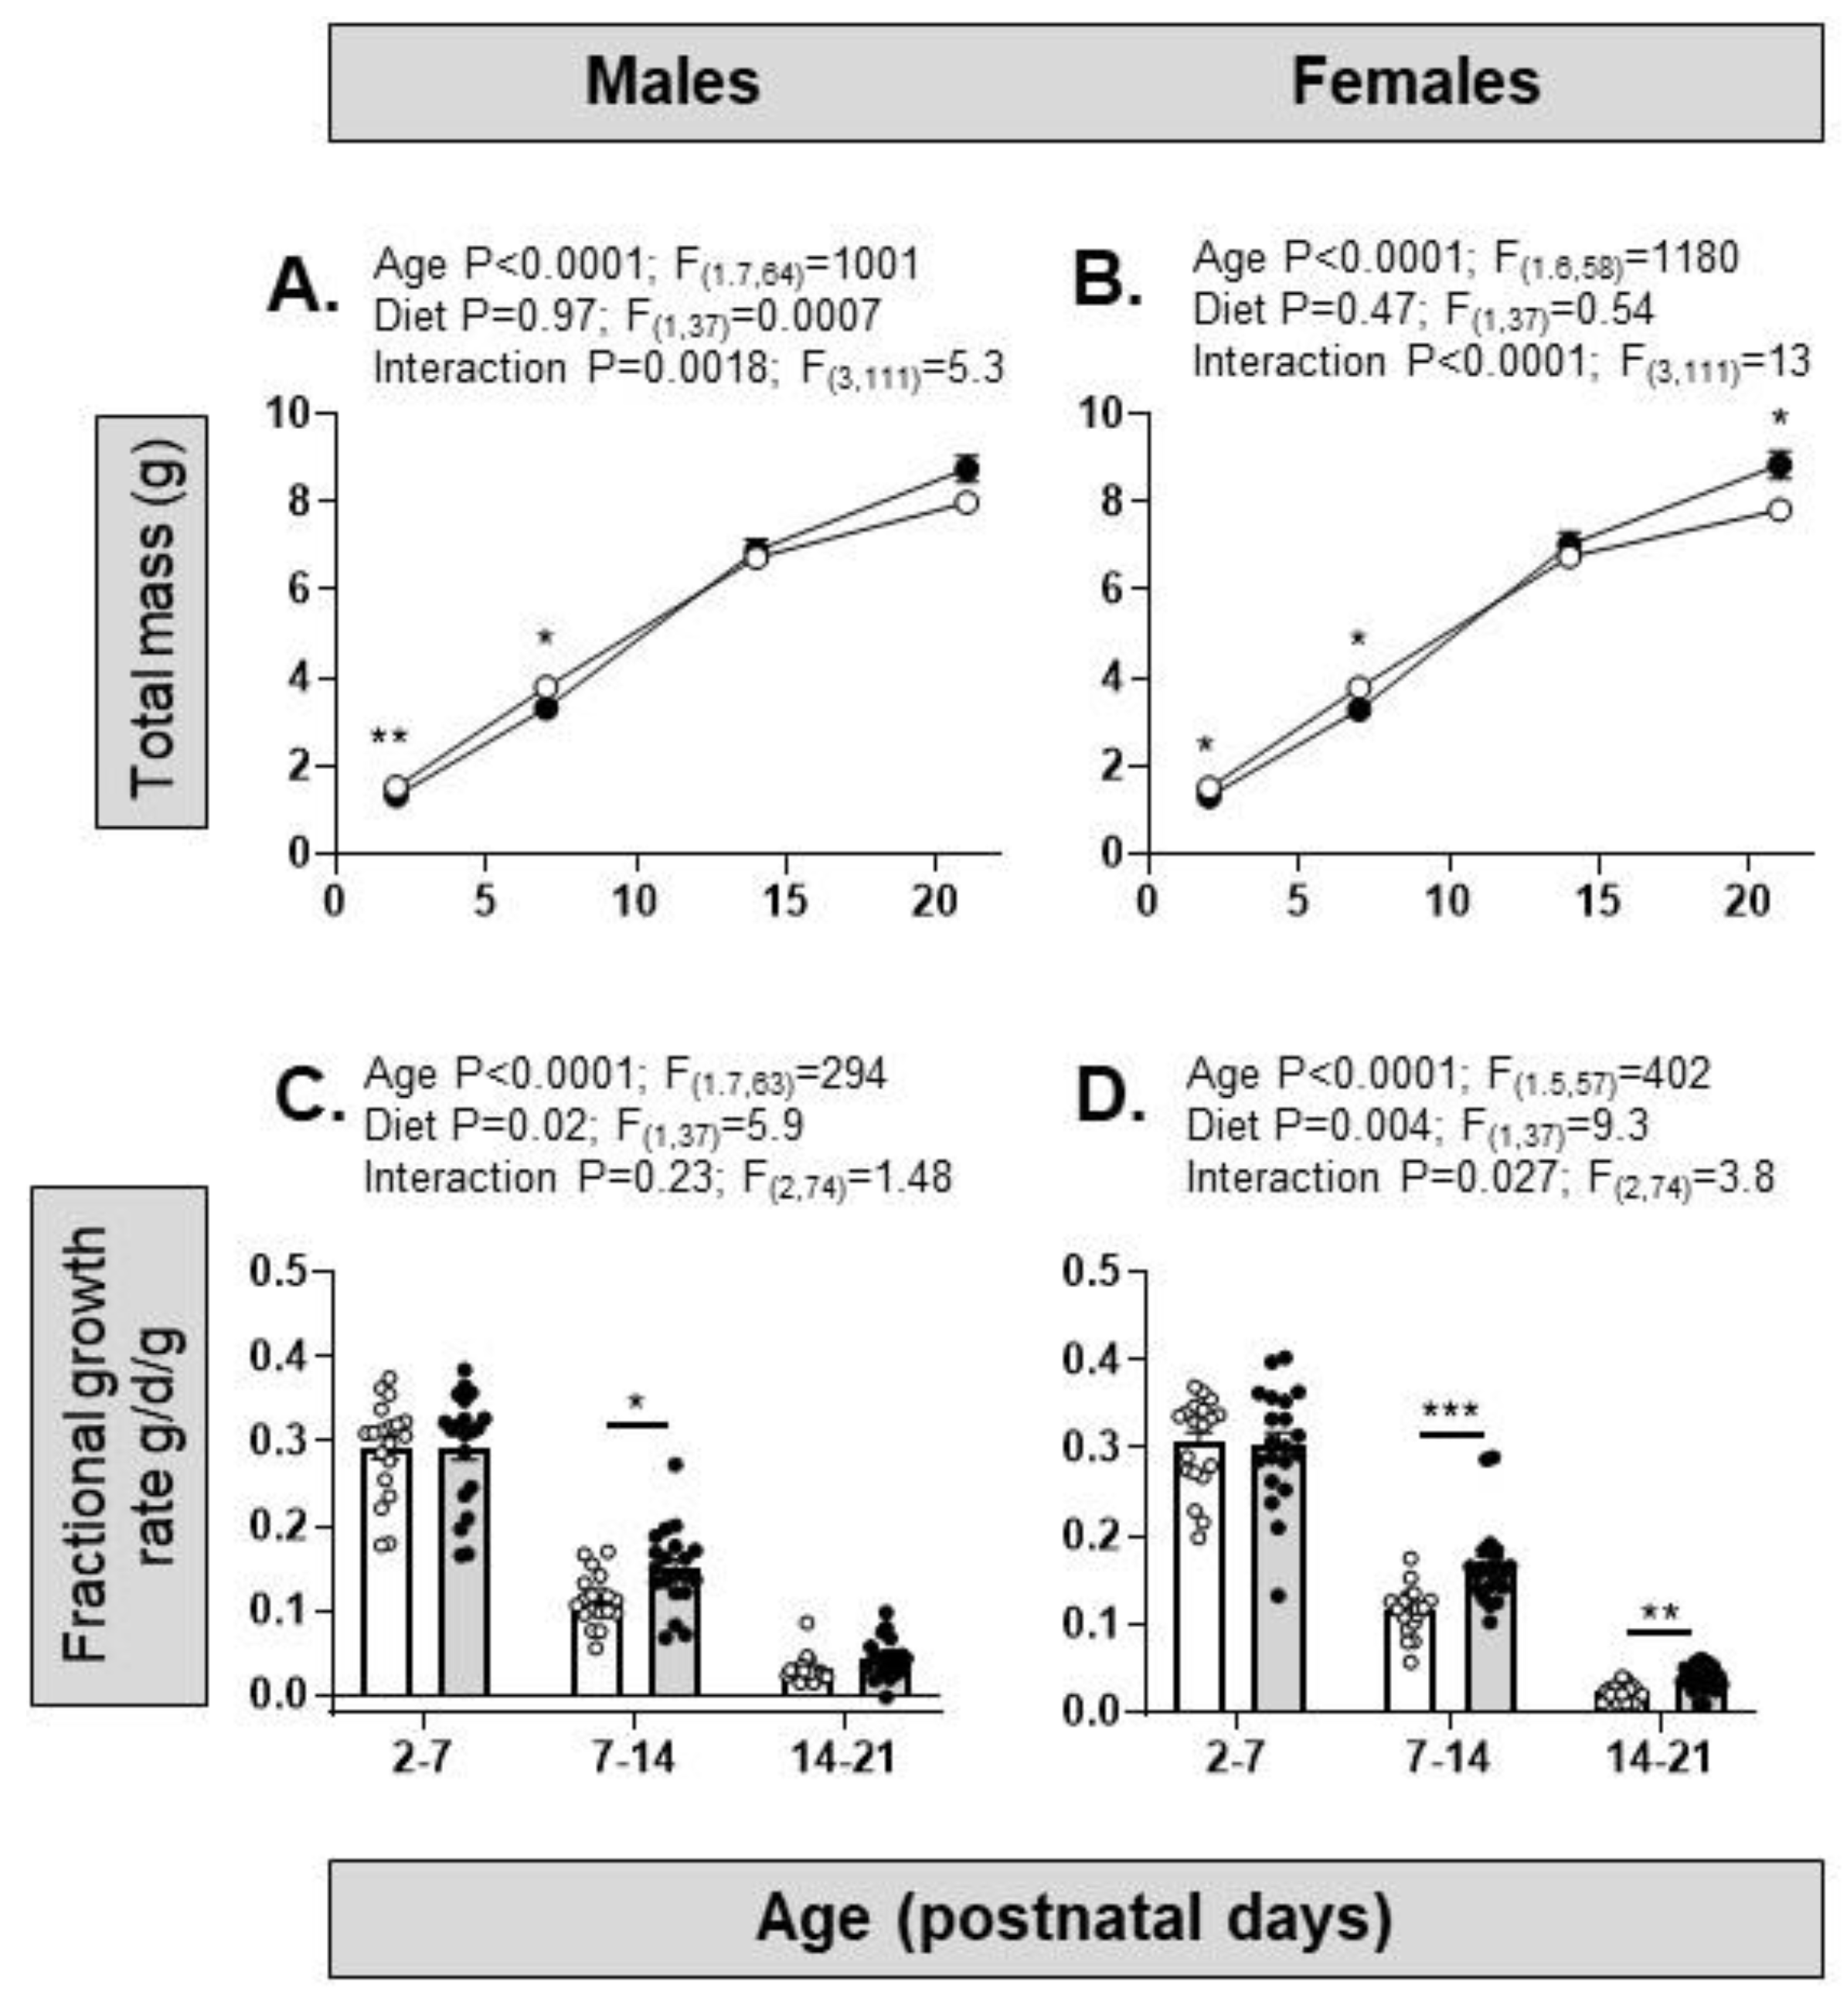
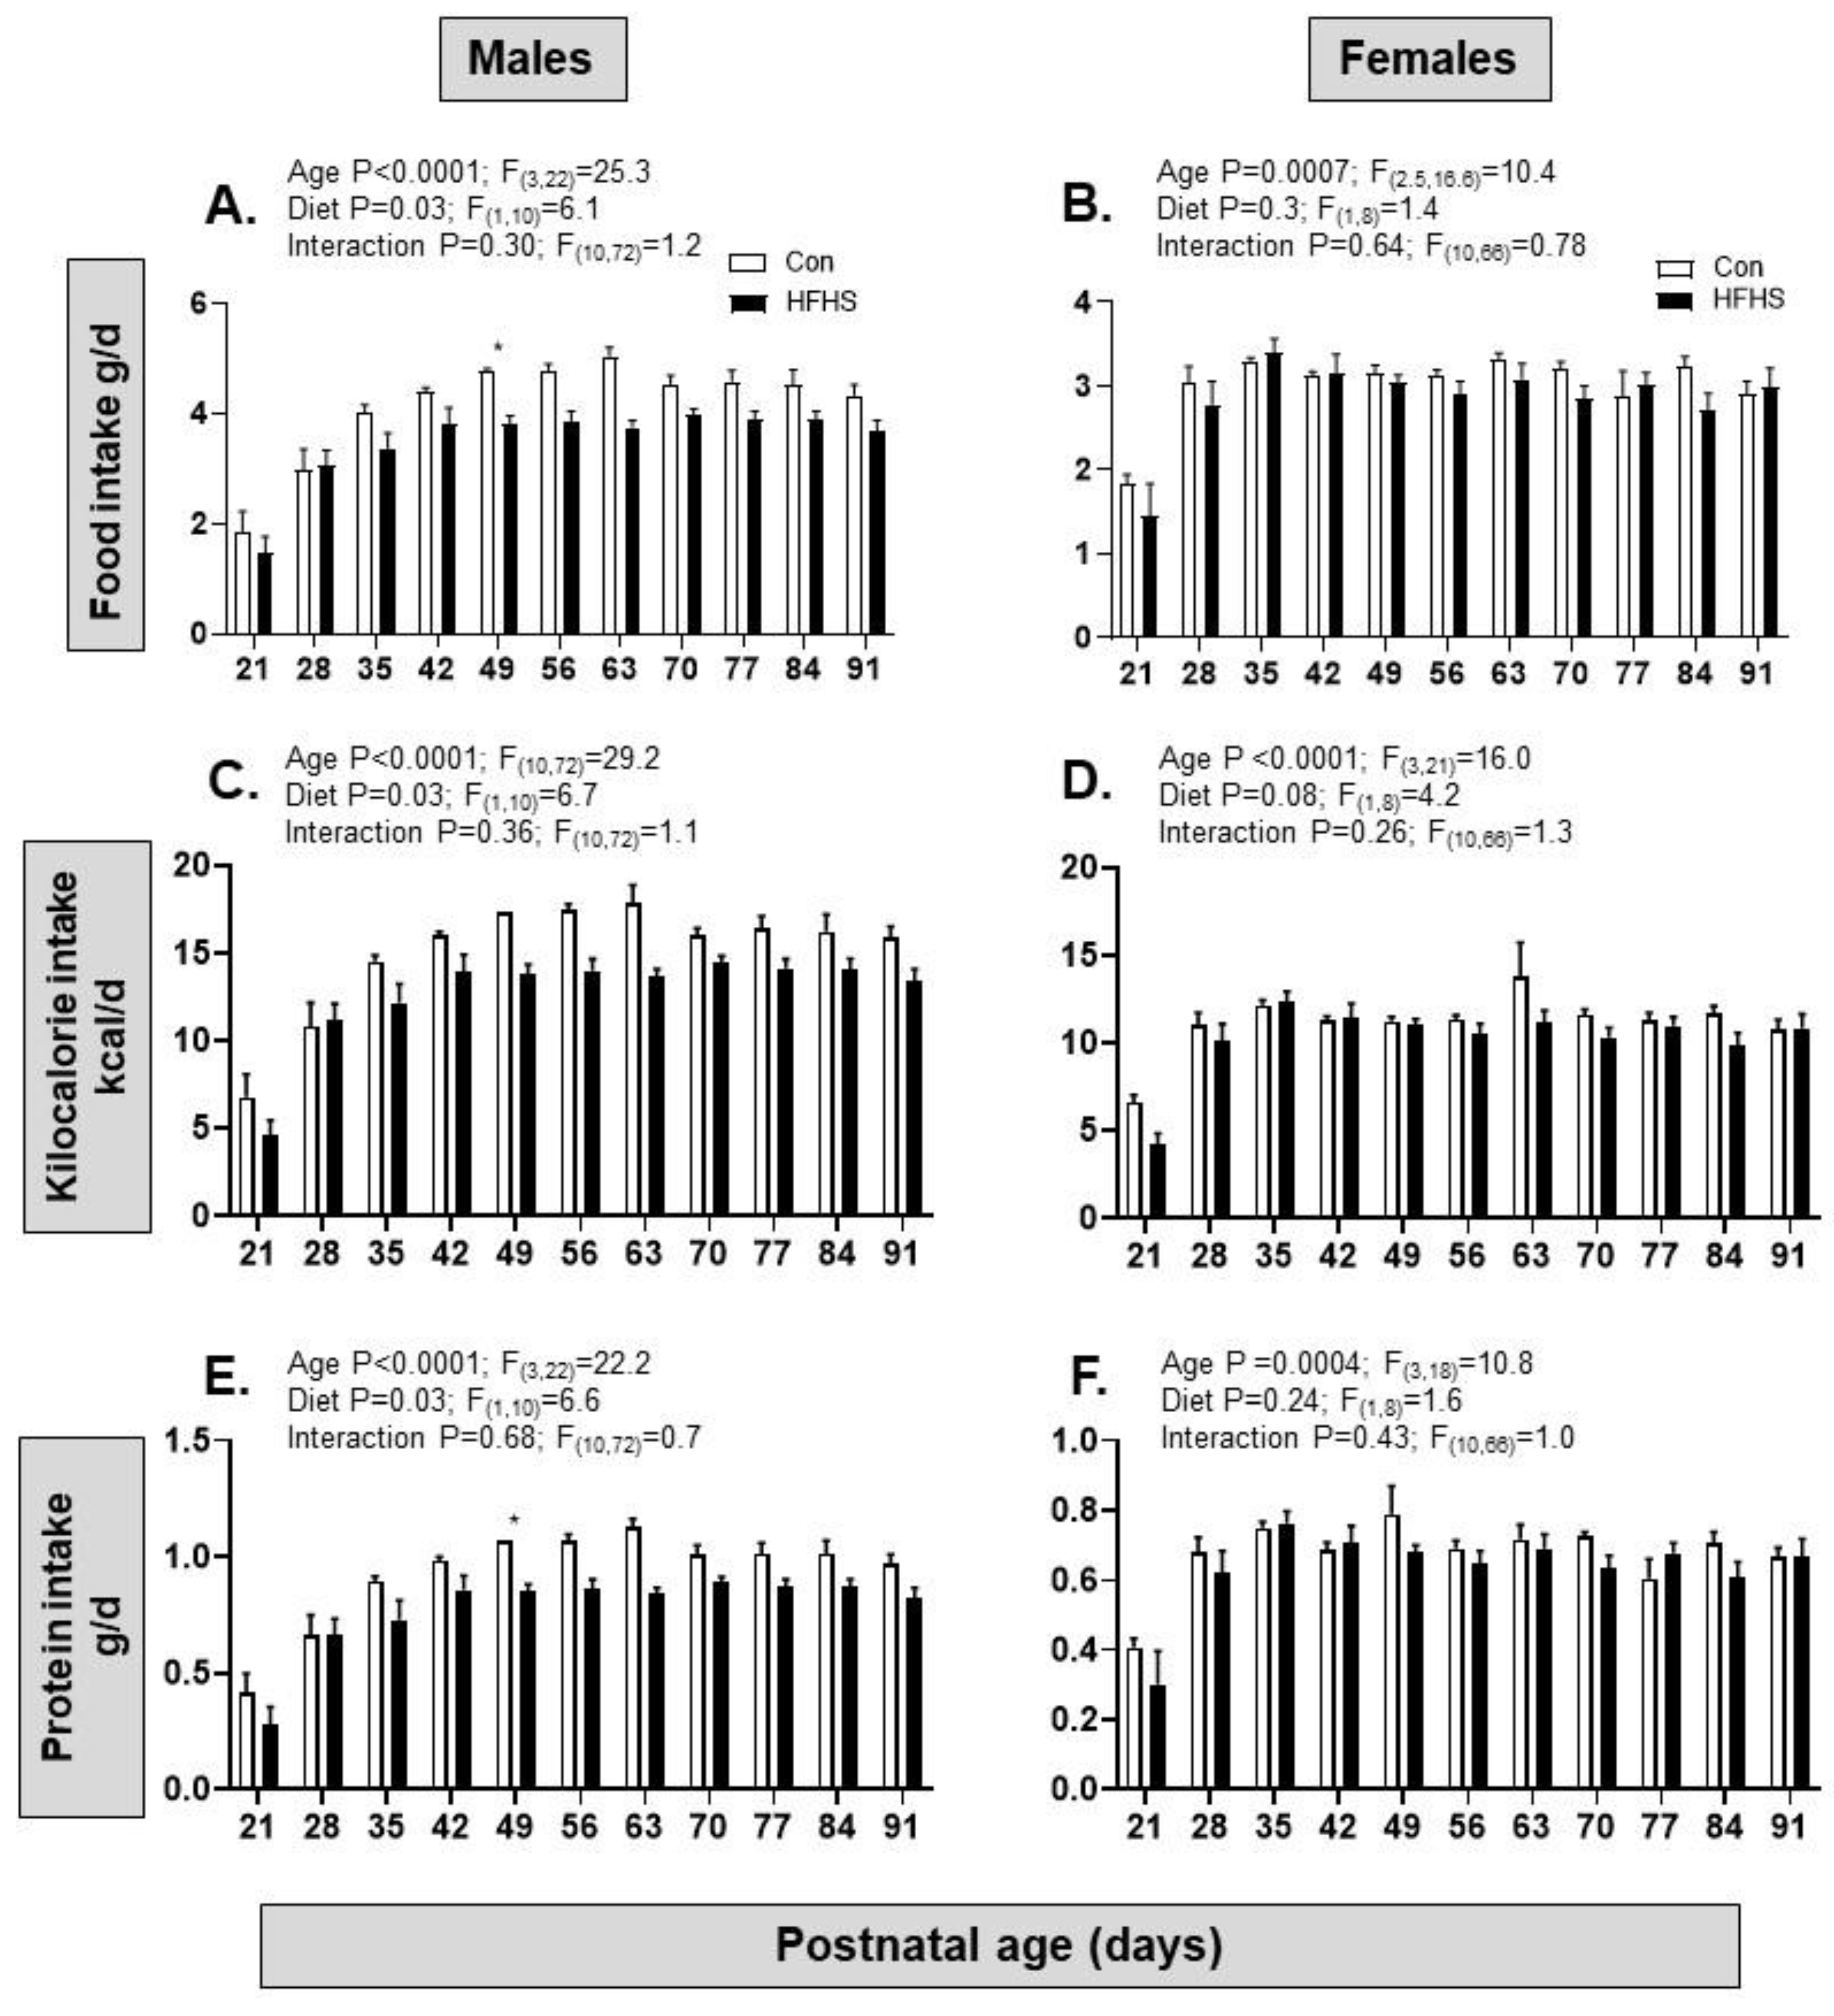
| Dams | Offspring | |||||||||
|---|---|---|---|---|---|---|---|---|---|---|
| Pre-pregnant | Pregnant | Lactating | Females | Males | ||||||
| Control(n = 7) | HFHS (n = 7) |
Control(n = 9) | HFHS (n = 9) |
Control (n = 14-26) |
HFHS (n = 10-18) |
Control(n = 9-16) | HFHS (n = 13-16) |
Control (n = 11-16) |
HFHS (n = 13) |
|
| Total body weight (g) | 22.4 ± 0.2 | 25.3 ± 0.3*** | 41.4 ± 1.2 | 39.3 ± 0.6 | 29.5 ± 0.4 | 29.5 ± 0.6 | 22.8 ± 0.2 | 22.4 ± 0.3 | 29.9 ± 0.4 | 28.8 ± 0.7 |
| Brain (mg) | 460 ± 7 | 460 ± 4 | 463 ± 8 | 442 ± 8 | 454 ± 6 | 454 ± 19 | 450 ± 2 | 450 ± 4 | 450 ± 4 | 440 ± 7 |
| Liver (g) | 1.20 ± 0.04 | 1.10 ± 0.04 | 1.9 ± 0.07 | 2.30 ± 0.10** | 2.10 ± 0.05 | 2.00 ± 0.08 | 1.11 ± 0.04 | 1.04 ± 0.03 | 1.49 ± 0.06 | 1.36 ± 0.06 |
| Heart (mg) | 120 ± 7 | 110 ± 9 | 152 ± 12 | 146 ± 4 | 0.21 ± 0.01 | 0.21 ± 0.03 | 120 ± 4 | 130 ± 3 | 170 ± 5 | 170 ± 8 |
| Adrenal (mg) | 7.8 ± 0.5 | 9.7 ± 0.5* | 6.8 ± 0.7 | 9.0 ± 1.8 | 7.7 ± 0.4 | 7.4 ± 0.6 | 6.3 ± 0.3 | 6.0 ± 0.3 | 5.0 ± 0.3 | 3.8 ± 0.2*** |
| Gonadal fat (mg) | NA | NA | 294 ± 25 | 484 ± 71** | 341 ± 25 | 1100 ± 142*** | 500 ± 34 | 514 ± 45 | 431 ± 31 | 579 ± 53* |
| Retroperitoneal fat (mg) | 37 ± 3 | 120 ± 21*** | 67 ± 5 | 156 ± 20*** | 55 ± 5 | 208 ± 29*** | 76 ± 4 | 72 ± 6 | 82 ± 8 | 150 ± 26*** |
| Perirenal fat (mg) | 46 ± 5 | 110 ± 27*** | 135 ± 18 | 216 ± 24** | 132 ± 7 | 300 ± 41*** | 109 ± 10 | 143 ± 8** | 49 ± 5 | 80 ± 6*** |
| Male offspring | Female offspring | |
|---|---|---|
| Dietary intake | ↓ food intake ↓ calorie intake ↓ protein intake |
↔ food intake ↔ calorie intake ↔ protein intake |
| Body mass and growth rate | ↓ PN2-7 ↑ FGR PN7-14 ↓ FGR PN21-28 |
↓ PN2-7 ↑ FGR PN7-21 ↔ FGR PN21-28 |
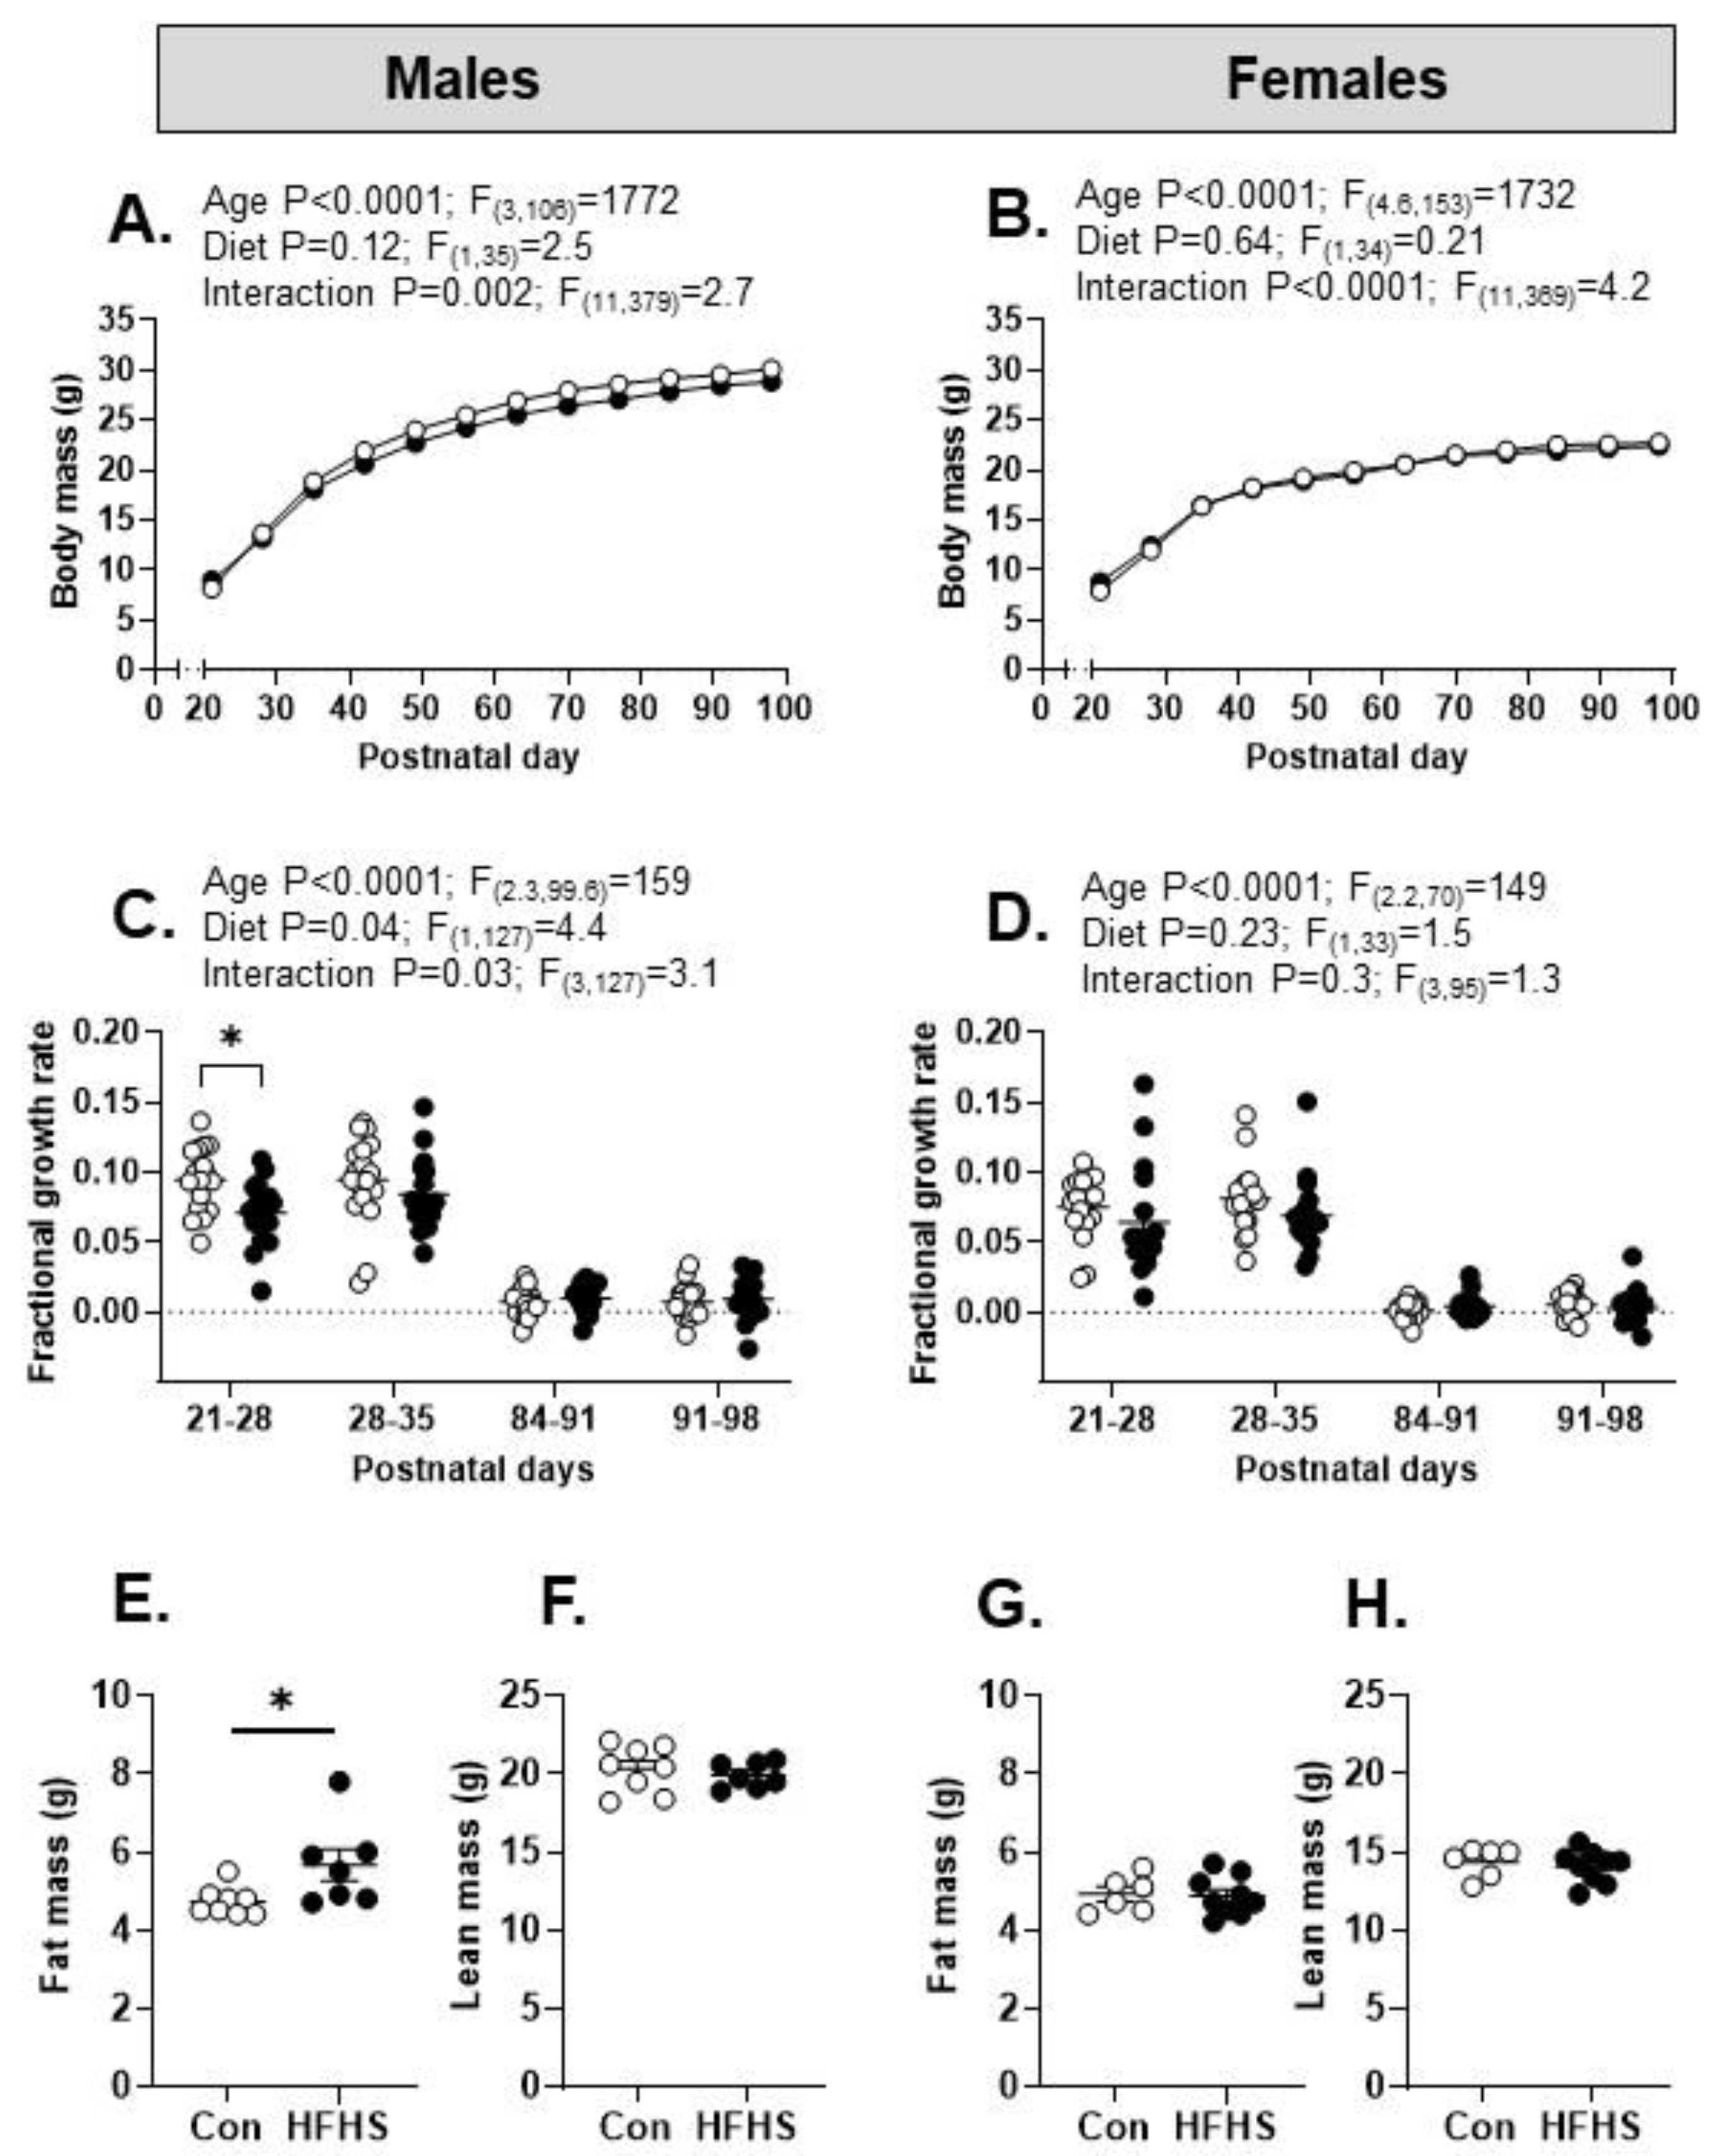
| Body composition | ↑ fat mass ↔ lean mass ↑ gonadal mass ↑ retroperitoneal mass ↑ perirenal fat mass |
↔ fat mass ↔ lean mass ↔ gonadal mass ↔ retroperitoneal mass ↑ perirenal fat mass |
| Locomotor activity | ↔ | ↔ |
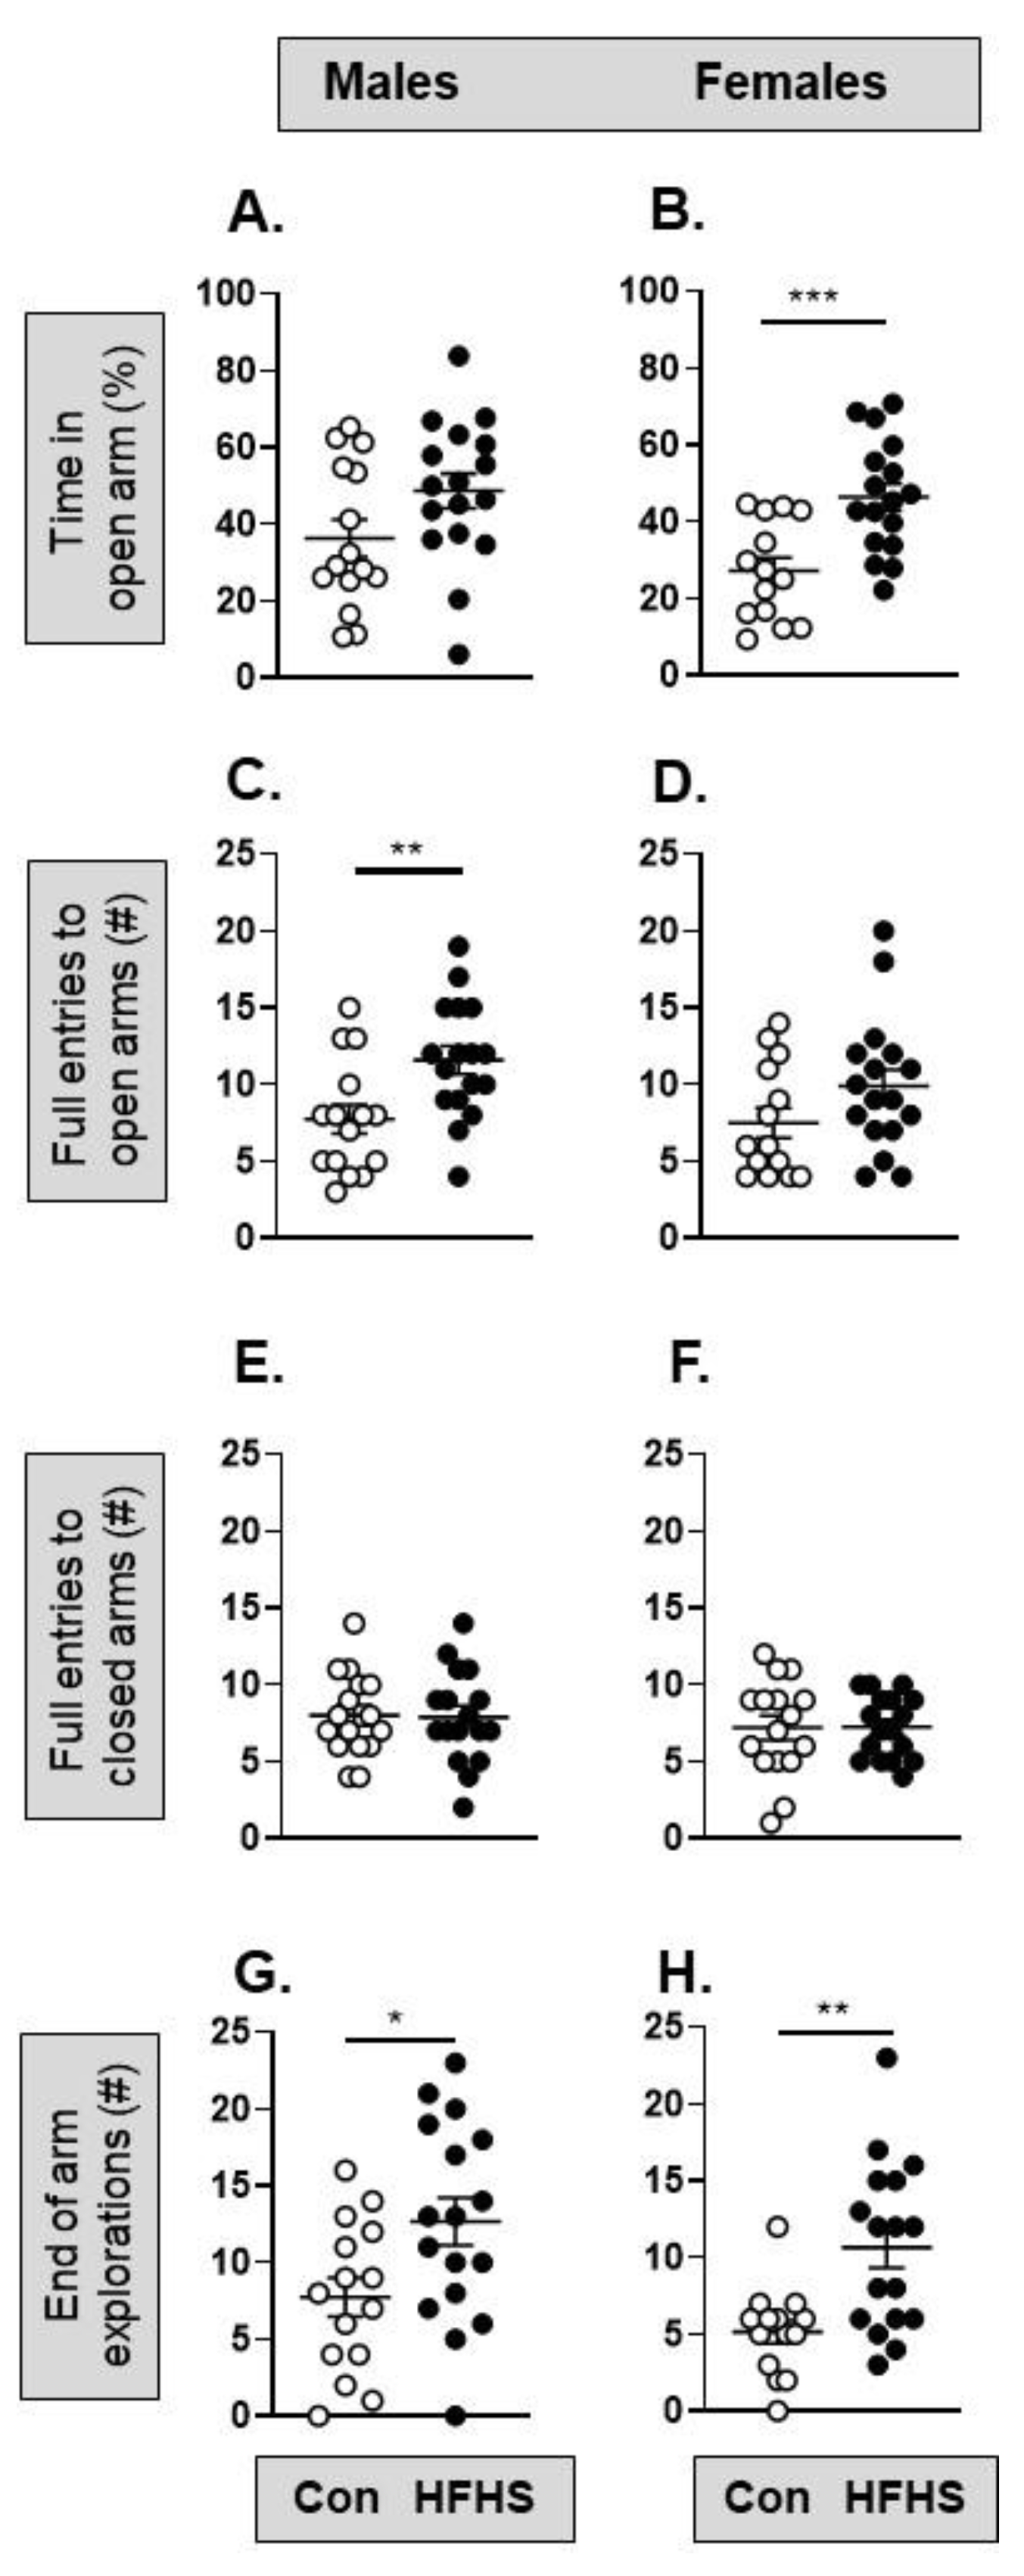
| Anxiety-related behaviours | ↑ open arm exploration ↔ % time in open arm ↑ full entries into open arm |
↑ open arm exploration ↑ % time in open arm ↔ full entries into open arm |
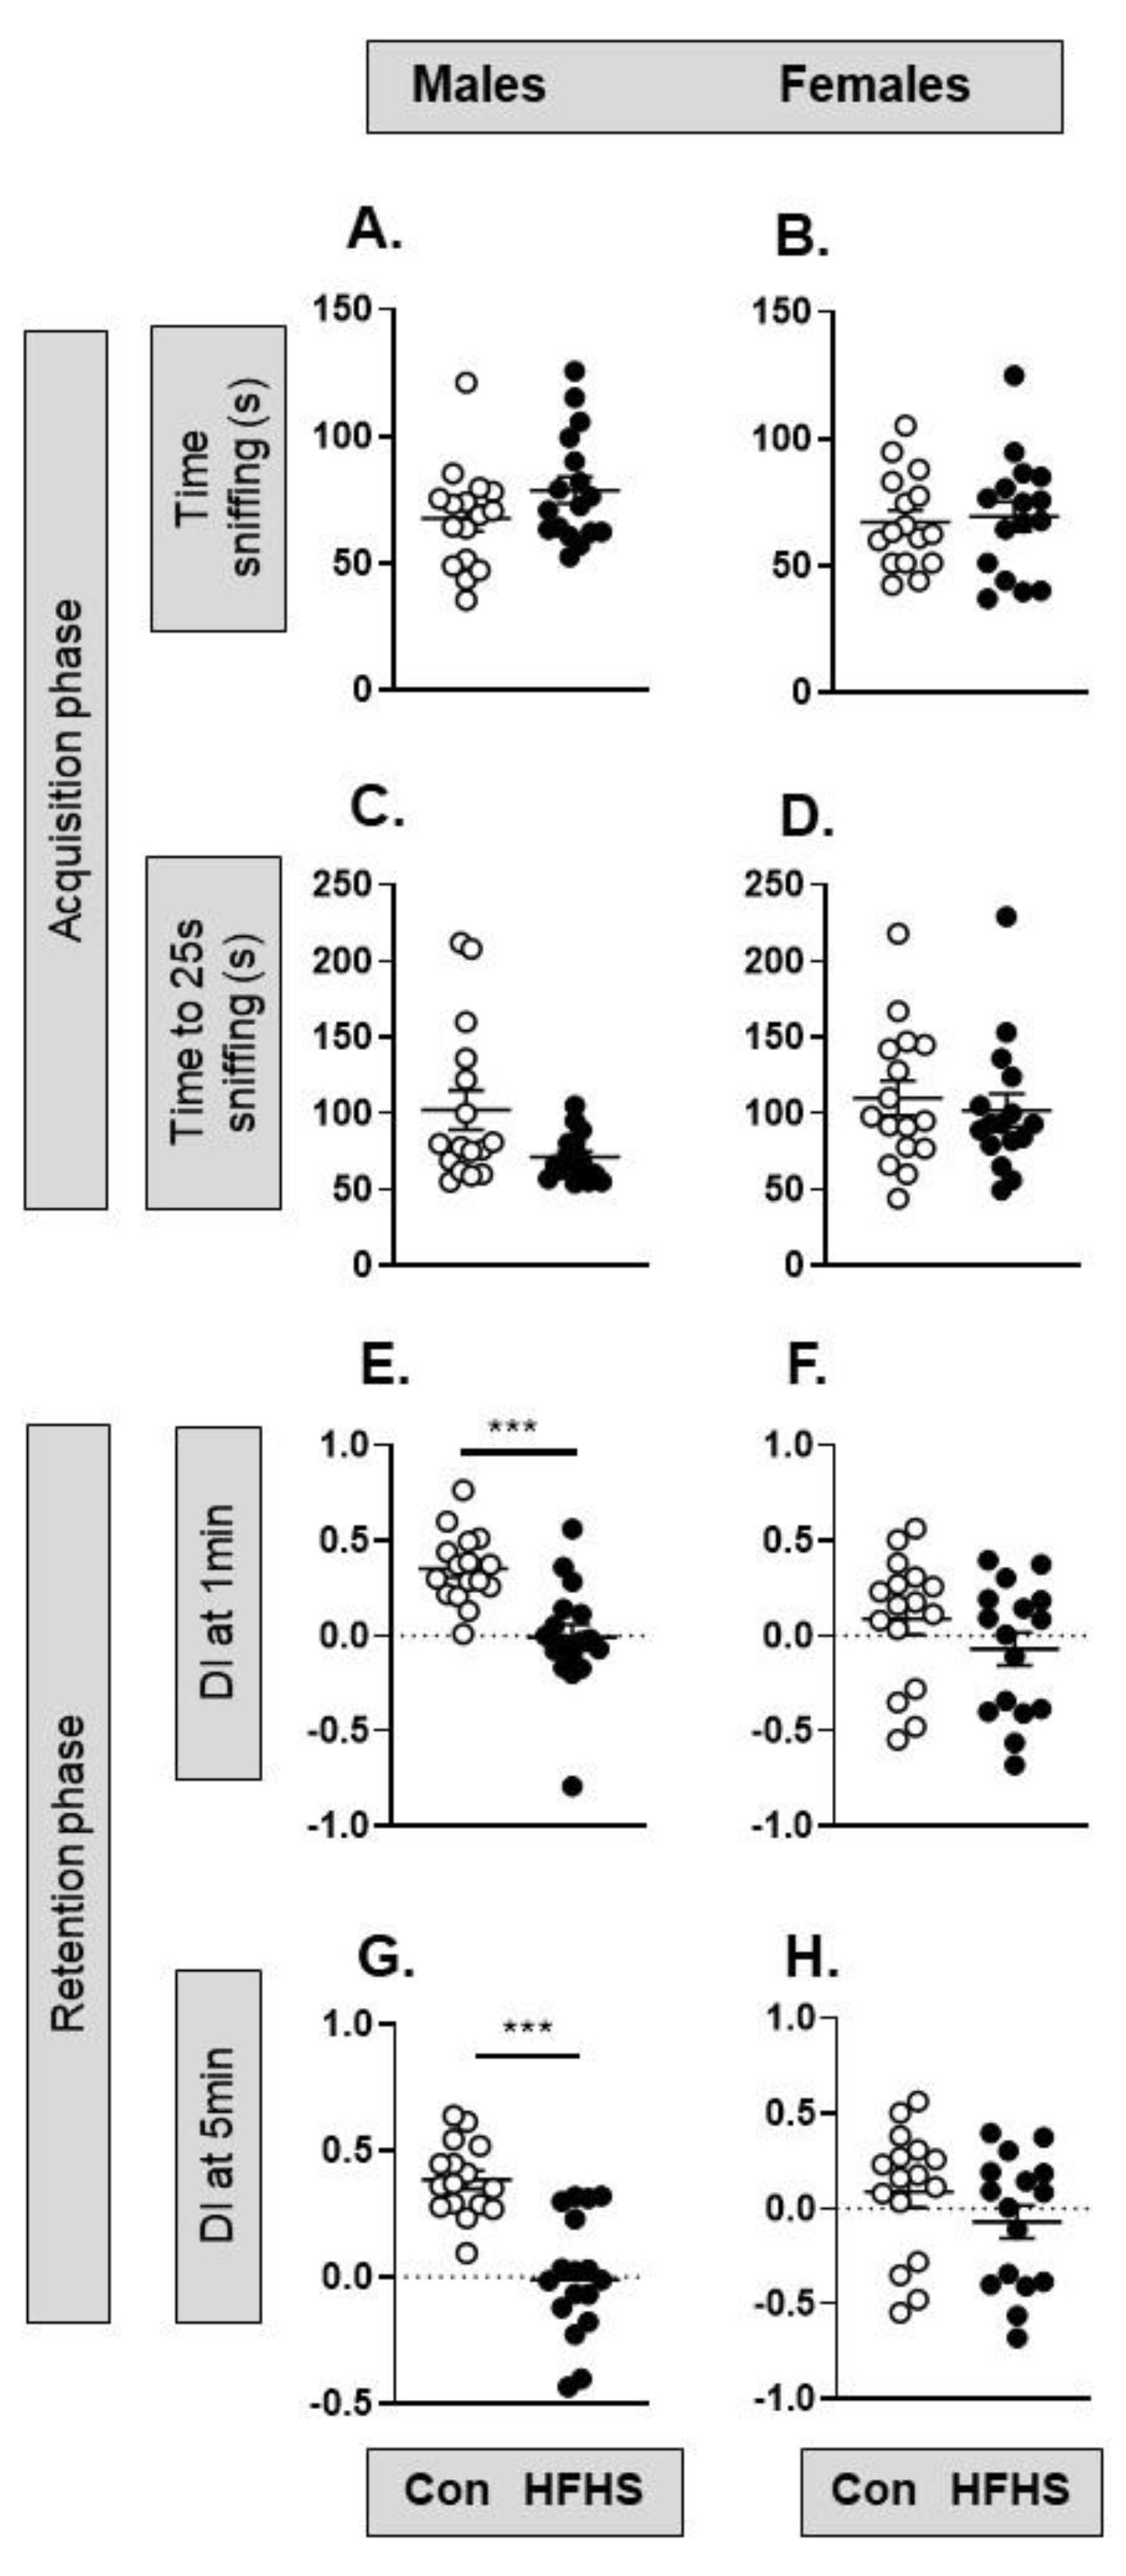
| Social behaviour | ↔ | ↔ |
| Cognition | ↓ object recognition memory | ↔ |
Disclaimer/Publisher’s Note: The statements, opinions and data contained in all publications are solely those of the individual author(s) and contributor(s) and not of MDPI and/or the editor(s). MDPI and/or the editor(s) disclaim responsibility for any injury to people or property resulting from any ideas, methods, instructions or products referred to in the content. |
© 2023 by the authors. Licensee MDPI, Basel, Switzerland. This article is an open access article distributed under the terms and conditions of the Creative Commons Attribution (CC BY) license (http://creativecommons.org/licenses/by/4.0/).


