1. Introduction
Porous metal material is a class of metal materials with obvious pore characteristics (porosity can be up to 98%). Due to the existence of pores, it presents a series of characteristics different from metal dense materials, such as low bulk density, large specific strength, high stiffness, good thermal conductivity, good energy absorption, good damping effect, etc.[
1,
2,
3,
4], so that porous metals are widely used in filtration and separation [
5], fluid penetration and distribution control [
6], efficient combustion [
7], enhanced mass and heat transfer [
8], damping adsorption[
9], acoustic adsorption[
10], flame retardant explosion-proof [
11] in industrial processes.
The pore structure characteristics of porous metals are the most important factors affecting their performance, which include pore size, porosity, pore shape, open or closed cell, and uniformity of pore distribution[
4,
12,
13,
14]. Different fields require porous metals with specific pore structure characteristics to meet the requirements of the applications. For example, porous titanium implants used in surgical hard tissue repair, in order to facilitate the growth of bone cells to form new bone tissue in the pore structure, the pore size of porous titanium is required to be in the range of 100~600 μm to provide the most suitable growth environment for bone cells [
15]. Porous metals used in heat exchangers, heaters, and heat sinks require through-hole structures to facilitate heat transfer, while porous metals used as insulation prefer more closed-cell structures [
16]. Porous metals used in efficient catalysts or catalyst supports need more microporous and mesoporous structures to provide ultra-high specific surfaces [
17].
Pore structure gives porous metals unique physical and chemical properties, but at the same time brings some adverse effects to porous metals. For example, compared with dense metal, its corresponding porous metal can withstand much lower stress levels under the same external pressure conditions, especially the uneven distribution of pore structure, which is more likely to cause stress concentration inside the material, resulting in failure of the material at a lower stress level [
18]. The presence of porous structures also affects the corrosion resistance of metals[
19,
20,
21]. Due to the high porosity of porous metal materials, their internal structure is open and discontinuous, resulting in the far different corrosion behavior between porous metal materials and their consubstantial dense materials. Wu et al. [
22] established a corrosion kinetic curve by weight loss method to study the corrosion resistance of porous titanium and aluminum metal materials, and the results showed that their corrosion resistance in hot hydrochloric acid at pH=2 and pH=3 was higher than that of stainless steel, porous nickel, porous titanium, porous titanium and porous titanium aluminum. Zhang et al.[
23] studied the effect of the pore structure of closed-cell aluminum foam on its corrosion resistance by weight loss method, and pointed out that the corrosion resistance of porous aluminum foam was much lower than that of dense aluminum material. In the case of similar pore size, with the increase of porosity, the surface area increases, and the corrosion resistance decreases. Yang et al [
24]. prepared 316L, Fe3Al, FeCrAl porous materials by powder sintering process and evaluated their corrosion resistance in SO
2/O
2/N
2 and H
2S/CO
2/N
2 atmospheres. The results show that the corrosion resistance of porous metal materials is not as good as that of dense metal materials in oxygen and sulfur atmospheres, because the large porosity of the porous materials increases the surface area of the contact reaction between the material and the corrosion interface [
25]. The corrosion behavior of plasma-sprayed porous titanium in dynamic and static electrolyte was checked, and the porous titanium showed weaker corrosion resistance compared with solid titanium material[
26]. Some 3D printed porous metals were also subjected be corrosion evaluation, and pointed out that introduction of pores leads to aggravation of corrosion. However, some research pointed out introducing of pore structures can relieve the corrosive degree of metals.
In summary, for porous metals, the influence of pore structure on metal corrosion is still controversial, and the evaluation methods for the corrosion behavior of porous metal materials mainly depend on weight loss method, electrochemical impedance. These methods are statistical averages of the corrosion behavior of the entire porous material, which cannot accurately reflect the corrosion behavior inside the pore structure and its difference from the corrosion of the porous metal surface area. Therefore, this paper proposes to use scanning kelvin probe to study the corrosion behavior of porous copper materials in NaCl solutions. The inner surface of the hole structure was scanned by the micro-Kelvin probe, and microscopic electrochemical information was collected, to which the corrosion law inside the pores is analyzed according. We believe the relevant results can provide a reference for the design of the corrosion-resistant structure of porous copper in the corrosive medium.
2. Materials and methods
2.1. Materials
The pure copper T2 sheet used in the experiment was purchased from commercial routes, and its components are shown in
Table 1. Sodium chloride (NaCl, AR), absolute ethyl alcohol were purchased f purchased from Chengdu Cologne Chemicals Co., Ltd. Laboratory-made deionized water was used throughout the experiment.
2.2. Preparation of porous pure copper electrodes
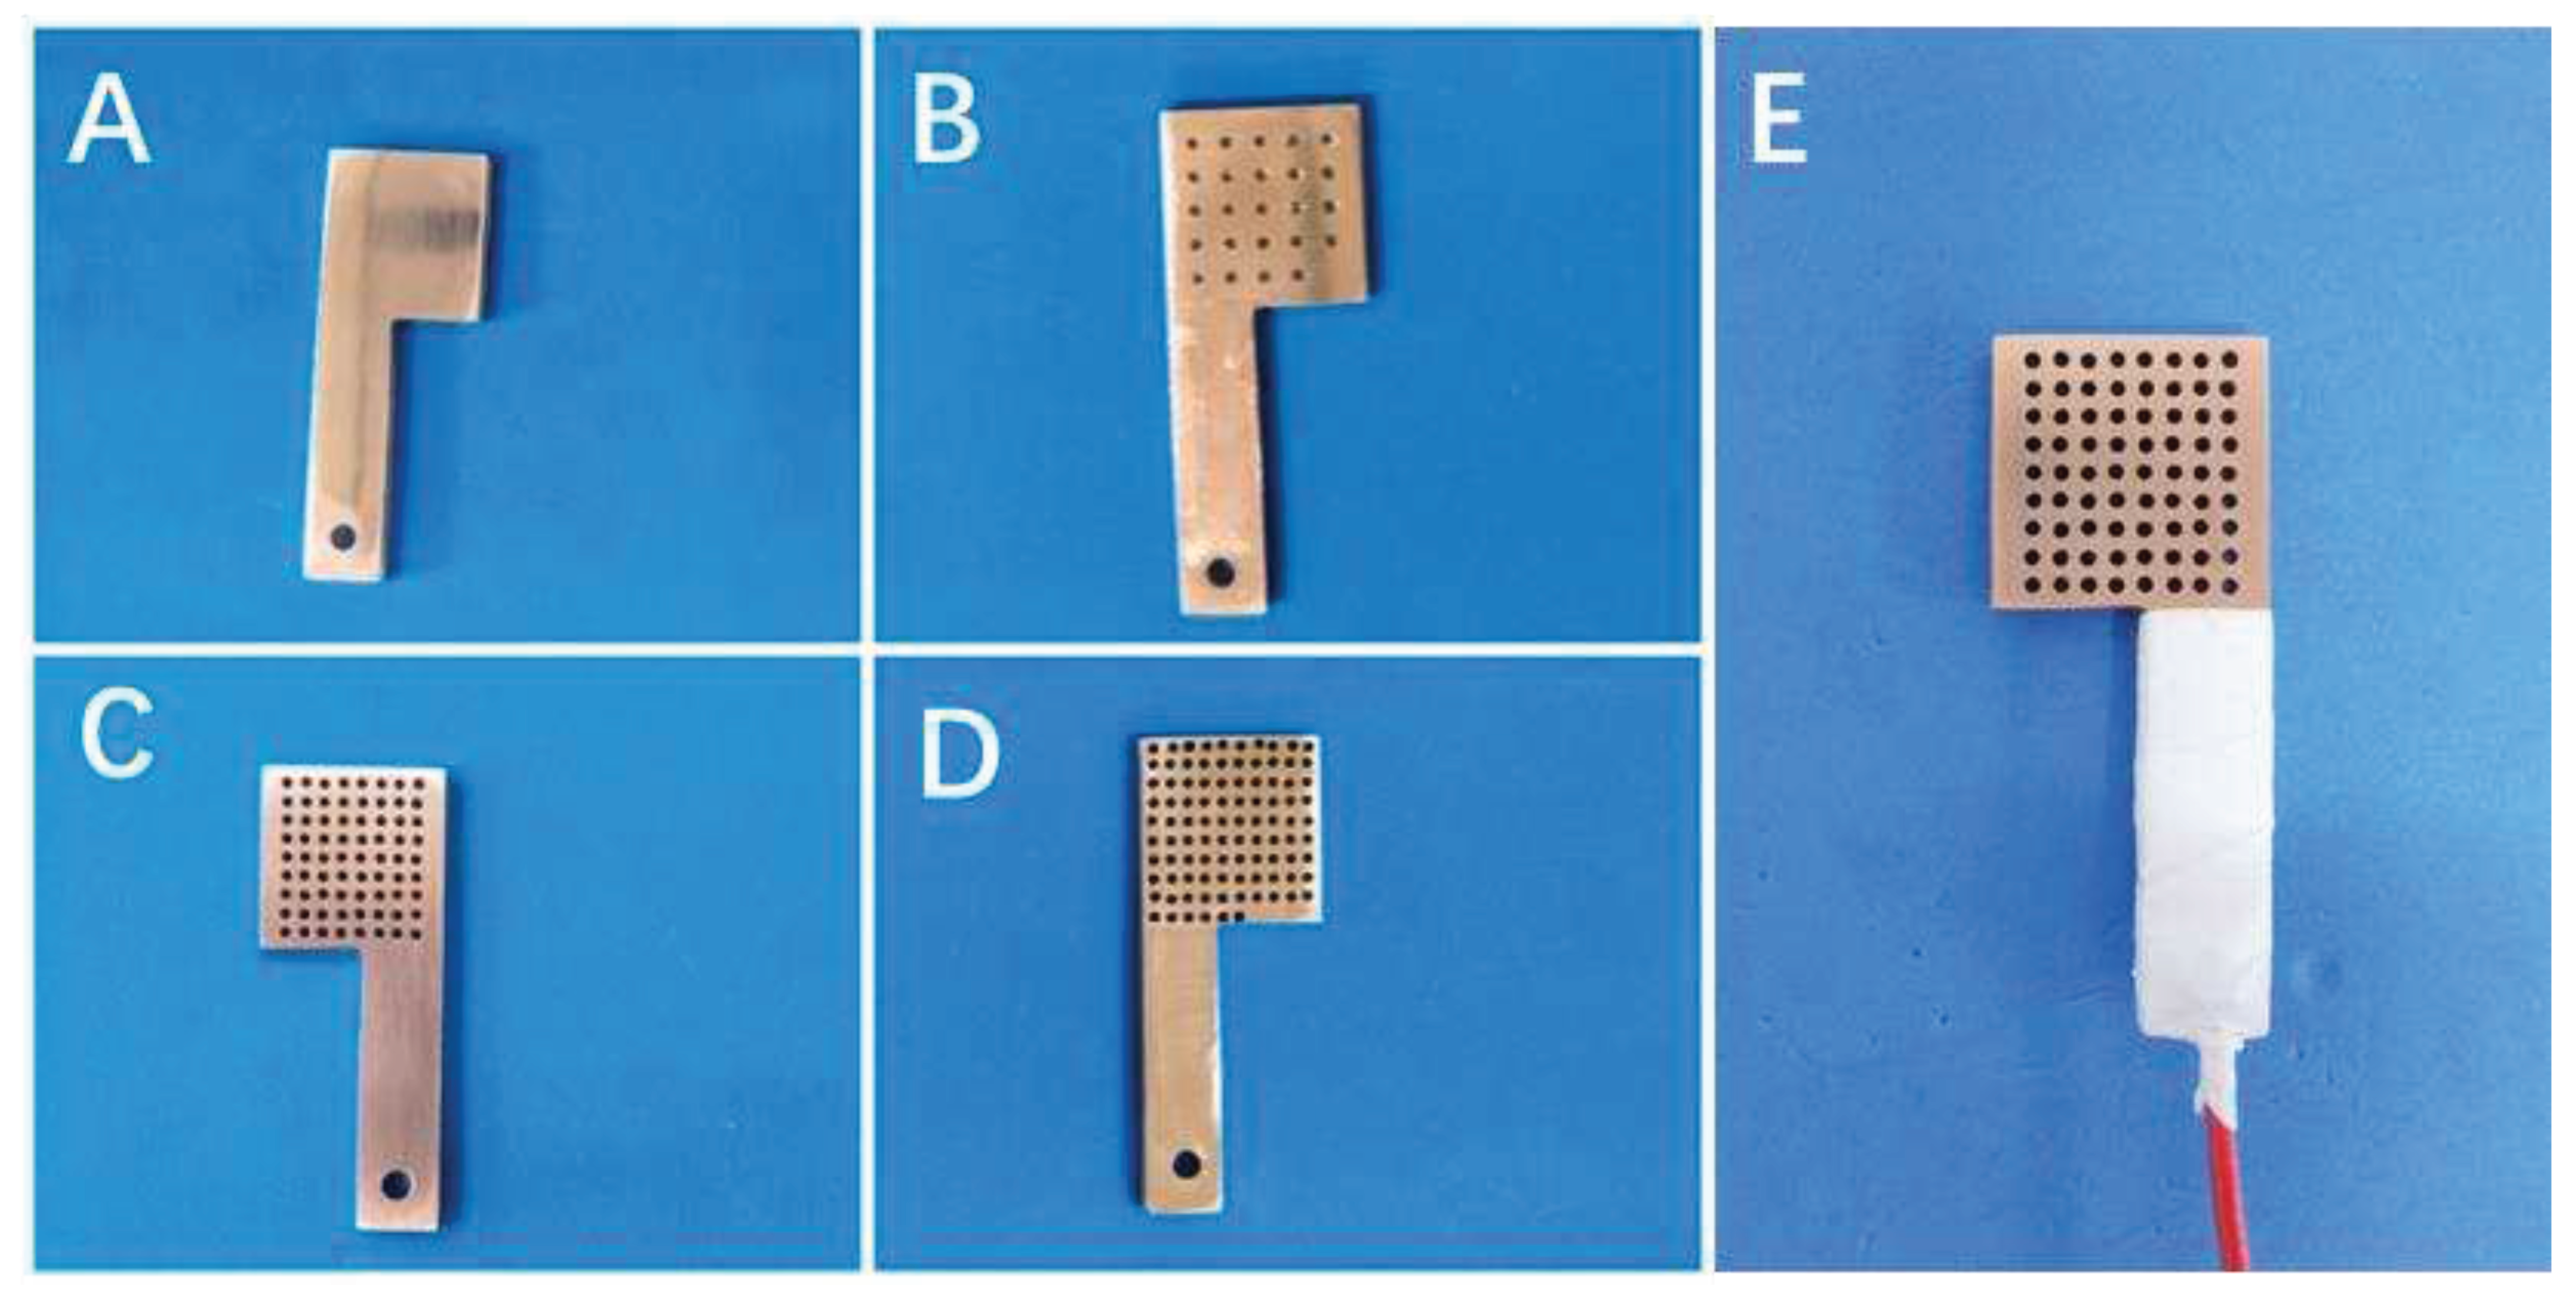
The pure copper sheet was processed into L-shaped specimens (rectangular part + square part) as shown in
Figure 1 by diamond wire cutting machine (STX-605, China), and different number (24, 72, 96) of hole structures with a diameter of 1mm were produced in their square part by mechanical working, and a hole was drilled in the rectangular part for connecting with copper wire. After drilling, the surface of the specimen and the inside of the hole were polished with 200#, 400#, 600#, 800#, 1200#, 1500#, 2000# abrasive paper and silicon-carbide-spray in turn to realize mirror surface. The polished specimens were ultrasonically cleaned in deionized water and anhydrous ethanol and dried with cold air. The blown-dried specimens were connected with the copper wire and sealed with silicone, exposing the square part as the working surface (20 mm × 20 mm × 3 mm) as shown in
Figure 1E.
2.3. Electrochemical polarization curve and impedance spectroscopy test
The three-electrode system was adopted in the electrochemical test. A porous copper sample was used as the working electrode. A saturated calomel electrode and a platinum electrode were employed as the reference electrode and the auxiliary electrode, respectively. The electrolyte solution selected for the test was 3.5 wt% of NaCl solution, and the test temperature was 25 °C. The working electrode was soaked in the solution to be measured for 30min, and after the open circuit potential was stabilized, the electrochemical test was carried out with the electrochemical workstation (Solartron1287+1260A,UK). The electrochemical polarization curve was measured in the potential scanning range of -250 mV – 650 mV at a scanning speed of 1 mV/s. The electrochemical impedance spectroscopy (EIS) was tested in the frequency range of 0.01~100 kHz with the self-corrosion potential as the starting potential. The AC excitation signal amplitude is 5 mV. The resultant impedance spectra were analyzed by ZsinpWin software. To ensure the reliability of the data obtained, at least three parallel samples were measured per set of experiments.
2.4. Scanning Kelvin probe tests
A scanning Kelvin probe assembled on the Micro-Area Scanning Electrochemical Workstation (VersaSCAN, Ametec, USA) was used to study the corrosion behavior of the specimen surface and inside of the pore structure. The Kelvin probe is a non-contact, non-destructive test method that measures the work function difference between the material and the probe [
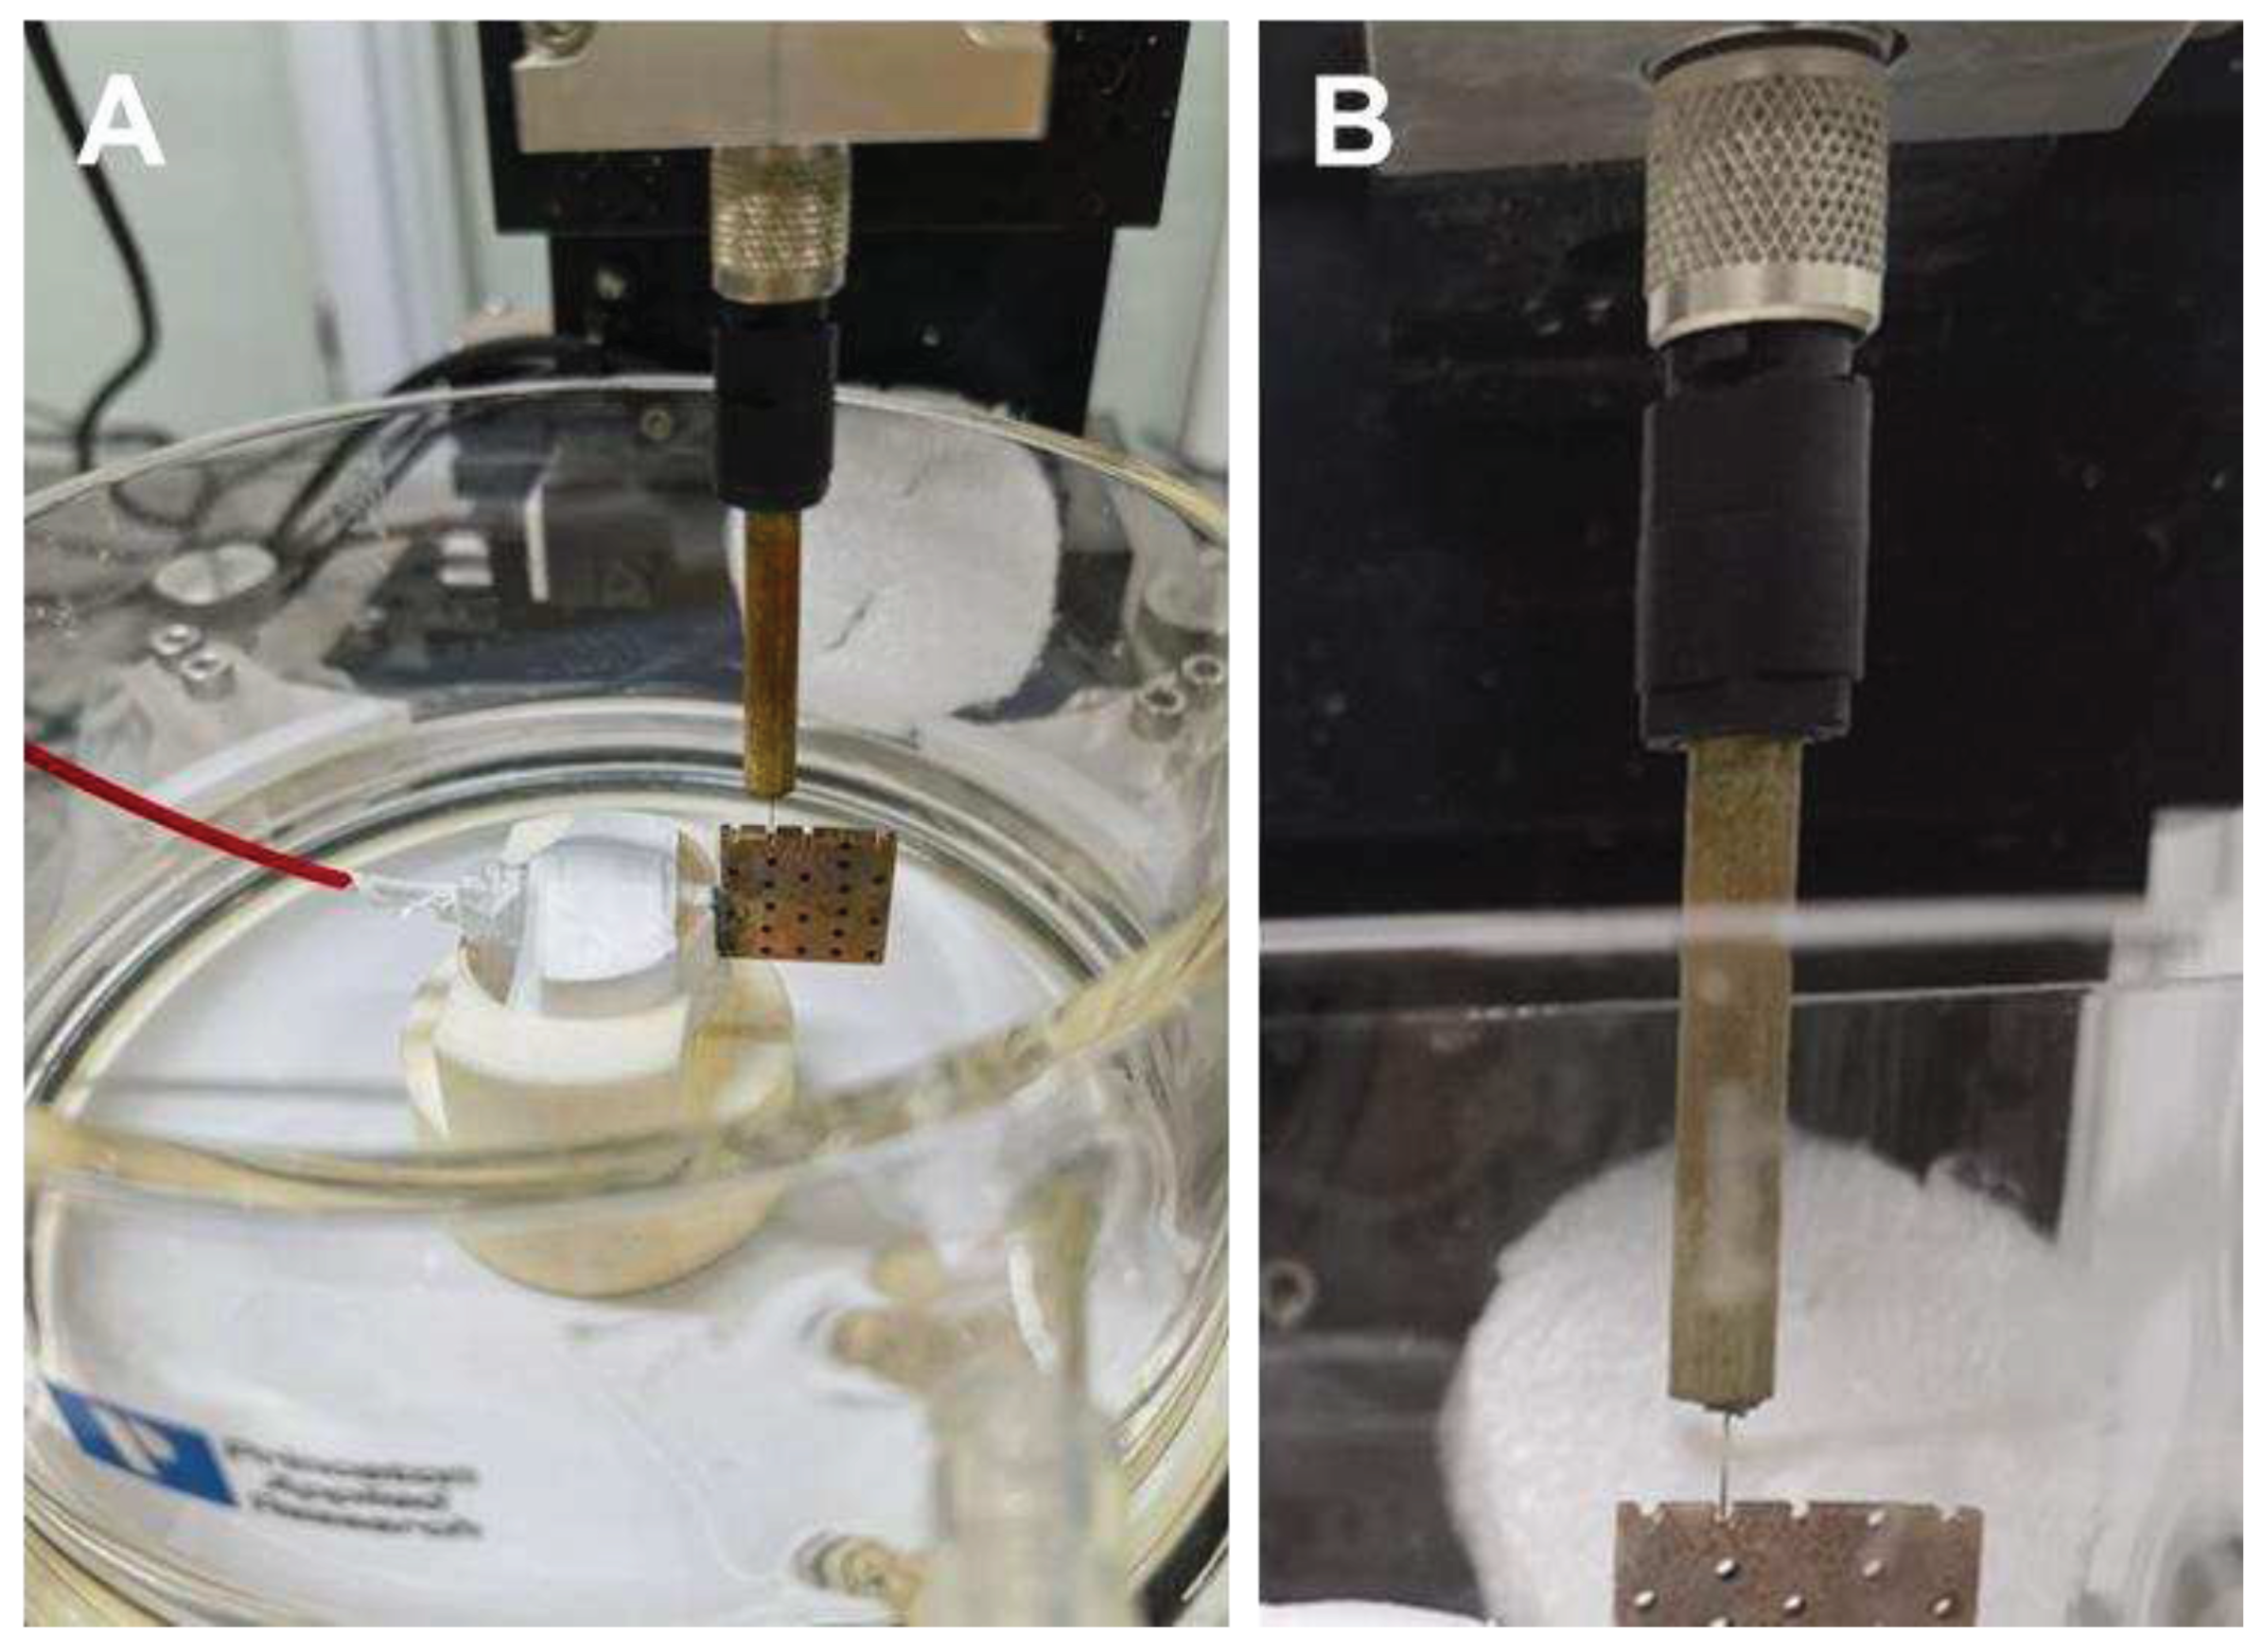
11] to obtain the surface potential distribution of the specimen. For testing, the prepared porous copper electrode was fixed on the sample stage of the workstation (as shown in
Figure 2). The sample stage was placed in an electrolytic cell.
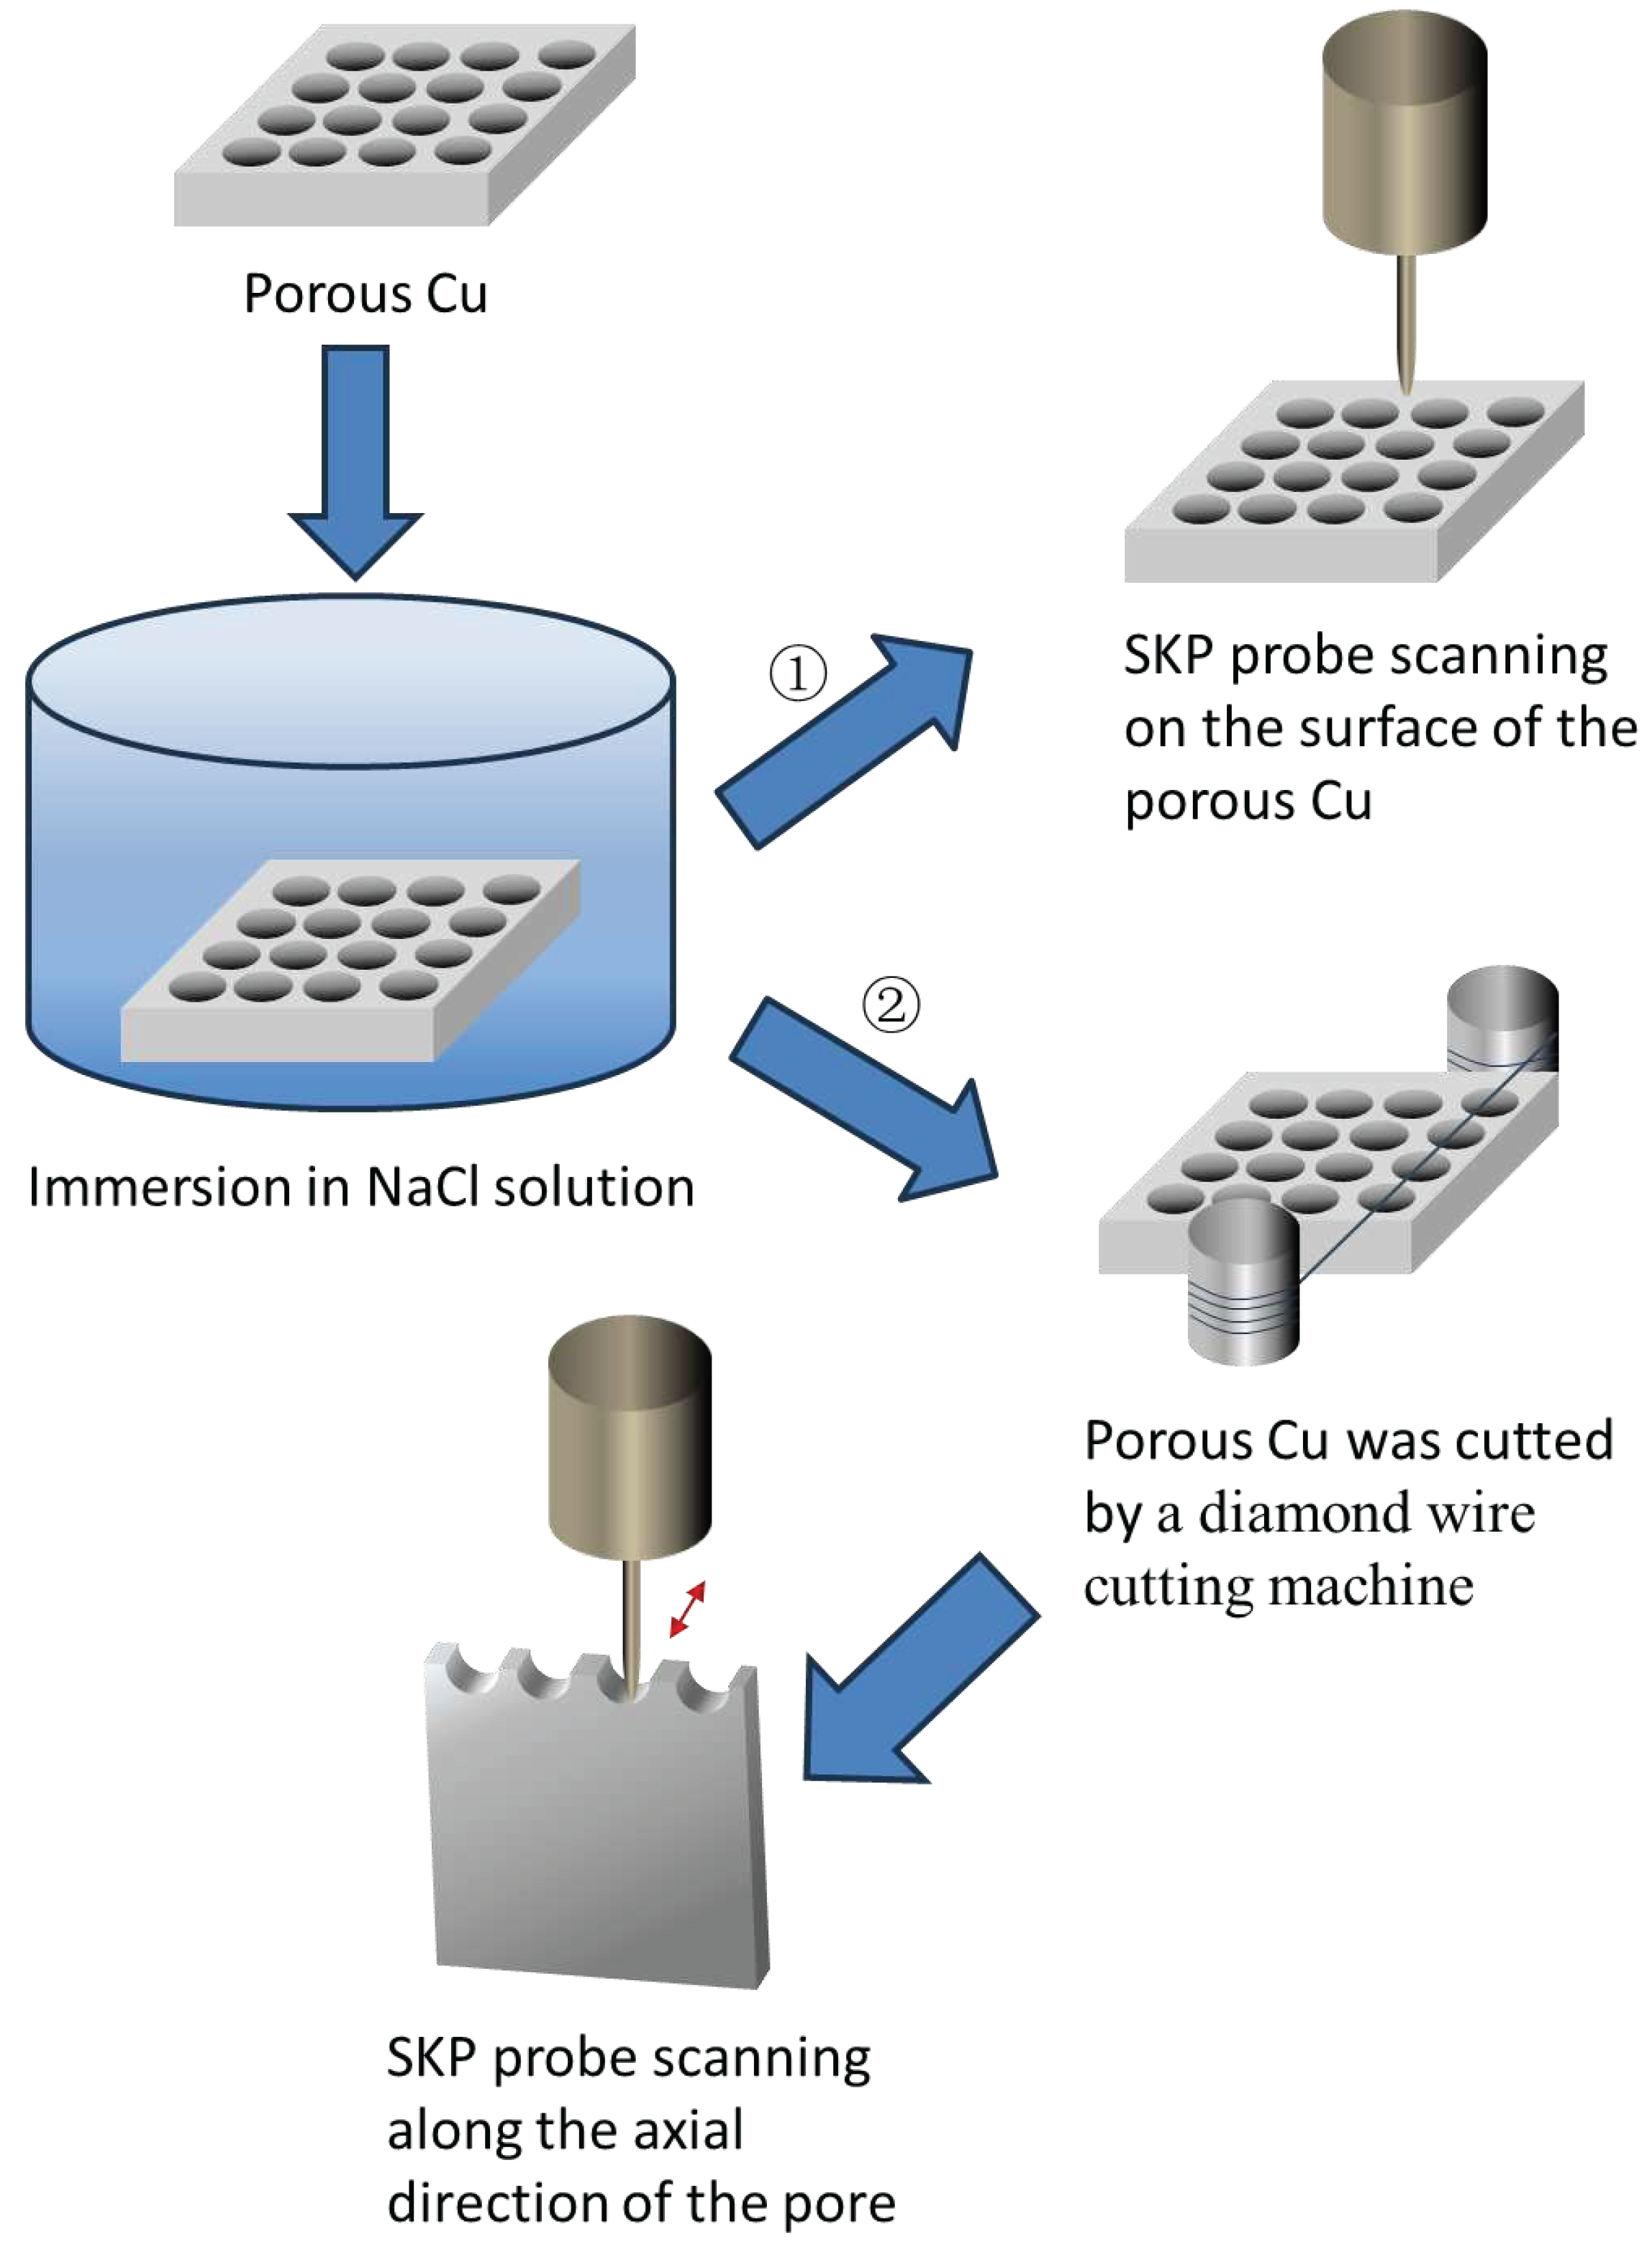
For the test of potential distribution on the electrode surface, the sample was immersed in NaCl solution for a certain period and then was taken out and blow-dried using cold air. As shown in
Figure 1, according to the route one, the surface of the dried sample was scanned by the SKP probe in area scan mode at a height of 100 μm from the sample surface in a scanning step of 50 μm. The scanning area (with the size of 3000 μm × 3000 μm) was positioned between two holes. The specimen without immersion in NaCl solution was also used as control.
When using SKP to test the potential distribution in the pores, porous samples were soaked in NaCl solution for a certain time, then the samples were taken out and were truncated by a diamond wire cutting machine to expose the surface of the pores according to the route two in
Figure 1. The truncated sample was fixed on the sample stage of the micro-scanning electrochemical workstation with cross section facing the SKP probe as shown in
Figure 3. The probe was placed above 100 μm from the lowest point of the pore’s inner surface and moved along the axial direction of the pore. The scanning range was 200 μm × 3000 μm with a scanning step size of 50 μm. The sample without immersion in NaCl solution, as a control, was also processed and tested as the aforementioned route.
2.5. Observation of corrosion morphology
Scanning electron microscopy (SEM, EVO MA15 ZEISS) was used to characterize the surface topography of porous pure copper specimens before and after immersion in 3.5 wt% NaCl solution. Before SEM test, the copper sample subjected to electrochemical test of was washed with deionized water to remove the surface corrosion solution, and then dried by cold air.
3. Results and discussion
3.1. Potentiodynamic polarization curve
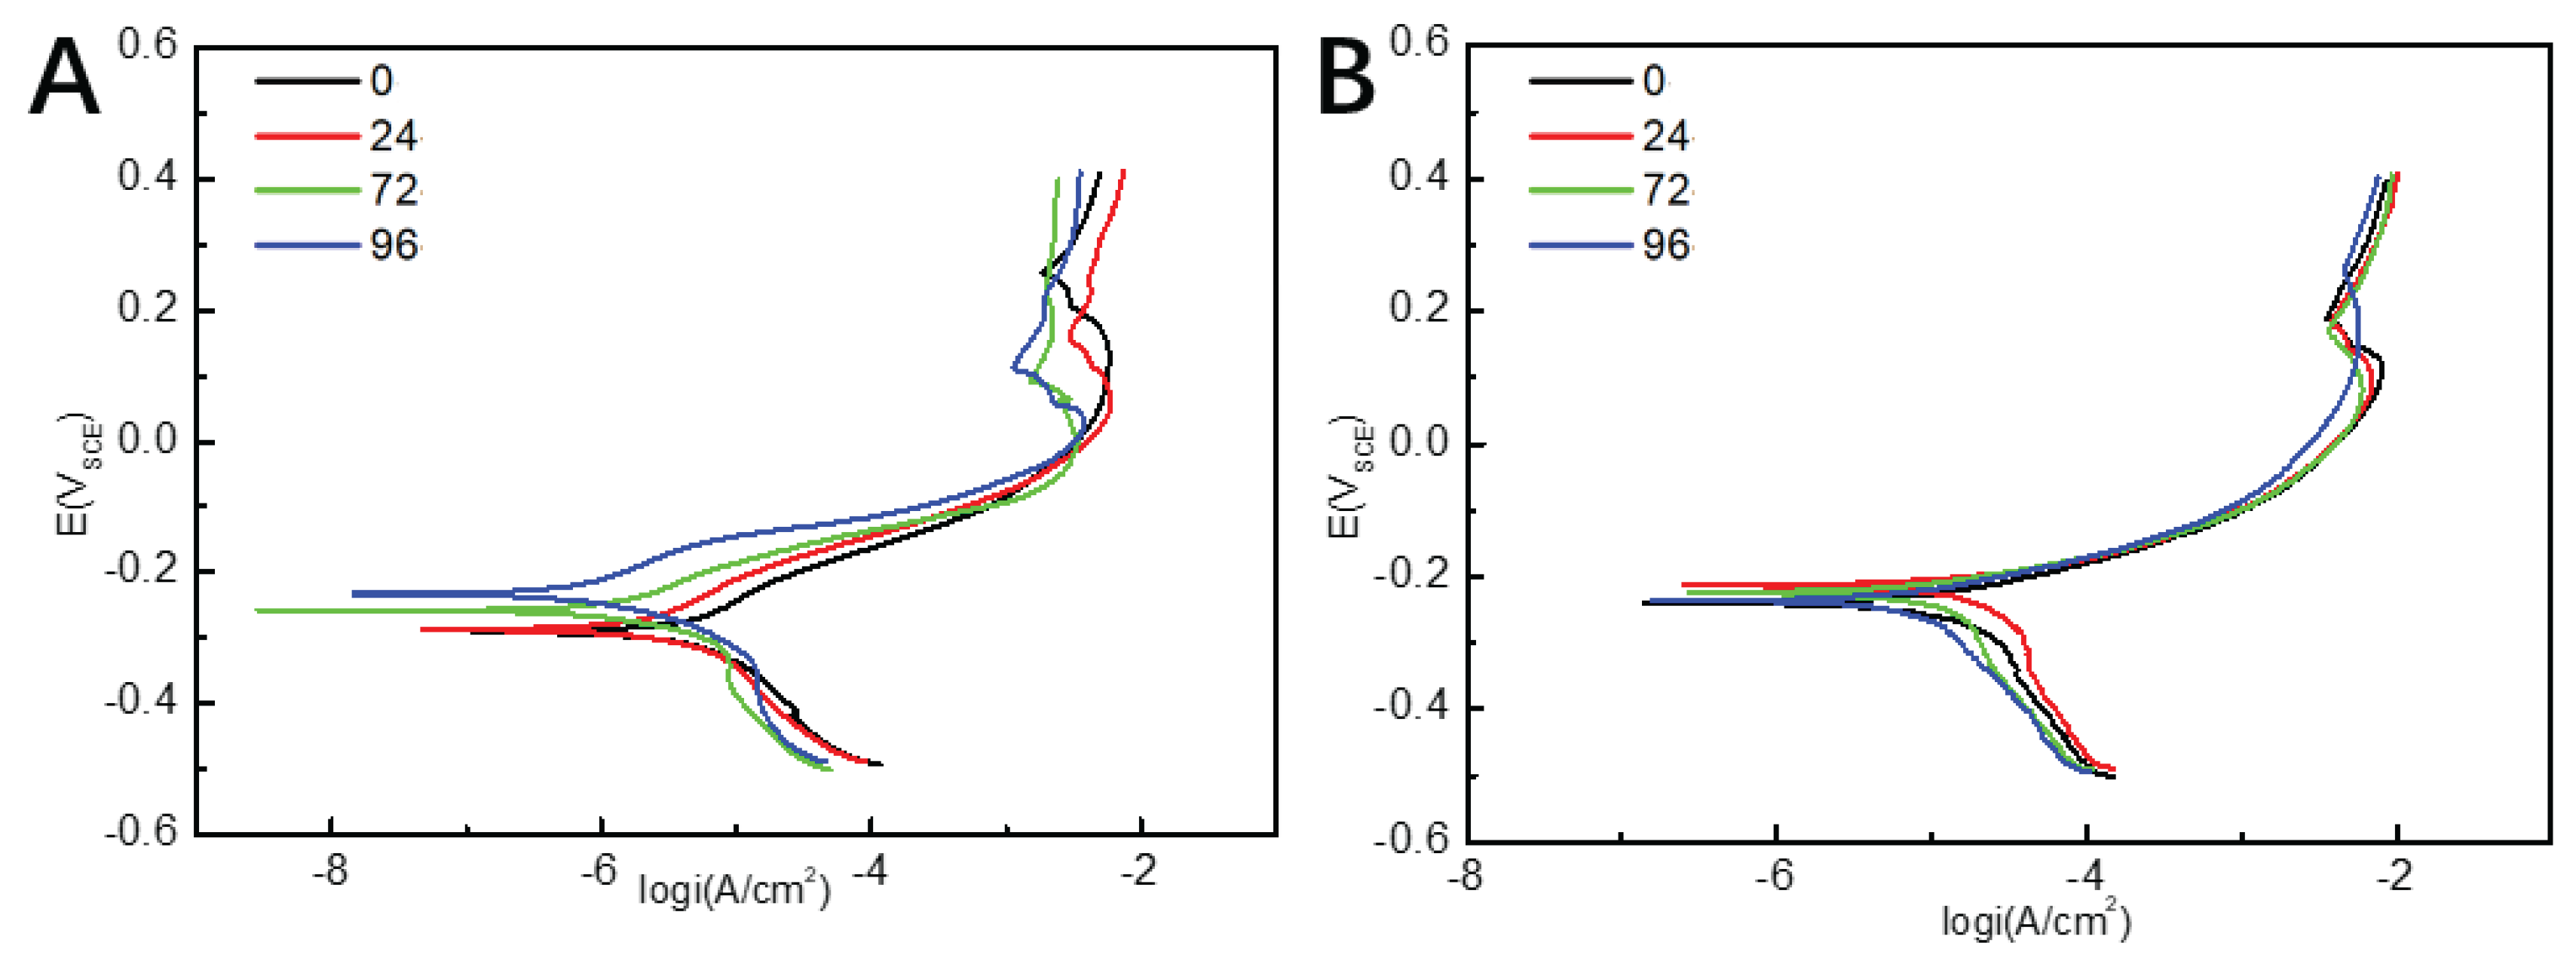
The polarization curves of pure copper specimens with different numbers of pores in 3.5 wt% NaCl under static and dynamic conditions are shown in
Figure 4. As shown in
Figure 4, the polarization curves show a similar shape, indicating that the corrosion mechanism of pure copper did not change with the number of pores. The cathodic polarization reaction of pure copper specimens was the reduction of oxygen; the dissolution reaction of the metal took place during the anode process, which can be divided into three stages: the active dissolution zone, the passivation zone, and the limit current region.
The poarization curve in
Figure 4 was fitted using the Tafel curve extrapolation method, and the electrochemical parameters obtained are shown in
Table 2. Accordingly, the corrosion potential (E
corr) of samples in static 3.5wt % NaCl solution slowly positive shifts as the number of pores increases. Generally, E
corr reflects the corrosion tendency of metal materials, so the changes of E
corr indicate that the corrosion tendency of porous copper decreases as the rise of the pore’s number. Additionally, the value of corrosion current density (I
corr) gradually decreases with the increase of the number of pores, and when the number of pores is 96, the value of I
corr achieves the minimum indicating the best corrosion resistance. It shows that under static conditions, the corrosion resistance of porous copper gradually was reinforced with the increase of the number of pores. Under dynamic conditions, according to the
Table 2, the value of I
corr first increases and then decreases. When the number of pore is 24, the maximum value of 16.281 μA/cm
2 was acquired. This suggests that under dynamic conditions, the porous copper with 24 pores has the worst corrosion resistance, which is different from the sample in static NaCl solution.
3.3. AC impedance test
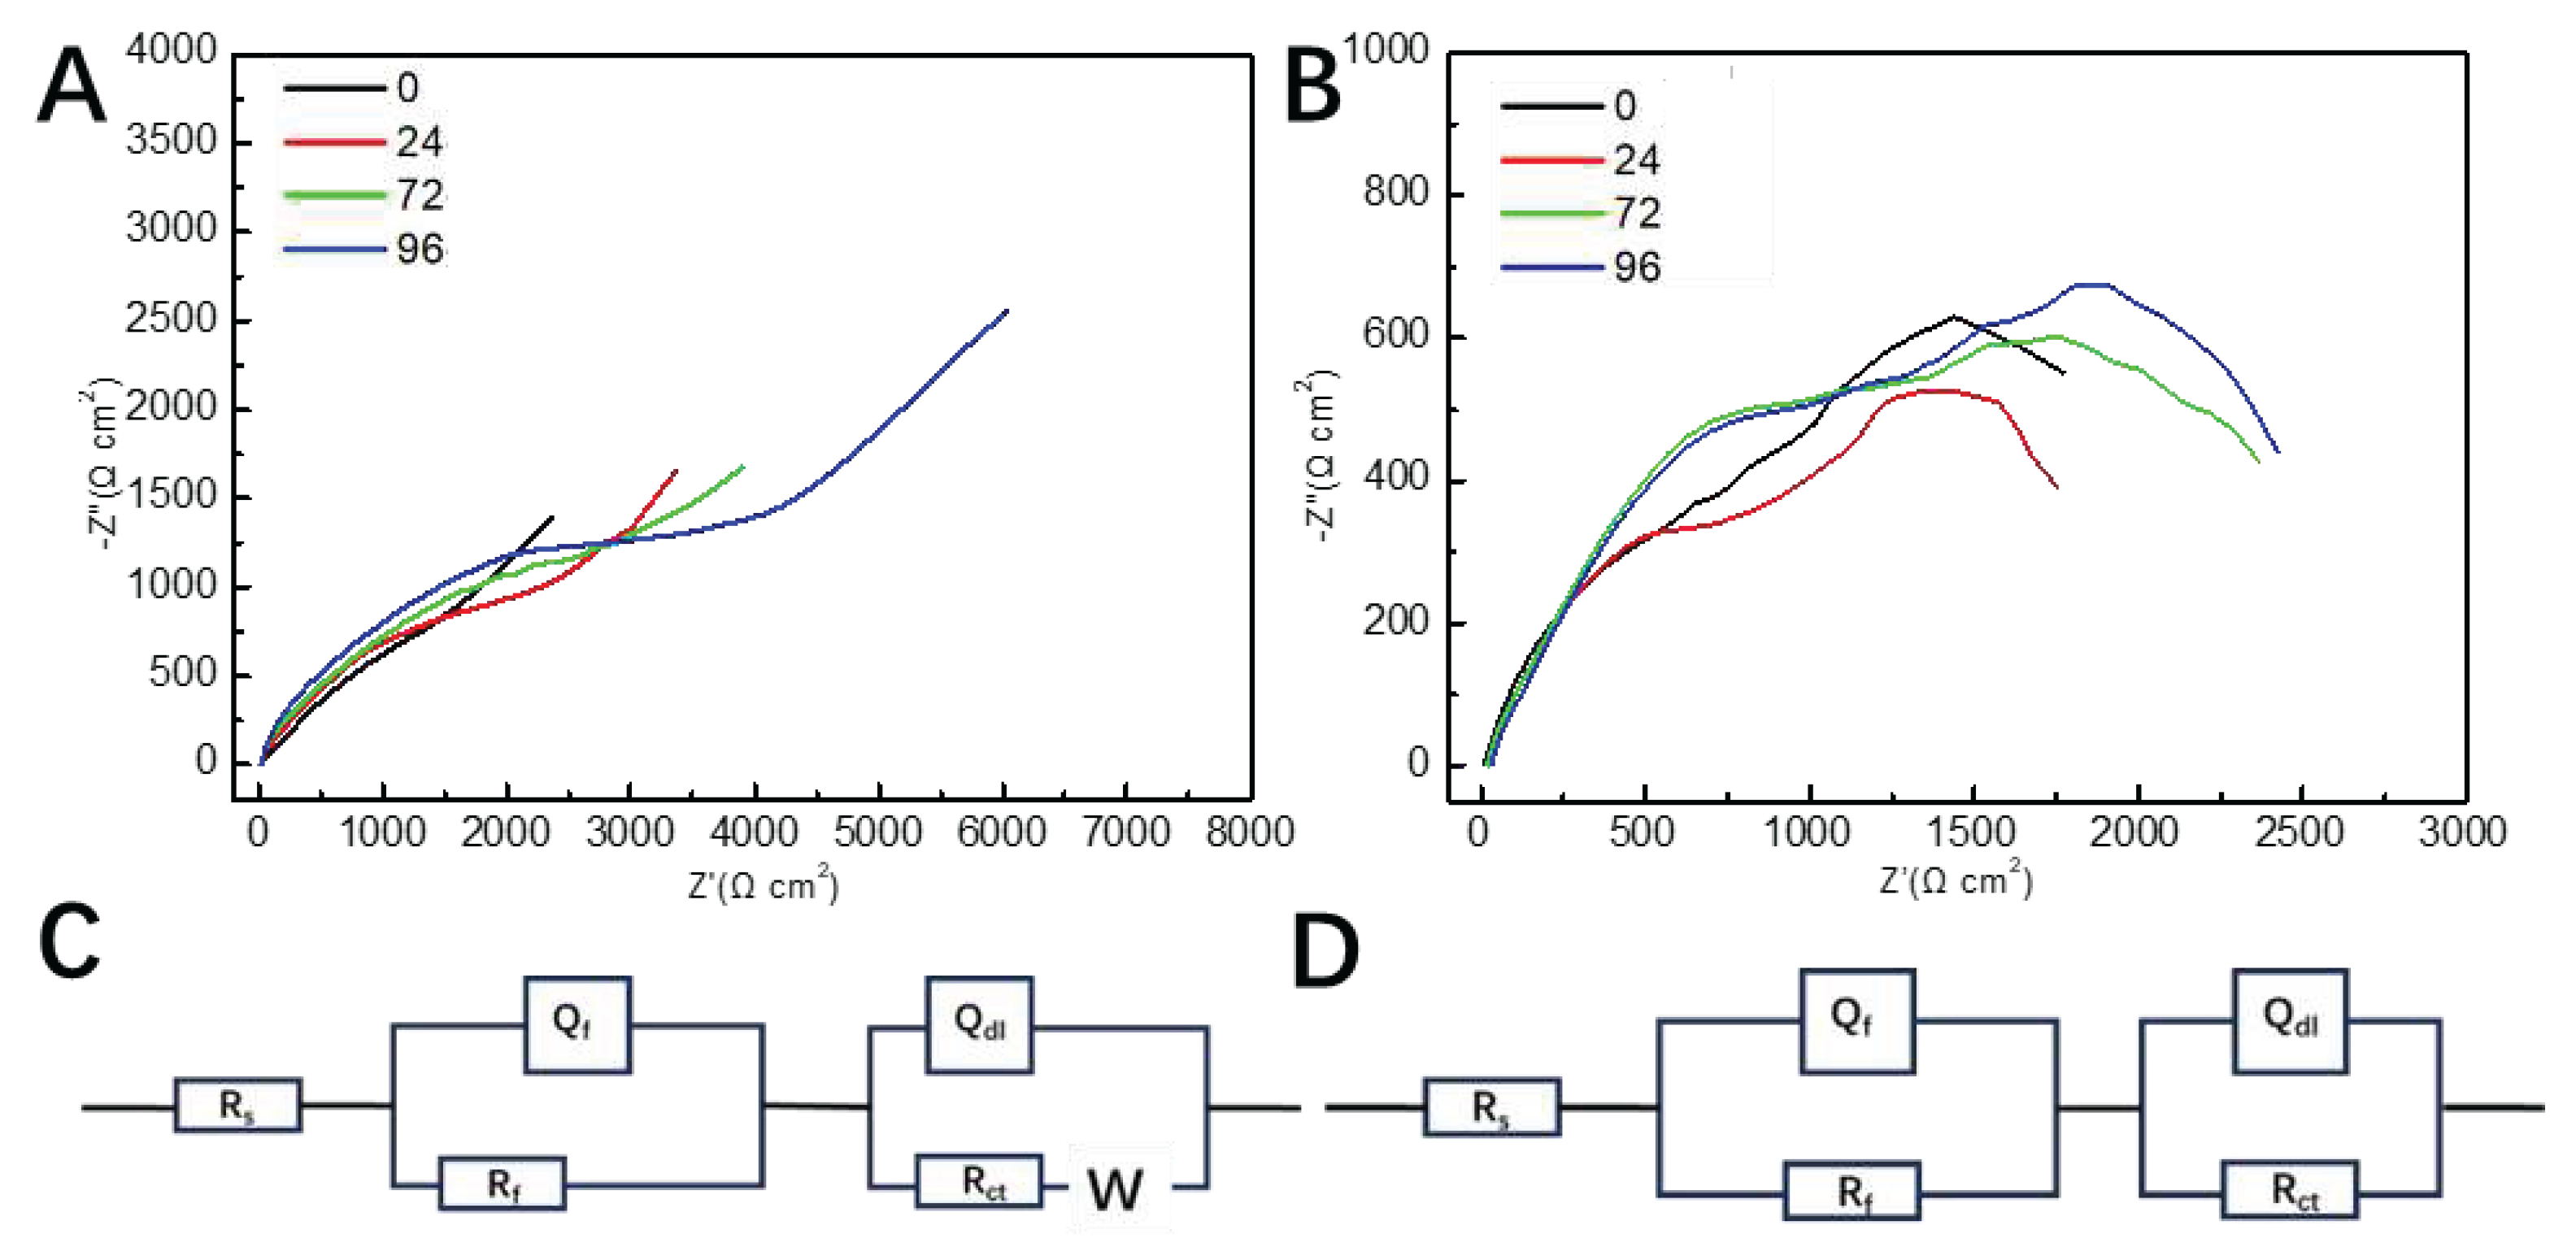
The impedance curves measured under static conditions are show in
Figure 4A. It can be found that with the increase of the number of holes, the radius of the impedance curve increases, that is, the resistance of the metal to corrode the reaction increases, indicating that the corrosion resistance of pure copper is better than porous ones. All impedance curves exhibit diffusion tails corresponding to the Warburg impedance in the low-frequency region. This indicates the occurrence of diffusion processes on the sample surface, including the diffusion of soluble metal ions from the sample facing the anode in solution and the dissolved oxygen diffusion towards the cathode in the opposite direction.
The impedance spectra under dynamic condition are different from those under static condition. The impedance spectra present two semicircular arc characteristics and the Warburg arc in the low-frequency region disappeared as shown in
Figure 5B. It is noted that with the increase of the number of pores, the radius of capacitance arc first decreases and then increases. When the number of holes is 24, the radius of capacitance arc is the smallest, indicating that the corrosion of sample with 24 pores was the most serious.
According to the characteristics of the Nyquist diagram in
Figure 5A,B, the equivalent circuit diagrams in
Figure 5C,D are chosen to fit them, respectively. In the equivalent circuit diagrams the solution resistance (R
s), the capacitance (Q
f) and resistance (R
f) of the corrosion product layer; electric double-layer capacitance (Q
dl) and charge transfer resistance (R
ct), Warburg impedance (Z
w) in the low frequency region were used.
The electrochemical impedance related parameters obtained by fitting with ZSimpWin software are shown in
Table 3 and
Table 4. The quality of the fitting is usually evaluated by the value of χ
2. In
Table 3 and
Table 4, all the values of χ
2 are less than 0.003, indicating the fitting data match the experimental result well. Under static condition, the value of R
ct gradually increases with the rise of the number of pores; however, under dynamic condition, the value of R
ct reaches a minimum when the number of pores was 24. R
ct is the resistance of the charge transfer through the bilayer (the phase boundary between the metal and the electrolyte in contact with the metal, such as an oxide film). The value of R
ct can reflect the rate of dissolution reaction of the metal. Accordingly, under static conditions the introduction of pores can boost corrosion resistance of copper and the resistance capacity achieved the maximum when the number of pores was 96. Nevertheless, under dynamic condition, the porous copper with 24 pores presented the worse corrosion resistance than sample without pores. Furthermore, the samples with the same pores exhibit the higher values of R
ct in static solution than in the dynamic solution. This means that perturbation of the solution leaded to the changes of corrosion behavior of the samples.
3.3. Analyses of Scan Kelvin probe test
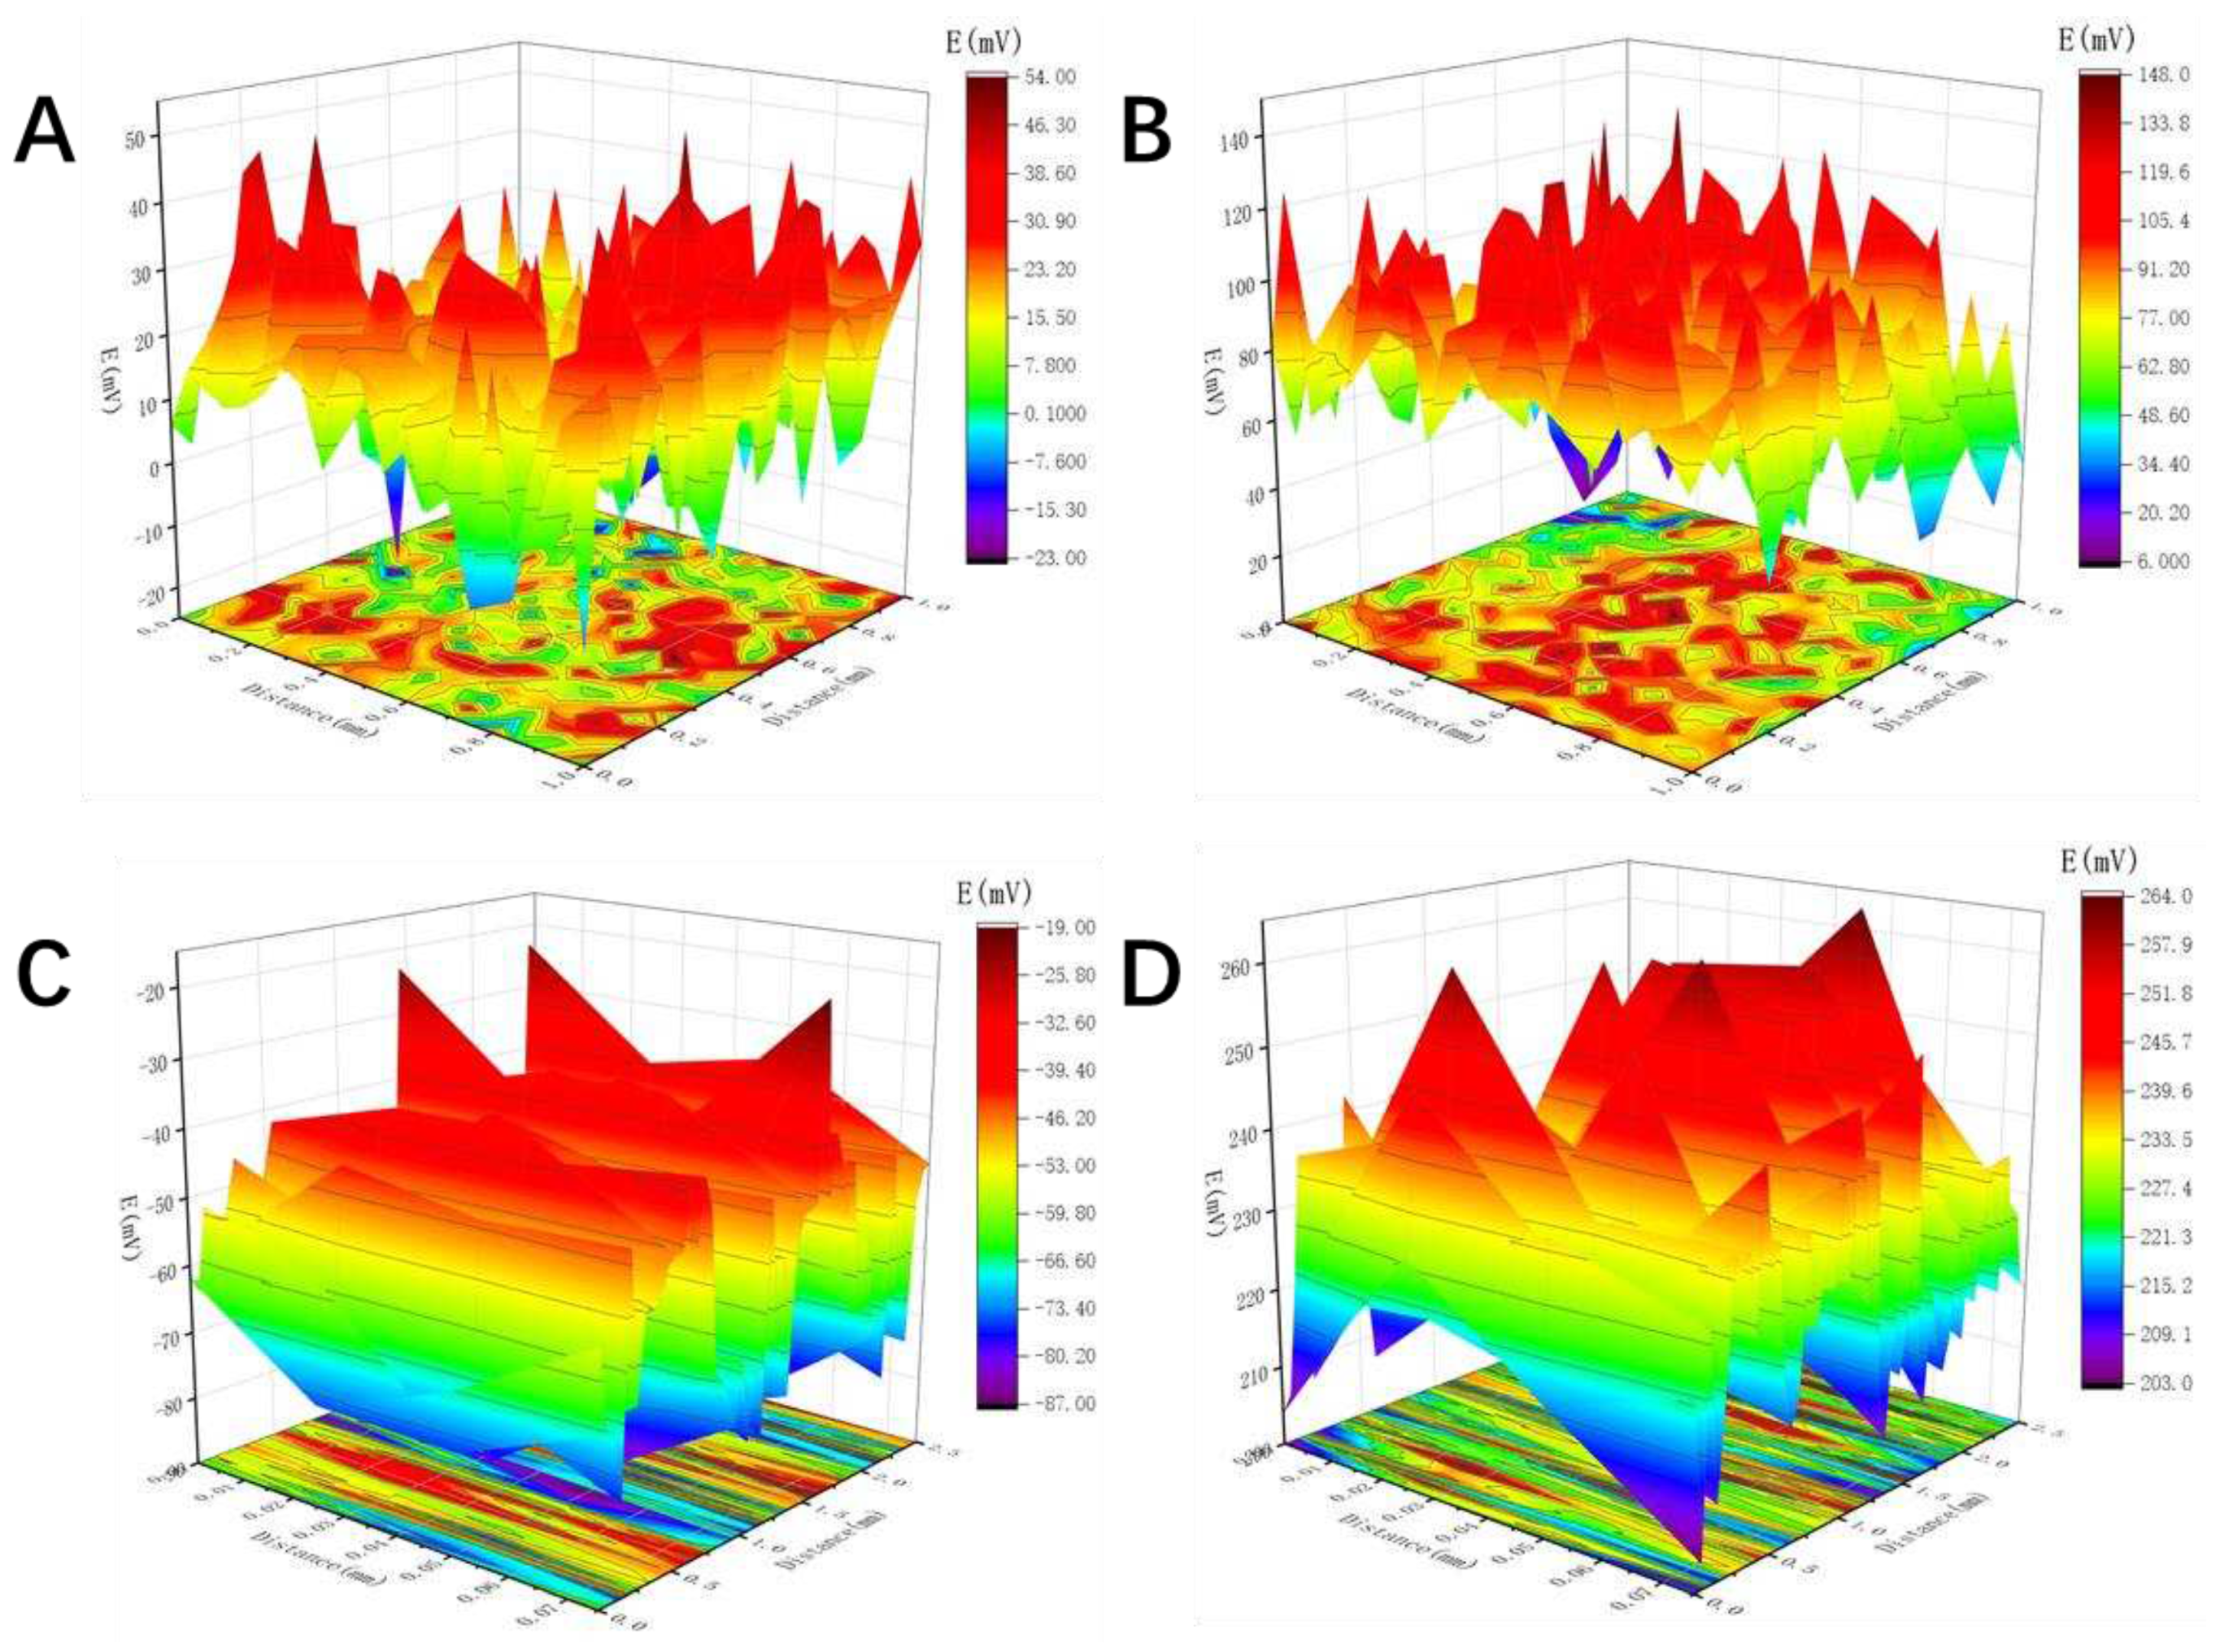
SKP was used to measure the potential changes on the outer surface of sample and inner surface of pore before and after immersion in 3.5 wt% NaCl solution for 14 days. According to the scanning Kelvin probe measuring principle, there is a linear relationship between the corrosion potential (Ecorr) and the Kelvin potential (Ekp): Ecorr = α + b Ekp. Therefore, the highest Kelvin potential (Ekpmax) and the lowest Kelvin potential (Ekpmin) of the measurement system correspond to the cathode potential and anode potential of the reaction system, respectively, and is defined as the difference between the maximum and minimum of the adjacent Kelvin potential, which is the corrosion potential difference of the system, and can be used to evaluate the trend of corrosion occurrence.
As shown in
Figure 6A, before corrosion the outer surface of the sample with 24 pores has uniform E
kp distribution with an average value of 25 mV. The value of E
kpmax is about 54 mV and E
kpmin of about -23 mV, and
is about 57mV. After immersion for 14 d, the potential of the outer surface shifted significantly (
Figure 6B). The average of E
kp increased to 98 mV, and
of about 43 mV was observed. The decrease of potential difference indicates that the corrosion rate of pure copper specimens is reduced, and the corrosion tendency is reduced. With respect to the inner surface of pores, the uniform distribution of values of E
kp is found before corrosion (
Figure 6C). The average value of E
kp is about –65 mV. The value of
is about 61 mV. After immersion in NaCl solution, the value of E
kp presents obvious positive shift. The average E
kp is about 223 mV and
is approximately 27 mV. The decrease of ΔE
kp indicates that after immersion in electrolyte the corrosive tendency of the inner surface declined due to formation and thickening of corrosion product layer. It is noted that after immersion for 14 d, the value of
of outer surface is bigger than that of the inner surface of pore, which suggests that the inner surface of pore has lower possibility to corrode than the outer surface. The reason is that the corrosion product is easy to accumulate and thicken in pores, which can relieve the attack of aggressive Cl
– to the metal matrix.
3.5. Morphologies of samples before and after immersion
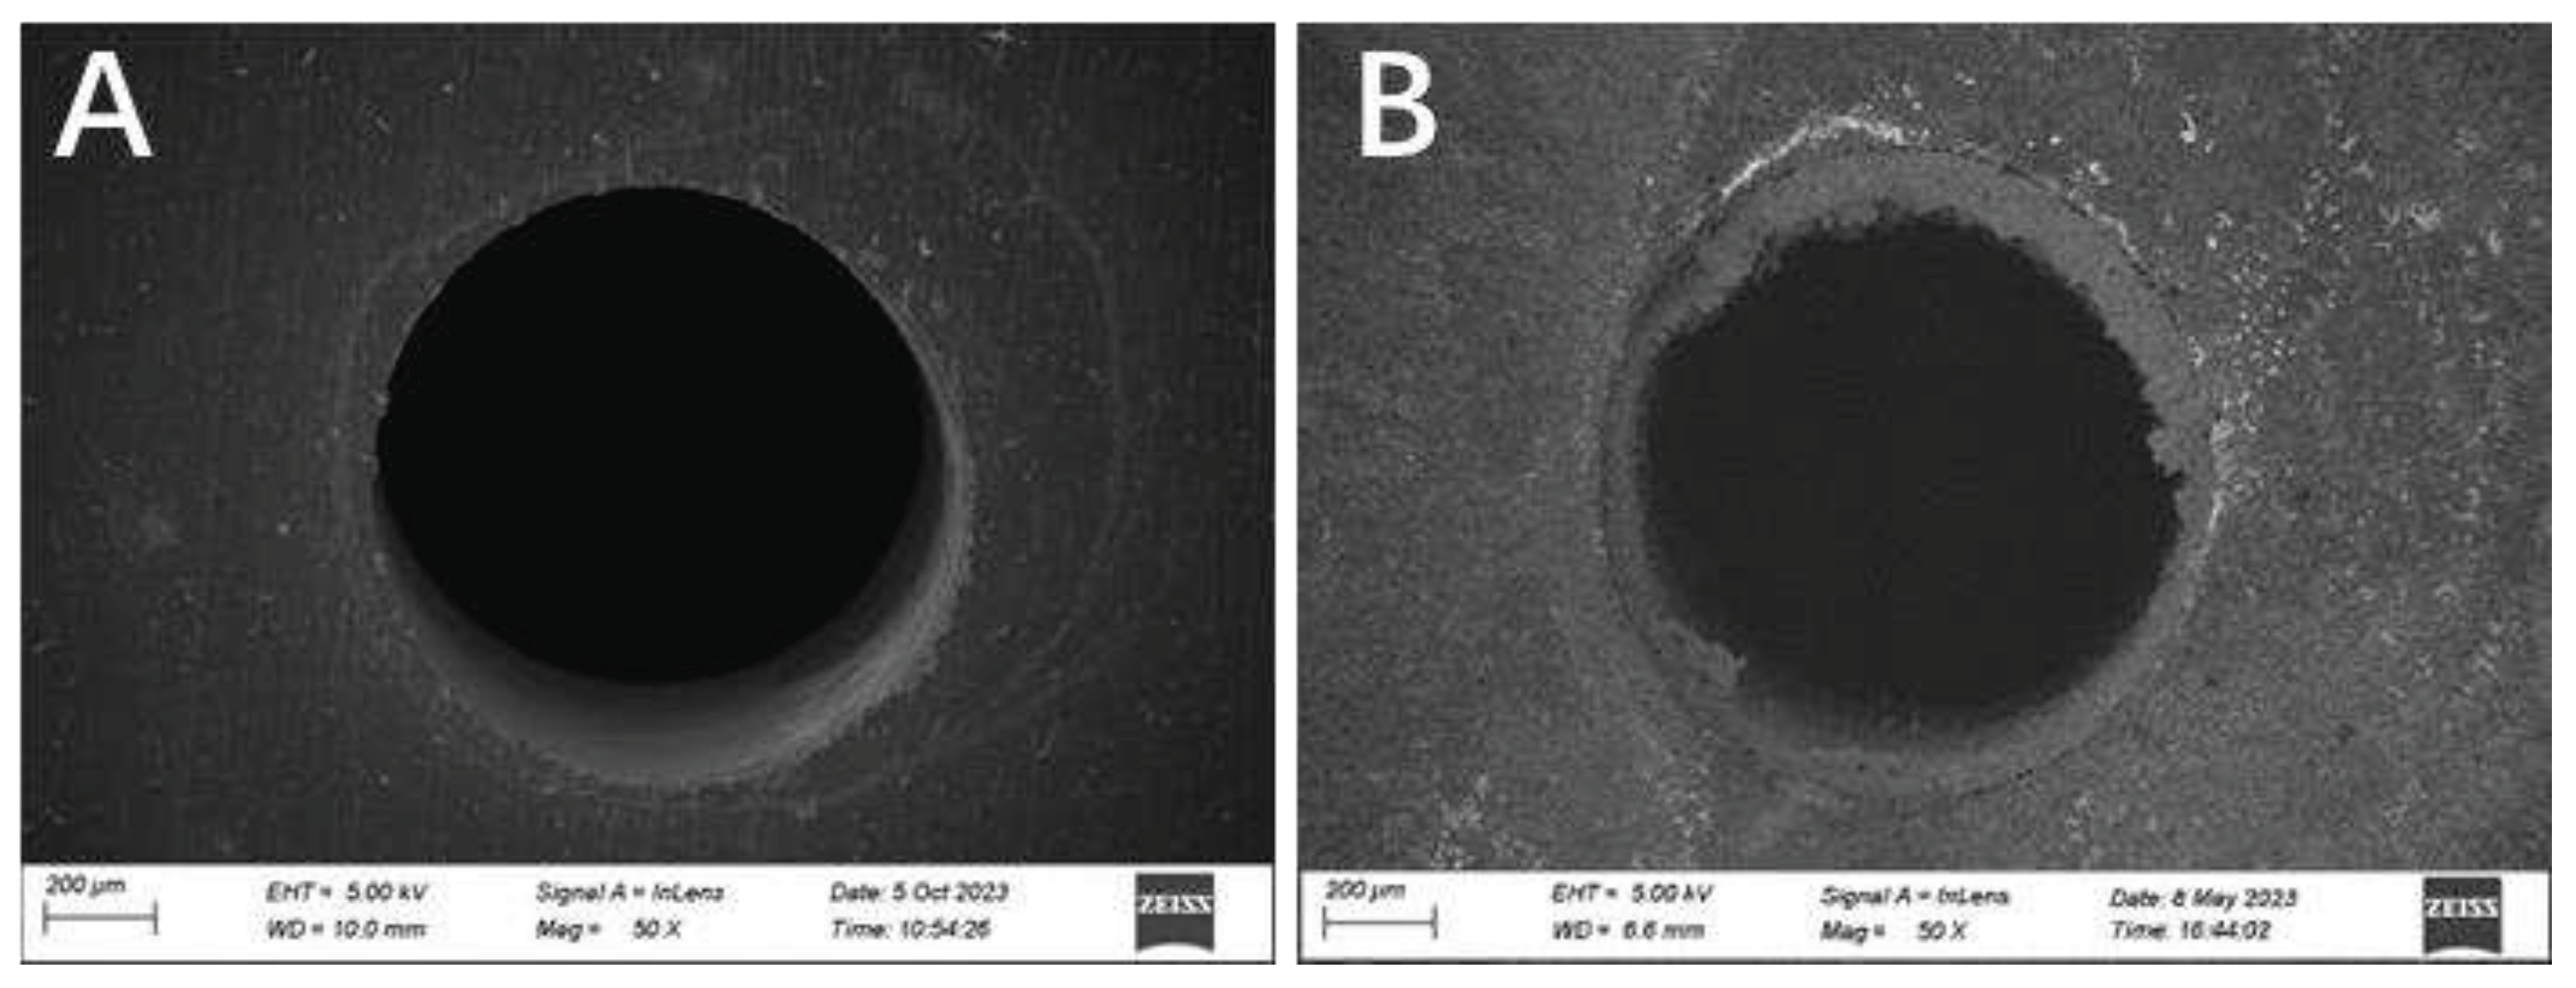
It was observed by scanning electron microscopy that the surface morphology of porous copper with 24 pores before and after immersion in 3.5 wt % NaCl solution for 14 d. The relevant results are shown in
Figure 7. It is obvious that a thick corrosion product layer generated around the pore, which demonstrates corrosion product is prone to accumulate in pores.
3.6. Interpretation of corrosion
In this work, the corrosion behavior of copper samples with different pores in 3.5 wt% NaCl solution under static and dynamic conditions were evaluated. Under static condition the corrosion resistance of samples was boosted with the increase of the number of pores (96>72>24>0). By contrast, the sample with 24 pores exhibited more susceptible to corrosion than the sample without pore.
In neutral NaCl solution, the anodic polarization process undergoes a copper dissolution reaction. The copper sample dissolves to form Cu+, and Cu+ combines with Cl– in solution to form CuCl insoluble matter (Equation (1)). The CuCl insoluble matter is unstable, and can further form CuCl2– soluble substance (Equation (2)), which promotes the further dissolution of copper. Therefore, the anodic dissolution of copper is mainly controlled by the diffusion of CuCl2–. With the progress of the reaction, when the copper sample enters the passivation zone, because CuCl is unstable, it can be hydrolyzed to generate Cu2O dense oxide film (Equation (3)), which may exist in the film of CuCl to protect the copper matrix. When the copper specimen is in the limit current region, the Cu2O oxide film formed on the surface of copper reacts under the action of Cl–, Cu+ is oxidized to Cu2+ (Equation (4), and loose Cu(OH)3Cl and CuO double-layer corrosion structure are generated, and the current of the anode reaction increases with the increase of polarization potential.
As copper in NaCl solution, the cathode undergoes oxygen reduction reaction, and its polarization process is affected by oxygen concentration and diffusion. The total reaction process occurs as shown in Equation (5), that is, when the oxygen concentration on the surface of copper increases, the reaction formula moves in a positive direction, concentration of generating OH– increases, and unstable CuCl insoluble matter is more likely to form dense oxide film Cu2O in solution, thereby increasing the corrosion resistance of copper.
In static 3.5 wt % NaCl solution, the corrosion rate of copper was mainly affected by the anodic reaction process. As pores were introduced in the copper sample, the exposed area of the metal matrix in the solution increased, leading to more CuCl generation on the metal surface under the erosion of Cl–. Since corrosion was carried out under an open system, the presence of oxygen in the solution was inevitiable; so Cu2O can formed on copper in oxygen-contained aqueous solution, and CuCl was also hydrolyzed to generate Cu2O. Cu2O was further converted to Cu(OH)3Cl and CuO corrosion products in NaCl solution. These corrosion products covered the metal surface and tended to accumulate in and around the wells, making it difficult for Cl– in solution to penetrate these oxidation products, thereby reducing Cl– attack on the copper matrix and reducing pure copper corrosion. Therefore, as the number of holes increased, the larger the exposed area, the less corrosion.
In dynamic 3.5 wt %NaCl solution, on the one hand, due to the introduction of pore structure, specific surface area increased, and the reaction area with Cl– in the solution rose, resulting in metal dissolution. At this time the reaction Equation (2) moved in a positive direction. At the same time, a variety of oxidative corrosion products such as dense Cu2O and loose Cu(OH)3Cl and CuO were also generated. The flow of the solution caused the resulting corrosion products to easily fall off the surface of the sample, thereby reducing the protective effect on the copper matrix, so the corrosion of the sample is accelerated. On the other hand, the introduction of the pore structure provided more oxygen diffusion channels, increased the surface oxygen concentration on the copper matrix, and made the cathodic reaction shown in Equation (5) move in a positive direction. As a result, OH– concentration in solution rose, further promoting the conversion of unstable CuCl insoluble matter into dense oxide film Cu2O and slowing down corrosion. The combined effect of the two aspects determined the corrosion rate of the porous samples. For the specimen with 24 pores, the corrosion acceleration effect of the introduction of pores on matrix dissolution was greater than the boost of oxygen diffusion to form protective oxides, so compared with the 0-pore sample, the corrosion current increased and the corrosion aggravated. When the number of pores was further increased, the samples with 72 and 96 pores exhibited almost the same polarization curve as that of sample with 24 pores, indicating that the three kinds of samples possessed basically the same rate of dissolution as reaction with Cl–. However, from the cathodic polarization curve, with the increase in the number of pores, oxygen diffusion was easier, and the oxides formed on copper matrix are thicker and denser, which limited the corrosion of the copper matrix.
4. Conclusions
In this work, the corrosion behaviors of porous copper in 3.5 wt % NaCl solution under static and dynamic conditions are studied by the corrosion electrochemical and SKP methods, and the following conclusions are obtained:
(1) Under static condition, the corrosion resistance of copper samples with different pores in 3.5 wt % NaCl solution gradually increased with the rise of the number of pores; when the number of pores was 96, the corrosion resistance was the best.
(2) Under dynamic condition, in 3.5 wt % NaCl solution, the corrosion resistance of the samples decreased first and then increased with the addition of the number of pores; when the number of pores was 24, the corrosion resistance was the worst; the sample with 96 pores still possessed the best corrosion resistance.
(3) The SKP test results show that at the beginning the corrosion tendency in the hole was greater, and with the increase of corrosion immersion time, the corrosion products generated and accumulated in the hole, improving the corrosion resistance of inner surface of pores. In dynamic NaCl solution, corrosion products fell off easily, so the sample with 24 pores exhibited more susceptible to corrosion than the sample without pore.
Acknowledgments
The work was supported by Project of Department of Science and Technology of Sichuan Province (2022NSFSC0033), Project of Vanadium and Titanium Resource Comprehensive Utilization Key Laboratory of Sichuan Province (2018FTSZ06).
References
- Liu, P. S.; Chen, G. F., Chapter Four - Special Porous Metals. In Porous Materials, Liu, P. S.; Chen, G. F., Eds. Butterworth-Heinemann: Boston, 2014; pp 189-220.
- Liu, P. S.; Chen, G. F., Chapter Three - Application of Porous Metals. In Porous Materials, Liu, P. S.; Chen, G. F., Eds. Butterworth-Heinemann: Boston, 2014; pp 113-188.
- Tang, F.; Fudouzi, H.; Uchikoshi, T.; Sakka, Y., Preparation of porous materials with controlled pore size and porosity. Journal of the European Ceramic Society 2004, 24, (2), 341-344.
- Nakajima, H., Fabrication, properties and application of porous metals with directional pores. Progress in Materials Science 2007, 52, (7), 1091-1173.
- Singh, H.; Saxena, P.; Puri, Y. M., The manufacturing and applications of the porous metal membranes: A critical review. CIRP Journal of Manufacturing Science and Technology 2021, 33, 339-368.
- Otaru, A. J., Review on Processing and Fluid Transport in Porous Metals with a Focus on Bottleneck Structures. Metals and Materials International 2020, 26, (4), 510-525.
- Banerjee, A.; Paul, D., Developments and applications of porous medium combustion: A recent review. Energy 2021, 221, 119868.
- Tauseef ur, R.; Ali, H. M.; Janjua, M. M.; Sajjad, U.; Yan, W.-M., A critical review on heat transfer augmentation of phase change materials embedded with porous materials/foams. International Journal of Heat and Mass Transfer 2019, 135, 649-673.
- Wang, Q.; Han, F.; Wu, J.; Hao, G., Damping behavior of porous CuAlMn shape memory alloy. Materials Letters 2007, 61, (11), 2598-2600.
- Guiping, C.; Deping, H.; Guangji, S., Underwater sound absorption property of porous aluminum. Colloids and Surfaces A: Physicochemical and Engineering Aspects 2001, 179, (2), 191-194.
- Long, F.; Duan, Y.; Yu, S.; Jia, H.; Bu, Y.; Huang, J., Effect of porous materials on explosion characteristics of low ratio hydrogen/methane mixture in barrier tube. Journal of Loss Prevention in the Process Industries 2022, 80, 104875.
- Goodall, R., 10 - Porous metals: foams and sponges. In Advances in Powder Metallurgy, Chang, I.; Zhao, Y., Eds. Woodhead Publishing: 2013; pp 273-307.
- Sundarram, S. S.; Li, W., The effect of pore size and porosity on thermal management performance of phase change material infiltrated microcellular metal foams. Applied Thermal Engineering 2014, 64, (1), 147-154.
- Xu, Z.; Hao, H., Electromagnetic interference shielding effectiveness of aluminum foams with different porosity. Journal of Alloys and Compounds 2014, 617, 207-213.
- Guo, Y.; Liu, F.; Bian, X.; Lu, K.; Huang, P.; Ye, X.; Tang, C.; Li, X.; Wang, H.; Tang, K., Effect of Pore Size of Porous-Structured Titanium Implants on Tendon Ingrowth. Applied Bionics and Biomechanics 2022, 2022, 2801229.
- Wan, T.; Liu, Y.; Zhou, C.; Chen, X.; Li, Y., Fabrication, properties, and applications of open-cell aluminum foams: A review. Journal of Materials Science & Technology 2021, 62, 11-24.
- Li, X.; Sun, M.; Rooke, J. C.; Chen, L.; Su, B.-L., Synthesis and applications of hierarchically porous catalysts. Chinese Journal of Catalysis 2013, 34, (1), 22-47.
- Biswas, N.; Ding, J. L., Numerical study of the deformation and fracture behavior of porous Ti6Al4V alloy under static and dynamic loading. International Journal of Impact Engineering 2015, 82, 89-102.
- Arensburger, D. S.; Pugin, V. S.; Fedorchenko, I. M., Corrosion resistance of porous titanium in some aggressive media. Soviet Powder Metallurgy and Metal Ceramics 1968, 7, (12), 977-981.
- Seah, K. H. W.; Thampuran, R.; Teoh, S. H., The influence of pore morphology on corrosion. Corrosion Science 1998, 40, (4), 547-556.
- Wu, L.; He, Y.-h.; Jiang, Y.; Zeng, Y.; Xiao, Y.-f.; Nan, B., Effect of pore structures on corrosion resistance of porous Ni3Al intermetallics. Transactions of Nonferrous Metals Society of China 2014, 24, (11), 3509-3516.
- Wu, S.-h.; Li, Y.; Zhang, Y.-q.; Li, X.-k.; Yuan, C.-f.; Hao, Y.-L.; Zhang, Z.-Y.; Guo, Z., Porous titanium-6 aluminum-4 vanadium cage has better osseointegration and less micromotion than a poly-ether-ether-ketone cage in sheep vertebral fusion. Artificial organs 2013, 37 12, E191-201.
- Zhang, J.; An, Y.; Ma, H., Research Progress in the Preparation of Aluminum Foam Composite Structures. Metals 2022, 12, (12), 2047.
- Yang, D.; Chen, J.; Wang, H.; Jiang, J.; Ma, A.; Lu, Z. P., Effect of Decomposition Kinetics of Titanium Hydride on the Al Alloy Melt Foaming Process. Journal of Materials Science & Technology 2015, 31, (4), 361-368.
- Wang, H.; Liu, X.; Niu, P.; Wang, S.; Shi, J.; Li, L., Porous Two-Dimensional Materials for Photocatalytic and Electrocatalytic Applications. Matter 2020, 2, (6), 1377-1413.
- Chen, X.; Fu, Q.; Jin, Y.; Li, M.; Yang, R.; Cui, X.; Gong, M., In vitro studying corrosion behavior of porous titanium coating in dynamic electrolyte. Materials Science and Engineering: C 2017, 70, 1071-1075.
|
Disclaimer/Publisher’s Note: The statements, opinions and data contained in all publications are solely those of the individual author(s) and contributor(s) and not of MDPI and/or the editor(s). MDPI and/or the editor(s) disclaim responsibility for any injury to people or property resulting from any ideas, methods, instructions or products referred to in the content. |
© 2023 by the authors. Licensee MDPI, Basel, Switzerland. This article is an open access article distributed under the terms and conditions of the Creative Commons Attribution (CC BY) license (http://creativecommons.org/licenses/by/4.0/).
