Submitted:
12 October 2023
Posted:
13 October 2023
You are already at the latest version
Abstract
Keywords:
1. Introduction
2. Materials and Methods
2.1. Patients Population
2.2. Variables
2.3. Statistical Analysis
3. Results
3.1. Demographic and Clinical Characteristics
3.2. Establishment of the Nomogram
3.3. Validation of the Nomogram
3.4. Survival Analysis
4. Discussion
5. Conclusions
Supplementary Materials
Author Contributions
Funding
Institutional Review Board Statement
Informed Consent Statement
Data Availability Statement
Conflicts of Interest
References
- Siegel RL, Miller KD and Jemal A. Cancer statistics, 2020. CA Cancer J Clin, 2020, 70(1): 7-30.
- Liu J, Cui G, Ye J, et al. Comprehensive Analysis of the Prognostic Signature of Mutation-Derived Genome Instability-Related lncRNAs for Patients With Endometrial Cancer. Front Cell Dev Biol, 2022, 10: 753957.
- Yao K, Zheng H and Li T. Association Between Metformin Use and the Risk, Prognosis of Gynecologic Cancer. Front Oncol, 2022, 12: 942380. [CrossRef]
- Reeves KW, Carter GC, Rodabough RJ, et al. Obesity in relation to endometrial cancer risk and disease characteristics in the Women's Health Initiative. Gynecol Oncol, 2011, 121(2): 376-382. [CrossRef]
- Yao X and Wang X. Bioinformatics searching of diagnostic markers and immune infiltration in polycystic ovary syndrome. Front Genet, 2022, 13: 937309. [CrossRef]
- Esposito G, Bravi F, Serraino D, et al. Diabetes Risk Reduction Diet and Endometrial Cancer Risk. Nutrients, 2021, 13(8): 2630. [CrossRef]
- Wu QJ, Li YY, Tu C, et al. Parity and endometrial cancer risk: a meta-analysis of epidemiological studies. Sci Rep, 2015, 5: 14243. [CrossRef]
- Wernli KJ, Ray RM, Gao DL, et al. Menstrual and reproductive factors in relation to risk of endometrial cancer in Chinese women. Cancer Causes Control, 2006, 17(7): 949-955. [CrossRef]
- Crosbie EJ, Kitson SJ, McAlpine JN, et al. Endometrial cancer. Lancet, 2022, 399(10333): 1412-1428. [CrossRef]
- Choi J, Holowatyj AN, Du M, et al. Distinct Genomic Landscapes in Early-Onset and Late-Onset Endometrial Cancer. JCO Precis Oncol, 2022, 6: e2100401. [CrossRef]
- Walsh MD, Cummings MC, Buchanan DD, et al. Molecular, pathologic, and clinical features of early-onset endometrial cancer: identifying presumptive Lynch syndrome patients. Clin Cancer Res, 2008, 14(6): 1692-1700. [CrossRef]
- Parslov M, Lidegaard O, Klintorp S, et al. Risk factors among young women with endometrial cancer: a Danish case-control study. Am J Obstet Gynecol, 2000, 182(1 Pt 1): 23-29. [CrossRef]
- Crissman JD, Azoury RS, Barnes AE, et al. Endometrial carcinoma in women 40 years of age or younger. Obstet Gynecol, 1981, 57(6): 699-704. [PubMed]
- Amin MB, Greene FL, Edge SB, et al. The Eighth Edition AJCC Cancer Staging Manual: Continuing to build a bridge from a population-based to a more "personalized" approach to cancer staging. CA Cancer J Clin, 2017, 67(2): 93-99. [CrossRef]
- Wang Z, Zhang S, Ma Y, et al. A nomogram prediction model for lymph node metastasis in endometrial cancer patients. BMC Cancer, 2021, 21(1): 748. [CrossRef]
- Celli V, Guerreri M, Pernazza A, et al. MRI- and Histologic-Molecular-Based Radio-Genomics Nomogram for Preoperative Assessment of Risk Classes in Endometrial Cancer. Cancers (Basel), 2022, 14(23): 5881. [CrossRef]
- Doll KM and Winn AN. Assessing endometrial cancer risk among US women: long-term trends using hysterectomy-adjusted analysis. Am J Obstet Gynecol, 2019, 221(4): 318.e311-318.e319. [CrossRef]
- Camp RL, Dolled-Filhart M and Rimm DL. X-tile: a new bio-informatics tool for biomarker assessment and outcome-based cut-point optimization. Clin Cancer Res, 2004, 10(21): 7252-7259. [CrossRef]
- Abdol Manap N, Ng BK, Phon SE, et al. Endometrial Cancer in Pre-Menopausal Women and Younger: Risk Factors and Outcome. Int J Environ Res Public Health, 2022, 19(15): 9059. [CrossRef]
- Yamagami W, Susumu N, Banno K, et al. Clinicopathologic manifestations of early-onset endometrial cancer in Japanese women with a familial predisposition to cancer. J Obstet Gynaecol Res, 2005, 31(5): 444-451. [CrossRef]
- Tarney CM, Tian C, Wang G, et al. Impact of age at diagnosis on racial disparities in endometrial cancer patients. Gynecol Oncol, 2018, 149(1): 12-21. [CrossRef]
- Giaquinto AN, Miller KD, Tossas KY, et al. Cancer statistics for African American/Black People 2022. CA Cancer J Clin, 2022, 72(3): 202-229. [CrossRef]
- Bailey ZD, Feldman JM and Bassett MT. How Structural Racism Works - Racist Policies as a Root Cause of U.S. Racial Health Inequities. N Engl J Med, 2021, 384(8): 768-773. [CrossRef]
- Williams DR, Lawrence JA and Davis BA. Racism and Health: Evidence and Needed Research. Annu Rev Public Health, 2019, 40: 105-125. [PubMed]
- Jiang P, Huang J, Deng Y, et al. Predicting Recurrence in Endometrial Cancer Based on a Combination of Classical Parameters and Immunohistochemical Markers. Cancer Manag Res, 2020, 12: 7395-7403. [CrossRef]
- Jiang P, Wang J, Gong C, et al. A Nomogram Model for Predicting Recurrence of Stage I-III Endometrial Cancer Based on Inflammation-Immunity-Nutrition Score (IINS) and Traditional Classical Predictors. J Inflamm Res, 2022, 15: 3021-3037. [CrossRef]
- Saha S, Shaik M, Johnston G, et al. Tumor size predicts long-term survival in colon cancer: an analysis of the National Cancer Data Base. Am J Surg, 2015, 209(3): 570-574. [CrossRef]
- Son J, Carr C, Yao M, et al. Endometrial cancer in young women: prognostic factors and treatment outcomes in women aged ≤40 years. Int J Gynecol Cancer, 2020, 30(5): 631-639. [CrossRef]
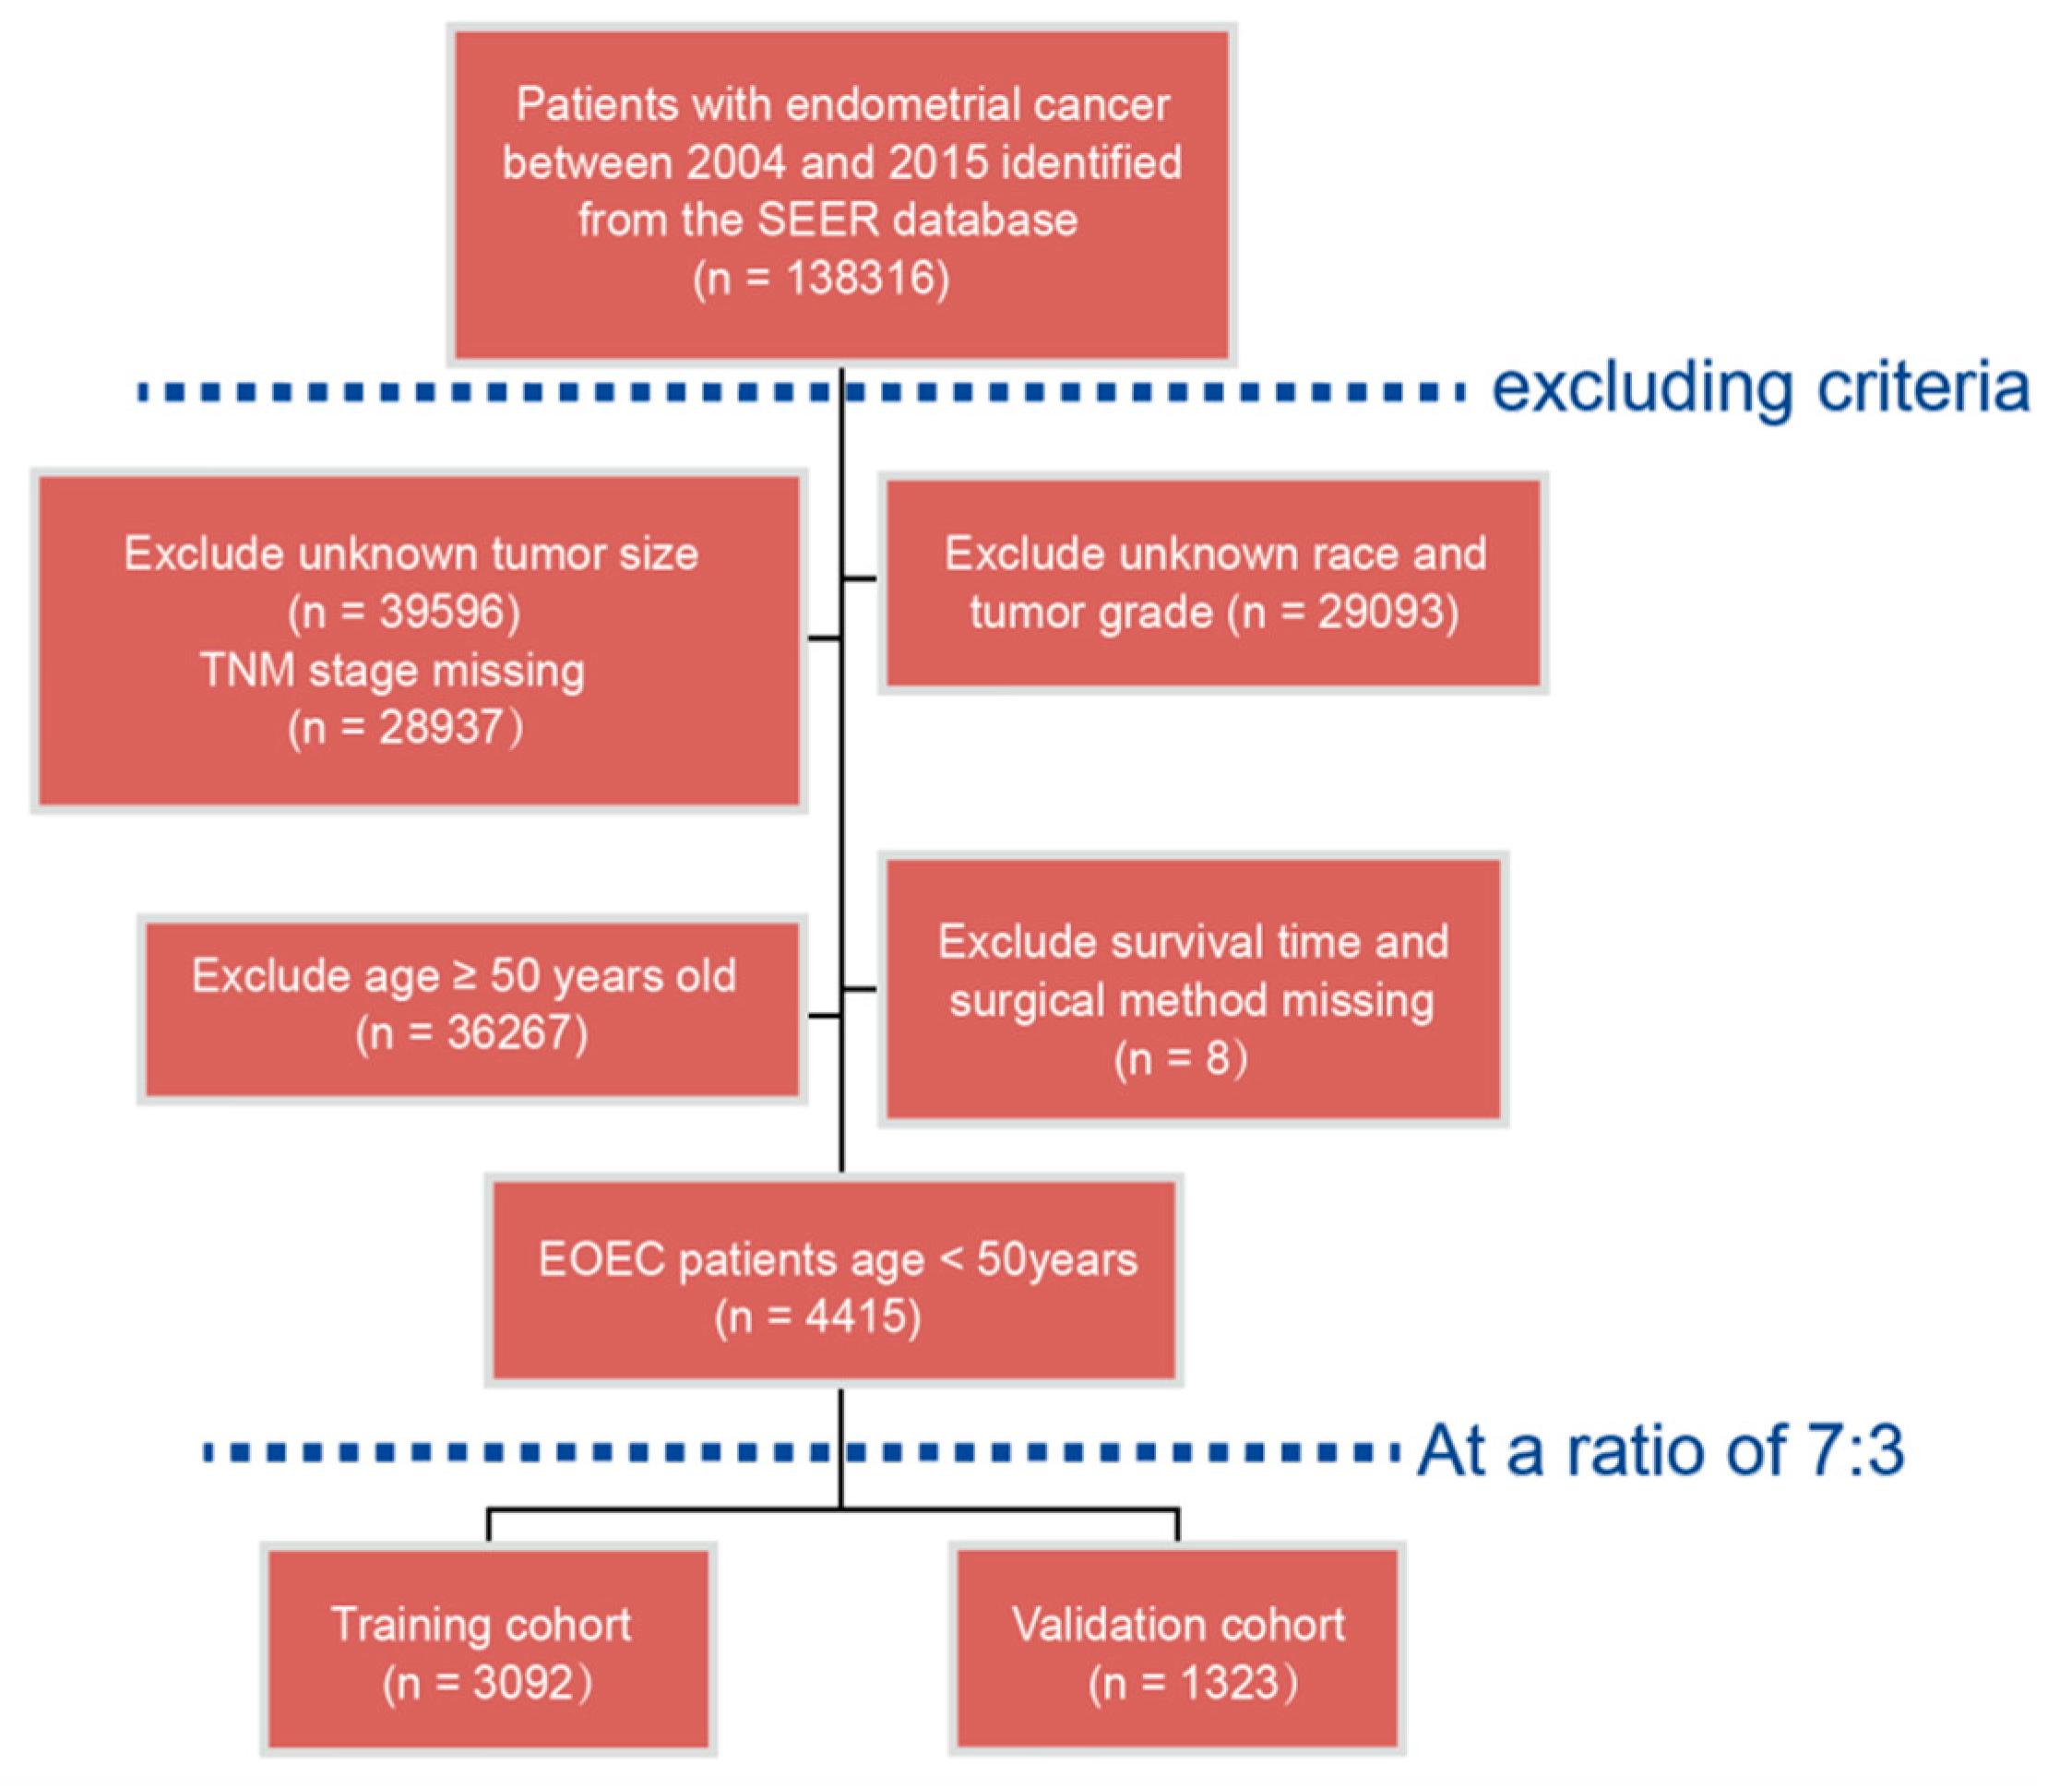
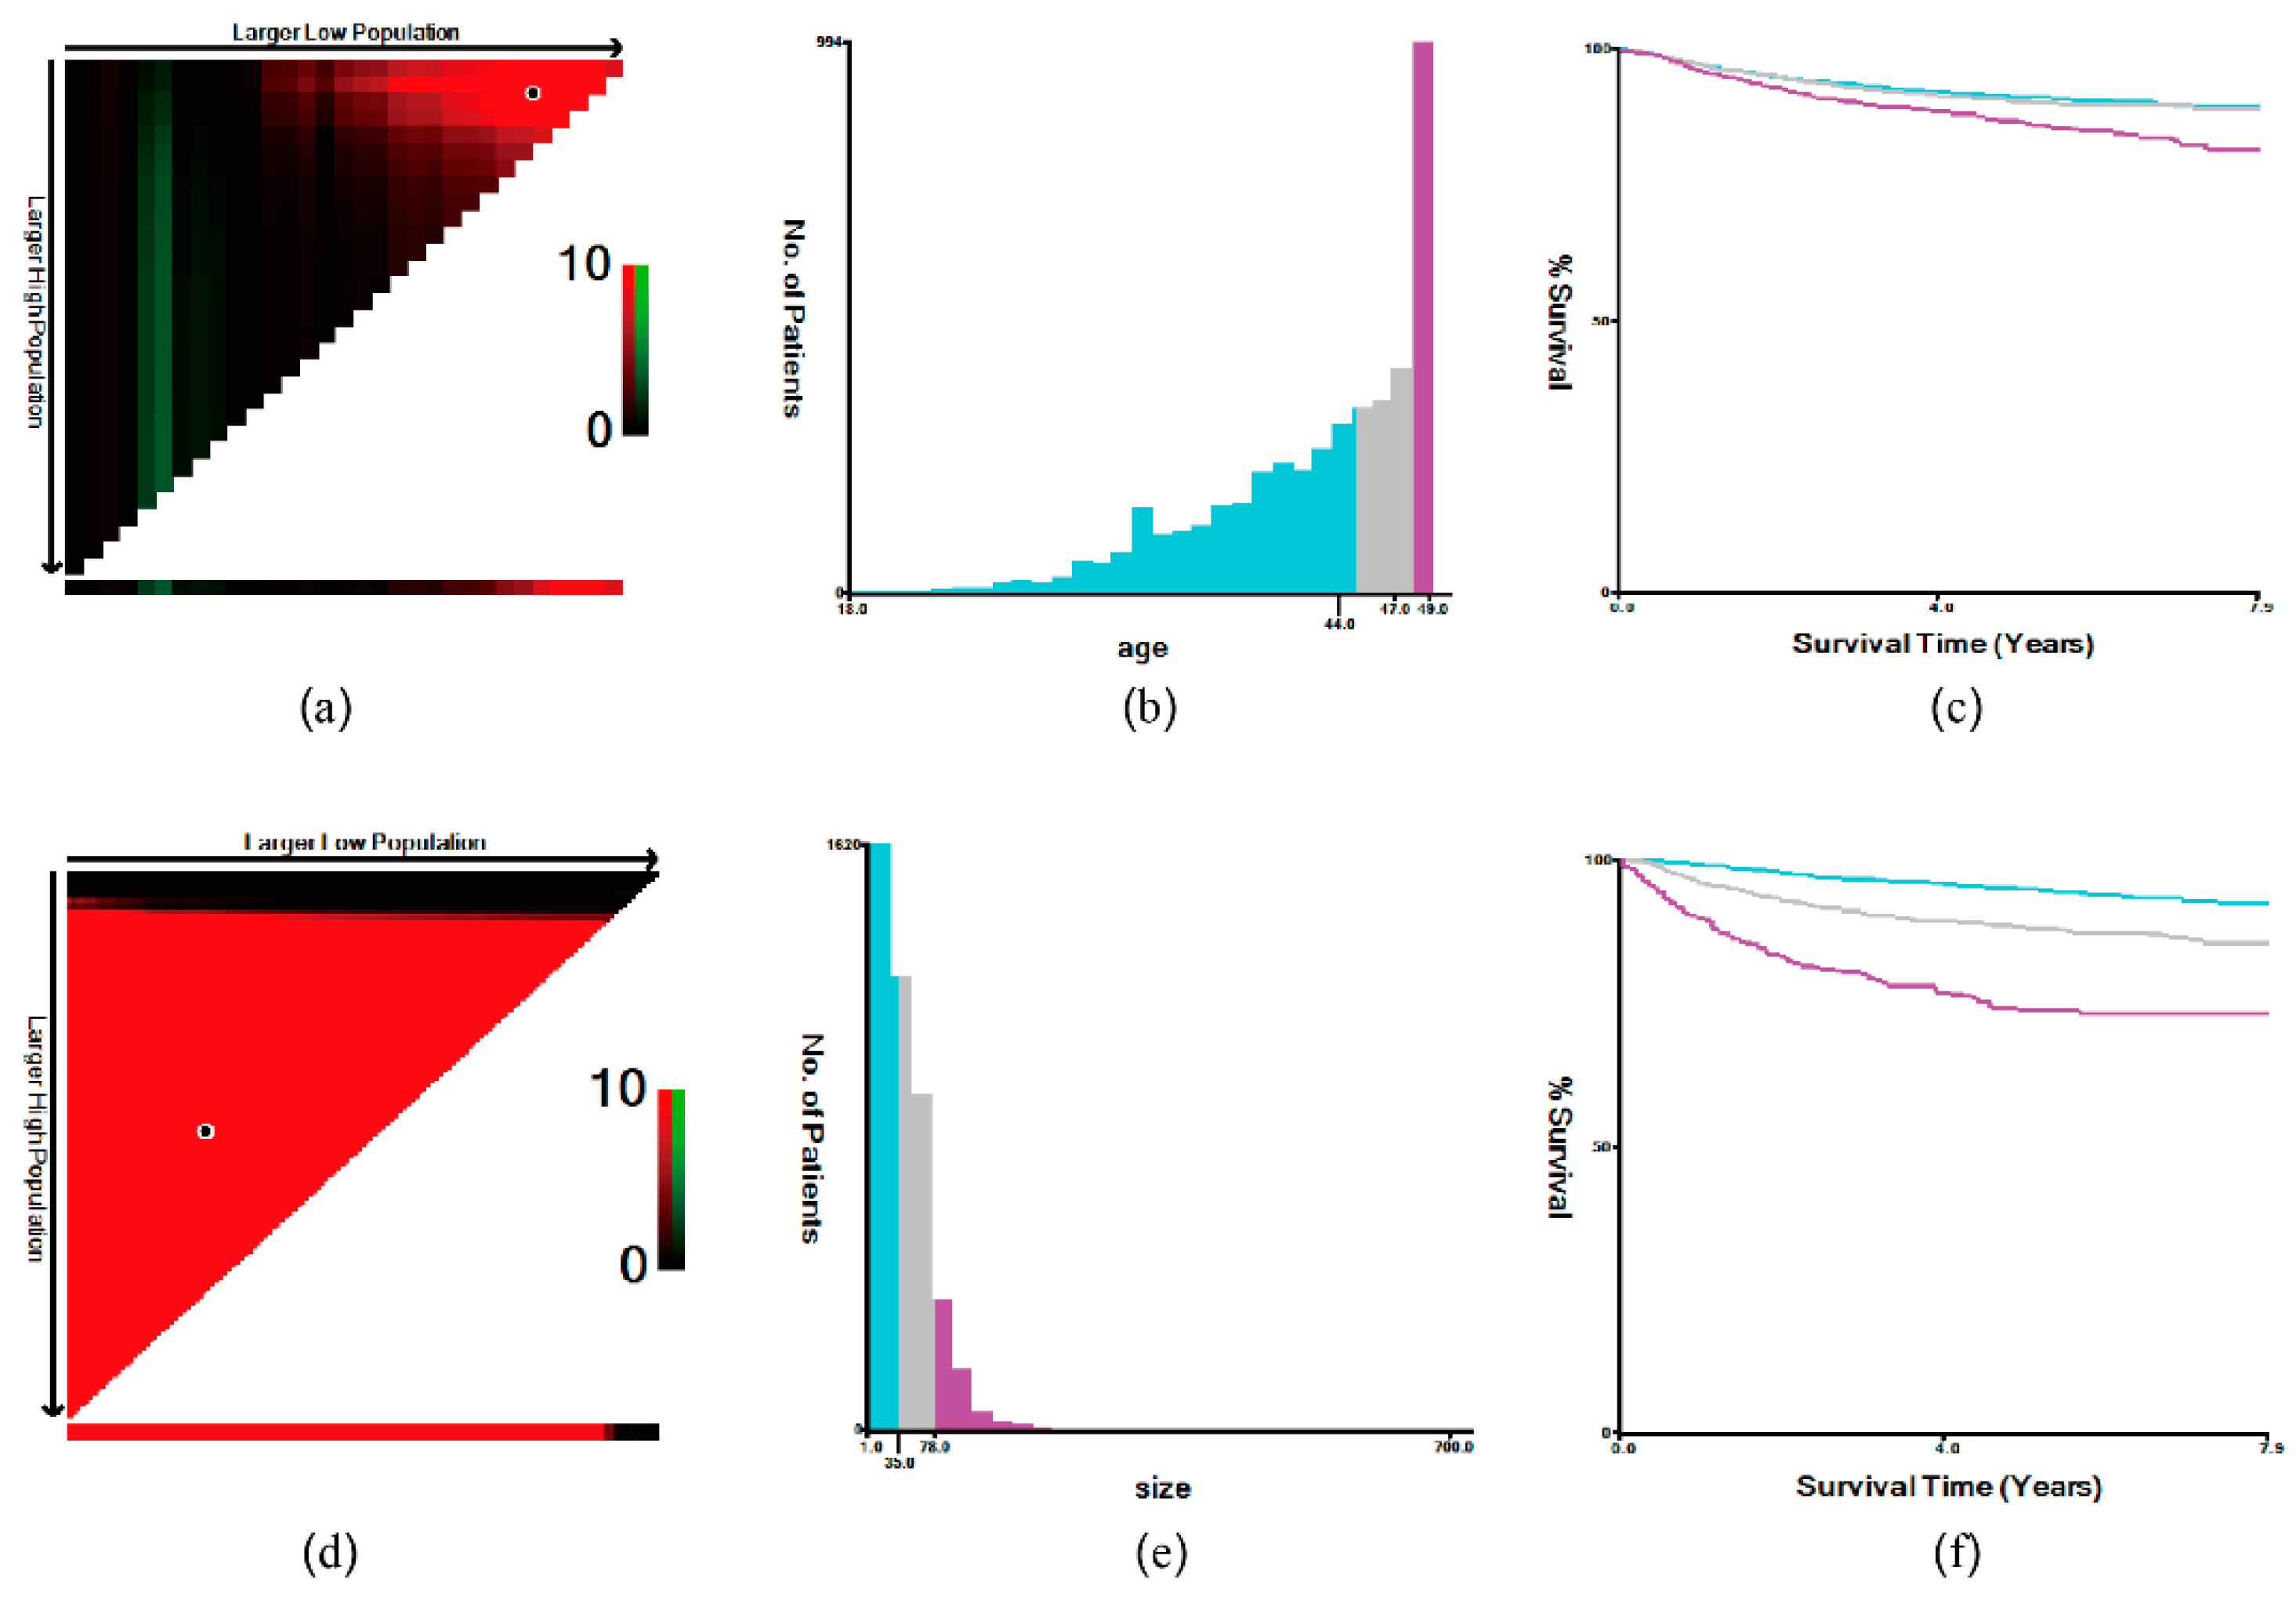
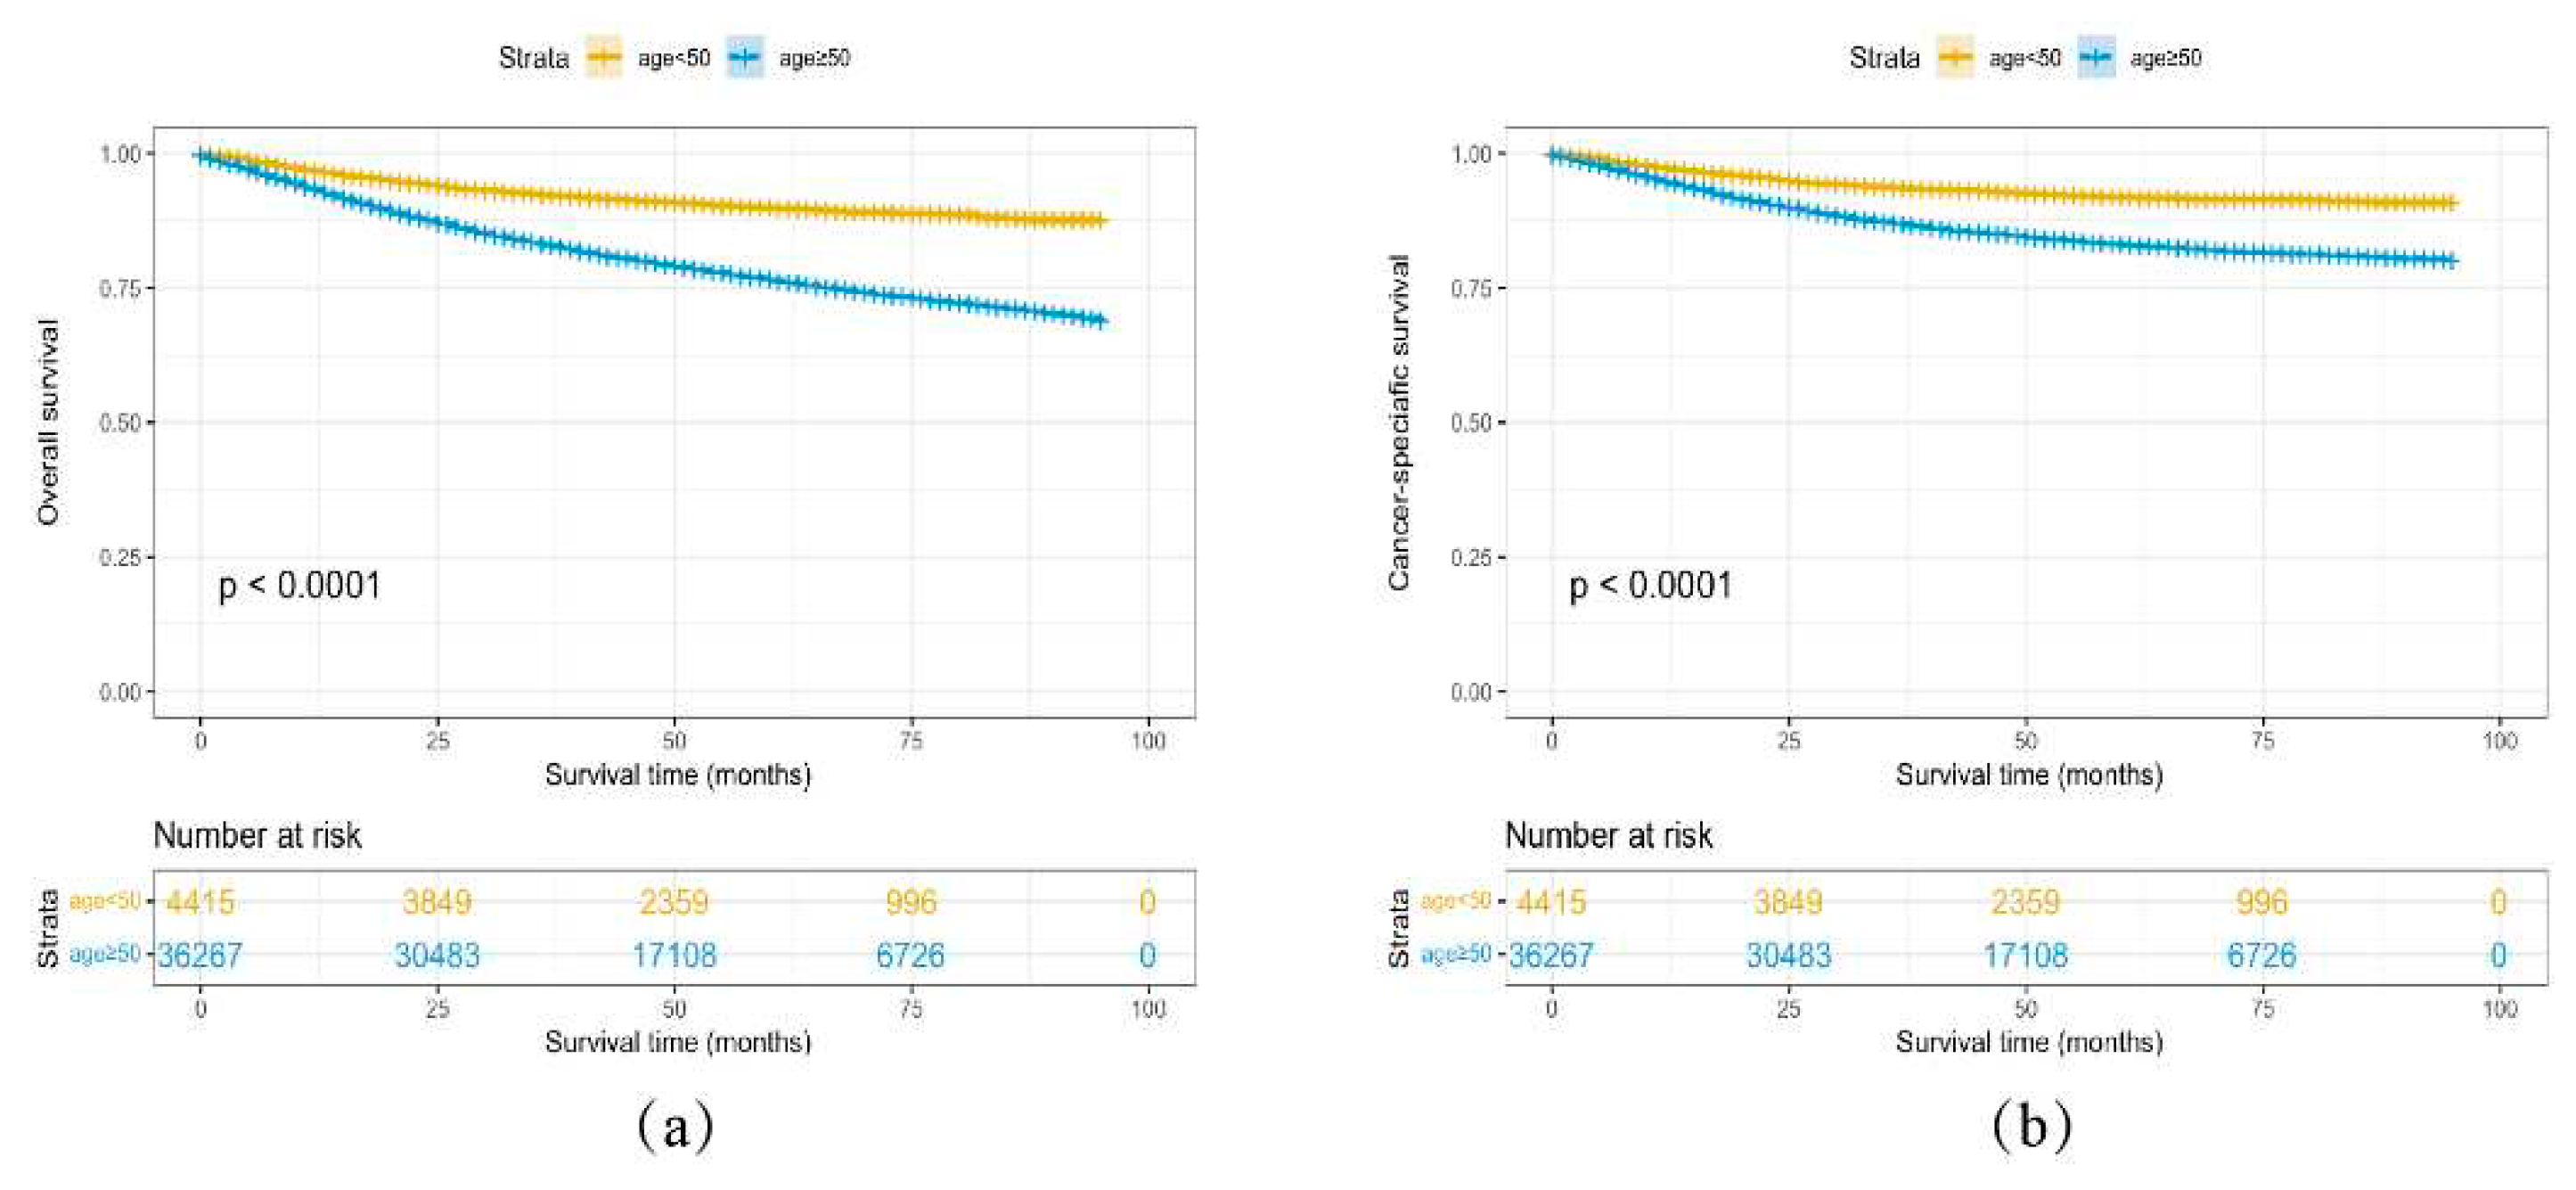
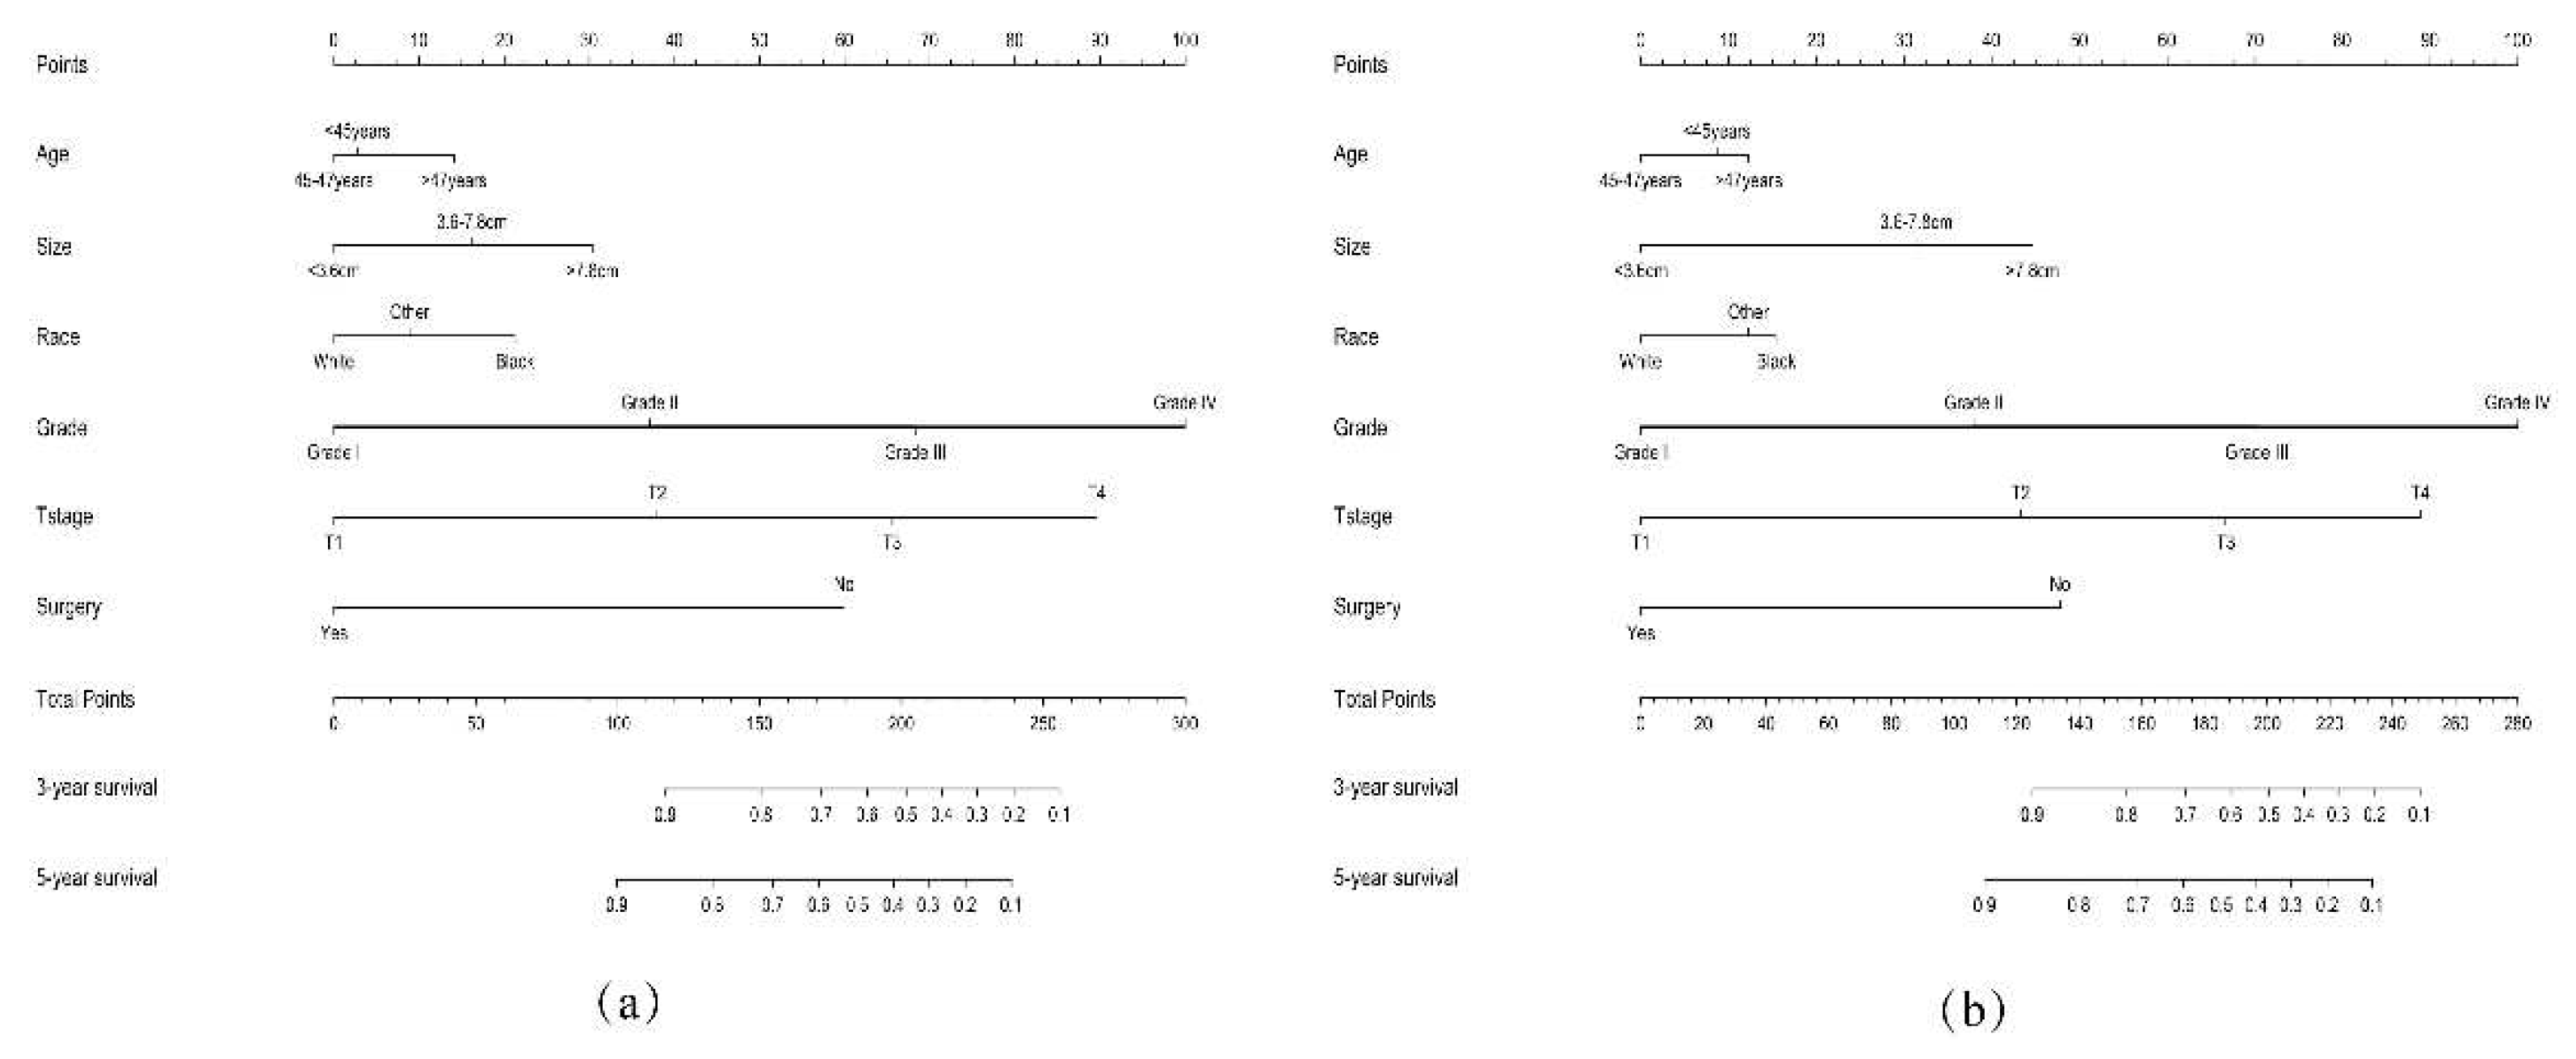
| Variables | Age < 50 years old (n = 4415) |
Age ≥ 50 years old (n = 36267) |
P value | ||
|---|---|---|---|---|---|
| n | % | n | % | ||
| Race | <0.001* | ||||
| White | 3310 | 75.0 | 29535 | 81.5 | |
| Black | 333 | 7.5 | 3451 | 9.5 | |
| Other | 772 | 17.5 | 3281 | 9.0 | |
| Grade | <0.001* | ||||
| I | 2466 | 55.9 | 14351 | 39.6 | |
| II | 1211 | 27.4 | 9980 | 27.5 | |
| III | 583 | 13.2 | 8436 | 23.3 | |
| IV | 155 | 3.5 | 3500 | 9.6 | |
| T stage | 0.018* | ||||
| T1 | 3600 | 81.5 | 29081 | 80.2 | |
| T2 | 324 | 7.3 | 2580 | 7.1 | |
| T3 | 441 | 10.1 | 4093 | 11.3 | |
| T4 | 50 | 1.1 | 513 | 1.4 | |
| N stage | <0.001* | ||||
| N0 | 4023 | 91.1 | 31958 | 88.1 | |
| N1 | 237 | 5.4 | 2526 | 7.0 | |
| N2 | 155 | 3.5 | 1783 | 4.9 | |
| M stage | 0.002* | ||||
| M0 | 4232 | 95.9 | 34359 | 94.7 | |
| M1 | 183 | 4.1 | 1908 | 5.3 | |
| Tumor size (cm) | <0.001* | ||||
| <3.6 | 1116 | 25.3 | 7815 | 21.5 | |
| 3.6-7.8 | 3027 | 68.5 | 25998 | 71.7 | |
| >7.8 | 272 | 6.2 | 2454 | 6.8 | |
| SEER stage | <0.001* | ||||
| Localized | 3232 | 73.2 | 25104 | 69.2 | |
| Regional | 978 | 22.2 | 9027 | 24.9 | |
| Distant | 205 | 4.6 | 2136 | 5.9 | |
| Surgery | 0.746 | ||||
| No | 70 | 1.6 | 552 | 1.5 | |
| Yes | 4345 | 98.4 | 35715 | 98.5 | |
| Lymphadenectomy | <0.001* | ||||
| No | 1879 | 42.6 | 11541 | 31.8 | |
| Yes | 2536 | 57.4 | 24726 | 68.2 | |
| Radiotherapy | <0.001* | ||||
| No/Unknown | 3509 | 79.5 | 25000 | 68.9 | |
| Yes | 906 | 20.5 | 11267 | 31.1 | |
| Chemotherapy | <0.001* | ||||
| No/Unknown | 3546 | 80.3 | 27602 | 76.1 | |
| Yes | 869 | 19.7 | 8665 | 23.9 | |
| Variables | No. of patients | Univariate analysis | Multivariate analysis | |
|---|---|---|---|---|
| P value | HR (95% CI) | P value | ||
| Age | <0.001* | |||
| <45 | 1624 | Ref | ||
| 45-47 | 760 | 0.99 (0.73-1.3) | 0.95 | |
| >47 | 708 | 1.4 (1.1-1.9) | 0.011* | |
| Race | <0.001* | |||
| White | 2323 | Ref | ||
| Black | 241 | 1.7 (1.2-2.4) | 0.002* | |
| Other | 528 | 1.2 (0.9-1.7) | 0.19 | |
| Grade | <0.001* | |||
| I | 1735 | Ref | ||
| II | 836 | 2.2 (1.6-3.2) | <0.001* | |
| III | 411 | 3.9 (2.6-5.7) | <0.001* | |
| IV | 110 | 7.5 (4.7-12) | <0.001* | |
| T stage | <0.001* | |||
| T1 | 2510 | Ref | ||
| T2 | 248 | 2.2 (1.3-3.6) | 0.002* | |
| T3 | 296 | 2.6 (1.6-4) | <0.001* | |
| T4 | 38 | 2.8 (1.4-5.7) | 0.004* | |
| N stage | <0.001* | |||
| N0 | 2812 | Ref | ||
| N1 | 170 | 1.2 (0.83-1.7) | 0.35 | |
| N2 | 110 | 1.3 (0.88-1.9) | 0.19 | |
| M stage | <0.001* | |||
| M0 | 2962 | Ref | ||
| M1 | 130 | 2.4 (0.86-6.6) | 0.096 | |
| Tumor size (cm) | <0.001* | |||
| <3.6 | 778 | Ref | ||
| 3.6-7.8 | 2124 | 1.4 (0.98-2.1) | 0.06 | |
| >7.8 | 190 | 1.8 (1.1-2.9) | 0.017* | |
| SEER stage | <0.001* | |||
| Localized | 2259 | Ref | ||
| Regional | 687 | 1.2 (0.74-1.9) | 0.47 | |
| Distant | 146 | 1.6 (0.5-5) | 0.44 | |
| Surgery | <0.001* | |||
| No | 47 | Ref | ||
| Yes | 3045 | 0.29 (0.17-0.49) | <0.001* | |
| Lymphadenectomy | 0.36 | – | – | |
| No | 1322 | – | – | |
| Yes | 1770 | – | – | |
| Radiotherapy | <0.001* | |||
| No/Unknown | 2451 | Ref | ||
| Yes | 641 | 0.77 (0.59-1) | 0.06 | |
| Chemotherapy | <0.001* | |||
| No/Unknown | 2489 | Ref | ||
| Yes | 603 | 1.1 (0.76-1.5) | 0.66 | |
| Variables | No. Of patients | Univariate analysis | Multivariate analysis | |
|---|---|---|---|---|
| P value | HR (95% CI) | P value | ||
| Age | 0.005* | |||
| <45 | 1624 | Ref | ||
| 45-47 | 760 | 1 (0.74-1.4) | 0.95 | |
| >47 | 708 | 1.5 (1.1-1.9) | 0.008* | |
| Race | <0.001* | |||
| White | 2323 | Ref | ||
| Black | 241 | 1.7 (1.2-2.4) | 0.001* | |
| Other | 528 | 1.2 (0.9-1.7) | 0.21 | |
| Grade | <0.001* | |||
| I | 1735 | Ref | ||
| II | 836 | 2.2 (1.6-3.2) | <0.001* | |
| III | 411 | 3.9 (2.6-5.7) | <0.001* | |
| IV | 110 | 7.6 (4.8-12) | <0.001* | |
| T stage | <0.001* | |||
| T1 | 2510 | Ref | ||
| T2 | 248 | 2.2 (1.3-3.6) | 0.002* | |
| T3 | 296 | 2.5 (1.6-4) | <0.001* | |
| T4 | 38 | 2.6 (1.3-5.4) | 0.008* | |
| N stage | <0.001* | |||
| N0 | 2812 | Ref | ||
| N1 | 170 | 1.2 (0.84-1.7) | 0.33 | |
| N2 | 110 | 1.3 (0.9-2) | 0.15 | |
| M stage | <0.001* | |||
| M0 | 2962 | Ref | ||
| M1 | 130 | 2.2 (0.79-6.3) | 0.13 | |
| Tumor size (cm) | <0.001* | |||
| <3.6 | 778 | Ref | ||
| 3.6-7.8 | 2124 | 1.5 (1-2.1) | 0.048* | |
| >7.8 | 190 | 1.8 (1.1-3) | 0.017 | |
| SEER stage | <0.001* | |||
| Localized | 2259 | Ref | ||
| Regional | 687 | 1.2 (0.73-1.9) | 0.49 | |
| Distant | 146 | 1.7 (0.53-5.4) | 0.38 | |
| Surgery | <0.001* | |||
| No | 47 | Ref | ||
| Yes | 3045 | 0.28 (0.17-0.48) | <0.001* | |
| Lymphadenectomy | 0.23 | – | ||
| No | 1322 | – | ||
| Yes | 1770 | – | ||
| Radiotherapy | <0.001* | |||
| No/Unknown | 2451 | Ref | ||
| Yes | 641 | 0.78 (0.59-1) | 0.071 | |
| Chemotherapy | <0.001* | |||
| No/Unknown | 2489 | Ref | ||
| Yes | 603 | 1.1 (0.75-1.5) | 0.73 | |
| Risk stratification systems | Training set | Validation set | ||
|---|---|---|---|---|
| C-index | 95% CI | C-index | 95% CI | |
| AJCC TNM stage | 0.772 | (0.743-0.801) | 0.766 | (0.720-0.813) |
| SEER stage | 0.758 | (0.729-0.787) | 0.773 | (0.730- 0.816) |
| Nomogram model | 0.828 | (0.801-0.855) | 0.844 | (0.809-0.879) |
| Risk stratification systems | Training set | Validation set | ||
|---|---|---|---|---|
| C-index | 95% CI | C-index | 95% CI | |
| AJCC TNM stage | 0.770 | (0.741- 0.799) | 0.837 | (0.792-0.882) |
| SEER stage | 0.756 | (0.727-0.785) | 0.826 | (0.783-0.869) |
| Nomogram model | 0.827 | (0.800-0.854) | 0.889 | (0.854-0.924) |
Disclaimer/Publisher’s Note: The statements, opinions and data contained in all publications are solely those of the individual author(s) and contributor(s) and not of MDPI and/or the editor(s). MDPI and/or the editor(s) disclaim responsibility for any injury to people or property resulting from any ideas, methods, instructions or products referred to in the content. |
© 2023 by the authors. Licensee MDPI, Basel, Switzerland. This article is an open access article distributed under the terms and conditions of the Creative Commons Attribution (CC BY) license (http://creativecommons.org/licenses/by/4.0/).


