Introduction
A complex object in an image, itcannot be described if the Euclidian Geometry is used, which is based on suchregular objects as cubes, cylinders, cones, etc. Hausdorff (2) it introduced amethod to measure the dimension of complex objects through a real value,although it presented certain difficulty in the practices. However Mandelbrot(2) in 1983 it defined a method to which I call Fractal Dimension (FD) that isnot but that the space that occupies a fractal set. This groups containself-similar elements that are independent of scale. The natural images arecomposed by self-similar elements, then, all natural image can be considered asa fractal set. Investigators have used the FD for many applications:quantification of noises (3), segmentation of images (4,5), analysis oftextures (6), recognition of patterns (7), biometrics (8), ecology (9), cancerdetection (10) and tomography (11).
In the field of the biology we canfind a great variety of systems that develop rough or irregular interfaces,being the but important the growth tumoral. The form of the profile of thetumor allows us to classify and to study the tumor type according to itsgeometry and dynamics, as well as it has been observed that the form of thecontour gives a valuable indication of the dynamic behavior of the tumor (12).Kikuchi (13) it showed that the surface of an adenocarcinoma endometrialpossesses a structure fractal, and that the FD differs chord to thehistological grade. In Lee’s work (14), the FD allowed to differ among scalycells, carcinoma and adenocarcinoma of the lung. Vasiljevic (15) it showed thatthe parameters of the analysis multifractal are significantly different amongthree groups of malignancy (renal, mammaries, lungs) that produce metastasis inthe bones, discovering a new potential application to detect primary tumors inpatient with cancer metastasis of unknown origin.
The works mentioned previouslypossess as denominator common images, which are processed by differentalgorithms to obtain encouraging results and to offer a better one diagnosethis way to patient. This work seeks to show some general results in the environmentof the Digital Prosecution of Medical Images, through the application oftechnical and methods sustained in the FG, to what is denominated FractalAnalysis (FA).
Fractal Geometry
The word fractal derives ofLatin fractus that means broken. It was given to know for the scientificB. Mandelbrot in the year 1975, to describe complex objects that presented apeculiar property to infinite scales (1). Each object fractal can be divided inparts but small, each one of those which is similar to the complete object,either in way: exact, almost-exact or statistic- exact. It is this propertydefinig for this objects, and it is denominated self - similarity. Mandelbrotshowed that the form of building these objects is through functions recursivesor iteratives. Two classic examples are: the flake of snow of Koch (it
Figure 1
) and the Triangle ofSierpinsky (it
Figure 2
).(1)
Figure 1.
Flake of Snow of Koch.
Figure 1.
Flake of Snow of Koch.
Figure 2.
Triangle of Sierpinsky.
Figure 2.
Triangle of Sierpinsky.
We can characterize the objectsfractales quantitatively using the concept of Fractal Dimension (FD). Todetermine the FD of an object, a standard unit of measure is used. To measurethe longitude of a segment, we will use the unit of having measured
,
for thetotal longitude of the segment L, then:
where N is the number of units that are needed to cover the segment.
If we needed to cover a surface, we would use as standard measure a side square
, for that that the surface it would be given for:
In a similar way it would be calculated for a volume,
and in general,
where
is the dimension topological of the object.
Clearing
in (4) we obtain:
The equation (5) we will write it as:
and we will call Fractal Dimension to
.
Fractal Analysis
The Fractal Analysis (FA), in one of their branches, tries to characterize objects through the FD. Reason of interest and of wide investigations they are the images, in particular the medical images (MI).
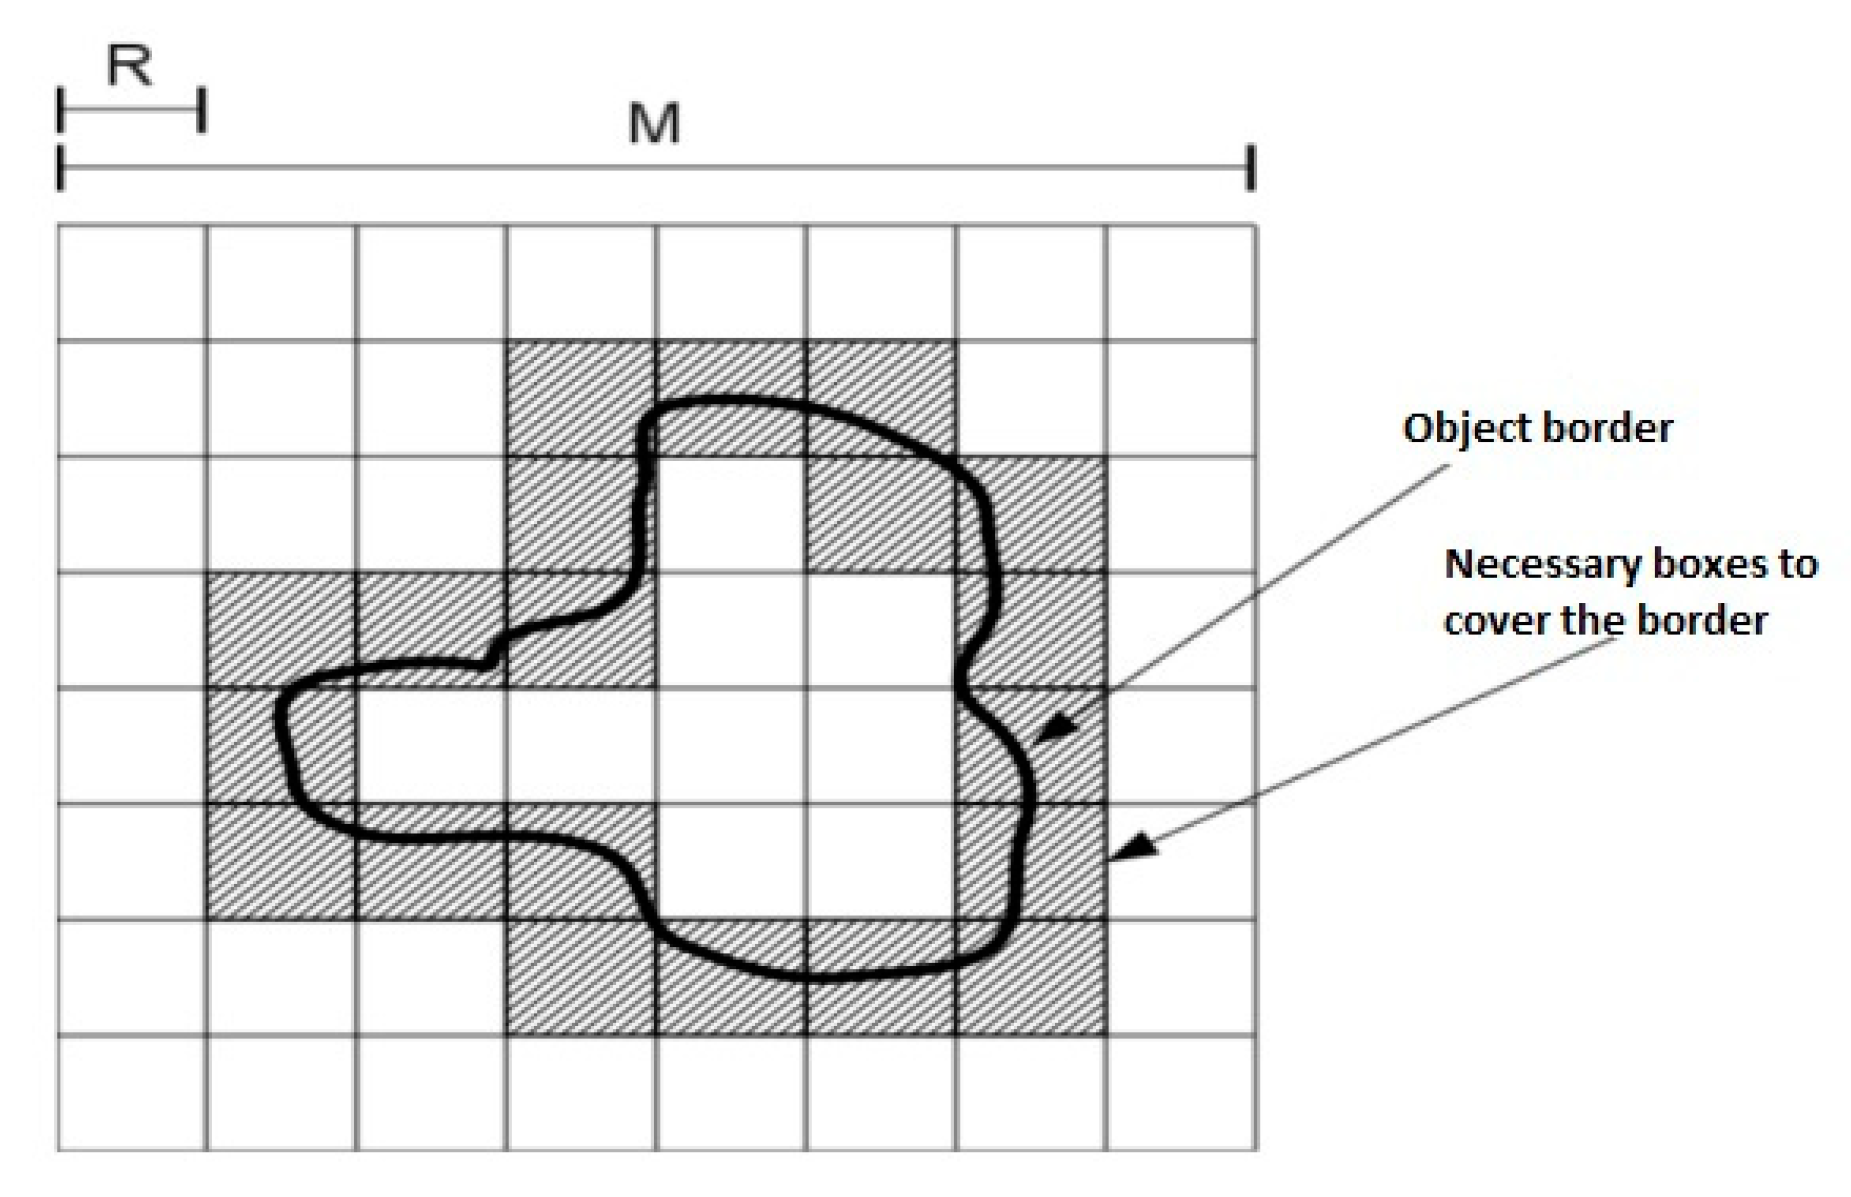
One in the ways but common of calculating the FD it has more than enough images, for their simple implementation, it is the Method Box Counting (16) (BC). BC takes an image of
, where
, and it segments the image in size windows
and it counts the quantity of windows that they cover the object,
, like it is shown in the Figura 4. Then FD is calculated as:
where
.
Figure 4.
Method BC. In this case they are necessary 20 boxes to cover the whole border of the object.
Figure 4.
Method BC. In this case they are necessary 20 boxes to cover the whole border of the object.
Quantifcation of Structural Heterogeneity Using Fractal Analysis(17).
The wicked tumors possess a heterogeneous structure, that which is recognized as one of the main problems in the propagation of the cancer and in the quimio-resistance (18,19, 20). The evaluation of the texture of fabrics allows the detection and estimate of the homogeneity of the tumors in medical images, which cannot be predicted for the human eye (21). Previous works have demonstrated that the heterogeneity of the structure of the tumors this correlated with the answer to the treatment in cancer of: head, neck, esophagus, lung and renal, in patients evaluated with images of tomography (TC) (22).
In this work, use of the software ImageJ is made (National Institutes of Health, available in http://rsb.info.nih.gov/ij) and the plugin FracLac (available in http://rsb.info.nih.gov/ij/plugins/fraclac/FLHelp/Introduction.htm).
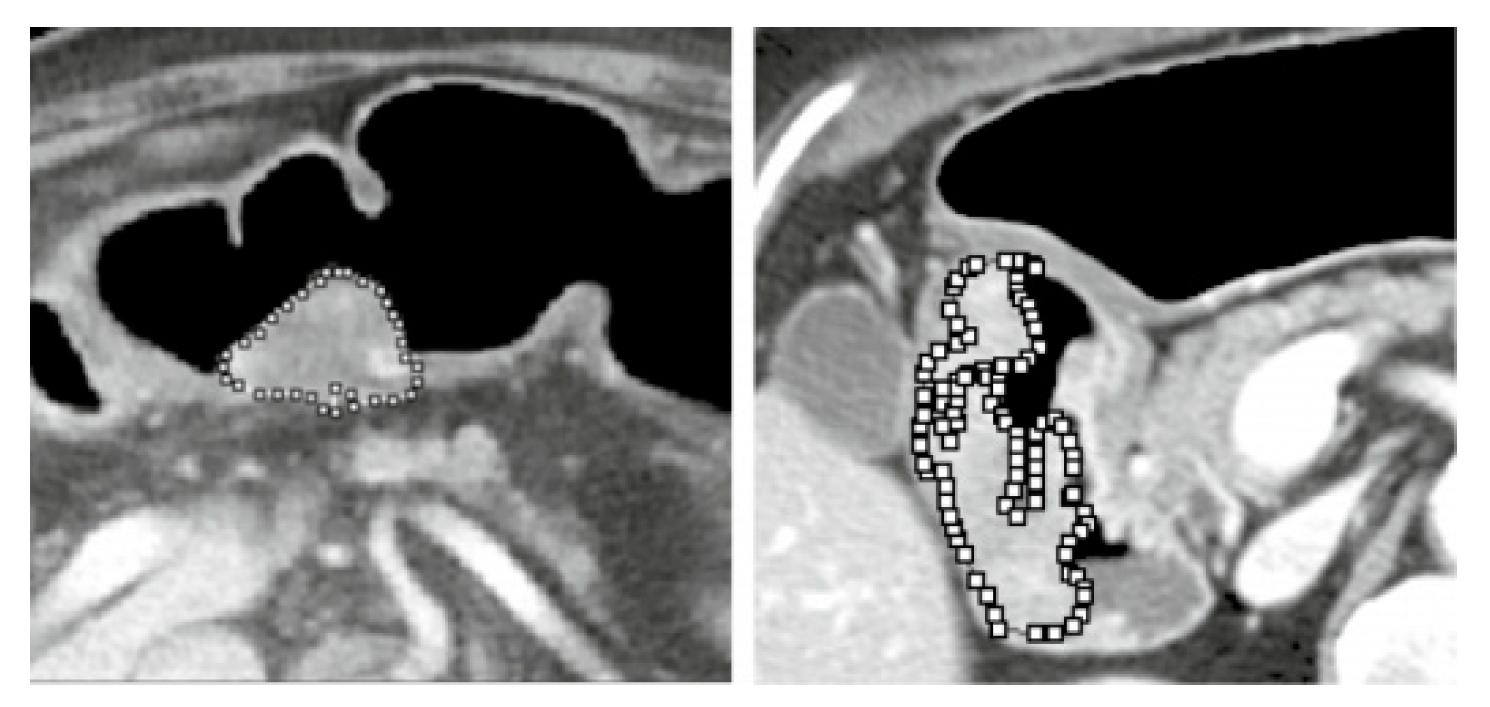
Using the software, the Method is applied BC it has more than enough images in scales of gray of 8-bit, to calculate the FD and to use it like a measure of heterogeneity or complexity. The region of interest (RDI) of the tumor it was selected manually by an observer (H.W, 3 years of experience in interpretation of abdominal TC), and supervised by a gastroenterologist (K.H, 14 years of experience in interpretation of abdominal TC). A partial result of a sample in the
Figure 5.
Figure 5.
To the left tumor of Type I; to the right Tumor of Type III.
Figure 5.
To the left tumor of Type I; to the right Tumor of Type III.
This study is the first report that it could demonstrate an impact in the I diagnose of the stomach cancer making use of the Fractal Analysis it has more than enough images TC, since it demonstrates that a high value of FD of a tumor, this significantly associated to the progression of this tumor, bearing to a worsening of the illness.
Use Of The Methods Of Segmentation C-Means, K-Means And Fractal Geometry In The Study In Alive Of the Cancer Of Lung (12).
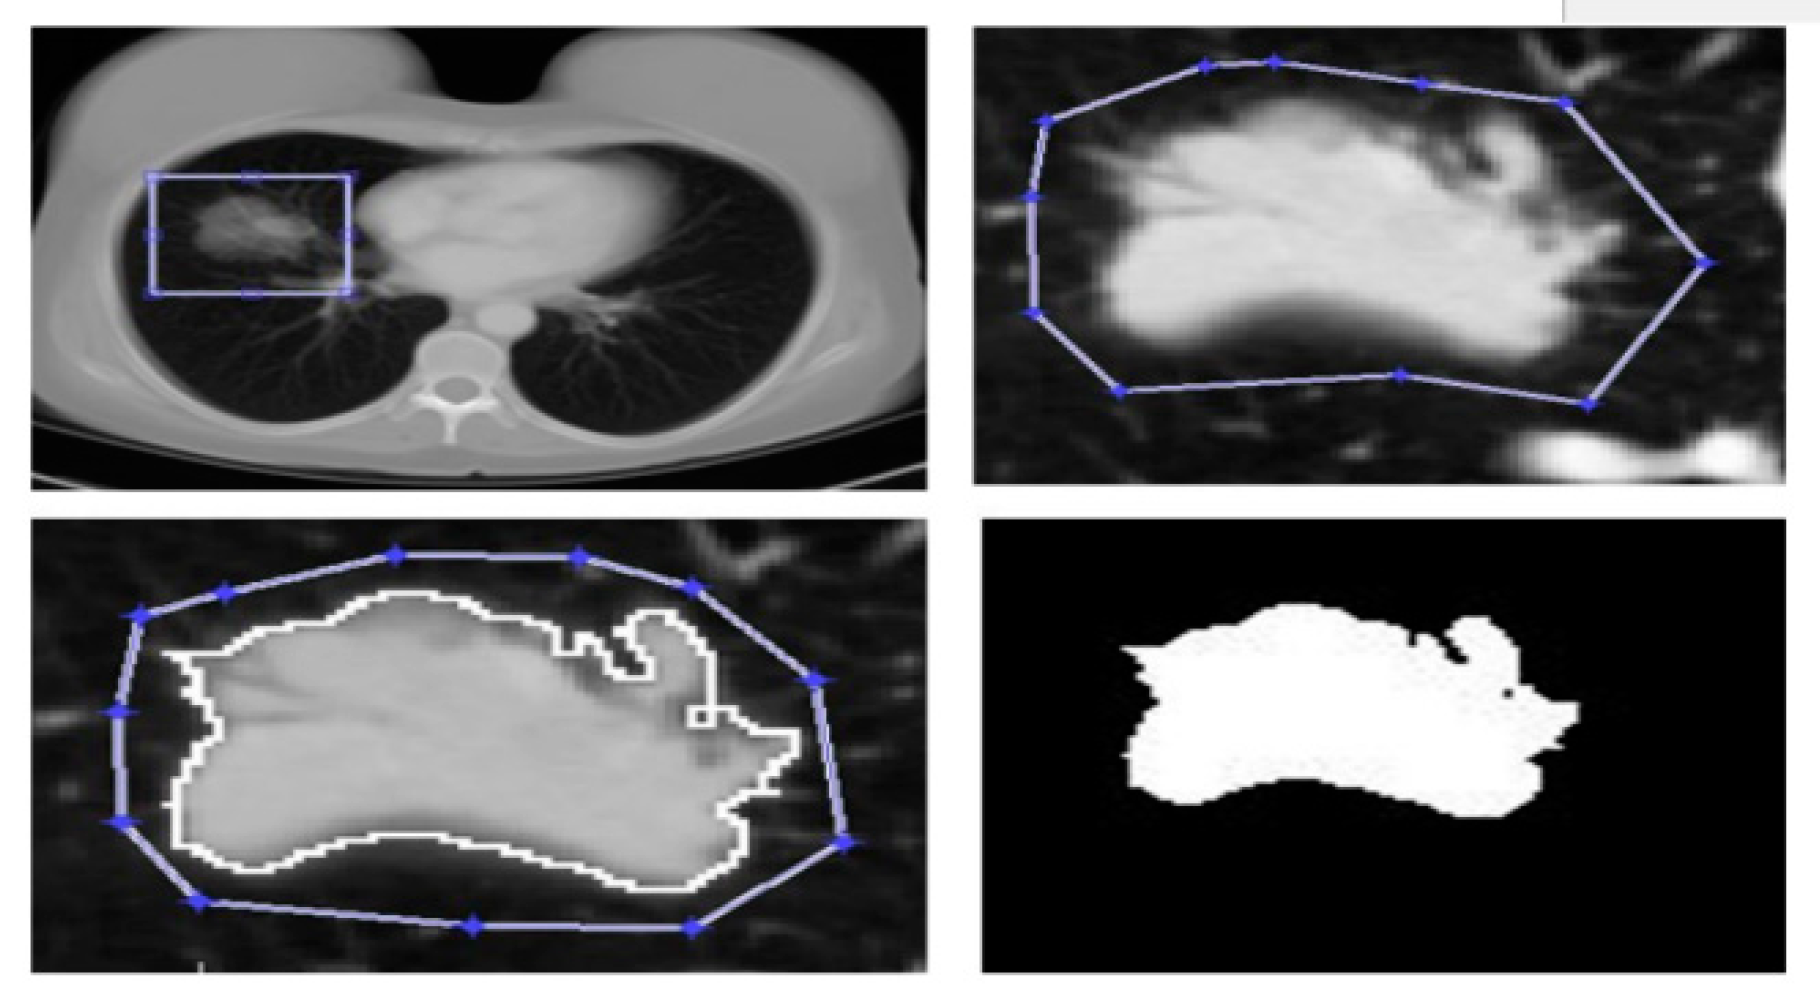
The FA applied to the lesions of lung tumors (e.g.,
Figure 6) it has allowed the quantitative characterization of fabrics, the classification of the tumors and the quantification of the changes in the vascularization associated to the pathologies of the cancer.
Figure 6.
Representation of the four steps that were made to have the segmentation finally cuts to court of the images TC of each tumor.
Figure 6.
Representation of the four steps that were made to have the segmentation finally cuts to court of the images TC of each tumor.
In this work, the growth of lung tumors in alive has been characterized by the analysis scaling, using data of TC. The cases that consist on different types of tumors, as the lung adenocarcinomas, non small cells and healthy fabric in lung, were analyzed keeping in mind the morphology of the interface of the tumor - guest to calculate their geometric dimensions, that is to say, the FD and the exponent criticize of local ruggedness . As it was expected, the complexity of the tumor-guest’s interface increases as the lesion becomes but aggressive, a fact that is reflected in the exponents of local ruggedness. Also, in the Chart #1 are observed that each one of the stadiums in you become cancerous them of lung they have very marked differences.
Chart #1.
Tumors of Lung. Interface of the tumor - host characterized by the FD, determined by the method BC, and the exponent of local ruggedness
Chart #1.
Tumors of Lung. Interface of the tumor - host characterized by the FD, determined by the method BC, and the exponent of local ruggedness
| Type |
|
|
|
|
|
|
|
|
|
|
|
|
|
|
Although the complex dynamics of the growth tumoral requires a deep and extensive analysis to describe them appropriately, the dimension of the fractal capacity has demonstrated to be a fine and effective describer to establish differences among the properties of the fabric through the transition from the normal fabric to the neoplasic, what makes it appropriate to incorporate it in clinical protocols and decisions prescribes.
Fractal Analysis of nets microvasculars in human retinas (23).
In this work, a total of 10 images of the retina of the human eye has been examined, obtained of the database of images STARE (Structured Analysis of the Retina), available in
http://www.ces.clemson.edu/A.Hoover/stare, that they correspond to patient with some pathology. The images were taken with a specialized camera for the capture of pictures of retinas TopCon it marks TRV-50 to 35 FOV and digitized to a resolution of 700x605 pixels. In this database, they are three groups, two of them segmented by two different observers in a manual way and a third segmented group using the algorithm proposed by A. Hoover and collaborators (24). In the
Figure 7 an image of the database is shown.
Figure 7.
Image im0001 for a patient with antecedents of diabetic retinopatia. original image; b) image in binary; c) segmented image.
Figure 7.
Image im0001 for a patient with antecedents of diabetic retinopatia. original image; b) image in binary; c) segmented image.
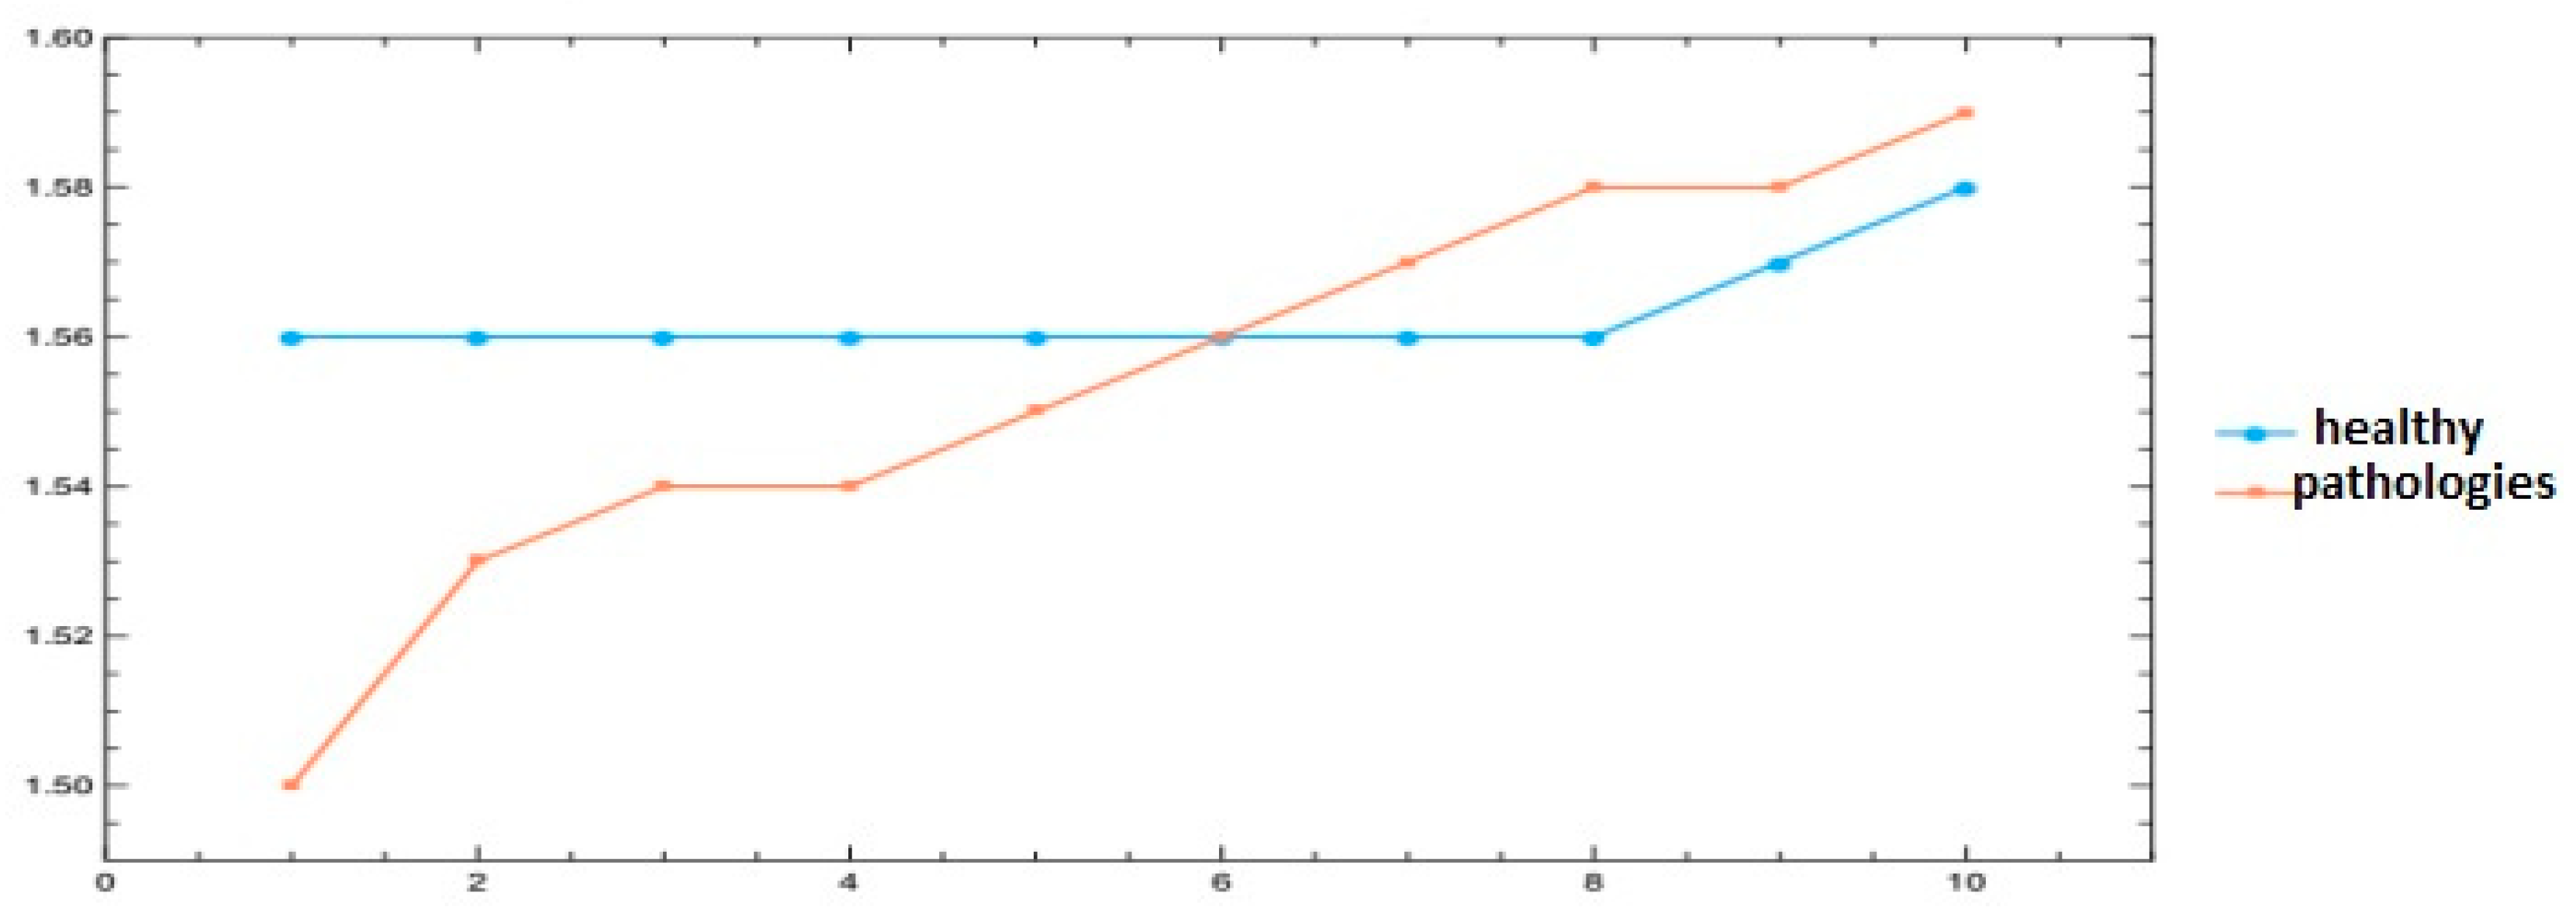
In a previous study presented by Santiago - Cortes and collaborators (25), the dimension fractal is analyzed for a groups of images of 10 healthy patients’ retina, with the same segmentation technique and the same characteristic in the I calculate of the dimension fractal carried out work presently. To the results of patient healthy (25), with those obtained for patient with some pathology, it is observed that the values of dimension fractal present a less fluctuating behavior in patient healthy that those observed in the patients with pathology. The graph of the values average in upward order for patient healthy and with pathologies it is observed in the
Figure 8.
Figure 8.
Dimension fractal average of the retinas of patient healthy of patient healthy reported by Santiago - Cortes and collaborators (25) and patient with pathologies reported in this work.
Figure 8.
Dimension fractal average of the retinas of patient healthy of patient healthy reported by Santiago - Cortes and collaborators (25) and patient with pathologies reported in this work.
So that a method of I diagnose it is efficient from the clinical point of view, it is necessary that this it provides elements that allow to carry out a process of early discrimination of the normal condition (including the biological variability) of the condition already with a pathology, besides showing high sensibility and appropriate specificity. As a result of this investigation, it was obtained that the value average of the FD of the vascular system of the retina in patient with pathologies is of 1,55 ± 0,05. When quantifying the FD of the vascular system of the retina, it is not possible to identify a characteristic pattern that allows to distinguish with clarity the different pathologies, however, if allows to differ among patient healthy and sick. Finally you concludes that the use of the analysis of the FD has a great potential in the evaluation clinical non invasive of the human retina and offers clear advantages, but its interpretation this limited one to only value that you cannot use in the detection and quantification of some pathology in the retina.
Characterization of Border Structure Using Fractal Dimension in Melanomas(26).
Melanoma is the type of skin cancer but common inside the Caucasian population. If early is detected big possibilities they exist of eliminating it completely and that the patient recovers satisfactorily. Their identification is possible thanks to characteristic distinctive that differentiate them of the moles. Nevertheless, certain difficulty exists to recognize these characteristics, even for a trained dermatologist. It is this one of the reasons of the development of on-line applications that allow the attendance to the specialists to make an I diagnose early and but I specify of a Melanoma.
One of the characteristics that a Melanoma of a common mole differs, is the irregularity of its border, which can be quantified with the help of the FD. The key of the process of detection of the border of the Melanoma, this in being able to differ between the mole and the skin in an image anyone, I process the one that is known as segmentation. After the segmentation process, the FD is calculated, like it is shown in the
Figure 9.
Figure 9.
Border detection for: (a) Lunar normal, (b) Melanoma.
Figure 9.
Border detection for: (a) Lunar normal, (b) Melanoma.
And their respective FD calculated by the method BC: (c) Lunar normal, (d) Melanoma.
As a result of the carried out tests, it was obtained that the algorithm developed computational possesses a success to detect Melanomas of the one 87%, and to detect Lunar normal a success of the one 83%. You concludes that the automatic classification of Melanomas is possible, that that not this exempt of risks. Nevertheless the risk of the one 13% it could be paid with the attendance of a specialist in Dermatology.
Conclusiones
The application of the Fractal Analysis to the Digital Prosecution of Images Prescribes it is of great utility for the medical community, since allows to make an diagnose but I specify of the different pathologies and of its possible evolution in the time, being in less treatments or but aggressive as they are the cases, what would propitiate an increase of the effectiveness of the treatment and for ende in the quality and hope of the patients’ life.
References
- Panigrahy, C.; Seal, A.; Mahato, N.K. Quantitative texture measurement of gray-scale images: Fractal dimension using an improved differential box counting method. Measurement 2019, 147, 106859. [Google Scholar] [CrossRef]
- Grizzi, F.; Castello, A.; Qehajaj, D.; Russo, C.; Lopci, E. The Complexity and Fractal Geometry of Nuclear Medicine Images. Mol. Imaging Biol. 2019, 21, 401–409. [Google Scholar] [CrossRef] [PubMed]
- Khobragade, P.; Fan, J.; Rupcich, F.; Crotty, D.J.; Schmidt, T.G. Application of fractal dimension for quantifying noise texture in computed tomography images. Med Phys. 2018, 45, 3563–3573. [Google Scholar] [CrossRef] [PubMed]
- Chaudhuri, B.; Sarkar, N. Texture segmentation using fractal dimension. IEEE Trans. Pattern Anal. Mach. Intell. 1995, 17, 72–77. [Google Scholar] [CrossRef]
- Keller, J.M.; Chen, S.; Crownover, R.M. Texture description and segmentation through fractal geometry. Comput. Vision, Graph. Image Process. 1989, 45, 150–166. [Google Scholar] [CrossRef]
- Backes, A.R.; Bruno, O.M. Texture analysis using volume-radius fractal dimension. Appl. Math. Comput. 2013, 219, 5870–5875. [Google Scholar] [CrossRef]
- Neil, G.; Curtis, K. Shape recognition using fractal geometry. Pattern Recognit. 1997, 30, 1957–1969. [Google Scholar] [CrossRef]
- L. Yu, D. L. Yu, D. Zhang, K. Wang, W. Yang, Coarse iris classification using box-bounting to estimate fractal dimensions, Pattern Recogn. 38 (11) (2005) 1791–1798.
- Sugihara, G.; May, R.M. Applications of fractals in ecology. Trends Ecol. Evol. 1990, 5, 79–86. [Google Scholar] [CrossRef] [PubMed]
- Bhandari, S.; Choudannavar, S.; Avery, E.R.; Sahay, P.; Pradhan, P. Detection of colon cancer stages via fractal dimension analysis of optical transmission imaging of tissue microarrays (TMA). Biomed. Phys. Eng. Express 2018, 4, 065020. [Google Scholar] [CrossRef]
- Y. Xu, Z. Y. Xu, Z. Ruijing, M. Shuo, Y. Xincong, W. Fenglai, Fractal dimension of concrete meso-structure based on x-ray computed tomography, Powder Technol. 350 (2019) 91–99.
- Rivero Borja, Mario Andres, and Jose Eduardo Escobar Martinez. “Uso de los métodos de segmentación c-means, k-means y geometría fractal en el estudio in vivo del cáncer de pulmón.” (2020).
- Kikuchi, A.; Kozuma, S.; Yasugi, T.; Taketani, Y. Fractal Analysis of Surface Growth Patterns in Endometrioid Endometrial Adenocarcinoma. Gynecol. Obstet. Investig. 2004, 58, 61–67. [Google Scholar] [CrossRef] [PubMed]
- Lee, L.H.; Tambasco, M.; Otsuka, S.; Wright, A.; Klimowicz, A.; Petrillo, S.; Morris, D.; Magliocco, A.; Bebb, D.G. Digital differentiation of non-small cell carcinomas of the lung by the fractal dimension of their epithelial architecture. Micron 2014, 67, 125–131. [Google Scholar] [CrossRef] [PubMed]
- Vasiljevic, J.; Reljin, B.; Sopta, J.; Mijucic, V.; Tulic, G.; Reljin, I. Application of multifractal analysis on microscopic images in the classification of metastatic bone disease. Biomed. Microdevices 2012, 14, 541–548. [Google Scholar] [CrossRef] [PubMed]
- Konatar, I.; Popovic, T.; Popovic, N. Box-Counting Method in Python for Fractal Analysis of Biomedical Images. 2020 24th International Conference on Information Technology (IT). pp. 1–4.
- Watanabe, H.; Hayano, K.; Ohira, G.; Imanishi, S.; Hanaoka, T.; Hirata, A.; Kano, M.; Matsubara, H. Quantification of Structural Heterogeneity Using Fractal Analysis of Contrast-Enhanced CT Image to Predict Survival in Gastric Cancer Patients. Dig. Dis. Sci. 2020, 66, 1–6. [Google Scholar] [CrossRef] [PubMed]
- Durrett, R.; Foo, J.; Leder, K.; Mayberry, J.; Michor, F. Intratumor Heterogeneity in Evolutionary Models of Tumor Progression. Genetics 2011, 188, 461–477. [Google Scholar] [CrossRef] [PubMed]
- Pries, A.R.; Cornelissen, A.J.M.; Sloot, A.A.; Hinkeldey, M.; Dreher, M.R.; Höpfner, M.; Dewhirst, M.W.; Secomb, T.W. Structural Adaptation and Heterogeneity of Normal and Tumor Microvascular Networks. PLOS Comput. Biol. 2009, 5, e1000394. [Google Scholar] [CrossRef] [PubMed]
- Gillies RJ, Schornack PA, Secomb TW, Raghunand N. Causes and efects of heterogeneous perfusion in tumors. Neoplasia. (1999);1:197–207.
- Kurata, Y.; Hayano, K.; Ohira, G.; Narushima, K.; Aoyagi, T.; Matsubara, H. Fractal analysis of contrast-enhanced CT images for preoperative prediction of malignant potential of gastrointestinal stromal tumor. Abdom. Imaging 2018, 43, 2659–2664. [Google Scholar] [CrossRef] [PubMed]
- Hayano, K.; Kulkarni, N.M.; Duda, D.G.; Heist, R.S.; Sahani, D.V. Exploration of Imaging Biomarkers for Predicting Survival of Patients With Advanced Non–Small Cell Lung Cancer Treated With Antiangiogenic Chemotherapy. Am. J. Roentgenol. 2016, 206, 987–993. [Google Scholar] [CrossRef] [PubMed]
- Santiago-Cortes, E., J. L. Martınes-Ledesma, and D. A. Mantilla. “Análisis fractal de redes microvasculares en retinas humanas.” Journal de Ciencia e Ingeniería 12.1 (2020): 230-242.
- Hoover, A.; Kouznetsova, V.; Goldbaum, M. Locating blood vessels in retinal images by piecewise threshold probing of a matched filter response. IEEE Trans. Med Imaging 2000, 19, 203–210. [Google Scholar] [CrossRef] [PubMed]
- E. Santiago-Cortés and J. M. Ledezma, “Dimensión fractal en retinas humanas,” Journal de Ciencia en Ingeniería, (2016), vol. 8, no. 1, pp. 59–65.
- Carbonetto, S. H. , and S. E. Lew. “Characterization of border structure using fractal dimension in melanomas.” 2010 Annual International Conference of the IEEE Engineering in Medicine and Biology. IEEE, 2010.
- Vázquez Domínguez, Minerva Guadalupe. Estudio de dimensión fractal, entropía y análisis de datos para mamografías con microcalcificación o tumor. BS thesis. 2020.
- Brun, Rene, and Fons Rademakers. “ROOT—An object oriented data analysis framework.” Nuclear Instruments and Methods in Physics Research Section A: Accelerators, Spectrometers, Detectors and Associated Equipment 389.1-2 (1997): 81-86.
|
Disclaimer/Publisher’s Note: The statements, opinions and data contained in all publications are solely those of the individual author(s) and contributor(s) and not of MDPI and/or the editor(s). MDPI and/or the editor(s) disclaim responsibility for any injury to people or property resulting from any ideas, methods, instructions or products referred to in the content. |
© 2023 by the authors. Licensee MDPI, Basel, Switzerland. This article is an open access article distributed under the terms and conditions of the Creative Commons Attribution (CC BY) license (http://creativecommons.org/licenses/by/4.0/).


