Preprint
Article

Microwave Irradiation: Effects of Particle Size Distribution, Rheological and Fluorescent Characteristic of Red Wine

Altmetrics

Downloads

95

Views

28

Comments

0

Submitted:

12 October 2023

Posted:

12 October 2023

You are already at the latest version

Alerts
Abstract
In this paper, the effects on the rheological properties, particle size distribution, and fluorescence properties of red wine were investigated under microwave irradiation, and the mechanism of the effects of microwave irradiation on the sensory properties of red wine was discussed. The results showed that the effect of microwave on the rheological properties in red wine could be fitted by the Power-law model and Carson model, through the analysis of the rheological constants, yield stress, and viscosity coefficient of wine, it was found that microwave treatment could improve leg phenomenon and thickening effect by the change of rheological properties; the particle size distribution in wine indicated that microwave irradiation did change the particle size distribution through friction effect and oxidative polymerization, resulting in the wine’s visual effect and mouthfeel; the wine quality could be improved by enhancing the fluorescence intensity under different microwave conditions, which meant that microwave technology could speed up the formation of fluorescent substances, such as the polymerization of flavan-3-ols. In conclusion, microwave treatment could modify the sensory characteristics of wine, and further provide the theoretical basis for the application of microwave in winemaking.
Keywords: 
Subject: Engineering  -   Other

1. Introduction

The sensory characteristics of red wine was one of the important indexes to measure the quality of red wine, which directly affected the quality of red wine [1]. The drinking quality of fresh wine is poor, tastes raw, astringent, and rough. Consumers preferred aged red wines that were stable in colour, rich in aroma, and soft in taste [2]. Aging of oak barrels was traditional aging technology for more than 2,000 years [3]. However, several disadvantages of oak barrels for wine aging should be taken into account, such as time-consuming, costly, labor-intensive, large number of oak barrels employed, and potentially undesirable microbial contamination [4]. Therefore, to overcome the above shortcomings, some ageing technologies has also been developed to produce higher quality wine in a short aging time, these technologies included micro-oxygenation, ultrasonic waves, high pressure, electric fields, gamma rays, and nanogold photocatalysis [5,6]. These methods aimed to speed up reactions between the compounds in wine to produce a stable solution similar to a naturally aged wine for many years. Due to the characteristics of a relatively low-cost, high efficiency, shorter processing time, and pasteurisation [7], microwave technology has been widely applied in winery. The application of microwave technology in wine quality improvement was reported in many literatures [1,8]. Recently, our research group also conducted a series of studies about the effects on the change of the physicochemical and colour characteristics of wine after microwave treatment [9,10], the changes of main phenolic compounds induced by microwave [11], 1-hydroxyethyl free radical in red wine induced by microwave [12], the change of properties and activities of PPO in grape maceration solution under microwave irradiation [13], the influence on the production of xanthylium cation pigments [14], reduction of higher alcohols content in wine [15]. All these results suggested that microwave irradiation definitely altered some of the properties in red wine, but these studies focused on the changes of chemical compounds of red wine.
The visual effect and mouthfeel were key indexes to evaluating red wine quality, which played an important role in the consumers’ enjoyment of red wine [16]. Previous studies have shown that microwaves could change the sensory properties of red wine to a certain extent. As was well known, the rheological properties, particle size distribution, and fluorescence spectra were related to sensory properties of wine. To our knowledge, the effects of microwave irradiation on the physical properties of wine were rarely reported, that is to say, how did the microwave influence the wine’s physical properties, leading to the changes in sensory characteristics. In this paper, the effects of microwave treatment on the rheological properties, particle size distributions, fluorescence spectra, and mechanism of fluorescence change of the red wine were investigated to explore the mechanism of the effect of microwave on the sensory characteristics of red wine.

2. Materials and Methods

2.1. Materials and Reagents

The red wine with 12% (v/v) alcohol content in 2021 throughout the experiment was provided by Kaiyuan Winery (Luoyang, Henan Province, China) from Cabernet Sauvignon grapes. (+)-Catechin was purchased from Zhiyuan Chemical Reagent Co., Ltd. (Tianjin, China); methanol and 3,4-dihydroxybenzoic acid were purchased from Deen Chemical Reagent Co., Ltd. (Tianjin, China); all other chemical reagents were analytical grades.

2.2. Microwave Treatment

The CMCC-MI system was used for microwave treatment on red wine samples [11]. For each experiment set, 50 mL of red wine was placed in a 100 mL two layers cylindrical cup, then put it in the same position of microwave chamber. The single-factor experimental design was adopted, and the microwave power was set at 100, 200, 300, 400, 500 W, and the other working conditions were fixed at 3 min and 30±1.5 °C; microwave temperature was set at 20, 30, 40, 50, 60 °C, the other working conditions were fixed at 300 W, 3 min; microwave time was set at 1, 2, 3, 4, 5 min, the other working conditions were fixed at 300 W and 30±1.5 °C. Each sample was repeated three times.

2.3. Determination of Particle size Distribution

The red wine samples were accurately diluted 500 times with 12% ethanol,then filtered with 0.22 μm organic filter membrane, and performed using a nanoparticle size and zeta potential analyzer (BeNano 90 Zeta, Dandong BetterSize Instrument Co., Ltd., China). The refractive index of the sample was 1.52, the material absorptivity was 0.1, the refractive index of water as a dispersion medium was 1.333. The detection angle was 90°, the balancing time was 120 s, and the number of sub-tests was 60. All infused wine samples were automatically tested at intervals set. The data about the particle size distribution was output.

2.4. Determination of Rheological Properties

Use DHR 2 rheometer (TA instruments-Waters LLC, American) to measure the rheological behavior of untreated and microwave-treated red wine. The plate (diameter 40 mm) was used for testing, the distance was 1 mm, and the shear rate of the measuring system was gradually increased from 10 s-1 to 1000 s-1 at 25 ℃. The relationship between shear rate (γ) and shear stress (τ) could be obtained. Drawing τ versus γ, then Power-law linear regression was performed to get the n value:
τ=K·γn
In the Power-law model, the unit of τ is Pa, the unit of γ is s-1, n is the rheological constant, and K is the viscosity coefficient with the unit of Pa·sn.
Casson's equation was used to perform linear regression to obtain the values of τ0 and K:
τ = τ 0 + K · γ
In the Casson model, the unit of τ is Pa, τ0 is the yield stress (Pa), the unit of γ is s-1, and the unit of K is Pa·sn.

2.5. Fluorescence Spectroscopy

Endogenous fluorescence spectroscopy was determined according to the method with slight modification [17]. The untreated red wine and different microwave conditions treated red wines were scanned for fluorescence spectra with Cary Eclipse Fluorescence Spectrophotometer (Agilent Technologies, Palo Alto, CA, USA). 12% (v/v) ethanol solution was used as blank control, the excitation wavelength was 340 nm, and the wavelength range was 350-650 nm. For sample measurement, the red wine samples were diluted (1:10) in 12% (v/v) ethanol solution because the fluorescence quenching phenomenon occurred when red wine was the higher concentration [18].

2.6. Determination of Total Flavan-3-ols Content

Determination of total flavan-3-ols in red wine used p-(dimethylamino)cinamaldehyde (p-DMACA) method [19]. Took 1 mL red wine sample and put it into 10 mL test tube, added 0.2 mL glycerol and 5 mL p-DMACA reagent, the volume set to 10 mL with methanol. After 7 min, the absorbance value was measured at 640 nm against blank methanol. The p-DMACA reagent was prepared before use, containing 1% (w/v) p-DMACA and 2.4 mol/L hydrochloric acid. (+)-Catechin was used as a standard for the calibration curve, and the results were expressed as mg/mL of flavan-3-ols equivalents.

2.7. Statistical Treatment of Data

Origin 2018 software for chart drawing. All the data were expressed as means ± standard deviation (SD) of three replications

3. Results

3.1. Effects of Microwave Irradiation on the Particle Size Distribution in Red Wine

3.1.1. Microwave Power on Particle Size Distribution

The particle size distribution of red wine without treatment and under different microwave power was shown in Figure 1, from which it could be seen that different microwave power did affect the particle size distribution of red wine. In general, the particle size distribution of all red wine samples was in three intervals, that was 0.3-0.5 nm, 0.5-1.0 nm, and 1.0-2.0 nm, among which 0.3-0.5 nm took the largest proportion. With the change in microwave power, the particle size distribution changed because of the different energy intensity transmitted from microwave irradiation. As the increasing of microwave power, the proportion of particle size of 0.3-0.5 nm also increased gradually, and the proportion of particle size of 0.5-1.0 nm and 1.0-2.0 nm decreased gradually, the particle size distribution at 1.0-2.0 nm even disappeared from 300 W to 500 W. This might be due to the increase of microwave intensity in unit space, so the thermal motion of polar molecules enhanced, resulting in a rapid rise of thermal energy [20], so the motion and friction of polar molecules under high-frequency electromagnetic fields were enhanced, small particles from big particles were increased through the fracture of intermolecular covalent or noncovalent bonds, and the free radicals were caused by weak hydrogen bond breaks of molecular dipoles [21]. The result showed that the more big particles degraded to small particles at higher microwave power, due to the friction between polar molecules enhanced at higher power. The intensity of free radicals increased with the increase of microwave power [12], which was consistent with the increasing trend of small particles proportion. In other words, the change in the particle sizes distribution was caused by different microwave power, and a series of free radicals chain reactions among the components and rheological properties of red wine were caused by different microwave power. The L* value of red wine could be increased with microwave technology [9], which could be explained that microwave technology made the particle size distribution more uniform and improved the clarity of red wine.

3.1.2. Microwave Temperature on Particle Size Distribution

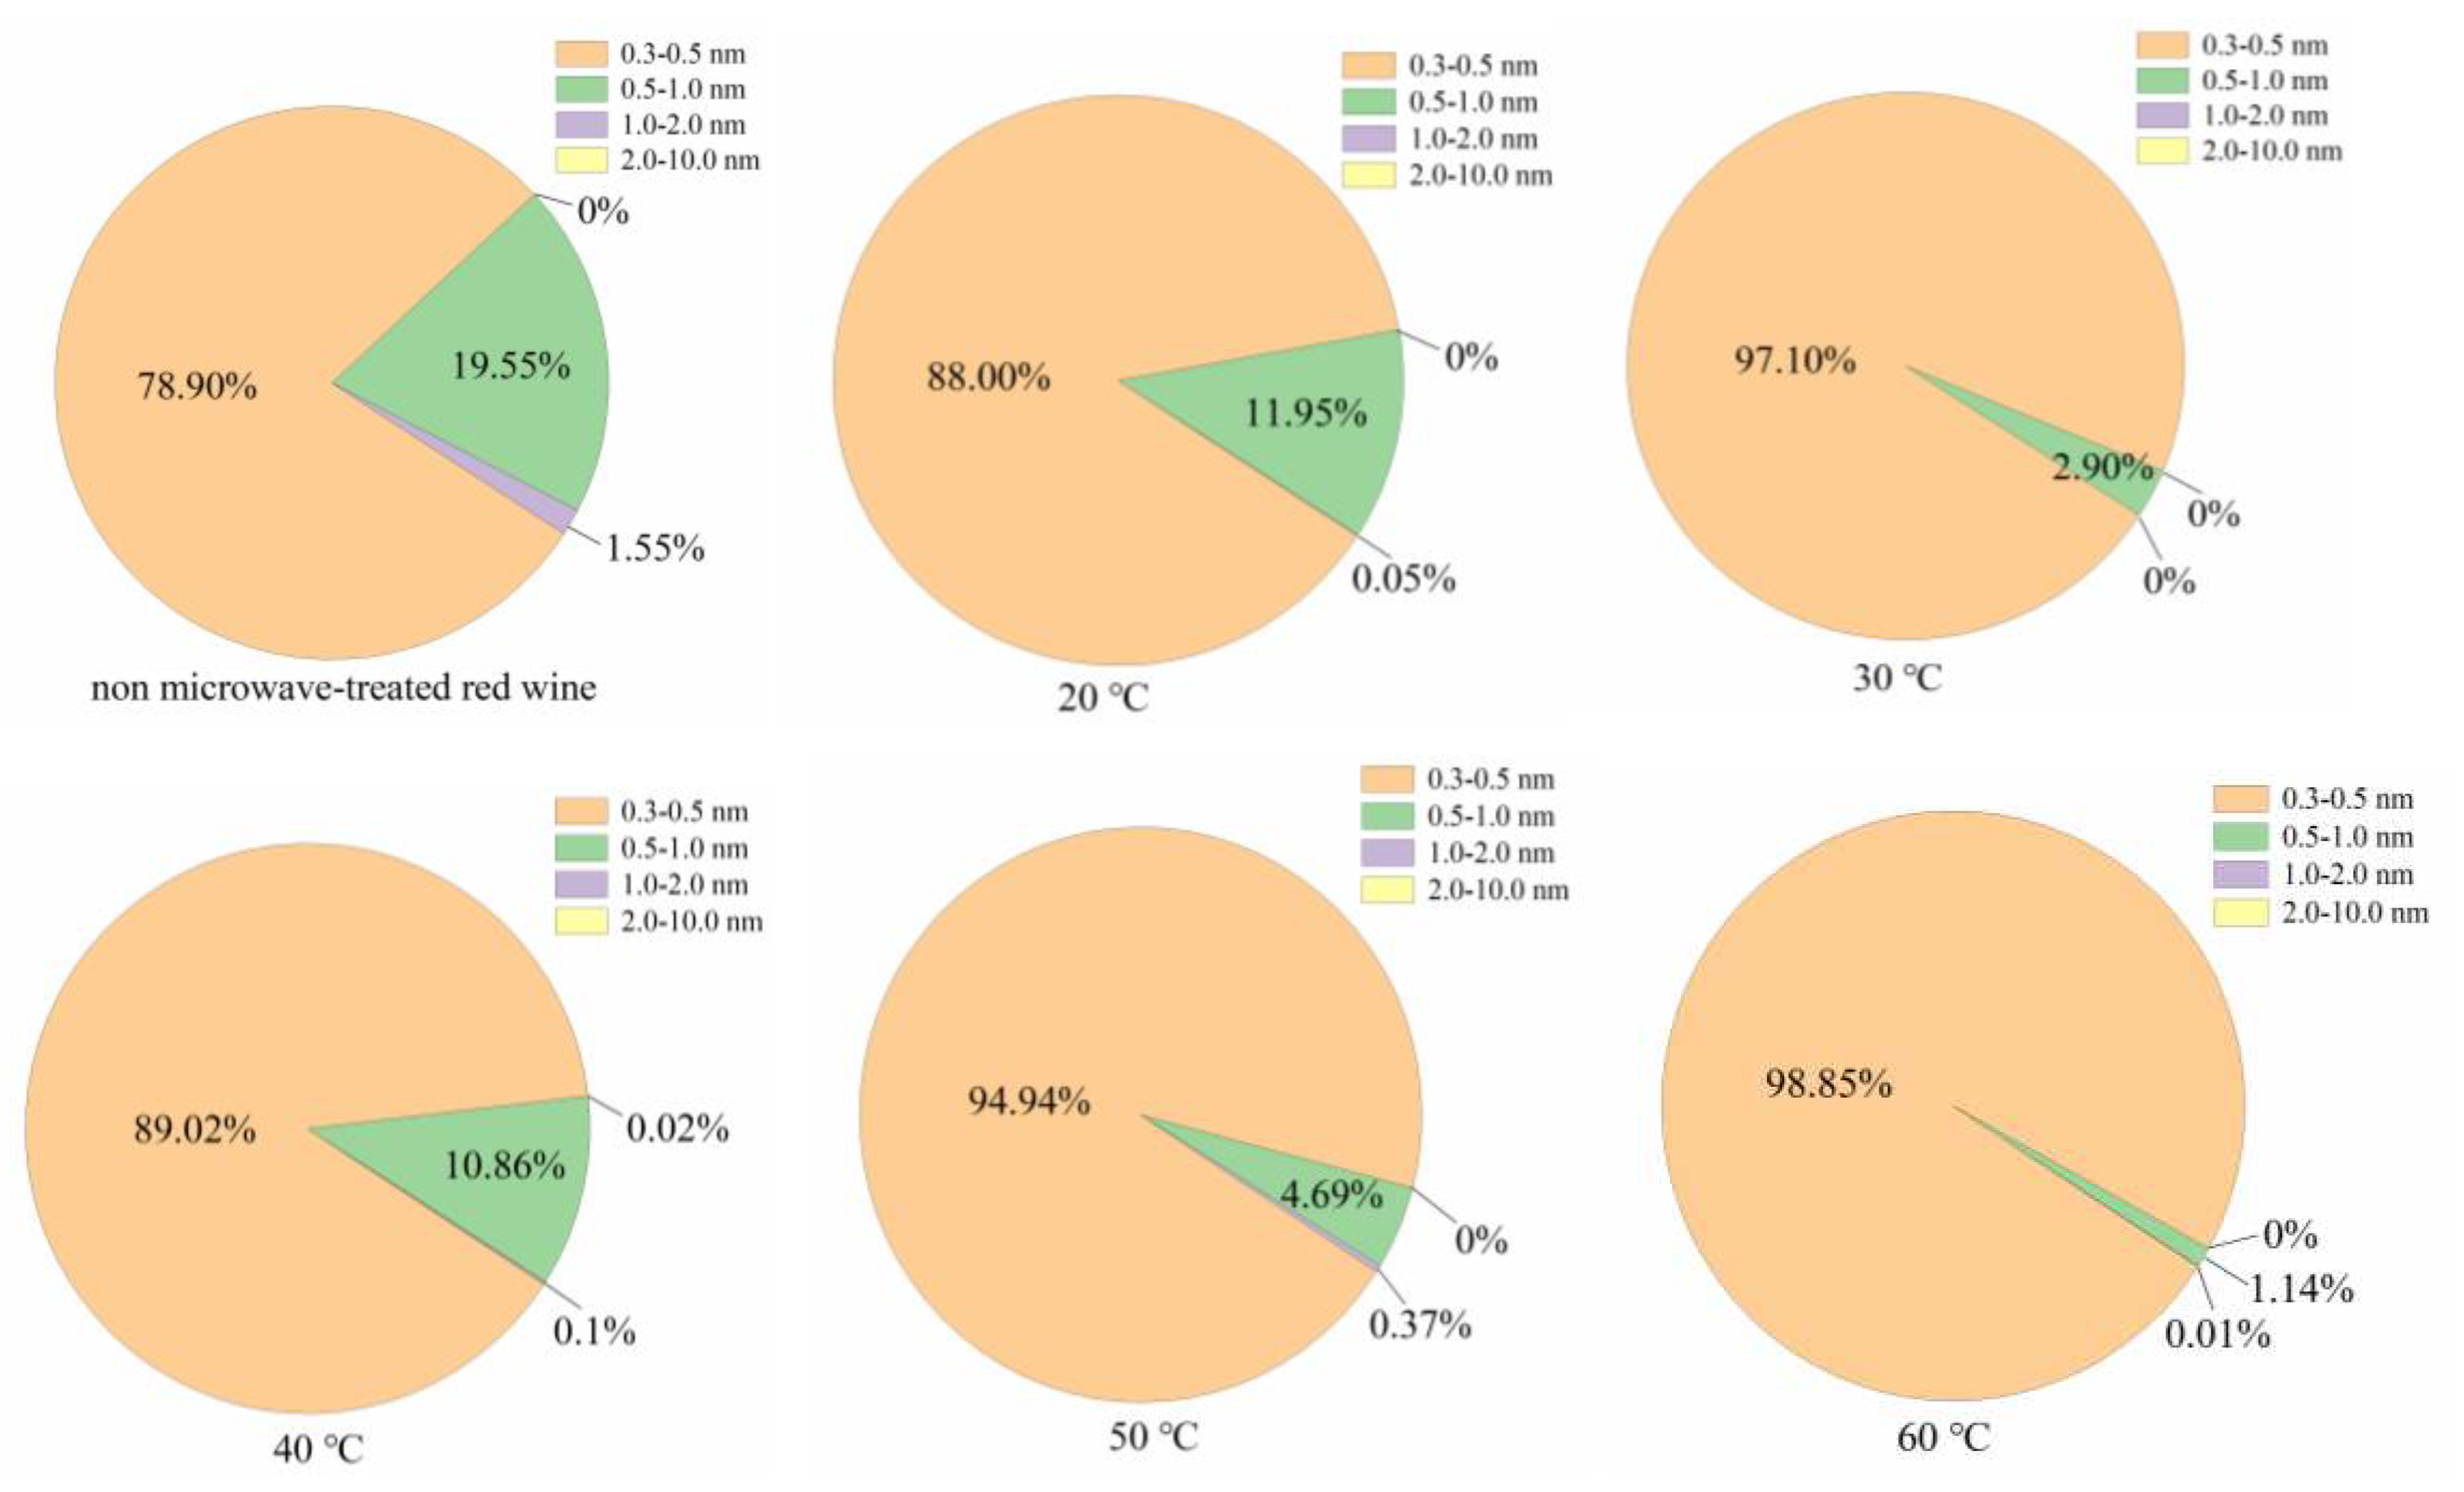
The particle size distribution of all red wine samples under different microwave temperature was shown in Figure 2, from which it could be seen that the particle size distribution was affected by different microwave temperature. Generally speaking, the particle size distribution of all red wine samples was in three intervals, that was 0.3-0.5 nm, 0.5-1.0 nm, and 1.0-2.0 nm, and particle size distribution at 0.3-0.5 nm took the largest proportion, and the particle size distribution of red wine changed with the increasing of microwave temperature between 20 ℃ and 60 ℃. There were still three particle size ranges, except that 2.0-10.0 nm particle size increased by 0.02% at 40 ℃, and the particles in the range of 0.5-1.0 nm and 1.0-2.0 nm decreased gradually from 20 ℃ to 30 ℃; the particles in the range of 0.3-0.5 nm increased gradually from 40 ℃ to 60 ℃, and the particles in the range of 1.0-2.0 nm had no significant change. Microwave temperature was a complicated factor affecting the particle size distribution, temperature not only affected the strength of molecular motion, but also affected the intensity of free radicals. From the result of Figure 2, the particle size distribution of wine samples treated by microwave at 40 °C changed obviously, this phenomenon perhaps was the reason for the double influence under microwave irradiation on the intensity of free radicals and the friction between polar molecules. Furthermore, the particle size distribution of wine treated at lower temperature was significantly different from that of untreated wine. At the same time, considering the influence on the physicochemical properties of red wine under microwave temperature [9,10], it was suggested that red wine was treated at lower temperature.

3.1.3. Microwave Time on Particle Size Distribution

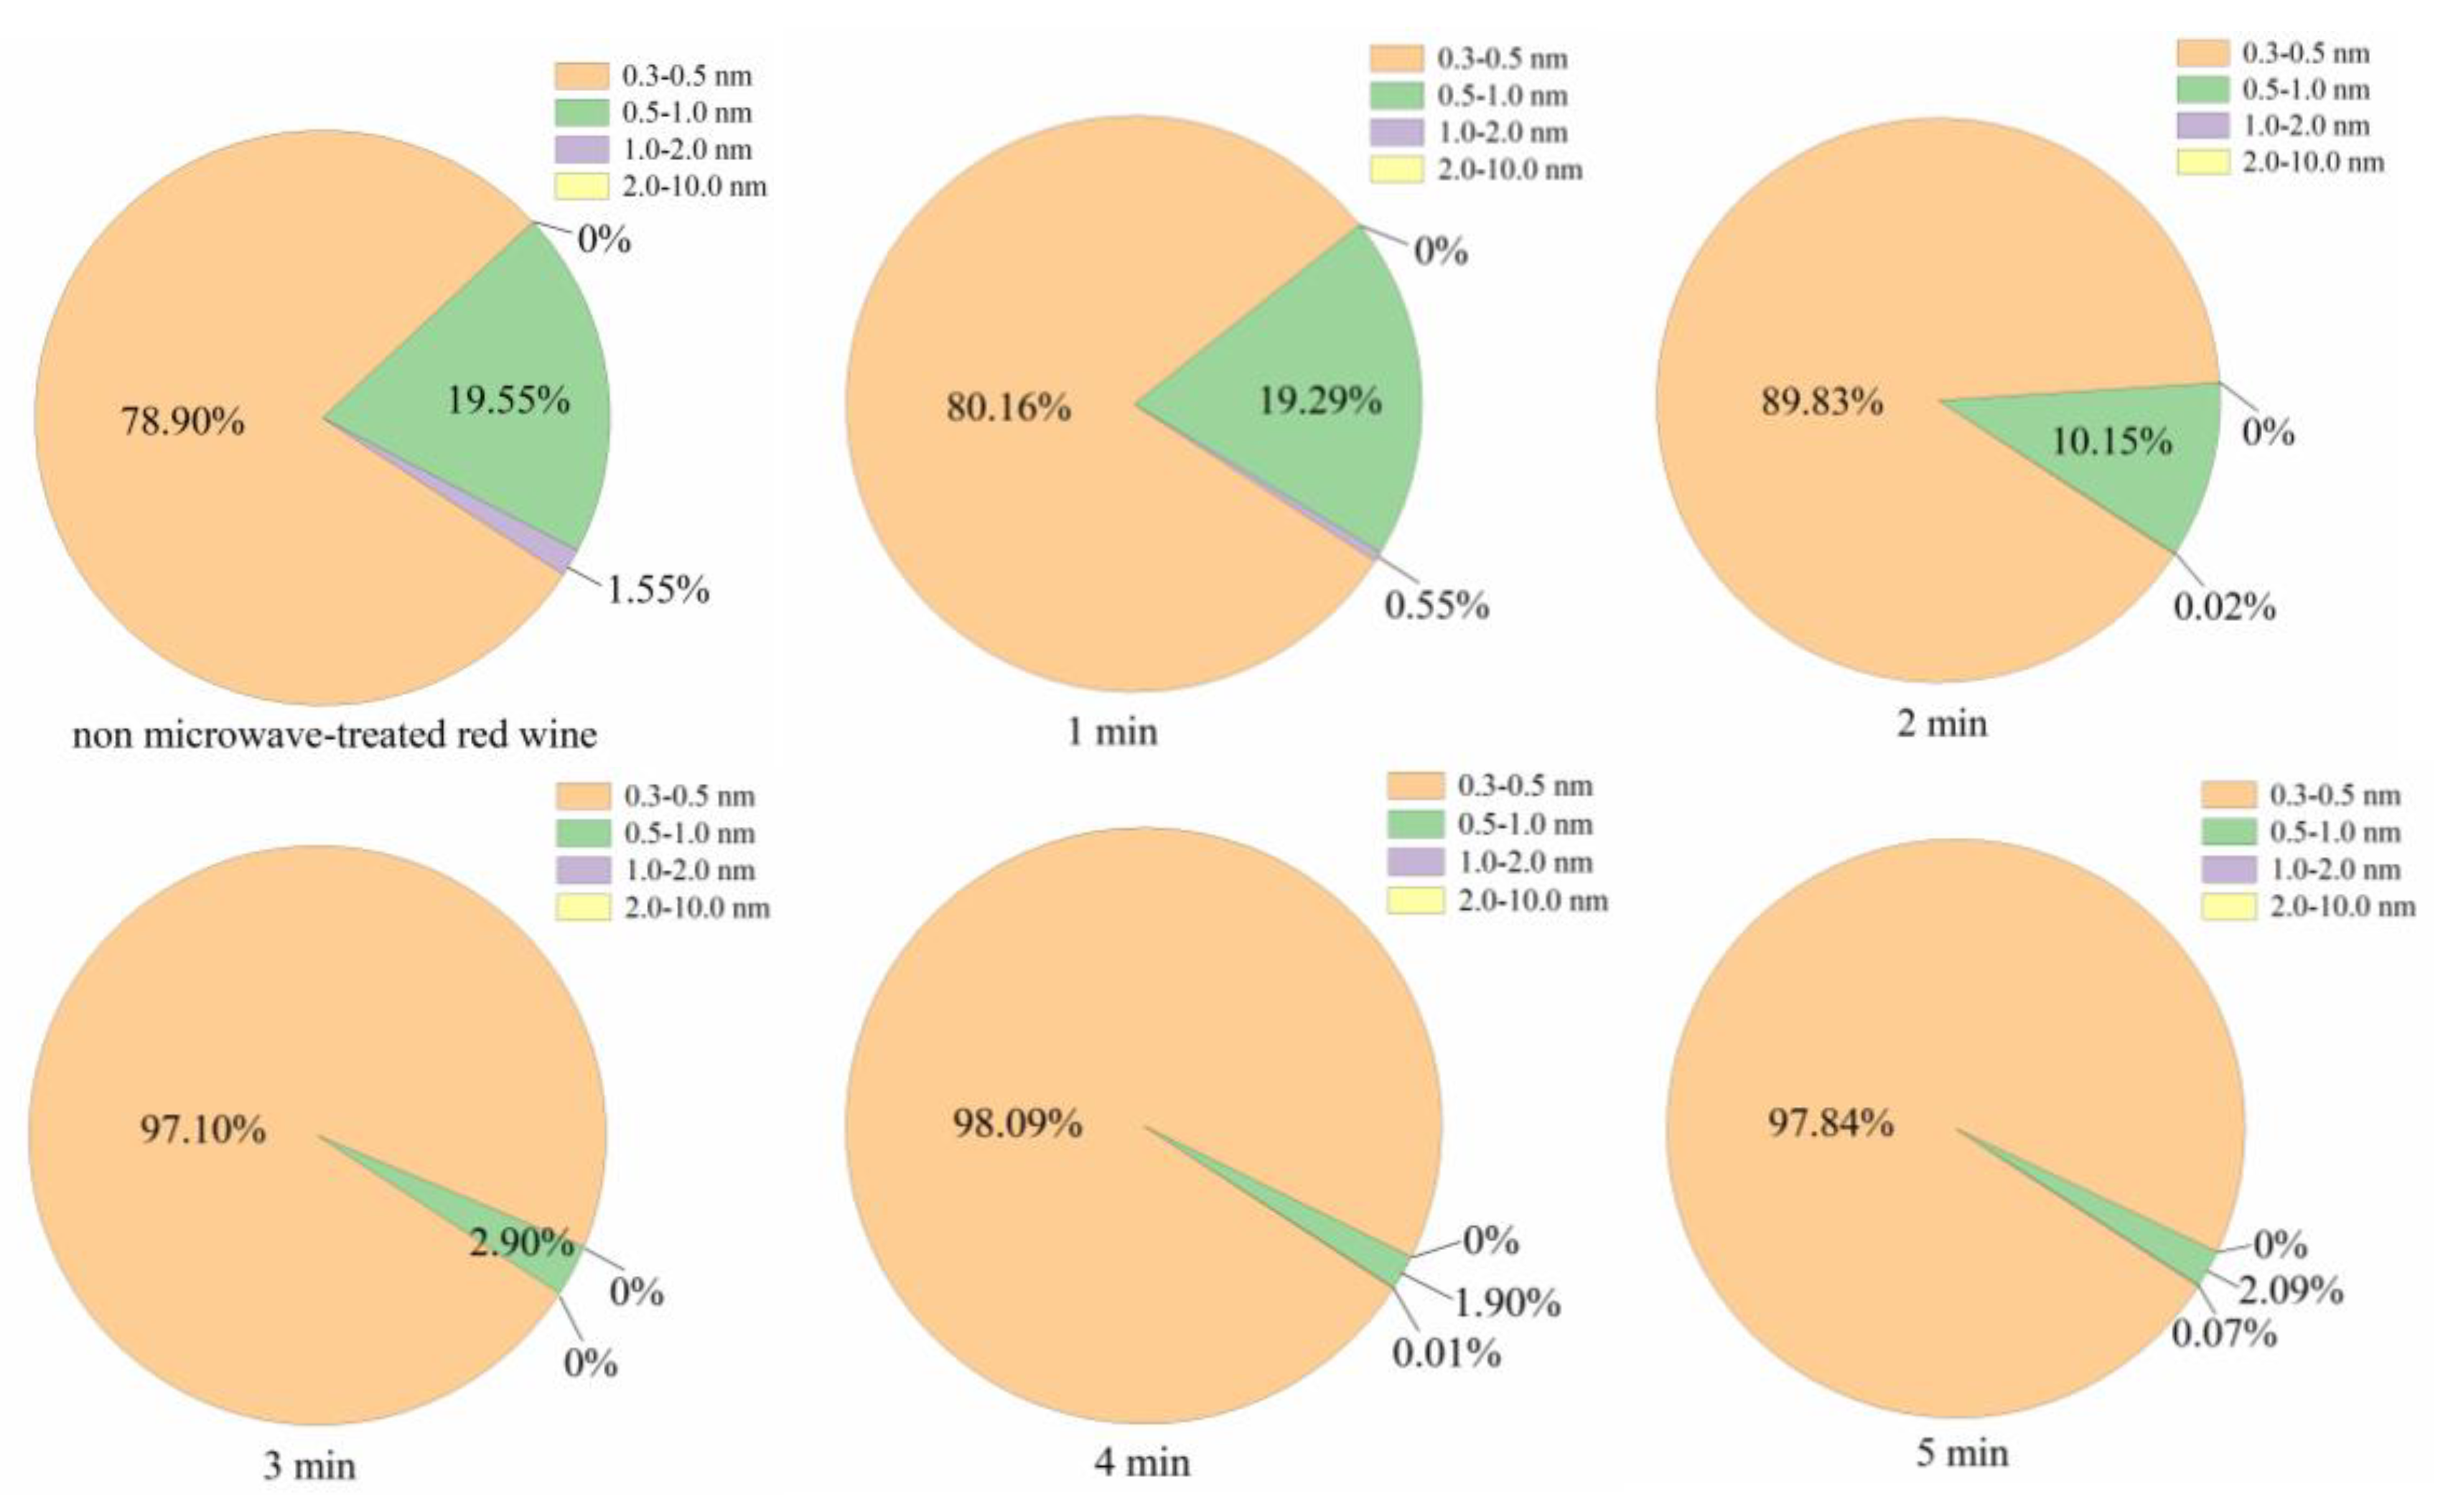
Figure 3 showed the particle size distribution of red wine under different microwave treatment times. Compared with the untreated microwave red wine, the particle size distribution of red wine after different microwave time treatment was still divided into three ranges: 0.3-0.5 nm, 0.5-1.0 nm, and 1.0-2.0 nm. In general, with the increase of microwave time, the proportion of larger particles gradually decreased, while the proportion of smaller particles gradually increased. The result showed that more big particles degraded small particles with the increasing of microwave time, which due to the motion and friction of polar molecules under high-frequency electromagnetic fields were enhanced as extending the treatment time. And the increasing trend of small particles was consistent with the increasing trend of free radicals intensity [12]. In other words, the change of the particle sizes distribution was caused by different microwave time, and a series of free radicals chain reactions among the components and rheological properties of red wine were caused by different microwave times, which could be explained by that the microwave technology made the particle size distribution more uniform and improved the clarity of red wine. It could be seen from the results that long-time microwave treatment could make the particle size distribution of red wine more uniform, not only increasing the proportion of small particles and changing the rheological properties of red wine, but also consistent with the reported improvement of the clarity of red wine under different microwave treatment time [9].

3.2. Rheological Characteristics of Untreated and Microwave-treated Red Wine

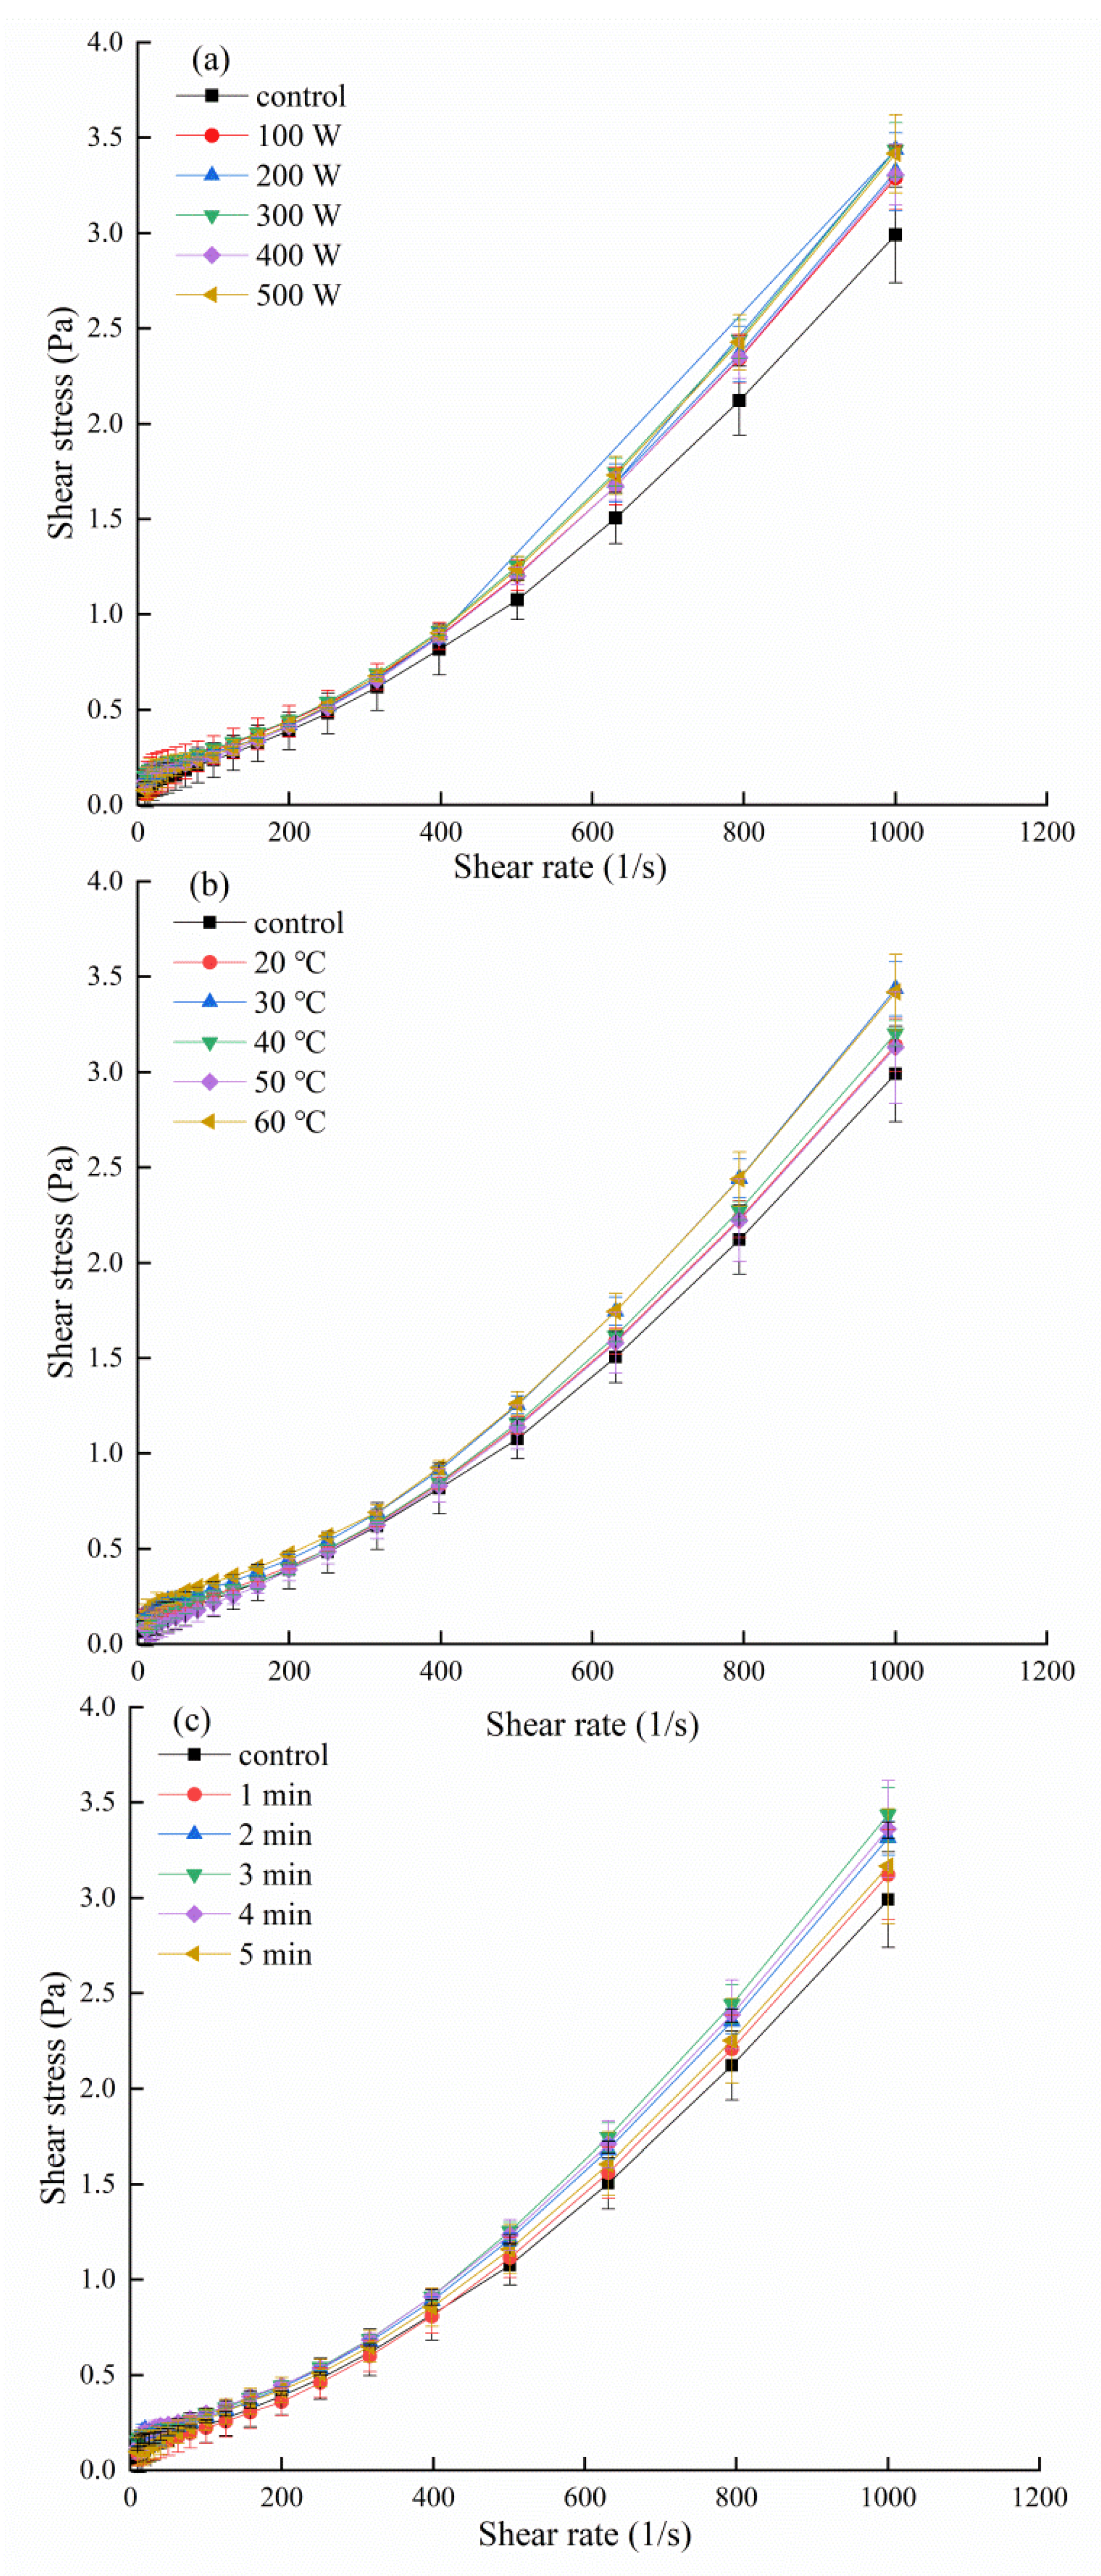
As shown in Figure 4(a)-(c), the rheological characteristics of red wine were indeed affected along with different microwave power, temperature, and time. According to the relationship between shear rate (γ) and shear stress (τ), fluids can be divided into Newtonian and non-Newtonian fluids [22,23]. According to the results of rheological curve, the shear rate, and shear stress of red wine in the untreated samples and the microwave-treated sample were not linear, which showed that red wine under different conditions was non-Newtonian fluids; and the shear stress of all red wine quickly increased with the increase of shear rate, which could indicate that microwave treatment couldn’t change the fluid characteristics of red wine. Usually, the rheological type could be determined by the calculated fitting results with the Power-law equation. n is the rheological constant, which indicates the degree of deviation of the fluid from Newtonian fluid. If n=1, the rheological type is Newtonian fluid; if n<1, the rheological type is pseudoplastic fluid, and the lower the value of n, the more shear-thinning behavior; if n>1, the rheological type of the sample is expanding fluid, and the higher the value of n, the less dependent of the viscosity on the change of shear rate [24].
Table 1 showed the relevant parameters of the rheological characteristics of red wine obtained by fitting the Power-law equation. All regression coefficient (R12) were in the range of 0.9724 to 0.9908, indicating that the Power-law model had good correlation with the rheological curve, and the rheological constants of all red wine samples were greater than 1, indicating that the rheological type of all red wine samples was expanding fluids. In other words, microwave irradiation could change the rheological characteristic constant, but could not change the rheological type of red wine. From the change of n value, it could be seen that the particles dispersed in red wine underwent complex movements and the interaction between the molecules [25], microwave irradiation perhaps resulted in the change of the stretching or deformation of the molecules or particles, resulting in the change of the rheological characteristics of red wine.
Table 1 further showed the relevant parameters of the rheological characteristics of red wine obtained by fitting the Casson equation. All regression coefficient (R22) were greater than 0.99, indicating that the Casson model had good correlation with the rheological curve. Among them, τ0 is the yield stress, which is the force required when the fluid begins to flow. The larger τ0 indicates the greater the force required for the sample to start flowing and the more difficult to flow; the smaller τ0 indicates the smaller the force required for the sample to start flowing and the easier to flow. In the comparison of microwave-treated and untreated red wines, the yield stress was changed under microwave irradiation, and yield stress of microwave-treated red wines was higher than untreated red wines. The viscosity coefficient K represents the viscosity of red wine, the larger K value, the better the thickening effect. In other words, the legs of red wine could be scientifically computed, the larger the K value, the more obvious legs phenomenon, relating to the improvement of wine quality. Under different microwave treatment conditions, the viscosity coefficient among the samples was slightly increased. Microwave treatment enhanced legs phenomenon in red wine through analysis of theoretical K value, which further showed that microwave treatment could improve the sensory quality of red wine. Microwave-treated condition at 300 W, 30 ℃, and 3 min could have the effects of better the thickening and leg phenomenon, these phenomena were similar to the higher quality red wine after a long period of natural aging [26].
Microwave irradiation containing high-frequency electromagnetic wave destroyed the stability of weak hydrogen bonds by enhancing the rotation of polar molecules, resulting in the fracture of hydrogen bonds between weak polar molecules [27,28], thus occurrence of more chemical and physical reactions in red wine, which might disturb the original arrangement of particles, resulting in the change of yield stress and viscosity coefficient of red wine.

3.3. Influence of Fluorescence Intensity in Red Wine by Microwave Treatment

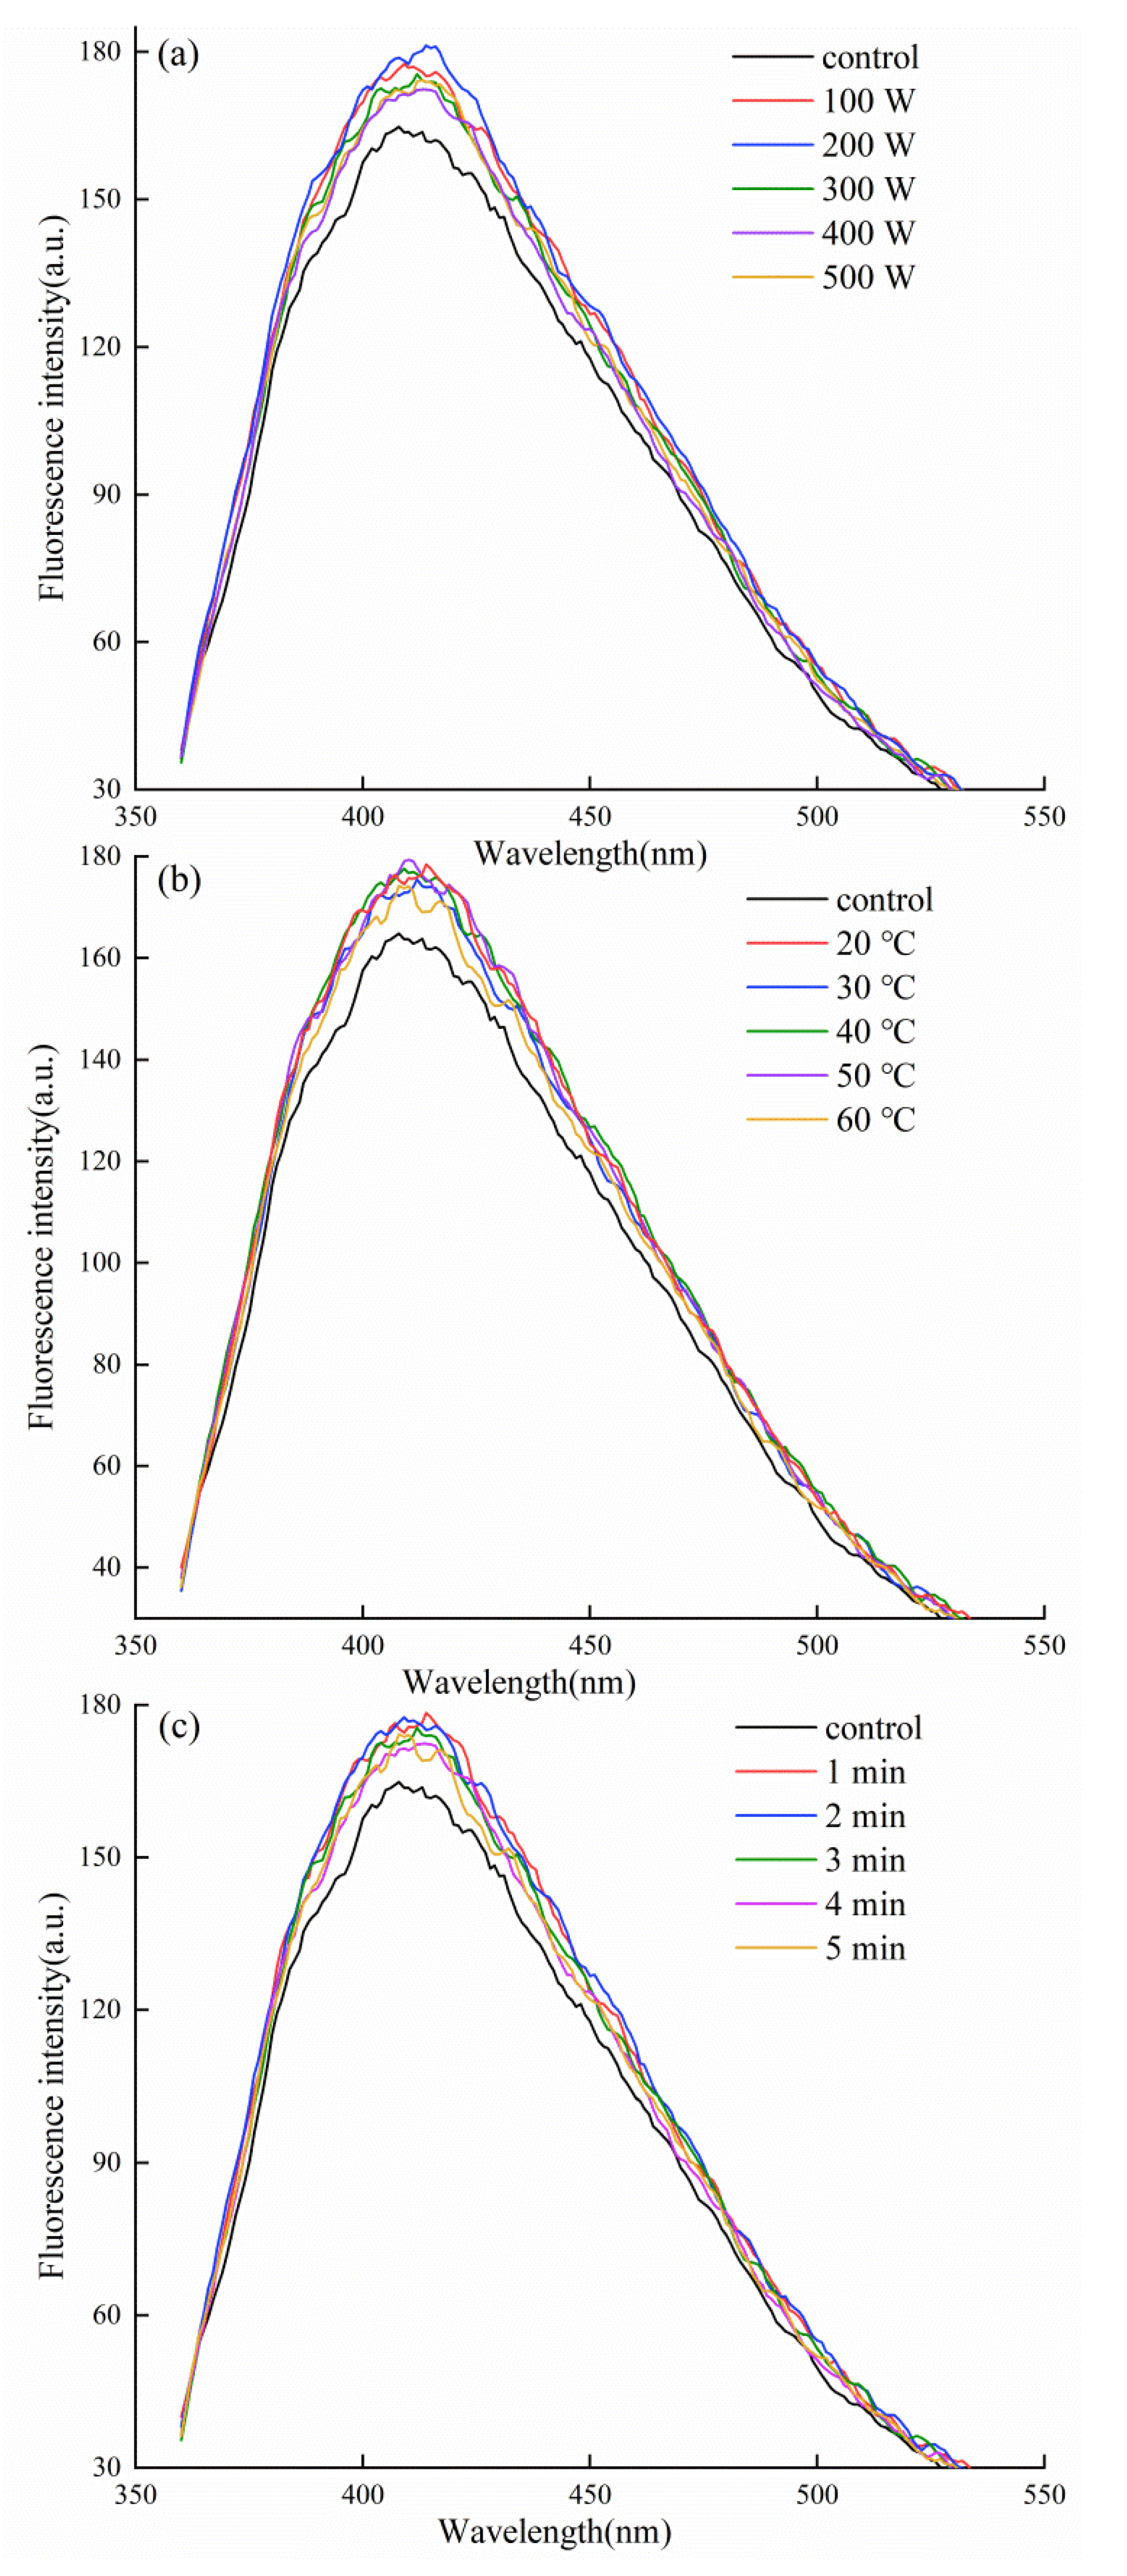
The age of the wine could be determined by analysis of fluorescence characteristics, the fluorescence intensity increased with the improvement of wine quality [29]; the fluorescence intensity of red wine enhanced with the extending aging time [30]. Apart from alcohols, aldehydes, acids, and esters, other fluorescent molecules present in wine were vitamins and amino acids [31]. The fluorescence spectrum could be considered as a fingerprint of red wine sample. As shown in Figure 5, the fluorescence spectra of untreated and microwave-treated red wine were similar, which showed that microwave-treated red wine could only change the fluorescence intensity, but not the spectral characteristics. The fluorescence intensity of red wine treated by microwave was higher than that of untreated red wine, which showed that microwave technology could improve the red wine quality to a certain extent.
The fluorescence intensity of red wine firstly increased and then decreased with the increase of microwave output power from 100 W to 500 W, and the fluorescence intensity of red wine was the highest at 200 W, the result showed that the lower power microwave was beneficial to improve the quality of red wine. Microwave temperatures of 20, 30, 40, 50, and 60 °C were carried out to study the effect on the fluorescence characteristics of red wine, while the other working conditions were fixed at 300 W and 3 min. The fluorescence intensity of red wine treated with different microwave temperatures was higher than that of untreated red wine, this phenomenon showed that different microwave temperature treatment could improve the quality of red wine, and microwave technology could shorten aging time from the view of microwave temperature. The influence of microwave time from 1 to 5min on the fluorescence intensity of red wine was carried out at the power of 300 W and 30±1.5 ℃. The fluorescence intensity of red wine treated by different microwave times was significantly higher than that of untreated red wine; and the fluorescence intensity of red wine gradually decreased with the increase of microwave treatment time, which indicated that short-time microwave treatment could improve the quality of red wine, and the result was instructive for microwave aging technology.

3.4. Influence of Flavan-3-ols in Red Wine by Microwave Treatment

Flavan-3-ols is important active compounds related to the bitterness and astringency of red wine, the monomeric flavan-3-ols contribute more bitterness than the polymeric flavan-3-ols in red wine; the polymeric flavan-3-ols with polymerization degree in 2~10 easily bonded with saliva protein, thus enhancing the astringency in red wine [32]. The structure type of flavan-3-ols affected the mouthfeel of red wine. Flavan-3-ols was a typical polyphenolic compound with the characteristic of fluorescence absorption [33]. The content of flavan-3-ols was related to fluorescence spectroscopy at λexc/em 340/420 [34], which might be due to extend the carbon chain and enhance the hydrophobicity during the polymerization of flavan-3-ols, thus increasing the intensity of fluorescence [35]. Therefore, the content of flavan-3-ols in red wine was explored to study the perhaps mechanism on the change of the fluorescence intensity by microwave treatment in red wine. As shown in Table 1, when red wine was treated with different microwave power, temperature and time, the content of flavan-3-ols in red wine decreased compared with untreated red wine. Interestingly, it was contrary to the observation on the increase of fluorescence intensity in red wine under microwave irradiation, which may be due to the fact that the flavan-3-ols (such as catechin, epicatechin, gallocatechin, epigallocatechin) in red wine would easily polymerize with anthocyanins or themselves to form dimers or polymers [36], due to more free radicals induced by microwave irradiation [12]. The enhancement of fluorescence intensity under microwave irradiation in Figure 5, which might be related to the extension of carbon chain and the enhancement of hydrophobicity during oxidative polymerization of flavan-3-ols in Table 1. In addition to flavan-3-ols, the increase in fluorescence intensity in red wine under microwave radiation was also related to the changes of other fluorescent substances. In a word, the mechanism of microwave treatment on the increase of fluorescence intensity in red wine needed further study.

4. Conclusions

In this study, red wine was treated with different microwave power, temperature, and time, and particle size distribution, the rheological characteristic, and fluorescence spectrum were detected, respectively, exploring the physical properties of red wine under microwave treatment. Through the friction effects and oxidative polymerization of microwave irradiation, microwave treatment changed particle size distribution, to form stable uniform solution, and enhance the visual impact and mouthfeel of red wine. Red wine was expansion fluid, microwave irradiation could change the rheological constant, yield stress, and viscosity coefficient, but couldn’t change the rheological type of red wine, and improved leg phenomenon and thickening effect. The fluorescence intensity increased under different microwave conditions, which was consistent with the increased fluorescence intensity of red wine during natural aging; the increase in fluorescence intensity might be caused by oxidative polymerization of fluorescent substances, such as the polymerization of flavan-3-ols. The mechanism of change of sensory characteristics in wine storage has not yet been studied, the modification of physical characteristics by microwave irradiation is still worth exploring and the scientific regulation of the microwave’s application is still further studied to better employ this technique in winery.

Author Contributions

Conceptualization, J.-F.Y.; data curation, J.-F.Y., H.-M.Q. and Z.-Y.C.; formal analysis, J.-F.Y. and Y.-T.L.; investigation, J.-F.Y. and Z.-Y.C.; methodology, H.-M.Q. and Z.-Y.C.; software, L.-Y.T. and X.-W.Y.; writing-original draft, J.-F.Y. and Z.-Y.C.; writing-review & editing, J.-F.Y. and H.-M.Q. All authors have read and agreed to the published version of the manuscript.

Institutional Review Board Statement

Not applicable.

Informed Consent Statement

Not applicable.

Data Availability Statement

No new data were created or analyzed in this study. Data sharing in not applicable to this article.

Conflicts of Interest

The authors declare no conflict of interest

References

  1. Sánchez-Córdoba, C.; Durán-Guerrero, E.; Castro, R. Olfactometric and sensory evaluation of red wines subjected to ultrasound or microwaves during their maceration or ageing stages. LWT 2021, 144, 111228. [Google Scholar] [CrossRef]
  2. Carpena, M.; Pereira, A.G.; Prieto, M.A.; Simal-Gandara, J. Wine aging technology: Fundamental role of wood barrels. Foods 2020, 9, 1160. [Google Scholar] [CrossRef] [PubMed]
  3. Jackson, R.S. Postfermentation treatments and related topics. Wine Sci. 2008, 2, 418–519. [Google Scholar] [CrossRef]
  4. García Martín, J.F.; Sun, D.W. Ultrasound and electric fields as novel techniques for assisting the wine ageing process: The state-of-the-art research. Trends Food Sci. Tech. 2013, 33, 40–53. [Google Scholar] [CrossRef]
  5. Celotti, E.; Stante, S.; Ferraretto, P.; Román, T.; Nicolini, G.; Natolino, A. High power ultrasound treatments of red young wines: Effect on anthocyanins and phenolic stability indices. Foods 2020, 9, 1344. [Google Scholar] [CrossRef] [PubMed]
  6. Tao, Y.; García, J.F.; Sun, D.W. Advances in wine aging technologies for enhancing wine quality and accelerating wine aging process. Crit. Rev. Food Sci. 2014, 54, 817–835. [Google Scholar] [CrossRef]
  7. Guo, Q.S.; Sun, D.W.; Cheng, J.H.; Han, Z. Microwave processing techniques and their recent applications in the food industry. Trends Food Sci. Tech. 2017, 67, 236–247. [Google Scholar] [CrossRef]
  8. Zheng, X.Z.; Liu, C.H.; Huo, J.W.; Li, C. Effect of the microwave irradiated treatment on the wine sensory properties. Int. J. Food Eng. 2011, 7, 71–78. [Google Scholar] [CrossRef]
  9. Yuan, J.F.; Wang, T.T.; Chen, Z.Y.; Wang, D.H.; Gong, M.G.; Li, P.Y. Microwave irradiation: Impacts on physicochemical properties of red wine. CyTA-J. Food 2020, 18, 281–290. [Google Scholar] [CrossRef]
  10. Yuan, J.F.; Lai, Y.T.; Chen, Z.Y.; Song, H.X.; Zhang, J.; Wang, D.H.; Gong, M.G.; Sun, J.R. Microwave irradiation: Effects on the change of colour characteristics and main phenolic compounds of Cabernet Gernischt dry red wine during storage. Foods 2022, 11, 1778. [Google Scholar] [CrossRef]
  11. Yuan, J.F.; Wang, T.T.; Wang, D.H.; Zhou, G.H.; Zou, G.X.; Wang, Y.; Gong, M.G.; Zhang, B. Effect of microwave on changes of gallic acid and resveratrol in a model extraction solution. Food Bioprocess. Tech. 2020, 13, 1246–1254. [Google Scholar] [CrossRef]
  12. Yuan, J.F.; Chen, Z.Y.; Wang, D.H.; Gong, M.G.; Qiu, Z.J. Microwave-induced free radicals production in red wine and model wine by electron paramagnetic resonance spin trapping. J. Food Process. Pres. 2021, 45, e15407. [Google Scholar] [CrossRef]
  13. Yuan, J.F.; Hou, Z.C.; Wang, D.H.; Qiu, Z.J.; Gong, M.G.; Sun, J.R. Microwave irradiation: Effect on activities and properties of polyphenol oxidase in grape maceration stage. Food Biosci. 2021, 44, 101378. [Google Scholar] [CrossRef]
  14. Yuan, J.F.; Chen, Z.Y.; Lai, Y.T.; Qiu, Z.J.; Wang, D.H.; Zhao, J.F.; Sun, J.R.; Li, X. . Microwave irradiation: The influence on the production of xanthylium cation pigments in model wine. Food Bioprocess. Tech. 2022, 15, 2210–2225. [Google Scholar] [CrossRef]
  15. Lai, Y.T.; Yuan, J.F.; Chen, Z.Y.; Wang, D.H.; Sun, J.R.; Ma, J. L. Microwave irradiation: Reduction of higher alcohols in wine and the effect mechanism by employing model wine. LWT 2023, 181, 114765. [Google Scholar] [CrossRef]
  16. Zheng, X.H.; Zhang, M.; Fang, Z.X.; Liu, Y.P. Effects of low frequency ultrasonic treatment on the maturation of steeped greengage wine. Food Chem. 2014, 162, 264–269. [Google Scholar] [CrossRef] [PubMed]
  17. Sádecká, J.; Jakubíková, M. Varietal classification of white wines by fluorescence spectroscopy. J. food sci. tech. MYS. 2020, 57, 2545–2553. [Google Scholar] [CrossRef] [PubMed]
  18. Xu, J.G.; Wang, Z.B. Fluorescence Analysis Methods, 3rd Ed.; Beijing Science Press: 2006.
  19. Ivanova, V.; Stefova, M.; Vojnoski, B.; Dörnyei, A.; Márk, L.; Dimovska, V.; Stafilov, T.; Kilár, F. Identification of polyphenolic compounds in red and white grape varieties grown in R. Macedonia and changes of their content during ripening. Food Res. Int. 2011, 44, 2851–2860. [Google Scholar] [CrossRef]
  20. Chandrasekaran, S.; Ramanathan, S.; Basak, T. Microwave food processing-A review. Food Res. Int. 2013, 52, 243–261. [Google Scholar] [CrossRef]
  21. Thostenson, E.T.; & Chou, T.W.; & Chou, T. W. Microwave processing: Fundamentals and applications. Compos. Part A-Appl. S. 1999, 30, 1055–1071. [Google Scholar] [CrossRef]
  22. Xu, B.W.; Shen, Y.; Zhang, Q.A.; Zhao, W.Q.; Yi, X. Effect of ultrasound irradiation on the particle size distribution and rheological properties of red wine. CyTA-J. Food 2019, 17, 180–188. [Google Scholar] [CrossRef]
  23. Košmerl, T.; Abramovič, H.; Klofutar, C. The rheological properties of Slovenian wines. J. Food Eng. 2000, 46, 165–171. [Google Scholar] [CrossRef]
  24. Staroszczyk, H.; Fiedorowicz, M.; Opalińska-Piskorz, J.; Tylingo, R. Rheology of potato starch chemically modified with microwave-assisted reactions. LWT 2013, 53, 249–254. [Google Scholar] [CrossRef]
  25. Holdsworth, S.D. Applicability of rheological models to the interpretation of flow and processing behavior of fluid food products. J. Texture Stud. 1971, 2, 393–418. [Google Scholar] [CrossRef] [PubMed]
  26. Araujo, L.D.; Parr, W.V.; Grose, C.; Hedderley, D.; Masters, O.; Kilmartin, P.A.; Valentin, D. In-mouth attributes driving perceived quality of Pinot noir wines: Sensory and chemical characterisation. Food Res. Int. 2021, 149, 110665. [Google Scholar] [CrossRef] [PubMed]
  27. Li, R.J.; Huang, L.L.; Zhang, M.; Mujumdar, A.S.; Wang, Y.C. Freeze drying of apple slices with and without application of microwaves. Dry. Technol. 2014, 32, 1769–1776. [Google Scholar] [CrossRef]
  28. Liu, Z.Z.; Qiao, L.; Yang, F.J.; Gu, H.Y.; Lei, Y. Bronsted acidic ionic liquid based ultrasound-microwave synergistic extraction of pectin from pomelo peels. Int. J. Biol. Macromol. 2017, 94, 309–318. [Google Scholar] [CrossRef]
  29. Airado-Rodríguez, D.; Durán-Merás, I.; Galeano-Díaz, T.; Wold, J.P. Front-face fluorescence spectroscopy: A new tool for control in the wine industry. J. Food Compos. Anal. 2011, 24, 257–264. [Google Scholar] [CrossRef]
  30. Dufour, É.; Letort, A.; Laguet, A.; Lebecque, A.; Serra, J.N. Investigation of variety, typicality and vintage of French and German wines using front-face fluorescence spectroscopy. Anal. Chim. Acta 2006, 563, 292–299. [Google Scholar] [CrossRef]
  31. Hoenicke, K.; Simat, T.J.; Steinhart, H.; Kohler, H.J.; Schwab, A. Determination of free and conjugated indole-3-acetic acid, tryptophan, and tryptophan metabolites in grape must and wine. J. Agric. Food Chem. 2001, 49, 5494–5501. [Google Scholar] [CrossRef]
  32. Lei, X.Q.; Zhu, Y.Y.; Wang, X.Y.; Zhao, P.T.; Liu, P.; Zhang, Q. T.; Chen, T.G.; Yuan, H.H.; Guo, Y.R. Wine polysaccharides modulating astringency through the interference on interaction of flavan-3-ols and BSA in model wine. Int. J. Biol. Macromol. 2019, 139, 896–903. [Google Scholar] [CrossRef] [PubMed]
  33. Vinas, P.; Lopez-Erroz, C.; Marin-Hernandez, J.J.; Hernandez-Cordoba, M. Determination of phenols in wines by liquid chromatography with photodiode array and fluorescence detection. J. Chromatogr. A 2000, 871, 85–93. [Google Scholar] [CrossRef] [PubMed]
  34. Airado-Rodríguez, D.; Galeano-Díaz, T.; Durán-Merás, I.; Wold, J.P. Usefulness of fluorescence excitation-emission matrices in combination with PARAFAC, as fingerprints of red wines. J. Agric. Food Chem. 2009, 57, 1711–1720. [Google Scholar] [CrossRef]
  35. Zhang, H.J.; Tao, F.R.; Cui, Y.Z.; Xu, Z. The aggregation induced fluorescence effect enhanced by a reasonable length of carbon chain. J. Mol. Liq. 2020, 302, 112550. [Google Scholar] [CrossRef]
  36. González-Manzano, S.; Dueñas, M.; Rivas-Gonzalo, J.C.; Escribano-Bailón, M.T.; Santos-Buelga, C. Studies on the copigmentation between anthocyanins and flavan-3-ols and their influence in the colour expression of red wine. Food Chem. 2008, 114, 649–656. [Google Scholar] [CrossRef]
Figure 1. Effect of microwave power on the particle size distribution of red wine.
Preprints 87609 g001
Figure 2. Effect of microwave temperature on the particle size distribution of red wine.
Preprints 87609 g002
Figure 3. Effect of microwave time on the particle size distribution of red wine.
Preprints 87609 g003
Figure 4. Rheological curves of red wine treated with different microwave conditions.
Preprints 87609 g004
Figure 5. Fluorescence spectrum of untreated and microwave treated red wine (a) different microwave power treatment of red wine; (b) different microwave temperature treatment of red wine; (c) different microwave time treatment of red wine.
Preprints 87609 g005
Table 1. Effects of microwave treatment on rheological constant, yield stress τ0, viscosity coefficient, and flavan-3-ols concentration in red wine.
Parameters Rheological
constant n
Regression
coefficient R12
Yield
Stress τ0 (Pa)
Viscosity coefficient
K (Pa sn)×10-3
Regression
Coefficient R22
Flavan-3-ols
concentration
(mg/mL)
Untreated 1.3029±0.1529 0.9859 0.6556±0.1803 2.8200±0.1411 0.9979 0.4240
Microwave power 100 W 1.2711±0.1055 0.9777 0.7427±0.1625 2.8933±0.1041 0.9983 0.3264
200 W 1.2941±0.0356 0.9802 0.7383±0.0266 2.9167±0.1405 0.9992 0.2951
300 W 1.2804±0.0167 0.9758 0.7769±0.0130 2.9367±0.0850 0.9993 0.2553
400 W 1.3053±0.0546 0.9795 0.7308±0.0475 2.9167±0.1415 0.9991 0.2364
500 W 1.3177±0.0271 0.9832 0.7141±0.0885 2.9967±0.0289 0.9980 0.2714
Microwave temperature 20℃ 1.2884±0.0288 0.9789 0.7283±0.0159 2.8200±0.0889 0.9995 0.2857
30℃ 1.2804±0.0167 0.9758 0.7769±0.0130 2.9367±0.0850 0.9993 0.2553
40℃ 1.3193±0.0606 0.9868 0.6775±0.0637 2.9200±0.1153 0.9989 0.3264
50℃ 1.3435±0.0564 0.9908 0.6609±0.1085 2.9333±0.1193 0.9980 0.2468
60℃ 1.2406±0.0359 0.9724 0.8073±0.0262 2.8933±0.0723 0.9981 0.2344
Microwave time 1min 1.3598±0.1281 0.9846 0.6617±0.1713 2.9067±0.1380 0.9989 0.3027
2min 1.2755±0.0169 0.9758 0.7657±0.0156 2.8767±0.0493 0.9990 0.2819
3min 1.2804±0.0167 0.9758 0.7769±0.0130 2.9367±0.0850 0.9993 0.2553
4min 1.2588±0.0206 0.9749 0.7817±0.0345 2.8833±0.0971 0.9984 0.2497
5min 1.2849±0.0672 0.9843 0.7028±0.1200 2.8733±0.1069 0.9984 0.2809
Disclaimer/Publisher’s Note: The statements, opinions and data contained in all publications are solely those of the individual author(s) and contributor(s) and not of MDPI and/or the editor(s). MDPI and/or the editor(s) disclaim responsibility for any injury to people or property resulting from any ideas, methods, instructions or products referred to in the content.
Copyright: This open access article is published under a Creative Commons CC BY 4.0 license, which permit the free download, distribution, and reuse, provided that the author and preprint are cited in any reuse.
Prerpints.org logo

Preprints.org is a free preprint server supported by MDPI in Basel, Switzerland.

Subscribe

© 2024 MDPI (Basel, Switzerland) unless otherwise stated