Submitted:
11 October 2023
Posted:
12 October 2023
You are already at the latest version
Abstract
Keywords:
1. Introduction
- The fundamental frequency (F0) that describes the frequency of vibration of the vocal folds.
- The first formant (F1), related to front-half oral cavity constriction: the greater the cavity, the lower F1. Furthermore, F1 is raised by pharyngeal tract constriction.
- The second formant (F2), linked to tongue movements: it is lowered by back-tongue constriction and increased by front-tongue constriction.
- The third formant (F3) that depends on lips rounding: the more this configuration is accentuated the lower is F3.
- F0 and formants F1-F3 are respectively inversely proportional to the size and thickness of the vocal folds and to the vocal tract length.
2. Materials and Methods
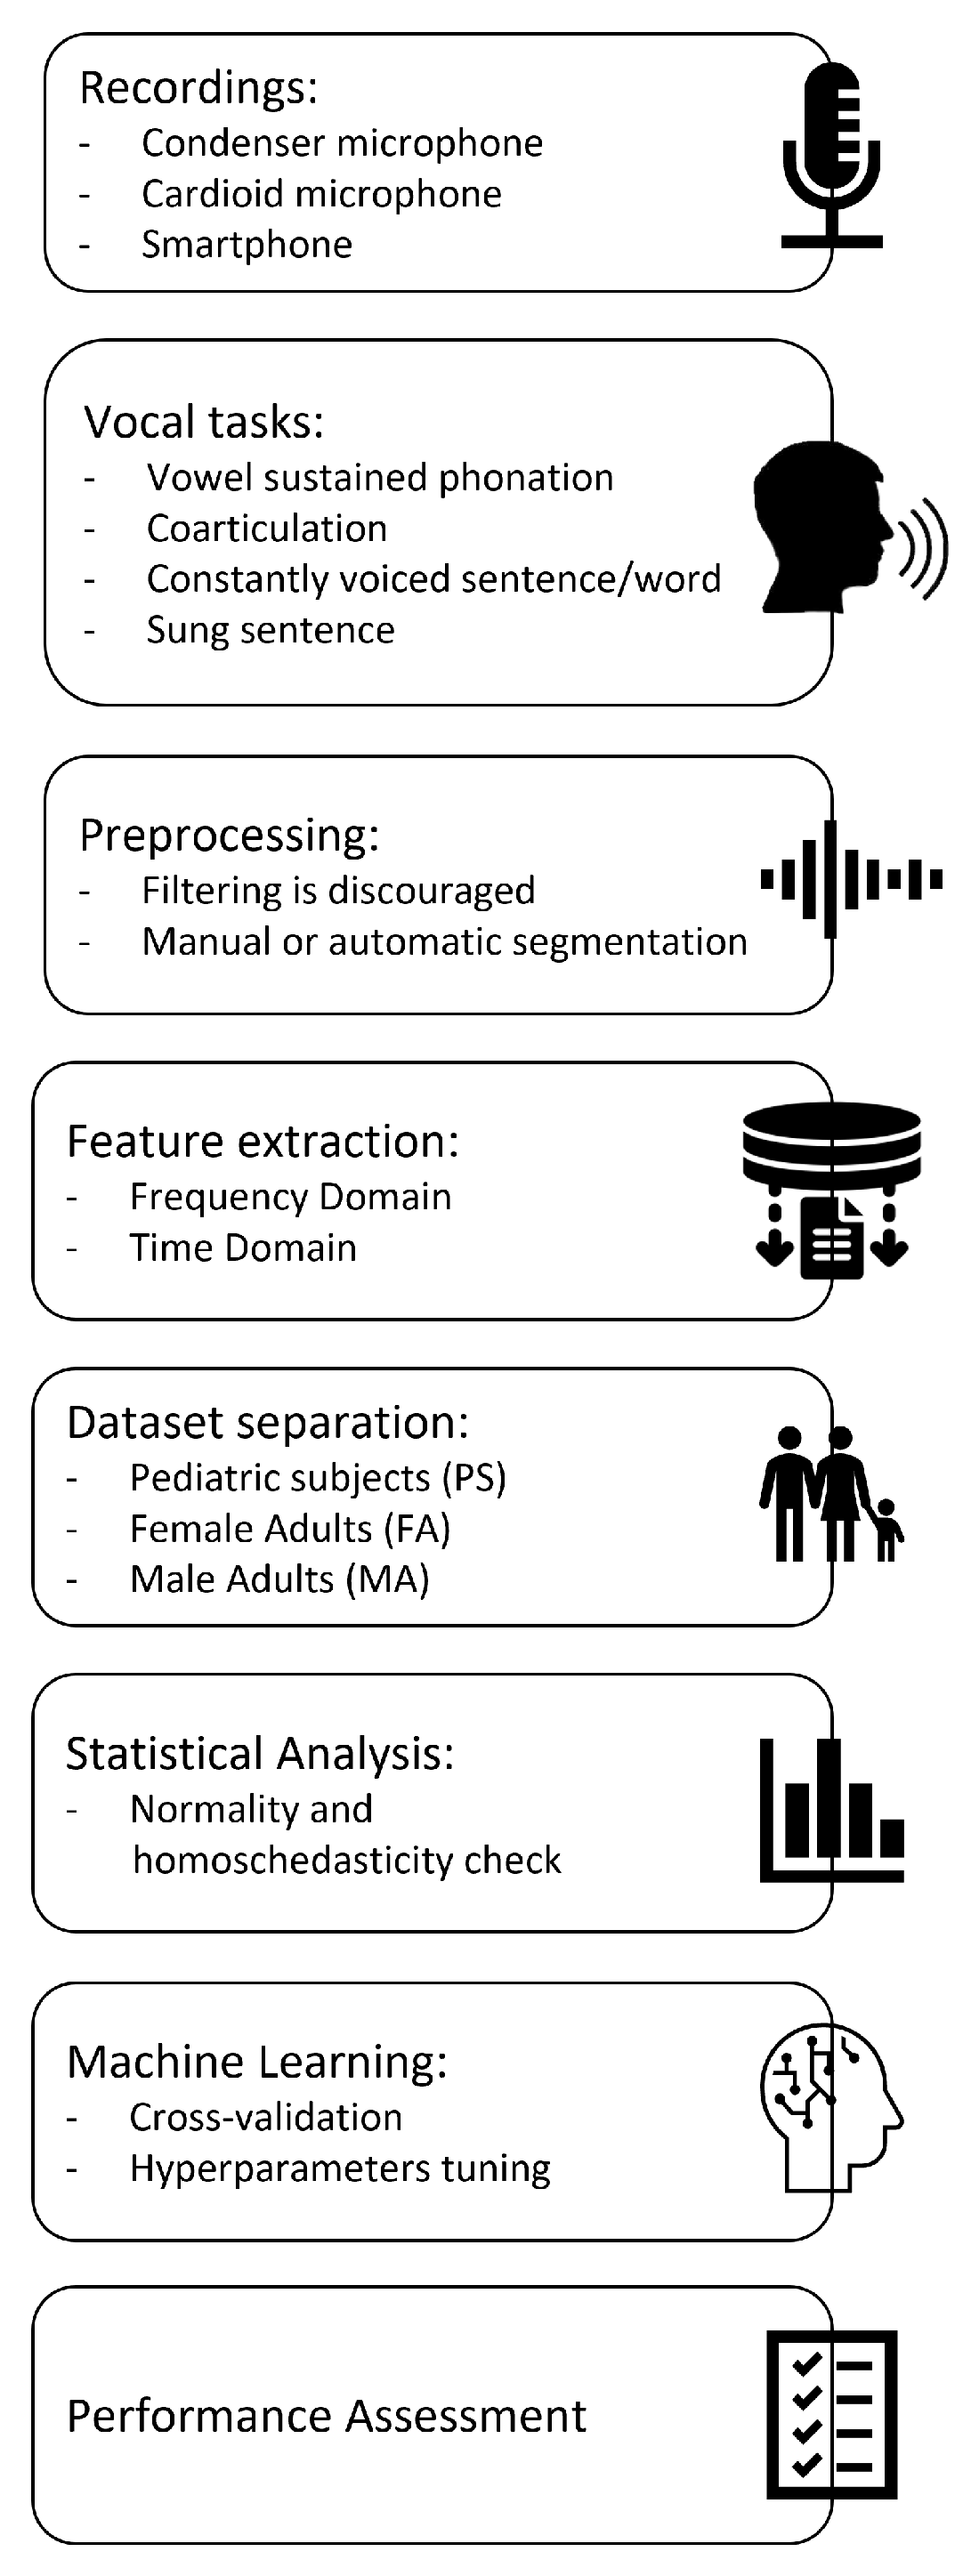
2.1. Recordings
- Flat frequency response.
- Noise level at least 15dB lower than the sound level of the softest phonation.
- Dynamic range upper limit higher than the sound level of the loudest phonation.
- Distance between microphone and source for which the maximally flat frequency response occurs.
2.2. Vocal tasks
- List of numbers from 1 to 10.
- Word /aiuole/ (IPA transcription «a’jwɔle»).
- Vowels /a/, /e/, /I/, /o/, /u/, sustained for at least 3s.
- Sentence “io amo le aiuole della mamma” (IPA transcription: «’io ‘amo ‘le a’jwɔle ‘del:a ‘mam:a», English translation: “I love mother’s flowerbeds”).
- Sung sentence “Fra Martino campanaro, dormi tu” (Italian version of the first sentence of the very well-known European traditional song Frère Jacques).
2.3. Preprocessing of audio samples
2.4. Acoustical analysis
2.5. Dataset separation
2.6. Machine learning
- For the KNN classifier: the number of neighbours k was evaluated between 2 and 27. The considered distance metrics were: “cityblock”, “Chebyshev”, “correlation”, “cosine”, “Euclidean”, “hamming”, “jaccard”, “mahalanobis”, “minkowski”, “seuclidean”, “spearman”. The distance weight was chosen between “equal”, “inverse”, “squared inverse”.
- For the SVM classifier: coding was selected between "one vs. one" or "one vs. all". Box constraint and kernel scale were evaluated between 10-3 and 103. The kernel function was set as Gaussian.
- For Random Forest: the fitcensemble.m function was used and the aggregation method was set as ‘Bag’. The minimum number of leaves was selected between 2 and 27, the maximum number of splits between 2 and 27, the split criterion between “deviance”, “gdi”, “twoing”, the number of variables to sample between 1 and 55.
2.7. Statistical analysis
2.8. Procedure validation
3. Results
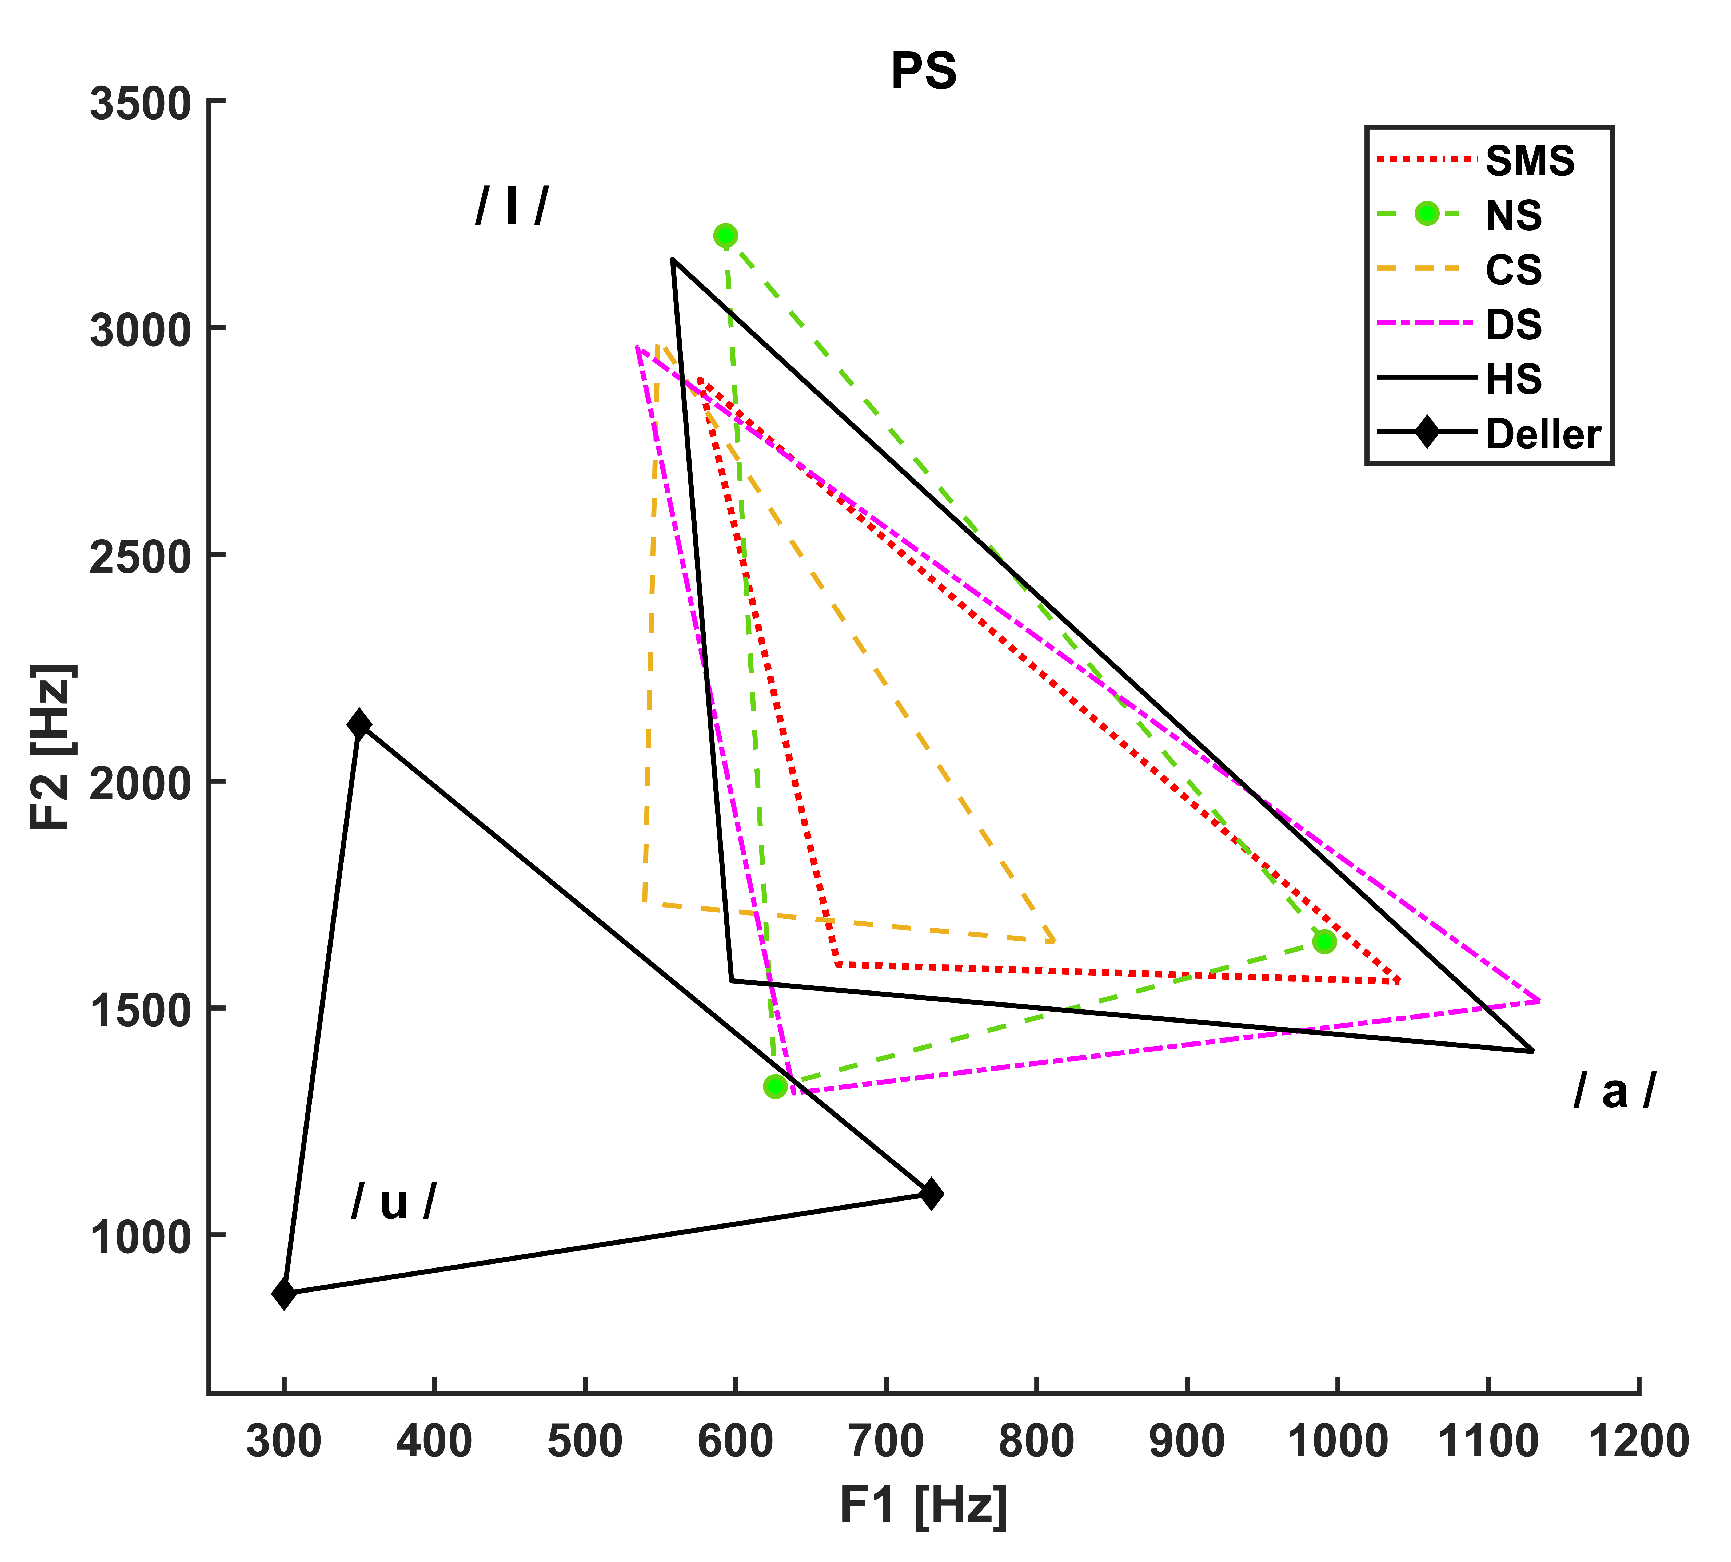
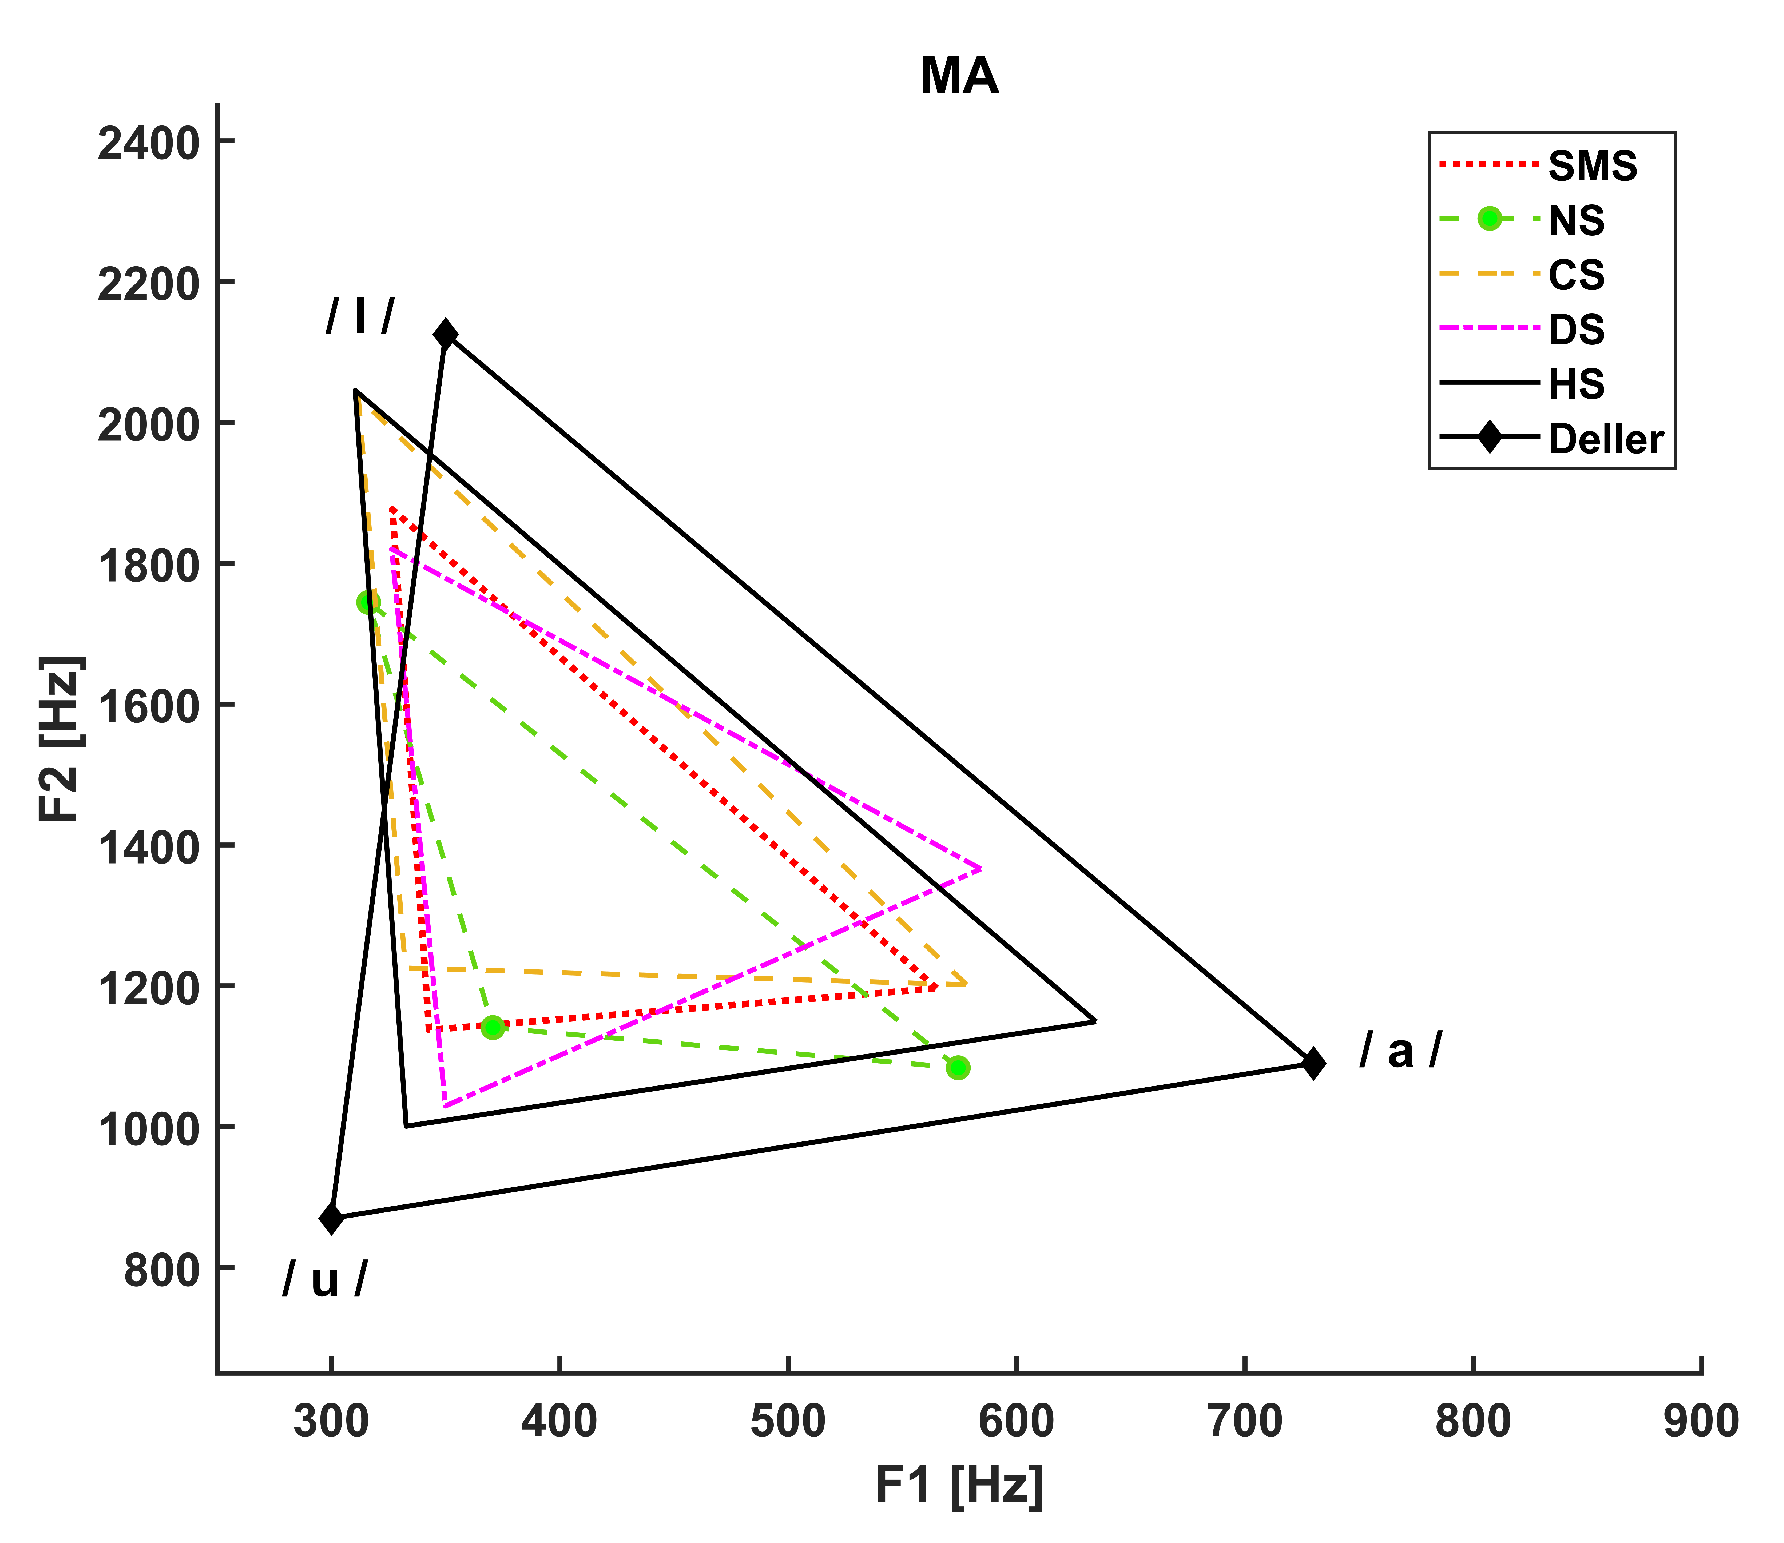
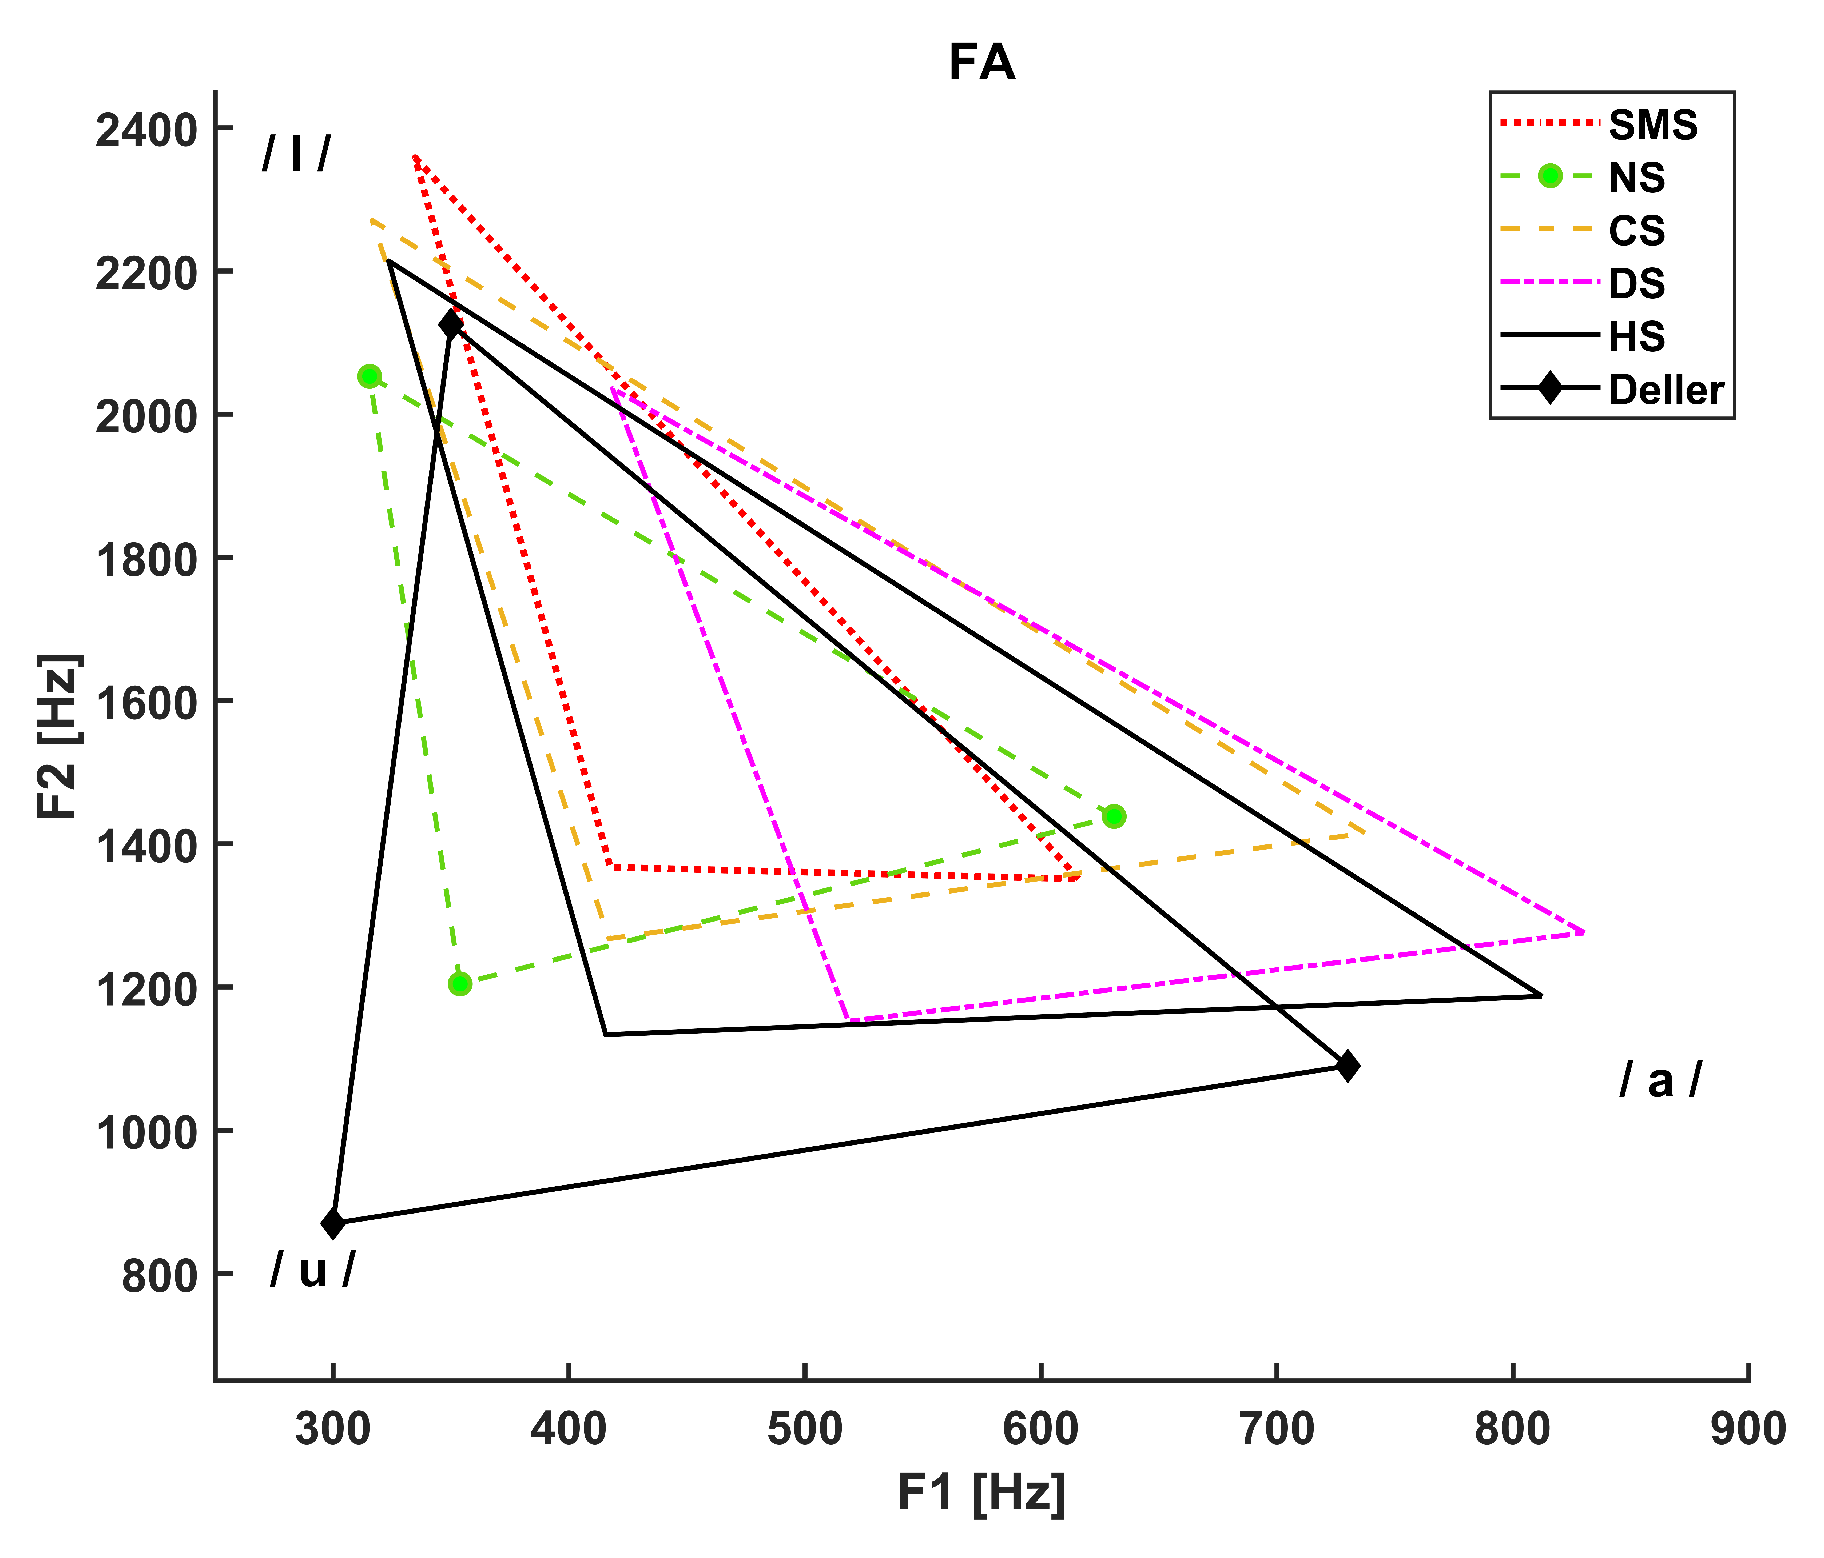
- The dotted line refers to SMS patients.
- The dashed line with circle markers refers to NS patients.
- The simple dashed line refers to CS patients.
- The dash-dotted line refers to DS patients.
4. Discussion
5. Conclusions
Author Contributions
Funding
Institutional Review Board Statement
Informed Consent Statement
Data Availability Statement
Acknowledgments
Conflicts of Interest
Appendix A
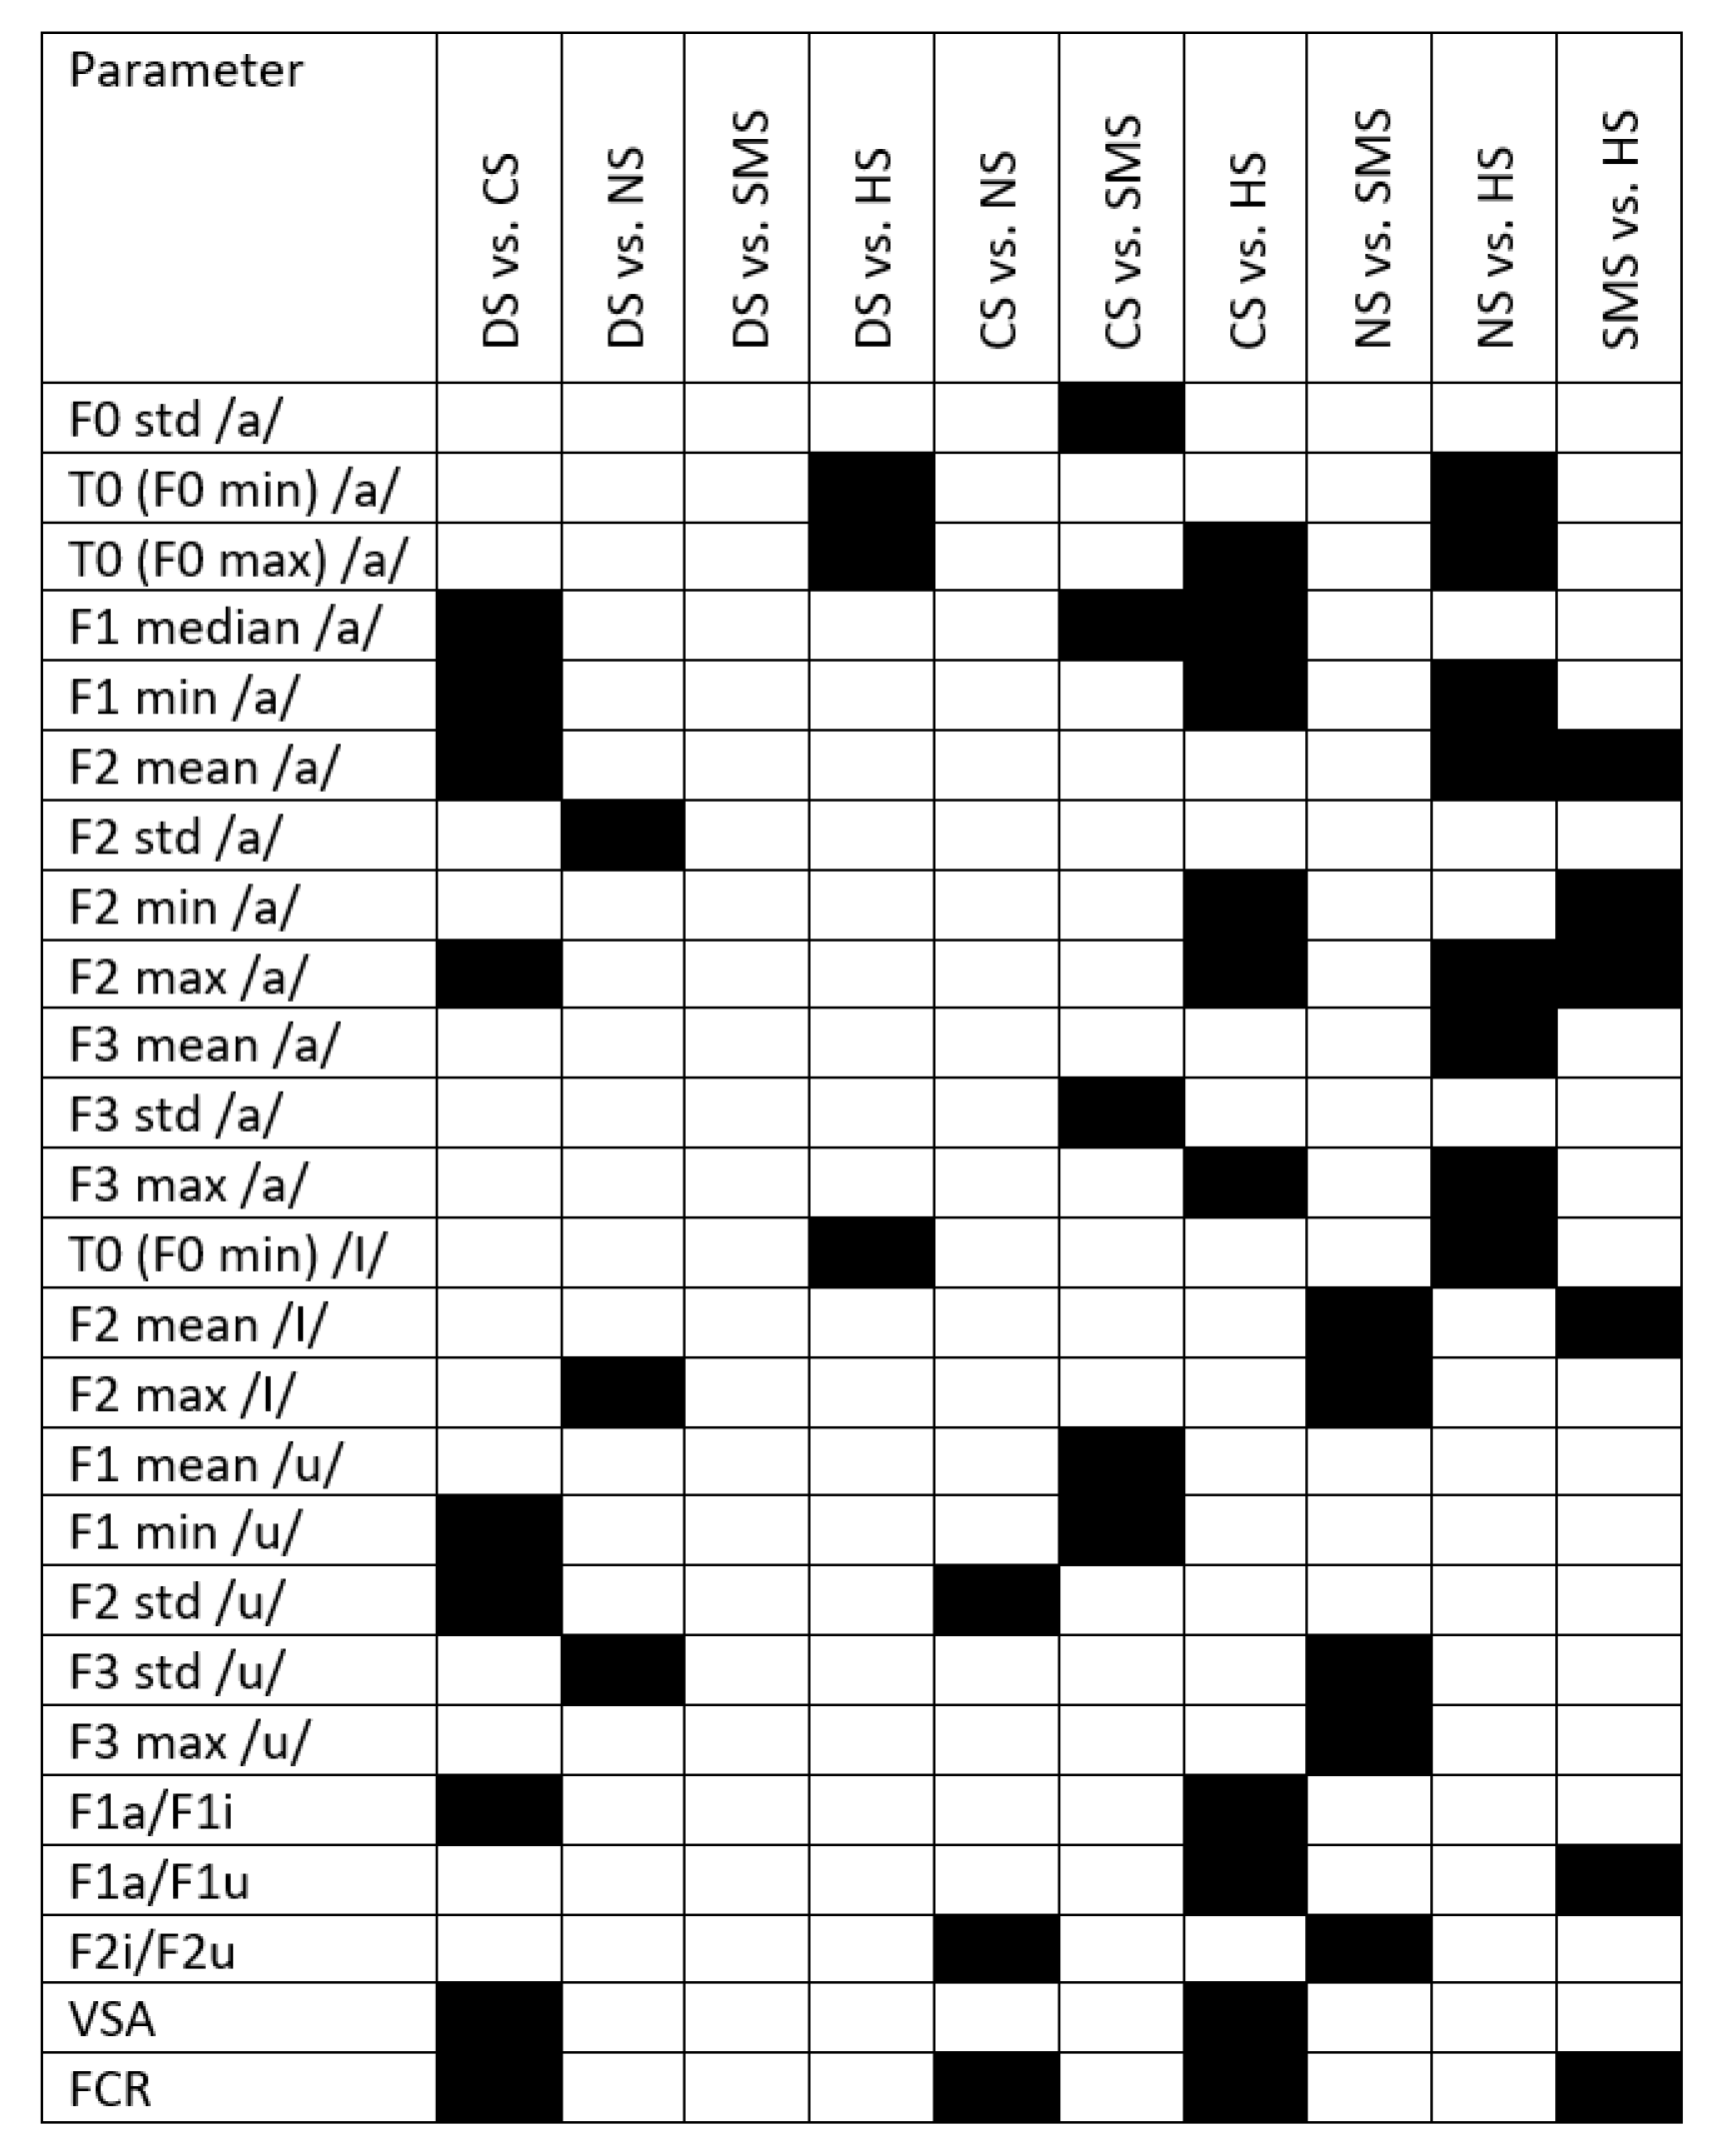
Appendix B
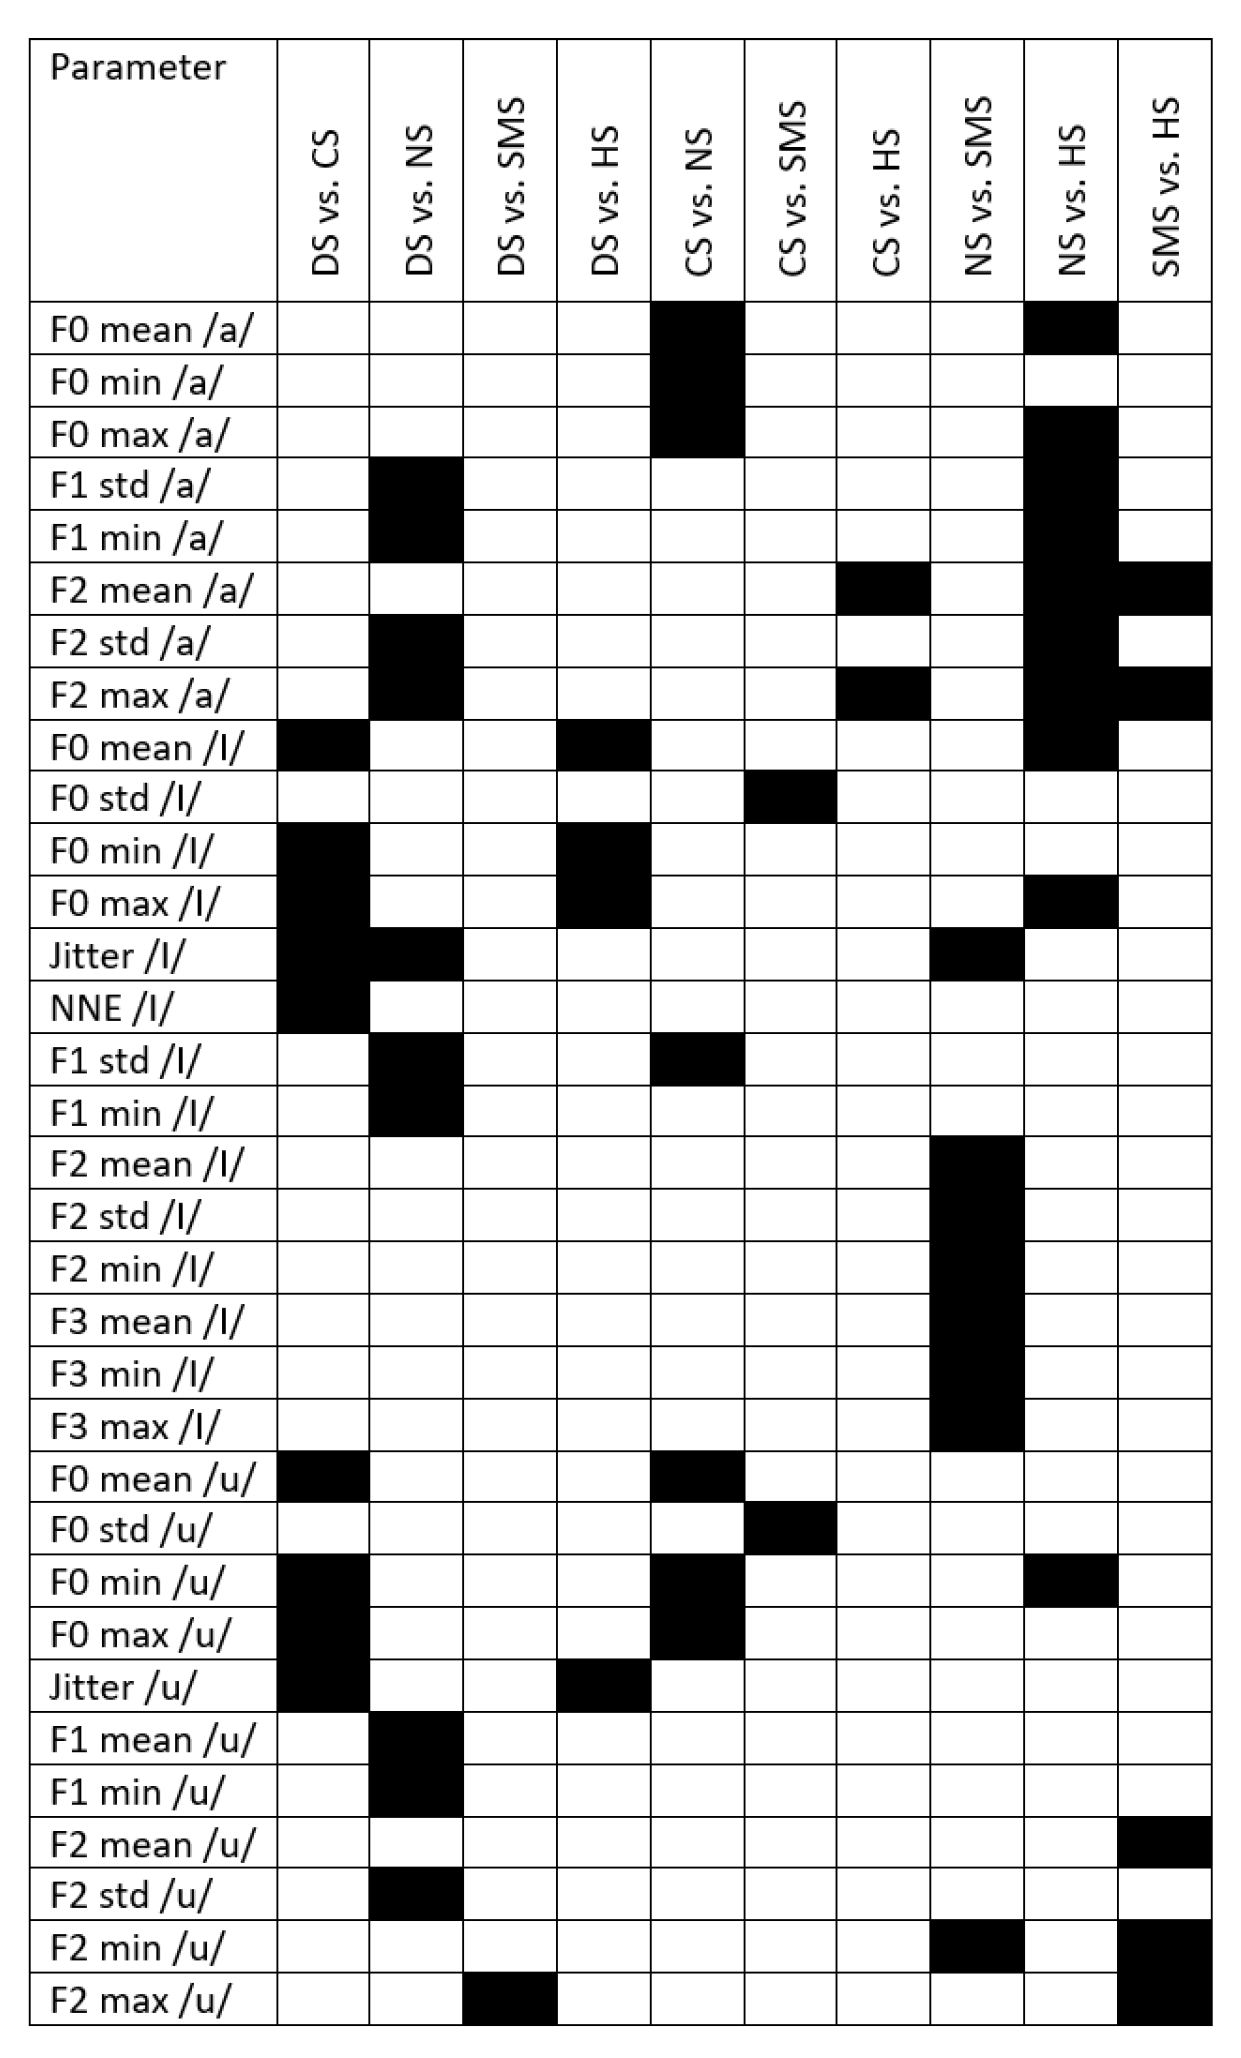
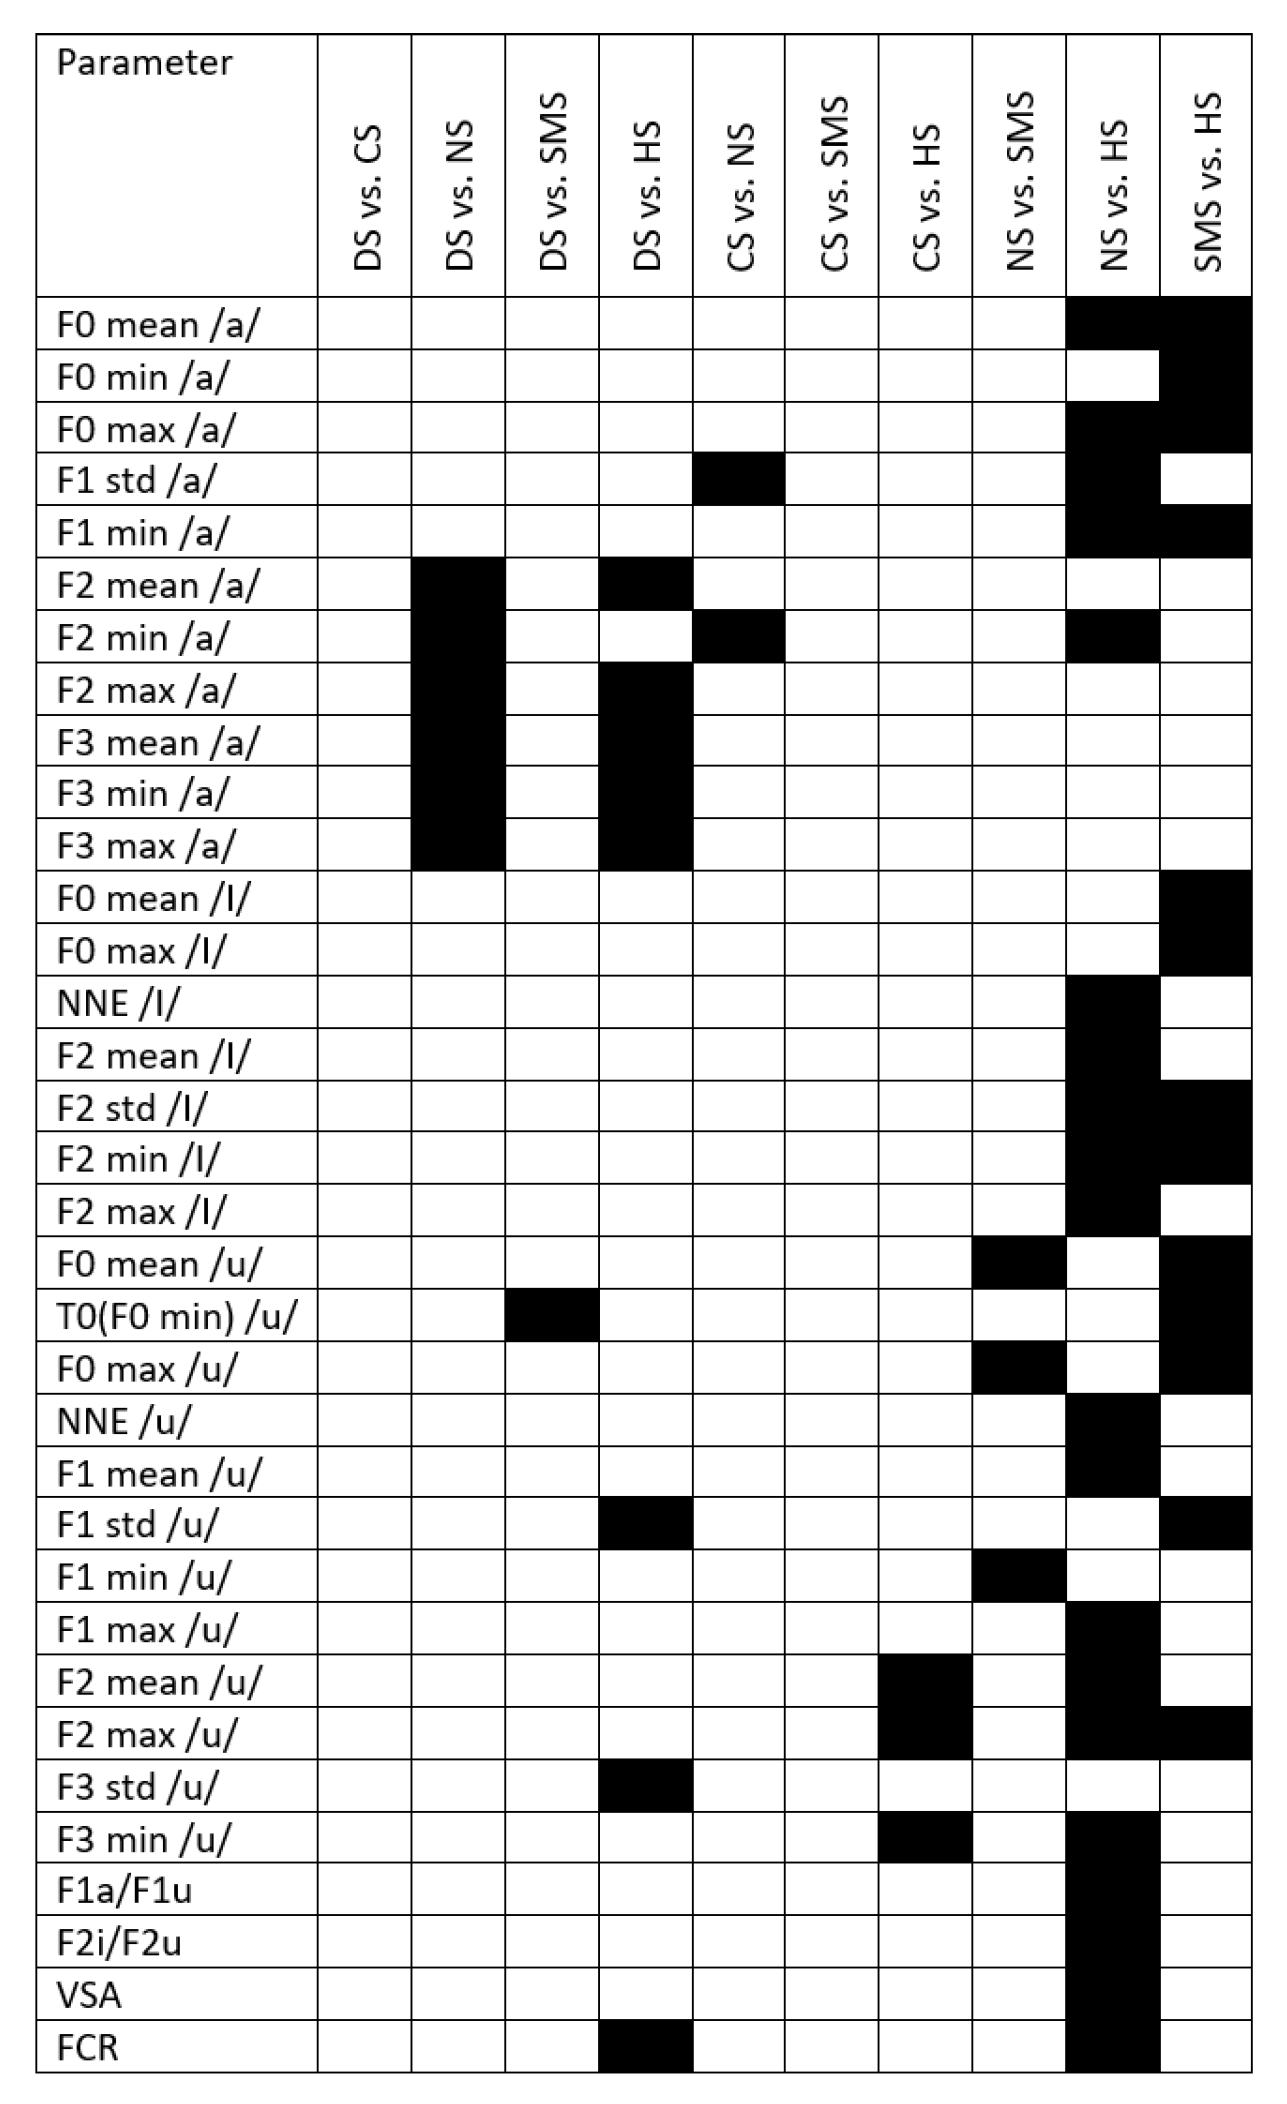
Appendix C
References
- Muhammad, G.; Altuwaijri, G.; Alsulaiman, M.; Ali, Z.; Mesallam, T.A.; Farahat, M.; Malki, K.H.; Al-Nasheri, A. Automatic voice pathology detection and classification using vocal tract area irregularity. Biocybernetics and Biomedical Engineering 2016, 36, 309–317. [Google Scholar] [CrossRef]
- Al-Nasheri, A.; Muhammad, G.; Alsulaiman, M.; Ali, Z.; Malki, K.H.; Mesallam, T.A.; Ibrahim, M.F. Voice pathology detection and classification using auto-correlation and entropy features in different frequency regions. Ieee Access 2017, 6, 6961–6974. [Google Scholar] [CrossRef]
- Bandini, A.; Giovannelli, F.; Orlandi, S.; Barbagallo, S.D.; Cincotta, M.; Vanni, P.; Chiaramonti, R.; Borgheresi, A.; Zaccara, G.; Manfredi, C. Automatic identification of dysprosody in idiopathic Parkinson’s disease. Biomedical Signal Processing and Control 2015, 17, 47–54. [Google Scholar] [CrossRef]
- Mittal, V.; Sharma, R. Classification of Parkinson Disease Based on Analysis and Synthesis of Voice Signal. International Journal of Healthcare Information Systems and Informatics (IJHISI) 2021, 16, 1–22. [Google Scholar] [CrossRef]
- Naranjo, L.; Perez, C.J.; Martin, J.; Campos-Roca, Y. A two-stage variable selection and classification approach for Parkinson’s disease detection by using voice recording replications. Computer methods and programs in biomedicine 2017, 142, 147–156. [Google Scholar] [CrossRef]
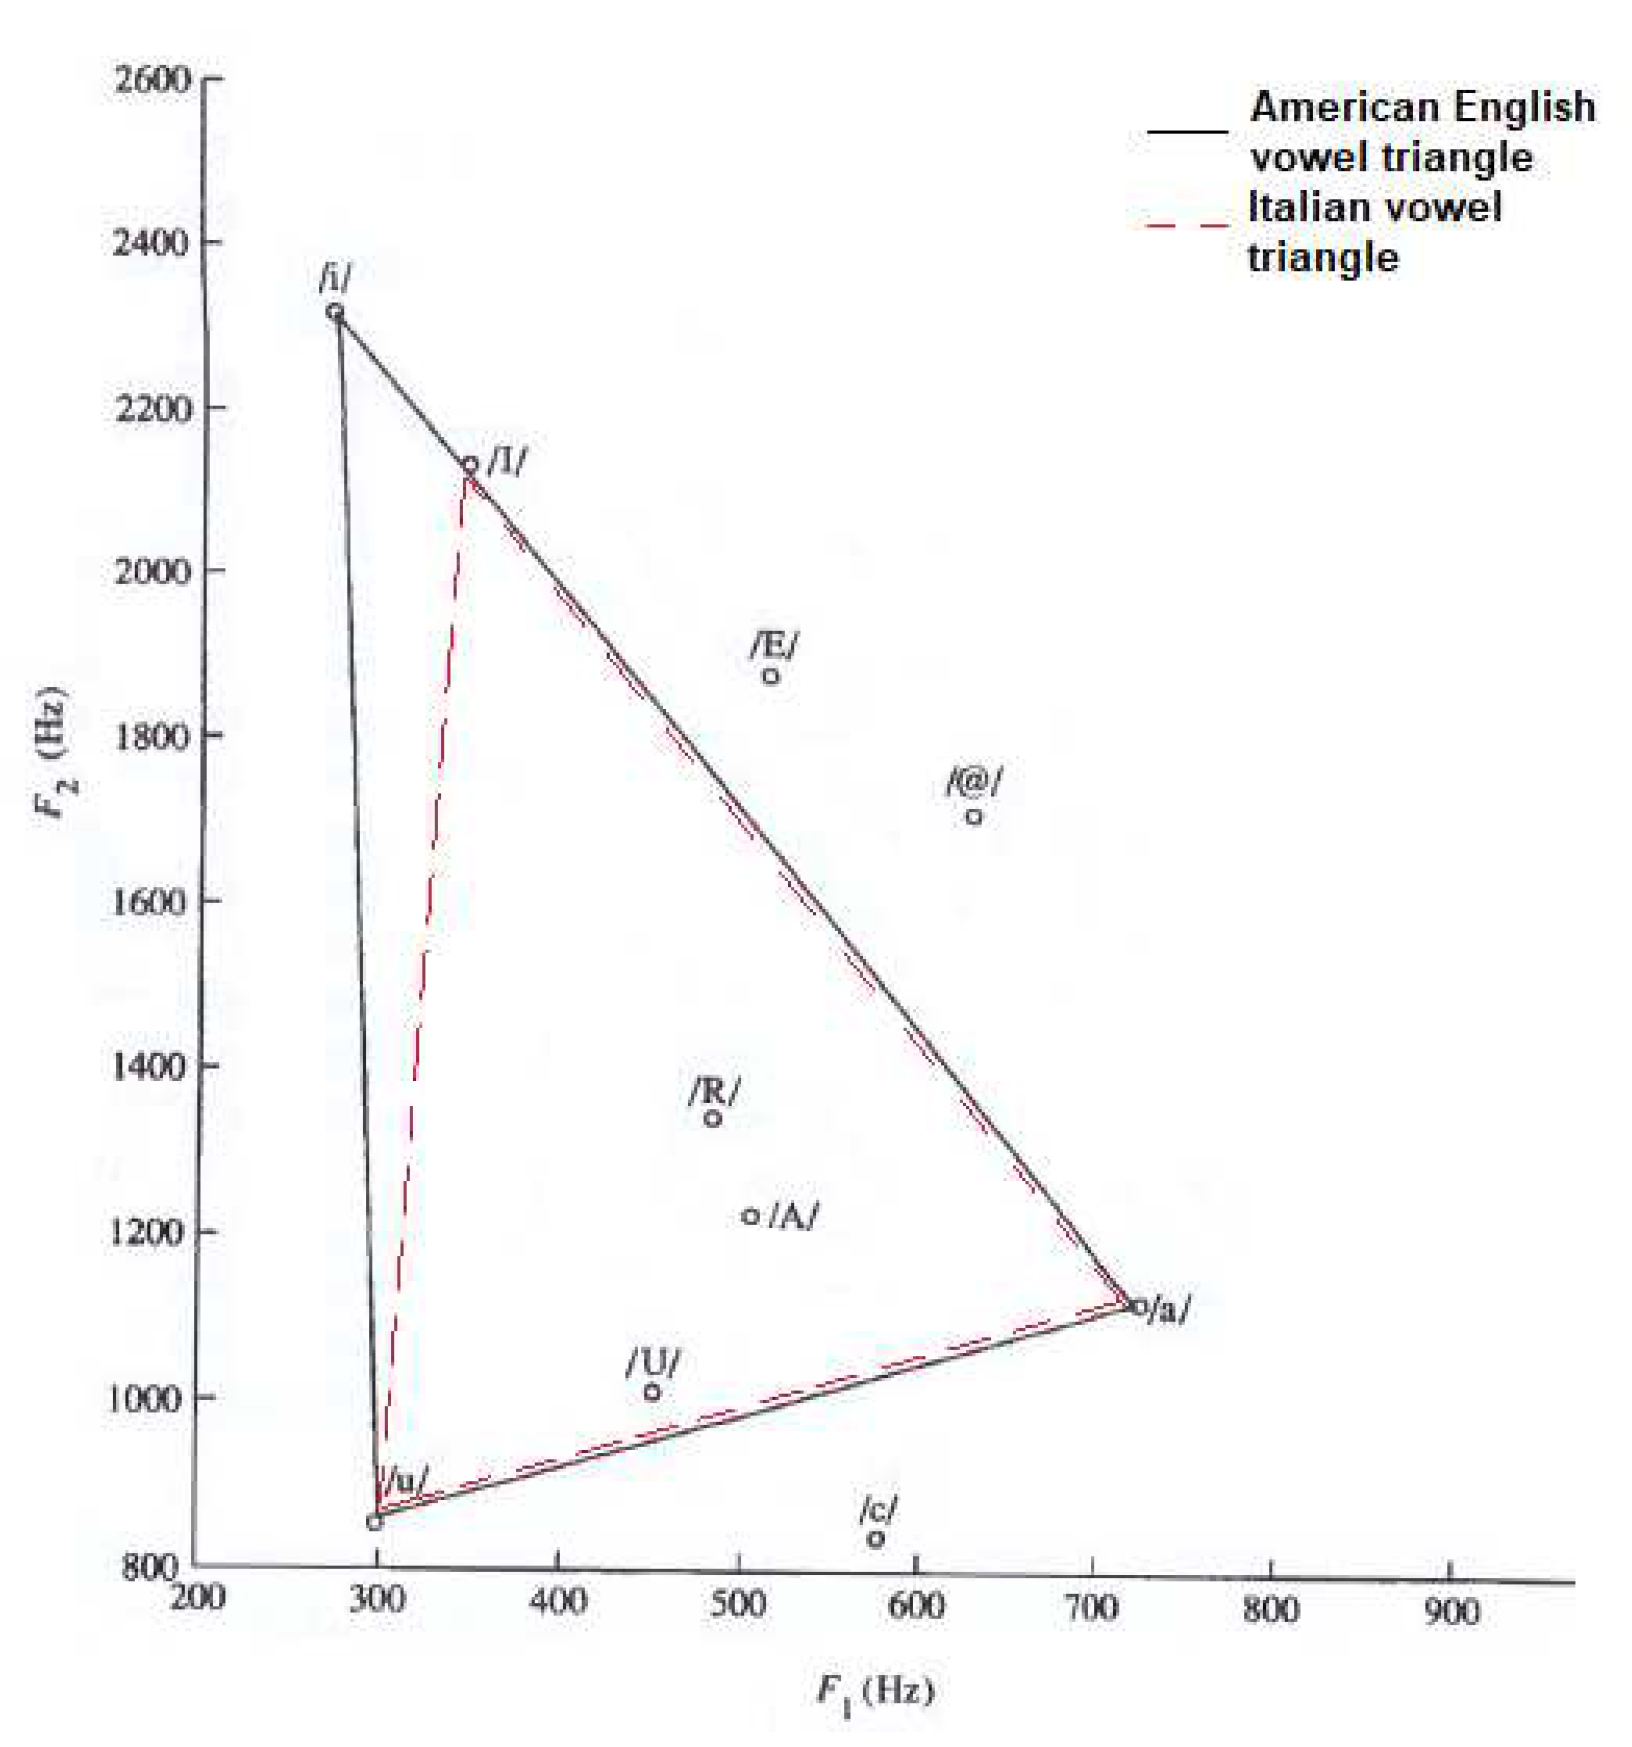
- Deller Jr, J.R. Discrete-time processing of speech signals. In Discrete-time processing of speech signals; 1993; pp. 908–908.
- Gripp, K.W.; Morse, L.A.; Axelrad, M.; Chatfield, K.C.; Chidekel, A.; Dobyns, W.; Doyle, D.; Kerr, B.; Lin, A.E.; Schwartz, D.D.; others. Costello syndrome: Clinical phenotype, genotype, and management guidelines. American Journal of Medical Genetics Part A 2019, 179, 1725–1744. [Google Scholar] [CrossRef]
- Norman, B.I. An examination of communication skills of individuals with Cardio-facio-cutaneous syndrome and Costello syndrome compared to typically developing individuals. PhD thesis, California State University, Sacramento, 2020.
- Moura, C.P.; Cunha, L.M.; Vilarinho, H.; Cunha, M.J.; Freitas, D.; Palha, M.; Pueschel, S.M.; Pais-Clemente, M. Voice parameters in children with Down syndrome. Journal of Voice 2008, 22, 34–42. [Google Scholar] [CrossRef]
- Bunton, K.; Leddy, M. An evaluation of articulatory working space area in vowel production of adults with Down syndrome. Clinical linguistics & phonetics 2011, 25, 321–334. [Google Scholar]
- Albertini, G.; Bonassi, S.; Dall’Armi, V.; Giachetti, I.; Giaquinto, S.; Mignano, M. Spectral analysis of the voice in Down syndrome. Research in developmental disabilities 2010, 31, 995–1001. [Google Scholar] [CrossRef] [PubMed]
- Zampini, L.; Fasolo, M.; Spinelli, M.; Zanchi, P.; Suttora, C.; Salerni, N. Prosodic skills in children with Down syndrome and in typically developing children. International Journal of Language & Communication Disorders 2016, 51, 74–83. [Google Scholar]
- Türkyilmaz, M.; Tokgöz Yılmaz, S.; Özcebe, E.; Yüksel, S.; Süslü, N.; Tekin, M. Voice characteristics of children with noonan syndrome Noonan sendromu olan çocuklarda ses özellikleri. Turkiye Klinikleri Journal of Medical Sciences 2014, 34. [Google Scholar] [CrossRef]
- Elemetrics, K. Operations manual, multi-dimensional voice program (MDVP) model 4305. Issue A. August. Pine Brook NJ: Kay Elemetric Corporation 1993.
- Pierpont, M.E.M.; Magoulas, P.L.; Adi, S.; Kavamura, M.I.; Neri, G.; Noonan, J.; Pierpont, E.I.; Reinker, K.; Roberts, A.E.; Shankar, S.; others. Cardio-facio-cutaneous syndrome: clinical features, diagnosis, and management guidelines. Pediatrics 2014, 134, e1149–e1162. [Google Scholar] [CrossRef] [PubMed]
- Wilson, M.; Dyson, A. Noonan syndrome: Speech and language characteristics. Journal of Communication Disorders 1982, 15, 347–352. [Google Scholar] [CrossRef]
- Hidalgo-De la Guía, I.; Garayzábal-Heinze, E.; Gómez-Vilda, P. Voice characteristics in smith–magenis syndrome: an acoustic study of laryngeal biomechanics. Languages 2020, 5, 31. [Google Scholar] [CrossRef]
- Hidalgo-De la Guía, I.; Garayzábal-Heinze, E.; Gómez-Vilda, P.; Martínez-Olalla, R.; Palacios-Alonso, D. Acoustic Analysis of Phonation in Children With Smith–Magenis Syndrome. Frontiers in Human Neuroscience 2021, 15, 661392. [Google Scholar] [CrossRef]
- Hillenbrand, J.; Houde, R.A. Acoustic correlates of breathy vocal quality: Dysphonic voices and continuous speech. Journal of Speech, Language, and Hearing Research 1996, 39, 311–321. [Google Scholar] [CrossRef]
- Dejonckere, P.H.; Bradley, P.; Clemente, P.; Cornut, G.; Crevier-Buchman, L.; Friedrich, G.; Van De Heyning, P.; Remacle, M.; Woisard, V. A basic protocol for functional assessment of voice pathology, especially for investigating the efficacy of (phonosurgical) treatments and evaluating new assessment techniques: guideline elaborated by the Committee on Phoniatrics of the European Laryngological Society (ELS). European Archives of Oto-rhino-laryngology 2001, 258, 77–82. [Google Scholar]
- Svec, J.G.; Granqvist, S. Guidelines for selecting microphones for human voice production research 2010.
- Hidalgo, I.; Vilda, P.G.; Garayzábal, E. Biomechanical Description of phonation in children affected by Williams syndrome. Journal of Voice 2018, 32, 515–e15. [Google Scholar] [CrossRef]
- Corrales-Astorgano, M.; Escudero-Mancebo, D.; González-Ferreras, C. Acoustic characterization and perceptual analysis of the relative importance of prosody in speech of people with Down syndrome. Speech Communication 2018, 99, 90–100. [Google Scholar] [CrossRef]
- Flanagan, O.; Chan, A.; Roop, P.; Sundram, F. Using acoustic speech patterns from smartphones to investigate mood disorders: scoping review. JMIR mHealth and uHealth 2021, 9, e24352. [Google Scholar] [CrossRef]
- Yoon, H.; Gaw, N. A novel multi-task linear mixed model for smartphone-based telemonitoring. Expert Systems with Applications 2021, 164, 113809. [Google Scholar] [CrossRef]
- Amir, O.; Anker, S.D.; Gork, I.; Abraham, W.T.; Pinney, S.P.; Burkhoff, D.; Shallom, I.D.; Haviv, R.; Edelman, E.R.; Lotan, C. Feasibility of remote speech analysis in evaluation of dynamic fluid overload in heart failure patients undergoing haemodialysis treatment. ESC Heart Failure 2021, 8, 2467–2472. [Google Scholar] [CrossRef]
- Manfredi, C.; Lebacq, J.; Cantarella, G.; Schoentgen, J.; Orlandi, S.; Bandini, A.; DeJonckere, P.H. Smartphones offer new opportunities in clinical voice research. Journal of voice 2017, 31, 111–e1. [Google Scholar] [CrossRef]
- Cavalcanti, J.C.; Englert, M.; Oliveira Jr, M.; Constantini, A.C. Microphone and audio compression effects on acoustic voice analysis: A pilot study. Journal of Voice 2021. [Google Scholar] [CrossRef]
- Glover, M.; Duhamel, M.F. Assessment of Two Audio-Recording Methods for Remote Collection of Vocal Biomarkers Indicative of Tobacco Smoking Harm. Acoustics Australia 2023, 51, 39–52. [Google Scholar] [CrossRef]
- Lebacq, J.; Schoentgen, J.; Cantarella, G.; Bruss, F.T.; Manfredi, C.; DeJonckere, P. Maximal ambient noise levels and type of voice material required for valid use of smartphones in clinical voice research. Journal of voice 2017, 31, 550–556. [Google Scholar] [CrossRef] [PubMed]
- Frassineti, L.; Zucconi, A.; Calà, F.; Sforza, E.; Onesimo, R.; Leoni, C.; Rigante, M.; Manfredi, C.; Zampino, G. Analysis of vocal patterns as a diagnostic tool in patients with genetic syndromes. PROCEEDINGS E REPORT 2021, p. 83.
- Suppa, A.; Costantini, G.; Asci, F.; Di Leo, P.; Al-Wardat, M.S.; Di Lazzaro, G.; Scalise, S.; Pisani, A.; Saggio, G. Voice in Parkinson’s disease: a machine learning study. Frontiers in Neurology 2022, 13, 831428. [Google Scholar] [CrossRef] [PubMed]
- Lenoci, G.; Celata, C.; Ricci, I.; Chilosi, A.; Barone, V. Vowel variability and contrast in childhood apraxia of speech: Acoustics and articulation. Clinical linguistics & phonetics 2021, 35, 1011–1035. [Google Scholar]
- Gómez-García, J.; Moro-Velázquez, L.; Arias-Londoño, J.D.; Godino-Llorente, J.I. On the design of automatic voice condition analysis systems. Part III: Review of acoustic modelling strategies. Biomedical Signal Processing and Control 2021, 66, 102049. [Google Scholar] [CrossRef]
- Seok, J.; Ryu, Y.M.; Jo, S.A.; Lee, C.Y.; Jung, Y.S.; Ryu, J.; Ryu, C.H. Singing voice range profile: New objective evaluation methods for voice change after thyroidectomy. Clinical Otolaryngology 2021, 46, 332–339. [Google Scholar] [CrossRef] [PubMed]
- Carrón, J.; Campos-Roca, Y.; Madruga, M.; Pérez, C.J. A mobile-assisted voice condition analysis system for Parkinson’s disease: assessment of usability conditions. Biomedical engineering online 2021, 20, 1–24. [Google Scholar] [CrossRef]
- Kohler, M.; Vellasco, M.M.; Cataldo, E.; others. Analysis and classification of voice pathologies using glottal signal parameters. Journal of Voice 2016, 30, 549–556. [Google Scholar]
- Gómez-Vilda, P.; Fernández-Baillo, R.; Nieto, A.; Díaz, F.; Fernández-Camacho, F.J.; Rodellar, V.; Álvarez, A.; Martínez, R. Evaluation of voice pathology based on the estimation of vocal fold biomechanical parameters. Journal of Voice 2007, 21, 450–476. [Google Scholar] [CrossRef] [PubMed]
- Gripp, K.W.; Lin, A.E. Costello syndrome: a Ras/mitogen activated protein kinase pathway syndrome (rasopathy) resulting from HRAS germline mutations. Genetics in Medicine 2012, 14, 285–292. [Google Scholar] [CrossRef] [PubMed]
- Kent, R.D.; Vorperian, H.K. Speech impairment in Down syndrome: A review 2013.
- Torres, G.X.; Santos, E.d.S.; César, C.P.H.A.R.; Irineu, R.d.A.; Dias, I.R.R.; Ramos, A.F. Clinical orofacial and myofunctional manifestations in an adolescent with Noonan Syndrome: a case report. Revista CEFAC 2020, 22. [Google Scholar] [CrossRef]
- Rinaldi, B.; Villa, R.; Sironi, A.; Garavelli, L.; Finelli, P.; Bedeschi, M.F. Smith-magenis syndrome—clinical review, biological background and related disorders. Genes 2022, 13, 335. [Google Scholar] [CrossRef] [PubMed]
- Vieira, M.N.; McInnes, F.R.; Jack, M.A. On the influence of laryngeal pathologies on acoustic and electroglottographic jitter measures. The Journal of the Acoustical Society of America 2002, 111, 1045–1055. [Google Scholar] [CrossRef]
- Schroder, C. The book of Audacity: Record, edit, mix, and master with the free audio editor; No Starch Press, 2011.
- Morelli, M.S.; Manfredi, S.O.C. BioVoice: A multipurpose tool for voice analysis. Proceeding 11th International Workshop Models and Analysis of Vocal Emissions for Biomedical Applications, MAVEBA 2019. Firenze University Press, 2019, pp. 261–264.
- Kent, R.D.; Kim, Y.J. Toward an acoustic typology of motor speech disorders. Clinical linguistics & phonetics 2003, 17, 427–445. [Google Scholar]
- Sapir, S.; Ramig, L.O.; Spielman, J.L.; Fox, C. Formant centralization ratio: A proposal for a new acoustic measure of dysarthric speech 2010.
- Blog, C. Effects of Intensive Voice Treatment (LSVT) on Vowel Articulation in Dysarthric Individuals With Idiopathic Parkinson Disease: Acoustic and Perceptual Findings Shimon Sapir, Jennifer L. Spielman, Lorraine O. Ramig, Brad H. Story, and Cynthia Fox. Journal of Speech, Language, and Hearing Research 2018, 50, 899–912. [Google Scholar]
- Harar, P.; Galaz, Z.; Alonso-Hernandez, J.B.; Mekyska, J.; Burget, R.; Smekal, Z. Towards robust voice pathology detection: Investigation of supervised deep learning, gradient boosting, and anomaly detection approaches across four databases. Neural Computing and Applications 2020, 32, 15747–15757. [Google Scholar] [CrossRef]
- Bur, A.M.; Shew, M.; New, J. Artificial intelligence for the otolaryngologist: a state of the art review. Otolaryngology–Head and Neck Surgery 2019, 160, 603–611. [Google Scholar] [CrossRef]
- Costantini, G.; Di Leo, P.; Asci, F.; Zarezadeh, Z.; Marsili, L.; Errico, V.; Suppa, A.; Saggio, G. Machine Learning based Voice Analysis in Spasmodic Dysphonia: An Investigation of Most Relevant Features from Specific Vocal Tasks. BIOSIGNALS, 2021, pp. 103–113.
- Maccarini, L.R.; Lucchini, E. La valutazione soggettiva e oggettiva della disfonia. Il Protocollo SIFEL, Relazione Ufficiale al XXXVI Congresso Nazionale della Società Italiana di Foniatria e Logopedia. Acta Phoniatrica Latina 2002, 24, 13–42. [Google Scholar]
- Choi, N.; Ko, J.M.; Shin, S.H.; Kim, E.K.; Kim, H.S.; Song, M.K.; Choi, C.W. Phenotypic and genetic characteristics of five Korean patients with Costello syndrome. Cytogenetic and Genome Research 2019, 158, 184–191. [Google Scholar] [CrossRef] [PubMed]
- De Smet, H.J.; Catsman-Berrevoets, C.; Aarsen, F.; Verhoeven, J.; Mariën, P.; Paquier, P.F. Auditory-perceptual speech analysis in children with cerebellar tumours: a long-term follow-up study. european journal of paediatric neurology 2012, 16, 434–442. [Google Scholar] [CrossRef] [PubMed]
- Boersma, P.; Van Heuven, V. Speak and unSpeak with PRAAT. Glot International 2001, 5, 341–347. [Google Scholar]
- Lee, S.H.; Yu, J.F.; Hsieh, Y.H.; Lee, G.S. Relationships between formant frequencies of sustained vowels and tongue contours measured by ultrasonography. American journal of speech-language pathology 2015, 24, 739–749. [Google Scholar] [CrossRef]
- Yellon, R.F. Prevention and management of complications of airway surgery in children. Pediatric Anesthesia 2004, 14, 107–111. [Google Scholar] [CrossRef]
| Feature | Description |
|---|---|
| F0 mean [Hz] | Mean fundamental frequency |
| F0 median [Hz] | Median fundamental frequency |
| F0 std [Hz] | Standard deviation of fundamental frequency |
| F0 min [Hz] | Minimum fundamental frequency |
| T0 (F0 min) [s] | Time instant at which the minimum of F0 occurs |
| F0 max [Hz] | Maximum fundamental frequency |
| T0 (F0 max) [s] | Time instant at which the maximum of F0 occurs |
| Jitter [%] | Frequency variation of F0 |
| NNE [dB] | Normalized Noise Energy |
| F1 mean [Hz] | Mean value of the first formant |
| F1 median [Hz] | Median value of the first formant |
| F1 std [Hz] | Standard deviation of the first formant |
| F1 min [Hz] | Minimum value of the first formant |
| F1 max [Hz] | Maximum value of the first formant |
| F2 mean [Hz] | Mean value of the second formant |
| F2 median [Hz] | Median value of the second formant |
| F2 std [Hz] | Standard deviation of the second formant |
| F2 min [Hz] | Minimum value of the second formant |
| F2 max [Hz] | Maximum value of the second formant |
| F3 mean [Hz] | Mean value of the third formant |
| F3 median [Hz] | Median value of the third formant |
| F3 std [Hz] | Standard deviation of the third formant |
| F3 min [Hz] | Minimum value of the third formant |
| F3 max [Hz] | Maximum value of the third formant |
| Signal duration [s] | Total audio file duration |
| % voiced | Percentage of voiced parts inside the whole signal |
| Voiced duration [s] | Total duration of voiced parts |
| Number Units | Number of voiced parts |
| Duration mean [s] | Mean duration of voiced parts |
| Duration std [s] | Standard deviation of duration of voiced parts |
| Duration min [s] | Minimum duration of voiced parts |
| Duration max [s] | Maximum duration of voiced parts |
| Number pauses | Total number of pauses in the audio file |
| Pause duration mean [s] | Mean duration of pauses |
| Pause duration std [s] | Standard deviation of duration of pauses |
| Pause duration min [s] | Minimum duration of pauses |
| Pause duration max [s] | Maximum duration of pauses |
| PS | FA | MA | |
|---|---|---|---|
| CS | 9.9 (2.0) [9] | 16.4 (4.3) [15] | 29.5 (2.1) [6] |
| DS | 7.2 (3.6) [18] | 21.2 (11.7) [12] | 18.3 (2.2) [9] |
| NS | 10.7 (2.3) [15] | 22.4 (7.7) [18] | 23.7 (8.4) [18] |
| SMS | 8.0 (2.0) [24] | 17.5 (1.3) [15] | 16.3 (1.5) [9] |
| HS | 8.9 (3.1) [21] | 18.3 (6.8) [9] | 21.3 (6.4) [18] |
| Parameter | Kruskal-Wallis H-statistic | p-value |
|---|---|---|
| F0 std /a/ | 11.58 | 0.021 |
| T0 (F0 min) /a/* | 19.68 | <0.001 |
| T0 (F0 max) /a/* | 23.40 | <0.001 |
| NNE /a/ | 11.14 | 0.025 |
| F1 median /a/* | 20.02 | <0.001 |
| F1 min /a/* | 21.56 | <0.001 |
| F1 max /a/* | 16.50 | 0.002 |
| F2 mean /a/* | 20.29 | <0.001 |
| F2 std /a/ | 13.27 | 0.01 |
| F2 min /a/* | 13.84 | 0.008 |
| F2 max /a/* | 29.77 | <0.001 |
| F3 mean /a/* | 10.80 | 0.029 |
| F3 std /a/ | 22.01 | <0.001 |
| F3 min /a/* | 10.09 | 0.039 |
| F3 max /a/* | 15.69 | 0.003 |
| T0 (F0 min) /I/* | 19.58 | <0.001 |
| T0 (F0 max) /I/ | 10.75 | 0.03 |
| F2 mean /I/* | 20.62 | <0.001 |
| F2 max /I/ | 17.44 | 0.002 |
| F1 mean /u/ | 10.93 | 0.027 |
| F1 std /u/ | 10.44 | 0.034 |
| F1 min /u/ | 15.70 | 0.003 |
| F2 std /u/ | 14.29 | 0.006 |
| F2 max /u/ | 10.93 | 0.027 |
| F3 std /u/ | 12.80 | 0.012 |
| F3 max /u/ | 10.50 | 0.033 |
| F1a/F1i* | 18.14 | 0.001 |
| F1a/F1u* | 18.07 | 0.002 |
| F2i/F2u | 11.94 | 0.018 |
| VSA* | 17.53 | 0.002 |
| FCR* | 26.98 | <0.001 |
| Parameter | Kruskal-Wallis H-statistic | p-value |
|---|---|---|
| F0 mean /a/* | 18.70 | <0.001 |
| F0 min /a/ | 14.76 | 0.005 |
| F0 max /a/* | 17.37 | 0.002 |
| NNE /a/ | 11.50 | 0.022 |
| F1 mean /a/ | 14.07 | 0.007 |
| F1 std /a/* | 18.53 | <0.001 |
| F1 min /a/* | 18.14 | 0.001 |
| F2 mean /a/* | 19.01 | <0.001 |
| F2 std /a/* | 16.00 | 0.003 |
| F2 min /a/ | 10.20 | 0.04 |
| F2 max /a/* | 24.78 | <0.001 |
| F0 mean /I/* | 18.70 | <0.001 |
| F0 std /I/ | 11.07 | 0.026 |
| F0 min /I/* | 13.05 | 0.011 |
| F0 max /I/* | 19.55 | <0.001 |
| Jitter /I/ | 21.09 | <0.001 |
| NNE /I/ | 10.41 | 0.034 |
| F1 std /I/ | 15.94 | 0.003 |
| F1 min /I/ | 13.07 | 0.011 |
| F2 mean /I/ | 14.13 | 0.007 |
| F2 std /I/ | 12.57 | 0.014 |
| F2 min /I/ | 15.65 | 0.004 |
| F3 mean /I/ | 17.60 | 0.001 |
| F3 min /I/ | 14.07 | 0.007 |
| F3 max /I/ | 15.14 | 0.004 |
| F0 mean /u/ | 17.24 | 0.002 |
| F0 std /u/ | 12.73 | 0.013 |
| F0 min /u/* | 19.72 | <0.001 |
| F0 max /u/ | 11.87 | 0.018 |
| Jitter /u/* | 11.77 | 0.019 |
| F1 mean /u/ | 17.38 | 0.002 |
| F1 min /u/ | 17.77 | 0.001 |
| F2 mean /u/* | 13.89 | 0.008 |
| F2 std /u/ | 14.65 | 0.005 |
| F2 min /u/* | 13.38 | 0.01 |
| F2 max /u/* | 17.54 | 0.002 |
| F3 std /u/ | 10.50 | 0.033 |
| Parameter | Kruskal-Wallis H-statistic | p-value |
|---|---|---|
| F0 mean /a/* | 22.61 | <0.001 |
| F0 min /a/* | 21.28 | <0.001 |
| F0 max /a/* | 22.29 | <0.001 |
| F1 std /a/* | 23.17 | <0.001 |
| F1 min /a/* | 14.70 | 0.005 |
| F2 mean /a/* | 20.67 | <0.001 |
| F2 min /a/* | 29.86 | <0.001 |
| F2 max /a/* | 15.38 | 0.004 |
| F3 mean /a/* | 19.49 | <0.001 |
| F3 min /a/* | 18.36 | 0.001 |
| F3 max /a/* | 18.19 | 0.001 |
| F0 mean /I/* | 18.31 | 0.001 |
| F0 max /I/* | 21.74 | <0.001 |
| NNE /I/* | 24.75 | <0.001 |
| F2 mean /I/* | 15.58 | 0.004 |
| F2 std /I/* | 13.60 | 0.009 |
| F2 min /I/* | 16.94 | 0.002 |
| F2 max /I/* | 11.81 | 0.019 |
| F0 mean /u/* | 25.06 | <0.001 |
| T0(F0 min) /u/* | 15.99 | 0.003 |
| F0 max /u/* | 24.86 | <0.001 |
| NNE /u/* | 16.51 | 0.002 |
| F1 mean /u/* | 11.67 | 0.02 |
| F1 std /u/* | 17.51 | 0.002 |
| F1 min /u/ | 14.64 | 0.006 |
| F1 max /u/* | 12.66 | 0.013 |
| F2 mean /u/* | 16.32 | 0.003 |
| F2 std /u/ | 9.46 | 0.05 |
| F2 min /u/ | 10.08 | 0.039 |
| F2 max /u/* | 27.40 | <0.001 |
| F3 mean /u/ | 11.58 | 0.021 |
| F3 std /u/* | 12.71 | 0.013 |
| F3 min /u/* | 18.99 | <0.001 |
| F1a/F1u* | 10.27 | 0.036 |
| F2i/F2u* | 23.07 | <0.001 |
| VSA* | 22.82 | <0.001 |
| FCR* | 19.33 | <0.001 |
| Parameter | SMS | NS | CS | DS | HS |
|---|---|---|---|---|---|
| Precision Recall Specificity F1-score AUC |
0.79 0.65 0.97 0.71 0.83 |
0.69 1 0.91 0.82 0.99 |
0.75 1 0.96 0.86 0.97 |
0.60 0.43 0.96 0.50 0.77 |
0.86 0.80 0.85 0.83 0.95 |
| Validation Accuracy | 75% | ||||
| Parameter | SMS | NS | CS | DS | HS |
|---|---|---|---|---|---|
| Precision Recall Specificity F1-score AUC |
0.85 0.92 0.92 0.88 0.97 |
0.86 1 0.92 0.92 0.98 |
1 0.86 1 0.92 0.94 |
1 0.5 1 0.67 0.91 |
1 1 1 1 1 |
| Validation Accuracy | 89% | ||||
| Parameter | SMS | NS | CS | DS | HS |
|---|---|---|---|---|---|
| Precision Recall Specificity F1-score AUC |
1 0.83 1 0.91 1 |
0.92 1 0.95 0.96 1 |
1 1 1 1 1 |
1 1 1 1 1 |
1 1 1 1 1 |
| Validation accuracy | 97% | ||||
Disclaimer/Publisher’s Note: The statements, opinions and data contained in all publications are solely those of the individual author(s) and contributor(s) and not of MDPI and/or the editor(s). MDPI and/or the editor(s) disclaim responsibility for any injury to people or property resulting from any ideas, methods, instructions or products referred to in the content. |
© 2023 by the authors. Licensee MDPI, Basel, Switzerland. This article is an open access article distributed under the terms and conditions of the Creative Commons Attribution (CC BY) license (http://creativecommons.org/licenses/by/4.0/).


