1. Introduction
Isoform 1 of the enzyme dimethylarginine dimethylaminohydrolase (DDAH1) is primarily responsible, unlike isoform 2 (DDAH2), for the metabolism of the endogenous inhibitors of nitric oxide (NO) synthesis, asymmetric N
G,N
G-dimethyl-L-arginine (ADMA) and NG-monomethyl-L-arginine (NMMA), into L-citrulline and dimethylamine [
1,
2,
3,
4,
5,
6,
7,
8]. Whilst upregulation of DDAH1 has been originally investigated as a therapeutic strategy to reduce ADMA and NMMA concentrations in conditions characterized by impaired NO synthesis, e.g., atherosclerosis and cardiovascular disease [
4,
9,
10,
11], more recently studies have also focused on DDAH1 inhibition to counteract the negative effect of excessive local and/or systemic NO concentrations in other disease states, e.g., cancer and sepsis [
12,
13,
14,
15,
16,
17,
18,
19,
20,
21]. Specifically, arginine analogues with DDAH1 inhibitory effects synthesized by our group have been shown to suppress the capacity of triple-negative breast cancer (TNBC) cell lines to undergo vasculogenic mimicry, a critical driver of cancer cell dissemination, metastasis, and adverse outcomes in patients with TBNC and other types of cancer [
22,
23,
24,
25,
26,
27,
28,
29].
The pharmacokinetics and safety profile of the most promising DDAH1 inhibitors in our series, compounds ZST316 and ZST152, have been recently investigated in four-week-old FVB mice after oral, intravenous, and intraperitoneal administration. In this study, the most potent DDAH1 inhibitor, ZST316 (Ki: 1μM [
22], subsequently revised to 261nM using a more performant assay [
30], personal data) exhibited a favourable pharmacokinetic profile and excellent tolerability [
31]. Notably, further analyses also led to the identification of several urinary metabolites of ZST316, including the known DDAH1 inhibitor, compound L-257 [
16,
18,
32]. This observation suggests that the conversion of ZST316 into L-257 could mediate, at least in part, the effects of ZST316 on DDAH1 activity and vasculogenic mimicry
in vivo.
In order to further investigate this issue, we report the development and validation of a new HPLC-MS/MS method for the combined measurement of ZST316 and L-257 in plasma and tumour tissue, assessing the pharmacokinetics of both molecules following acute and chronic treatment with ZST316 in a xenograft model of TNBC.
2. Materials and Methods
2.1. Compounds
ZST316, L-257, and ZST152 (internal standard) were provided by Flinders University (Adelaide, Australia). The compounds were dissolved in bi-distilled water, according to the instructions from the provider, for method development and pharmacokinetic analysis. ZST316 was dissolved in sterile water prior to acute and chronic intraperitoneal administration in mice (S.A.L.F. S.p.A., Laboratorio Farmacologico, Bergamo, Italy).
2.2. Pharmacokinetic study
Six-week-old female SCID mice (n=24; Charles River Laboratories Italia S.r.L., Calco, Lecco, Italy), were housed under rigorous standards and handled under pathogen-free conditions in the Animal Care Facilities of the Mario Negri Institute for Pharmacological Research (Milan, Italy).
Two x 106 (in 10μL) MDA-MB-231 TNBC cells were transplanted into the mammary fat pad. Tumour growth was regularly monitored with a calliper and treatment with ZST316 was given when the tumour volume reached 400-500 mm3. Mice received either a single dose (acute treatment) or a daily dose of ZST316 30mg/Kg intraperitoneally for five days (chronic treatment). Chronic treatment was well tolerated, and no signs of toxicity were recorded.
Plasma and tumour tissue (n=3 mice/each time point) were sampled at 1, 8 and 24 hours after treatment (on day 5 for the chronic treatment). To collect plasma, mice were anesthetized by isoflurane, the blood was drained from the retro-orbital plexus into heparinized tubes and centrifuged for 10 min at 4000g at 4°C. Tumours were collected and immediately frozen. Plasma and tumour samples were stored at -20°C until analysis.
2.3. Analytical method development
2.3.1. Preparation of standard and quality control plasma samples
Plasma from control mice (90µL) was spiked with 5μL of ZST316 and L-257 working solutions in the range of 100-20,000ng/mL to obtain a final dilution of 1:20, generating seven calibration standards in the range 5.0-1000ng/mL. The calibration curve included a blank and a zero blank standard plasma sample (processed with Internal Standard, IS). To prepare quality control (QC) samples, three fractions of plasma were mixed with an appropriate amount of QC working solutions to obtain QC plasma samples at the final concentration of 15, 75, and 250ng/mL.
2.3.2. Extraction procedure for plasma samples
To assay ZST316 and L-257, 10µL of IS (ZST152 WS: 500 ng/mL) were added to 100µL of study plasma samples, standards, or QCs in a polypropylene tube. The sample was then added with 10µl of NH4COOH 50mM, mixed and added with 400µL CH3OH:0.1% HCOOH, vortex mixed again and centrifuged at 13,200 rpm for 10 min at 4°C. The supernatant was transferred to a 1.5mL Eppendorf tube, dried under nitrogen flow and reconstituted with 100µL of mobile phase (MP) A:B (1:1, v/v). Finally, the mixed samples were centrifuged at 13,200 rpm for 10 min at 4°C and the supernatant transferred into vials for HPLC-MS/ MS analysis.
2.3.3. Preparation of standard and quality control tumour samples
Control MDA-MB-231 TNBC cell tumours were homogenized with NH4COOH 50mM (1:4, w:v). The homogenate (90µL) was spiked with 5μL of ZST316 and L-257 working solutions in the range of 100-10,000ng/mL to obtain a final dilution of 1:20, generating seven calibration standards in the range 25-5000ng/g. The calibration curve included also a blank and a zero blank standard plasma sample (processed with IS). To prepare QC samples, 90µL of the homogenate was mixed with an appropriate amount of QC working solutions to obtain QC plasma samples at the nominal concentration of 75, 375, and 1250ng/g.
2.3.4. Extraction procedure for homogenate tumour samples
To assay ZST316 and L-257 10µL of IS (ZST152 WS: 500ng/mL) were added to 100µL of tumour homogenate samples or standards or QCs in a polypropylene tube. After vortex mixing the samples, 400µL CH3OH:0.1% HCOOH were added, vortex mixed again and centrifuged at 13,200 rpm for 10 min at 4°C. The supernatant was transferred to a 1.5mL Eppendorf tube, dried under nitrogen flow and reconstituted with 100µL of MP A:B (1:1, v/v). Finally, the mixed samples were centrifuged at 13,200 rpm for 10 min at 4°C and the supernatant transferred into vials for HPLC-MS/ MS analysis.
2.3.5. HPLC-MS/MS conditions
Reversed-phase chromatography was performed under gradient conditions with separation on a HILIC column, C18, 3µm, 100A, 2.1 x 150mm, Waters (Milford, Massachusetts, USA), coupled with a 3µm, 3.9 x 5.0mm guard column of the same material at the flow rate of 0.2mL/min. Gradient features were: 10% mobile phase (MP) A (NH
4HCO
2 10mM, 10% CH
3CN, 0.1% HCOOH) and 90% MP B (CH
3CN, 0.1% HCOOH) as initial constant condition; then to 90% MP A in 6 min and constant condition for 1.5 min. Return to start condition in 0.5 min and conditioning for 5.5 min. Total run time: 13.5 min. Analyte detection and quantification were performed using tandem mass spectrometry (MS/MS) operating in positive ionization mode as previously reported for ZST316 and ZST152 [
31].
3. Results
3.1. HPLC-MS/MS
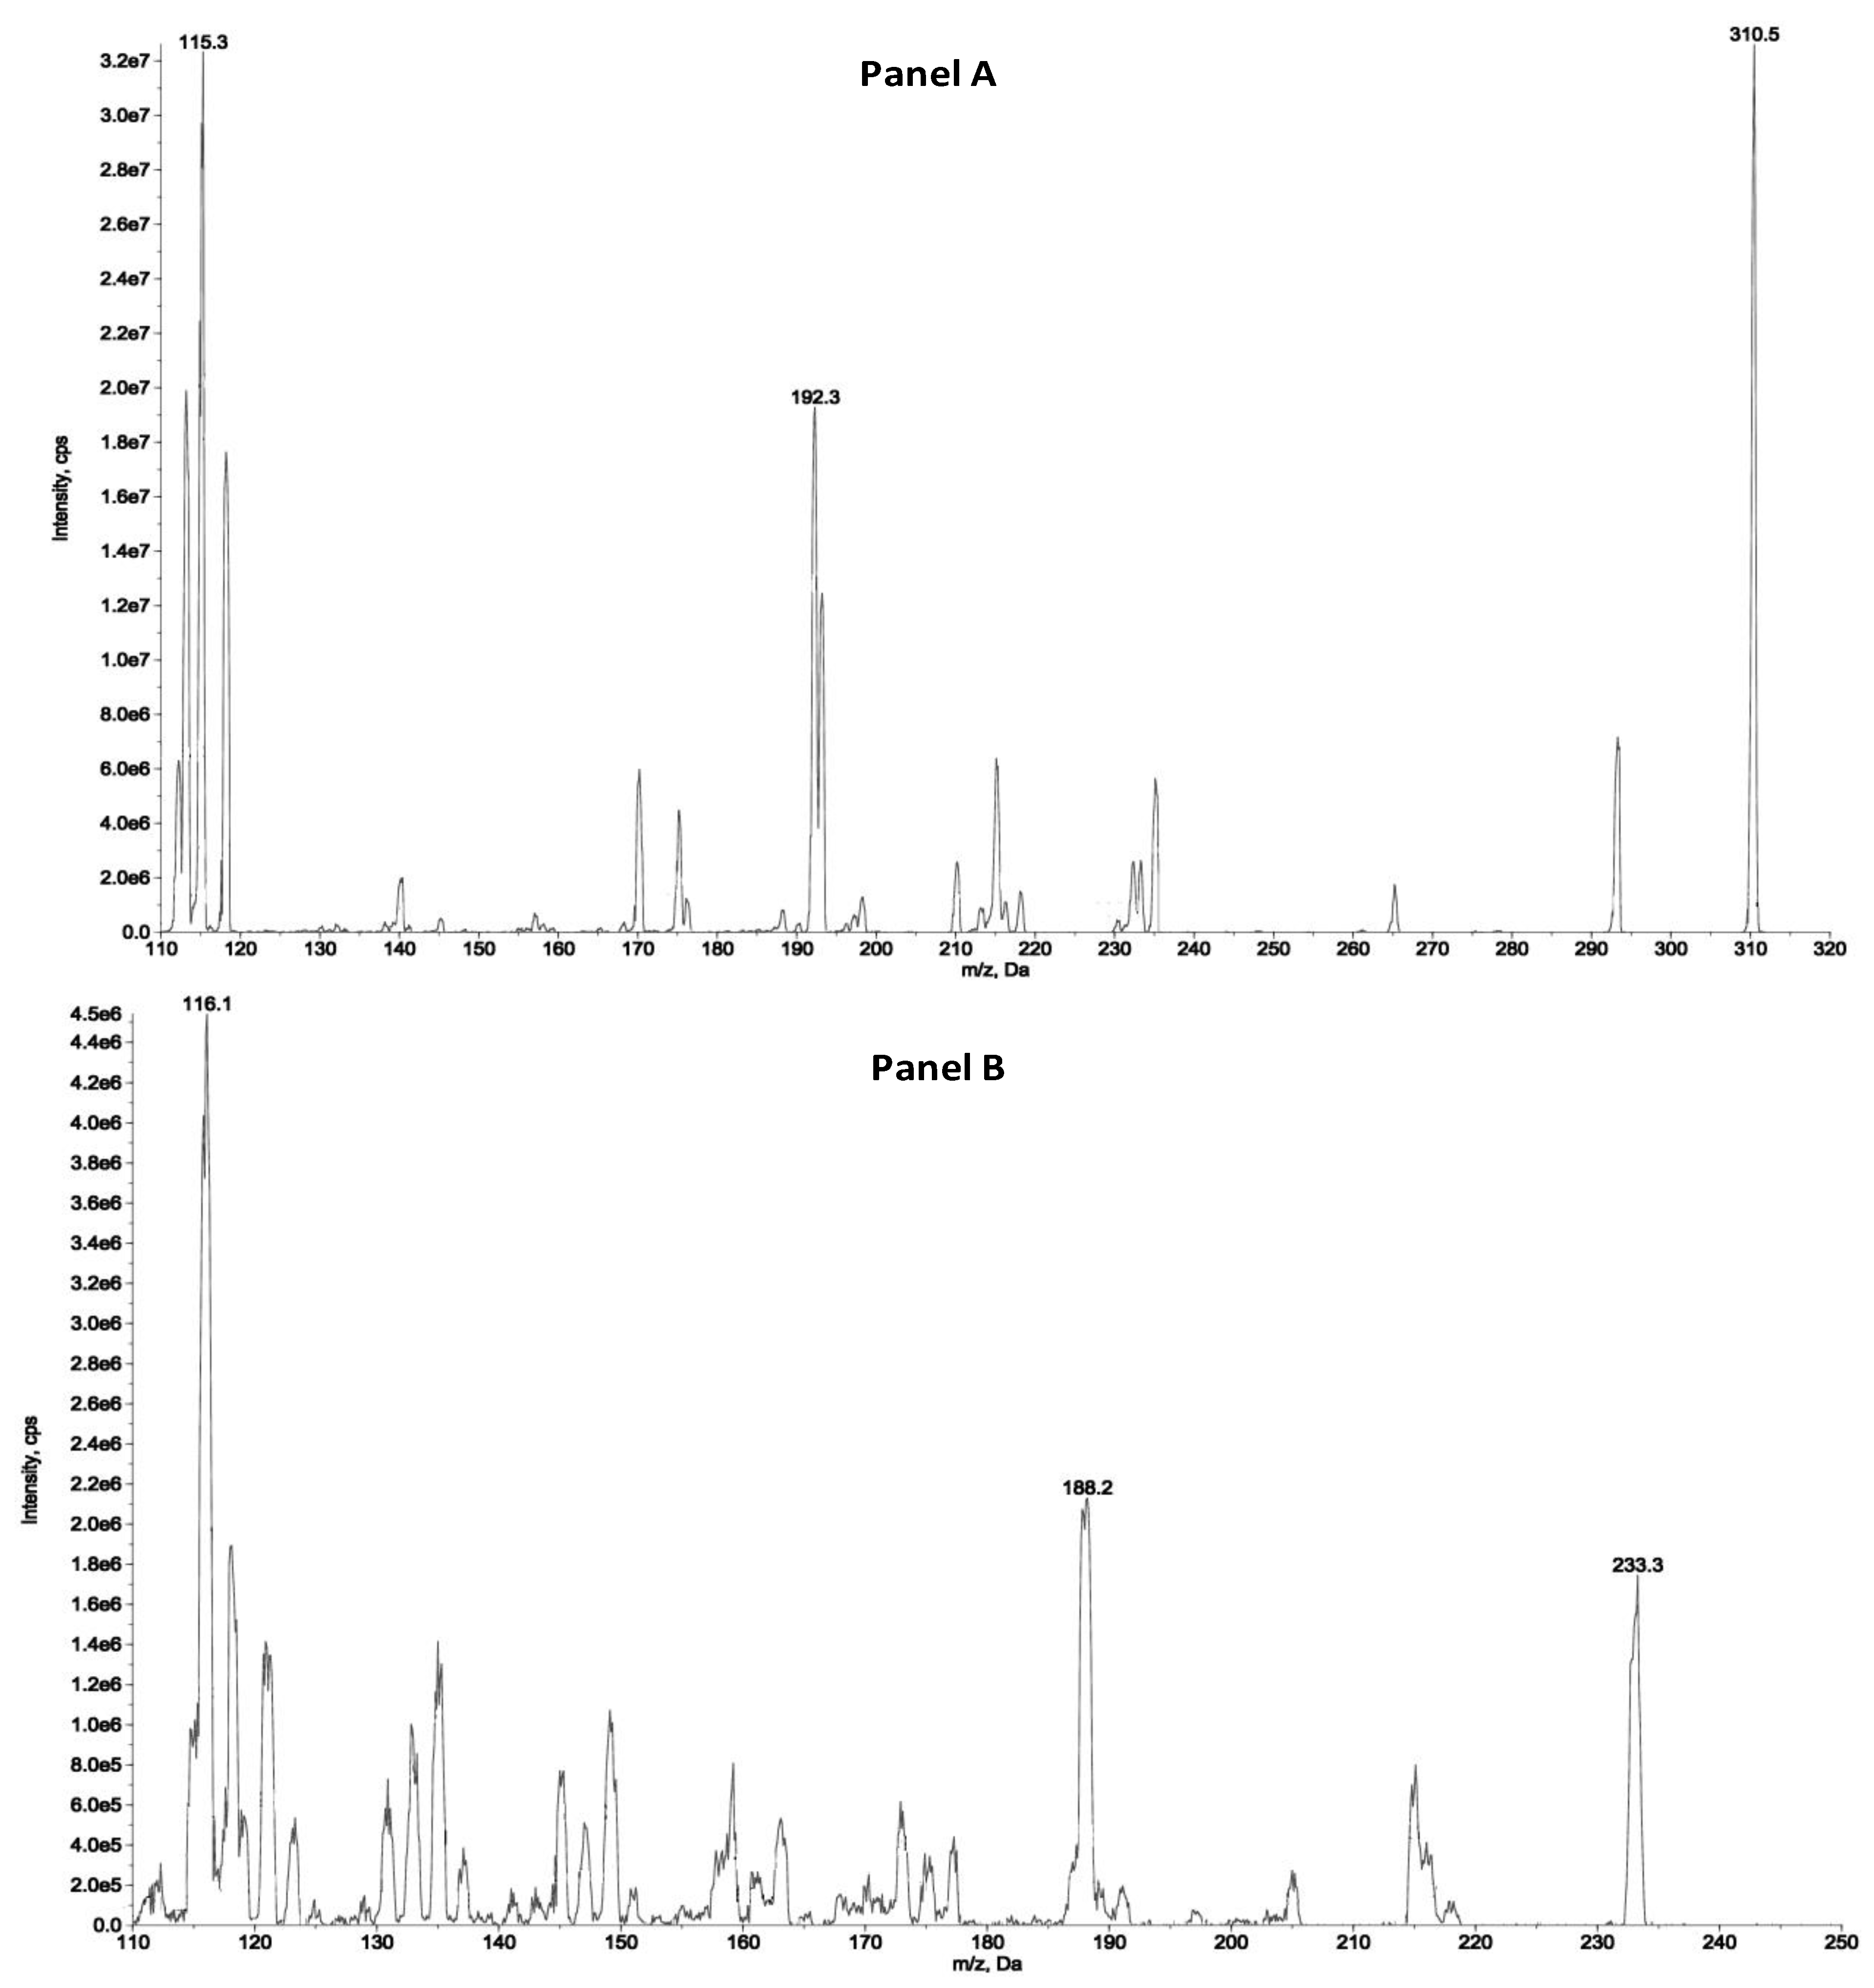
The detection and quantification of the analytes were carried out by tandem mass spectrometry (MS/MS) following the transitions: 310.5 > 115.3 and 310.4 > 192.3 m/z as quantifier and qualifiers ions for ZST316, respectively and 233.3 > 116.1 and 233.3 > 188.2 as quantifier and qualifiers ions for L-257, respectively. The detailed selected reaction monitoring (SRM) reporting the full fragmentation pattern of ZST316 and L-257 obtained by MS/MS is shown in
Figure 1.
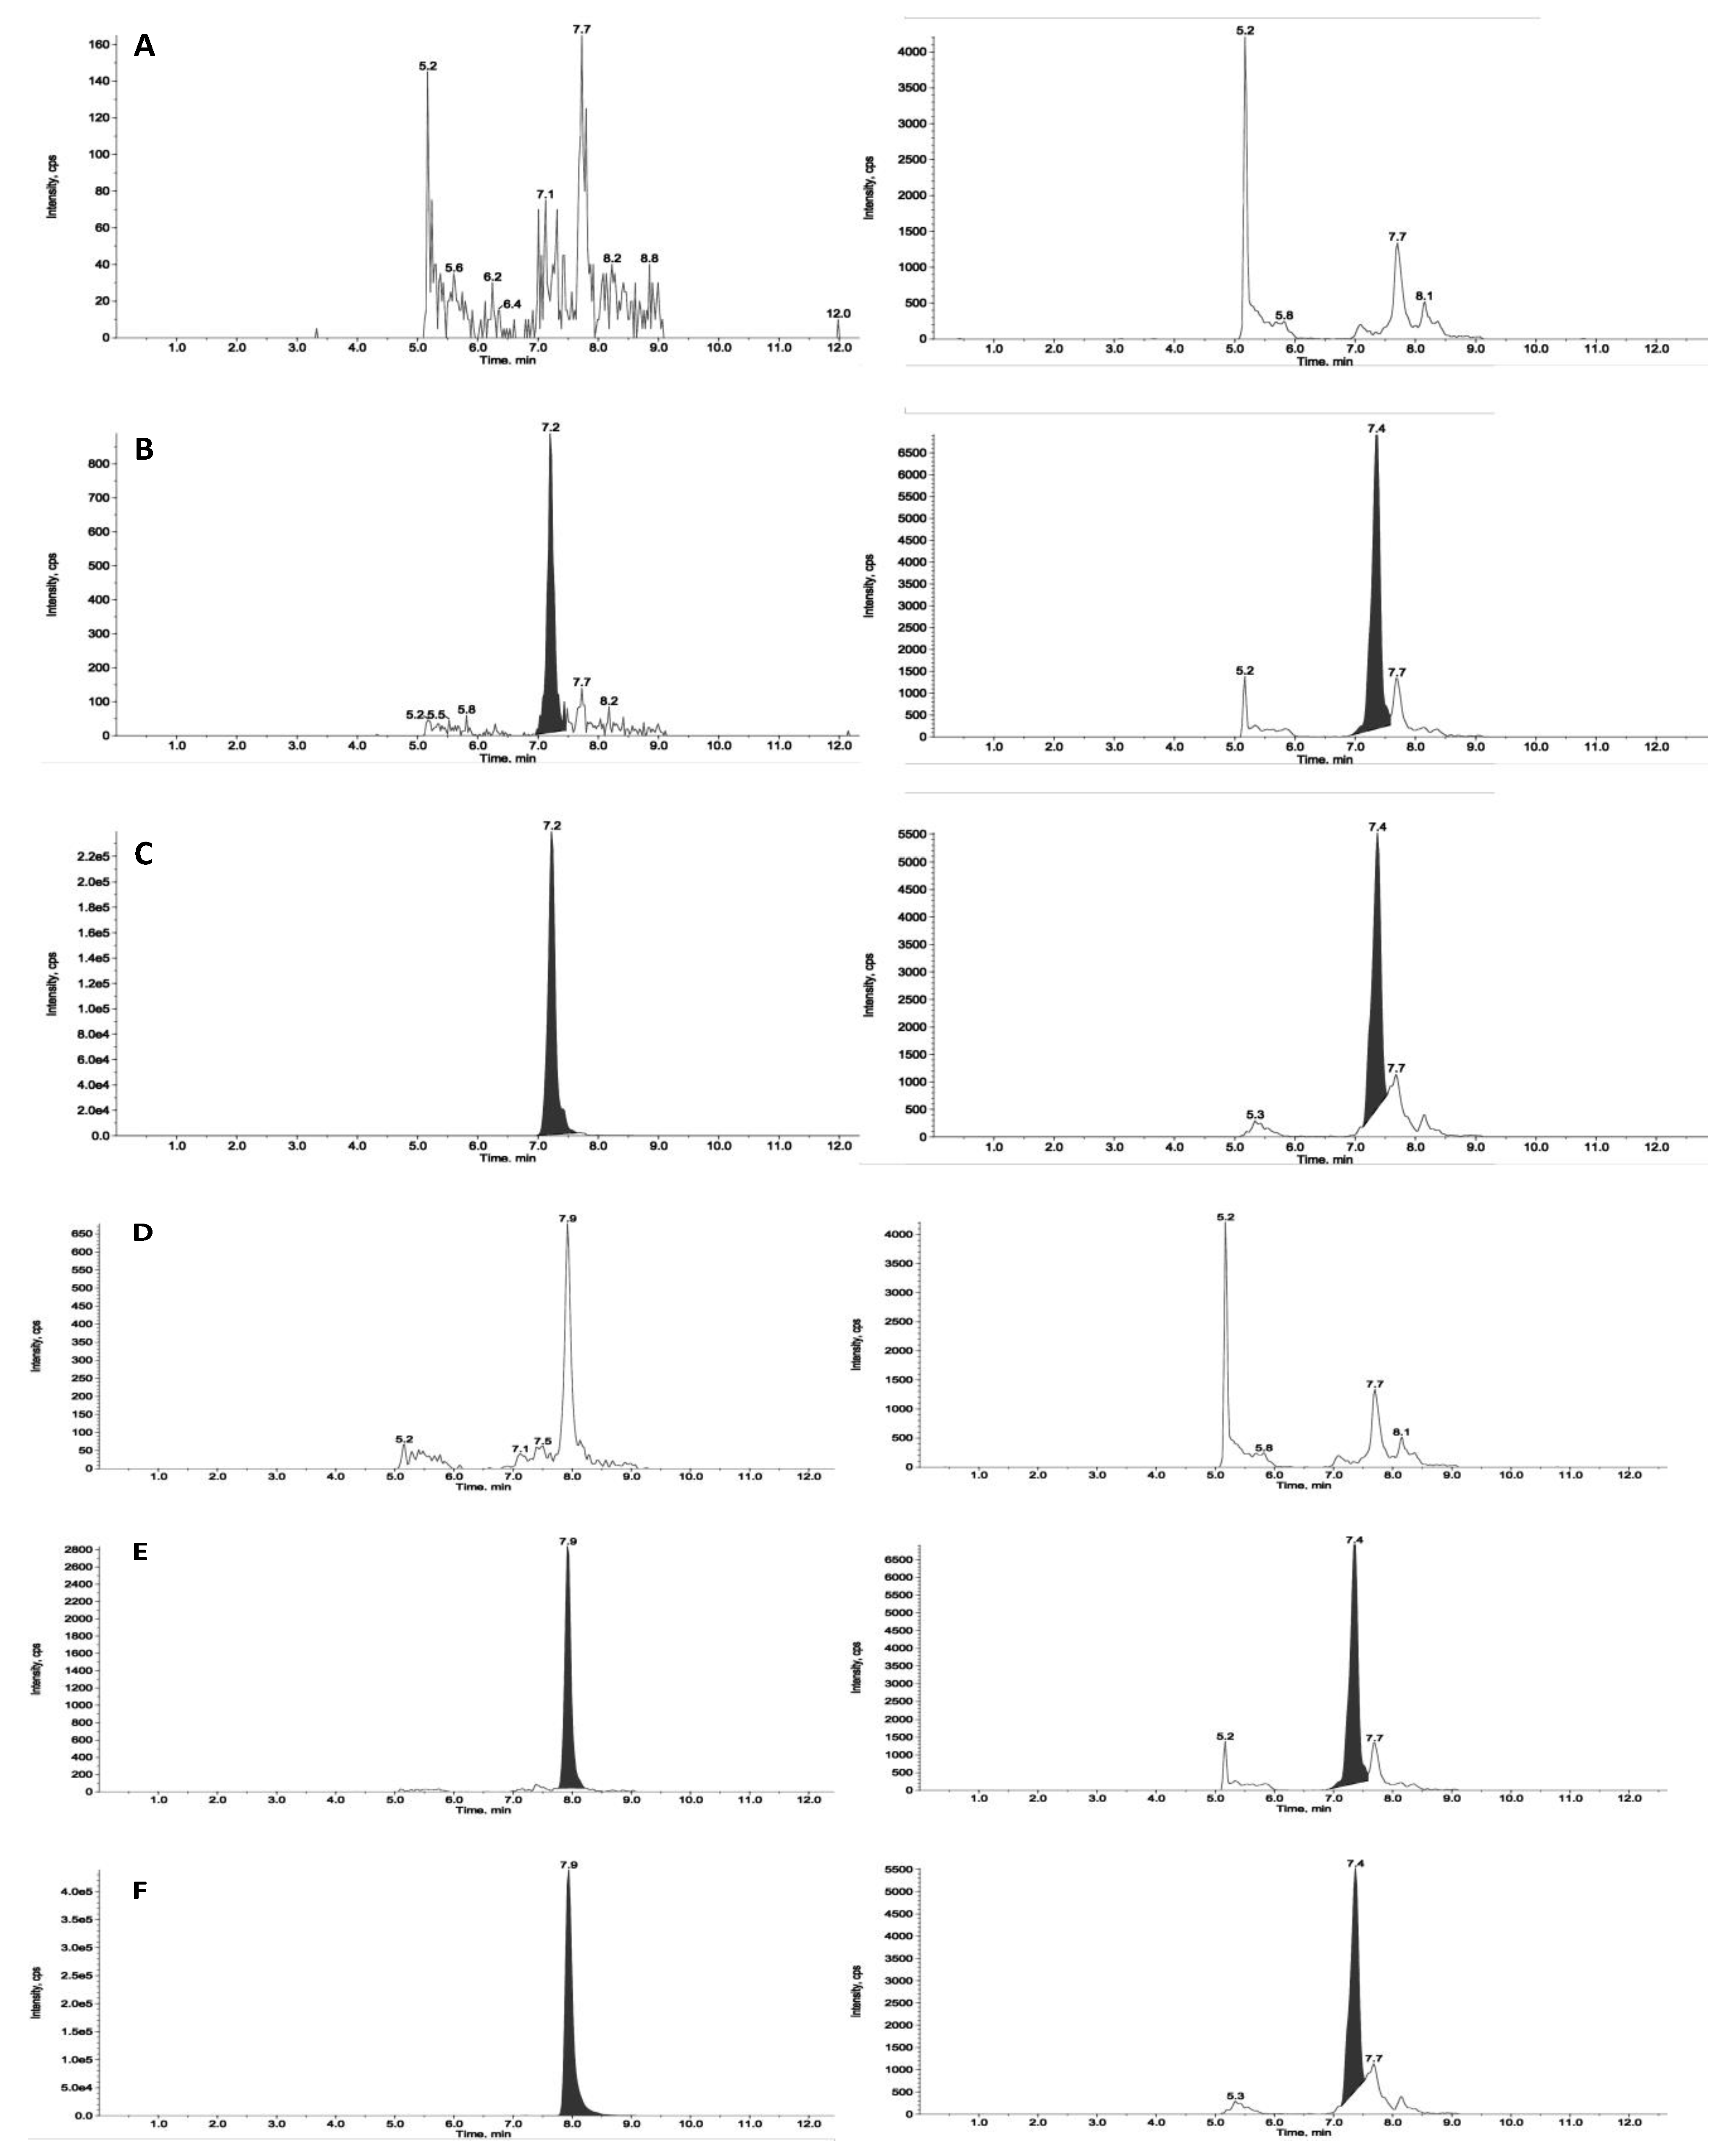
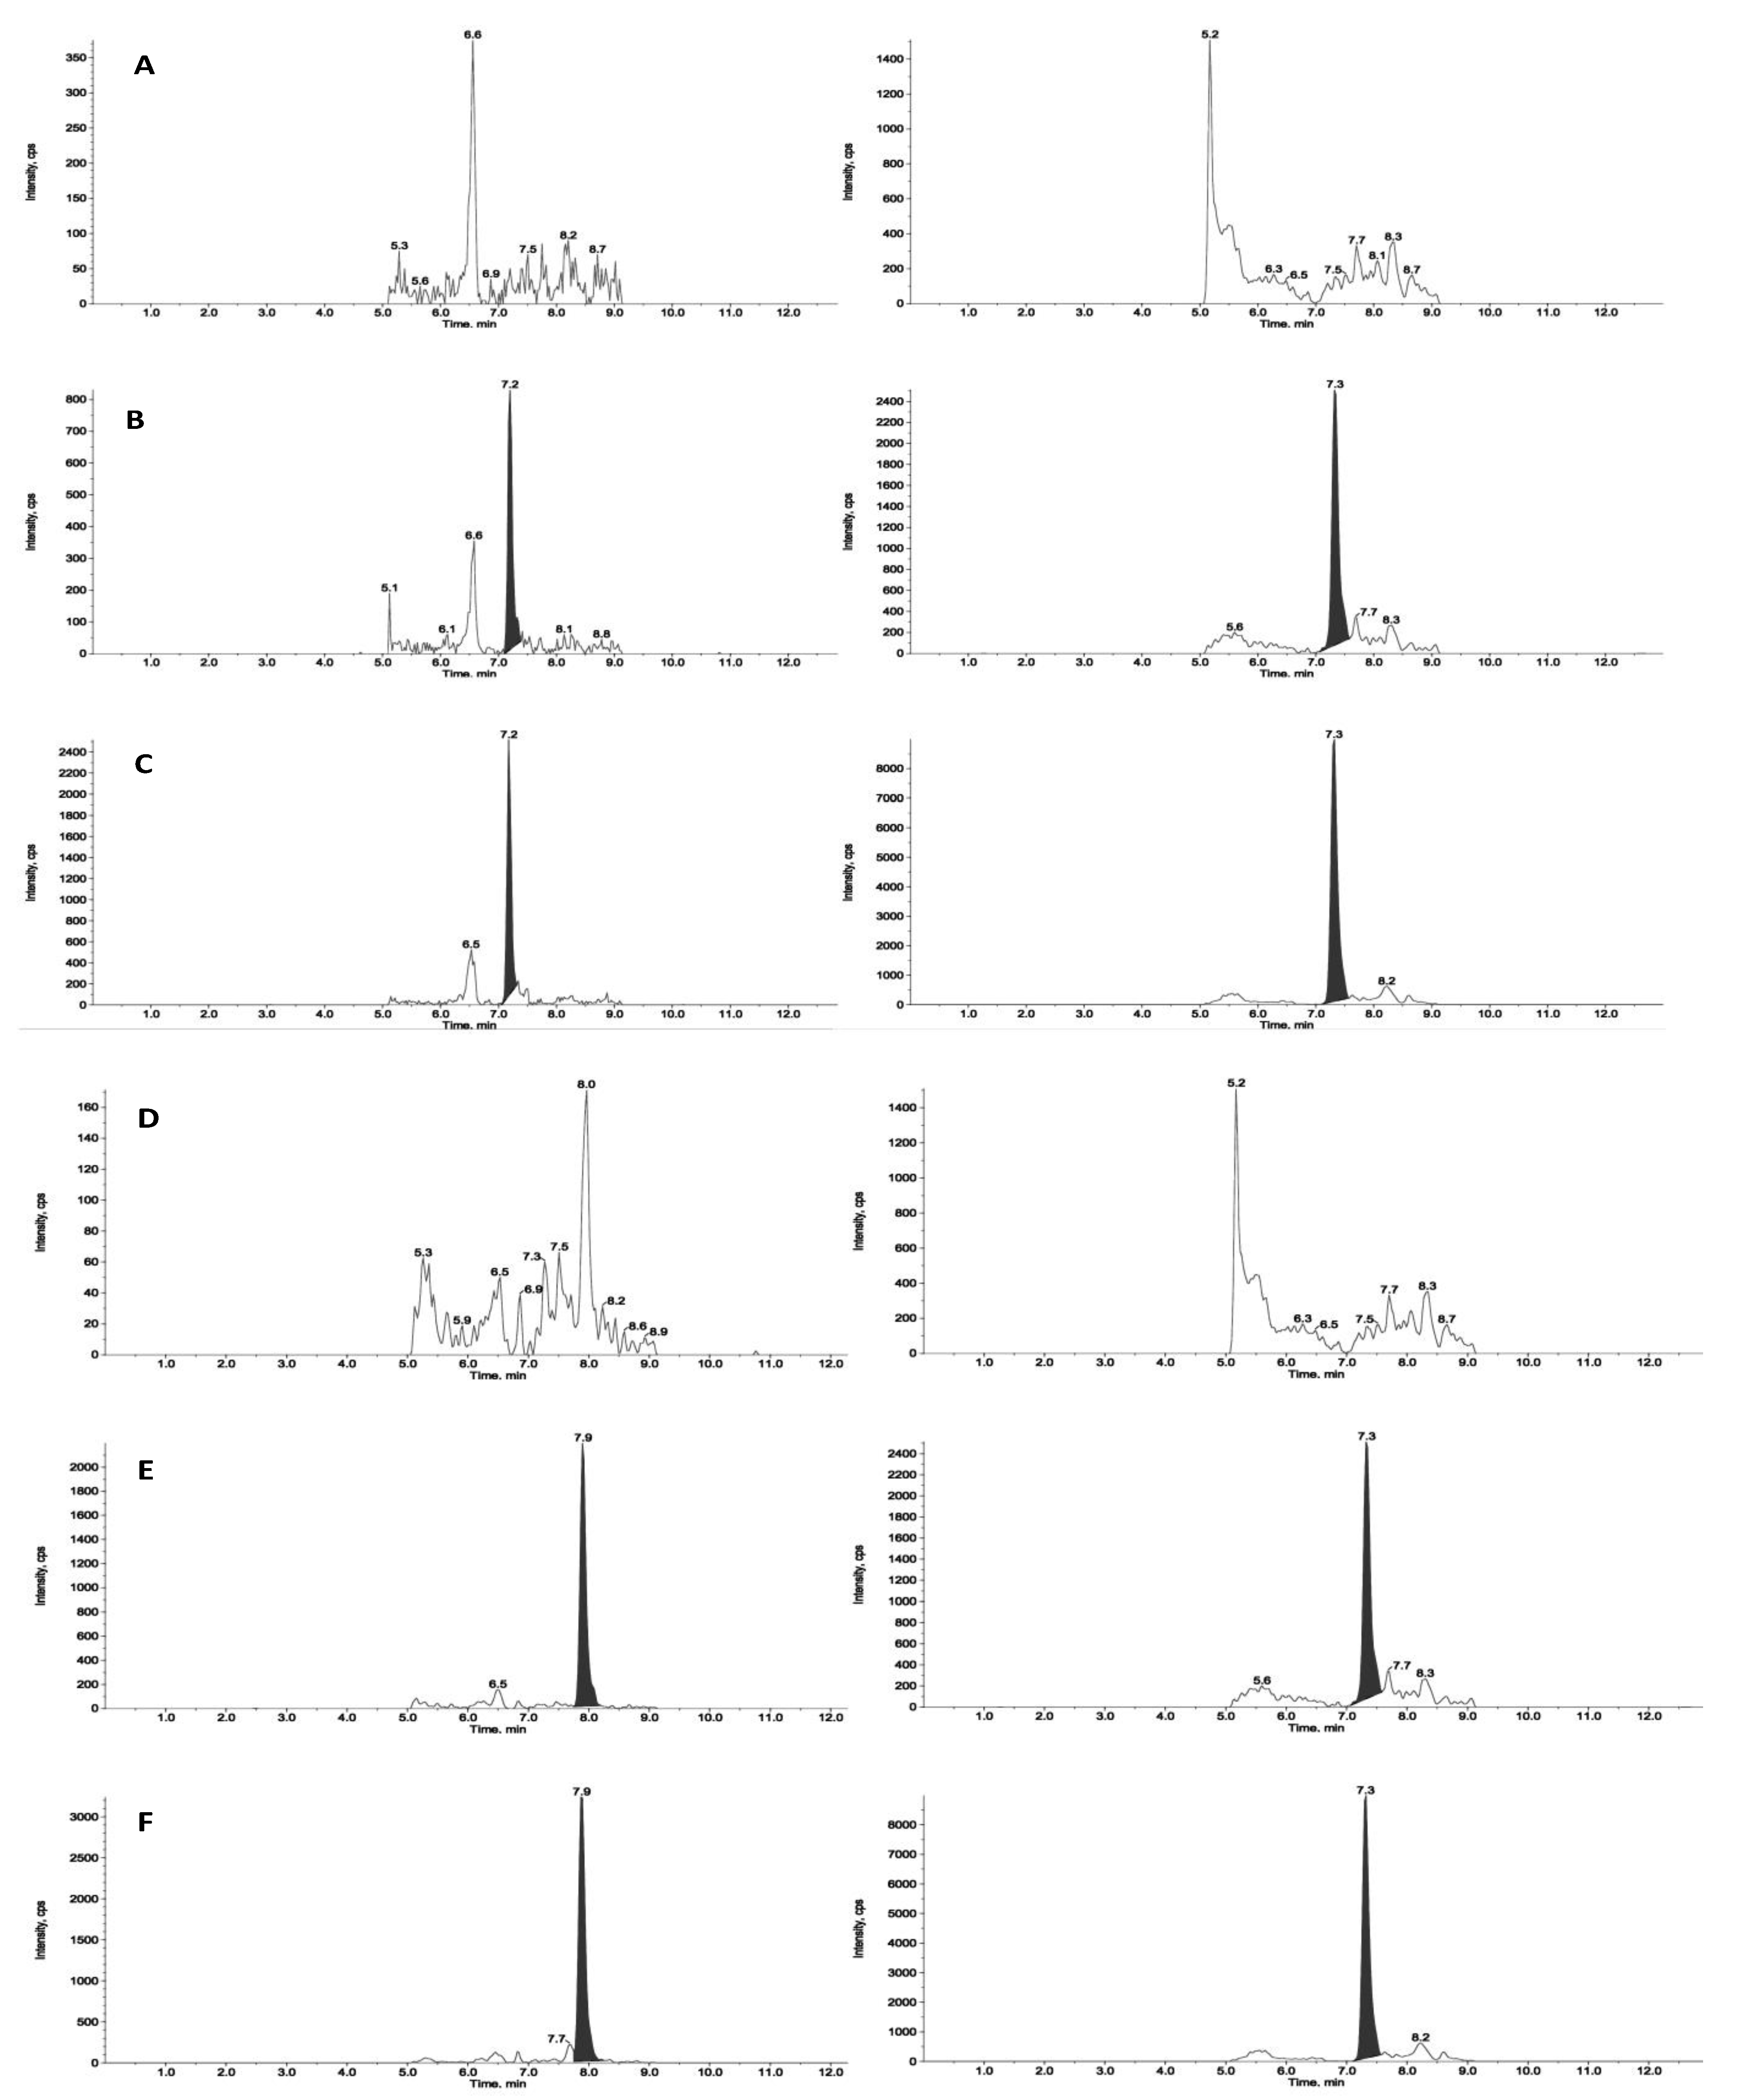
Figure 2 and
Figure 3 reports chromatograms including blank plasma and blank tumour samples, the lower limit of quantitation (i.e., 5ng/mL and 25ng/g), and unknown study samples taken at 1 and 24 hours after acute treatment for plasma and tumour, respectively.
3.1.1. Plasma sample analysis
A quantitation method for ZST316 was previously established [
31]. Here, we set up, validated, and applied the method for the combined measurement of ZST316 and L-257. We established a LOQ of 5ng/mL for L-257, in line with that of ZST316 [
31], with precision of 5.2% and accuracy of 107.8% (n=5). The linearity of the method for L-257 was acceptable over the concentration range 5.0-1000.0 ng/mL, with a coefficient of determination (R
2) of 0.996.
The combined method proved to be precise and accurate as shown by the analysis of three different concentrations of QC plasma samples of ZST316 and L-257 (
Table 1). Both ZST316 and L-257 were stable in frozen plasma for at least one month at -20°C. There was no chromatographic carryover effect observed injecting a blank sample after the highest standard calibration point.
Considering the precision (range 5.2-9.9%) and accuracy (range 95.5–107.8%) values found for QCs and LOQ, all falling within the parameters defined by the main international guidelines [
33,
34], the method developed for the combined measurement of ZST316 and L-257 in plasma is considered suitable for preclinical pharmacokinetic investigations.
3.1.2. Tumour tissue
The method was linear in the tested standards among the concentration range of 25.0-5000.0 ng/mL for both analytes, as demonstrated by the mean determination coefficient (R2) of 0.997 and 0.994 for ZST316 and L-257, respectively.
The recovery was high and consistent at all the QC concentrations of ZST316 and L-257 (
Table 2 and
Table 3). We established a LOQ of 25ng/g for both the analytes in tumour, with precision of 3.3 and 4.6% and an accuracy of 102.7 and 110.5, for ZST316 and L-257 (n = 5).The method was reproducible, precise and accurate as shown by the analysis of QC homogenate tumour samples containing both ZST316 and L-257 (
Table 4 and
Table 5). No chromatographic carryover effect was observed injecting a blank sample after the highest standard calibration point.
Considering the high and consistent recovery, the precision (range 3.3–8.5 %) and accuracy (range 101.8–110.5%) values found for QCs and LOQ, all falling within the parameters defined by the main international guidelines, we believe that the method developed for the combined measurement of ZST316 and L-257 in tumour is suitable for preclinical pharmacokinetic investigations.
3.2. Pharmacokinetics and tumour distribution
3.2.1. Acute treatment with ZST316
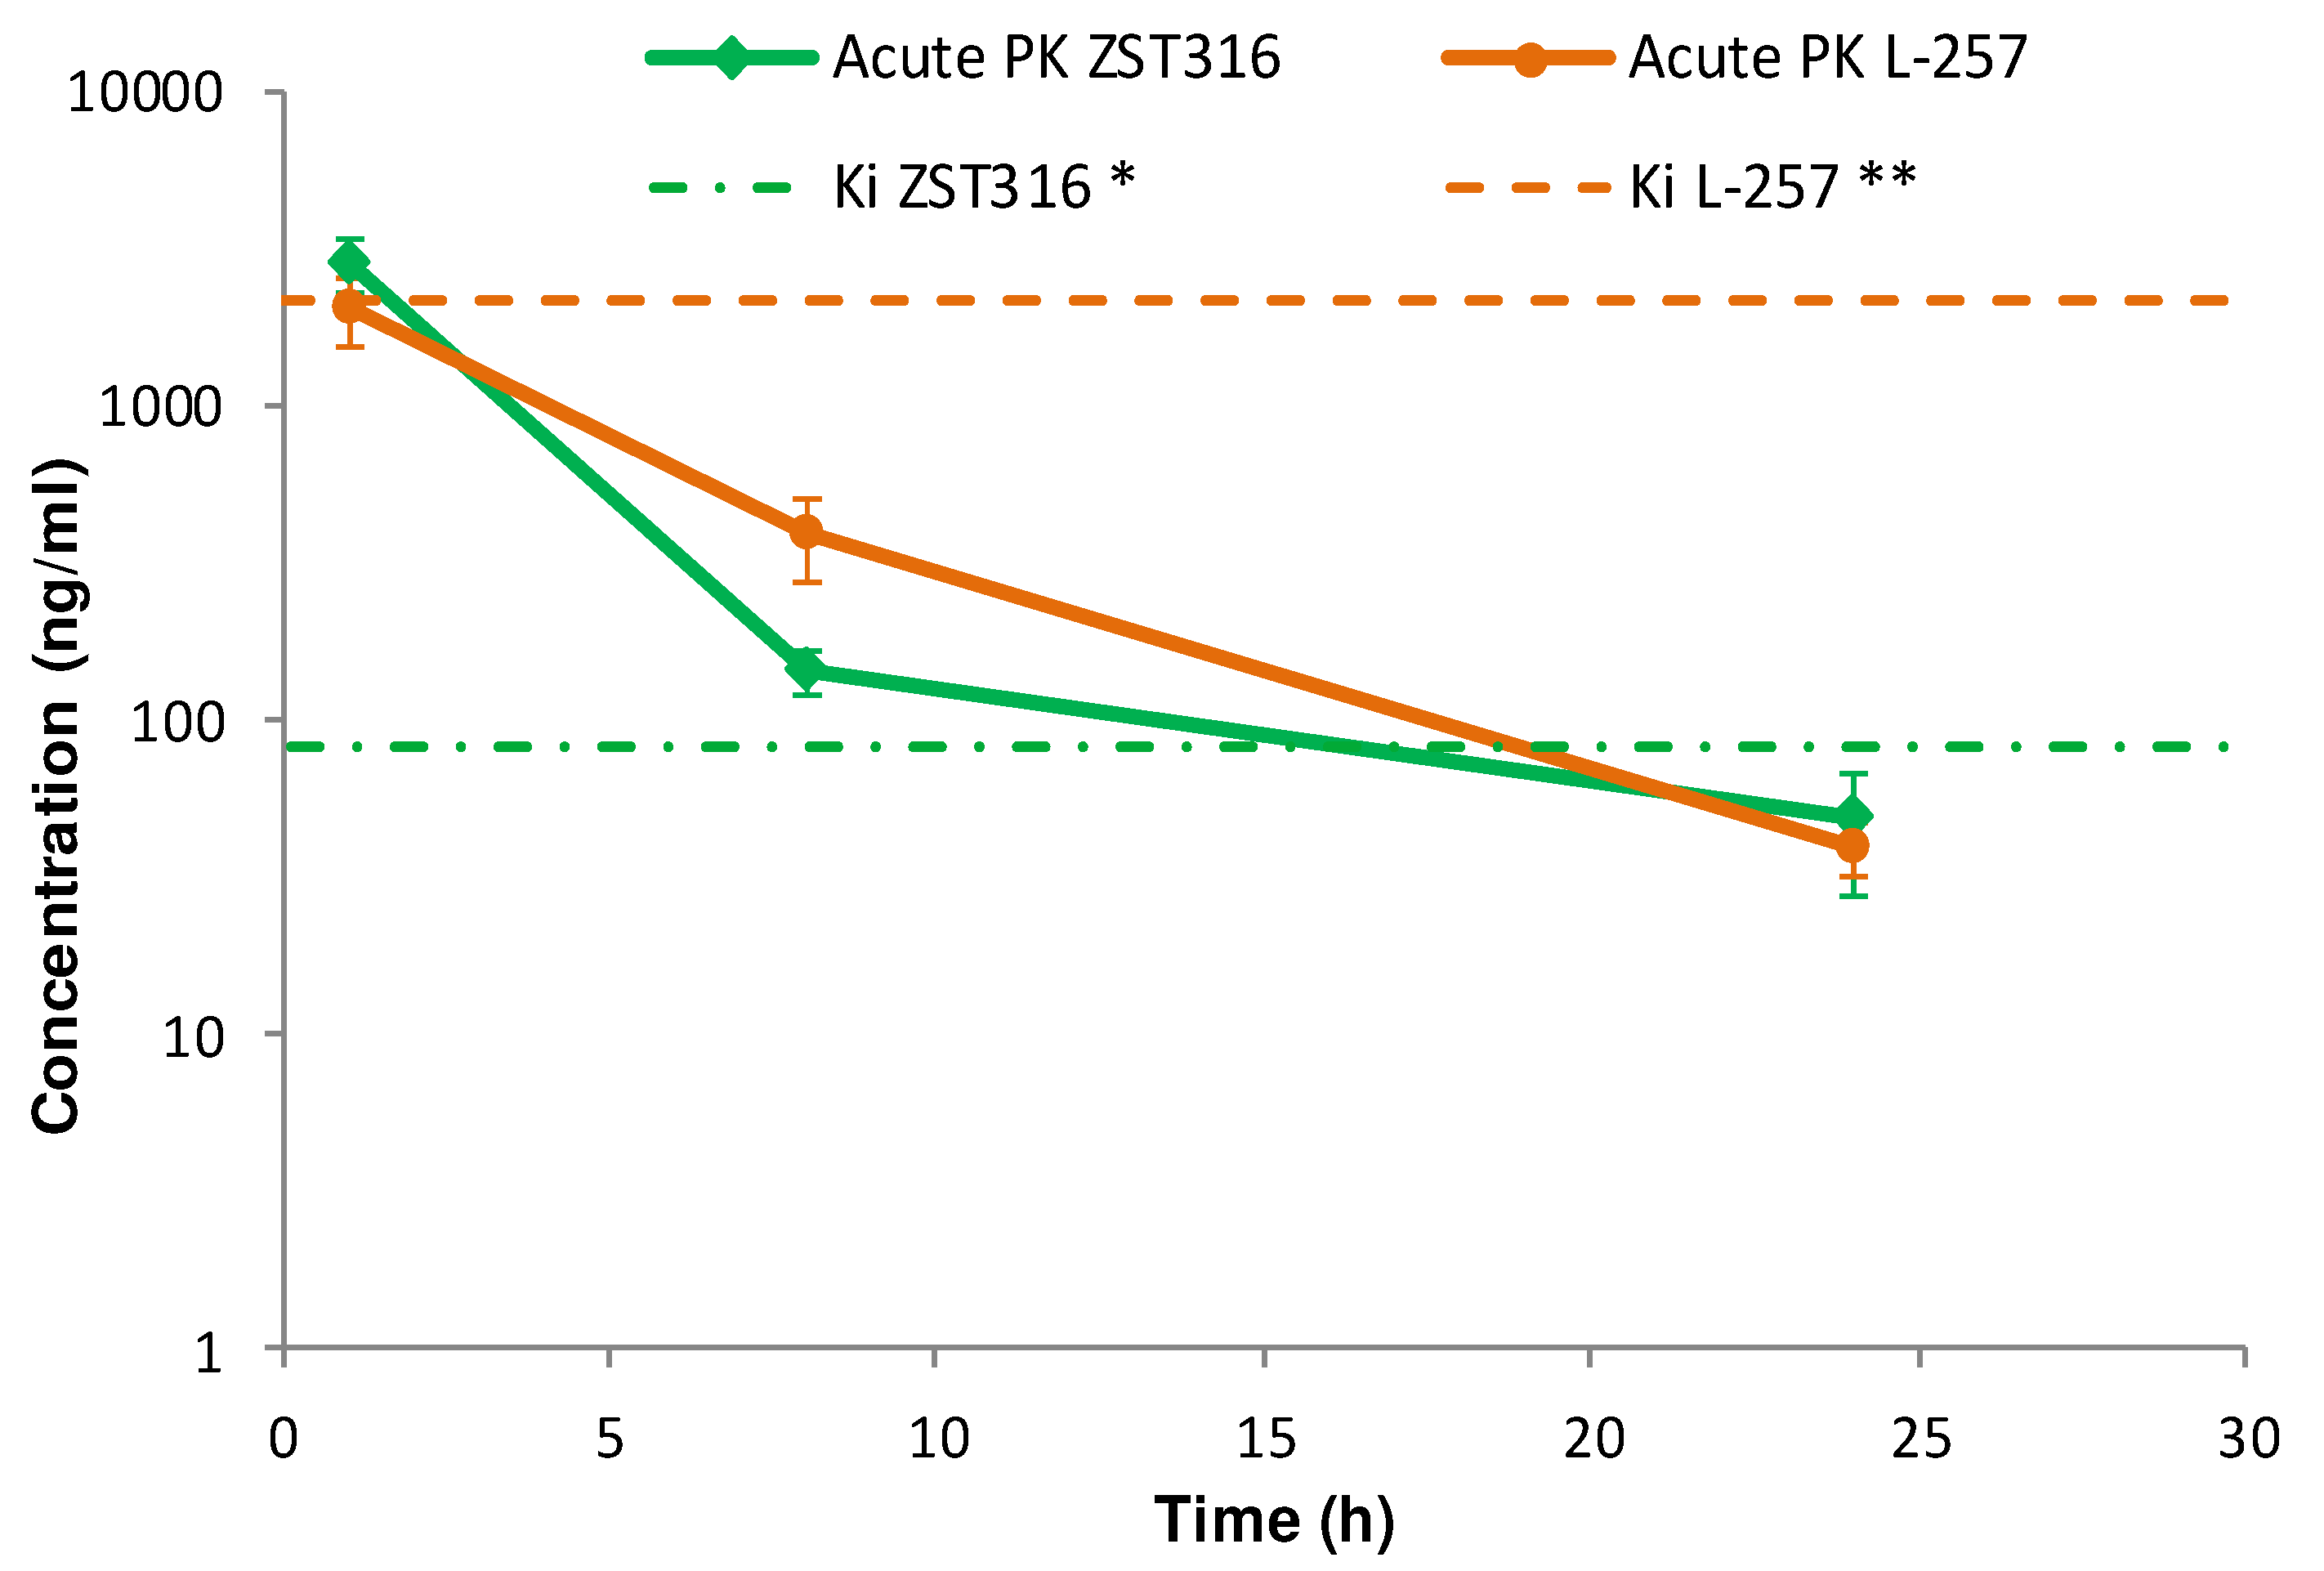
ZST316 was detected in plasma at a mean concentration of 2.79 µg/mL (9.01µM) one hour after acute intraperitoneal administration. The drug was rapidly cleared with an estimated elimination half-life of 4.4 hours and was still detectable after 24 hours at a mean concentration of 0.05 µg/mL (0.16µM), as shown in
Figure 4 and
Table 6. The active metabolite L-257 was measurable in plasma at a concentration of 2.02µg/mL (8.72 µM) one hour after acute intraperitoneal administration of ZST316. The estimated half-life of the drug was 4.2 hours and ZST316 was detectable up to 24 hours at a mean concentration of 0.04µg/mL (0.17 µM;
Figure 4 and
Table 6).
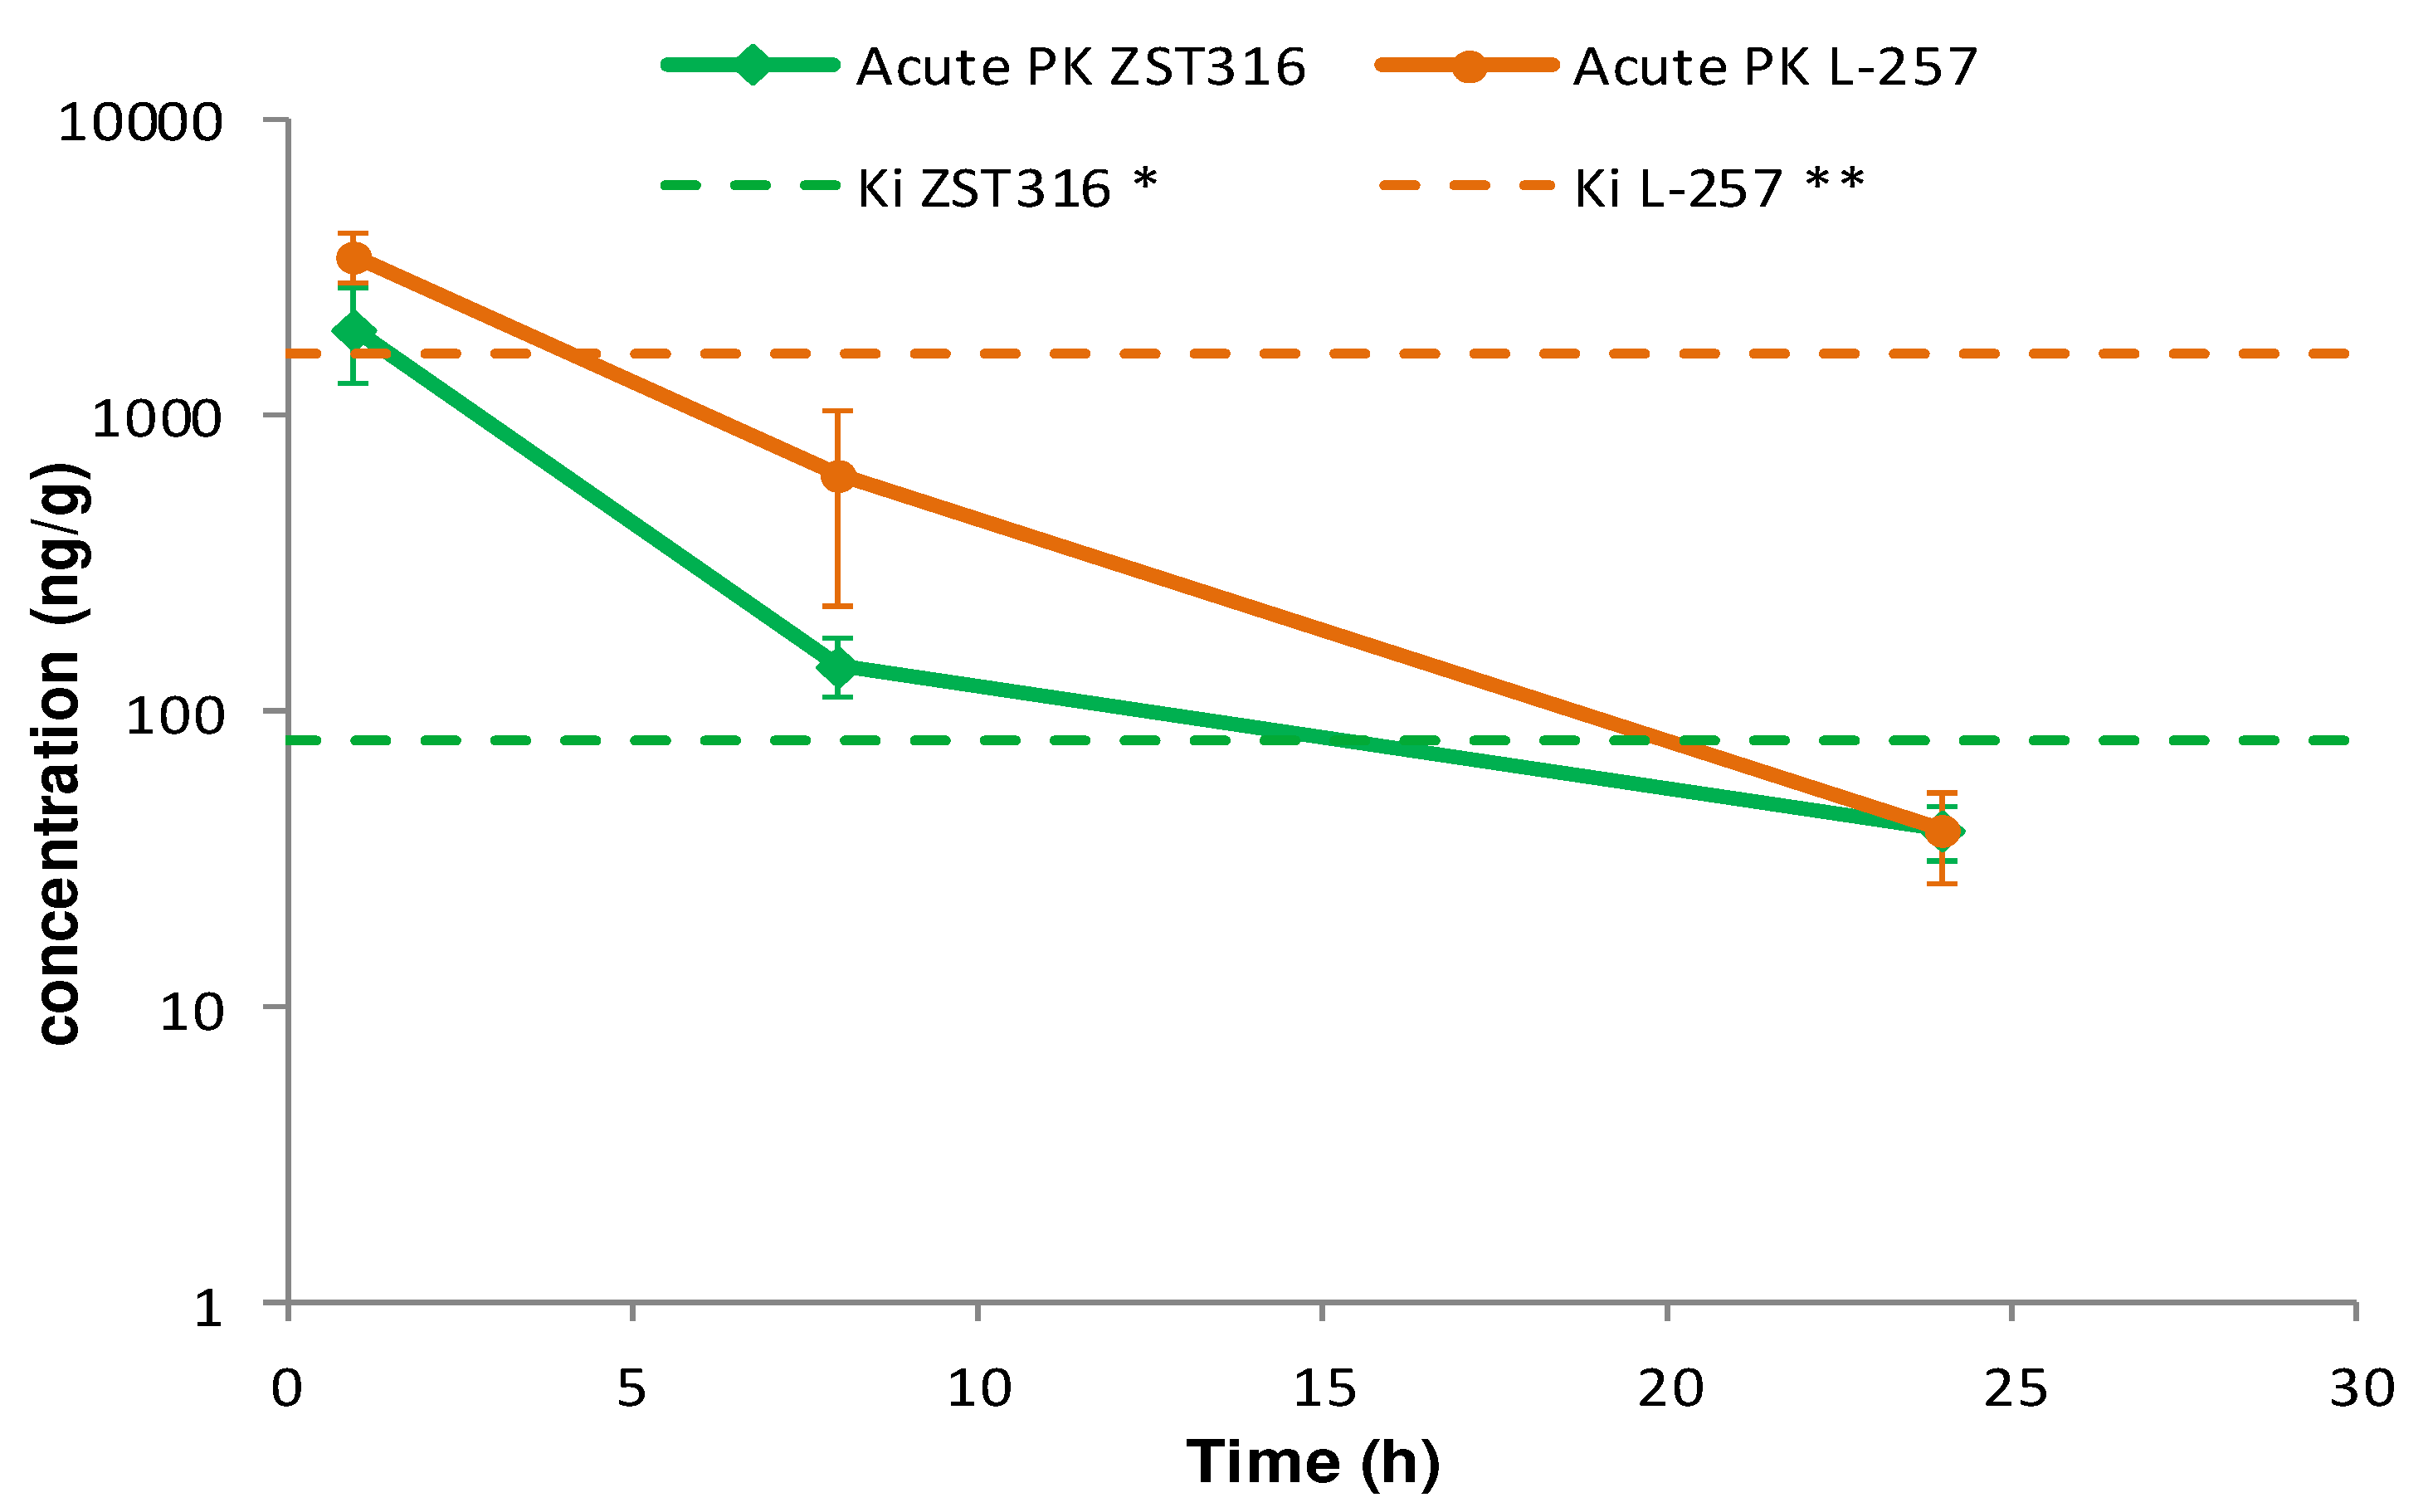
Intra-tumour ZST316 was detected at a concentration of 2.0 µg/g (6.47µM) one hour after acute intraperitoneal administration. The drug was rapidly cleared with an estimated elimination half-life of 4.5 hours. The drug was still detectable after 24 hours at a mean tumour concentration of 0.04µg/g (0.13µM), as reported in
Figure 5 and
Table 6. Intra-tumour L-257 was detected at a concentration of 3.5µg/g (15.06 µM) one hour after acute intraperitoneal administration of ZST316. L-257 was rapidly cleared with an estimated elimination half-life of 3.6 hours. The metabolite was detectable after 24 hours at a mean concentration of 0.04µg/g (0.17µM;
Figure 5 and
Table 6)
3.2.2. Chronic treatment with ZST316
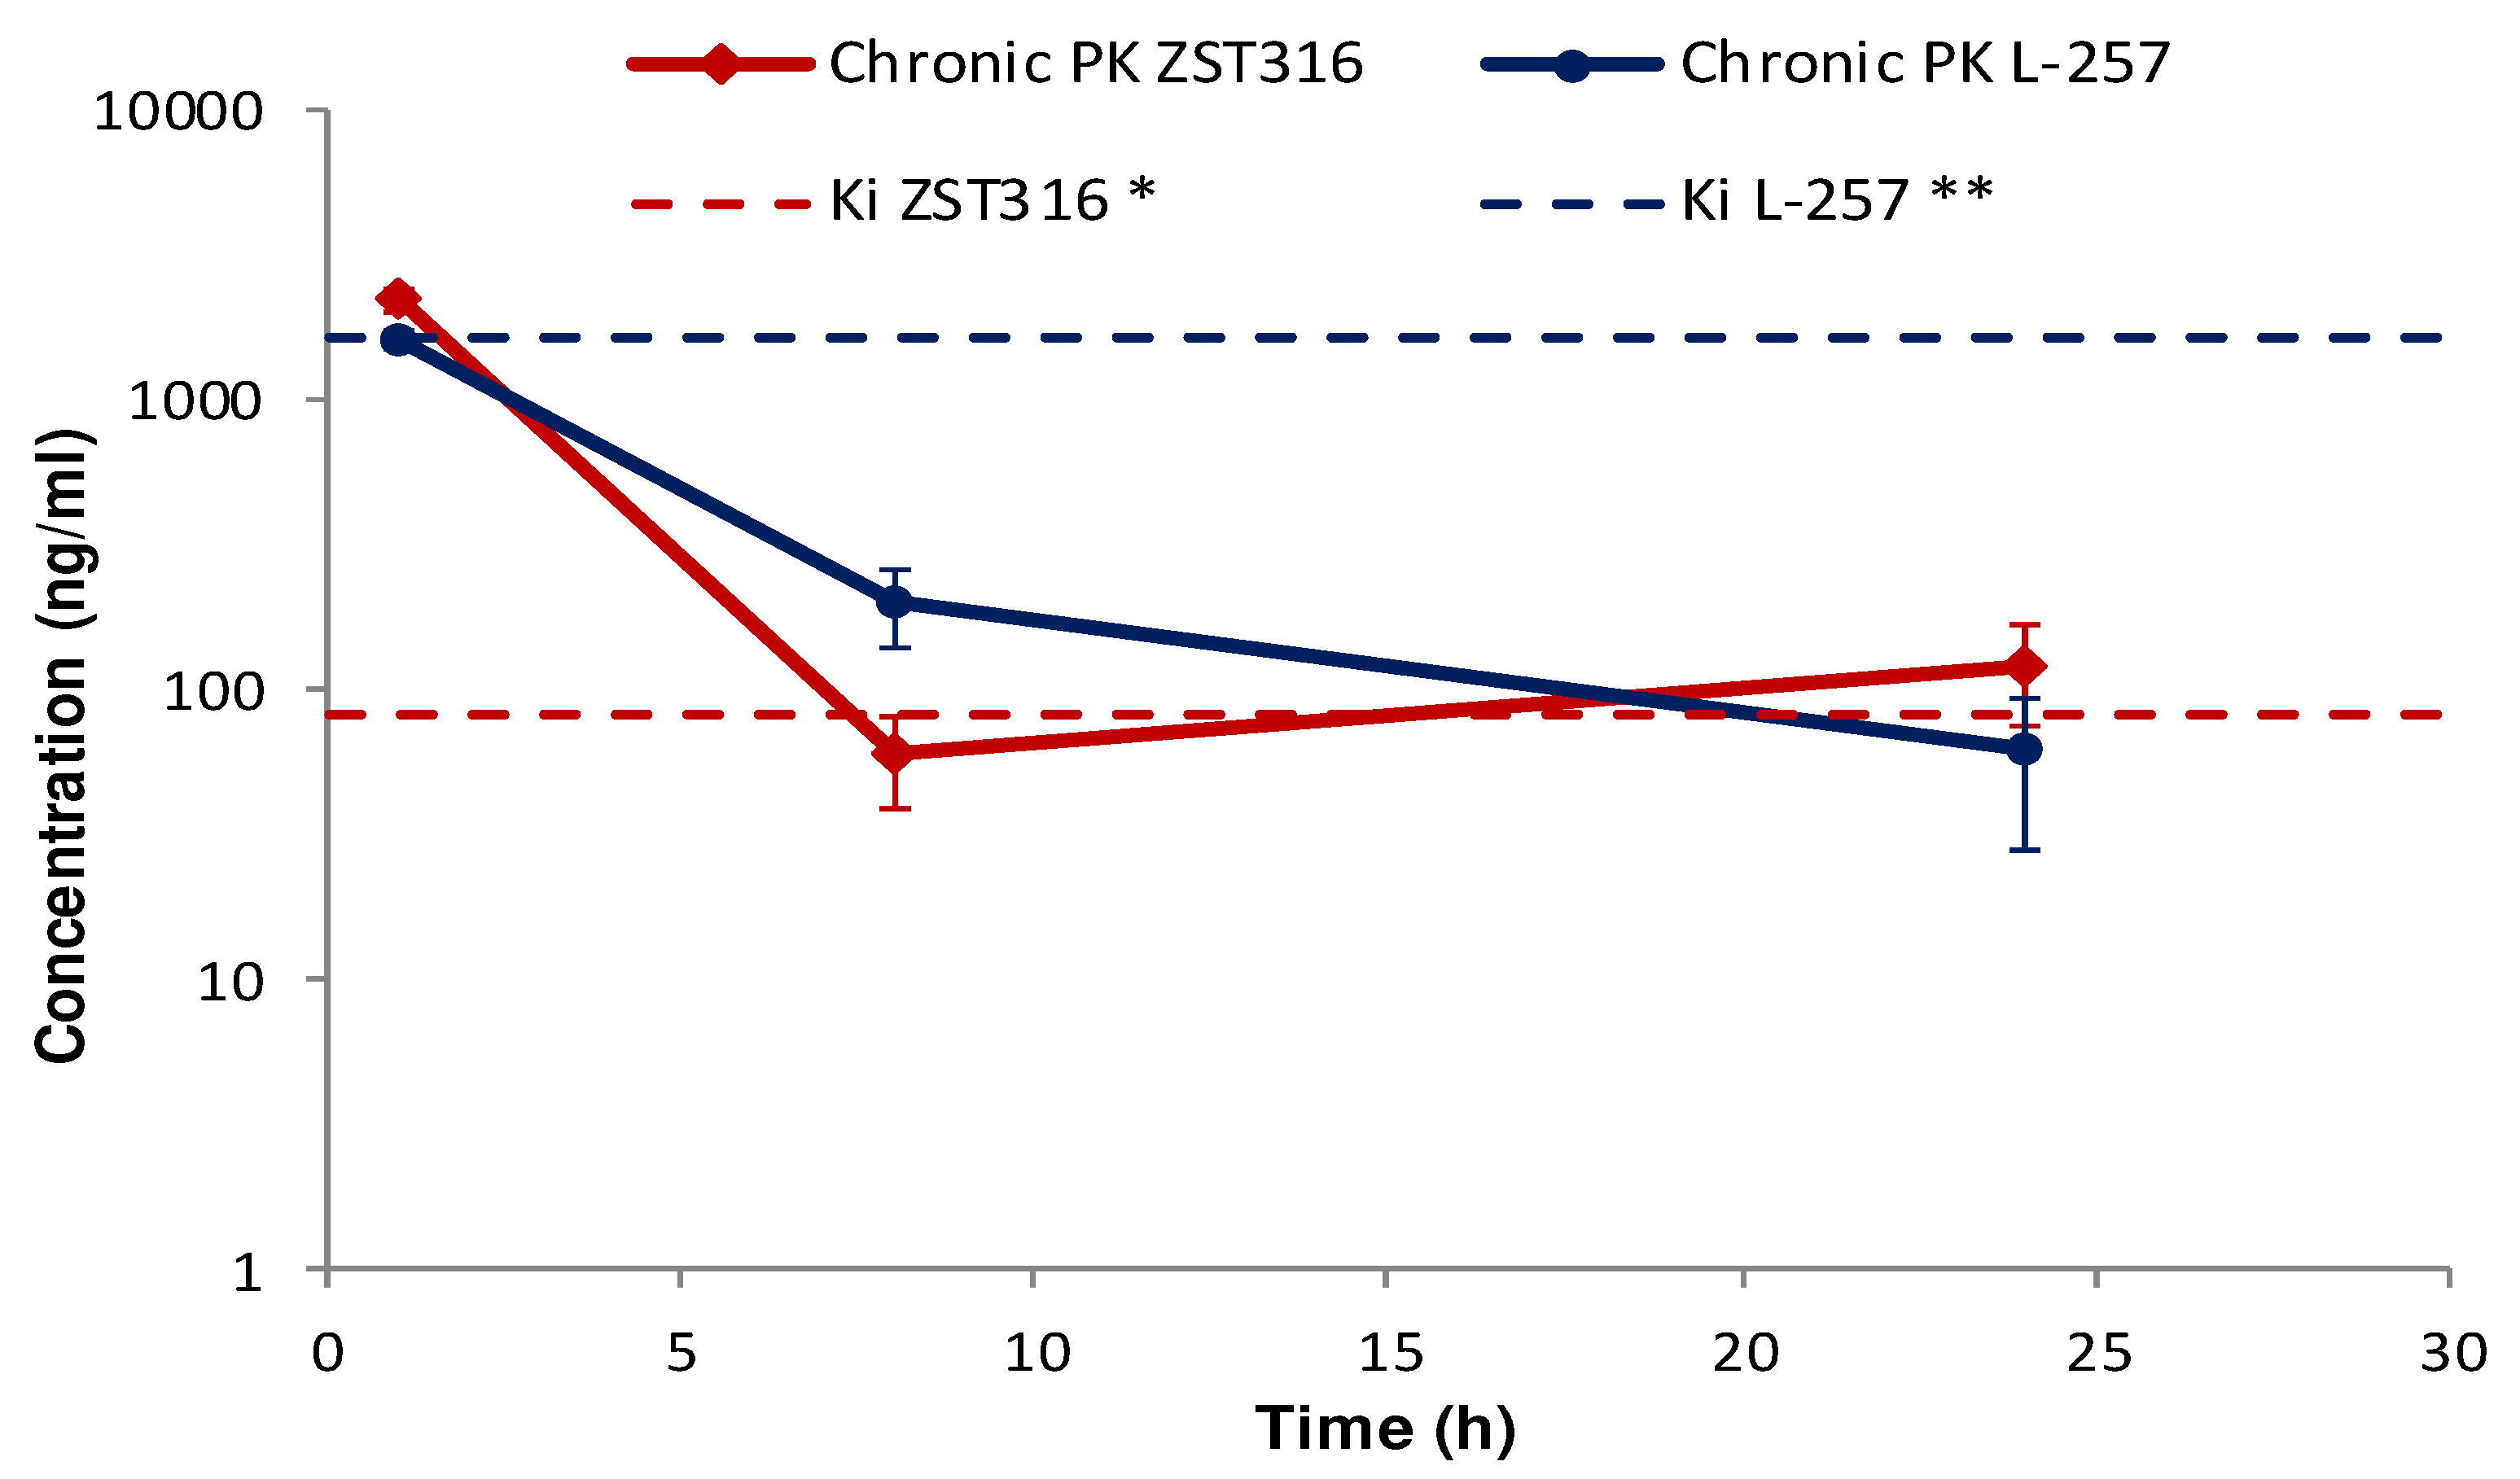
ZST316 was detected in plasma at a mean concentration of 2.22 µg/mL (7.19µM) one hour after chronic intraperitoneal administration, then cleared from plasma with a half-life of 7.1 hours. The drug was still detectable after 24 hours at a mean plasma concentration of 0.12µg/mL (0.39µM;
Figure 6 and
Table 6). The metabolite L-257 was measurable in plasma at a concentration of 1.60µg/mL (6.91µM) one hour after chronic administration of ZST316. Estimated half-life was 5.3 hours. L-257 was still detectable in plasma up to 24 hours at a mean concentration of 0.06µg/mL (0.26µM;
Figure 6 and
Table 6).
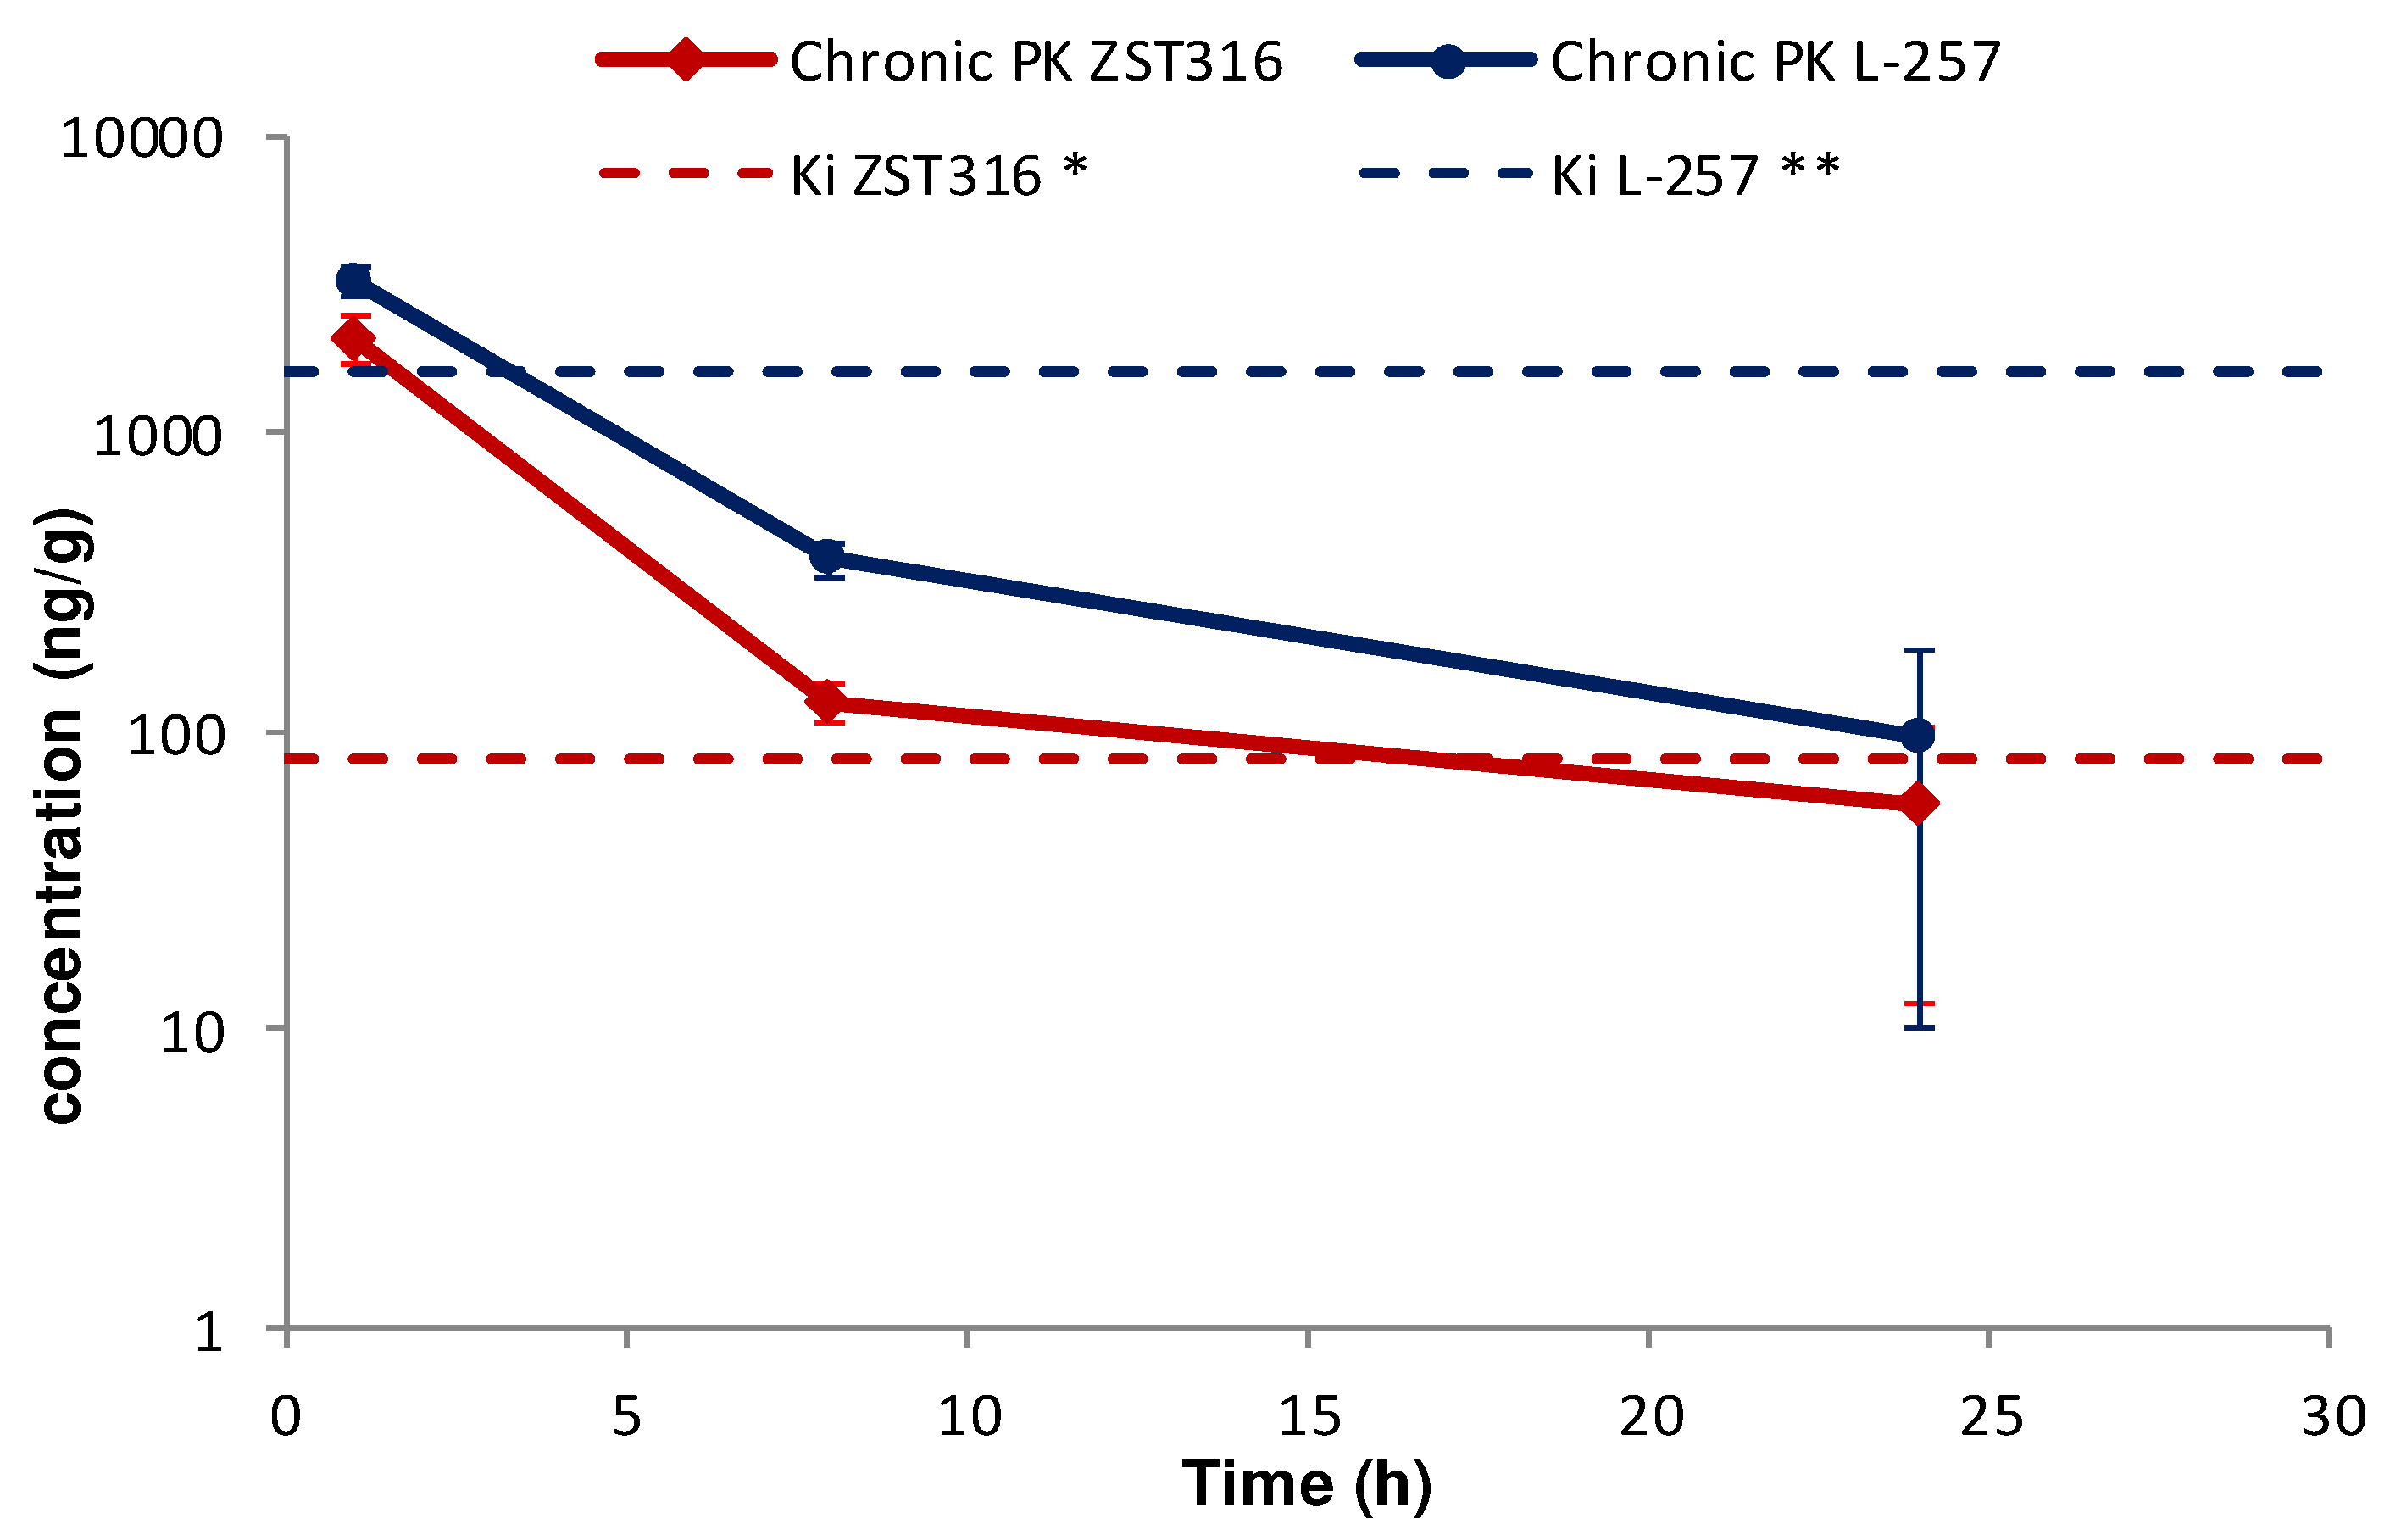
Intra-tumour ZST316 was detected at a concentration of 2.09µg/g (6.75µM) one hour after chronic intraperitoneal administration. The drug was rapidly cleared with an estimated elimination half-life of 5.0 hours. The drug was still detectable after 24 hours at a mean tumour tissue concentration of 0.06µg/g (0.18µM;
Figure 7 and
Table 6). Intra-tumour L-257 was detected at a concentration of 3.24µg/g (13.94 µM) 1 hour after chronic intraperitoneal administration of ZST316. L-257 was rapidly cleared with an elimination half-life of 4.9 hours. The metabolite was still detectable after 24 hours at a mean concentration of 0.10µg/g (0.30µM;
Figure 7 and
Table 6).
No accumulation of ZST316 was observed after chronic treatment, with similar plasma areas under the curve (AUC) observed at day 1 (15.3µg/mL*h) and day 5 (12.4µg/mL*h;
Table 6). The acute and chronic tumour AUC values were also similar (11.4 and 11.8µg/g*h;
Table 6). There was also no accumulation of the metabolite L-257 after chronic treatment, with similar plasma areas under the curve (AUC) observed at day 1 (14.1µg/mL*h) and day 5 (10.3µg/mL*h;
Table 6). The acute and chronic tumour AUC values were also similar (23.9 and 20.3µg/g*h;
Table 6).
4. Discussion
After reporting the pharmacokinetic profile of the arginine analogue DDAH1 inhibitors ZST316 and ZST152 in mice, and the observation that urinary metabolites of ZST316 include another known DDAH1 inhibitor, compound L-257 [
31], in this study we described the development of an accurate and reproducible bioanalytical method for the combined assessment of ZST316 and L-257 in plasma and tumour tissue. The method was successfully applied to assess the pharmacokinetics and for the first time the tumour distribution of both compounds following acute and chronic intraperitoneal treatment with ZST316 in a xenograft model of TNBC using the established cell line MDA-MB-231 [
35,
36,
37]. The results of these assessments indicate that ZST316 is rapidly converted into L-257
in vivo and that both compounds share a similar pharmacokinetic profile. Notably, both compounds rapidly penetrate the tumour tissue and are still detectable 24 hours after administration of ZST316. Furthermore, there was no evidence of plasma or tumour accumulation for both ZST316 and L-257 during chronic treatment with ZST316.
The preferential tumour vs. plasma localization observed for the ZST316 metabolite and DDAH1 inhibitor L-257 (as indicated by the high AUC
tum/AUC
pl ratio;
Table 6) raises the possibility that the reported
in vitro effects of compound ZST316 on vasculogenic mimicry might also depend on its conversion to L-257
in vivo [
20,
23]. However, it is also important to emphasise that the observed intra-tumour concentrations of L-257 remained above the IC
50 [
32] and the Ki values for DDAH1 inhibition [
18,
22] for a relatively short period of time, an estimated 4 and 3.5-hrs after acute and chronic ZST316 treatment, respectively, when compared to the time above the IC
50 and Ki values for ZST316, 15.5 and 16.5-hrs after acute and chronic ZST316 treatment (
Figure 5 and
Figure 7) [
22,
30].
The pharmacokinetic and tumour distribution data reported in this study allow the optimal planning of activity studies in xenograft models of TNBC. Specifically, the plasma and tumour exposure which we determined to be 16-20 hours at concentrations ≥ ki allows us to foresee daily treatments with ZST316 for relatively long periods of time, also given the good tolerability observed in this and a previous study [
31].
Considering the positive data originated by the combined exposure of the two agents, the newly developed HPLC-MS/MS method appears particularly useful for investigating the effects of ZST316 treatment on vasculogenic mimicry, tumour growth, and metastatic burden in xenograft models of TNBC and whether such effects are at least partially mediated by the active metabolite L-257.
5. Conclusions
The development and validation of a HPLC-MS/MS method for the combined determination of the DDAH1 inhibitor ZST316 and its active metabolite L-257 allowed a comprehensive characterization of the pharmacokinetics and tumour distribution of both compounds after acute and chronic treatment with ZST316. This method appears to be particularly useful for investigating the effects of pharmacological inhibition of DDAH1 on vasculogenic mimicry, tumour growth, and metastatic burden in xenograft models of cancer, specifically TNBC.
Author Contributions
Conceptualization, A.A.M., ST, and M.Z; methodology, data collection, and analysis, T.C, R.F, A.D., C.G., G.D., M.Z.; data interpretation, A.A.M., T.C, R.F, A.D., C.G., G.D., S.T., M.Z.; resources, C.G., M.Z.; writing—original draft preparation, A.A.M.; writing—review and editing, T.C, R.F, A.D., C.G., G.D., S.T., M.Z.; funding acquisition, A.A.M. All authors have read and agreed to the published version of the manuscript.
Funding
This research was funded by Tour de Cure Research, Support, and Prevention, Senior Research Grants RSP-246-18/19 and RSP-041-FY2023.
Institutional Review Board Statement
All animal procedures were performed according to the following regulations: Italian Governing Law (D.lgs 26/2014; Authorization n/.19/2008-A issued by the Ministry of Health on 6 March 2008), Mario Negri Institutional Regulations and Policies (Quality Management System Certificate – UNI EN ISO 9001:2008 – Reg. N 6121), National Institutes of Health Guide for the Care and use of Laboratory Animals (2001 Edition), European Union directives and guidelines (EEC Council Directive 2010/63/UE), and Guidelines for the welfare and use of animals in cancer research. The experimental protocol was approved by the IRFMN Animal Care and Use Committee (IACUC) and the Italian Ministry of Health.
Data Availability Statement
The data supporting the reported results are available from the corresponding author upon request.
Conflicts of Interest
The authors declare no conflict of interest. The funders had no role in the design of the study; in the collection, analyses, or interpretation of data; in the writing of the manuscript; or in the decision to publish the results.
References
- Tran, C.T.; Leiper, J.M.; Vallance, P. The DDAH/ADMA/NOS pathway. Atheroscler Suppl 2003, 4, 33–40. [Google Scholar] [CrossRef] [PubMed]
- Leiper, J.; Nandi, M.; Torondel, B.; Murray-Rust, J.; Malaki, M.; O'Hara, B.; Rossiter, S.; Anthony, S.; Madhani, M.; Selwood, D.; et al. Disruption of methylarginine metabolism impairs vascular homeostasis. Nat Med 2007, 13, 198–203. [Google Scholar] [CrossRef] [PubMed]
- Hu, X.; Atzler, D.; Xu, X.; Zhang, P.; Guo, H.; Lu, Z.; Fassett, J.; Schwedhelm, E.; Boger, R.H.; Bache, R.J.; et al. Dimethylarginine dimethylaminohydrolase-1 is the critical enzyme for degrading the cardiovascular risk factor asymmetrical dimethylarginine. Arterioscler Thromb Vasc Biol 2011, 31, 1540–1546. [Google Scholar] [CrossRef] [PubMed]
- Wadham, C.; Mangoni, A.A. Dimethylarginine dimethylaminohydrolase regulation: a novel therapeutic target in cardiovascular disease. Expert Opin Drug Metab Toxicol 2009, 5, 303–319. [Google Scholar] [CrossRef] [PubMed]
- Mangoni, A.A.; Rodionov, R.N.; McEvoy, M.; Zinellu, A.; Carru, C.; Sotgia, S. New horizons in arginine metabolism, ageing and chronic disease states. Age Ageing 2019, 48, 776–782. [Google Scholar] [CrossRef]
- Jarzebska, N.; Mangoni, A.A.; Martens-Lobenhoffer, J.; Bode-Boger, S.M.; Rodionov, R.N. The Second Life of Methylarginines as Cardiovascular Targets. Int J Mol Sci 2019, 20. [Google Scholar] [CrossRef]
- Mangoni, A.A.; Tommasi, S.; Sotgia, S.; Zinellu, A.; Paliogiannis, P.; Piga, M.; Cauli, A.; Pintus, G.; Carru, C.; Erre, G.L. Asymmetric Dimethylarginine: a Key Player in the Pathophysiology of Endothelial Dysfunction, Vascular Inflammation and Atherosclerosis in Rheumatoid Arthritis? Curr Pharm Des 2021, 27, 2131–2140. [Google Scholar] [CrossRef]
- Ragavan, V.N.; Nair, P.C.; Jarzebska, N.; Angom, R.S.; Ruta, L.; Bianconi, E.; Grottelli, S.; Tararova, N.D.; Ryazanskiy, D.; Lentz, S.R.; et al. A multicentric consortium study demonstrates that dimethylarginine dimethylaminohydrolase 2 is not a dimethylarginine dimethylaminohydrolase. Nat Commun 2023, 14, 3392. [Google Scholar] [CrossRef]
- Dayoub, H.; Rodionov, R.N.; Lynch, C.; Cooke, J.P.; Arning, E.; Bottiglieri, T.; Lentz, S.R.; Faraci, F.M. Overexpression of dimethylarginine dimethylaminohydrolase inhibits asymmetric dimethylarginine-induced endothelial dysfunction in the cerebral circulation. Stroke 2008, 39, 180–184. [Google Scholar] [CrossRef]
- Rodionov, R.N.; Dayoub, H.; Lynch, C.M.; Wilson, K.M.; Stevens, J.W.; Murry, D.J.; Kimoto, M.; Arning, E.; Bottiglieri, T.; Cooke, J.P.; et al. Overexpression of dimethylarginine dimethylaminohydrolase protects against cerebral vascular effects of hyperhomocysteinemia. Circ Res 2010, 106, 551–558. [Google Scholar] [CrossRef] [PubMed]
- Kopaliani, I.; Jarzebska, N.; Billoff, S.; Kolouschek, A.; Martens-Lobenhoffer, J.; Bornstein, S.R.; Bode-Boger, S.M.; Ragavan, V.N.; Weiss, N.; Mangoni, A.A.; et al. Overexpression of dimethylarginine dimethylaminohydrolase 1 protects from angiotensin II-induced cardiac hypertrophy and vascular remodeling. Am J Physiol Heart Circ Physiol 2021, 321, H825–H838. [Google Scholar] [CrossRef]
- Wang, Y.; Hu, S.; Gabisi, A.M., Jr.; Er, J.A.; Pope, A.; Burstein, G.; Schardon, C.L.; Cardounel, A.J.; Ekmekcioglu, S.; Fast, W. Developing an irreversible inhibitor of human DDAH-1, an enzyme upregulated in melanoma. ChemMedChem 2014, 9, 792–797. [Google Scholar] [CrossRef] [PubMed]
- Buijs, N.; Oosterink, J.E.; Jessup, M.; Schierbeek, H.; Stolz, D.B.; Houdijk, A.P.; Geller, D.A.; van Leeuwen, P.A. A new key player in VEGF-dependent angiogenesis in human hepatocellular carcinoma: dimethylarginine dimethylaminohydrolase 1. Angiogenesis 2017, 20, 557–565. [Google Scholar] [CrossRef] [PubMed]
- Reddy, K.R.K.; Dasari, C.; Duscharla, D.; Supriya, B.; Ram, N.S.; Surekha, M.V.; Kumar, J.M.; Ummanni, R. Dimethylarginine dimethylaminohydrolase-1 (DDAH1) is frequently upregulated in prostate cancer, and its overexpression conveys tumor growth and angiogenesis by metabolizing asymmetric dimethylarginine (ADMA). Angiogenesis 2018, 21, 79–94. [Google Scholar] [CrossRef] [PubMed]
- Papaevangelou, E.; Boult, J.K.R.; Whitley, G.S.; Robinson, S.P.; Howe, F.A. Assessment of the direct effects of DDAH I on tumour angiogenesis in vivo. Angiogenesis 2018, 21, 737–749. [Google Scholar] [CrossRef]
- Leiper, J.; Nandi, M. The therapeutic potential of targeting endogenous inhibitors of nitric oxide synthesis. Nat Rev Drug Discov 2011, 10, 277–291. [Google Scholar] [CrossRef]
- Wang, Z.; Lambden, S.; Taylor, V.; Sujkovic, E.; Nandi, M.; Tomlinson, J.; Dyson, A.; McDonald, N.; Caddick, S.; Singer, M.; et al. Pharmacological inhibition of DDAH1 improves survival, haemodynamics and organ function in experimental septic shock. Biochem J 2014, 460, 309–316. [Google Scholar] [CrossRef] [PubMed]
- Murphy, R.B.; Tommasi, S.; Lewis, B.C.; Mangoni, A.A. Inhibitors of the Hydrolytic Enzyme Dimethylarginine Dimethylaminohydrolase (DDAH): Discovery, Synthesis and Development. Molecules 2016, 21. [Google Scholar] [CrossRef]
- Hulin, J.A.; Tommasi, S.; Elliot, D.; Hu, D.G.; Lewis, B.C.; Mangoni, A.A. MiR-193b regulates breast cancer cell migration and vasculogenic mimicry by targeting dimethylarginine dimethylaminohydrolase 1. Sci Rep 2017, 7, 13996. [Google Scholar] [CrossRef]
- Hulin, J.A.; Gubareva, E.A.; Jarzebska, N.; Rodionov, R.N.; Mangoni, A.A.; Tommasi, S. Inhibition of Dimethylarginine Dimethylaminohydrolase (DDAH) Enzymes as an Emerging Therapeutic Strategy to Target Angiogenesis and Vasculogenic Mimicry in Cancer. Front Oncol 2019, 9, 1455. [Google Scholar] [CrossRef]
- Zolner, J.; Lambden, S.; Nasri, N.M.; Johnson, M.R.; Leiper, J. Inhibition of Dimethylarginine Dimethylaminohydrolase 1 Improves the Outcome of Sepsis in Pregnant Mice. Shock 2020, 54, 498–506. [Google Scholar] [CrossRef]
- Tommasi, S.; Zanato, C.; Lewis, B.C.; Nair, P.C.; Dall'Angelo, S.; Zanda, M.; Mangoni, A.A. Arginine analogues incorporating carboxylate bioisosteric functions are micromolar inhibitors of human recombinant DDAH-1. Org Biomol Chem 2015, 13, 11315–11330. [Google Scholar] [CrossRef]
- Hulin, J.A.; Tommasi, S.; Elliot, D.; Mangoni, A.A. Small molecule inhibition of DDAH1 significantly attenuates triple negative breast cancer cell vasculogenic mimicry in vitro. Biomed Pharmacother 2019, 111, 602–612. [Google Scholar] [CrossRef] [PubMed]
- Morales-Guadarrama, G.; Garcia-Becerra, R.; Mendez-Perez, E.A.; Garcia-Quiroz, J.; Avila, E.; Diaz, L. Vasculogenic Mimicry in Breast Cancer: Clinical Relevance and Drivers. Cells 2021, 10. [Google Scholar] [CrossRef] [PubMed]
- Andreucci, E.; Peppicelli, S.; Ruzzolini, J.; Bianchini, F.; Calorini, L. Physicochemical aspects of the tumour microenvironment as drivers of vasculogenic mimicry. Cancer Metastasis Rev 2022, 41, 935–951. [Google Scholar] [CrossRef] [PubMed]
- Chavoshi, H.; Poormolaie, N.; Vahedian, V.; Kazemzadeh, H.; Mir, A.; Nejabati, H.R.; Behroozi, J.; Isazadeh, A.; Hajezimian, S.; Nouri, M.; et al. Vascular mimicry: A potential therapeutic target in breast cancer. Pathol Res Pract 2022, 234, 153922. [Google Scholar] [CrossRef]
- Dudley, A.C.; Griffioen, A.W. Pathological angiogenesis: mechanisms and therapeutic strategies. Angiogenesis 2023, 26, 313–347. [Google Scholar] [CrossRef] [PubMed]
- Ma, X.; Geng, Z.; Wang, S.; Yu, Z.; Liu, T.; Guan, S.; Du, S.; Zhu, C. The driving mechanism and targeting value of mimicry between vascular endothelial cells and tumor cells in tumor progression. Biomed Pharmacother 2023, 165, 115029. [Google Scholar] [CrossRef] [PubMed]
- Mangoni, A.A.; Hulin, J.-A.; Weerakoon, L.; Tommasi, S. Targeting dimethylarginine dimethylaminohydrolase 1 to suppress vasculogenic mimicry in breast cancer: Current evidence and future directions. In Nitric Oxide in Health and Disease; 2023; pp. 117–133.
- Tommasi, S.; Elliot, D.J.; Hulin, J.A.; Lewis, B.C.; McEvoy, M.; Mangoni, A.A. Human dimethylarginine dimethylaminohydrolase 1 inhibition by proton pump inhibitors and the cardiovascular risk marker asymmetric dimethylarginine: in vitro and in vivo significance. Sci Rep 2017, 7, 2871. [Google Scholar] [CrossRef] [PubMed]
- Mangoni, A.A.; Ceruti, T.; Frapolli, R.; Russo, M.; Fichera, S.; Zucchetti, M.; Tommasi, S. Pharmacokinetic Characterization of the DDAH1 Inhibitors ZST316 and ZST152 in Mice Using a HPLC-MS/MS Method. Molecules 2022, 27. [Google Scholar] [CrossRef]
- Rossiter, S.; Smith, C.L.; Malaki, M.; Nandi, M.; Gill, H.; Leiper, J.M.; Vallance, P.; Selwood, D.L. Selective substrate-based inhibitors of mammalian dimethylarginine dimethylaminohydrolase. J Med Chem 2005, 48, 4670–4678. [Google Scholar] [CrossRef] [PubMed]
- Guideline on bioanalytical method validation. European Medicine Agency: London, United Kingdom, 2011; pp. 1–23.
- Bioanalytical Method Validation - Guidance for Industry. Office of Communications, Division of Drug Information Center for Drug Evaluation and Research. Food and Drug Administration: Silver Spring, MD, USA, 2018; pp. 1–41.
- Holen, I.; Speirs, V.; Morrissey, B.; Blyth, K. In vivo models in breast cancer research: progress, challenges and future directions. Dis Model Mech 2017, 10, 359–371. [Google Scholar] [CrossRef] [PubMed]
- Park, M.K.; Lee, C.H.; Lee, H. Mouse models of breast cancer in preclinical research. Lab Anim Res 2018, 34, 160–165. [Google Scholar] [CrossRef] [PubMed]
- Roarty, K.; Echeverria, G.V. Laboratory Models for Investigating Breast Cancer Therapy Resistance and Metastasis. Front Oncol 2021, 11, 645698. [Google Scholar] [CrossRef]
Figure 1.
SRM fragmentation pattern of ZST316 (A) and L-257 (B) obtained by tandem mass spectrometry.
Figure 1.
SRM fragmentation pattern of ZST316 (A) and L-257 (B) obtained by tandem mass spectrometry.
Figure 2.
Representative chromatograms of a blank plasma sample (panel A for ZST316 and D for L-257), LOQ of ZST316 with IS (panel B), an unknown study plasma sample analyzed for ZST316 (panel C), LOQ of L-257 with IS (panel E), and an unknown study plasma sample analyzed for L-257 (panel F). The measured concentration corresponded to 2200ng/mL and 1710ng/mL for ZST316 and L-257, respectively.
Figure 3.
Representative chromatograms of a blank tumour sample (panel A for ZST316 and D for L-257), LOQ of ZST316 with IS (ZST152, panel B), unknown study tumour sample analyzed for ZST316 with IS (ZST152, panel C), LOQ of L-257 with IS (panel (E) and unknown study tumour sample analyzed for L-257 with IS (panel F). The measured concentration corresponded to 37.3ng/g and 30.7ng/g for ZST316 and L-257, respectively.
Figure 4.
Plasma pharmacokinetics of ZST316 and L-257 after acute administration of ZST316. Dotted lines represent the Ki values (* 261nM = 80.3ng/mL; ** 7µM = 1625ng/mL)
Figure 4.
Plasma pharmacokinetics of ZST316 and L-257 after acute administration of ZST316. Dotted lines represent the Ki values (* 261nM = 80.3ng/mL; ** 7µM = 1625ng/mL)
Figure 5.
Tumour distribution of ZST316 and L-257 after acute administration of ZST316. Dotted lines represent the Ki values (* 261nM = 80.3ng/mL; ** 7µM = 1625ng/mL).
Figure 5.
Tumour distribution of ZST316 and L-257 after acute administration of ZST316. Dotted lines represent the Ki values (* 261nM = 80.3ng/mL; ** 7µM = 1625ng/mL).
Figure 6.
Plasma pharmacokinetics of ZST316 and L-257 after chronic administration of ZST316. Dotted lines represent the Ki values (* 261nM = 80.3ng/mL; ** 7µM = 1625ng/mL).
Figure 6.
Plasma pharmacokinetics of ZST316 and L-257 after chronic administration of ZST316. Dotted lines represent the Ki values (* 261nM = 80.3ng/mL; ** 7µM = 1625ng/mL).
Figure 7.
Tumour distribution of ZST316 and L-257 after chronic administration of ZST316. Dotted lines represent the Ki values (* 261nM = 80.3ng/mL; ** 7µM = 1625ng/m).
Figure 7.
Tumour distribution of ZST316 and L-257 after chronic administration of ZST316. Dotted lines represent the Ki values (* 261nM = 80.3ng/mL; ** 7µM = 1625ng/m).
Table 1.
Precision and accuracy results for the assay of ZST316 and L-257 in plasma.
Table 1.
Precision and accuracy results for the assay of ZST316 and L-257 in plasma.
| |
ZST316 |
L-257 |
| Actual concentration (ng/mL) |
15.0 |
75.0 |
250.0 |
15.0 |
75.0 |
250.0 |
| Mean concentration (ng/mL) |
15.1 |
71.6 |
257.7 |
14.7 |
75.2 |
259.3 |
| Accuracy (%) |
100.7 |
95.5 |
103.1 |
98.0 |
100.3 |
103.7 |
| Precision (%) |
7.6 |
9.9 |
7.8 |
2.4 |
2.1 |
5.3 |
| # N |
3 |
3 |
3 |
3 |
3 |
3 |
Table 2.
Extraction recovery in homogenate of tumour tissue for ZST316.
Table 2.
Extraction recovery in homogenate of tumour tissue for ZST316.
| |
QC
75ng/g |
QC
375ng/g |
QC
1250ng/g |
| Sample no
|
Recovery % |
| 1 |
86.5 |
112.6 |
95.6 |
| 2 |
81.8 |
98.0 |
86.9 |
| 3 |
86.5 |
98.6 |
84.9 |
| 4 |
89.5 |
98.7 |
82.4 |
| 5 |
77.6 |
81.7 |
85.7 |
| N |
5 |
5 |
5 |
| Mean |
84.4 |
97.9 |
87.1 |
| SD |
4.7 |
10.9 |
5.0 |
| CV% |
5.5 |
11.2 |
5.8 |
Table 3.
Extraction recovery in homogenate of tumour tissue for L-257.
Table 3.
Extraction recovery in homogenate of tumour tissue for L-257.
| |
QC
75ng/g |
QC
375ng/g |
QC
1250ng/g |
| Sample no
|
Recovery% |
| 1 |
98.4 |
102.5 |
94.4 |
| 2 |
104.4 |
100.1 |
90.0 |
| 3 |
99.7 |
91.5 |
90.8 |
| 4 |
91.0 |
92.4 |
90.0 |
| 5 |
76.1 |
90.0 |
89.9 |
| N |
5 |
5 |
5 |
| Mean |
93.9 |
95.3 |
91.0 |
| SD |
11.1 |
5.6 |
1.9 |
| CV% |
11.8 |
5.9 |
2.1 |
Table 4.
Precision and accuracy results for ZST316 in tumour tissue
Table 4.
Precision and accuracy results for ZST316 in tumour tissue
Table 5.
Precision and accuracy results for L-257 in tumour tissue.
Table 5.
Precision and accuracy results for L-257 in tumour tissue.
| Actual concentration (ng/g) |
25.0 (LOQ) |
75.0 |
375.0 |
1250.0 |
| Mean concentration found (ng/g) |
27.6 |
80.2 |
397 |
1356 |
| Accuracy (%) |
110.5 |
106.9 |
105.7 |
108.5 |
| Precision (%) |
4.6 |
6.8 |
4.4 |
3.9 |
| Number of samples |
5 |
5 |
5 |
5 |
Table 6.
Pharmacokinetic parameters of ZST316 and L-257 after acute and chronic intraperitoneal administration of ZST316.
Table 6.
Pharmacokinetic parameters of ZST316 and L-257 after acute and chronic intraperitoneal administration of ZST316.
| |
ZST316
acute |
ZST316
chronic |
L-257
acute |
L-257
chronic |
Plasma
AUC1-24h (μg/ml*h) |
15.3
(0.050 μM/ml*h) |
12.4
(0.040 μM/ml*h) |
14.1
(0.061 μM/ml*h) |
10.3
(0.044 μM/ml*h) |
Tumour
AUC1-24h (μg/ml*h) |
11.4
(0.037 μM/ml*h) |
11.8
(0.038 μM/ml*h) |
23.9
(0.103 μM/ml*h) |
20.3
(0.087 μM/ml*h) |
| AUCtum/AUCpl
|
0.75 |
0.95 |
1.7 |
2.0 |
| Cmax plasma (μg/ml) |
2.79 (9.03μM) |
2.22 (7.18μM) |
2.02 (8.70μM) |
1.60 (6.89μM) |
| Cmax tumour (μg/g) |
2.00 (6.47μM) |
2.09 (6.76μM) |
3.50 (15.08μM) |
3.24 (13.96μM) |
| *half-life plasma (h) |
4.4 |
7.1 |
4.2 |
5.3 |
| *half-life tumour (h) |
4.5 |
5.0 |
3.6 |
4.9 |
|
Disclaimer/Publisher’s Note: The statements, opinions and data contained in all publications are solely those of the individual author(s) and contributor(s) and not of MDPI and/or the editor(s). MDPI and/or the editor(s) disclaim responsibility for any injury to people or property resulting from any ideas, methods, instructions or products referred to in the content. |
© 2023 by the authors. Licensee MDPI, Basel, Switzerland. This article is an open access article distributed under the terms and conditions of the Creative Commons Attribution (CC BY) license (http://creativecommons.org/licenses/by/4.0/).
