1. Introduction
The Visible Infrared Imaging Radiometer Suite (VIIRS) instrument is the successor to MODIS for generating ocean color and earth data products. The VIIRS is a multidisciplinary instrument mounted on the Joint Polar Satellite System (JPSS) - Suomi National Polar-orbiting Partnership Satellite (S-NPP) launched in October 2011. The VIIRS sensor features 22 spectral bands ranging from 412 nm to 12 µm, including 16 moderate-resolution bands with a maximum resolution of 750 m, 5 high-resolution bands at 375 m, and a day-night band (DNB) suitable for global observations of the land, oceans, atmosphere, and cryosphere. The VIIRS data products have been made available from 2012 to 2023, spanning approximately 12 years, which notably exceeds the planned life expectancy of 5 to 7 years. Recent studies have indicated that the MODIS-Aqua longevity is impressive as it continued to operate over the period of 21 years beyond its design lifetime of 6 years despite minor adjustments made to further improve the retrieved ocean color products. The long-term ocean color records of the MODIS-Aqua instrument also led to notable performance degradation and indicated the need for new calibration methods. For instance, Meister et al. (2014) proposed a calibration method specifically targeting the MODIS bands. This method utilized only the central part of the MODIS scan to generate the averaged L3 data products at the desired spatial and temporal scales [
1]. Using the restricted L3 data accounting for scan angles and cross-calibration coefficients for each scan angle, the cross-calibration coefficients for the central part were determined close to 1 as an indicator of good calibration. The residual trends persisted on the scan edges, particularly at 412 and 443 nm bands. For the 412 nm band, the correction at the scan edges reached up to 3%. When evaluating the long-term VIIRS ocean color products, Cao et al. (2013) found that the degradation of the mirror component of the VIIRS rotating telescope stabilized at 30% approximately [
2]. However, continuous monitoring of its performance over the long period is necessary. Uprety et al. (2015) conducted an analysis of the radiometric performance of the VIIRS sensor by comparing it with other satellite instruments such as MODIS/Aqua and Landsat 8 OLI [
3]. The results showed that the stability of most VIIRS bands was better than 0.5% and the uncertainty around 1%. After accounting for spectral differences, the absolute radiance deviation estimated through cross-calibration between VIIRS and MODIS was less than 2% for each waveband. In general, similar to the MODIS/Aqua instrument calibration activities on a regular basis, it is critical to assess the long-term spatial and temporal ocean color products of VIIRS and ensure their accuracy and integrity for global ocean applications.
Most of the existing validations of VIIRS products have primarily relied on data collected from fixed platforms (such as buoys) or AERONET-OC observation stations installed on offshore oil platforms. During the early launch phase of VIIRS, Hlaing (2013) validated the accuracy of VIIRS products based on nearly one year of data (2012) from two coastal AERONET-OC (LISCO and WaveCIS) sites. The results showed that the VIIRS products sensor were capable of capturing seasonal and temporal variations of water properties, with an average correlation coefficient (R) greater than 0.96 for all bands except the 412 nm band and an average absolute percentage difference (APD) of approximately 20% [
4]. However, the VIIRS products were underestimated at 412 nm band. To address this issue, Hlaing et al. (2013) performed extensive radiative transfer simulations of the coupled ocean-atmosphere system using the aerosol optical properties and outgoing radiance data from the AERONET-OC sites and performed the radiometric proxy calibration of VIIRS in visible and near-infrared bands. The difference in blue band was approximately 0.5% [
5]. Wang et al. (2014) evaluated the VIIRS ocean color products using data from the Marine Optical Buoy (MOBY) near Lanai Island, Hawaii, which included the normalized water-leaving radiance spectra (nLw(λ)) and chlorophyll-a (Chl-a) concentration in five bands of VIIRS [
6]. The results showed that the VIIRS Chl-a concentrations in global oligotrophic waters were significantly lower in 2013 than in 2012 while exhibiting little inter-annual variation in MODIS-Aqua products between 2012 and 2013. This indicates a serious issue with the VIIRS calibration in the visible bands. It was primarily related to the attenuation values at the VIIRS 551 nm band. Vandermeulen et al. (2015) validated the accuracy of VIIRS products using in-situ data from the AERONET-OC sites located in the Chesapeake Bay and Mississippi River plume and the results showed an RMSE value of 0.160 mW cm
-2m
-1sr
-1 for the 551 nm band [
7]. Brando et al. (2016) reported spectral comparisons of radiometer data with VIIRS in different tropical water types off northern Australia based on the standard NIR atmospheric correction algorithm (available in SeaDAS software) [
8]. The results showed a high consistency (RMSD < 0.002 sr
-1) for all wavelengths above 530 nm, but the satellite reflectance data consistently underestimated the in situ spectra in blue bands by 7.5%–29%. After several years of VIIRS operation, Barnes et al. (2019) validated the VIIRS remote sensing reflectance products using in situ measurements from 53 cruises in nearshore regions of the Gulf of Mexico between 2012 and 2017. The results revealed the APD values of 37%, 30%, 22%, 23%, and 43% for the 412 nm, 443 nm, 486 nm, 551 nm, and 671 nm bands, respectively[
9].
Using data from fixed platforms is of great advantage because of its high temporal resolution. The use of high frequency observations from fixed platforms with small time intervals (within 1 hour) also leads to more accurate validation of the satellite-derived ocean color products. However, certain distinctly different areas of algal blooms and river plumes are often under-sampled by these methods. Most of the previous studies have primarily focused on validating the satellite data products for a particular year without considering the long-term product quality and integrity. Thus, the main objective of this study is to evaluate the long-term accuracy of VIIRS remote sensing reflectance (Rrs) products by utilizing a large dataset covering the open ocean waters, estuaries, river plumes, algal blooms, and coastal areas. For this purpose, the in-situ data were collected from the fixed observing platforms and ship measurements. This will lead to developing new models to improve the accuracy of VIIRS ocean color products.
2. Data and Methods
2.1. In situ data
The in-situ measurements of remote-sensing reflectance (Rrs) are the primary data used to evaluate the VIIRS products’ accuracy. These data were obtained from a database created by Valente et al. (2022) who previously utilized this database to validate the OC-CCI (ESA Ocean Colour Climate Change Initiative) ocean color products [
10,
11,
12]. It includes a vast number of measurements made during the period from 1997 to 2021, comprising six commonly used data sources for ocean colour validation (MOBY, BOUSSOLE, AERONET-OC, SeaBASS, NOMAD, and MERMAID) and four data sources for ocean colour applications (AWI, COASTCOLOUR, TPSS, and TARA). Any duplicate data within these data sources were screened out, thus priority was given to the NOMAD dataset followed by the data from the individual projects (MOBY, BOUSSOLE, AERONET-OC, AMT, HOT, and GeP&CO) and other sources (SeaBASS, MERMAID, and ICES). This approach was chosen by their global popularity and wider utility in ocean color work. The compiled in-situ Rrs spectra were normalized to a single sun-viewing geometry (sun at zenith and nadir viewing) and corrected for the bidirectional effects (Morel et al., 2002)) [
13]. Furthermore, Valente et al. (2022) applied homogenization, quality control, and merging methods to all data. Minimal changes were made to the original data, other than averaging the observations that were closely collected in time and space, eliminating some points after quality control, and converting these data to a standard format[
10,
11,
12].
During the operational time period of VIIRS, we obtained the remote sensing reflectance from OC-CCI data covering the period from 1 January 2012 to 27 September 2021 (insitudb_rrs_satbands6_V3,
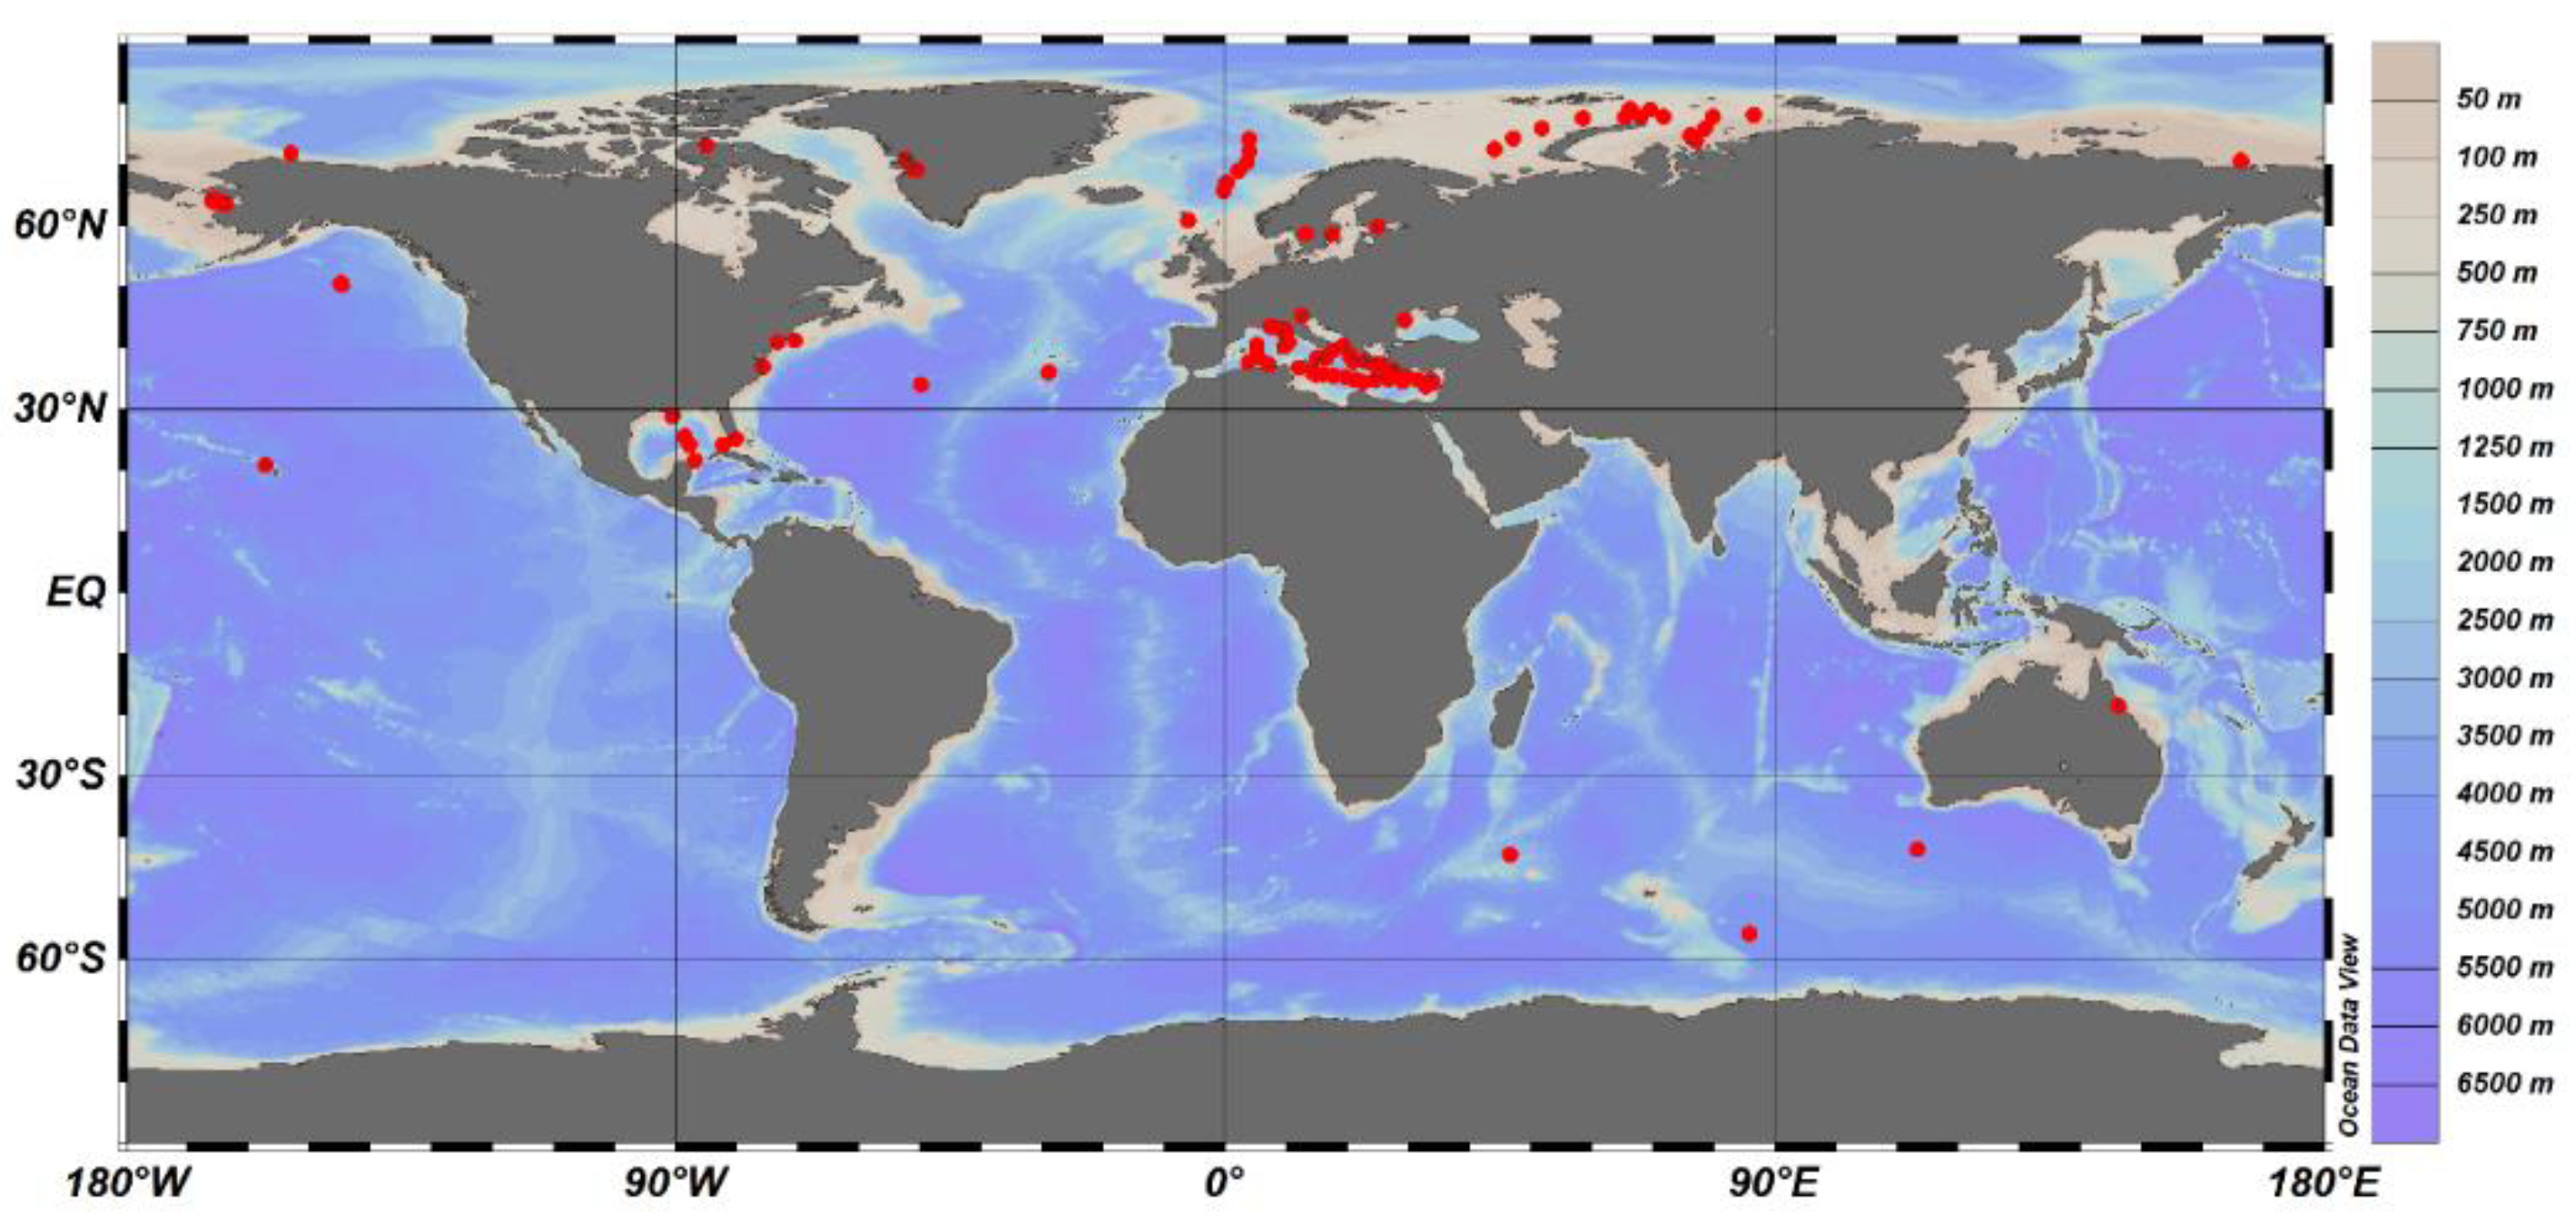
https://doi.pangaea.de/10.1594/PANGAEA.941318). This dataset includes approximately 32198 in situ measurements of Rrs spectra (values are generally available at 412 nm, 443 nm, 486 nm, 551 nm, and 671 nm), of which approximately 30000 measurements were collected on fixed platforms such as AERONET-OC and BOUSSOLE and the remaining 2,000 measurements on mobile platforms like NOMAD and others. Due to clouds, sun glints, straylight, and other factors, the number of matchups between in situ and satellite Rrs data was significantly lower than the total number of measurements. The distribution of the sampling locations is shown in
Figure 1, where much of these data come Case-2 waters while a small portion from open oceanic waters.
2.2. Satellite data
The VIIRS Level 2 products were generated by the NASA OBPG (
http://oceancolor.gsfc.nasa.gov) using SeaDAS software (with the standard iterative NIR atmospheric correction algorithm) and that were obtained from for the sampling locations of OC-CCI data. These data were processed using the latest processing scheme (version 2022.0), which includes the updates on VIIRS instrument calibration for the radiometric degradation issues based on the on-board (solar/lunar) measurements. The wavelengths of the VIIRS sensor slightly differed from those of the OC-CCI dataset and hence all comparisons were made using the reference VIIRS wavelengths (412, 443, 486, 551, and 671 nm).
For the matchup comparison, the data processing excluded the individual pixels meeting any of the following conditions: land, cloud, failure in atmospheric correction, stray light, bad navigation quality, high and moderate glint, and negative Rayleigh-corrected radiance. In addition, pixels with negative values in any of the wavelengths of the water-leaving radiance spectra were also excluded from spatial averaging. A solar zenith angle (SZA) threshold was fixed to 90 degrees to evaluate the accuracy of satellite products under different SZAs and to obtain the corresponding products.
2.3. Temporal and spatial matching scheme and statistical parameters
To validate the satellite products, we considered the significant differences/variations in the time matching window, pixel box size, and coefficient of variation (CV). For example, the time matching window can be ± 3 hours or ± 5 hours, the pixel box can be 3x3 or 5x5, and the coefficient of variation can be 0.15, 0.2, and 0.4. Studies by Mélin et al. (2007) and Barnes et al. (2015) have indicated that the statistical errors remain relatively consistent across different time matching windows and coefficients of variation [
14]. In this study, the spatial and temporal matching of in-situ and satellite data was successfully done by averaging all pixels in the 3x3 window centered on the observation point with a time window of ±3 hours [
15,
16]. Additionally, the following conditions were applied:
1) The percentage of valid pixels in the 3x3 window was checked. If it exceeded 50%, the data were used and otherwise discarded.
2) The mean and standard deviation (SD) of all validation pixels were calculated. Any pixel falling outside the range of mean ± 1.5 SD was removed.
3) For the remaining pixels, the CV, calculated as SD/mean, was used to ensure spatial consistency. If CV exceeded 0.15, the data were discarded.
For pixels meeting the aforementioned criteria, we conducted a comparison analysis between the in-situ and satellite-derived remote sensing reflectance products. This approach excluded the data affected by unexpected changes in natural and environmental conditions as well as artifacts in the satellite-derived products resulting from the critical sensor characteristics using the filtering procedures as previously outlined in this section.
Statistical evaluation of the VIIRS Rrs product accuracy is based on global metrics such as the square of the Pearson product-moment correlation coefficient (R
2), absolute percentage difference (APD), relative percentage difference (RPD), and root mean square difference (RMSD). These metrics are defined below [
17,
18],
where
,
, and
represent the observed values, retrieved values, and the number of samples, respectively. APD quantifies the systematic error. RPD is a primary metric used to assess the accuracy and bias in satellite-derived products. RMSD takes into account the mean and variance of the error distribution to define the random error. Using these multiple statistical metrics is an effective approach to evaluate the satellite products’ accuracy.
3. Results
This section presents the in-situ spectral characteristics of different waters, overall accuracy and its variation with observation geometry, impacts of observation geometry, and long-term accuracy variation in the water color products.
3.1. In situ spectral characteristics
A total of 8312 satellite spectral data were matched with in-situ data.
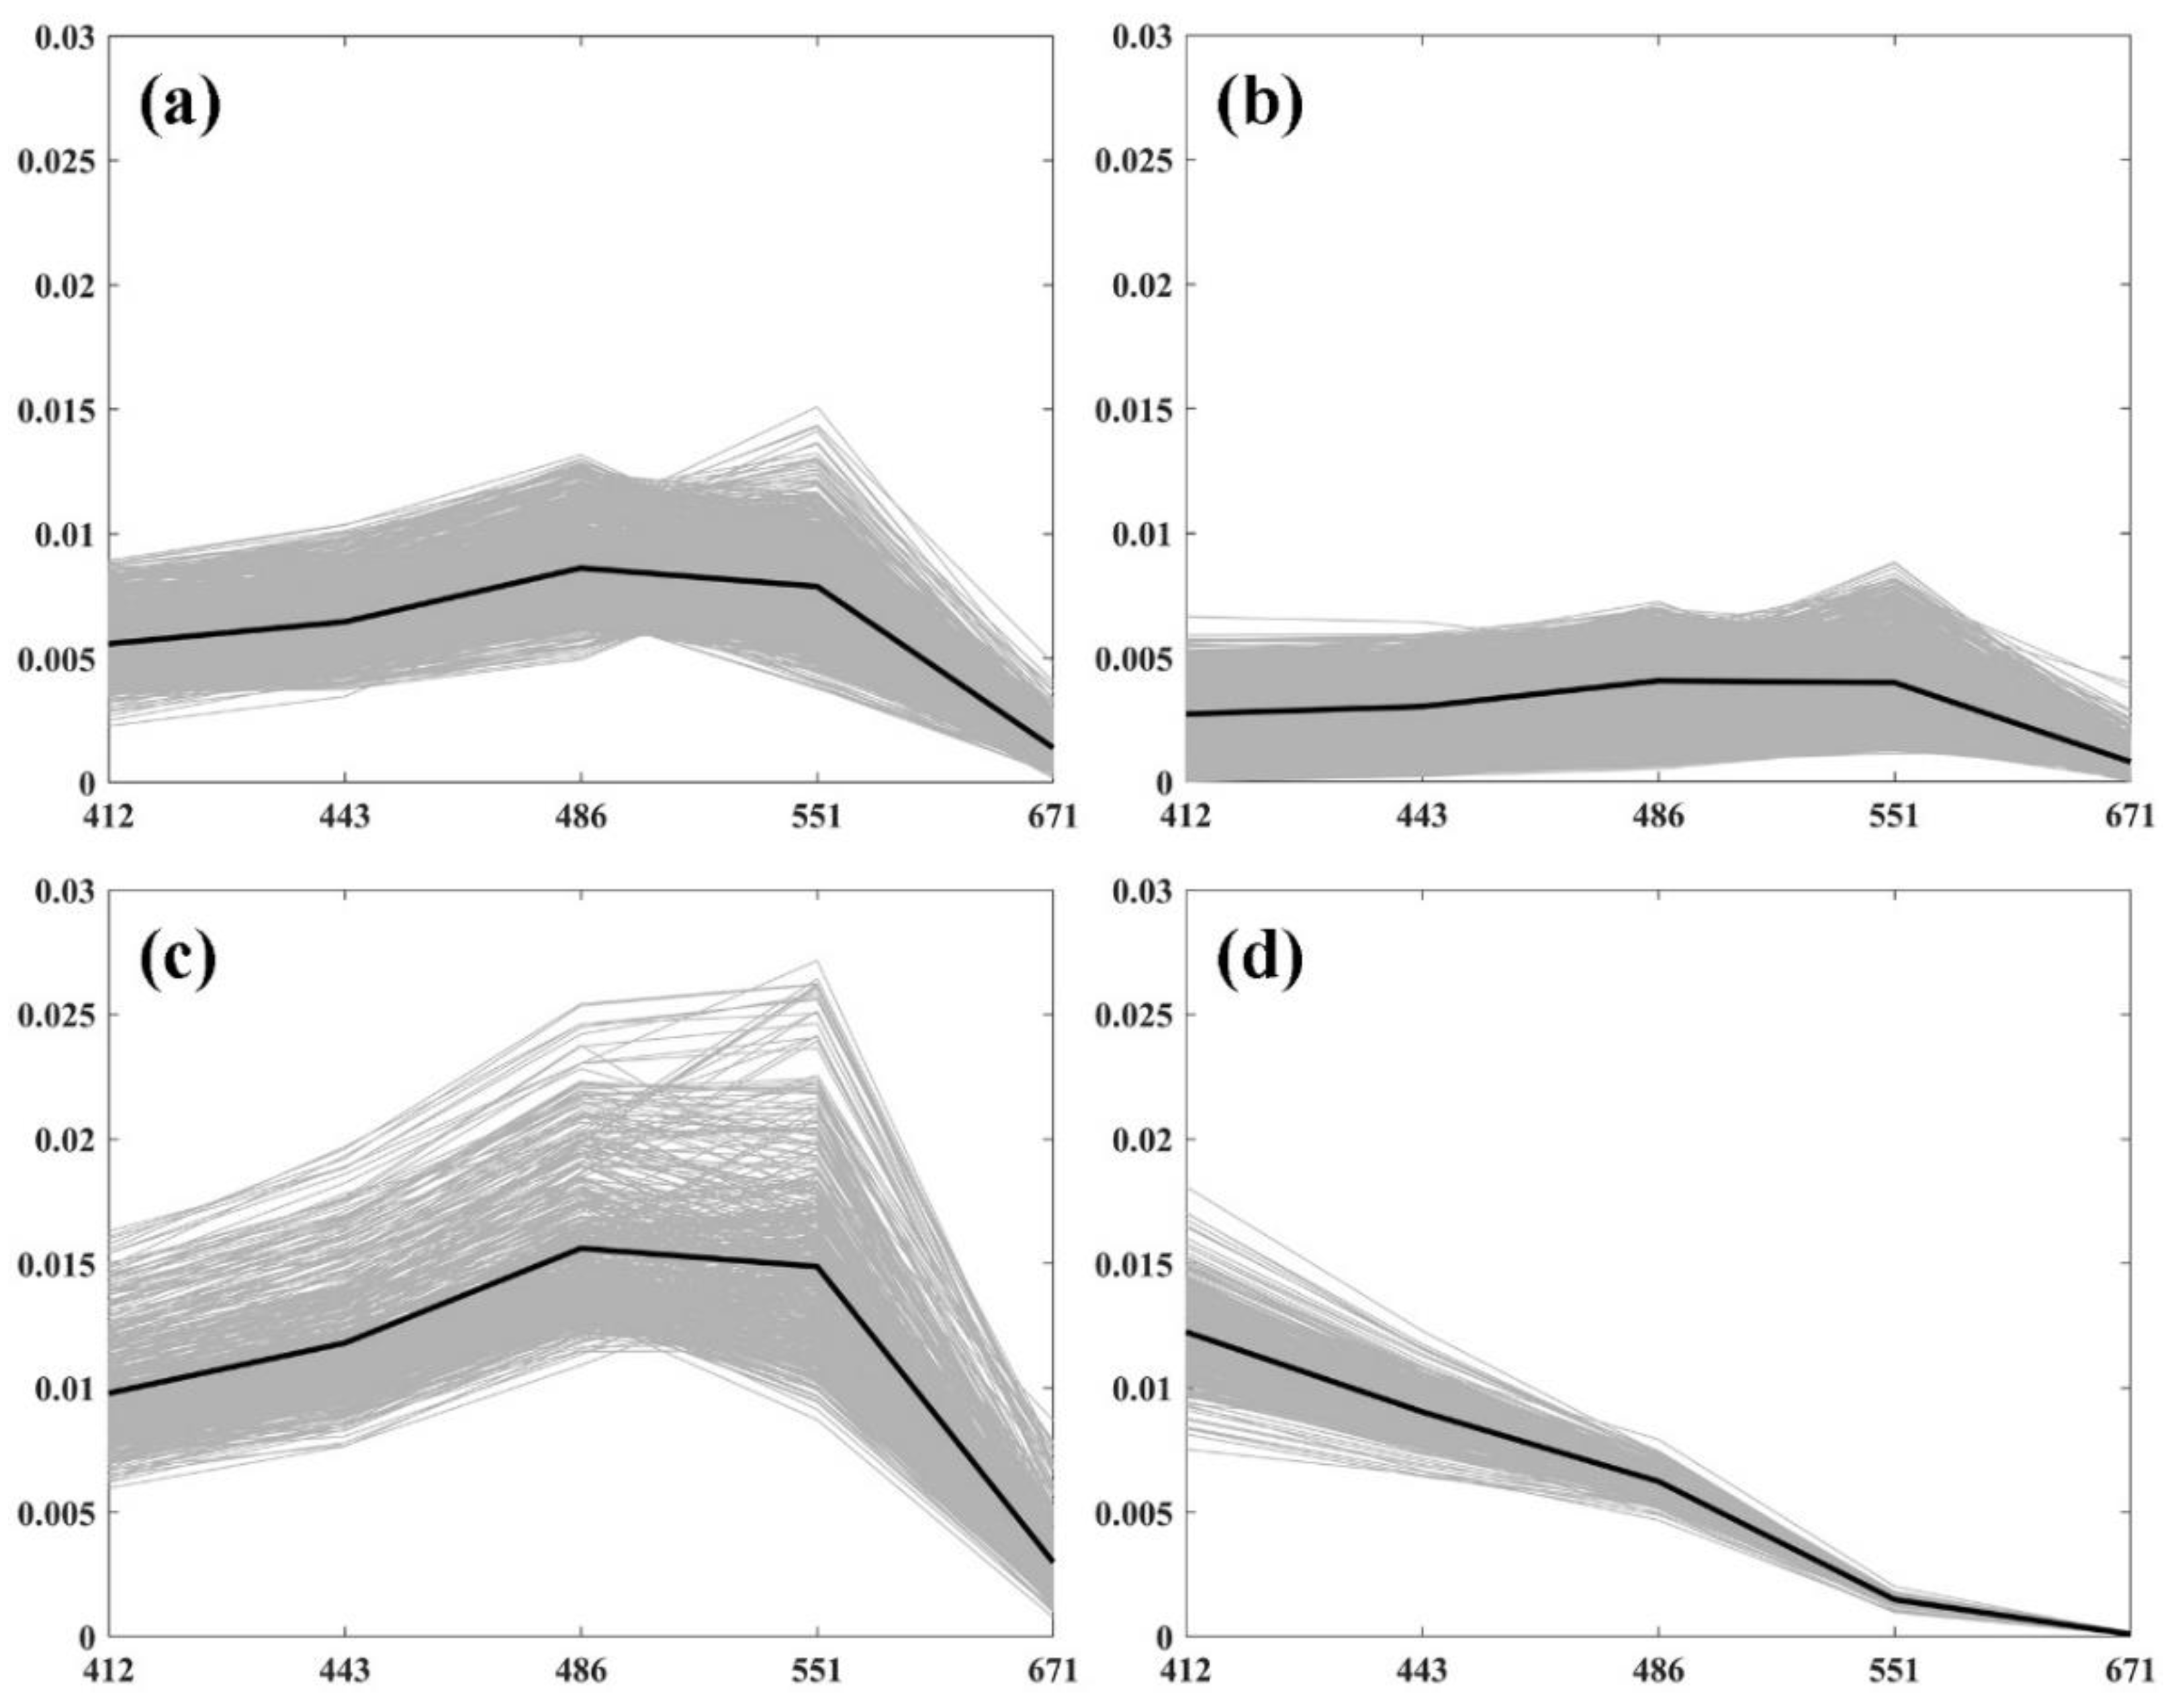
Figure 2 displays the results of using the K-Means clustering analysis on the matched in situ spectra in OC-CCI dataset. The data can be broadly divided into four categories: (a) turbid continental shelf waters, (b) clear continental shelf waters, (c) turbid coastal waters, and (d) clear open ocean waters. These four water types account for 24%, 54%, 12%, and 10% respectively. The overall range of remote sensing reflectance at 551nm for these water types is from 0.0009 to 0.027 sr
-1.
3.2. Overall assessments
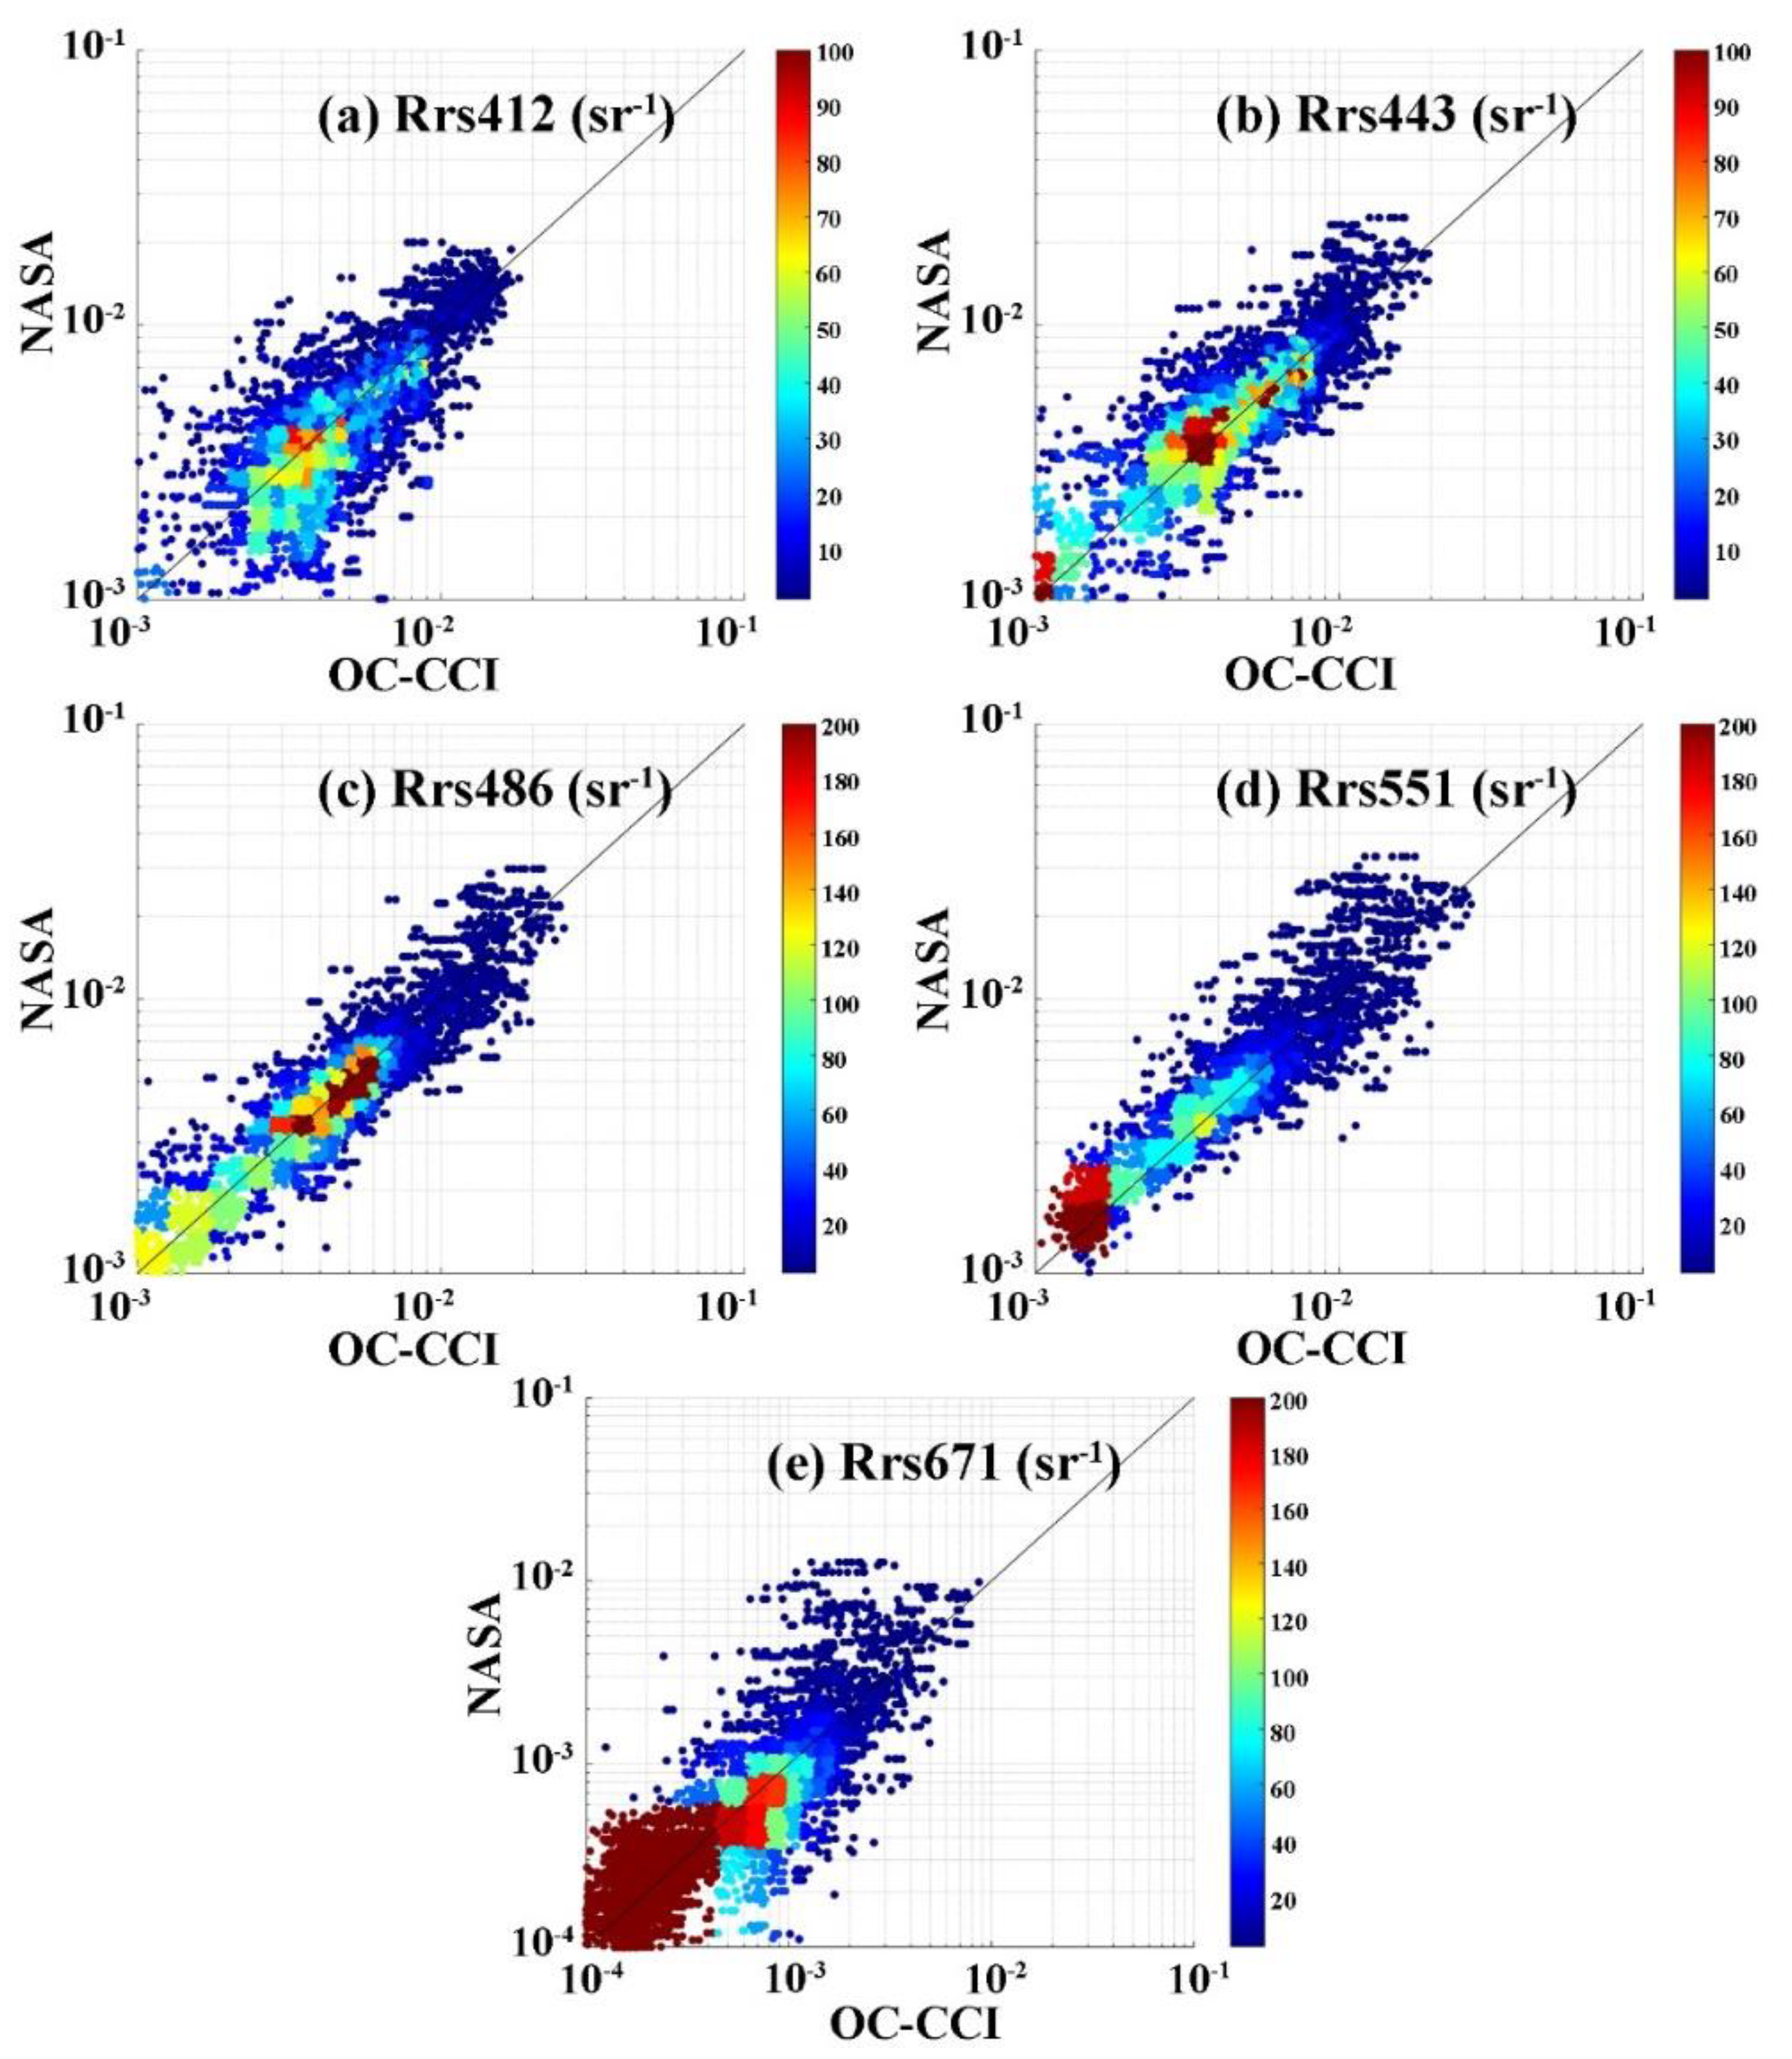
Figure 3 presents the VIIRS remote sensing reflectance (Rrs) products for each band versus the OC-CCI data. The scatter points for each band are closely aligned with the 1:1 line, demonstrating a good correlation between the retrieved and measured Rrs data over the period of 13 years and indicating high accuracy of VIIRS Rrs products in various water types.
Table 1 summarizes the overall statistical results. The accuracy of the Rrs at 486nm is generally higher compared to other bands, with an APD of 17.9% and an RPD of -2.45%. Across all VIIRS bands, there is a noticeable underestimation of Rrs values as indicated by the negative RPD values.
3.3. Annual variation in product accuracy
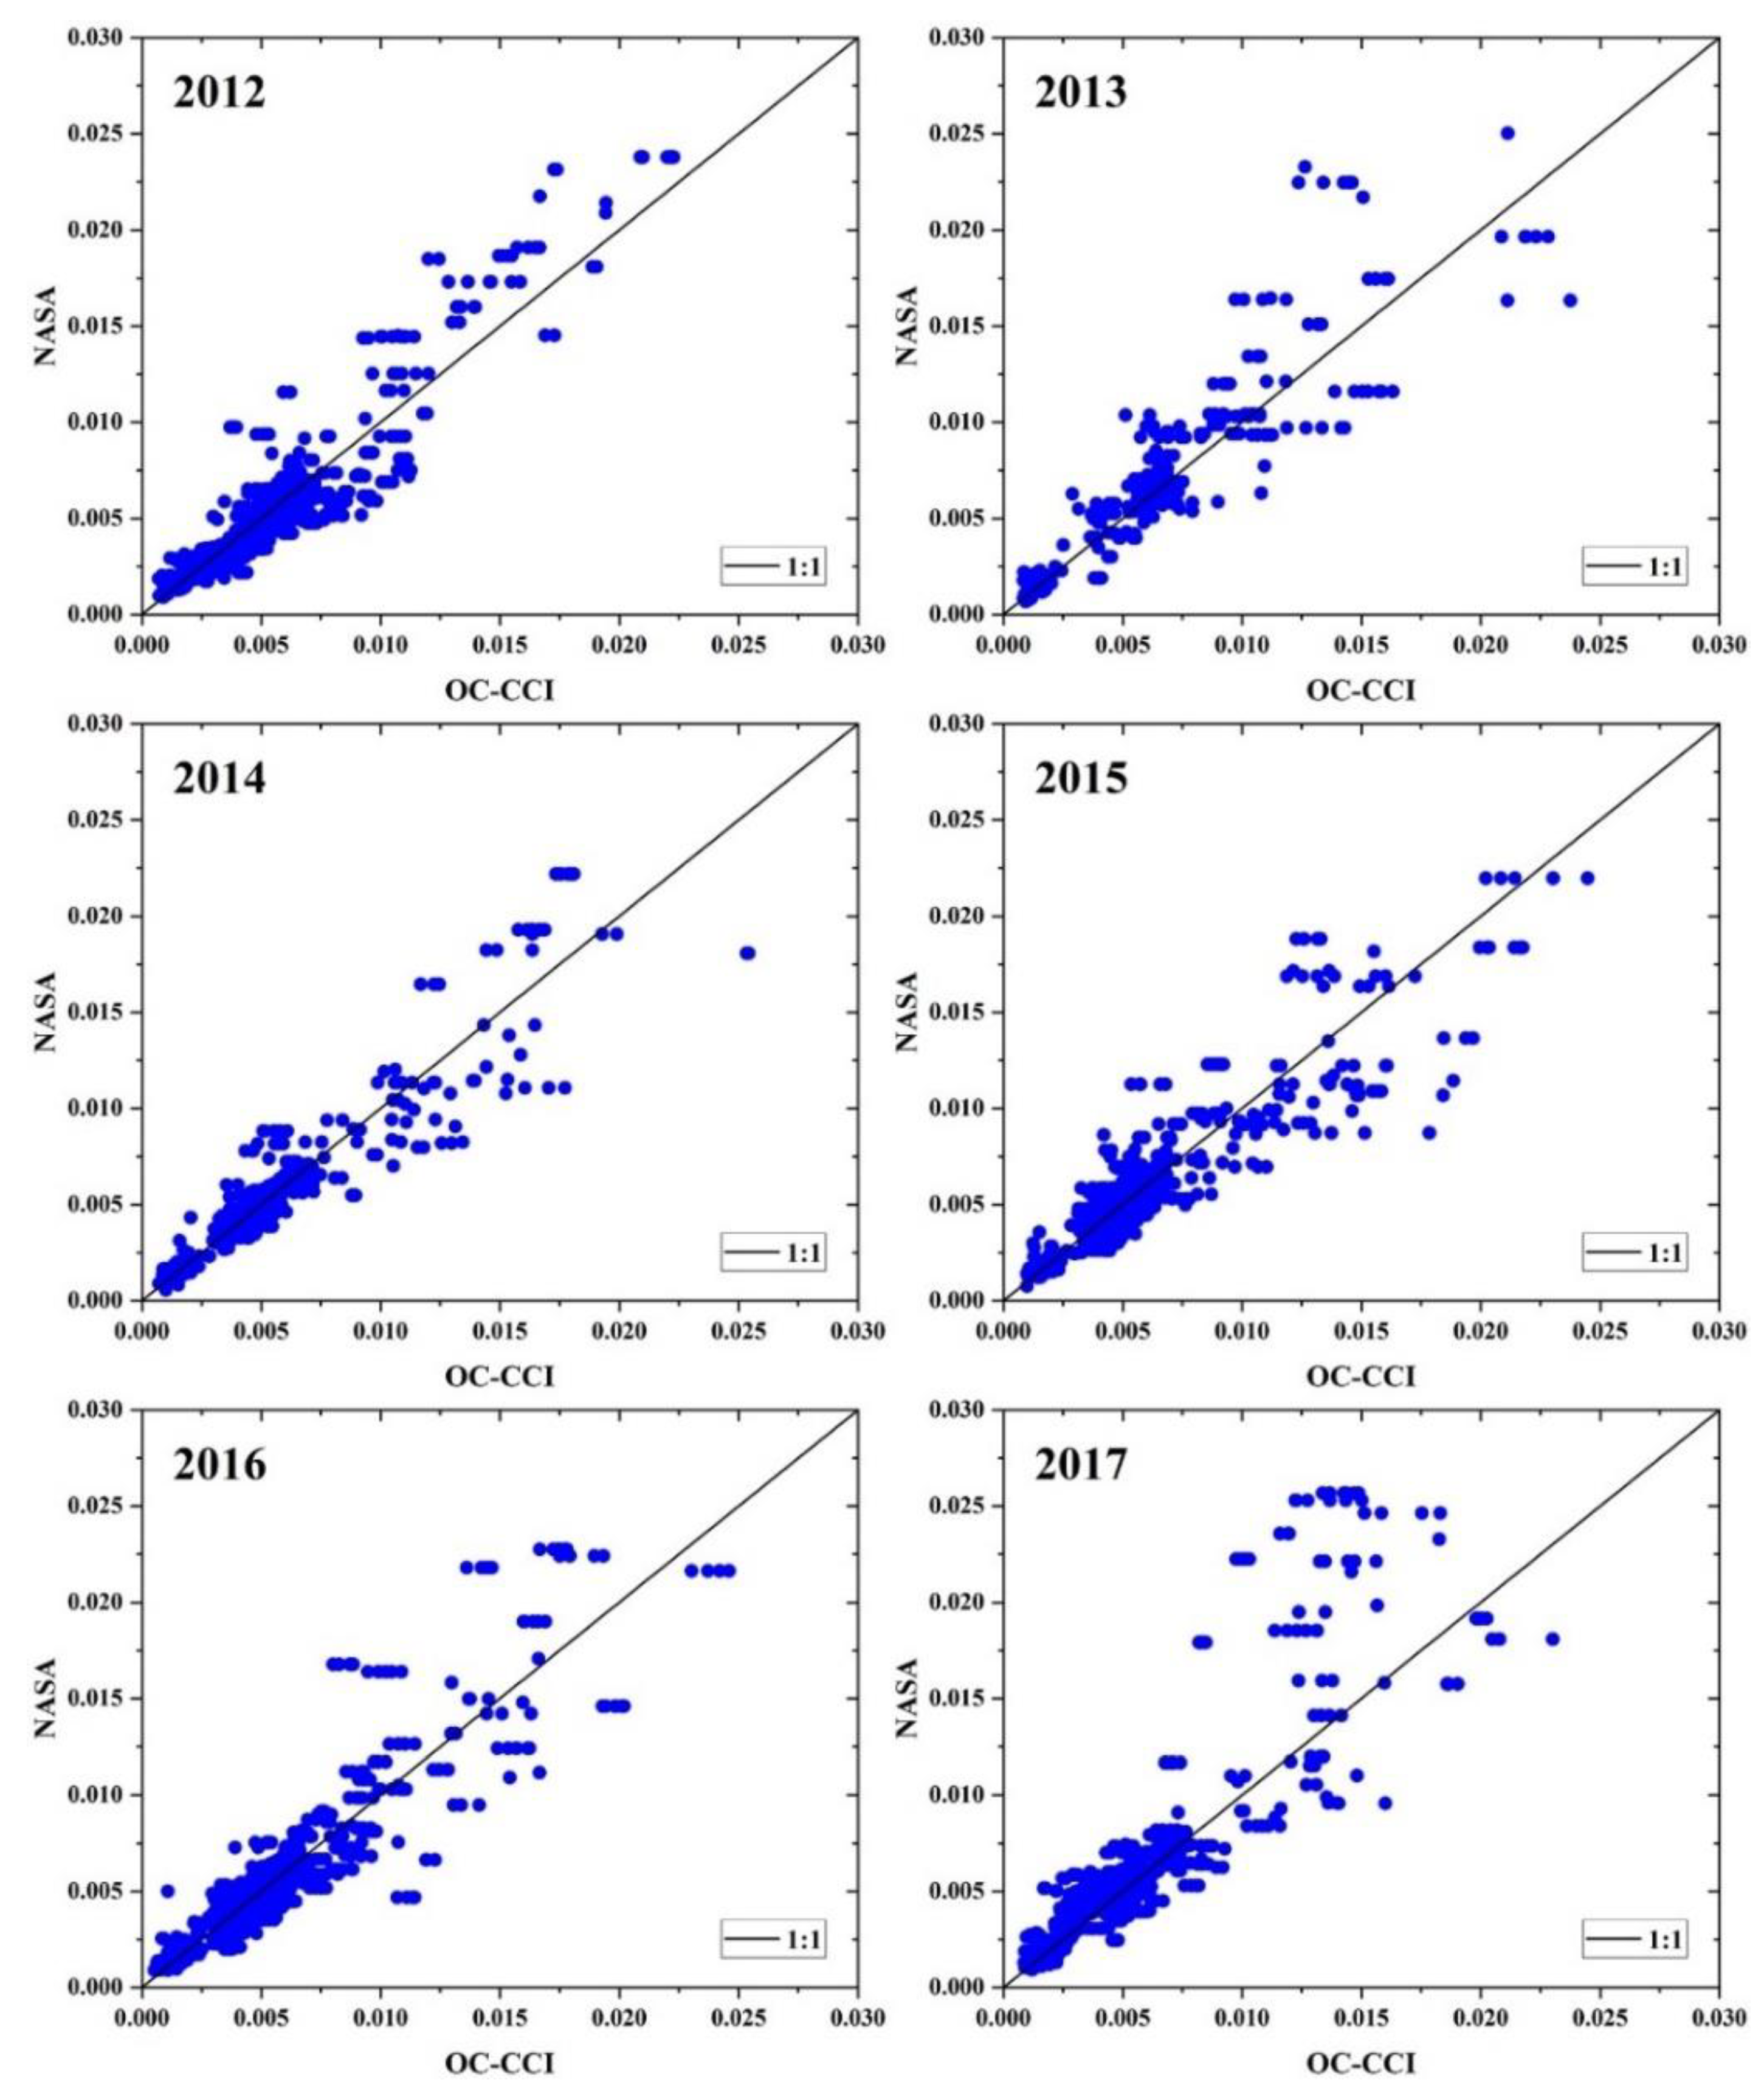
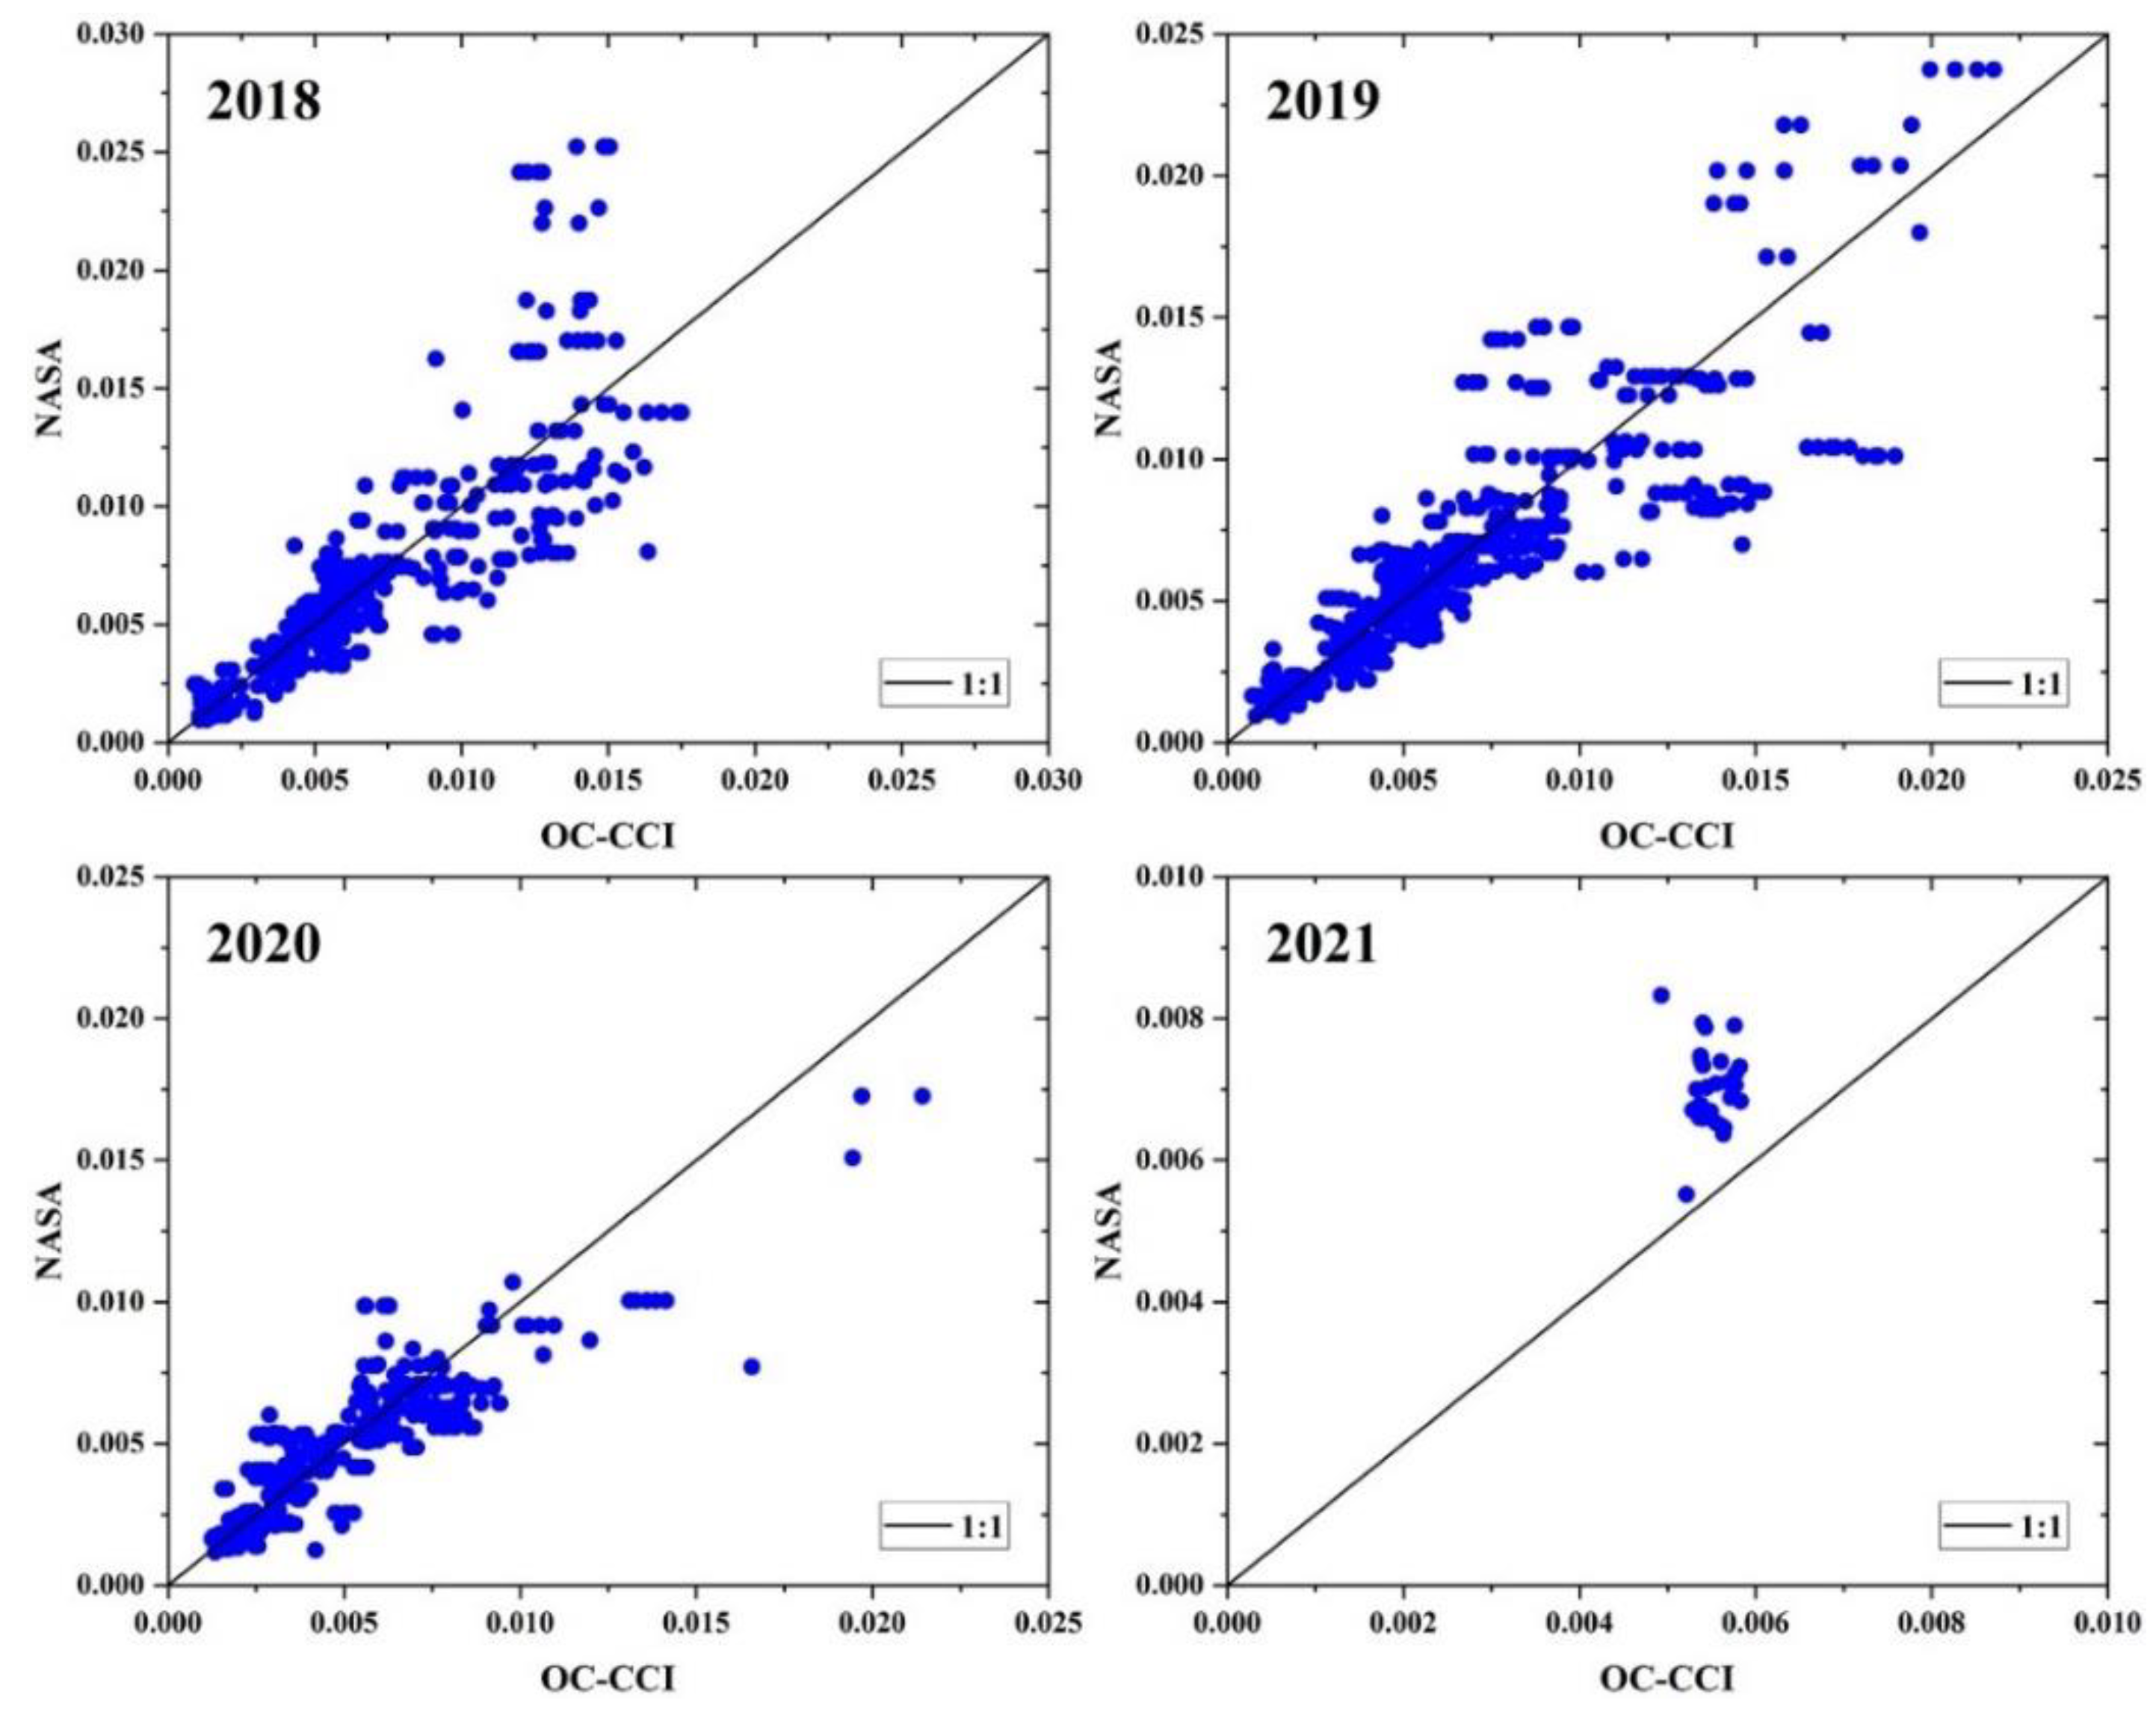
After assessing the overall accuracy of VIIRS Rrs products, we further investigated precision of annual products at 486 nm from 2012 to 2021 (
Figure 4 and
Figure 5). Notably, the inversion accuracy of VIIRS Rrs products is higher in clean water bodies than in coastal waters. When the Rrs values at 486 nm exceed 0.01 sr
-1, the validation data points are significantly scattered and deviating from in-situ measured data. Moreover, we observed a declining trend in precision of VIIRS Rrs products over the years. The accuracy remains stable in clear waters but deteriorates in water bodies with Rrs(486) greater than 0.01 sr
-1 (typically coastal turbid and eutrophic waters) as evidenced by the wide scatter points and increased deviation in the annual products.
Table 2 presents the statistical parameters of the accuracy assessment of VIIRS-Rrs(486) products on a yearly basis. Although the number of measured data used for this evaluation impacts the final statistical parameters, the measured data exceeded 300 for all years except 2021. Using similar amounts of measured data (such as 2014 (465 data points) and 2020 (439 data points)), we found that the R
2 and APD values were 0.863, 16.46%, and 0.780, 20.03%, respectively. These results indicate a noticeable decline in product accuracy for the year 2020.
3.4. Variation of product accuracy with observation geometry
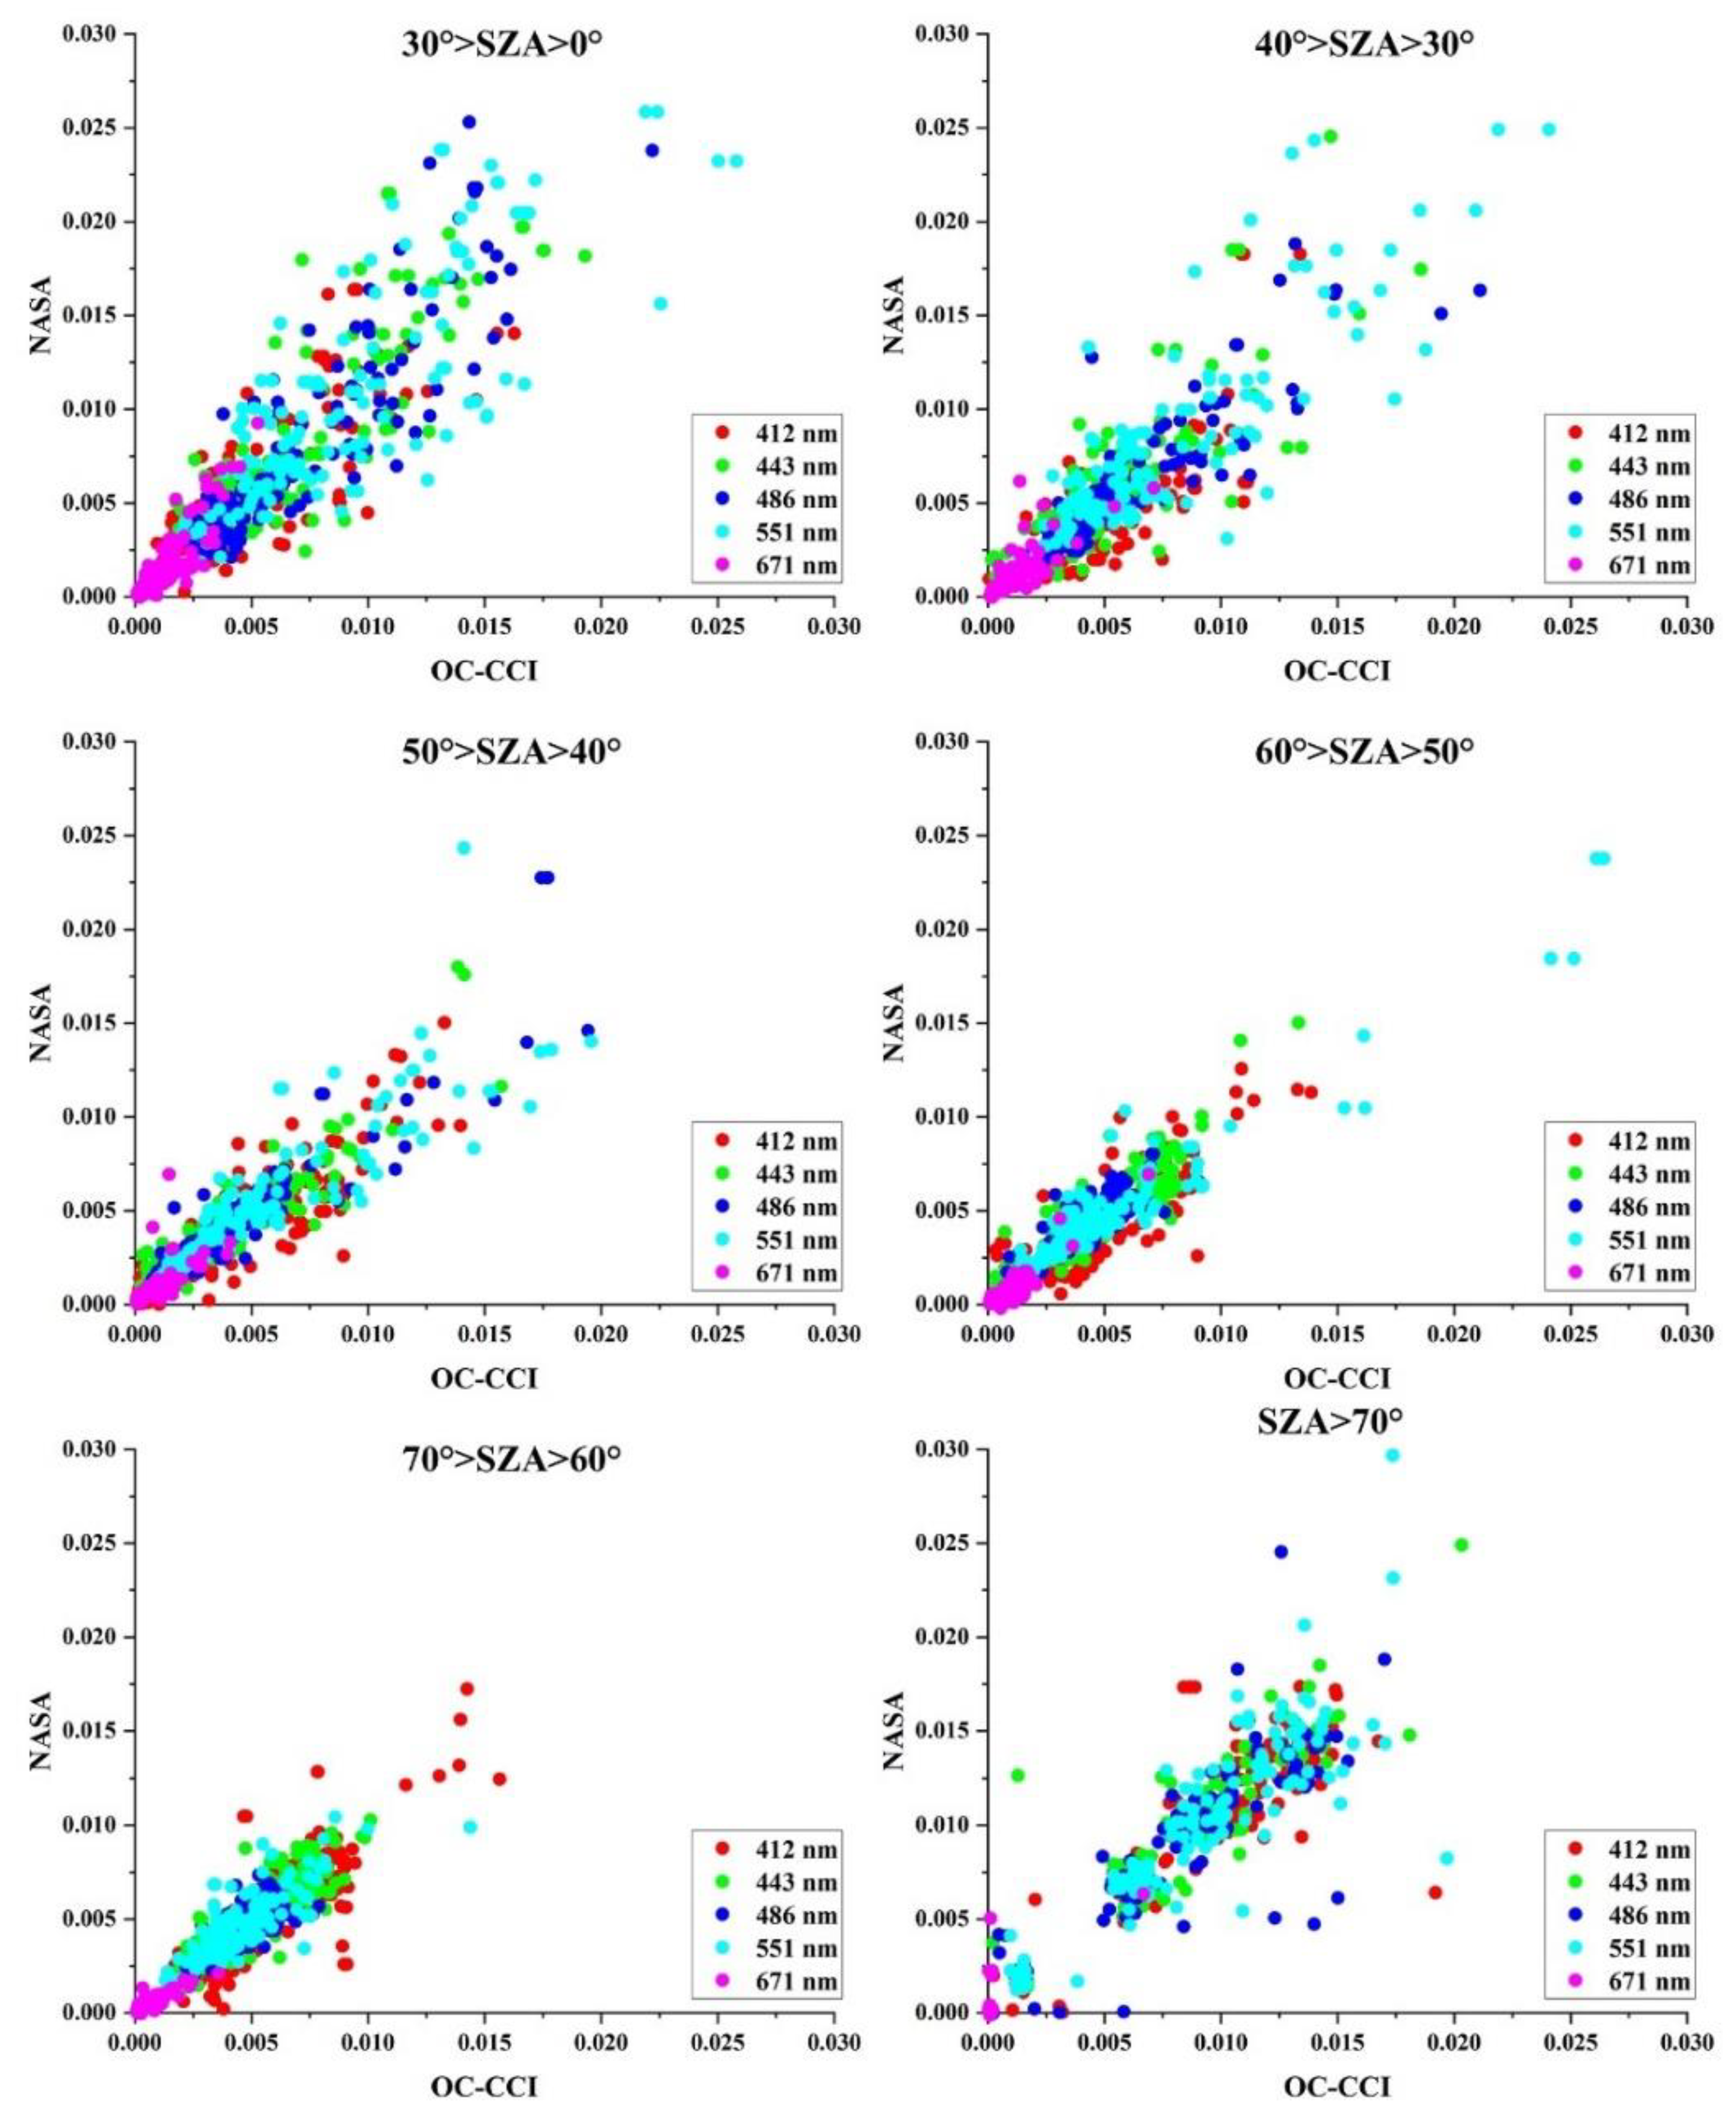
The accuracy of VIIRS Rrs products was assessed for different SZAs and observation zenith angles (OZAs). To better utilize the statistical metrics for evaluating the VIIRS Rrs products at different SZAs, we standardized the data size. For a SZA range of 40° to 50°, the actual matched data size was 1644, but we randomly selected 790 data to match with the minimum available data size in the SZA range of >70°.
Figure 6 presents the evaluation results, where the data points are notably scattered for higher SZAs (> 70°) and well confined to the 1:1 line under typical SZAs. The statistical metrices clearly indicate that the errors and deviations are small for normal/smaller SZAs and increase significantly for larger SZAs [
19,
20].
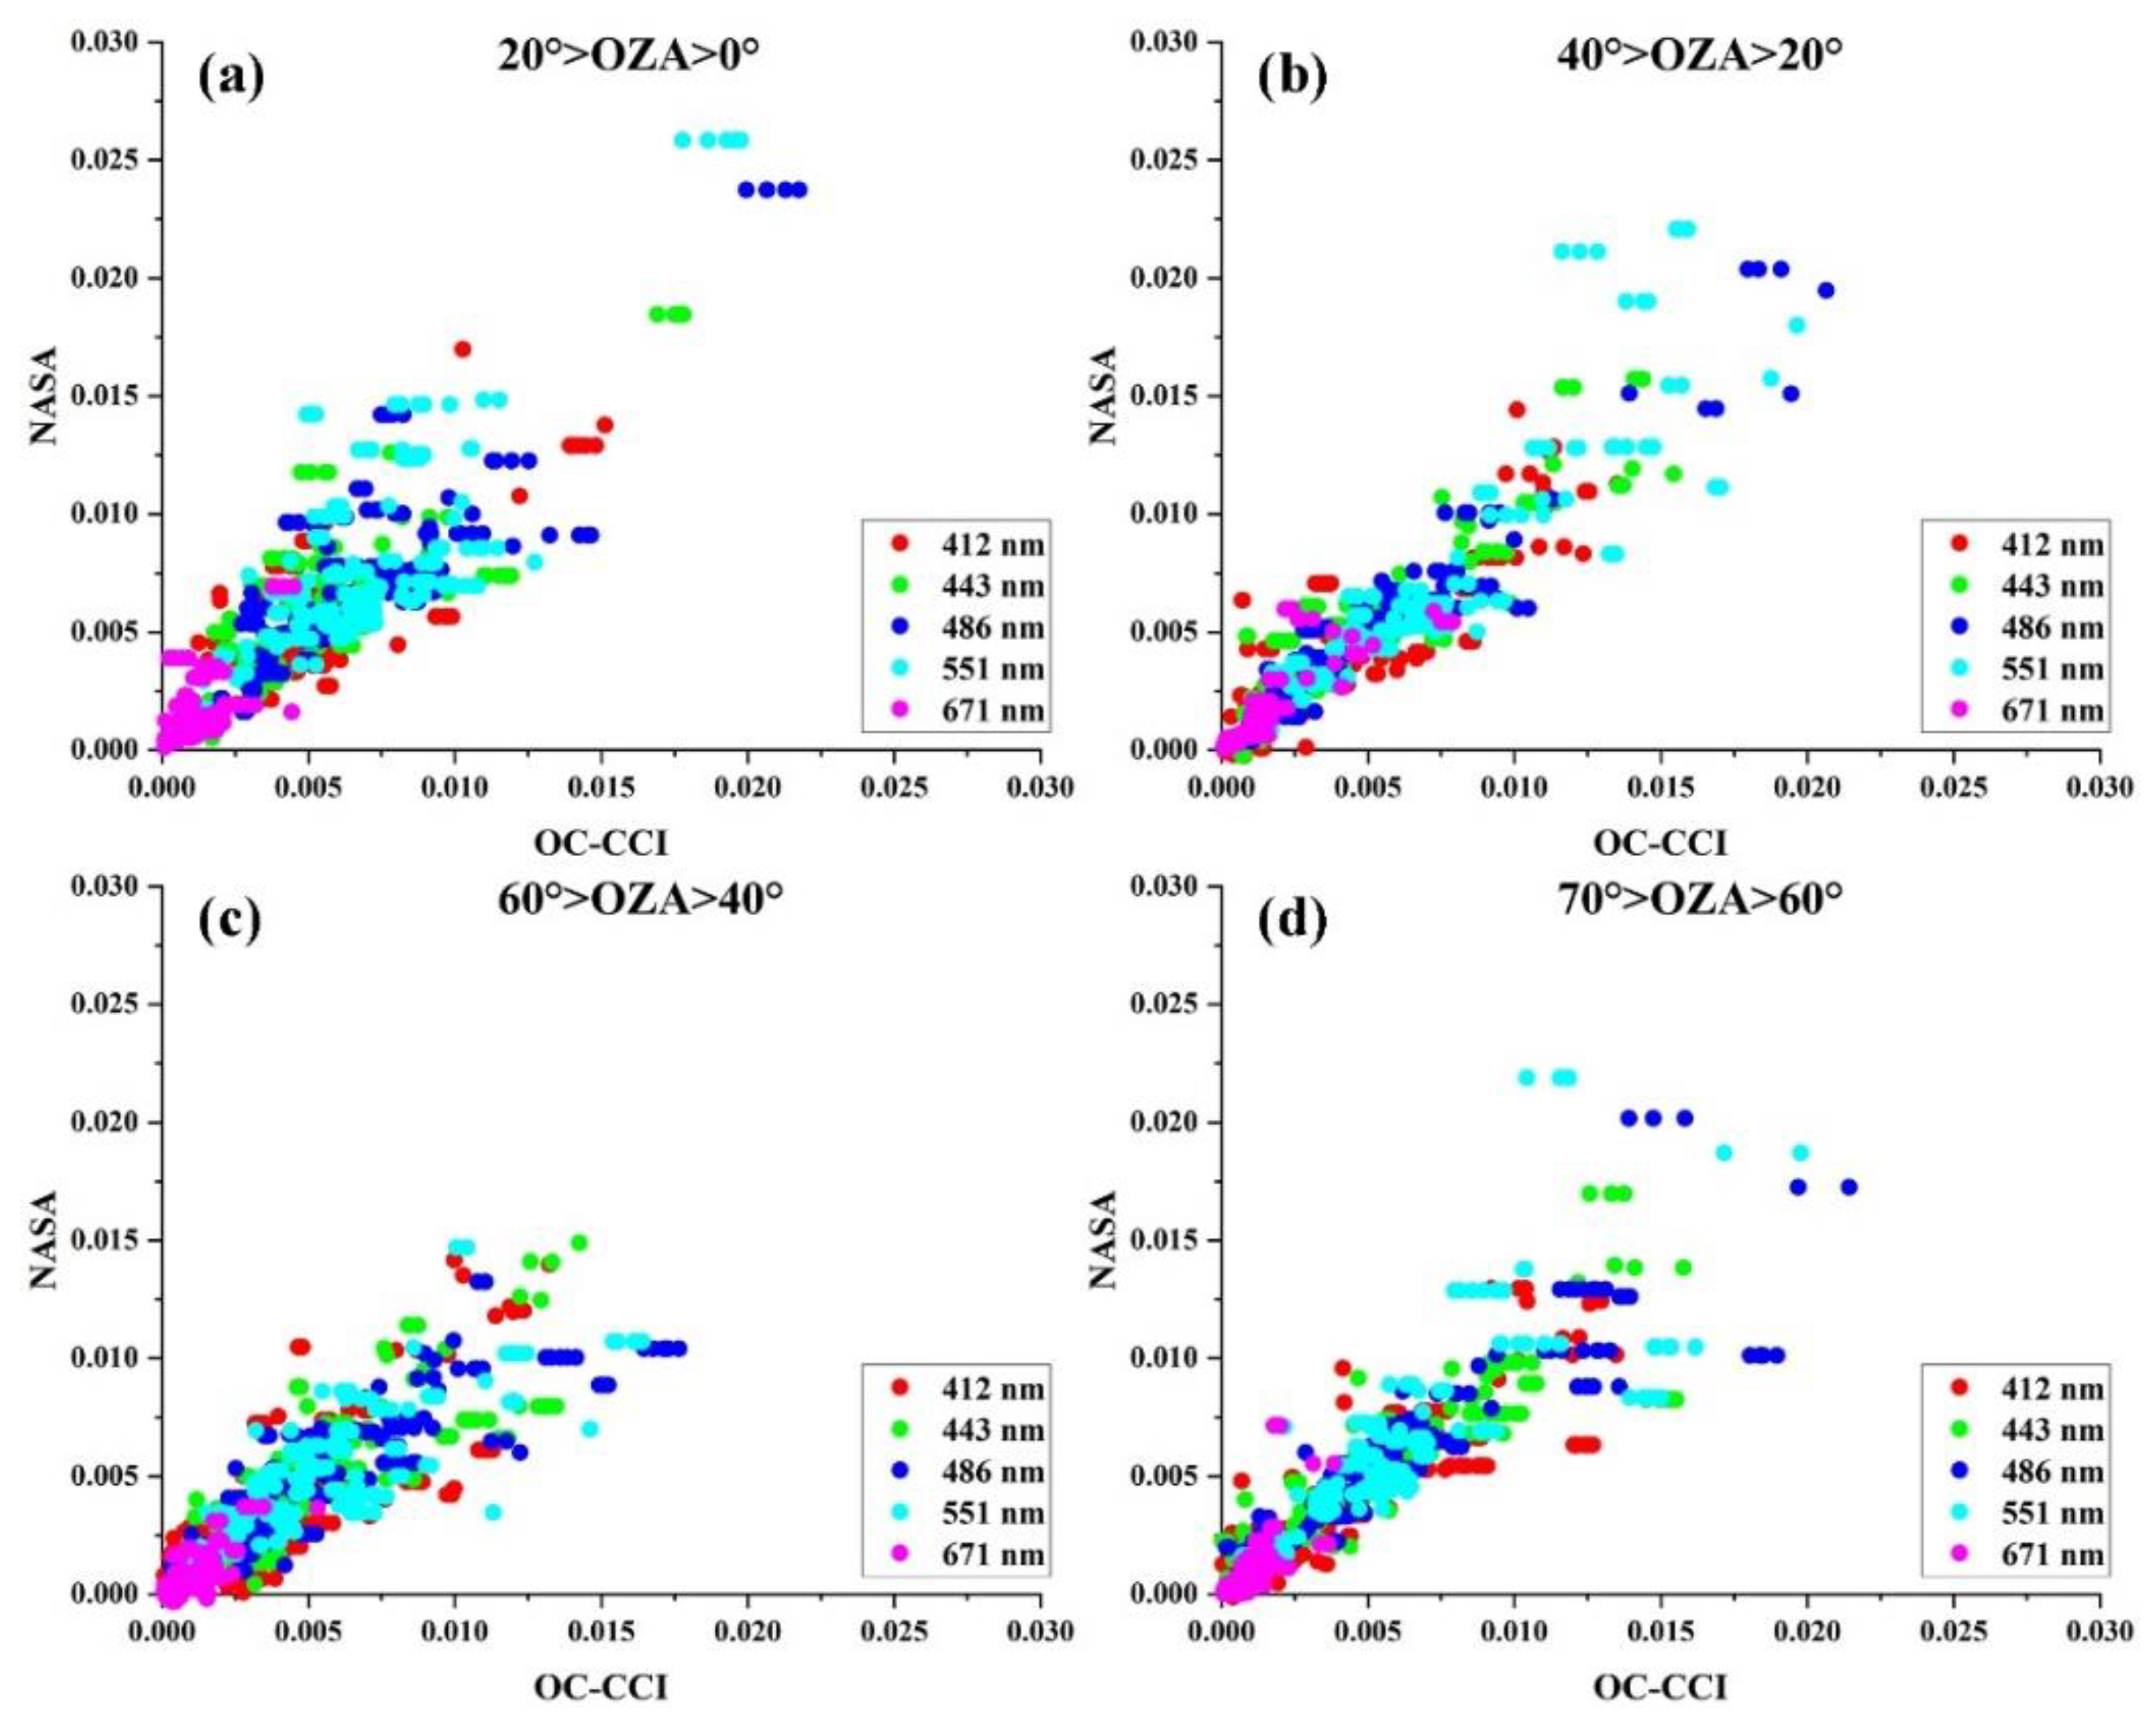
Figure 7 and
Table 4 present the evaluation results for VIIRS Rrs products for different OZAs. Consistent with our earlier observations, the Rrs product accuracy noticeably decreases with increasing OZAs [
21,
22].
Figure 6.
Evaluation of the VIIRS Rrs products using OC-CCI data under different SZAs.
Figure 6.
Evaluation of the VIIRS Rrs products using OC-CCI data under different SZAs.
Table 3.
Statistical results for the VIIRS Rrs products versus OC-CCI Rrs data under different SZAs.
Table 3.
Statistical results for the VIIRS Rrs products versus OC-CCI Rrs data under different SZAs.
| SZA |
N |
R2
|
RMSD (sr-1) |
APD (%) |
RPD (%) |
|
30 o>SZA>0o
|
790 |
0.795 |
0.0026 |
34.96 |
-17.51 |
|
40 o>SZA>30o
|
790 |
0.771 |
0.0019 |
33.84 |
-12.39 |
|
50 o>SZA>40o
|
790 |
0.836 |
0.0012 |
29.27 |
-6.26 |
|
60 o>SZA>50o
|
790 |
0.873 |
0.0012 |
23.07 |
-1.67 |
|
70 o>SZA>60o
|
790 |
0.830 |
0.0014 |
33.99 |
-14.07 |
|
SZA>70 o
|
790 |
0.876 |
0.0020 |
48.69 |
-38.59 |
Figure 7.
Evaluation of the VIIRS Rrs products using OC-CCI data under different OZAs.
Figure 7.
Evaluation of the VIIRS Rrs products using OC-CCI data under different OZAs.
Table 4.
Statistical results of the VIIRS Rrs products versus OC-CCI Rrs data under different OZAs.
Table 4.
Statistical results of the VIIRS Rrs products versus OC-CCI Rrs data under different OZAs.
| OZA |
N |
R2
|
RMSD (sr-1) |
APD (%) |
RPD (%) |
|
20 o>OZA>0o
|
970 |
0.732 |
0.0019 |
38.48 |
-19.45 |
|
40 o>OZA>20o
|
970 |
0.843 |
0.0015 |
34.18 |
-5.39 |
|
60 o>OZA>40o
|
970 |
0.717 |
0.0018 |
38.85 |
-3.75 |
|
70 o>OZA>60o
|
970 |
0.790 |
0.0018 |
43.42 |
-21.29 |
4. Discussion
4.1. Overall performance assessment and annual variation
Comparison of our results with previous work revealed a discrepancy in the accuracy of VIIRS products. This difference may stem from significant variations in the number of data used for accuracy assessment. In this study, we utilized a substantial amount of data of approximately 8312 matched pairs, whereas the previous study had only a few tens of matched data. Moreover, our analysis utilized data from both fixed platforms (AERONET-OC) and cruise measurements in contrast to the limited data (only from fixed platforms) used in earlier studies. Our results demonstrate that the accuracy of the Rrs(486) is higher than that of the previous studies, with an APD of 17.9% (compared to 19% by Barnes et al. (2019) and 20.1% by Hlaing et al. (2013)). However, the Rrs products at other bands have a relatively lower accuracy (for instance, APD(551 nm) is 26.3% compared to 21% reported by Barnes et al. (2019), 9.4% by Hlaing et al. (2013), and 10.6% by Ahmed et al. (2014)) [
23]. The near-ultraviolet (412 nm) and near-infrared (671 nm) bands exhibit higher APD values. The error in near-ultraviolet band is attributed to the long-standing bias with the VIIRS measurements and that in near-infrared band is influenced by extremely low values of Rrs data. Overall, our analysis showed the RPD values of all bands within 20%, which indicate that the NASA's multiple calibration efforts (in the years 2012, 2013, 2014, 2018, and 2022) have effectively minimized the systematic biases with the VIIRS products. The observed high APD values for each band measurements emphasize the necessity for improving the atmospheric correction algorithm for retrieving more accurate Rrs values from VIIRS data. As for the annual variations, the APD values are consistently below 17% during the period from 2012 to 2016 (except for 2013) and remained around 20% for the period from 2017 to 2021. Similarly, the R
2 value consistently exceeded 0.82 over the years from 2012 to 2016 (except for 2015), and it declined to below 0.78 over the years from 2017 to 2021. This suggests a gradual decline in the accuracy of VIIRS products due to the prolonged operation over the years.
Table 5.
Summary of the VIIRS product validation results.
Table 5.
Summary of the VIIRS product validation results.
| Citation |
N |
412 nm |
443 nm |
486 nm |
551 nm |
671 nm |
| Ahmed et al. (2013) |
29 |
39.4% |
20.8% |
12.6% |
10.6% |
18.2% |
| Hlaing et al. (2013) |
16 |
54.8% |
23.4% |
20.1% |
9.4% |
23.9% |
| Barnes et al. (2019) |
55 |
27.0% |
23.0% |
19.0% |
21.0% |
37.0% |
4.2. Impact of observation geometry
From the analysis of VIIRS Rrs products under varying SZAs, it is evident that the product accuracy is strongly dependent upon solar geometry. For SZAs > 70°, the matchup pairs are more spread out from the 1:1 line. The extent of data distribution spread is more effectively gauged by higher APD and RPD values. APD rises from 29.27% at SZA 40°-50° to 48.69% at SZA > 70°, depicting increasing deviations. Simultaneously, RPD substantially decreases from -6.26% to -38.59% under these conditions, underscoring the diminishing accuracy of VIIRS Rrs products at larger SZAs. To process the data with larger SZAs requires a novel atmospheric correction that will improve the accuracy of Rrs retrievals from VIIRS data. Further, our analysis revealed similar trends in the VIIRS Rrs product accuracy at larger OZAs. The APD reduces from 43.42% at OZA~ 60°-70° to 34.18% at OZA~20°-40° with a difference of 27%. These results indicate a strongly influence of both solar and observational geometries on the VIIRS Rrs product accuracy.
Under high SZAs and OZAs, the accuracy reduction in satellite Rrs retrievals can be attributed to several factors. In such conditions, the solar energy is substantially weak, leading to a reduced illumination on the ocean surface. At larger SZAs, the optical pathlength of sunlight is much longer through the atmosphere meaning that the light intensity decreases and Rayleigh becomes more effective at removing the longer (in addition to shorter) wavelengths and dust particles from the lower atmosphere play a crucial role in attenuating solar irradiance and hence determining aerosol scattering and absorption processes. The bidirectional reflectance factor of larger SZAs and OZAs is more amplified. Additionally, there is a pronounced effect of Earth's curvature on the TOA radiance. As a consequence, upwelling radiance from the water body decreases substantially and that induce higher biases on remote sensing reflectance retrieved by a conventional atmospheric correction algorithm (Li et al. 2019) [
24,
25].
5. Conclusions
The evaluation and analysis of the 10-year VIIRS Rrs products have demonstrated a high level of accuracy across various water types, despite the system being operational beyond its design lifetime of 5 to 7 years. The higher performance of VIIRS is achieved because of the NASA’s on-orbit calibration/characterization activities and regular lunar observations related to wavelength-dependent gain degradation in different bands. However, our study on evaluating the long-term VIIRS Rrs products have showed a declining trend in the product accuracy. For example, the product accuracy in specific spectral bands, such as near-ultraviolet and near-infrared bands, is considerably low with a long-term bias at the near-ultraviolet band. Moreover, there is a declining trend in the annual precision of VIIRS Rrs products, particularly in coastal or eutrophic waters, where the spread of the matchup pairs is more pronounced over the recent years. This declined accuracy indicates the need for continuous monitoring of sensor performance and a novel atmospheric correction algorithm to specifically deal with satellite records at larger SZAs and OZAs. Our analysis showed a declining product accuracy at higher SZAs and OZAs as better depicted by the spread of a data distribution. A novel atmospheric correction algorithm is needed to process these data with higher SZAs and OZAs. In conclusion, the VIIRS sensor has proven capable working as a successor to MODIS and providing crucial earth science data products beyond its design lifetime. The high products accuracy in most spectral bands shows the success of NASA's calibration efforts. Nevertheless, our study emphasizes the importance of continuous monitoring, further efforts on improving the atmospheric correction algorithms, and careful consideration of different environmental and geometry conditions (such as SZAs and water types) to ensure the long-term data quality and integrity of VIIRS products.
Author Contributions
Conceptualization, Hao Li; Data curation, Hao Li and Xianqiang He;; Funding acquisition, Xianqiang He; Methodology, Yan Bai; Project administration, Difeng Wang; Resources, Palanisamy Shanmugam; Software, Palanisamy Shanmugam, Difeng Wang and Teng Li; Supervision, Fang Gong.
Funding
This research was funded by the National Natural Science Foundation of China (Grants #41825014, #42206183, #U22B2012, #42176177 and #42176182), the Zhejiang Provincial Natural Science Foundation of China (Grant #LDT23D06021D06), the "Pioneer" R&D Program of Zhejiang (2023C03011), and the East China Sea Youth Talent Sailing Fund (DH-2023QH0002).
Data Availability Statement
Not applicable.
Acknowledgments
We are grateful to the authors of the cited article (Valente et al., 2022) for providing their global bio-optical in situ data, and to the NASA team for granting access to the VIIRS data. These valuable contributions have greatly enhanced our research work on the VIIRS performance assessments. We thank the satellite ground station, satellite data processing & sharing center, and marine satellite data online analysis platform (SatCO2) of SOED/SIO/MNR for assistance with data collection and processing.
Conflicts of Interest
The authors declare no conflict of interest.
References
- Meister, G.; Franz, B.A. Corrections to the MODIS Aqua calibration derived from MODIS Aqua ocean color products. IEEE Transactions on Geoscience and Remote Sensing. 2014, 52, 6534–6541. [Google Scholar] [CrossRef]
- Cao, C.; Xiong, J.; Blonski, S.; Liu, Q.; Uprety, S.; Shao, X.; Weng, F. Suomi NPP VIIRS sensor data record verification, validation, and long-term performance monitoring. Journal of Geophysical Research: Atmospheres. 2013, 118, 11–664. [Google Scholar] [CrossRef]
- Uprety, S.; Cao, C. Suomi NPP VIIRS reflective solar band on-orbit radiometric stability and accuracy assessment using desert and Antarctica Dome C sites. Remote Sensing of Environment. 2015, 166, 106–115. [Google Scholar] [CrossRef]
- Hlaing, S.; Harmel, T.; Gilerson, A.; Foster, R.; Weidemann, A.; Arnone, R.; Ahmed, S. Evaluation of the VIIRS ocean color monitoring performance in coastal regions. Remote Sensing of Environment. 2013, 139, 398–414. [Google Scholar] [CrossRef]
- Hlaing, S.; Gilerson, A.; Foster, R.; Wang, M.; Arnone, R.; Ahmed, S. Radiometric calibration of ocean color satellite sensors using AERONET-OC data. Optics Express. 2014, 22, 23385–23401. [Google Scholar] [CrossRef]
- Menghua, Wang.; Wei, Shi.; Lide, Jiang. Technique for monitoring performance of VIIRS reflective solar bands for ocean color data processing. Optics Express. 2015, 18, 18,11–15. [Google Scholar]
- Vandermeulen, R.A.; Arnone, R.; Ladner, S.; Martinolich, P. Enhanced satellite remote sensing of coastal waters using spatially improved bio-optical products from SNPP–VIIRS. Remote Sensing of Environment. 2015, 165, 53–63. [Google Scholar] [CrossRef]
- Brando, V.E.; Lovell, J.L.; King, E.A.; Boadle, D.; Scott, R.; Schroeder, T. The potential of autonomous ship-borne hyperspectral radiometers for the validation of ocean color radiometry data. Remote Sensing. 2016, 8, 150. [Google Scholar] [CrossRef]
- Barnes, B.B.; Cannizzaro, J.P.; English, D.C.; Hu, C. Validation of VIIRS and MODIS reflectance data in coastal and oceanic waters: An assessment of methods. Remote Sensing of Environment. 2019, 220, 110–123. [Google Scholar] [CrossRef]
- Valente, A.; Sathyendranath, S.; Brotas, V.; Groom, S.; Grant, M.; Taberner, M.; Zibordi, G. A compilation of global bio-optical in situ data for ocean-colour satellite applications. Earth System Science Data. 2016, 8, 235–252. [Google Scholar] [CrossRef]
- Valente, A.; Sathyendranath, S.; Brotas, V.; Groom, S.; Grant, M.; Taberner, M.; Zibordi, G. A compilation of global bio-optical in situ data for ocean-colour satellite applications–version two. Earth System Science Data. 2019, 11, 1037–1068. [Google Scholar] [CrossRef]
- Valente, A.; Sathyendranath, S.; Brotas, V.; Groom, S.; Grant, M.; Taberner, M.; Zibordi, G. A compilation of global bio-optical in situ data for ocean colour satellite applications–version three. Earth System Science Data. 2022, 14, 5737–5770. [Google Scholar] [CrossRef]
- Morel, A.; Antoine, D.; Gentili, B. Bidirectional reflectance of oceanic waters: accounting for Raman emission and varying particle scattering phase function. Applied Optics. 2002, 41, 6289–6306. [Google Scholar] [CrossRef]
- Mélin, F.; Zibordi, G.; Berthon, J.F. Assessment of satellite ocean color products at a coastal site. Remote Sensing of Environment. 2007, 110, 192–215. [Google Scholar] [CrossRef]
- He, X.; Bai, Y.; Pan, D.; Huang, N.; Dong, X.; Chen, J.; Cui, Q. Using geostationary satellite ocean color data to map the diurnal dynamics of suspended particulate matter in coastal waters. Remote Sensing of Environment. 2013, 133, 225–239. [Google Scholar] [CrossRef]
- He, X.; Bai, Y.; Pan, D.; Tang, J.; Wang, D. Atmospheric correction of satellite ocean color imagery using the ultraviolet wavelength for highly turbid waters. Optics express. 2012, 20, 20754–20770. [Google Scholar] [CrossRef] [PubMed]
- Meister, G.; Franz, B.A.; Kwiatkowska, E.J.; Mcclain, C.R. Corrections to the calibration of modis aqua ocean color bands derived from seawifs data. IEEE Transactions on Geoscience & Remote Sensing. 2011, 50, 310–319. [Google Scholar]
- Delgado, A.L.; Guinder, V.A.; Dogliotti, A.I.; Zapperi, G.; Pratolongo, P.D. Validation of modis-aqua bio-optical algorithms for phytoplankton absorption coefficient measurement in optically complex waters of EL RINCON(Argentina). Continental Shelf Research. 2018, 173, 73–86. [Google Scholar] [CrossRef]
- Shanmugam, P. CAAS: an atmospheric correction algorithm for the remote sensing of complex waters. Annales Geophysicae. 2012, 30, 203–220. [Google Scholar] [CrossRef]
- Li, H.; He, X.; Bai, Y.; Shanmugam, P.; Park, Y.J.; Liu, J.; Huang, H. Atmospheric correction of geostationary satellite ocean color data under high solar zenith angles in open oceans. Remote Sensing of Environment. 2020, 249, 112022. [Google Scholar] [CrossRef]
- Chen, J.; Quan, W.T.; Cui, T.W.; Song, Q.J.; Lin, C.S. Remote sensing of absorption and scattering coefficient using neural network model: development, validation, and comparison. Remote Sensing of Environment. 2014, 149, 213–226. [Google Scholar] [CrossRef]
- Chen, J.; Cui, T.W.; Joji, I.; Lin, C.S. A neural network model for remote sensing of diffuse attenuation coefficient in global oceanic waters. Remote Sensing of Environment. 2014, 148, 168–177. [Google Scholar] [CrossRef]
- Ahmed, S.; Gilerson, A.; Hlaing, S.; Ioannou, I.; Wang, M.; Weidemann, A.; Arnone, R.A. Evaluation of VIIRS ocean color data using measurements from the AERONET-OC sites. In Ocean Sensing and Monitoring. 2013, 8724, 198–212. [Google Scholar]
- Li, H.; He, X.; Shanmugam, P.; Bai, Y.; Wang, D.; Huang, H.; Gong, F. Radiometric sensitivity and signal detectability of ocean color satellite sensor under high solar zenith angles. IEEE Transactions on Geoscience and Remote Sensing. 2019, 57, 8492–8505. [Google Scholar] [CrossRef]
- Li, H.; He, X.; Bai, Y.; Gong, F.; Wang, D.; Li, T. Restoration of Wintertime Ocean Color Re-mote Sensing Products for the High-Latitude Oceans of the Southern Hemisphere. IEEE Transactions on Geoscience and Remote Sensing. 2022, 60, 1–12. [Google Scholar]
|
Disclaimer/Publisher’s Note: The statements, opinions and data contained in all publications are solely those of the individual author(s) and contributor(s) and not of MDPI and/or the editor(s). MDPI and/or the editor(s) disclaim responsibility for any injury to people or property resulting from any ideas, methods, instructions or products referred to in the content. |
© 2023 by the authors. Licensee MDPI, Basel, Switzerland. This article is an open access article distributed under the terms and conditions of the Creative Commons Attribution (CC BY) license (http://creativecommons.org/licenses/by/4.0/).
