Preprint
Article

Cold Atmospheric Plasma Jet Treatment Decreases the Survival and the Expression of Oncogenic miRNAs of Oral Carcinoma Cell

Altmetrics

Downloads

155

Views

74

Comments

0

A peer-reviewed article of this preprint also exists.

Submitted:

12 October 2023

Posted:

13 October 2023

You are already at the latest version

Alerts
Abstract
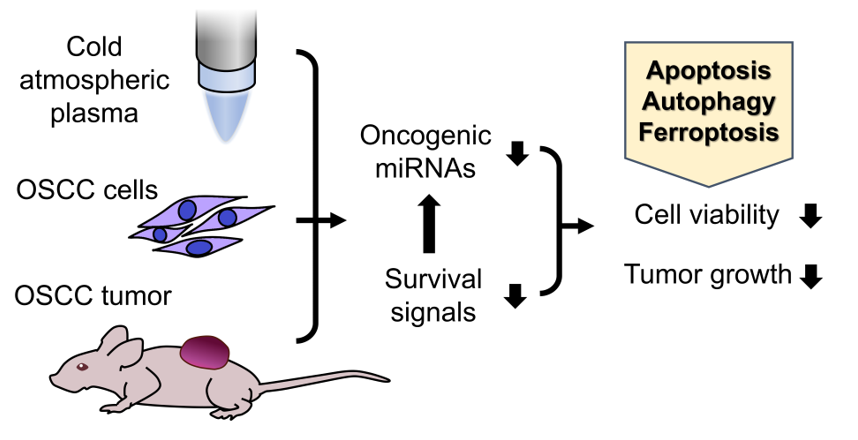
Despite recent advancements, therapies remain ineffective against advanced oral squamous cell carcinoma (OSCC), resulting in unsatisfactory therapeutic outcomes. Cold atmospheric plasma (CAP) offers a promising approach in the treatment of malignant neoplasms. Yet, the exact mechanisms driving CAP-induced cancer cell death are not fully understood. This study revealed a significant reduction in the viability of OSCC cell lines, inactivation of AKT and ERK, and the downregulation of the miR-21, miR-31, miR-134, miR-146a and miR-211 expression followed the CAP treatment. Pretreatment with ZVAD, 3-MA, and Fer-1 synergistically reduced CAP-induced cell death, indicating a combined induction of variable death pathways by CAP. Activation of AKT and ERK, alongside combined treatments using death inhibitors and miRNA mimics, counteracted the cell mortality associated with CAP. CAP-induced downregulation of miR-21, miR-31, miR-187 and miR-211 expression was rescued by AKT and ERK activation. Additionally, CAP treatments notably inhibited the growth of SAS cell xenografts on nude mice. The reduced expression of oncogenic miRNAs in vivo aligned with in vitro findings. In conclusion, our study indicates that CAP jet treatment diminishes OSCC cell viability by abrogating survival signals and oncogenic miRNA expression.
Keywords: 
Subject: Biology and Life Sciences  -   Other

1. Introduction

Plasma is an ionized gas and the fourth state of matter. Cold atmospheric plasma (CAP) is produced by inert gases or air under atmospheric pressure at room temperature. CAP comprises atoms, electrons, ions, molecules, and reactive oxygen and nitrogen species (RONS) [1]. At elevated doses, RONS intensify oxidative stress, induce DNA damage, increase cytotoxicity, and promote tissue pathogenesis [2]. CAP's biological effects have found medical applications in enhancing wound healing, disinfection, skin disease control, and aiding cancer therapies [3,4,5]. The anti-tumor efficacies of CAP in enriching cell cycle arrest, induction of apoptosis, enhancing tumor chemosensitivity, eliminating cancer stemness and modulating tumor microenvironment have been shown in multiple malignancies [1,6,7,8]. Distinct CAP responses between neoplastic cells and their normal counterparts highlight the potential utility of CAP in cancer treatment [9,10,11,12]. CAP reduces the viability of cancer cells by impairing multiple RONS-dependent or independent signals [4,12,13,14,15,16,17,18,19,20]. Apart from apoptosis, a diverse profile of programmed death including ferroptosis, autophagy, pyroptosis and necroptosis could also be evoked by CAP in different types of cells [12,20,21,22,23,24,25].
Head and neck squamous cell carcinomas (HNSCCs), which include oral SCCs (OSCCs), rank as the sixth most prevalent malignancy globally [26,27]. Despite the advances in mechanistic understanding and therapeutic approach, further effective HNSCC treatments are required for improving patient’s survival. The promising in vitro or in vivo effects of CAP in abrogating HNSCC or OSCC have been explored [5,6,9,14,15,16,17,25,28,29]. The combined regimens using CAP and chemotherapeutic reagents result in remarkable HNSCC inhibition [14,30]. As more superficially located, oral cavity tissue is highly vulnerable for non-invasive CAP assessment [31]. While initial human trials on advanced OSCC have shown tumor flattening or ulcer rim contraction in areas treated with CAP jet [32], a broader CAP trial is needed to establish its clinical efficacy.
miRNAs play pivotal roles in the neoplastic process including the pathogenesis of HNSCC or OSCC. The dysregulation of oncogenic miRNAs such as miR-21, miR-31, miR-134, miR-146a, miR-187 and miR-211, and the suppressor miR-125b together with the functional disruption of their targets in OSCC have been identified in previous studies[33,34,35,36,37,38,39,40,41]. Some of these miRNAs are also ROS modulators or signal effectors [33,39,40]. While CAP irradiation modifies miRNA profiles in myeloid cancer [4], its role in modulating miRNA expression in OSCC is yet to be fully understood.
The phosphoinositide 3-kinases (PI3K)/AKT/mTOR signaling complex orchestrates diverse regulatory functions in cell survival, disease pathogenesis, and neoplastic progression [42], Remarkably, this crucial axis is disrupted in 90% of HNSCC cases [26]. CAP induces AKT degradation by activating ubiquitination-proteasome system, which leads to AKT inactivation and apoptosis in HNSCC [16]. Extracellular signal-regulated kinase 1/2 (ERK1/2) also plays central roles in anti-apoptotic, proliferation and drug resistance of HNSCC [42,43]. CAP seems to activate pro-apoptotic p38 MAPK and JNK, in different cell types including HNSCC cells, albeit with no effects on ERK [13,15,18]. CAP also deactivates NF-κB and reduces the associated phenotypes in some OSCC cells [14]. This study delves into the altered expression of vital miRNAs, particularly the recognized oncogenic miRNAs in OSCC, post-CAP treatment in OSCC cell lines. The signal elements affecting tumor survival are also investigated. We identified the downregulation of a panel of miRNAs secondary to the inactivation of AKT/ERK signals mediated by argon CAP treatment. CAP irradiation also inhibits the xenografic growth of OSCC in murine model. Our research provides new molecular perspectives on the CAP mechanisms that inhibit OSCC.

2. Results

2.1. CAP Induces Apoptosis, Autophagy and Ferroptosis of OSCC Cell Lines

A We designed and assembled the CAP jet device in our laboratory [7]. After optimizing the CAP jet system established in our laboratory (Figure 1A), we analyzed the RONS emission in CAP. The 309 nm, 300 - 400 nm, and 700 – 800 nm peaks of optical emission spectroscope (OES) spectrum measured from CAP represent the OH radical, RNS, and argon emission, respectively (Figure 1B). The OES spectrum peaks show that our CAP generates the OH radical, nitrite and excited argon. To test the production of soluble ROS/RNS and the stability of the appliance, we analyzed the H2O2, nitrate and nitrite concentration in the CAP-treated PBS during the different time duration of jet irradiation. The H2O2 concentration increased with the CAP treatment time and the four H2O2 concentration curves, which were measured every 10 mins, show no significant difference. This result shows the ROS reproducibility in our CAP treated solution (Figure 1C). The increase of nitrite following 10s – 30s CAP treatments was also consistently notified across all time durations (Figure 1D). The nitrite production following 60s CAP treatment at 40-46 min time duration was slightly lower than earlier time durations. The production of nitrate was not detectable (not shown).
We cultivated normal oral keratinocyte (NOK), and OSCC cell lines SAS and FaDu in Dulbecco’s modified eagle’s medium (DMEM)/ keratinocyte serum-free medium (KSFM) (1:1) for 24 h before treating them with CAP, ranging from 5s to 60s. Treatment with argon for 60s without electricity was the control. One hour after CAP treatment, the culture medium was replaced. The cell viability was measured 24 h later. The results showed a dose-dependent inhibition of the growth of NOK, FaDu and SAS mediated by CAP treatment (Figure 1E). SAS exhibited the highest CAP sensitivity, while NOK exhibited the lowest CAP sensitivity. CAP-induced cell death (10s treatment) was partly mitigated by individually pre-treating with 10 µM apoptosis inhibitor Z-VAD-FMK (Z-VAD), autophagy/PI3K inhibitor 3-Methyladenine (3-MA) and ferroptosis inhibitor ferropstatin-1 (Fer-1) in SAS and FaDu cells (Figure 1F, Lt; 1G Lt, respectively). Pretreatment with 20 µM inhibitors rendered more rescue of CAP-associated cell death in cells (Figure 1F, Rt and 1G Rt). The combined treatment of two inhibitors resulted in more pronounced reversion of cell death than solitary treatment. The combined treatment with 10 µM of all inhibitors restored cell survival till 83 – 92%, while the combined treatment with 20 µM of all inhibitors restored cell viability to around 93% (Figure 1F, 1G). The rescue of cell viability in 10s CAP-treated SAS cells by inhibitors appeared dose-dependent (Figure 1H). In addition, following the 5s – 20s CAP treatment, the viability of SAS cells was slightly rescued by individual inhibitor. The concomitant treatment of three inhibitors resulted in more prominent rescue of cell survival (Figure 1I). Although the concordant induction of apoptosis, autophagy and ferroptosis may underlie the CAP-induced death of OSCC cells, the rescue effects of ferroptosis inhibitor were more potent than the other two inhibitors.

2.2. CAP Downregulated the Expression of Oncogenic miRNAs in OSCC Cells

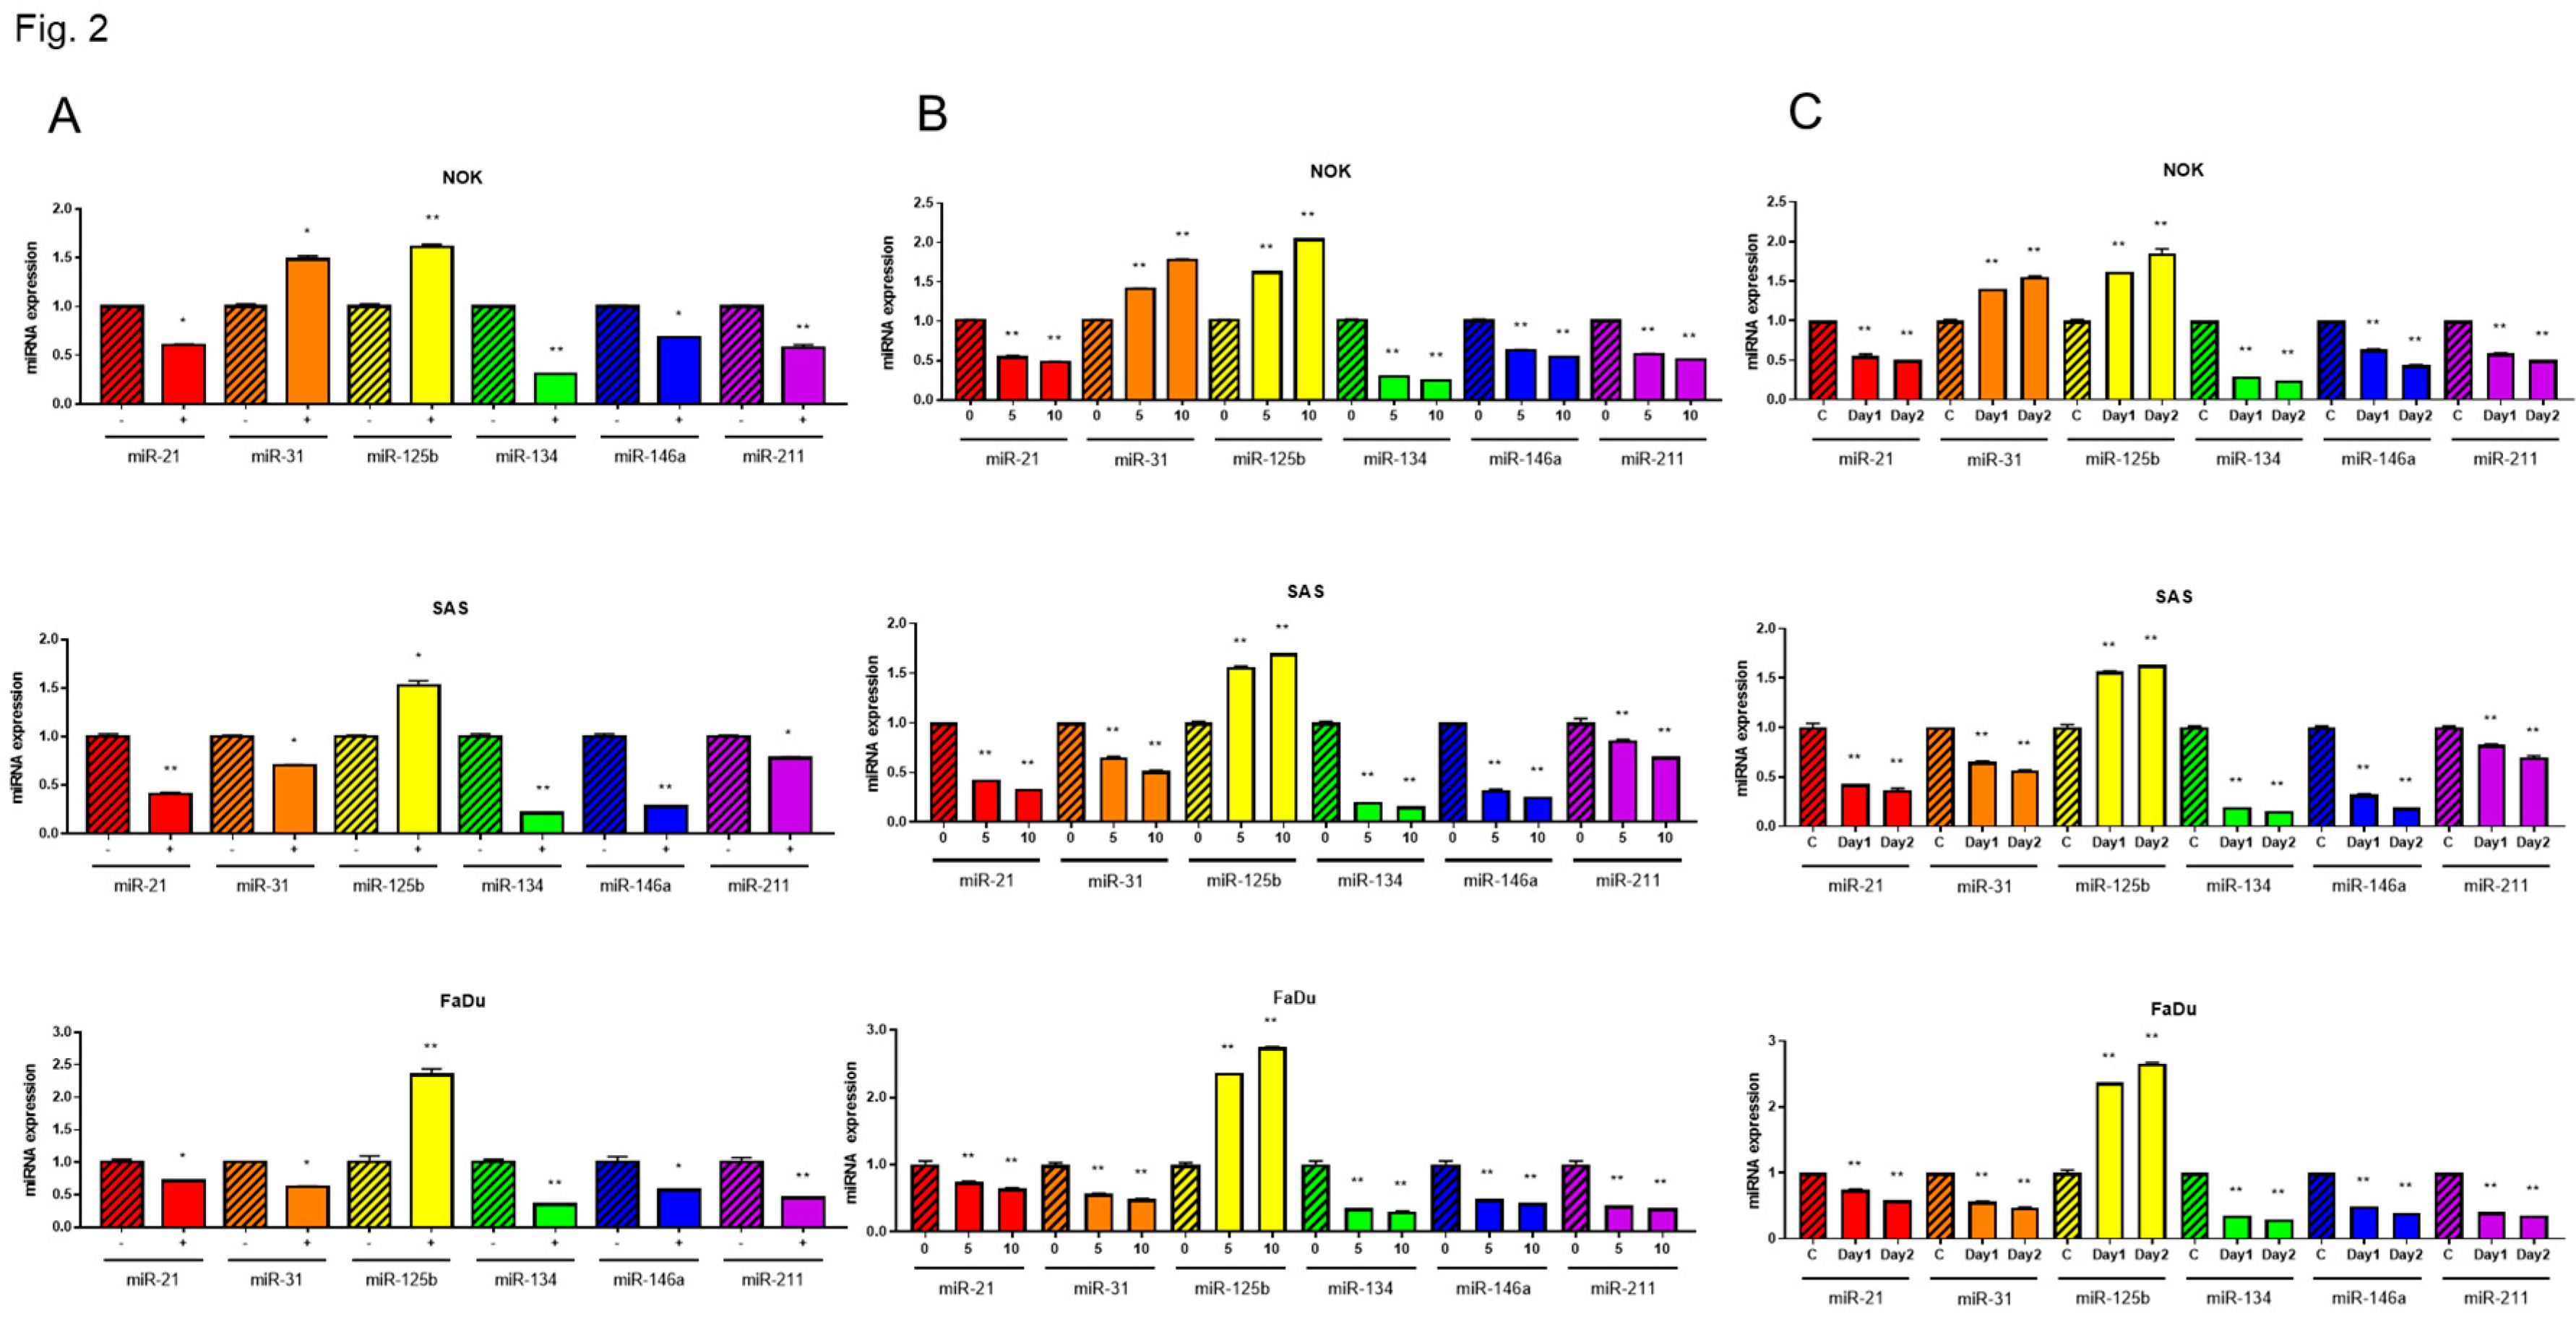
Following a 10s CAP treatment over 24 h, we observed a downregulation in the expression of miR-21, miR-134, miR-146a, and miR-211, while miR-125b expression was upregulated in NOK, SAS, and FaDu cells (Figure 2A). Although miR-31 was downregulated in OSCC cell line following such treatment, it was upregulated in NOK (Figure 2A). Treatment with 5s CAP also resulted in the dysregulation of miRNA with lesser changes in expression level (Figure 2B). The effects of 10s CAP treatment at 24 h also lasted to 48 h (Figure 2C). As the 5s CAP treatment yielded 12.5 µM H2O2 in culture medium, cells were treated with 12.5 µM H2O2 for 1 h, then the medium was changed, the assay at 24 h showed no remarkable change in miRNA expression (Figure S1A - C). The treatment of SAS cell with 12.5 µM H2O2 for 24 h without changing medium resulted in decreased miR-21, miR-125b, miR-134 and miR-211 expression, along with increased miR-146a expression and the absence of change for miR-31 expression in SAS cells (Figure S1D), suggesting that CAP stimuli or products other than H2O2 may be responsible for triggering the disruption in miRNA expression.

2.3. The Downregulation of Oncogenic miRNAs Underlies the CAP-Induced Decrease in Cell Survival

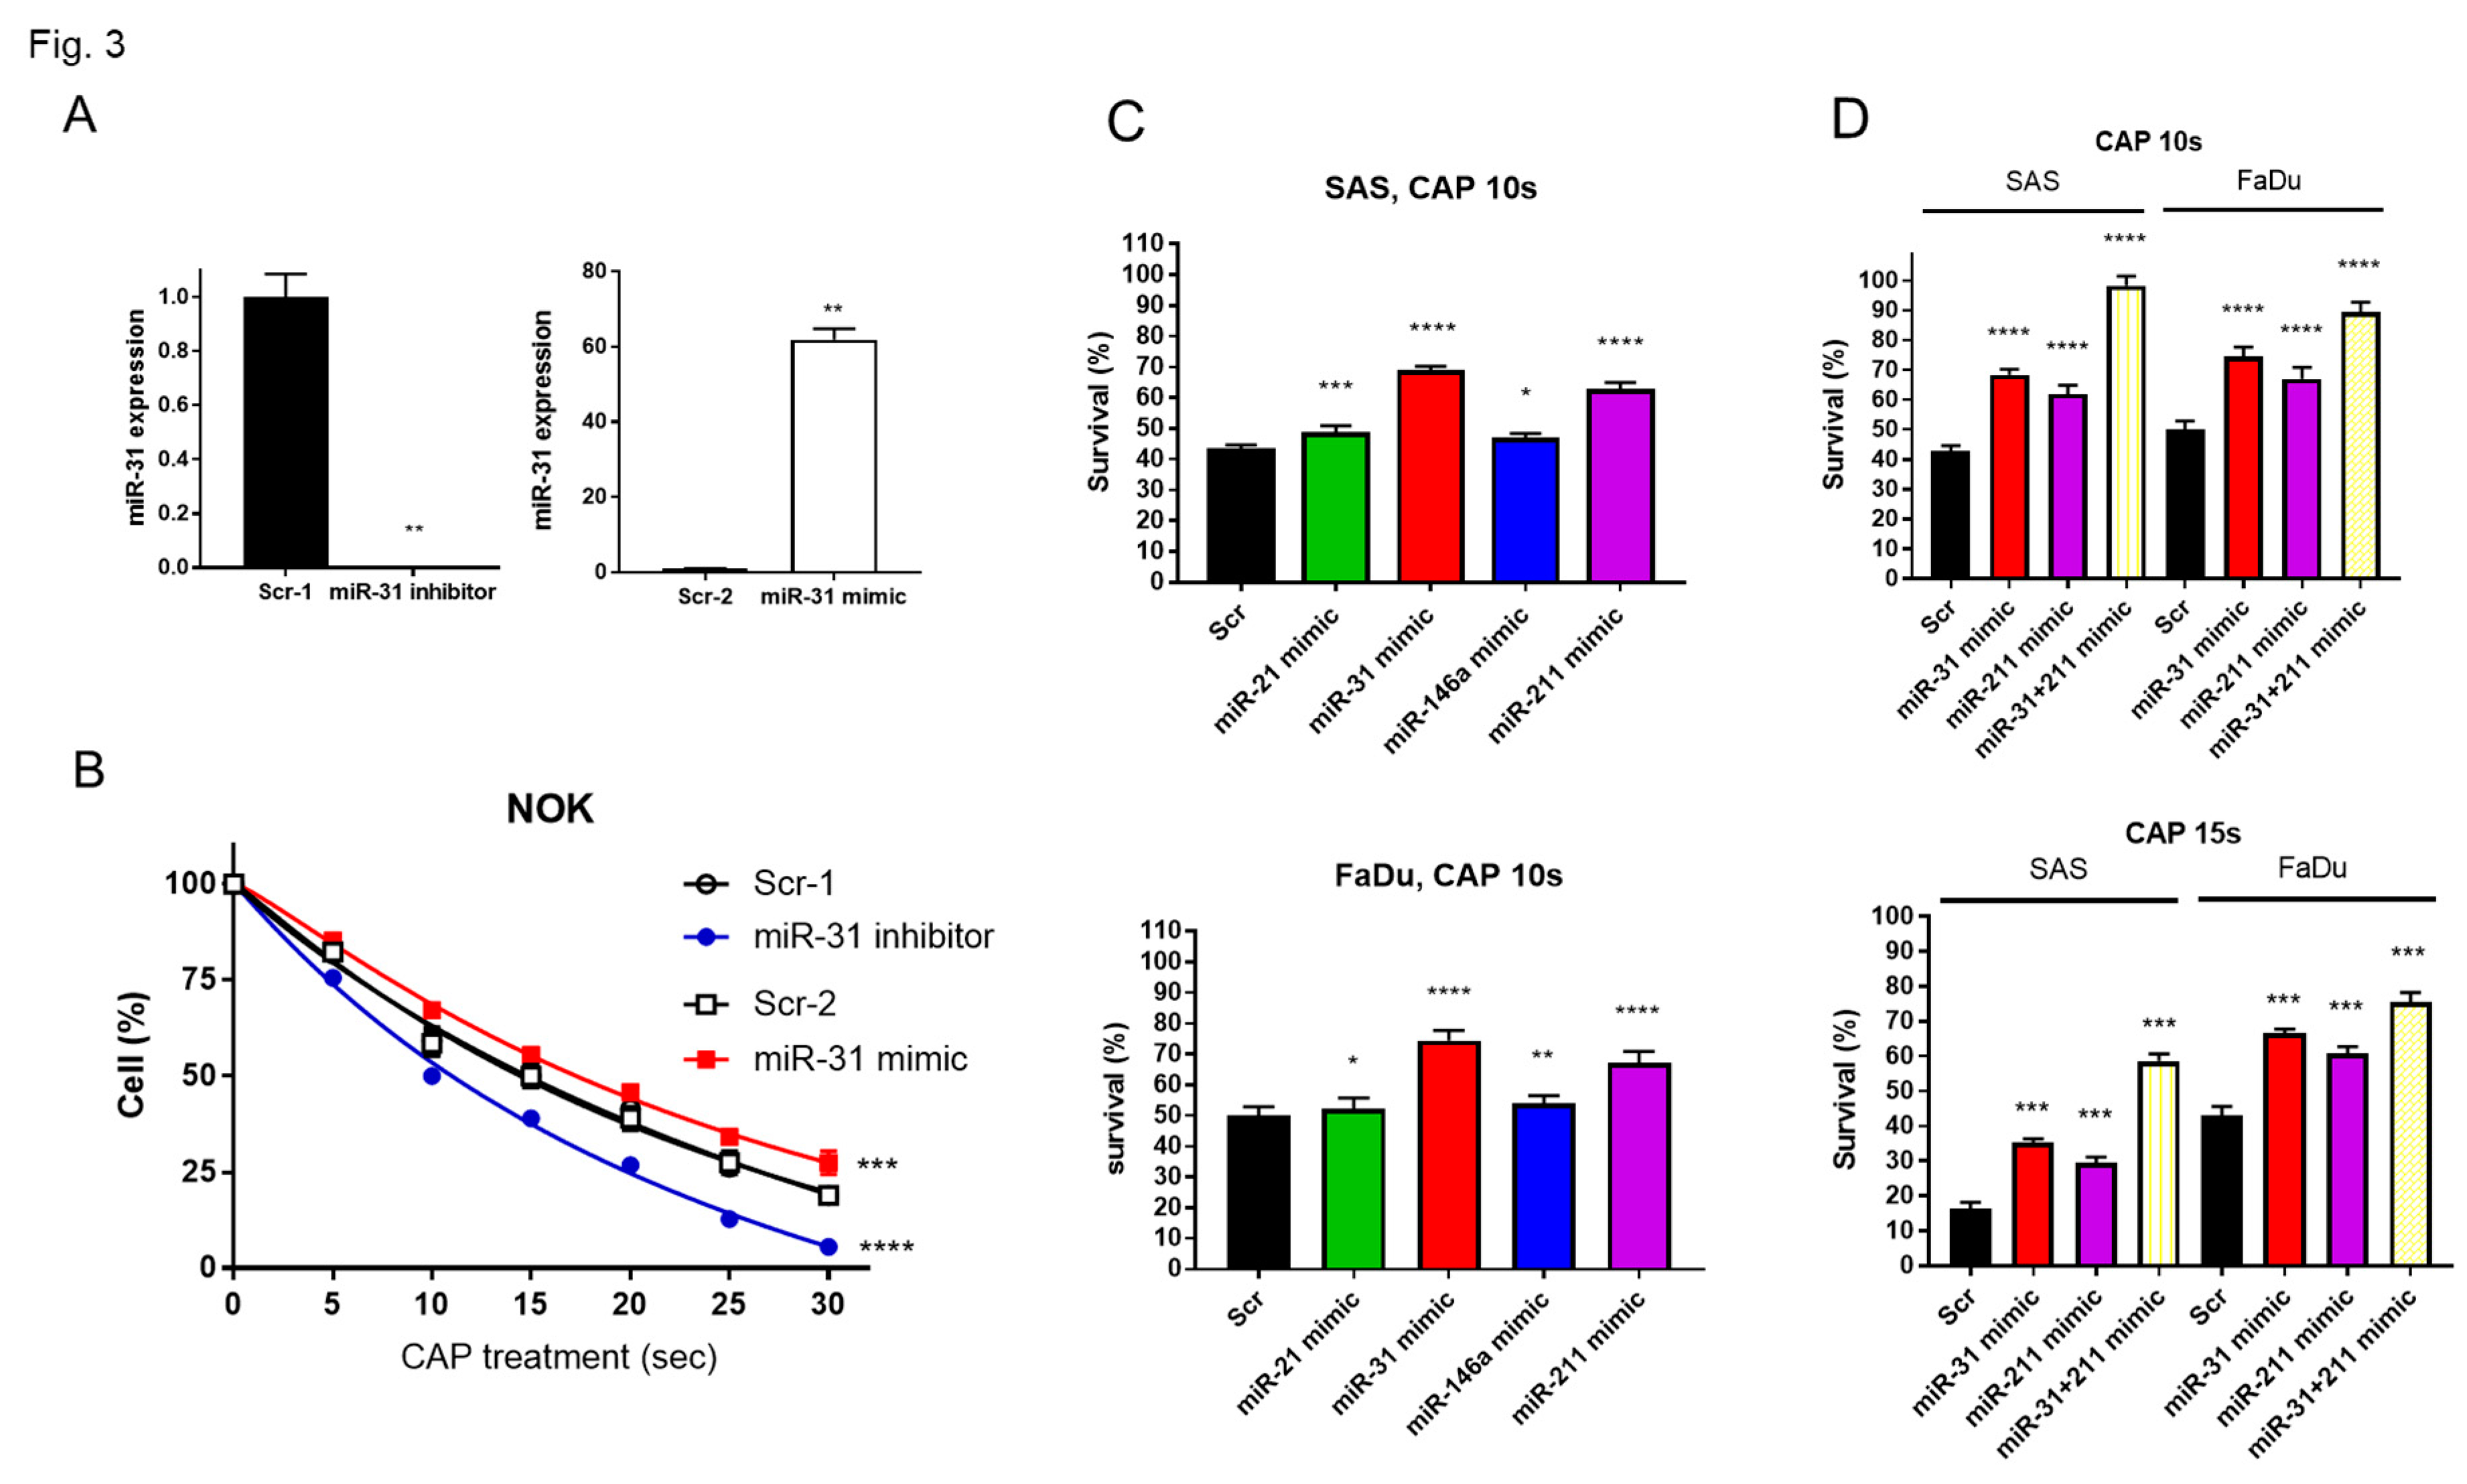
To investigate whether the alteration in miR-31 expression influences the varied CAP responses across cells, we either downregulated or upregulated miR-31 expression using inhibitor or mimic, respectively (Figure 3A). As the higher miR-31 expression levels were associated with the better survival of NOK (Figure 3B), the upregulation of miR-31 following CAP treatment in NOK may underlie its relatively lower lethality in response to CAP treatment.
With the pretreatment of miRNA mimics to upregulate miR-21, miR-31, miR-146a and miR-211, the survival of OSCC cells was higher than control cells after 10s CAP treatment (Figure 3C). Since the treatment with miR-31 mimic and miR-211 mimic rendered higher cell survival than other mimics, we tested the efficacy of co-treatment. The co-treatment of miR-31 mimic and miR-211 mimic restored the survival of OSCC cells after 10s and 15s CAP treatments for up to 98% and 76%, respectively (Figure 3D). The CAP-modulated miRNA expression underlies the changes in cell viability.

2.4. CAP Inactivates AKT and ERK to Reduce Cell Survival and Impede miRNA Expression

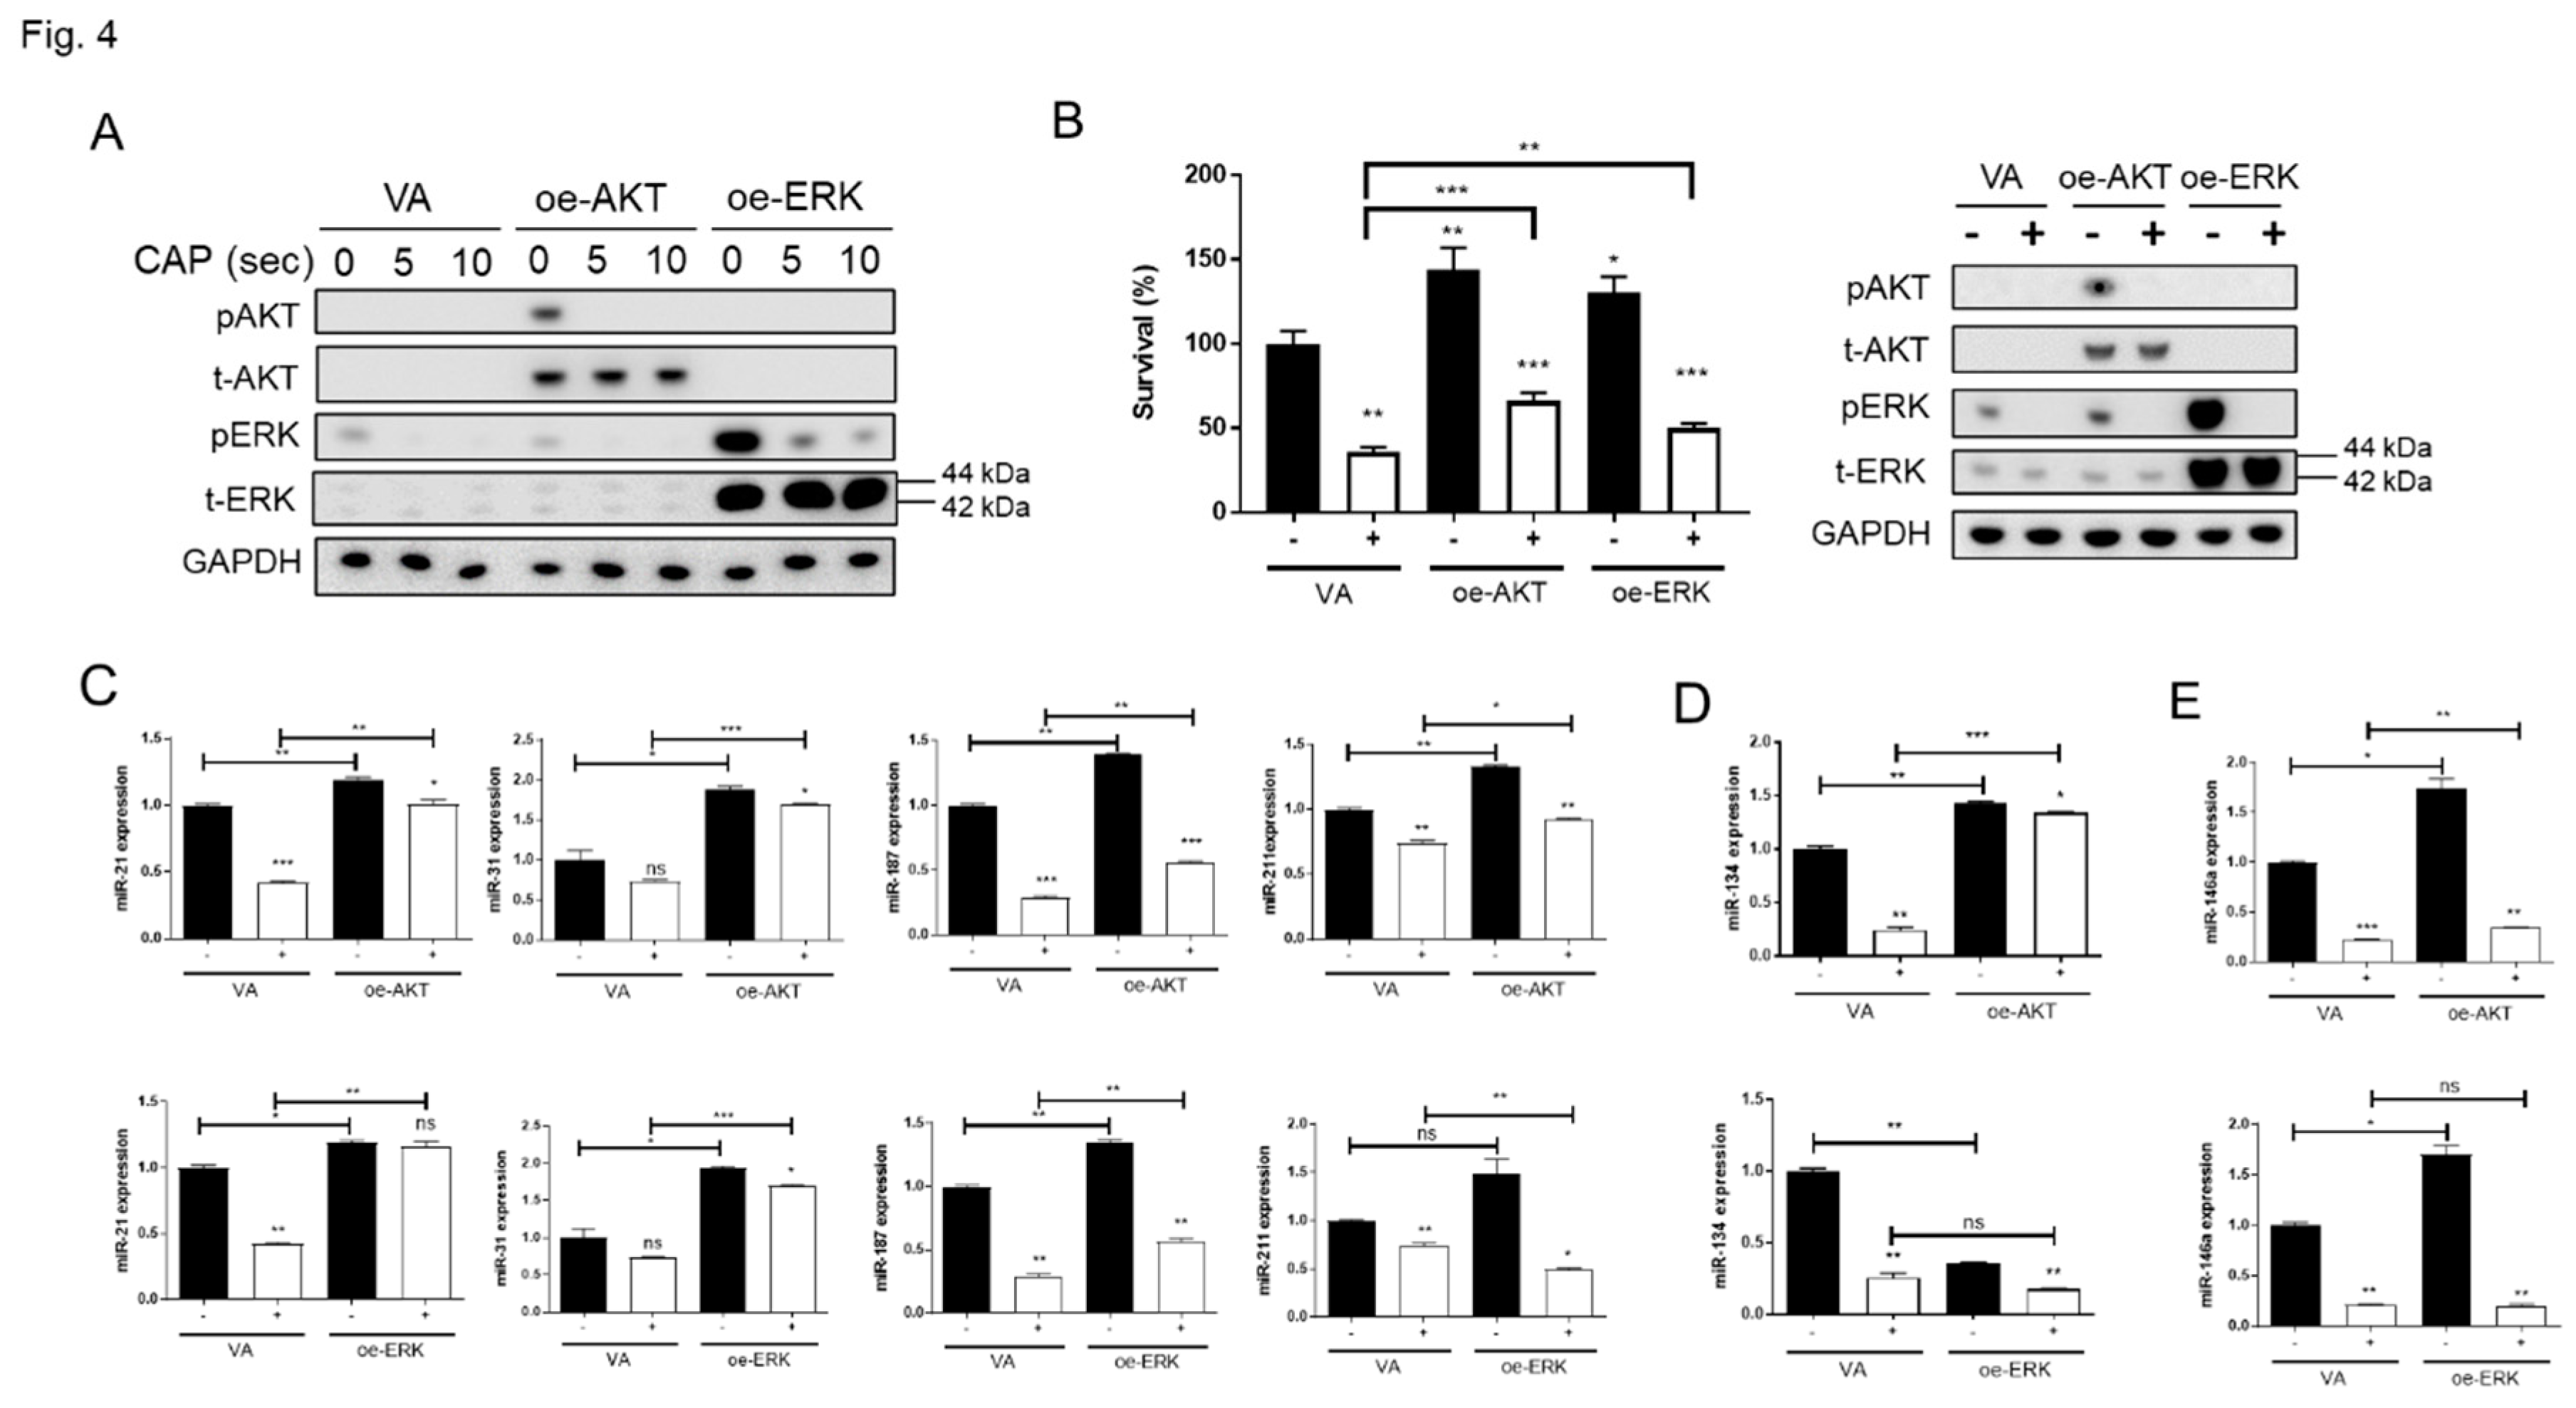
The SAS cell displays a modest level of endogenous ERK activation and lacks AKT expression. To test the effects of CAP on the signal activation, SAS cell was transfected with AKT or ERK plasmid for exogenous overexpression. The transient overexpression also accompanied the remarkable AKT and ERK activation (Figure 4A). Of note, CAP treatment did not affect the abundance of AKT or ERK proteins, regardless of endogenous or exogenous, it reduced the endogenous ERK activity, and exogenous AKT and ERK activity 2 h after treatment. The treatment with 10s CAP caused more conspicuous ERK inactivation than 5s CAP (Figure 4A). The increase of cell survival associated with AKT or ERK activation (Figure 4B, Lt) was attenuated by 10s CAP (Figure 4B, Rt), implying the involvement of these signals in CAP-induced cell death. Activation of AKT and ERK also drove the alterations in miRNA expression (Figure 4C - E). The upregulation of miR-21, miR-31, miR-187 and miR-211 associated with AKT or ERK activation was significantly attenuated by 10s CAP (Figure 4C). miR-134 expression was upregulated by AKT activation but downregulated by ERK activation (Figure 4D). Although miR-146a expression was drastically upregulated by AKT or ERK activation, the downregulation of 10s CAP on miR-146a expression was pronounced and this was not associated with the activation of these signals (Figure 4E).

2.5. CAP Treatment Decreases the Xenografic Tumor Growth of SAS Cell Line

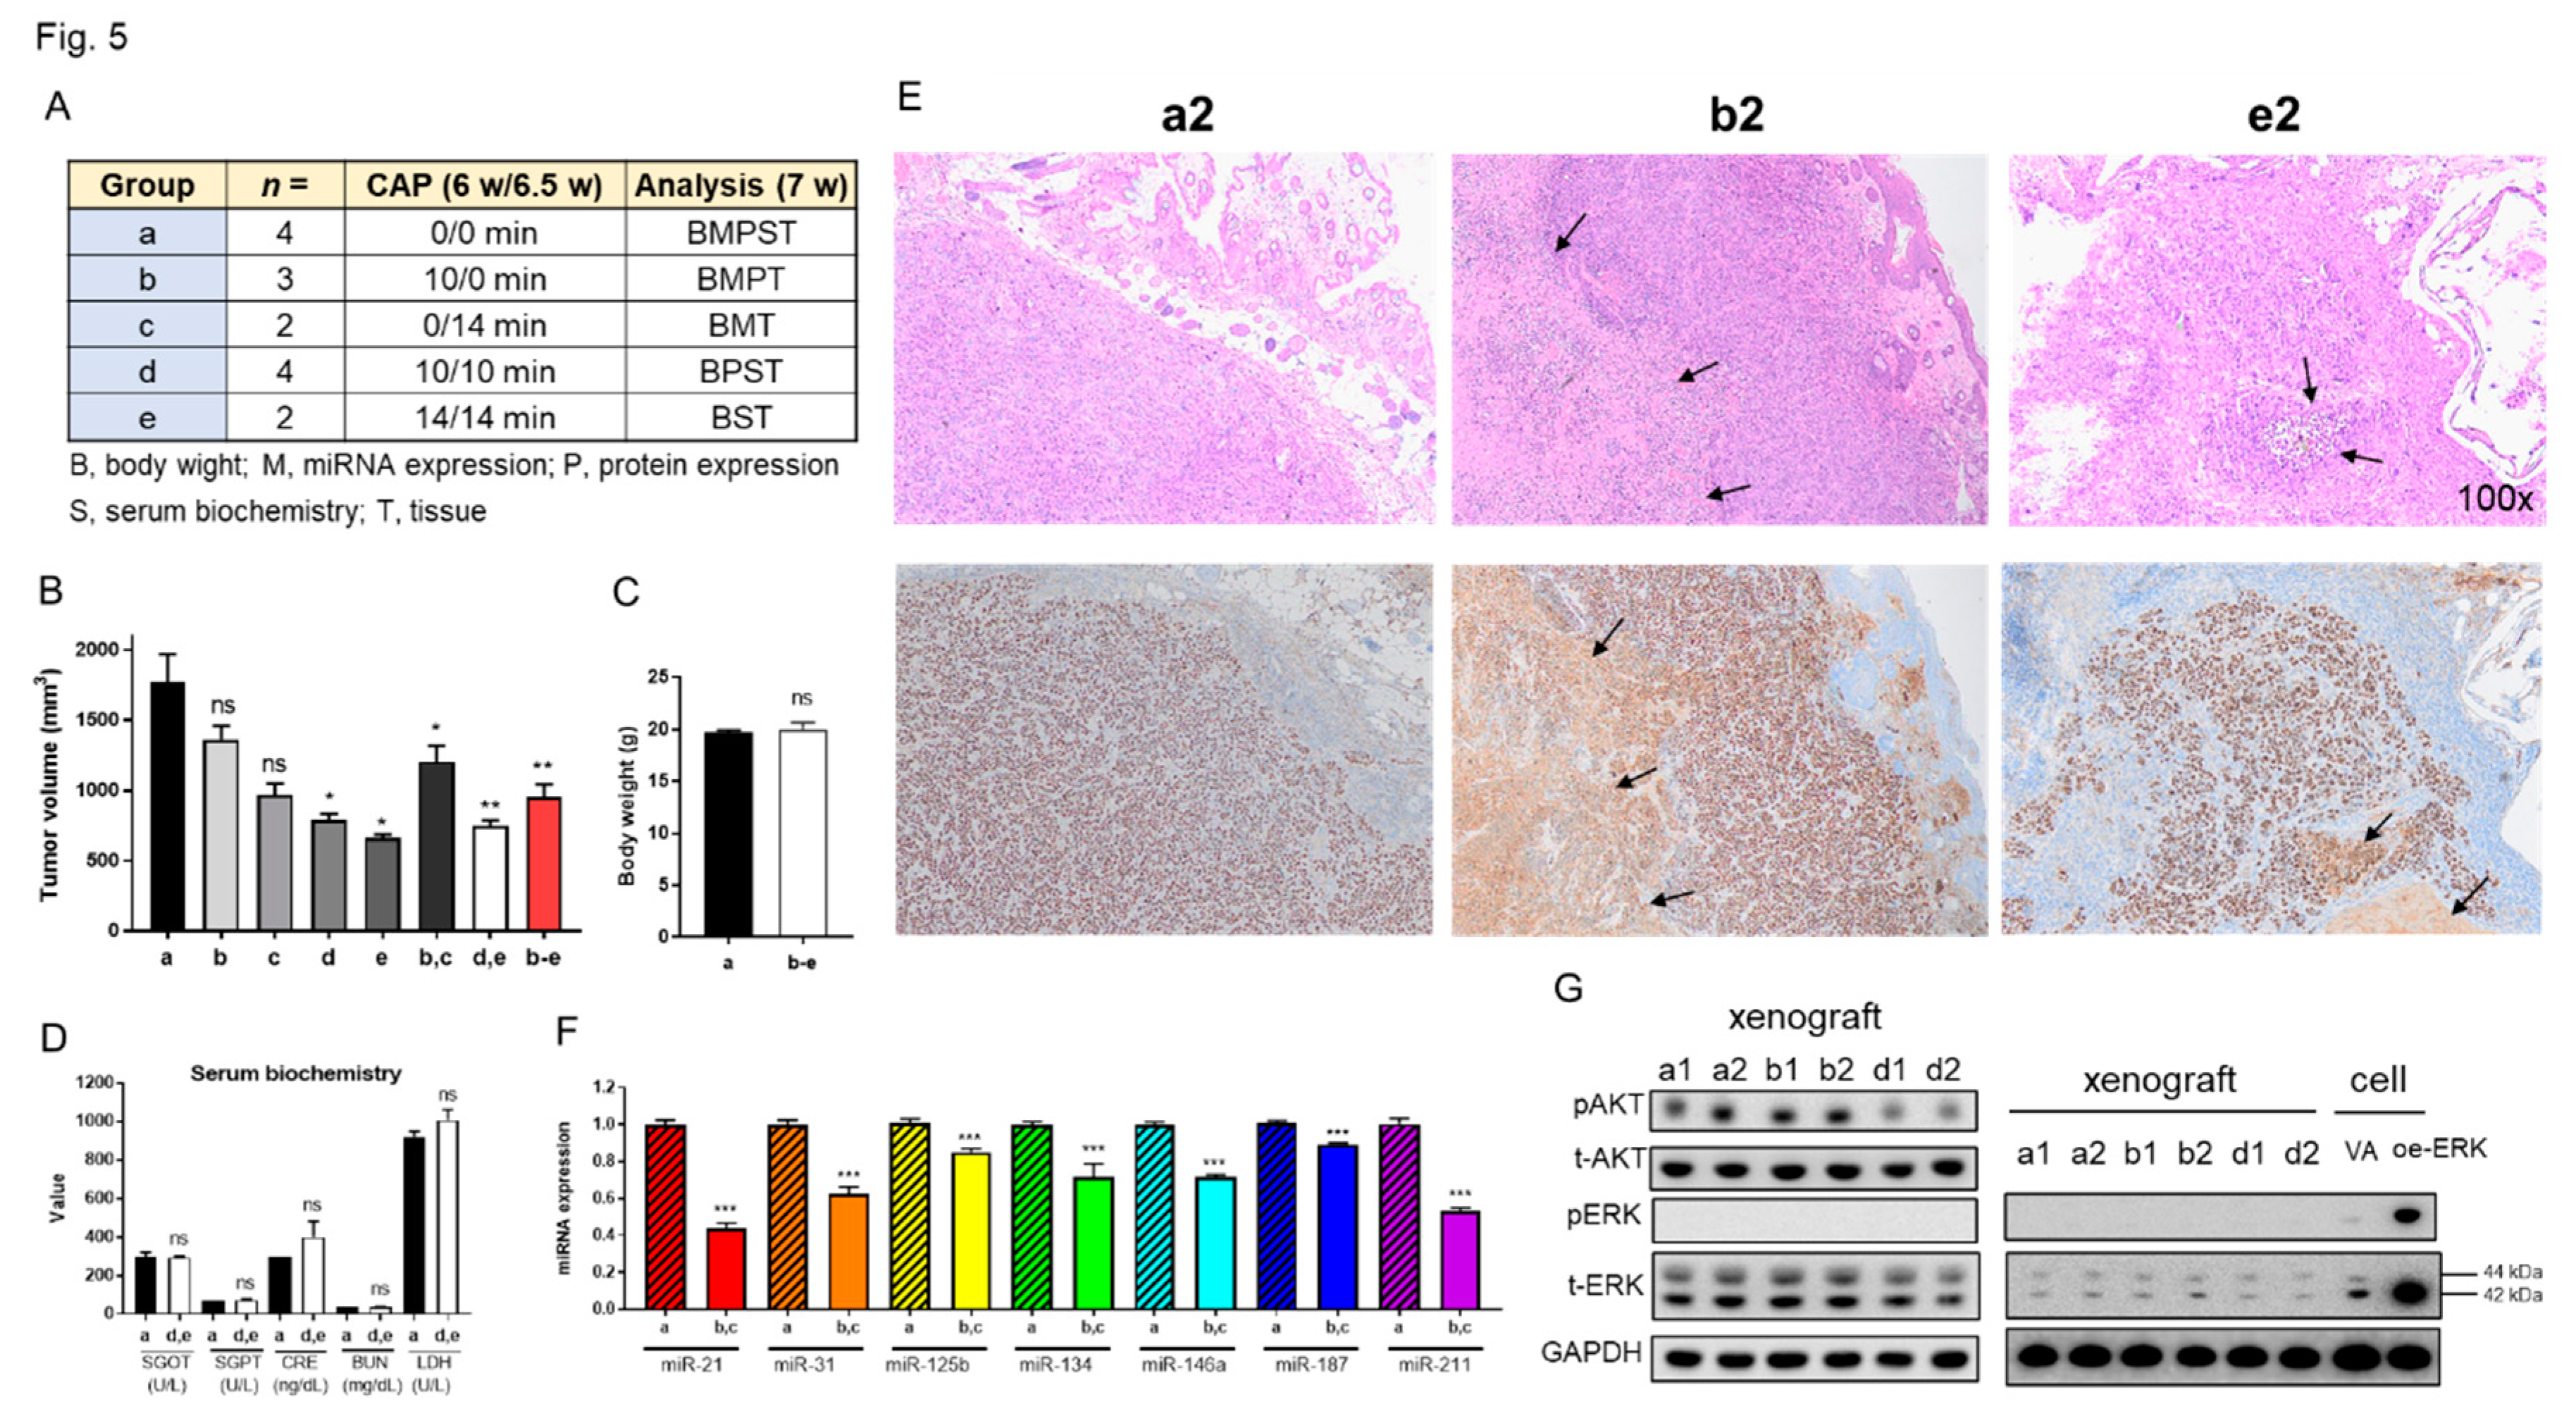
To assess CAP's inhibitory effects on OSCC tumors, we induced xenografts of SAS cells on the thighs of nude mice. CAP treatments causing tumor reduction and the absence of skin injury were preliminarily optimized (Figure S2). To acquire sufficient amounts of tissue samples for comprehensive analysis, the tumors were grown to diameters exceeding > 1 cm at 6.0 week. Subjects were divided into five groups receiving various treatments and assays (illustrated in Figure 5A). Single shot CAP treatment for 10 min or 14 min decreased the tumor volume to 67% relative to controls. Two shots of CAP treatment for 10 min/10 min or 14 min/14 min decreased the tumor volume to 42% of control tumors. The CAP treatment generally decreased tumor volume to 54% compared to argon-treated controls (Figure 5B). Neither the body weight of mice (Figure 5C), nor the serological data of liver and renal function (Figure 5D) were changed at the endpoint (7.0 week).
Histopathological examination of the control tumor revealed aggregations of Ki-67- stained cells, focal areas of necrosis and extensive inflammatory cell infiltration. These tumors were enclosed by a slender fibrovascular connective tissue layer interspersed with epithelioid cells (Figure 5E). The histopathological features of treated tumors are largely the same with control tumors despite a lesser Ki-67 labelled cellular fraction, a thicker fibrovascular-epitheloid cell layer and more extensive necrosis. The histopathological evaluation of tissue sections from two autopsy mice receiving the highest dose of CAP treatment revealed no remarkable tissue changes in tongue, lung, liver and kidney (Figure S3).
Compared to controls, tumors that underwent a single CAP treatment displayed varied extents of miRNA downregulation (Figure 5F; Figure S4). The decrease of miR-21 and miR-211 was particularly eminent. miR-125b expression is also downregulated in CAP-treated tumors. Western blot analysis indicated the abundant endogenous AKT and ERK expression, drastic AKT activation and the complete absence of ERK activity in tumors (Figure 5G, Lt). Site-by-site analysis demonstrated the lack of ERK activity in xenografts comparing to cell. (Figure 5G, Rt). Tumors receiving one-shot CAP treatment did not exhibit the change of AKT activation, whereas tumors receiving two-shot CAP treatment exhibited the decreased AKT activation (Figure 5G, Lt).

3. Discussion

Several studies have documented the efficacy of CAP in mitigating the effects of OSCC and HNSCC [5,6,9,14,15,16,17,25,28,29]. Our previous studies have demonstrated the equal effects across direct He-CAP treatment exposure and He-CAP-treated medium in abrogating the growth of cancer cells [7]. Besides, the He-CAP-treated medium synergized with anti-cancer drug to induce cancer death. Following the implementation of direct CAP or CAP-treated medium, the differentiation in sensitivity to CAP across normal cells and OSCC cells have been found [9,13,17]. However, the cross comparison of CAP effects in different types of cells or culture conditions may raise concerns on bias. In this study, we developed an argon CAP jet and characterized its efficacy and stability. By evaluating identical cell types (squamous cells) grown in a consistent medium, our study confirms that normal oral keratinocytes are less sensitive to CAP toxicity compared to OSCC cell lines. As a factor contributing to immortalization and neoplastic transformation of oral keratinocyte [37,39], mild increase of miR-31 expression following CAP treatment to sustain growth capability of NOK, would be the potential explanation of such discrepancy in CAP sensitivity. Therefore, CAP could be a promising strategy to intercept OSCC, which causes less toxicity on surrounding normal oral epithelium.
The influence of CAP in inducing apoptotic cell death is well-documented in various malignancies, including HNSCC [15,30]. Recent studies revealed that CAP also bestowed the autophagic and ferroptotic death of cancer cells [23,25,28]. Experiments in this study show that the rescue of viability by ferroptosis blocker is much pronounced than inhibitors against apoptosis or autophagy. The findings substantiate the effects of CAP associated RNS in ferroptosis induction [11], while the orchestration of apoptosis and autophagy death also exists. Although crosstalk lies amongst various types of programmed death [44,45], since combined treatment with 20 µM of ferroptosis/apoptosis/autophagy inhibitors nearly abolish the cell mortality induced by 10s CAP irradiation, the involvement of additional types of CAP-induced cell death in OSCC could be limited [20]. To reinforce the ferroptotic death induced by CAP using drugs may facilitate the OSCC interception [23].
CAP's impact on miRNA expression has been previously noted exclusively in leukemia cells [4]. For the first time, we have identified a downregulation in various oncogenic miRNAs and an upregulation of miR-125b in OSCC cells, influenced by CAP. In accordance with previous functional studies, such miRNA disruption would underlie the oncogenic suppression [33,34,35,36,37,38,39,40,41]. As the treatments with miRNA mimics partially restore the cell viability being repressed by CAP, our study provides clues substantiating that the disruption of miRNA expression could be the mechanisms of CAP-induced lethality of OSCC cells. Since this study only analyzed selected miRNA targets being previously studied [33,34,35,36,37,38,39,40,41], upon the insight of comprehensive landscape of miRNA expression affected by CAP, a strategy combining CAP and miRNA targeting could be validated to eliminate cancer cells.
Research indicates that CAP diminishes AKT levels and stimulates p38 and JNK in HNSCC cells [15,16]. But the effects of CAP in modulating ERK protein or activity await to be addressed. The endogenous AKT and ERK expression was scanty or modest in SAS cells in our culture condition, while the transfection of plasmids induces drastic exogenous protein expression and consequential activation. Since the 10s CAP treatment completely abolishes pAKT and pERK, along with the fact that AKT and ERK activation parallels the cell survival and the expression of miR-21, miR-31, miR-187 and miR-211, CAP-AKT/ERK-miRNA-survival cascade could be the anti-OSCC mechanism of CAP. Although CAP represses miR-134, the influences of AKT and ERK on miR-134 expression are different. Both AKT and ERK upregulate miR-146a, but CAP-mediated miR-146a downregulation is irrelevant to these signals. This study demonstrates the conspicuous effects of CAP in extinguishing the activity of AKT/ERK, which are critical factors of neoplastic survival. Phosphatase and tensin homolog (pTEN) is a potent inhibitor of PI3K/AKT/mTOR mediating tumor suppression [21]. Dual-specificity phosphatases (DUSPs) such as MKP1 (DUSP1) dephosphorylate serine/threonine residues of ERK to mediate tumor suppression [46,47]. The regulation of CAP or CAP products on pTEN and DUSPs or their effects in disturbing chemical bonds of signal molecules need to be addressed to realize the inactivation mechanism. The effects of CAP on the abundance of signaling factors in OSCC cells require wider stratification [15,16]. Our overexpression approach modes could be further extended to fully elucidate the influences of CAP on other signal pathways.
We explore the in vivo implications of CAP using a nude mice model. For consistent efficacy, we employed the same jet appliance for irradiation as used in our in vitro experiments. Although the CAP regimens in our study are different from other studies [15,16], the inhibitory effects of single or double CAP irradiation on SAS xenografts are evident, and no local or systemic toxicities are detected. Despite that the Ki-67 immunoreactivity seems unchanged in the survived cell of shrunk tumors, the changes of miRNA expression profile, are generally in concert with those occurred in in vitro experiments. Both total AKT and ERK proteins seem more abundant in tumors comparing to original cultivated cells. The AKT activation appears synchronizing with the total AKT amount, but the modest ERK activation in original cells was completely silenced in the tumors. The mild inactivation of AKT in tumors receiving two-shot CAP treatment may be owing to the limited irradiation dose or the limited penetration distance of CAP and CAP-induced compounds. Otherwise, the decrease in AKT activation could be secondary to the tumor shrinkage. Since CAP therapy would be more effective in superficial compartment of tumors, a precise preclinical regimen of CAP irradiation should be developed to achieve effective elimination of early stage OSCC. Further studies are required to better illuminate the modification of CAP on tumor microenvironment, especially the immune microenvironment in syngeneic murine OSCC model [16,48].
While therapeutic trials involving CAP in human OSCC are underway [31,32], a deeper mechanistic understanding of CAP is essential to bolster theoretical foundations and refine practical guidelines. Our research highlights that CAP acts as a potent suppressor of survival signals and oncogenic miRNAs in OSCC, primarily by triggering multiple forms of programmed cell death. The anti-tumor potential plus the safety of this therapeutic approach would enable potent adjuvant to OSCC therapy, particularly for tumors exhibiting less depth, and harboring high AKT/ERK activation or high oncogenic miRNAs expression.

4. Materials and Methods

4.1. Cell Lines

The SAS cell line was regularly cultivated in DMEM (Biochrom AG, Burlington, MA, USA) supplemented with 1% L-glutamine (Biological Industries, Tel Aviv, Israel), while the FaDu cell line was grown in Minimum Essential Medium (Gibco, Carlsbad, CA, USA) with 1% sodium pyruvate (Gibco). The media were supplemented with 10 % Fetal Bovine Serum (FBS, Biological Industries). NOK is an hTERT immortalized normal oral keratinocyte we established previously [37], was regularly cultured in KSFM (Invitrogen, Carlsbad, CA). All culture media also contained 1 % 3-in-1 antibiotics (100 unit/mL Penicillin, 0.1 mg/mL Streptomycin, 250 ng/mL Amphotericin, Biological Industries). As these cells grew and attached stably in mixed DMEM/KSFM (1:1) culture medium within five days in pilot tests, they were all transferred to this medium to grow 24 h before CAP experiment to assure no discrepancies in cultivation conditions for CAP experiments. The viability of cells was measured using trypan blue exclusion assay [49].

4.2. Plasma Jet Device

Figure 1A illustrates the CAP jet structure. The preliminary tests of the efficacy and stability of this system were performed on 1x phosphate-buffered solution (PBS, Biological Industries).

4.3. Reagents

Z-VAD, 3-MA and Fer-1 were purchased from Sigma-Aldrich (St Louise, MO, USA). They were dissolved in dimethyl sulfoxide (DMSO, Sigma-Aldrich) and optimized to 10 mM stock solution for use [47]. The mimics for miR-21, miR-31, miR-146a and miR-211, the inhibitor for miR-31, and their controls were enlisted in Table S1. They were optimized to 60 nM for use [48]. TransFectinTM Reagent (BioRad, Hercules, CA, USA) was used for transfection. Unless specified, all reagents were obtained from Sigma-Aldrich.

4.4. RONS Measurement

The RONS in CAP was measured using an OES. H2O2 and nitrate/nitrite were measured using Amplex® Red Hydrogen Peroxide/Peroxidase Assay Kit (Thermo Fisher Scientific, Waltham, MA, USA) and Nitrate/Nitrite Colorimetric Assay Kit (Cayman, Ann Arbor, MI, USA), respectively. The concentration of H2O2, nitrate and nitrite in PBS after 10s, 20s, 30s, and 60s CAP treatment was measured; the measurements were performed every 10 mins and the CAP was switched on for 46 mins during the measurement. In subsequent content of this manuscript, seconds will be denoted as "s".
4.5. qPCR Analysis
RNA was isolated from cell or tissue using TRI reagent (Molecular Research Center, Cincinnati, OH, USA). The expression of miRNA was measured using TaqMan miRNA assay kit (Apply Biosystems, Waltham, MA, USA). The probes of miRNAs including miR-21, miR-31, miR-125b, miR-134, miR-146a, miR-187 and miR-211, together with RNU6B (internal control) probe were enlisted in Table S2. The differential expression between test samples and controls was calculated using the 2−ΔΔCt method, where Ct is the cycle threshold of fluorescence reaction [48].

4.6. Western Blot Analysis

An amount of 10 µg cell lysates were subjected to Western blot analysis according to our published protocol [45]. The primary and secondary antibodies were described in Table S3. The detection of phosphorylation of Ser473 in AKT and phosphorylation of Thr202/Tyr204 in ERKs delineated their activation states. The expression of tested proteins was achieved by normalizing to GAPDH.

4.7. Plasmids

The plasmids ERK2 (MAPK1; CAT#: 39223, Addgene, Watertown, MA, USA) and pUSE-AKT (a gift from Professor Yang, C.C.) were used for signal activation by means of transient overexpression as related to their vector alone (VA) control [40,50].

4.8. Animal Study

For the induction of xenografts, 106 SAS cells were mixed with 40% Matrigel® Matrix (Corning, Bedford, MA, USA) and intradermally injected into the flanks of nude mice. Tumor volume was calculated in accordance with the formula: volume = 0.5ab2; a, the longest diameter, b, the shortest diameters [49]. CAP jet irradiation was performed on the surface of tumor or non-tumor bearing skin at defined timing. Body weight of mice was measured weekly. After sacrificing the mice, samples were collected for serologic, histopathologic and molecular studies. The animal study was approved by the Institutional Animal Care and Use Committee (IACUC) of National Yang Ming Chiao Tung University (IACUC approval no.: 1100422).

4.9. Immunohistochemistry

The paraffin-embedded sections harboring tumor tissues were subjected to immunohistochemical studies using human specific anti-Ki-67 antibody (Agilent, Glostrup, Denmark) to detect the labelled tumor cells according to the protocol we previously established [49].

4.10. Statistical Analysis

Data were presented as mean ± SE. Mann-Whitney test, t-test and two-way analysis of variance (ANOVA) were used for statistical analysis of data. A p value less than 0.05 was considered significantly different (*p < 0.05; **p< 0.01; ***p< 0.001, ***p< 0.0001)

Supplementary Materials

The following supporting information can be downloaded at the website of this paper posted on Preprints.org.

Author Contributions

Conceptualization, C.Y.C.; C.K.W.; L.W.C. and L.S.C.; sampling, P.J.H.; T.H.F. and C.K.W.; experiments, P.J.H; C.C.Y.; C.C.H.; data processing, C.Y.C.; P.J.H; C.C.Y.; C.C.H. and L.S.C.; writing, C.Y.C; C.K.W. and L.S.C.; funding acquisition, C.Y.C.; C.K.W. and L.S.C.

Funding

This study is supported by grants 110-2628-E-A49 -006 and 110-2314-B-A49A-515-MY3 from National Science and Technology Council, Taiwan.

Institutional Review Board Statement

Not applicable.

Informed Consent Statement

Not applicable.

Data Availability Statement

The data presented in this study are available on request from the corresponding author.

Acknowledgments

This study is also supported by the seed fund across Colleges of Engineering and Dentistry in National Yang Ming Chiao Tung University for Encouraging Cross-Domain Research Collaboration.

Conflicts of Interest

The authors declare no conflict of interest.

References

  1. Chupradit, S.; Widjaja, G.; Radhi Majeed, B.; Kuznetsova, M.; Ansari, M.J.; Suksatan, W.; Turki Jalil, A.; Ghazi Esfahani, B. Recent advances in cold atmospheric plasma (CAP) for breast cancer therapy. Cell Biol. Int. 2023, 47, 327–340. [Google Scholar] [CrossRef]
  2. Hajam, Y.A.; Rani, R.; Ganie, S.Y.; Sheikh, T.A.; Javaid, D.; Qadri, S.S.; Pramodh, S.; Alsulimani, A.; Alkhanani, M.F.; Harakeh, S.; et al. Oxidative Stress in Human Pathology and Aging: Molecular Mechanisms and Perspectives. Cells 2022, 11. [Google Scholar] [CrossRef]
  3. Brany, D.; Dvorska, D.; Halasova, E.; Skovierova, H. Cold Atmospheric Plasma: A Powerful Tool for Modern Medicine. Int. J. Mol. Sci. 2020, 21. [Google Scholar] [CrossRef] [PubMed]
  4. Guo, B.; Li, W.; Liu, Y.; Xu, D.; Liu, Z.; Huang, C. Aberrant Expressional Profiling of Small RNA by Cold Atmospheric Plasma Treatment in Human Chronic Myeloid Leukemia Cells. Front. Genet. 2021, 12, 809658. [Google Scholar] [CrossRef] [PubMed]
  5. Zhai, S.Y.; Kong, M.G.; Xia, Y.M. Cold Atmospheric Plasma Ameliorates Skin Diseases Involving Reactive Oxygen/Nitrogen Species-Mediated Functions. Front. Immunol. 2022, 13, 868386. [Google Scholar] [CrossRef] [PubMed]
  6. Chang, J.W.; Kang, S.U.; Shin, Y.S.; Kim, K.I.; Seo, S.J.; Yang, S.S.; Lee, J.S.; Moon, E.; Baek, S.J.; Lee, K.; et al. Non-thermal atmospheric pressure plasma induces apoptosis in oral cavity squamous cell carcinoma: Involvement of DNA-damage-triggering sub-G(1) arrest via the ATM/p53 pathway. Arch. Biochem. Biophys. 2014, 545, 133–140. [Google Scholar] [CrossRef]
  7. Chen, C.Y.; Cheng, Y.C.; Cheng, Y.J. Synergistic effects of plasma-activated medium and chemotherapeutic drugs in cancer treatment. J. Phys. D Appl. Phys. 2018, 51, 13LT01. [Google Scholar] [CrossRef]
  8. Forster, S.; Niu, Y.; Eggers, B.; Nokhbehsaim, M.; Kramer, F.J.; Bekeschus, S.; Mustea, A.; Stope, M.B. Modulation of the Tumor-Associated Immuno-Environment by Non-Invasive Physical Plasma. Cancers (Basel) 2023, 15. [Google Scholar] [CrossRef]
  9. Guerrero-Preston, R.; Ogawa, T.; Uemura, M.; Shumulinsky, G.; Valle, B.L.; Pirini, F.; Ravi, R.; Sidransky, D.; Keidar, M.; Trink, B. Cold atmospheric plasma treatment selectively targets head and neck squamous cell carcinoma cells. Int. J. Mol. Med. 2014, 34, 941–946. [Google Scholar] [CrossRef]
  10. Kim, S.J.; Seong, M.J.; Mun, J.J.; Bae, J.H.; Joh, H.M.; Chung, T.H. Differential Sensitivity of Melanoma Cells and Their Non-Cancerous Counterpart to Cold Atmospheric Plasma-Induced Reactive Oxygen and Nitrogen Species. Int. J. Mol. Sci. 2022, 23. [Google Scholar] [CrossRef] [PubMed]
  11. Li, Y.; Tang, T.; Lee, H.; Song, K. Cold Atmospheric Pressure Plasma-Activated Medium Induces Selective Cell Death in Human Hepatocellular Carcinoma Cells Independently of Singlet Oxygen, Hydrogen Peroxide, Nitric Oxide and Nitrite/Nitrate. Int. J. Mol. Sci. 2021, 22. [Google Scholar] [CrossRef] [PubMed]
  12. Zhao, L.; Yan, C.; Kong, S.; Jia, T.; Chu, Z.; Yang, L.; Wu, J.; Geng, S.; Guo, K. Biosafety and differentially expressed genes analysis of melanoma cells treated with cold atmospheric plasma. J. Biophotonics 2022, 15, e202100403. [Google Scholar] [CrossRef]
  13. Bundscherer, L.; Wende, K.; Ottmuller, K.; Barton, A.; Schmidt, A.; Bekeschus, S.; Hasse, S.; Weltmann, K.D.; Masur, K.; Lindequist, U. Impact of non-thermal plasma treatment on MAPK signaling pathways of human immune cell lines. Immunobiology 2013, 218, 1248–1255. [Google Scholar] [CrossRef]
  14. Chang, J.W.; Kang, S.U.; Shin, Y.S.; Seo, S.J.; Kim, Y.S.; Yang, S.S.; Lee, J.S.; Moon, E.; Lee, K.; Kim, C.H. Combination of NTP with cetuximab inhibited invasion/migration of cetuximab-resistant OSCC cells: Involvement of NF-kappaB signaling. Sci. Rep. 2015, 5, 18208. [Google Scholar] [CrossRef]
  15. Kang, S.U.; Cho, J.H.; Chang, J.W.; Shin, Y.S.; Kim, K.I.; Park, J.K.; Yang, S.S.; Lee, J.S.; Moon, E.; Lee, K.; et al. Nonthermal plasma induces head and neck cancer cell death: The potential involvement of mitogen-activated protein kinase-dependent mitochondrial reactive oxygen species. Cell Death Dis. 2014, 5, e1056. [Google Scholar] [CrossRef] [PubMed]
  16. Kim, S.Y.; Kim, H.J.; Kang, S.U.; Kim, Y.E.; Park, J.K.; Shin, Y.S.; Kim, Y.S.; Lee, K.; Kim, C.H. Non-thermal plasma induces AKT degradation through turn-on the MUL1 E3 ligase in head and neck cancer. Oncotarget 2015, 6, 33382–33396. [Google Scholar] [CrossRef]
  17. Lee, J.H.; Om, J.Y.; Kim, Y.H.; Kim, K.M.; Choi, E.H.; Kim, K.N. Selective Killing Effects of Cold Atmospheric Pressure Plasma with NO Induced Dysfunction of Epidermal Growth Factor Receptor in Oral Squamous Cell Carcinoma. PLoS ONE 2016, 11, e0150279. [Google Scholar] [CrossRef]
  18. Lee, S.Y.; Kang, S.U.; Kim, K.I.; Kang, S.; Shin, Y.S.; Chang, J.W.; Yang, S.S.; Lee, K.; Lee, J.S.; Moon, E.; et al. Nonthermal plasma induces apoptosis in ATC cells: Involvement of JNK and p38 MAPK-dependent ROS. Yonsei Med. J. 2014, 55, 1640–1647. [Google Scholar] [CrossRef]
  19. Tornin, J.; Mateu-Sanz, M.; Rodriguez, A.; Labay, C.; Rodriguez, R.; Canal, C. Pyruvate Plays a Main Role in the Antitumoral Selectivity of Cold Atmospheric Plasma in Osteosarcoma. Sci. Rep. 2019, 9, 10681. [Google Scholar] [CrossRef]
  20. Yang, X.; Chen, G.; Yu, K.N.; Yang, M.; Peng, S.; Ma, J.; Qin, F.; Cao, W.; Cui, S.; Nie, L.; et al. Cold atmospheric plasma induces GSDME-dependent pyroptotic signaling pathway via ROS generation in tumor cells. Cell Death Dis. 2020, 11, 295. [Google Scholar] [CrossRef]
  21. Adhikari, M.; Adhikari, B.; Ghimire, B.; Baboota, S.; Choi, E.H. Cold Atmospheric Plasma and Silymarin Nanoemulsion Activate Autophagy in Human Melanoma Cells. Int. J. Mol. Sci. 2020, 21. [Google Scholar] [CrossRef]
  22. Chen, X.; Tao, Y.; He, M.; Deng, M.; Guo, R.; Sheng, Q.; Wang, X.; Ren, K.; Li, T.; He, X.; et al. Co-delivery of autophagy inhibitor and gemcitabine using a pH-activatable core-shell nanobomb inhibits pancreatic cancer progression and metastasis. Theranostics 2021, 11, 8692–8705. [Google Scholar] [CrossRef]
  23. Jo, A.; Bae, J.H.; Yoon, Y.J.; Chung, T.H.; Lee, E.W.; Kim, Y.H.; Joh, H.M.; Chung, J.W. Plasma-activated medium induces ferroptosis by depleting FSP1 in human lung cancer cells. Cell Death Dis. 2022, 13, 212. [Google Scholar] [CrossRef]
  24. Patrakova, E.; Biryukov, M.; Troitskaya, O.; Gugin, P.; Milakhina, E.; Semenov, D.; Poletaeva, J.; Ryabchikova, E.; Novak, D.; Kryachkova, N.; et al. Chloroquine Enhances Death in Lung Adenocarcinoma A549 Cells Exposed to Cold Atmospheric Plasma Jet. Cells 2023, 12. [Google Scholar] [CrossRef]
  25. Sato, K.; Shi, L.; Ito, F.; Ohara, Y.; Motooka, Y.; Tanaka, H.; Mizuno, M.; Hori, M.; Hirayama, T.; Hibi, H.; et al. Non-thermal plasma specifically kills oral squamous cell carcinoma cells in a catalytic Fe(II)-dependent manner. J. Clin. Biochem. Nutr. 2019, 65, 8–15. [Google Scholar] [CrossRef]
  26. Akbari Dilmaghani, N.; Safaroghli-Azar, A.; Pourbagheri-Sigaroodi, A.; Bashash, D. The PI3K/Akt/mTORC signaling axis in head and neck squamous cell carcinoma: Possibilities for therapeutic interventions either as single agents or in combination with conventional therapies. IUBMB Life 2021, 73, 618–642. [Google Scholar] [CrossRef]
  27. Johnson, D.E.; Burtness, B.; Leemans, C.R.; Lui, V.W.Y.; Bauman, J.E.; Grandis, J.R. Head and neck squamous cell carcinoma. Nat. Rev. Dis. Primers 2020, 6, 92. [Google Scholar] [CrossRef]
  28. Holanda, A.G.A.; Cesario, B.C.; Silva, V.M.; Francelino, L.E.C.; Nascimento, B.H.M.; Damasceno, K.F.A.; Ishikawa, U.; Farias, N.B.S.; Junior, R.F.A.; Barboza, C.A.G.; et al. Use of Cold Atmospheric Plasma in the Treatment of Squamous Cell Carcinoma: In vitro Effects and Clinical Application in Feline Tumors: A Pilot Study. Top. Companion Anim. Med. 2023, 53-54, 100773. [Google Scholar] [CrossRef]
  29. Lee, C.M.; Jeong, Y.I.; Kook, M.S.; Kim, B.H. Combinatorial Effect of Cold Atmosphere Plasma (CAP) and the Anticancer Drug Cisplatin on Oral Squamous Cell Cancer Therapy. Int. J. Mol. Sci. 2020, 21. [Google Scholar] [CrossRef] [PubMed]
  30. Brunner, T.F.; Probst, F.A.; Troeltzsch, M.; Schwenk-Zieger, S.; Zimmermann, J.L.; Morfill, G.; Becker, S.; Harreus, U.; Welz, C. Primary cold atmospheric plasma combined with low dose cisplatin as a possible adjuvant combination therapy for HNSCC cells-an in-vitro study. Head. Face Med. 2022, 18, 21. [Google Scholar] [CrossRef]
  31. Li, X.; Rui, X.; Li, D.; Wang, Y.; Tan, F. Plasma oncology: Adjuvant therapy for head and neck cancer using cold atmospheric plasma. Front. Oncol. 2022, 12, 994172. [Google Scholar] [CrossRef] [PubMed]
  32. Schuster, M.; Seebauer, C.; Rutkowski, R.; Hauschild, A.; Podmelle, F.; Metelmann, C.; Metelmann, B.; von Woedtke, T.; Hasse, S.; Weltmann, K.D.; et al. Visible tumor surface response to physical plasma and apoptotic cell kill in head and neck cancer. J. Craniomaxillofac Surg. 2016, 44, 1445–1452. [Google Scholar] [CrossRef] [PubMed]
  33. Chen, Y.F.; Wei, Y.Y.; Yang, C.C.; Liu, C.J.; Yeh, L.Y.; Chou, C.H.; Chang, K.W.; Lin, S.C. miR-125b suppresses oral oncogenicity by targeting the anti-oxidative gene PRXL2A. Redox Biol. 2019, 22, 101140. [Google Scholar] [CrossRef]
  34. Chen, Y.F.; Yang, C.C.; Kao, S.Y.; Liu, C.J.; Lin, S.C.; Chang, K.W. MicroRNA-211 Enhances the Oncogenicity of Carcinogen-Induced Oral Carcinoma by Repressing TCF12 and Increasing Antioxidant Activity. Cancer Res. 2016, 76, 4872–4886. [Google Scholar] [CrossRef]
  35. Hui, A.B.; Lenarduzzi, M.; Krushel, T.; Waldron, L.; Pintilie, M.; Shi, W.; Perez-Ordonez, B.; Jurisica, I.; O'Sullivan, B.; Waldron, J.; et al. Comprehensive MicroRNA profiling for head and neck squamous cell carcinomas. Clin. Cancer Res. 2010, 16, 1129–1139. [Google Scholar] [CrossRef]
  36. Hung, P.S.; Liu, C.J.; Chou, C.S.; Kao, S.Y.; Yang, C.C.; Chang, K.W.; Chiu, T.H.; Lin, S.C. miR-146a enhances the oncogenicity of oral carcinoma by concomitant targeting of the IRAK1, TRAF6 and NUMB genes. PLoS ONE 2013, 8, e79926. [Google Scholar] [CrossRef] [PubMed]
  37. Hung, P.S.; Tu, H.F.; Kao, S.Y.; Yang, C.C.; Liu, C.J.; Huang, T.Y.; Chang, K.W.; Lin, S.C. miR-31 is upregulated in oral premalignant epithelium and contributes to the immortalization of normal oral keratinocytes. Carcinogenesis 2014, 35, 1162–1171. [Google Scholar] [CrossRef]
  38. Lin, S.C.; Kao, S.Y.; Chang, J.C.; Liu, Y.C.; Yu, E.H.; Tseng, S.H.; Liu, C.J.; Chang, K.W. Up-regulation of miR-187 modulates the advances of oral carcinoma by targeting BARX2 tumor suppressor. Oncotarget 2016, 7, 61355–61365. [Google Scholar] [CrossRef]
  39. Liu, C.J.; Tsai, M.M.; Hung, P.S.; Kao, S.Y.; Liu, T.Y.; Wu, K.J.; Chiou, S.H.; Lin, S.C.; Chang, K.W. miR-31 ablates expression of the HIF regulatory factor FIH to activate the HIF pathway in head and neck carcinoma. Cancer Res. 2010, 70, 1635–1644. [Google Scholar] [CrossRef] [PubMed]
  40. Lu, W.C.; Kao, S.Y.; Yang, C.C.; Tu, H.F.; Wu, C.H.; Chang, K.W.; Lin, S.C. EGF up-regulates miR-31 through the C/EBPbeta signal cascade in oral carcinoma. PLoS ONE 2014, 9, e108049. [Google Scholar] [CrossRef]
  41. Peng, S.Y.; Tu, H.F.; Yang, C.C.; Wu, C.H.; Liu, C.J.; Chang, K.W.; Lin, S.C. miR-134 targets PDCD7 to reduce E-cadherin expression and enhance oral cancer progression. Int. J. Cancer 2018, 143, 2892–2904. [Google Scholar] [CrossRef] [PubMed]
  42. Harsha, C.; Banik, K.; Ang, H.L.; Girisa, S.; Vikkurthi, R.; Parama, D.; Rana, V.; Shabnam, B.; Khatoon, E.; Kumar, A.P.; et al. Targeting AKT/mTOR in Oral Cancer: Mechanisms and Advances in Clinical Trials. Int. J. Mol. Sci. 2020, 21. [Google Scholar] [CrossRef]
  43. Rong, C.; Muller, M.F.; Xiang, F.; Jensen, A.; Weichert, W.; Major, G.; Plinkert, P.K.; Hess, J.; Affolter, A. Adaptive ERK signalling activation in response to therapy and in silico prognostic evaluation of EGFR-MAPK in HNSCC. Br. J. Cancer 2020, 123, 288–297. [Google Scholar] [CrossRef] [PubMed]
  44. Raudenska, M.; Balvan, J.; Masarik, M. Cell death in head and neck cancer pathogenesis and treatment. Cell Death Dis. 2021, 12, 192. [Google Scholar] [CrossRef] [PubMed]
  45. Golpour, M.; Alimohammadi, M.; Sohbatzadeh, F.; Fattahi, S.; Bekeschus, S.; Rafiei, A. Cold atmospheric pressure plasma treatment combined with starvation increases autophagy and apoptosis in melanoma in vitro and in vivo. Exp. Dermatol. 2022, 31, 1016–1028. [Google Scholar] [CrossRef]
  46. Kwon, O.S.; Lee, H.; Kim, Y.J.; Cha, H.J.; Song, N.Y.; Lee, M.O. ERK Dephosphorylation through MKP1 Deacetylation by SIRT1 Attenuates RAS-Driven Tumorigenesis. Cancers (Basel) 2020, 12. [Google Scholar] [CrossRef]
  47. Lu, H.H.; Kao, S.Y.; Liu, T.Y.; Liu, S.T.; Huang, W.P.; Chang, K.W.; Lin, S.C. Areca nut extract induced oxidative stress and upregulated hypoxia inducing factor leading to autophagy in oral cancer cells. Autophagy 2010, 6, 725–737. [Google Scholar] [CrossRef]
  48. Chen, Y.F.; Chang, K.W.; Yang, I.T.; Tu, H.F.; Lin, S.C. Establishment of syngeneic murine model for oral cancer therapy. Oral. Oncol. 2019, 95, 194–201. [Google Scholar] [CrossRef]
  49. Shieh, T.M.; Lin, S.C.; Liu, C.J.; Chang, S.S.; Ku, T.H.; Chang, K.W. Association of expression aberrances and genetic polymorphisms of lysyl oxidase with areca-associated oral tumorigenesis. Clin. Cancer Res. 2007, 13, 4378–4385. [Google Scholar] [CrossRef]
  50. Yang, C.C.; Tu, H.F.; Wu, C.H.; Chang, H.C.; Chiang, W.F.; Shih, N.C.; Lee, Y.S.; Kao, S.Y.; Chang, K.W. Up-regulation of HB-EGF by the COX-2/PGE2 signaling associates with the cisplatin resistance and tumor recurrence of advanced HNSCC. Oral. Oncol. 2016, 56, 54–61. [Google Scholar] [CrossRef]
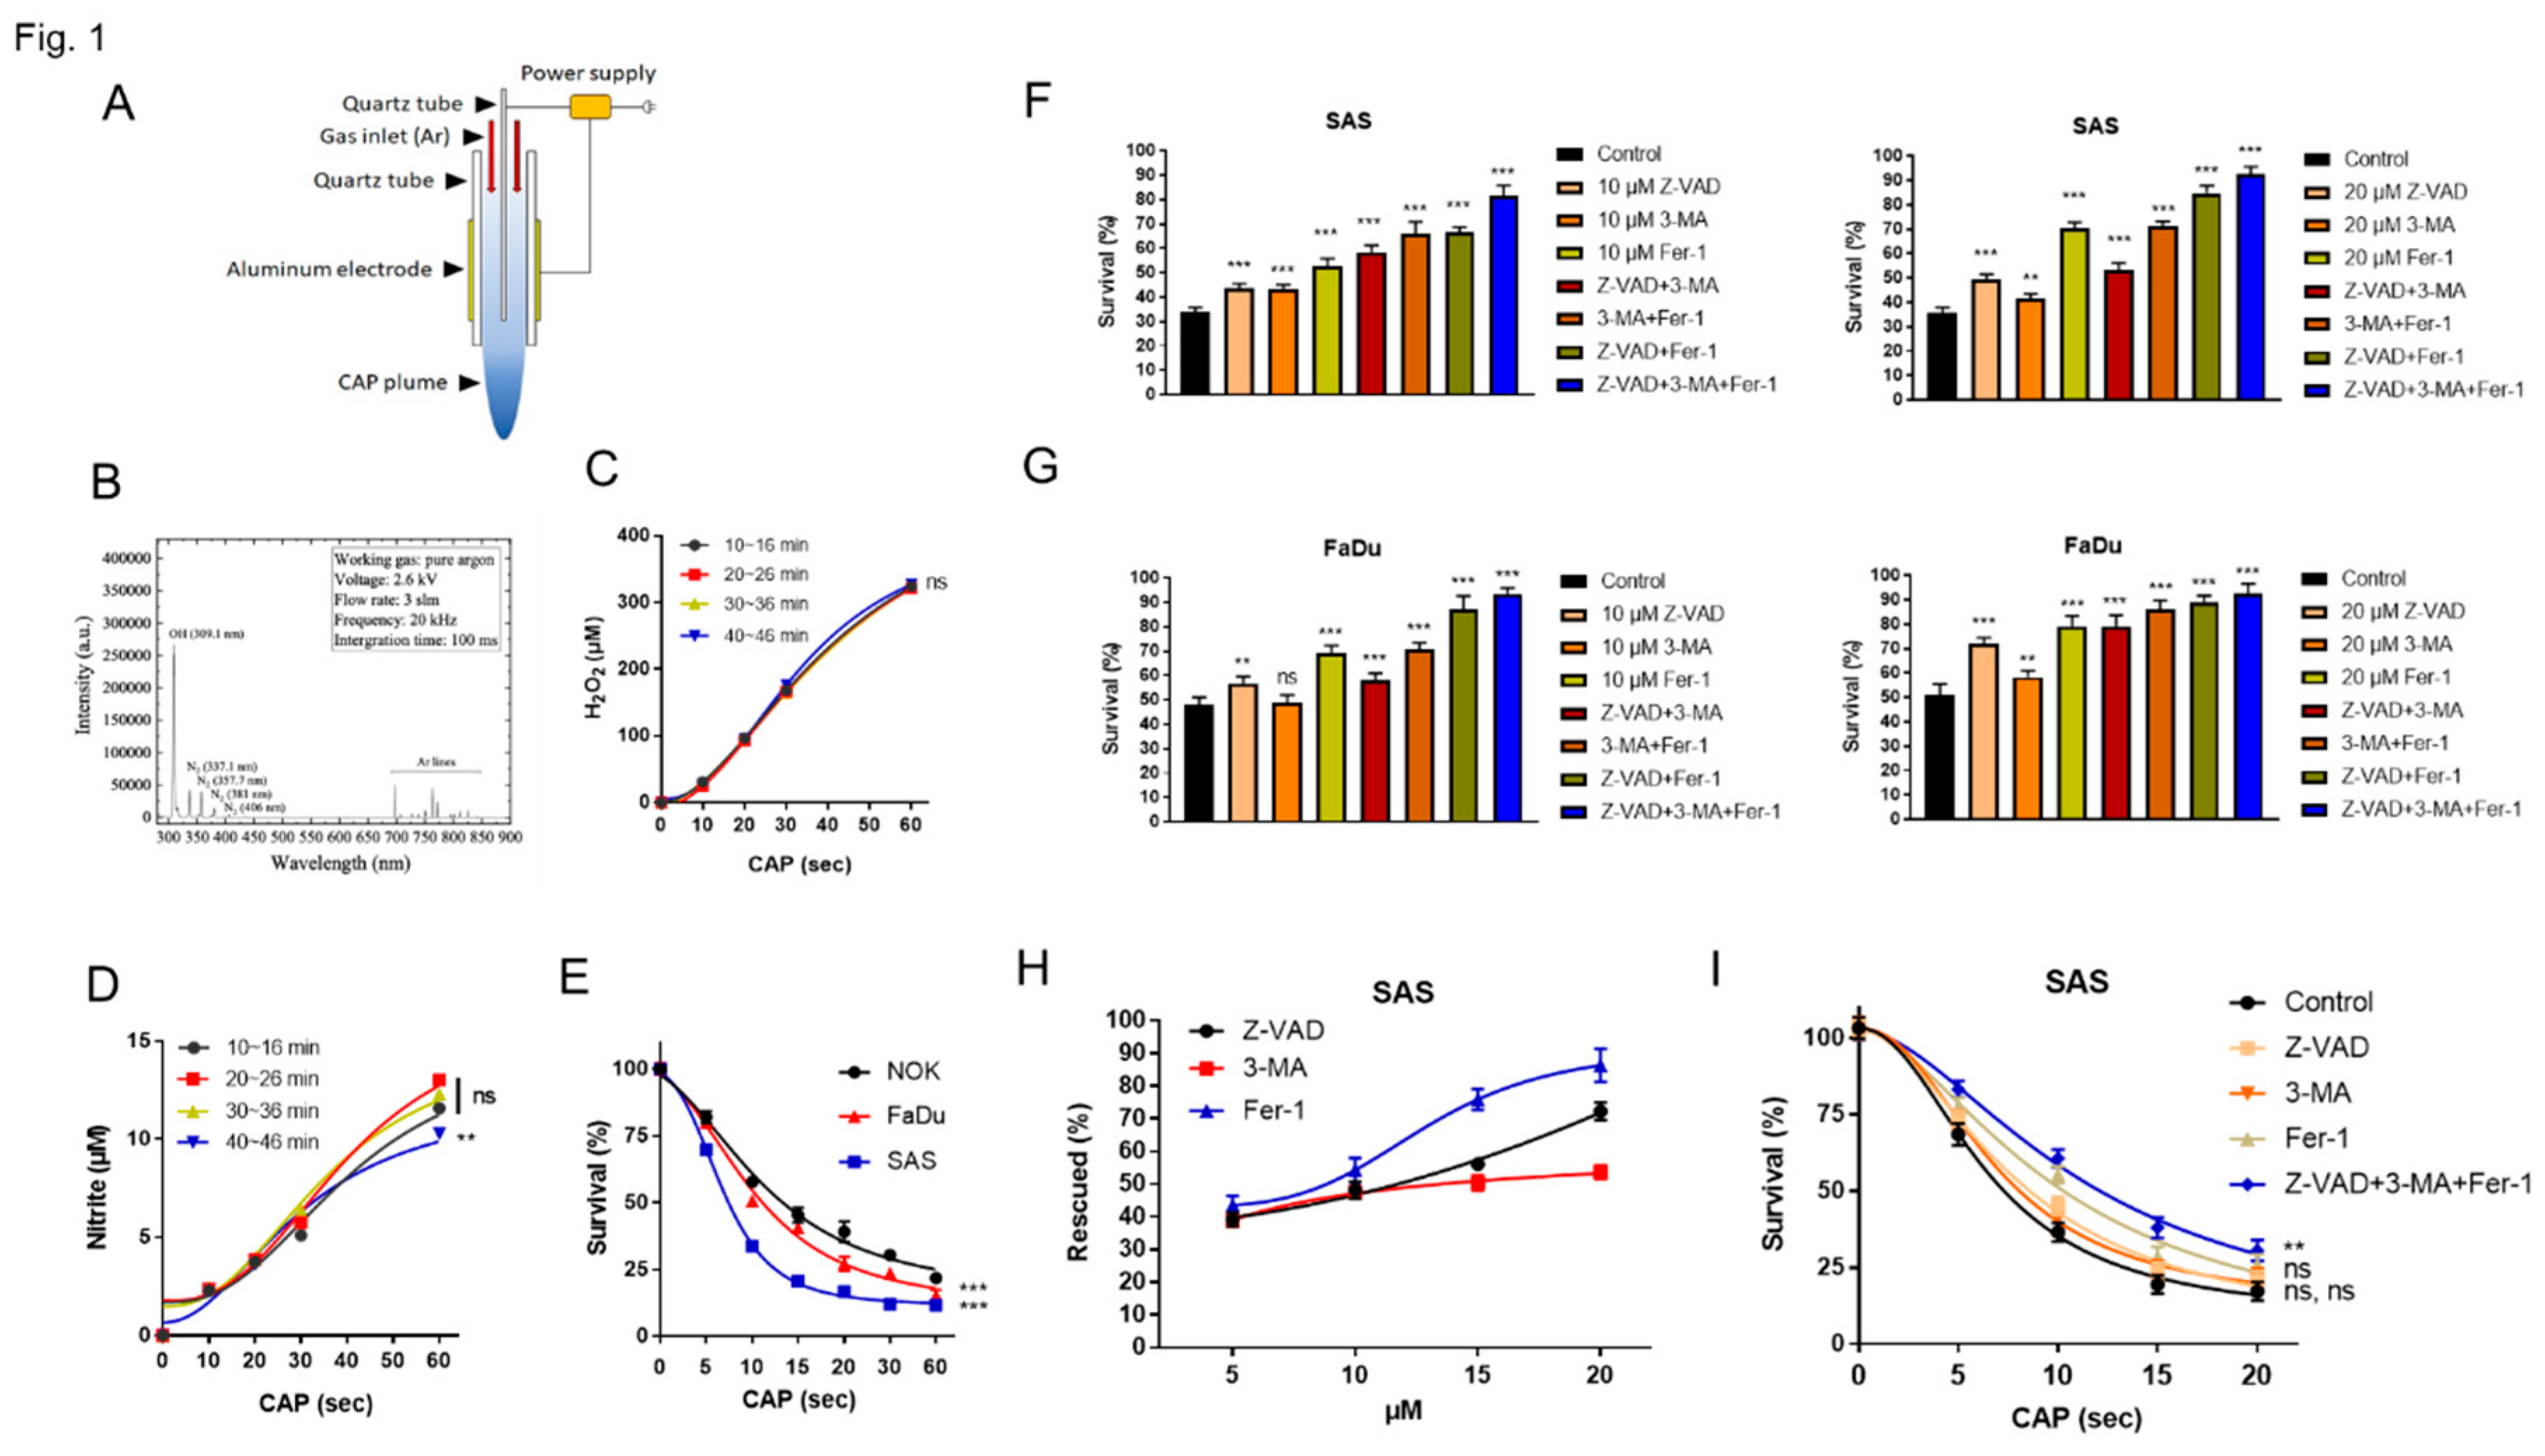
Figure 1. CAP irradiation induces OSCC cell death. (A). Schema to illustrate the CAP jet developed in our laboratory. (B) Optical emission spectrum of the CAP jet after the 10s-CAP-application on PBS. (C, D) H2O2 and nitrite concentration in PBS after 10s, 20s, 30s, and 60s CAP treatment, 3 repetition; the measurements were performed every 10 mins and the CAP was switched on for 46 mins during the measurement. (E) Survival of cells 24 h after CAP treatment for 5s - 60s. (F, G) Pretreatment with ZVAD, 3-MA, Fer-1 and their combination as related to the cell survival following 10s CAP treatment. (F) SAS, (G) FaDu. Lt and Rt, 10 µM and 20 µM inhibitors, respectively. (H, I) SAS. (H) The cell survival being rescued by 5 µM - 20 µM inhibitors following 10s CAP treatment. (I) The cell survival following the 10 µM inhibition pretreatment an 5s - 20s CAP irradiation.
Preprints 87614 g001
Figure 2. The expression of miRNAs in cells treated with CAP. (A) 10s CAP treatment, then growing cells for 24 h. (B) 5s or 10s CAP treatments, then growing cells for 24 h. (C) 10s CAP treatment, then growing cells for 24 h or 48 h. Upper, NOK, Middle, SAS, Lower, FaDu.
Preprints 87614 g002
Figure 3. The CAP-induced OSCC cell death is rescued by miRNA mimics. (A, B) NOK treated with miR-31 inhibitor or mimic. (A) miR-31 expression analyzed by qPCR. (B) NOK survival following 5s – 30s CAP treatment, in the presence of miR-31 inhibitor or mimic. (C) The OSCC cell survival following 10s CAP treatment, in the presence of miR-21, miR-31, miR-146a or miR-211 mimic. Upper, SAS; Lower, FaDu. (D) The OSCC cell survival following 10s CAP treatment (Upper) or 15s CAP treatment (Lower), in the presence of solitary miR-31 or miR-211 miRNA mimic, or their combination. Scr, scramble control.
Preprints 87614 g003
Figure 4. CAP inactivates AKT and ERK signals in SAS cells. (A; B, Rt) Western blot analysis. Cells are transfected with AKT or ERK overexpression plasmid or VA plasmid. The endogenous and exogenous expression along with phosphorylation of AKT and ERK 2 h after CAP treatment are analyzed. (A) 5s or 10s CAP treatment. (B, Rt) 10s CAP treatment. (B, Lt) Cell survival following the signal activation and CAP treatment being shown in (B, Rt). (C – E) miRNA expression 24 h later following signal activation and 10s CAP treatment. (C) miR-21, miR-31, miR-187 and miR-211 expression. (D) miR-134 expression. (E) miR-146a expression. oe-, transient overexpression; VA, vector alone control; p, phosphorylated; t-, total.
Preprints 87614 g004
Figure 5. CAP treatment inhibits the growth of SAS xenografts in nude mice. (A) Schema to illustrate the grouping, number of mice, CAP treatment regimen, and the assays performed on the tumors and mice. a, control; b, c, one-shot CAP treatment performed at 6 or 6.5 week; e, f, two-shot CAP treatment performed at 6 and 6.5 week. (B) Tumor volume. (C) Body weight. (D) Serum biochemistry. (E) Representative histopathological diagrams of tumor sections. Upper, HE-stained tissue section. Lower, Ki-67 immunohistochemistry of the consecutive sections. Arrows indicate necrosis. Number, amplification fold. (F) The summary of miRNA expression from four control tumors and four tumors receiving one-shot CAP treatment. Detailed data are integrated in Figure S4. (G) Western blot analysis on control tumors, and tumors receiving one-shot or two-shot CAP treatment (two tumors in each group). Lt diagram encompasses AKT and ERK analysis. Note the absence of ERK activation in tumors. Rt diagram encompasses the concordant tissue and cell analysis within a blot to confirm the lack of ERK activation in tumors. The exposure time of t-ERK panel for the Rt diagram is shorter than that for Lt diagram. oe-, transient overexpression; VA, vector alone control; p, phosphorylated; t-, total.
Preprints 87614 g005
Disclaimer/Publisher’s Note: The statements, opinions and data contained in all publications are solely those of the individual author(s) and contributor(s) and not of MDPI and/or the editor(s). MDPI and/or the editor(s) disclaim responsibility for any injury to people or property resulting from any ideas, methods, instructions or products referred to in the content.
Copyright: This open access article is published under a Creative Commons CC BY 4.0 license, which permit the free download, distribution, and reuse, provided that the author and preprint are cited in any reuse.
Prerpints.org logo

Preprints.org is a free preprint server supported by MDPI in Basel, Switzerland.

Subscribe

© 2024 MDPI (Basel, Switzerland) unless otherwise stated