Introduction
In recent years, genomic research has increased in popularity. There is a need for an economically friendly and obtainable, easily conjugated, and highly functional particle that can visualize chromosomes. A promising way to achieve this would be through the usage of quantum dots (QD). QD is an emerging technology, and it is promising for sensitive bioanalysis and bioimaging. They are 1-10 nanometers in size and highly promising in terms of optical properties. Because they are very concentrated in a small volume and have relatively small number of atoms (around 100s-1000s), they are also referred to as artificial atoms. (Desmond et al., 2021).
Carbon Quantum Dots
Carbon and its allotropes have been frequently studied in recent years because they are easy, convenient, and cost-effective. One of the areas where carbon is applied at the nanotechnological level is carbon quantum dots (CQDs). CQDs have important properties: good biocompatibility, non-toxicity, significantly high thermal, fluorescent, water-soluble, and highly chemically stable (Iravani, 2011; Mohammadinejad et al., 2016). Since carbon is a widely used element in nature, it is found in the most readily-available materials and therefore cost-effective. CQDs can be studied and optimized for bioimaging because of their carbon-based chemical structure as well as their properties. These features have made CQDs popular in the field of bioimaging in recent years.
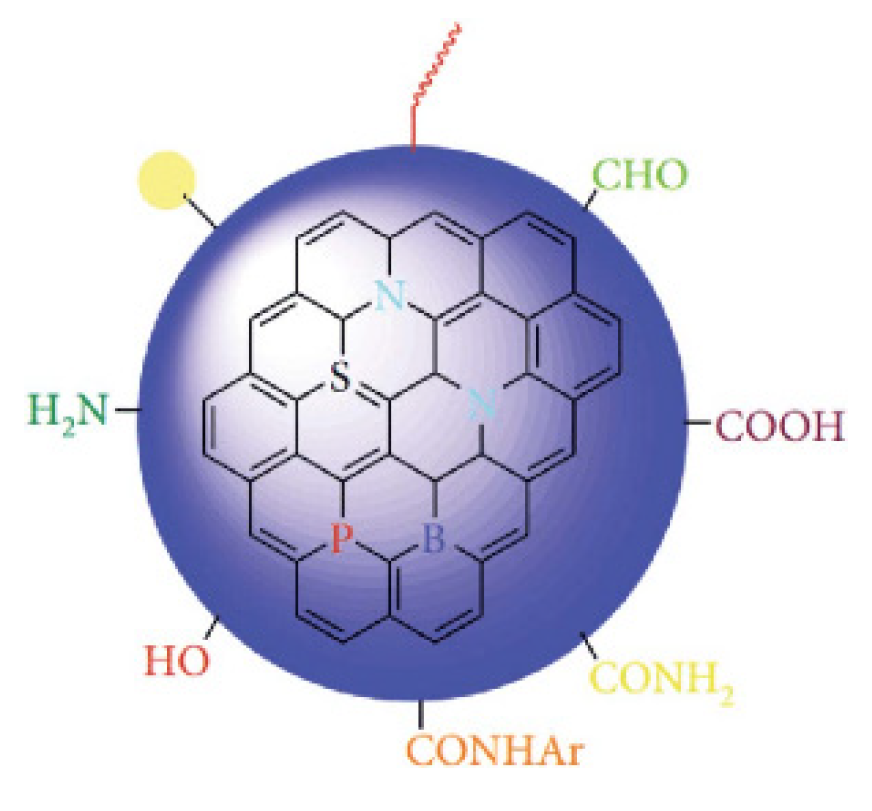
As seen in
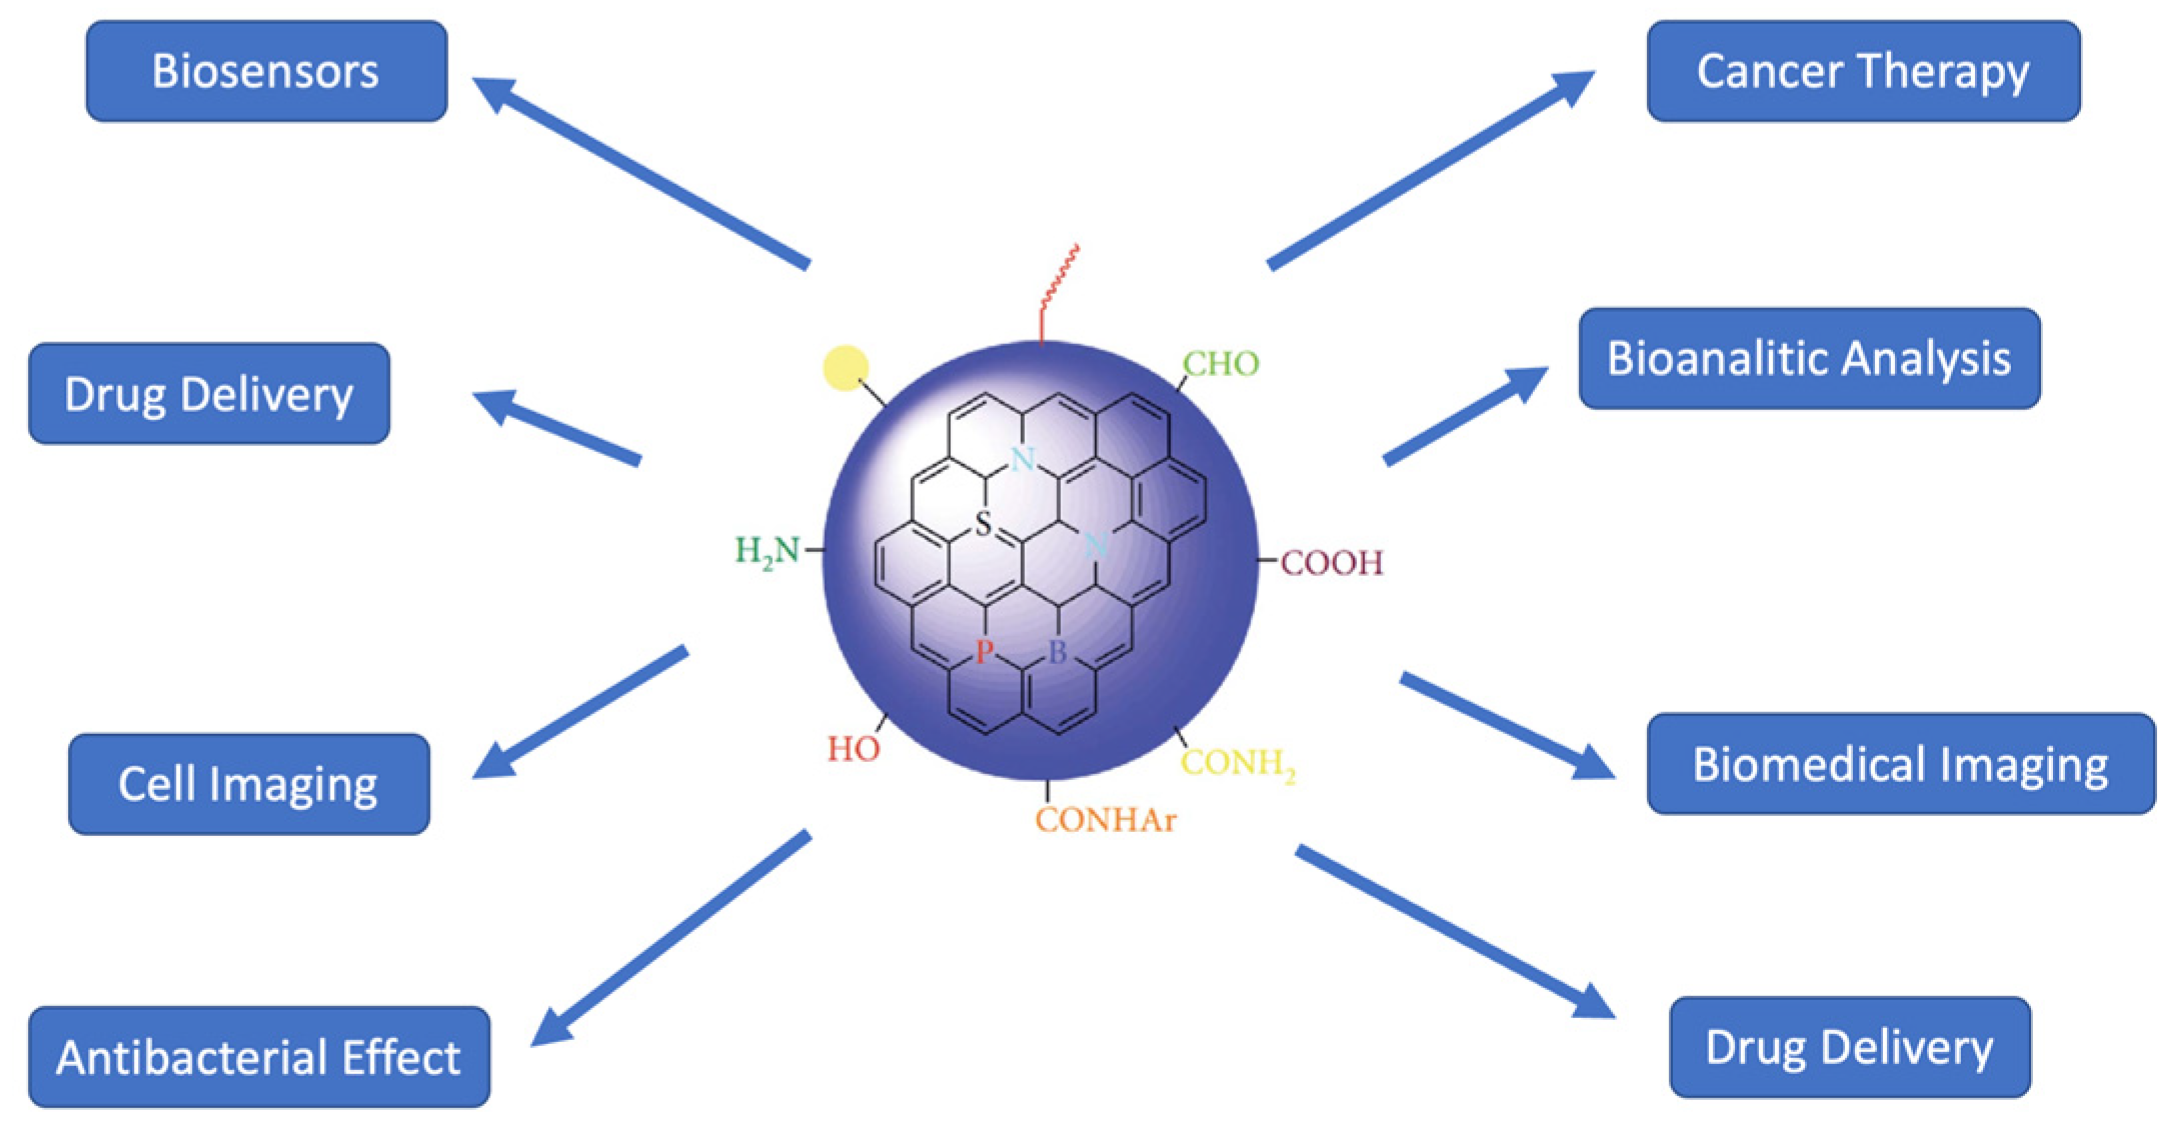
Figure 1, the chemical structure of CQDs is very open to modification. These modifications may include the addition of antibiotics, carboxyl groups, drug molecules, proteins, and fluorescent dyes. Due to their high fluorescence properties, stability, and ease of production, CQDs have been and are widely preferred in bioimaging. CQDs aren’t only limited to bioimaging. Researchers have used them in drug delivery and gene therapy, bioanalytical/biomedical assays, cell imaging, biomedical imaging, antibacterial action, and gene delivery. For instance, a different functional group attached to carbon quantum dots can impart desired properties for tracing, which emerges as an alternative role that can be used in antibacterial and cancer treatment (Azam et al., 2021). These alternative fields for the usage of CQDs are illustrated in
Figure 2.
Synthesis Methods of CQDs
CQDs can be made from various readily-available crops, for example: walnut, watermelon, and orange peel. In this study, Raphanus sativus was used. The nitrogen percentage is approximately 2.5% (Durak et al., 2019), and it is suitable for mass production due to its low cost and wide availability.
CQDs are produced by two main methods: top-down and bottom-up. The top-down method is the separation of mass particles into smaller pieces by energizing them with various mechanical and chemical methods (Gürmen et al., 2008). Examples of this method are laser ablation, arc discharge, electrochemical techniques, and high-energy ball milling. In the bottom-up method, CQDs are produced from molecules using chemical methods (Ateş et al., 2015). Examples of this method are hydrothermal, solvothermal, microwave-assisted, ultrasonic-assisted, combustion, and chemical vapor deposition methods (Başkaya et al., 2021).
Usage of CQDs on Cancer and Cellular Bioimaging
Previous research has shown that CQDs are useful in tumor cell imaging and therapy. Since CQDs do not contain metal atoms, they do not have a toxic effect in vivo. In addition, the high photoluminescence properties of CQDs and the emittance spectrum based on their sizes increase the possibility of using these nanoparticles in tumor imaging. In particular, it has been reported that small particles emit high energy, appearing bluer, but larger particles emit low energy and appear red (Medintz et al., 2005). It has shown that if CQDs are developed, they can penetrate through tumor blood vessels and reach the targeted tumor cell. (Choppadandi et al., 2021) Because CQDs come in different sizes and colors, the size of the tumor can be determined by the color of the CQD attached to it. This could enable semi-quantitative visualization of tumors. Similarly, functionalized CQDs are useful in imaging targeted cells by binding to specific cell receptors. CQDs can also be developed as the linker that puts cancer cells and drugs in proximity due to their binding abilities.
Nitrogen-doped carbon Quantum Dots
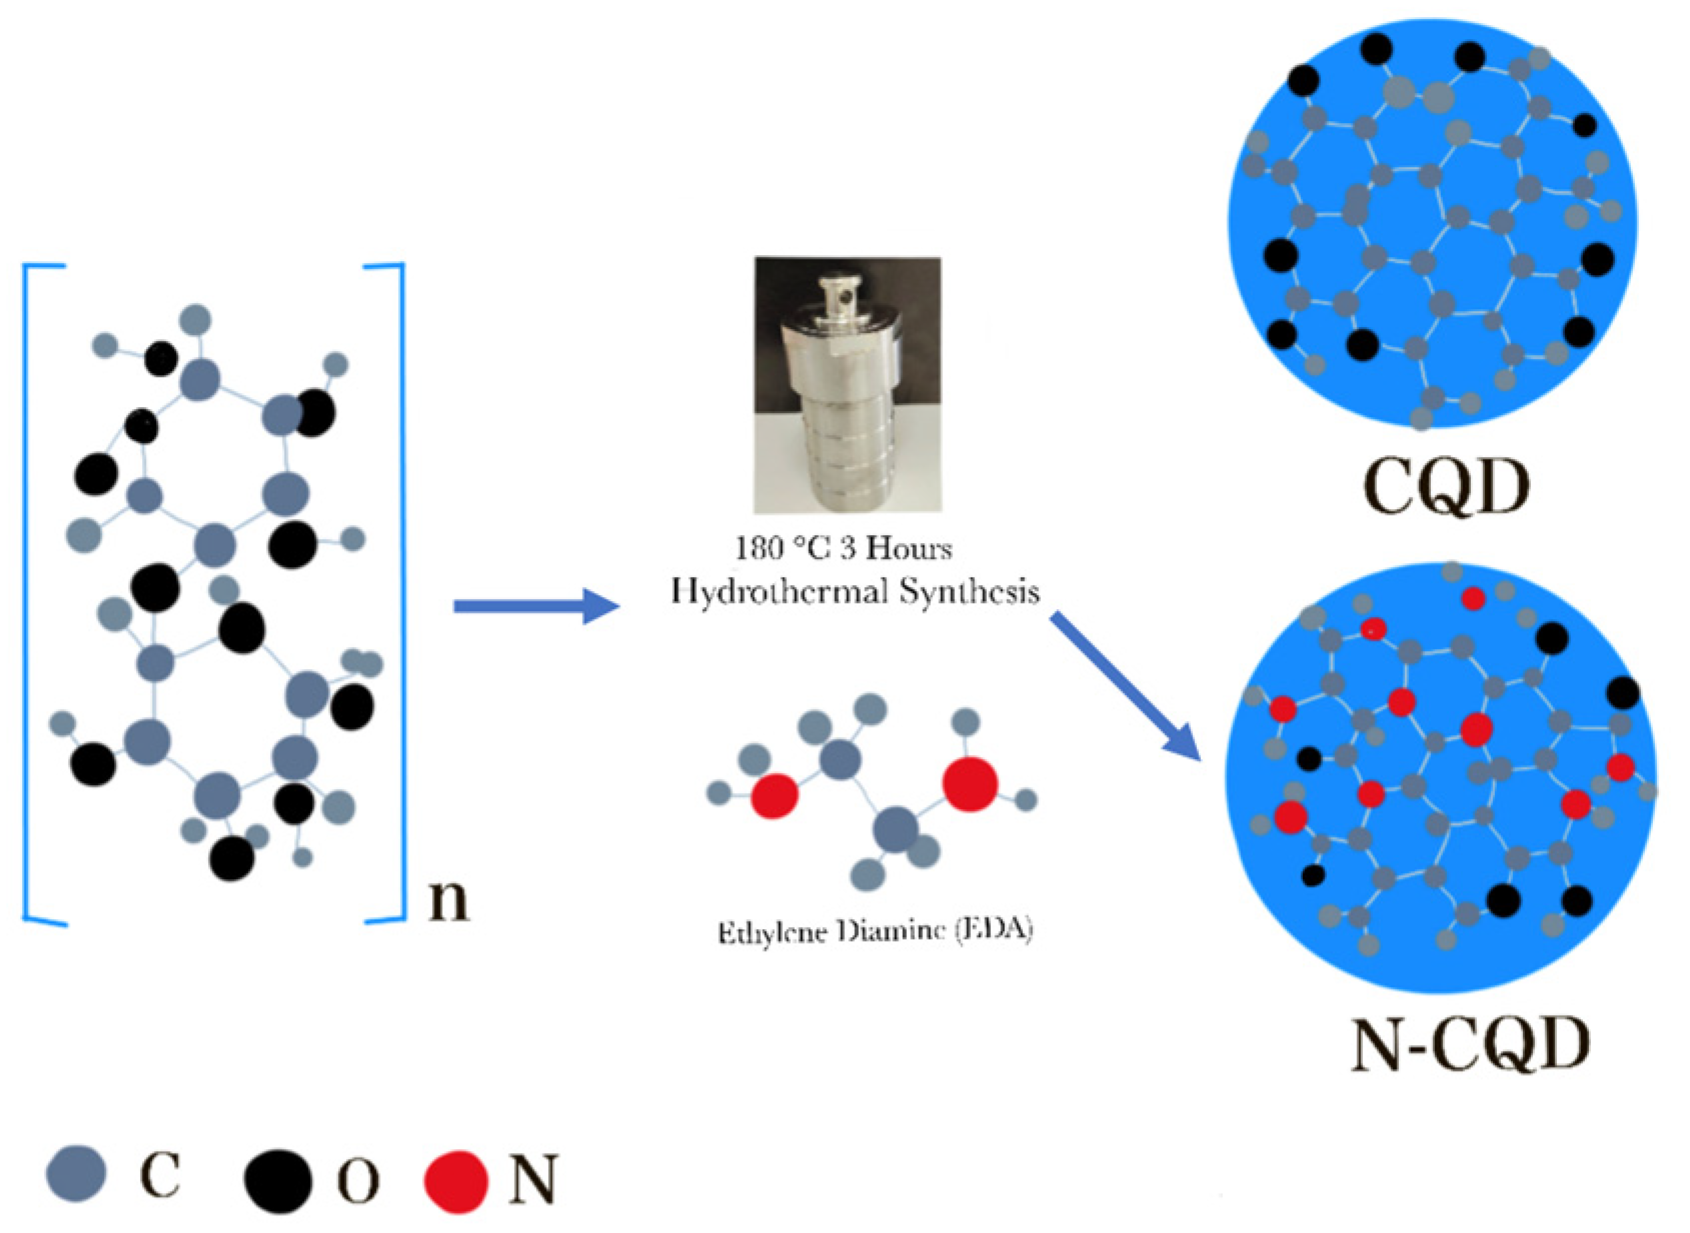
N-CQDs were produced by adding nitrogen (N) to the CQDs (
Figure 3). If CQDs are conjugated with different nitrogen-containing compounds, the imaging properties, quantum yield, photostability, and fluorescence properties of carbon quantum dots can be significantly increased.
CQD’s Usage on Cellular Bioimaging in Previous Studies
In a study by Choppadandi et al (2021), CQDs produced from citric acid were used for tumoroid imaging on breast cancer cells. DAPI was used comparatively in these experiments. Considering the results obtained, CQDs generated better imaging data due to their ability to bind to chromatin in higher concentrations compared to DAPI dye. Some important points to take note of when using CQDs in bioimaging is that 1) CQDs with a radius greater than 4nm could not enter the cell and 2) in another study by Prasad et al. (2016) showed that walnut shells do not have a toxic effect on cell viability. Cell nuclei staining with CQDs was also tested in this experiment. In another experiment by Ci et al. (2017), HeLa cells were imaged during interphase using N-CQDs chromosome staining, which indicates that the CQDs are able to enter the nucleus.
Although carbon quantum dots have been investigated, they are not actively used in chromosome research due to the limited amount of research done. Therefore the purpose of this study is to obtain carbon quantum dots from radish starting material, which can be found easily and is thought to be efficient in bioimaging due to the high amount of nitrogen in it, to increase its fluorescence values by adding nitrogen, to investigate the usability of the obtained N-CQDs in chromosome imaging and to successfully compare to DAPI staining technique.
Results
Successful synthesis of N-CQDs and characterization
This is the first attempt to create N-CQDs from
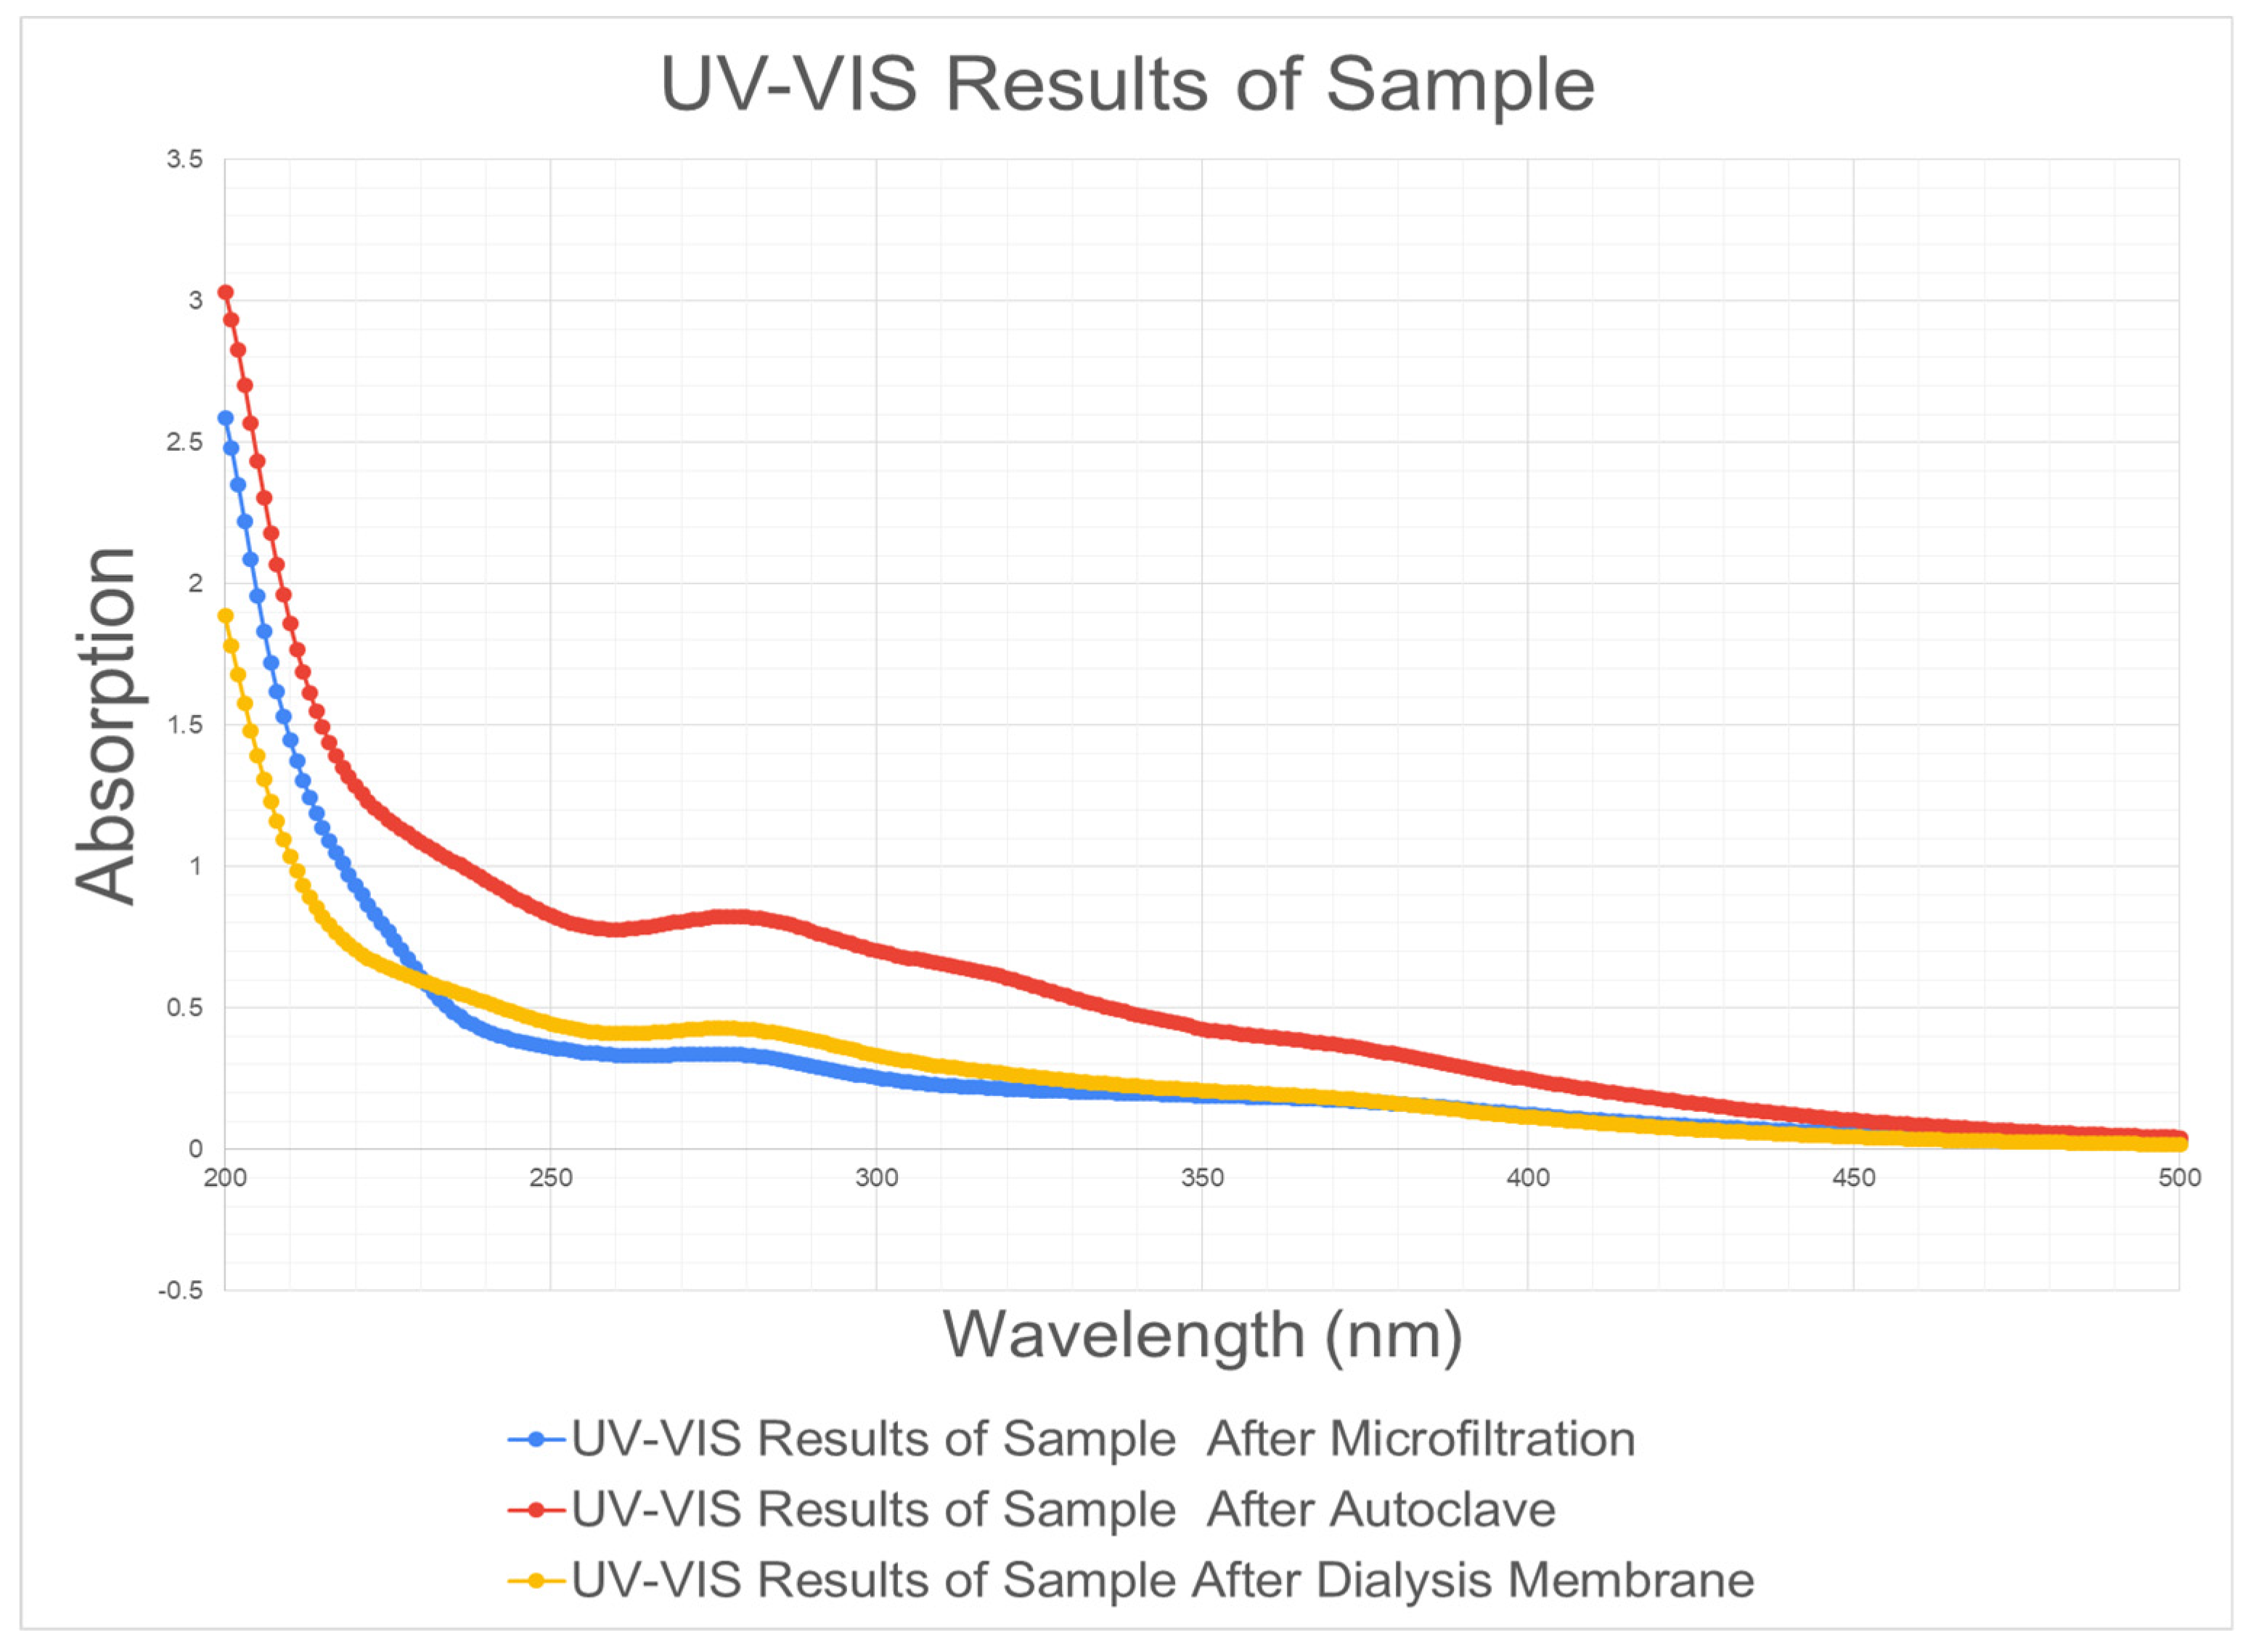
Raphanus sativus. The liquid biomass was extracted using a blender, and subsequently filtered. Ethylenediamine was added and the mixture was incubated and ultrasonicated. This mixture was then placed in an autoclave oven for 180 ◦C for 3 hours. Lastly, the mixture was centrifuged and filtered. Throughout the protocol steps, the mixture’s characteristics were documented through UV-VIS and visual observations (
Figure 5 and
Table 1). The illustration of the steps is provided in
Figure 4.
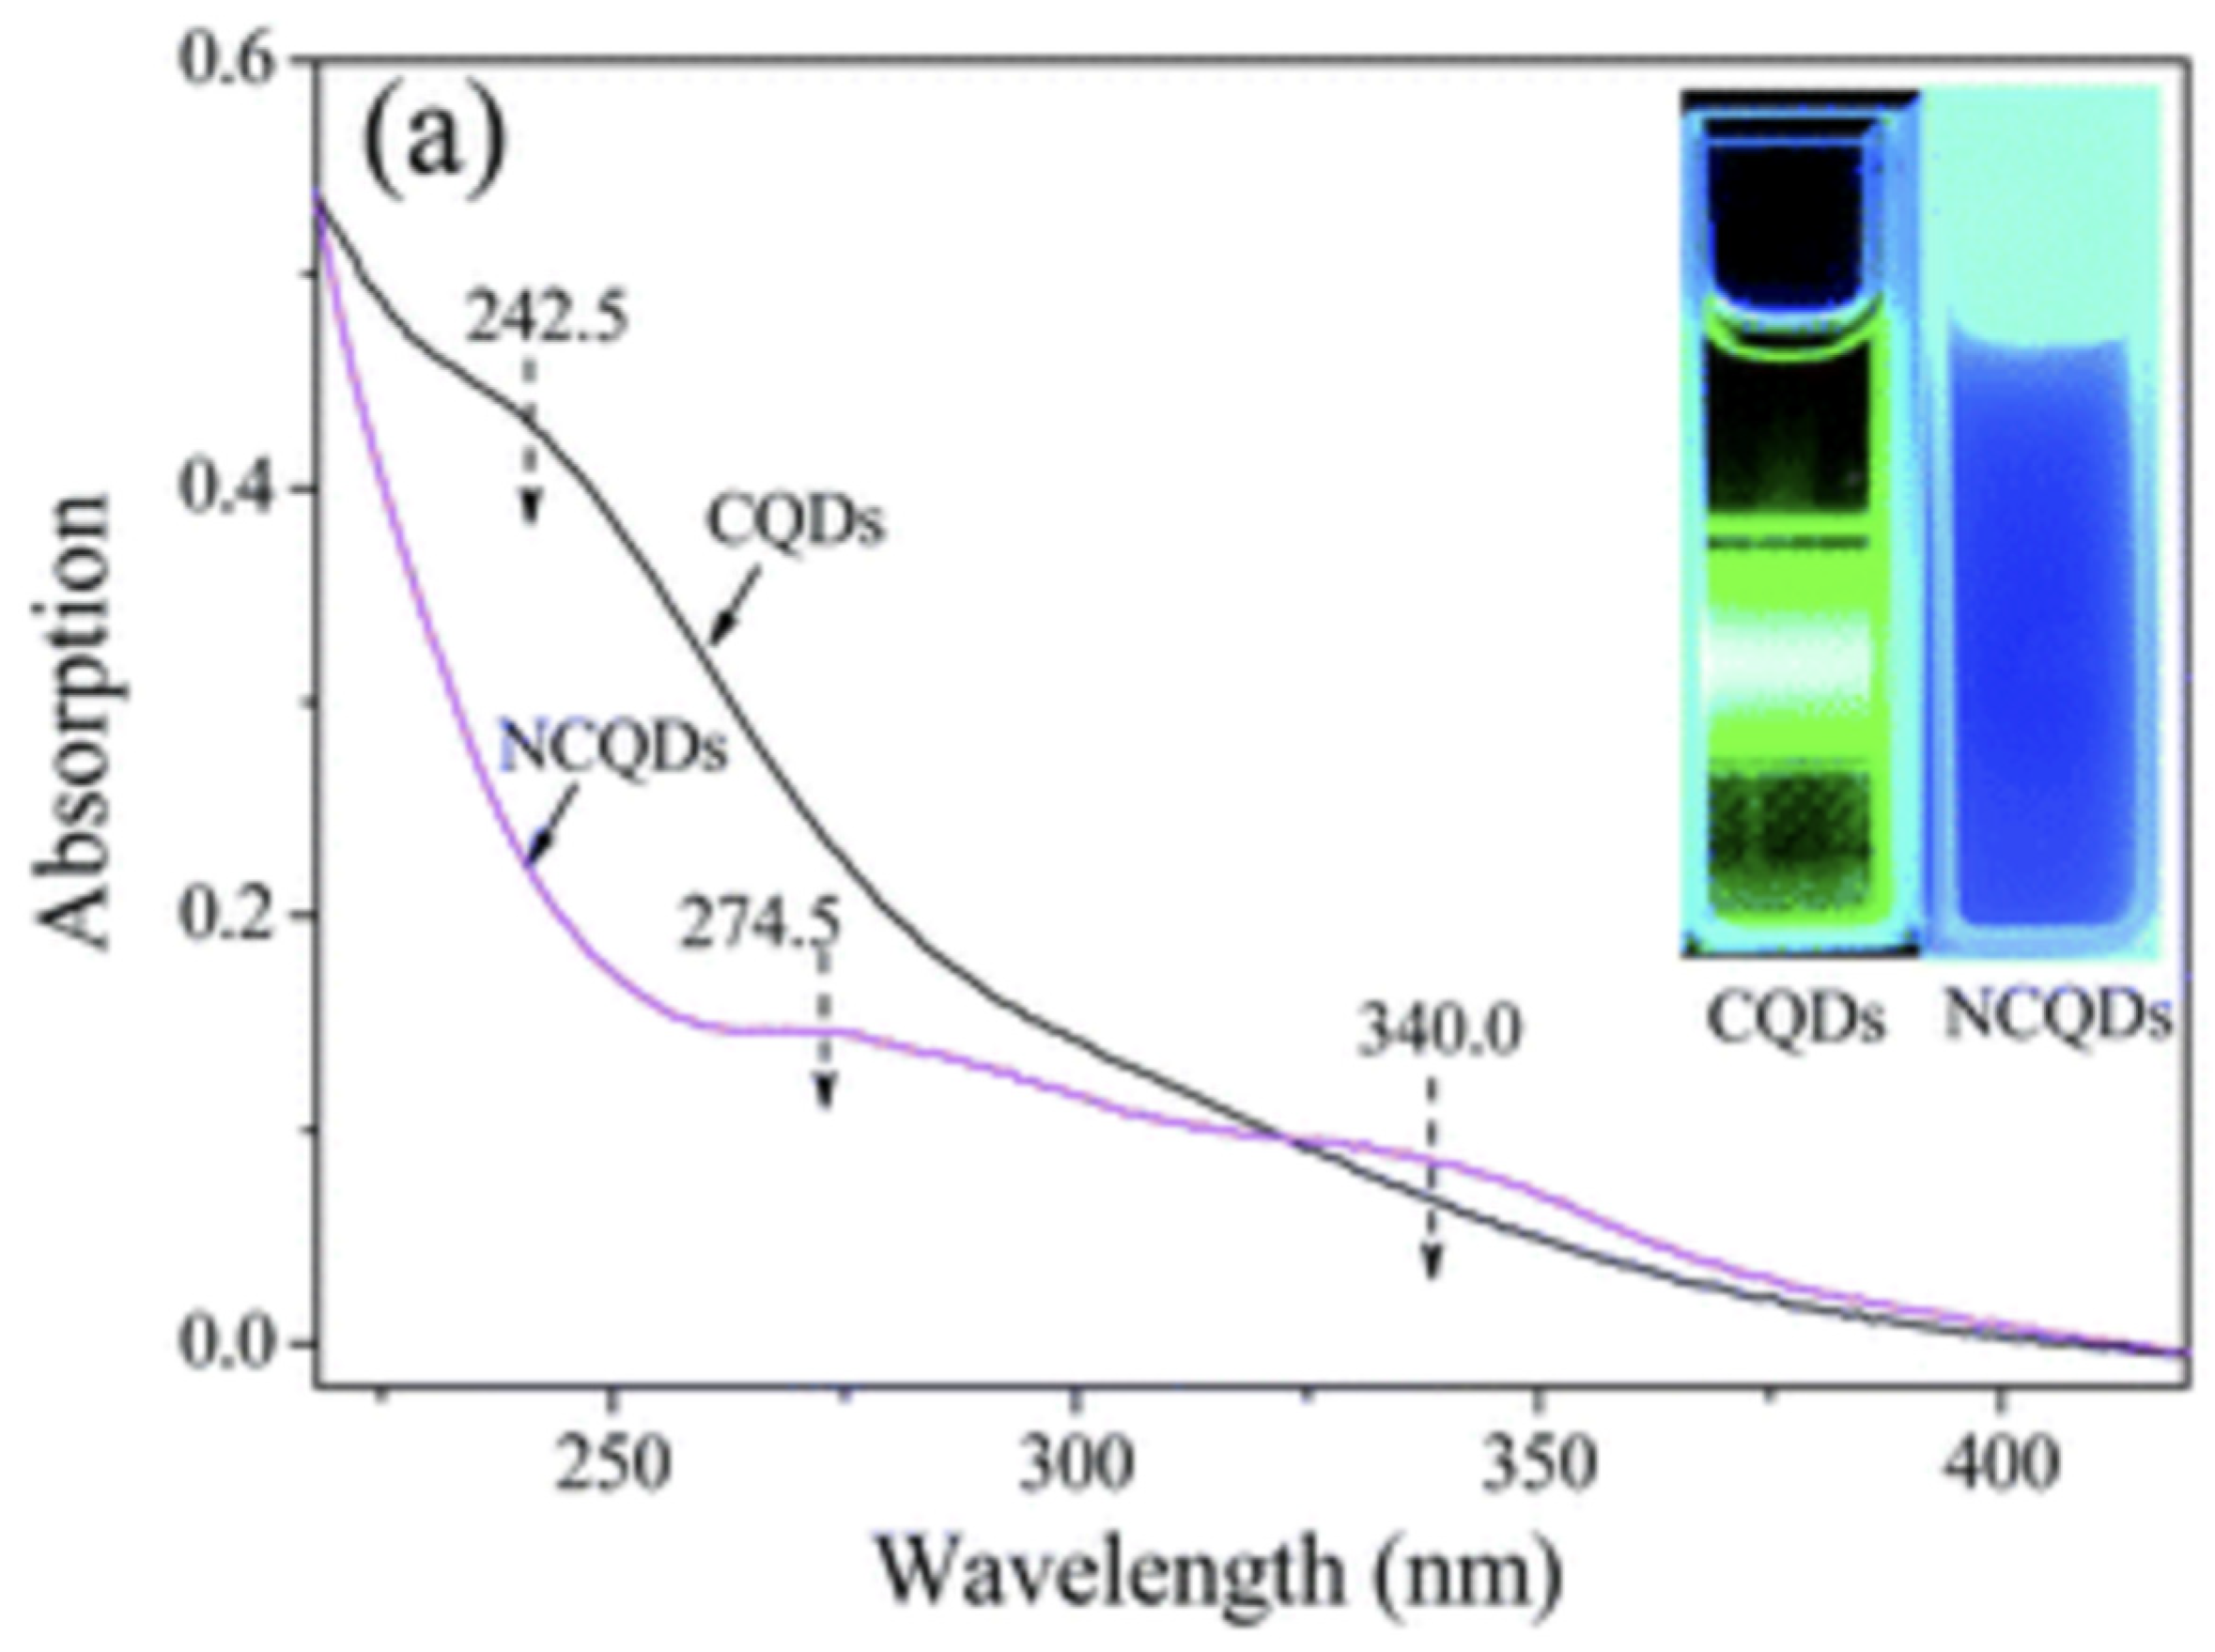
The synthesized N-CQDs were characterized using the UV-VIS and the absorbance peak was found to be 277 nm (
Figure 5), which is comparable to the absorbance peak of previous literature demonstrated in
Figure 6 (around 274.5 nm).
In
Table 1, pictures of the products obtained during the production process of N-CQDs are presented. The samples prepared for analysis are as seen in the table.
N-CQDs application in chromosome imaging
Lymphocyte cell lines were cultured, and additional steps, such as the addition of Sol A, Sol B, or Colchemeid were completed. After centrifuge and the addition of KCL, the supernatant was removed and cell lines were left to age.
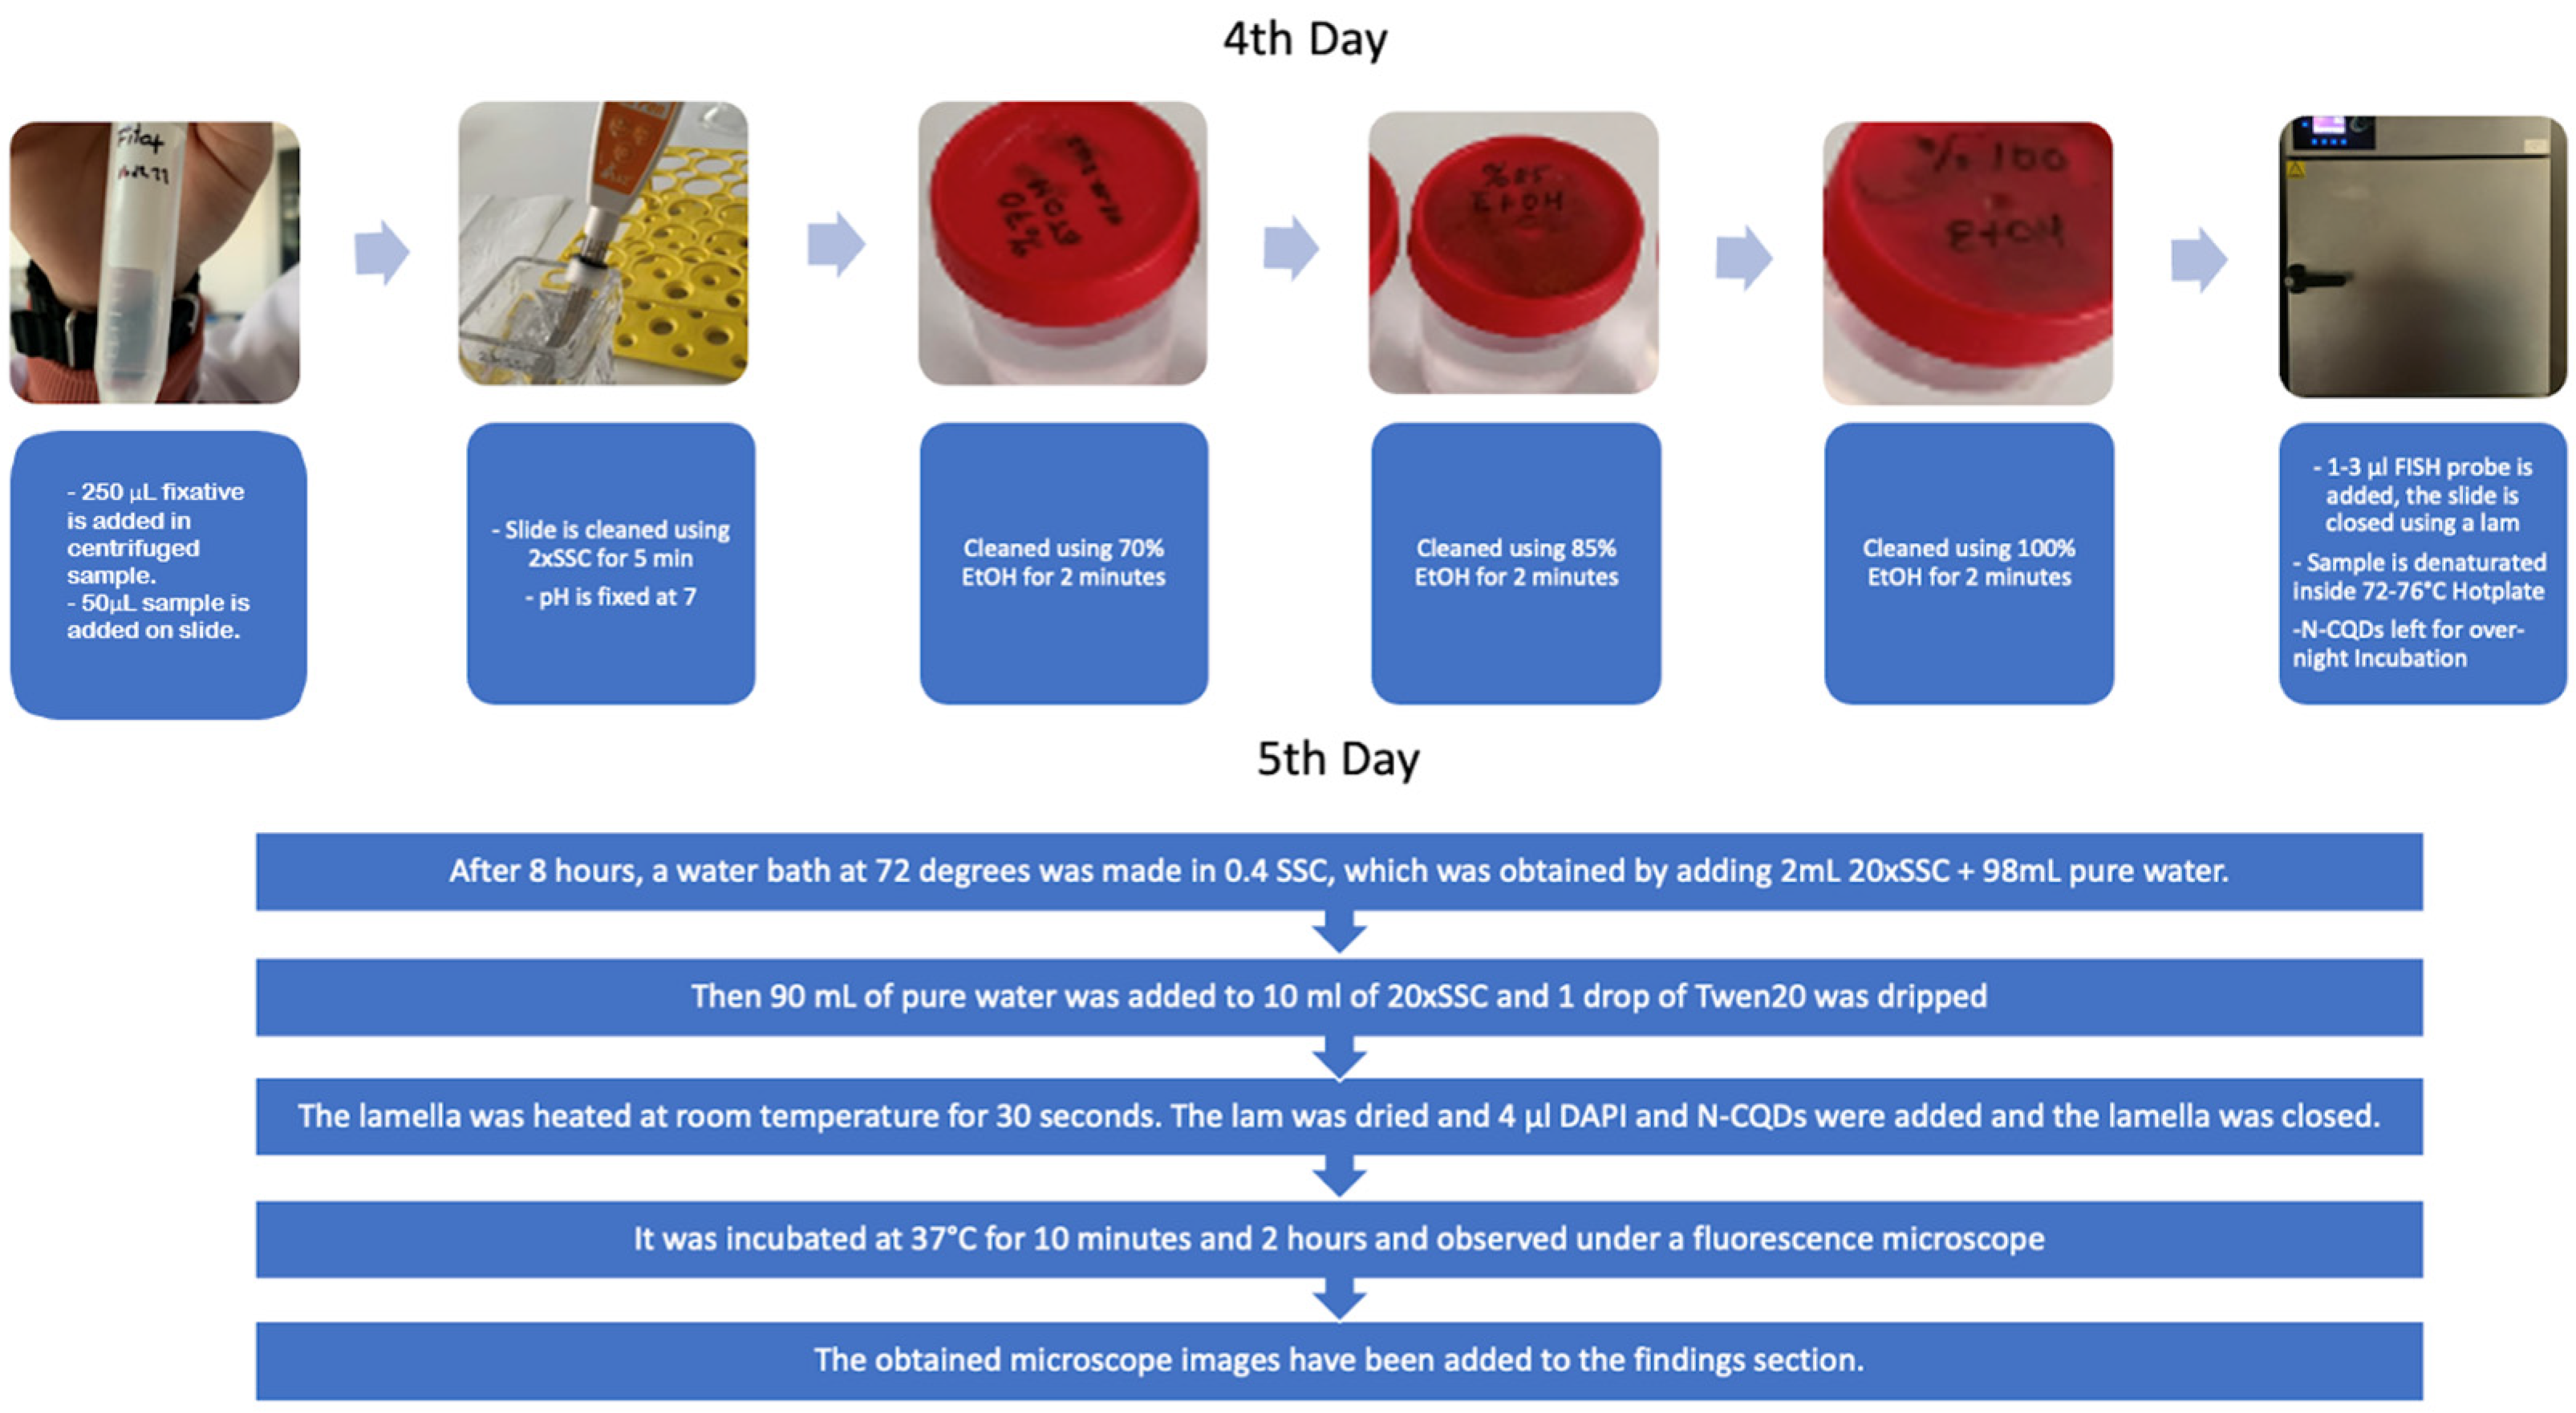
From this cell culture, the nucleus and chromosomes were extracted from the cell, and the cell was prepared for chromosome imaging using the FISH technique. The slides with the cells were washed with SSC salt. The slides were placed in a FISH hybridization box and left to incubate overnight. After the addition of SSC and Tween20, the N-CQDs and DAPI were added to the different slides and incubated for 10 minutes and 2 hours. The slides were then imaged under a fluorescence microscope. The steps are provided in
Figure 7.
Fluorescence properties and comparisons
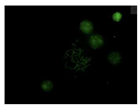
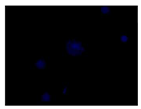
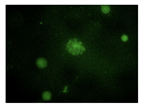
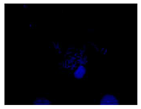
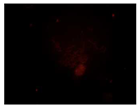
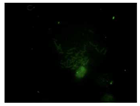
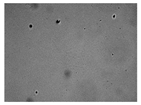
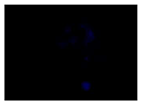
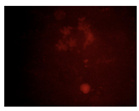
When the acquired images were examined and compared with the DAPI control, where we see a higher intensity for N-CQDs, however, their resolution was lower. (
Table 2) This meant that N-CQDs were not able to produce images with good resolution after 10 minutes. Additionally, the images produced using N-CQDs as a dye were fading and blinking constantly. There are several potential reasons for the current inferior performance of N-CQDs generated with the protocol. These reasons are: the inability to standardize the size of the N-CQDs, the inability to adjust the density, the inherent challenges of nuclei stacking on top of each other resulting in poor imaging resolution, and the possible longer incubation time requirement.
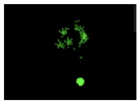
After the incubation for 2 hours, N-CQDs’ resolution was improved, whereas DAPI dye’s images established less resolution. N-CQDs have excitation and emission values between DAPI and FITC. N-CQDs emitted red light (630 nm) when green light (532 nm) was sent, green light when blue light (465 nm) was received, and blue light (465 nm) when light blue light (<465 nm) was received. Even though this is similar to how DAPI dye behaves, N-CQDs’ spectrum is assumed to be in between DAPI and FITC because N-CQDs perform better than DAPI when it comes to emitting green fluorescence.
Furthermore, it was also observed that the rapid blinking of N-CQDs decreased after two hours. This meant that for N-CQDs to attach to chromosomes, 2 hours was more optimal than 10 minutes. Considering that N-CQDs are more economical and have an easy-to-produce method, N-CQDs may be useful, albeit with longer incubation times.
Conclusion and Discussion
The project set out to produce CQDs from a radish biomass source in an economical manner. The CQD was then modified with nitrogen to increase their fluorescence properties. The absorbance peak of the synthesized N-CQDs in the UV-VIS spectrophotometer is compatible with the literature (Wu et al., 2017).
After 10 minutes of incubation, the images N-CQDs showed strong staining intensity, however, it lacked resolution. It was also observed that after 10 minutes of incubation, the fluorescent staining produced by N-CQDs were fading quickly. After 120 minutes of incubation, produced N-CQDs produced significantly better images in terms of both intensity and resolution.
The N-CQDs were able to generate fluorescence across the spectrum, and the results after 120 minutes showed that the N-CQDs reflected more green light than DAPI, hence, could be a better bioimaging dye compared to DAPI under FITC filters.
There are engineering challenges with synthesizing N-CQDs since the particle size is dependent on the environment. There is also an inability to control the density at the moment. The NCQDs also differ from DAPI in incubation time, 10 min vs 120 min. However, this could also be due to the quality of the cells used in this project. In addition, N-CQDs are not optimal for TXRED filter imaging since the chromosomes weren’t resolved clearly. This situation can be considered as one of the difficulties provided by the use of N-CQDs in bioimaging. Nevertheless, N-CQDs showed significantly better images under the FITC filter compared to DAPI.
Due to all the findings obtained, it has been shown that genomic DNA can be bioimaged using N-CQDs produced from radish. This could have potential uses in genetic research and diagnosis.
Future Directions
Future work may seek to standardize the sizes of N-CQDs. N-CQDs tend to clump together and are difficult to control. The density of N-CQDs was more uncertain compared to the DAPI. This is a feature of N-CQDs that will be developed during staining in future studies. This is also one reason why N-CQDs have not been able to go into mass production.
In addition, one of the biggest disadvantages of N-CQDs produced in this project and previous projects is the incubation time. In a short duration, some may argue that N-CQDs do not produce good staining images. However, when incubated for a longer duration, we see a drastic improvement over DAPI. In future studies, a new method can be developed that will reduce the incubation time of N-CQDs in the cell. This can be due to the time CQDs take to get into the nucleus, or the time they take to bond with the DNA.
The production of nitrogen-doped carbon quantum dots from different biomass sources can be improved by considering different parameters (method, parts of the source plant, doped nanoparticles, etc.). In this way, bioimaging and diagnostic applications can be made more stable and effective.
Thanks to an antibody that can be added to the activated surface of N-CQDs through conjugation chemistry, N-CQDs can be tried to be used on cell labeling. The labeled cells can be incubated, and after 2 hours they can be used under fluorescent microscopy. Eventually, this can help with imaging of translocation activities (for instance t(9;22)) on chromosomes, which can be an innovative way for cancer diagnosis.
The interaction of N-CQDs with different molecules can also be predicted using machine learning and cheminformatics, which can be used to develop N-CQDs with new binding properties.
Method
Chemicals, Materials and Apparatus Used
Raphanus sativus (public market), Ethylenediamine (EDA, for amine function, > 98.0% SigmaAldrich Inc.), Hydrothermal Reactor-Teflon Autoclave (100 mL), Oven (Core FN400), Centrifuge (Electromag M19 PII Microhematocrit Centrifuge), Dialysis Membrane (500–1000 MWCO), Syringe filter (0.22 µm, Millex-GV), Magnetic Heater Stirrer (MS300HS Hot&Stire, Weighing Scale (TellInsrumentLabPro LP210A), Ultrasonic bath (Isolab, 6L), UV -VIS Spectrophotometer (Model:CARY 100SCAN), Micro Pipette (Across Pro), Beakers, Erlen meyers, Filter Paper, Funnel, Lymphocyte Cells from METAGENTECH Genetic Diseases Research Center, 100% Roswell Park Memorial Institue Media (4 ◦C), %10 Fetal Bovine Serum (-20 ◦C), Pensilin Streptomisin 2.5% (-20 ◦C), Phytohemoglutinin 2.5% (-20 ◦C), Methyl Alcohol (> 99.0% SigmaAldrich Inc.), Ethyl Alcohol (> 99.0% SigmaAldrich) Inc.), Acetic Acid (> 99.0% Merck), DAPI, Coverslip, Slide, Invert Microscope, Fish Hybridization Box (Cytocell, Multiprobe), Fluorescent Microscope (Nikon), 20xSSC solution, Purified water, Sol A, Sol B, Colchemeid , KCl (> 99.0% Merck), Tween20.
Synthesis Steps of N-CQDs
To obtain a carbon quantum dot from a biomass source of radish (Raphanus sativus), The source of radish biomass was obtained from the public market and its juice was extracted using a blender. 100 mL of radish juice was first filtered using filter paper, and 2 mL of ethylenediamine (EDA) was added to the resulting liquid. This mixture was stirred in a magnetic stirrer for half an hour, and then kept in an ultrasonic bath for 10 minutes. This mixture was placed in a Teflon autoclave. Afterward, it was placed in an autoclave oven and kept at 180 ◦C for 3 hours. The mixture was removed from the autoclave after cooling. This mixture was spun down in a centrifuge (13000 rpm, 15 minutes). The obtained substance was filtered using a 0.22 µm filter using a syringe. The flow-through was put inside a 500 (500–1000 MWCO) dialysis membrane for 24 hours for further filtration.
Culturing Lymphocytes and Nuclei Extraction
500 µl of lymphocyte cell lines were cultured in the media with phyto at 37°C for 72 hours. On the 2nd day, 80 µl Sol A was added to the culture, and on the 3rd day 80 µl Sol B was added. Then, 100 µl of Colchemeid was added and the culture was incubated in an oven for 30 minutes. After 30 minutes, the cells were centrifuged at 500 g for 5 minutes, the supernatant was discarded and the pellet was collected. After 30 minutes, 37°C KCl (8-10mL) was added to the pellet and subsequently vortexed in heavy drop form. It was incubated for 10 minutes in the oven at 37°C degrees, it was then removed from the oven and centrifuged at 500 rpm for 5 minutes, the supernatant was discarded and the pellet was removed. It was fixed for 4 times and stored in the fridge (-20°C) for 3-4 days before imaging.
Sample Prep for Imaging under Fluorescent Microscope
The old fixative was removed and the new fixative was added. 15 mL methanol and 5 mL acetic acid were used for further fixative. 250 µl of fixative was dropped on both sides of the slide containing the samples and the liquid was spread across the slide. The slide was left to dry and a 2xSSC solution was prepared meanwhile. 90 mL of distilled water was added to 10 mL of 20xSSC salt. HCl acid was used to equalize the pH of the 2xSSC to 7.0. The slide was kept in the 2xSSC for 5 minutes. Then, the slide was kept in 70%, 85%, and 100% ethyl alcohol concentrations for 2 minutes, respectively. The preparation was placed in a FISH hybridization box moistened with opaque distilled water and incubated at 37 degrees overnight. After 8 hours, a 72°C water bath was made in 0.4x SSC obtained by adding 98 mL of distilled water onto 2 mL of 20x SSC. Then, 90 mL of distilled water was added onto 10 mL of 20x SSC and 1 drop of Tween20 was added. The coverslip was heated at room temperature for 30 seconds. The slide was dried and 4 µl of DAPI and N-CQDs were added and covered with a coverslip. It was incubated at 37°C for 10 minutes and up to 2 hours. The incubated slide was observed under a fluorescence microscope at 10 minutes and at 2 hours.
References
- Ateş, H., & Bahçeci, E. (2015). Nano malzemeler için üretim yöntemleri. Gazi University Journal of Science Part C: Design and Technology, 3(2), 483-499.
- Azam, N., Najabat Ali, M., & Javaid Khan, T. (2021). Carbon quantum dots for biomedical applications: review and analysis. Frontiers in Materials, 8, 700403. [CrossRef]
- Atchudan, R., Edison, T. N. J. I., Perumal, S., Selvam, N. C. S., & Lee, Y. R. (2019). Green synthesized multiple fluorescent nitrogen-doped carbon quantum dots as an efficient label-free optical nanoprobe for in vivo live-cell imaging. Journal of Photochemistry and Photobiology A: Chemistry, 372, 99-107. [CrossRef]
- Atchudan, R., Edison, T. N. J. I., Perumal, S., Vinodh, R., & Lee, Y. R. (2019). Betel-derived nitrogen-doped multicolor carbon dots for environmental and biological applications. Journal of Molecular Liquids, 296, 111817. [CrossRef]
- Azam, N., Najabat Ali, M., & Javaid Khan, T. (2021). Carbon quantum dots for biomedical applications: review and analysis. Frontiers in Materials, 8, 700403. [CrossRef]
- Başkaya, S. K., & Çeşme, M. Synthesis of N-Doped Carbon Quantum Dots by Hydrothermal Synthesis Method and Investigation of Optical Properties. Türk Doğa ve Fen Dergisi, 10(2), 206-211. [CrossRef]
- Başkaya, S. K., & Çeşme, M. Synthesis of N-Doped Carbon Quantum Dots by Hydrothermal Synthesis Method and Investigation of Optical Properties. Türk Doğa ve Fen Dergisi, 10(2), 206-211. [CrossRef]
- Choppadandi, M., Guduru, A. T., Gondaliya, P., Arya, N., Kalia, K., Kumar, H., & Kapusetti, G. (2021). Structural features regulated photoluminescence intensity and cell internalization of carbon and graphene quantum dots for bioimaging. Materials Science and Engineering: C, 129, 112366. [CrossRef]
- Ci, J., Cao, C., Kuga, S., Shen, J., Wu, M., & Huang, Y. (2017). Improved performance of microbial fuel cell using esterified corncob cellulose nanofibers to fabricate air-cathode gas diffusion layer. ACS Sustainable Chemistry & Engineering, 5(11), 9614-9618. [CrossRef]
- Das, R., Bandyopadhyay, R., & Pramanik, P. (2018). Carbon quantum dots from natural resource: A review. Materials Today Chemistry, 8, 96-109. [CrossRef]
- Desmond, L. J., Phan, A. N., & Gentile, P. (2021). Critical overview on the green synthesis of carbon quantum dots and their application for cancer therapy. Environmental Science: Nano, 8(4), 848-862. [CrossRef]
- Durak, A. ve Emir, C., (2019), Bor Gübrelemesinin Turp (Raphanus sativus L.) Bitkisinin Verim ve Bazı Bitki Özelliklerine Etkisi. Gaziosmanpaşa Bilimsel Araştırma Dergisi, 8(2), 58-65,.
- Fang, M., Peng, C. W., Pang, D. W., & Li, Y. (2012). Quantum dots for cancer research: current status, remaining issues, and future perspectives. Cancer Biology & Medicine, 9(3), 151. [CrossRef]
- Gürmen, S., Ebin, B., & İtü, M. (2008). Nanopartiküller ve üretim yöntemleri-1. Metalurji Dergisi, 150, 31-38.
- Iravani, S. (2011). Green synthesis of metal nanoparticles using plants. Green Chemistry, 13(10), 2638-2650. [CrossRef]
- Kouwenhoven, L. P., Marcus, C. M., McEuen, P. L., Tarucha, S., Westervelt, R. M., & Wingreen, N. S. (1997). Electron Transport in Quantum Dots (Mesoscopic Electron Transport, Kluwer Series E 345) ed LL Sohn et al.
- Kumar, P., Dua, S., Kaur, R., Kumar, M., & Bhatt, G. (2022). A review on advancements in carbon quantum dots and their application in photovoltaics. RSC advances, 12(8), 4714-4759. [CrossRef]
- Medintz, I. L., Uyeda, H. T., Goldman, E. R., & Mattoussi, H. (2005). Quantum dot bioconjugates for imaging, labelling and sensing. Nature materials, 4(6), 435-446. [CrossRef]
- Mohammadinejad, R., Karimi, S., Iravani, S., & Varma, R. S. (2016). Plant-derived nanostructures: types and applications. Green Chemistry, 18(1), 20-52. [CrossRef]
- Mounika Choppadandi, Aditya Teja Guduru, Piyush Gondaliya, Arya, N., Kalia, K., Kumar, H., & Govinda Kapusetti. (2021). Structural features regulated photoluminescence intensity and cell internalization of carbon and graphene quantum dots for bioimaging. Materials Science and Engineering: C, 129, 112366–112366. [CrossRef]
- Prasad, R., Aiyer, S., Chauhan, D. S., Srivastava, R., & Selvaraj, K. (2016). Bioresponsive carbon nano-gated multifunctional mesoporous silica for cancer theranostics. Nanoscale, 8(8), 4537-4546. [CrossRef]
- Saikia, M., Das, T., Dihingia, N., Fan, X., Silva, L. F., & Saikia, B. K. (2020). Formation of carbon quantum dots and graphene nanosheets from different abundant carbonaceous materials. Diamond and Related Materials, 106, 107813. [CrossRef]
- Wang, Y., & Hu, A. (2014). Carbon quantum dots: synthesis, properties and applications. Journal of Materials Chemistry C, 2(34), 6921.
- Wu, P., Li, W., Wu, Q., Liu, Y., & Liu, S. (2017). Hydrothermal synthesis of nitrogen-doped carbon quantum dots from microcrystalline cellulose for the detection of Fe 3+ ions in an acidic environment. RSC advances, 7(70), 44144-44153.
|
Disclaimer/Publisher’s Note: The statements, opinions and data contained in all publications are solely those of the individual author(s) and contributor(s) and not of MDPI and/or the editor(s). MDPI and/or the editor(s) disclaim responsibility for any injury to people or property resulting from any ideas, methods, instructions or products referred to in the content. |
© 2023 by the authors. Licensee MDPI, Basel, Switzerland. This article is an open access article distributed under the terms and conditions of the Creative Commons Attribution (CC BY) license (http://creativecommons.org/licenses/by/4.0/).
