Submitted:
14 October 2023
Posted:
17 October 2023
You are already at the latest version
Abstract
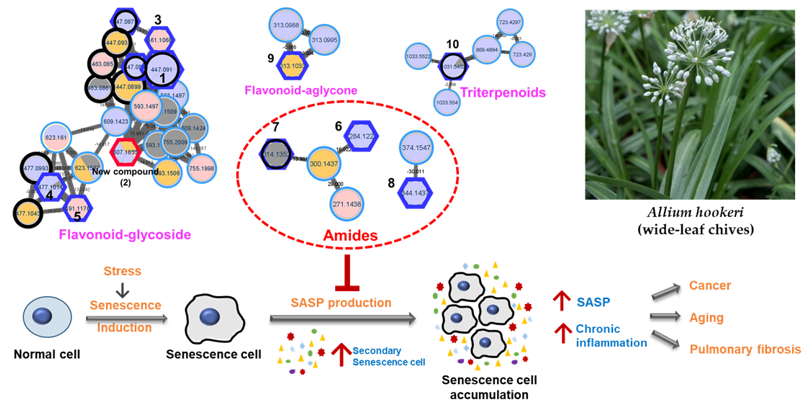
Keywords:
1. Introduction
2. Materials and Methods
2.1. Materials
2.2. Plant Material
2.3. UHPLC-qTOF-MS/MS Experiments
2.4. Sample Preparation of A. hookeri for MS/MS Analysis
2.5. Extraction and Isolation
2.5.1. Physicochemical Properties of Isolated Compounds
2.6. Cell Culture
2.7. LPS-Induced NO Production and Cell Viability
2.8. Bleomycin-Induced Senescent Model
2.8.1. Senescence-Associated β-Galactosidase Staining
2.9. RNA Extraction and Quantitative Real-Time Polymerase Chain Reaction (qRT-PCR)
2.10. Statistical Analyses
3. Results
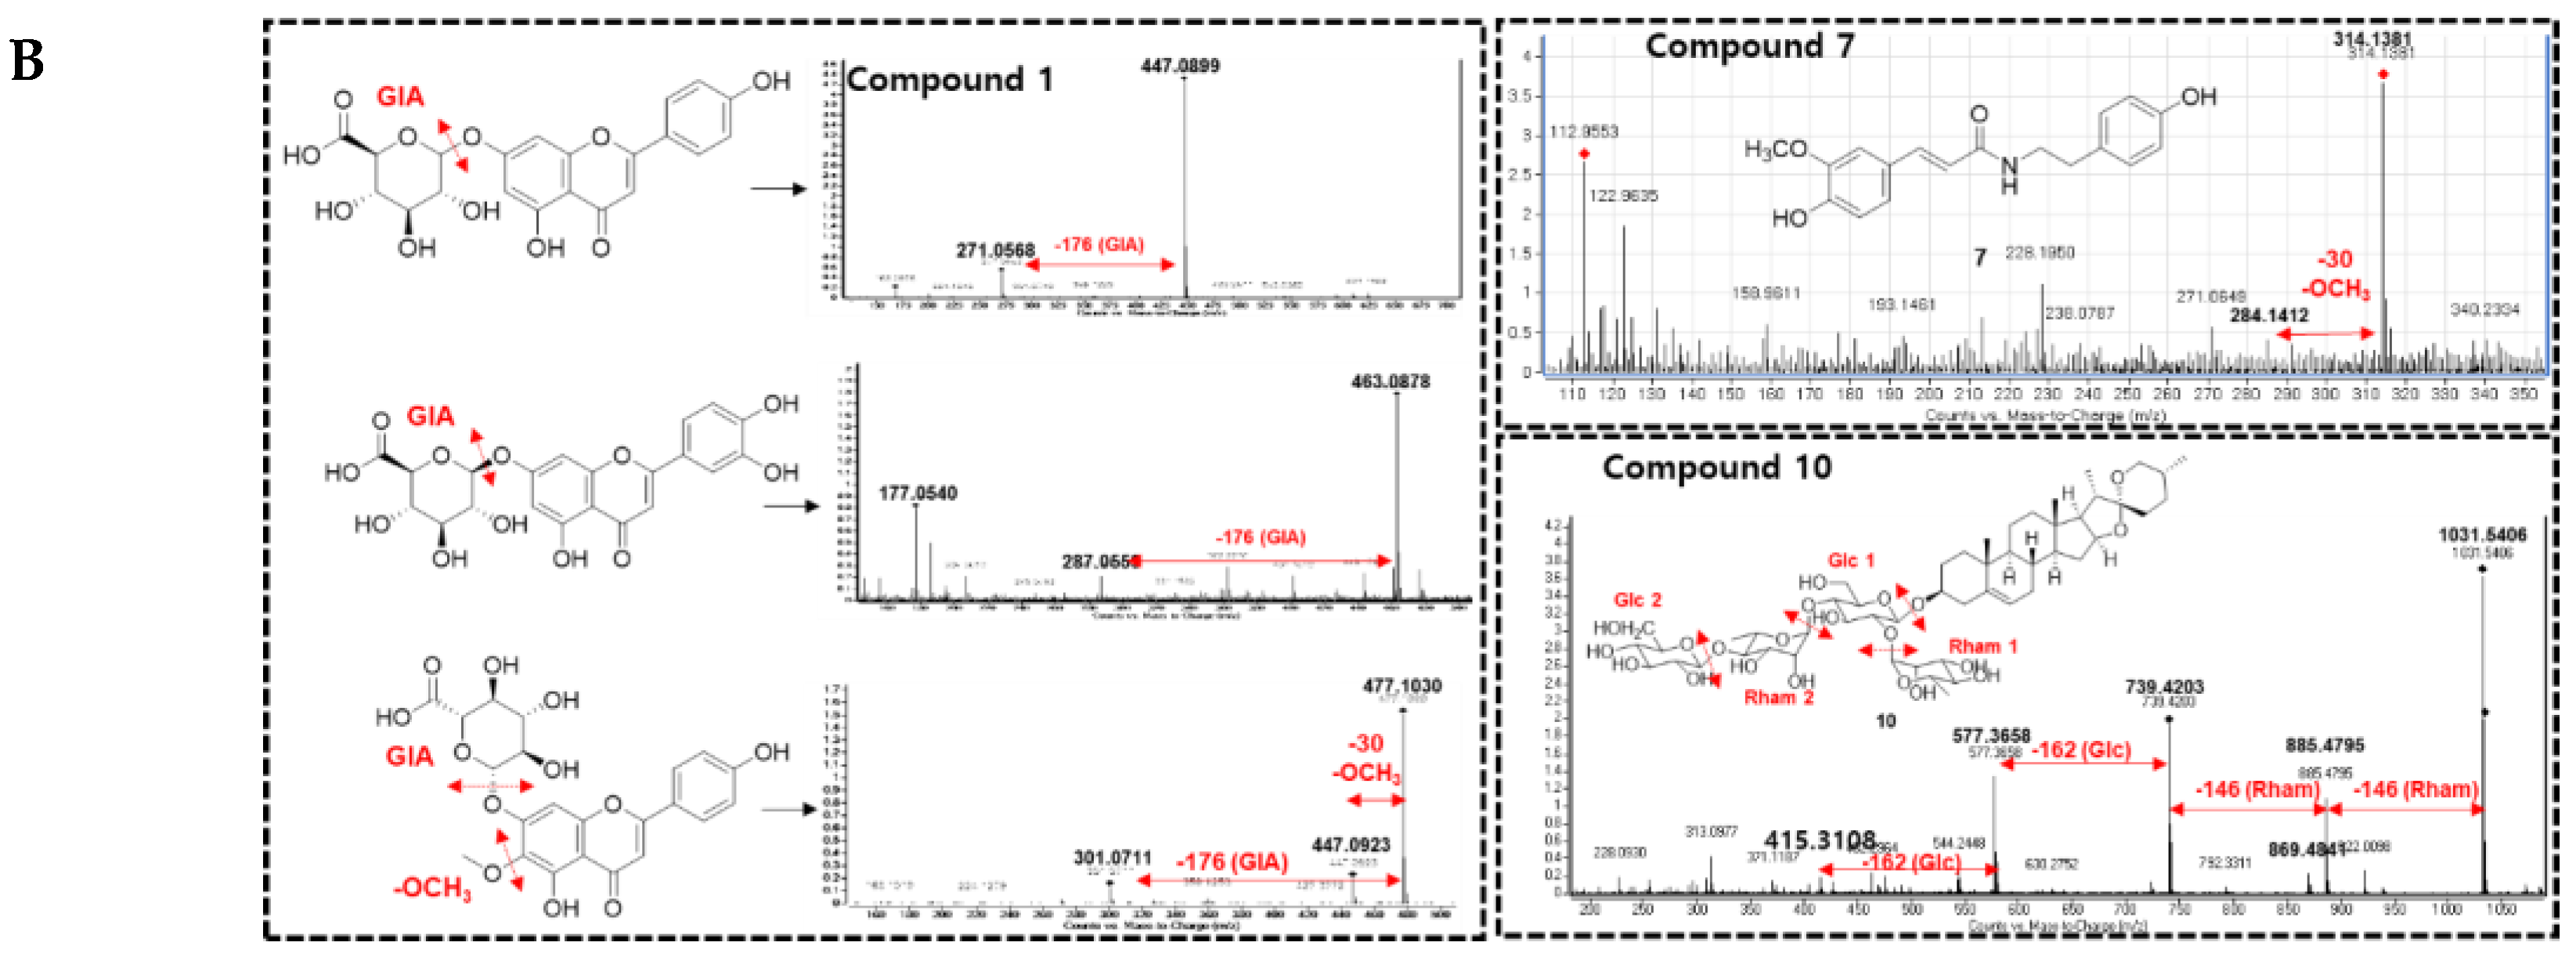
3.1. Feature-Based Molecular Networking of the A. hookeri Leaves Extract
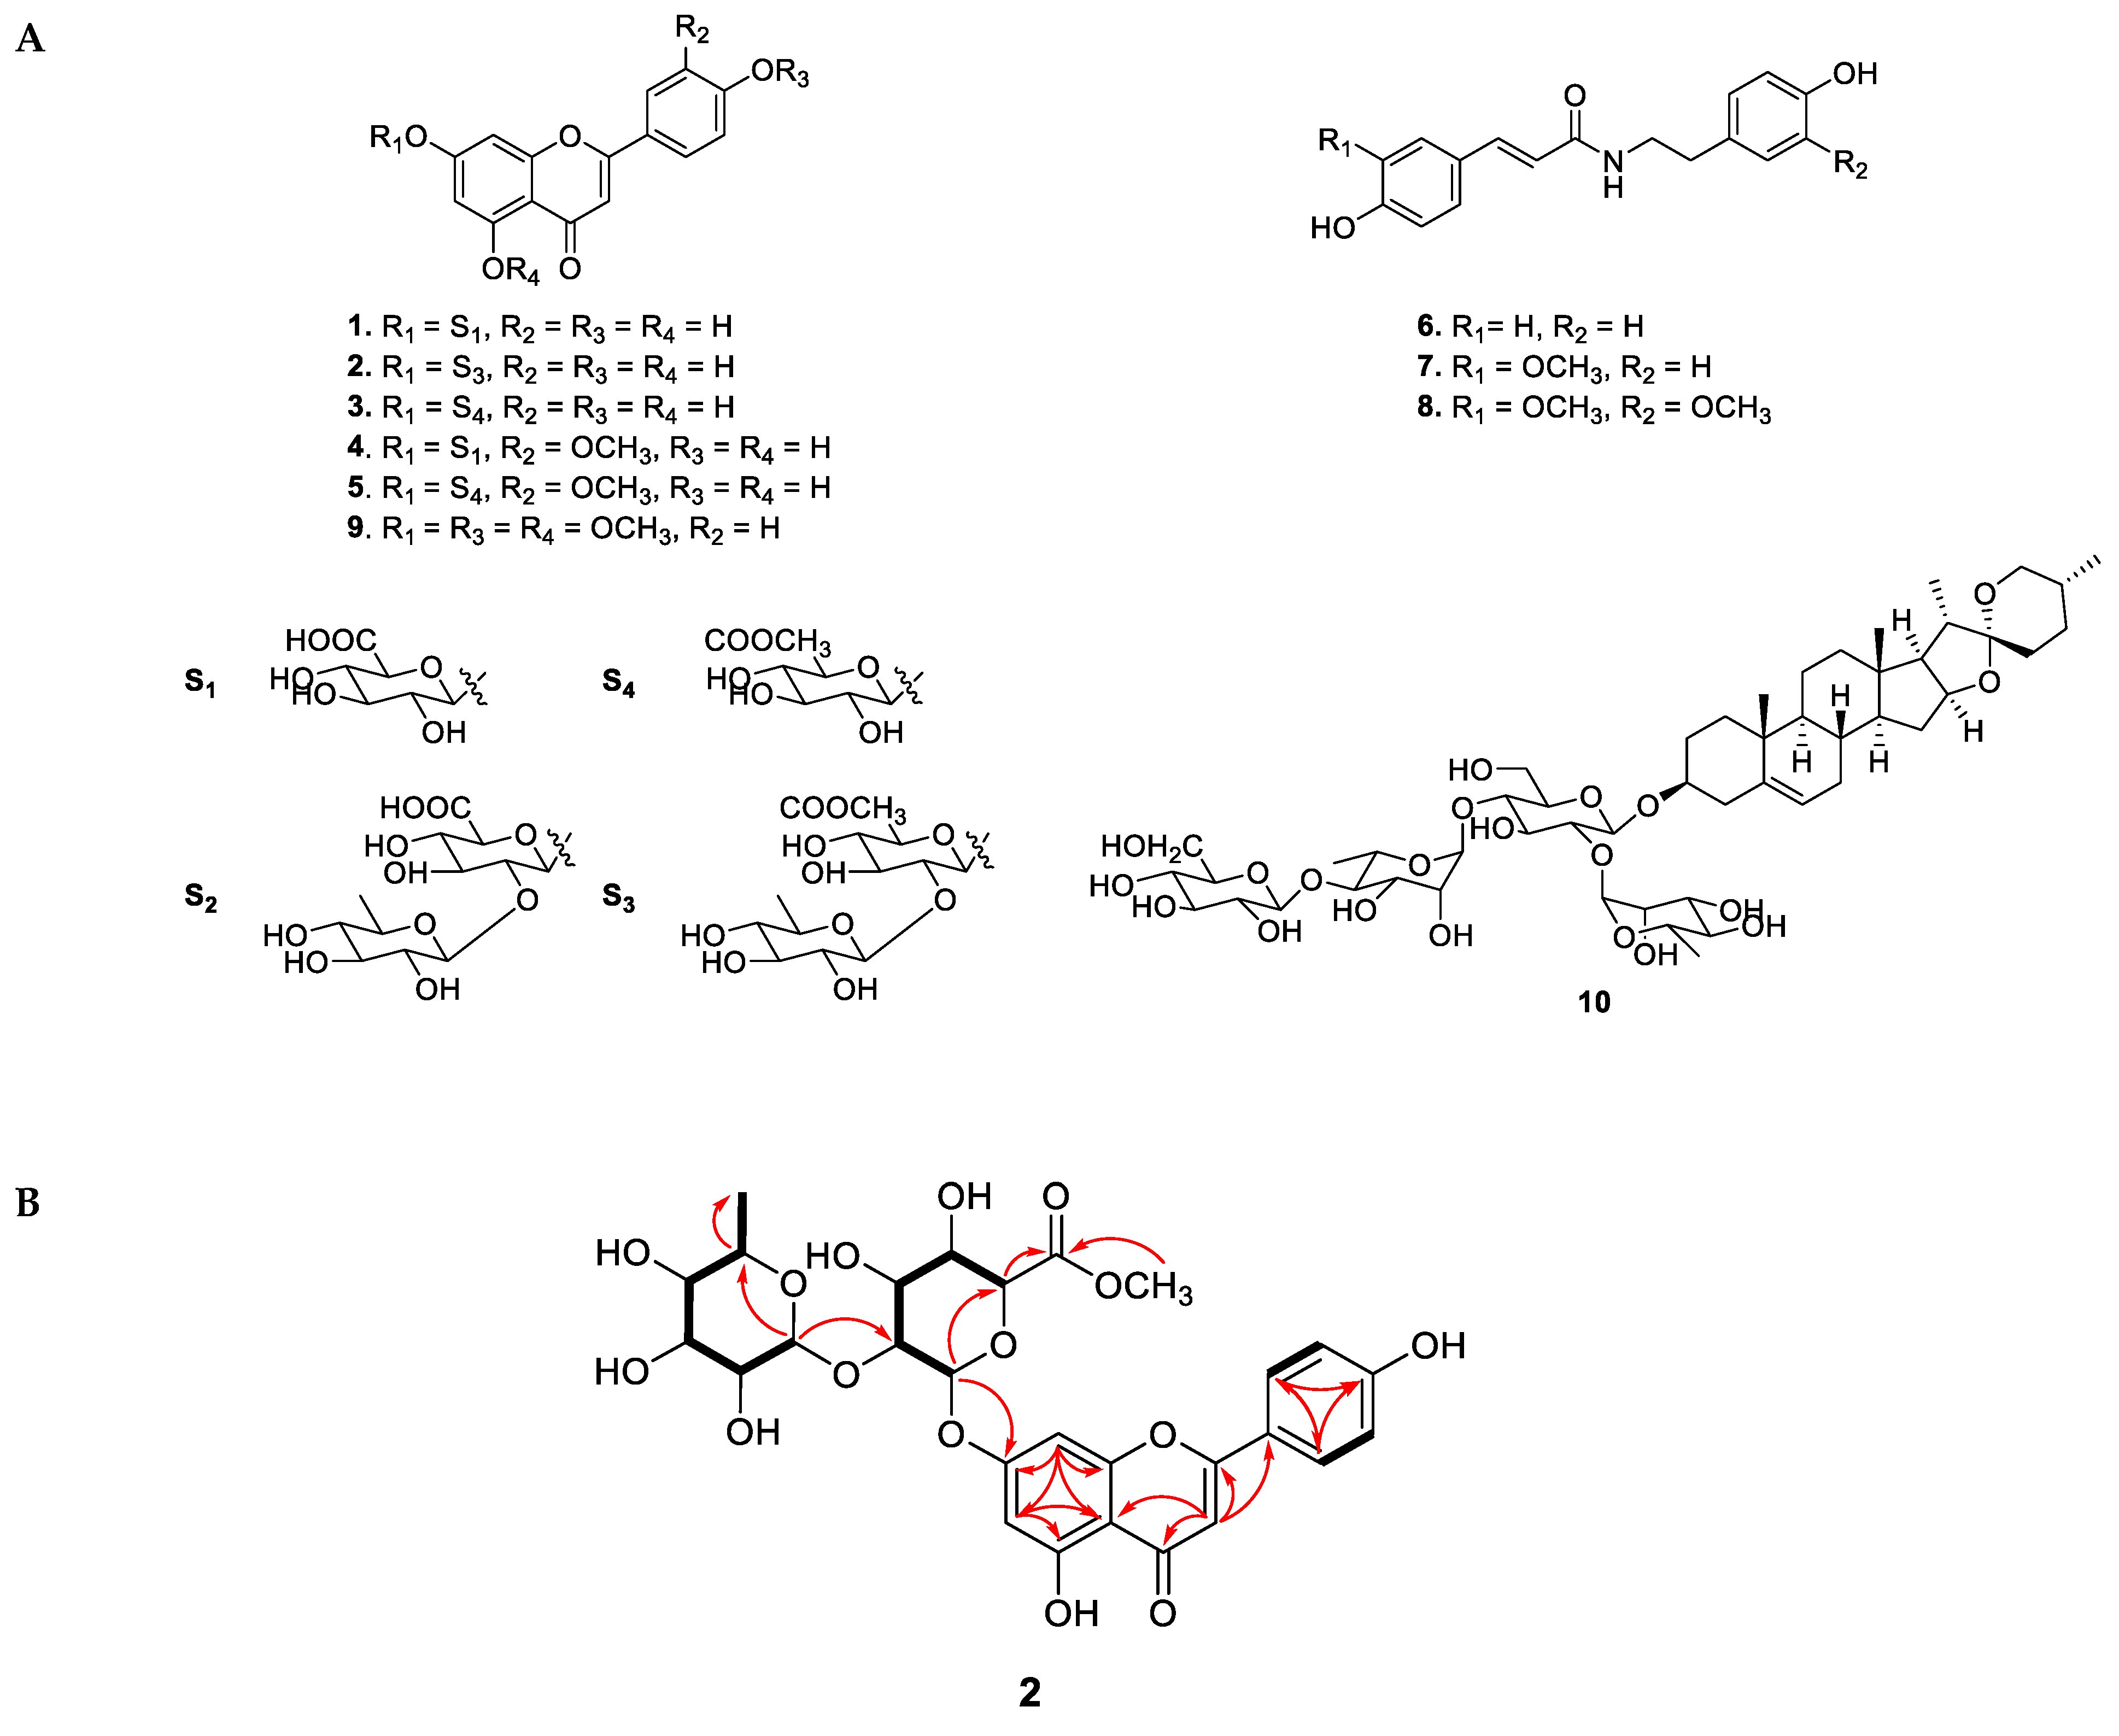
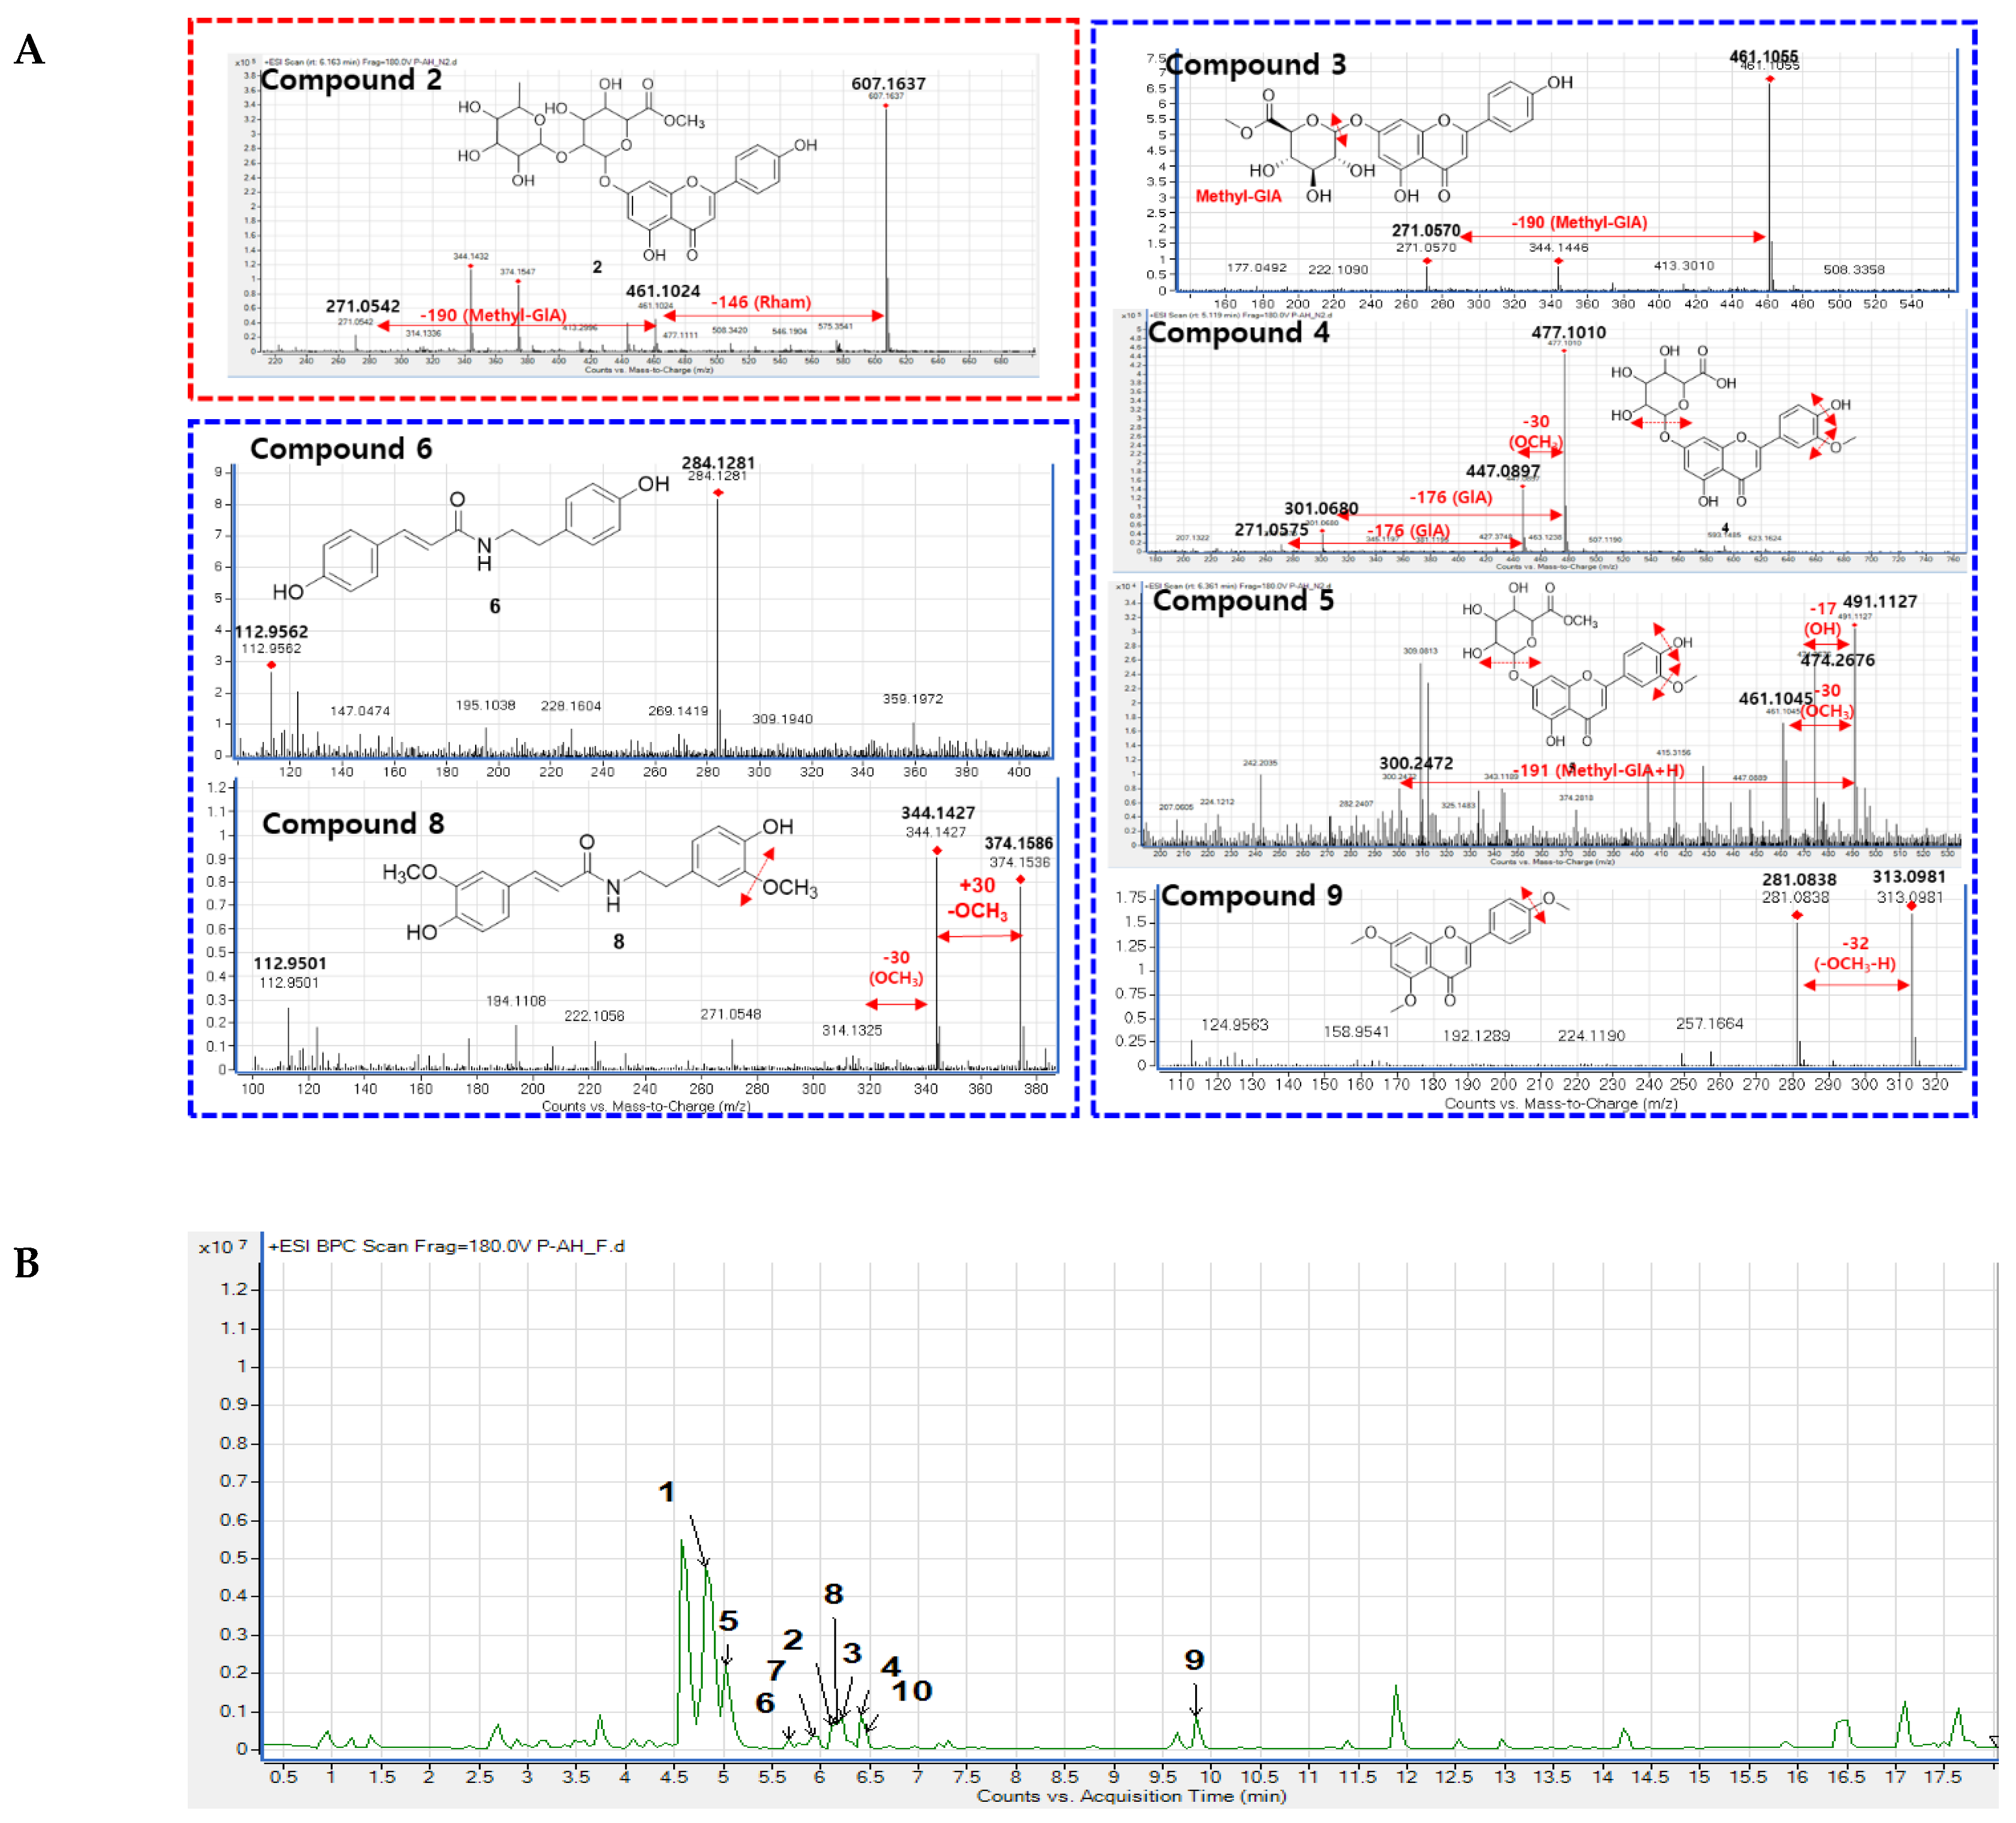
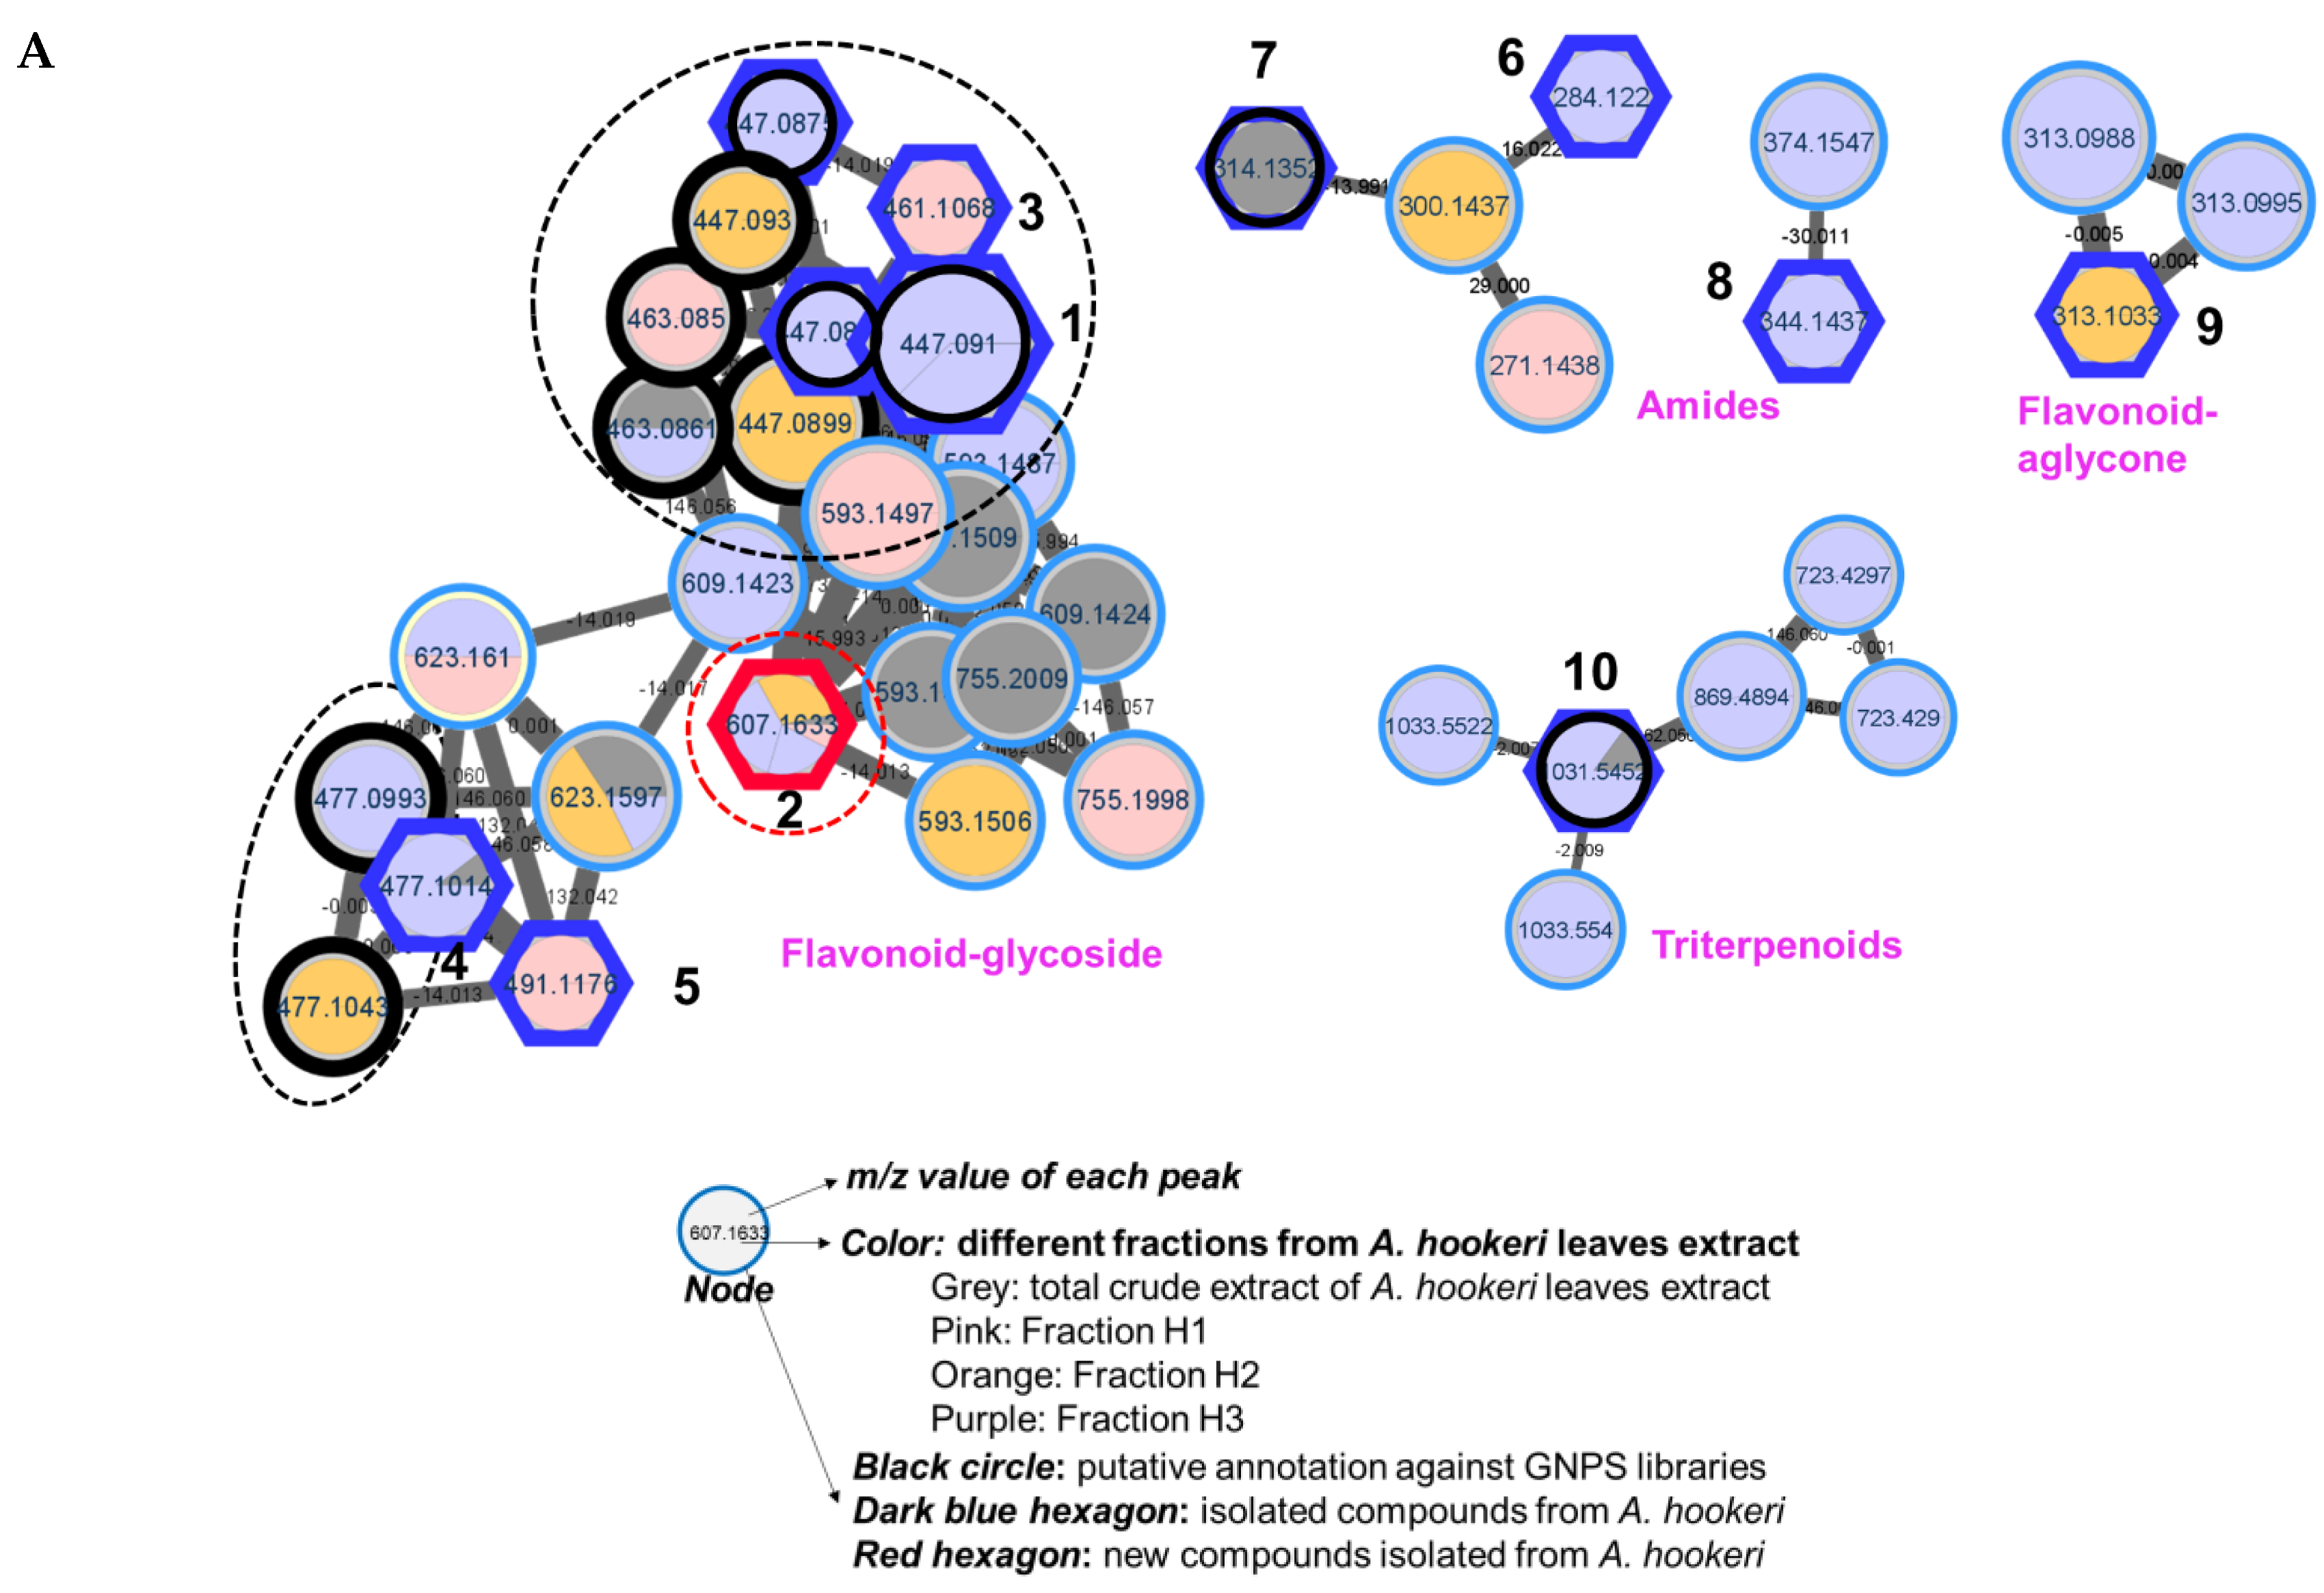
3.2. Isolation and Structural Elucidation of New Compound 2
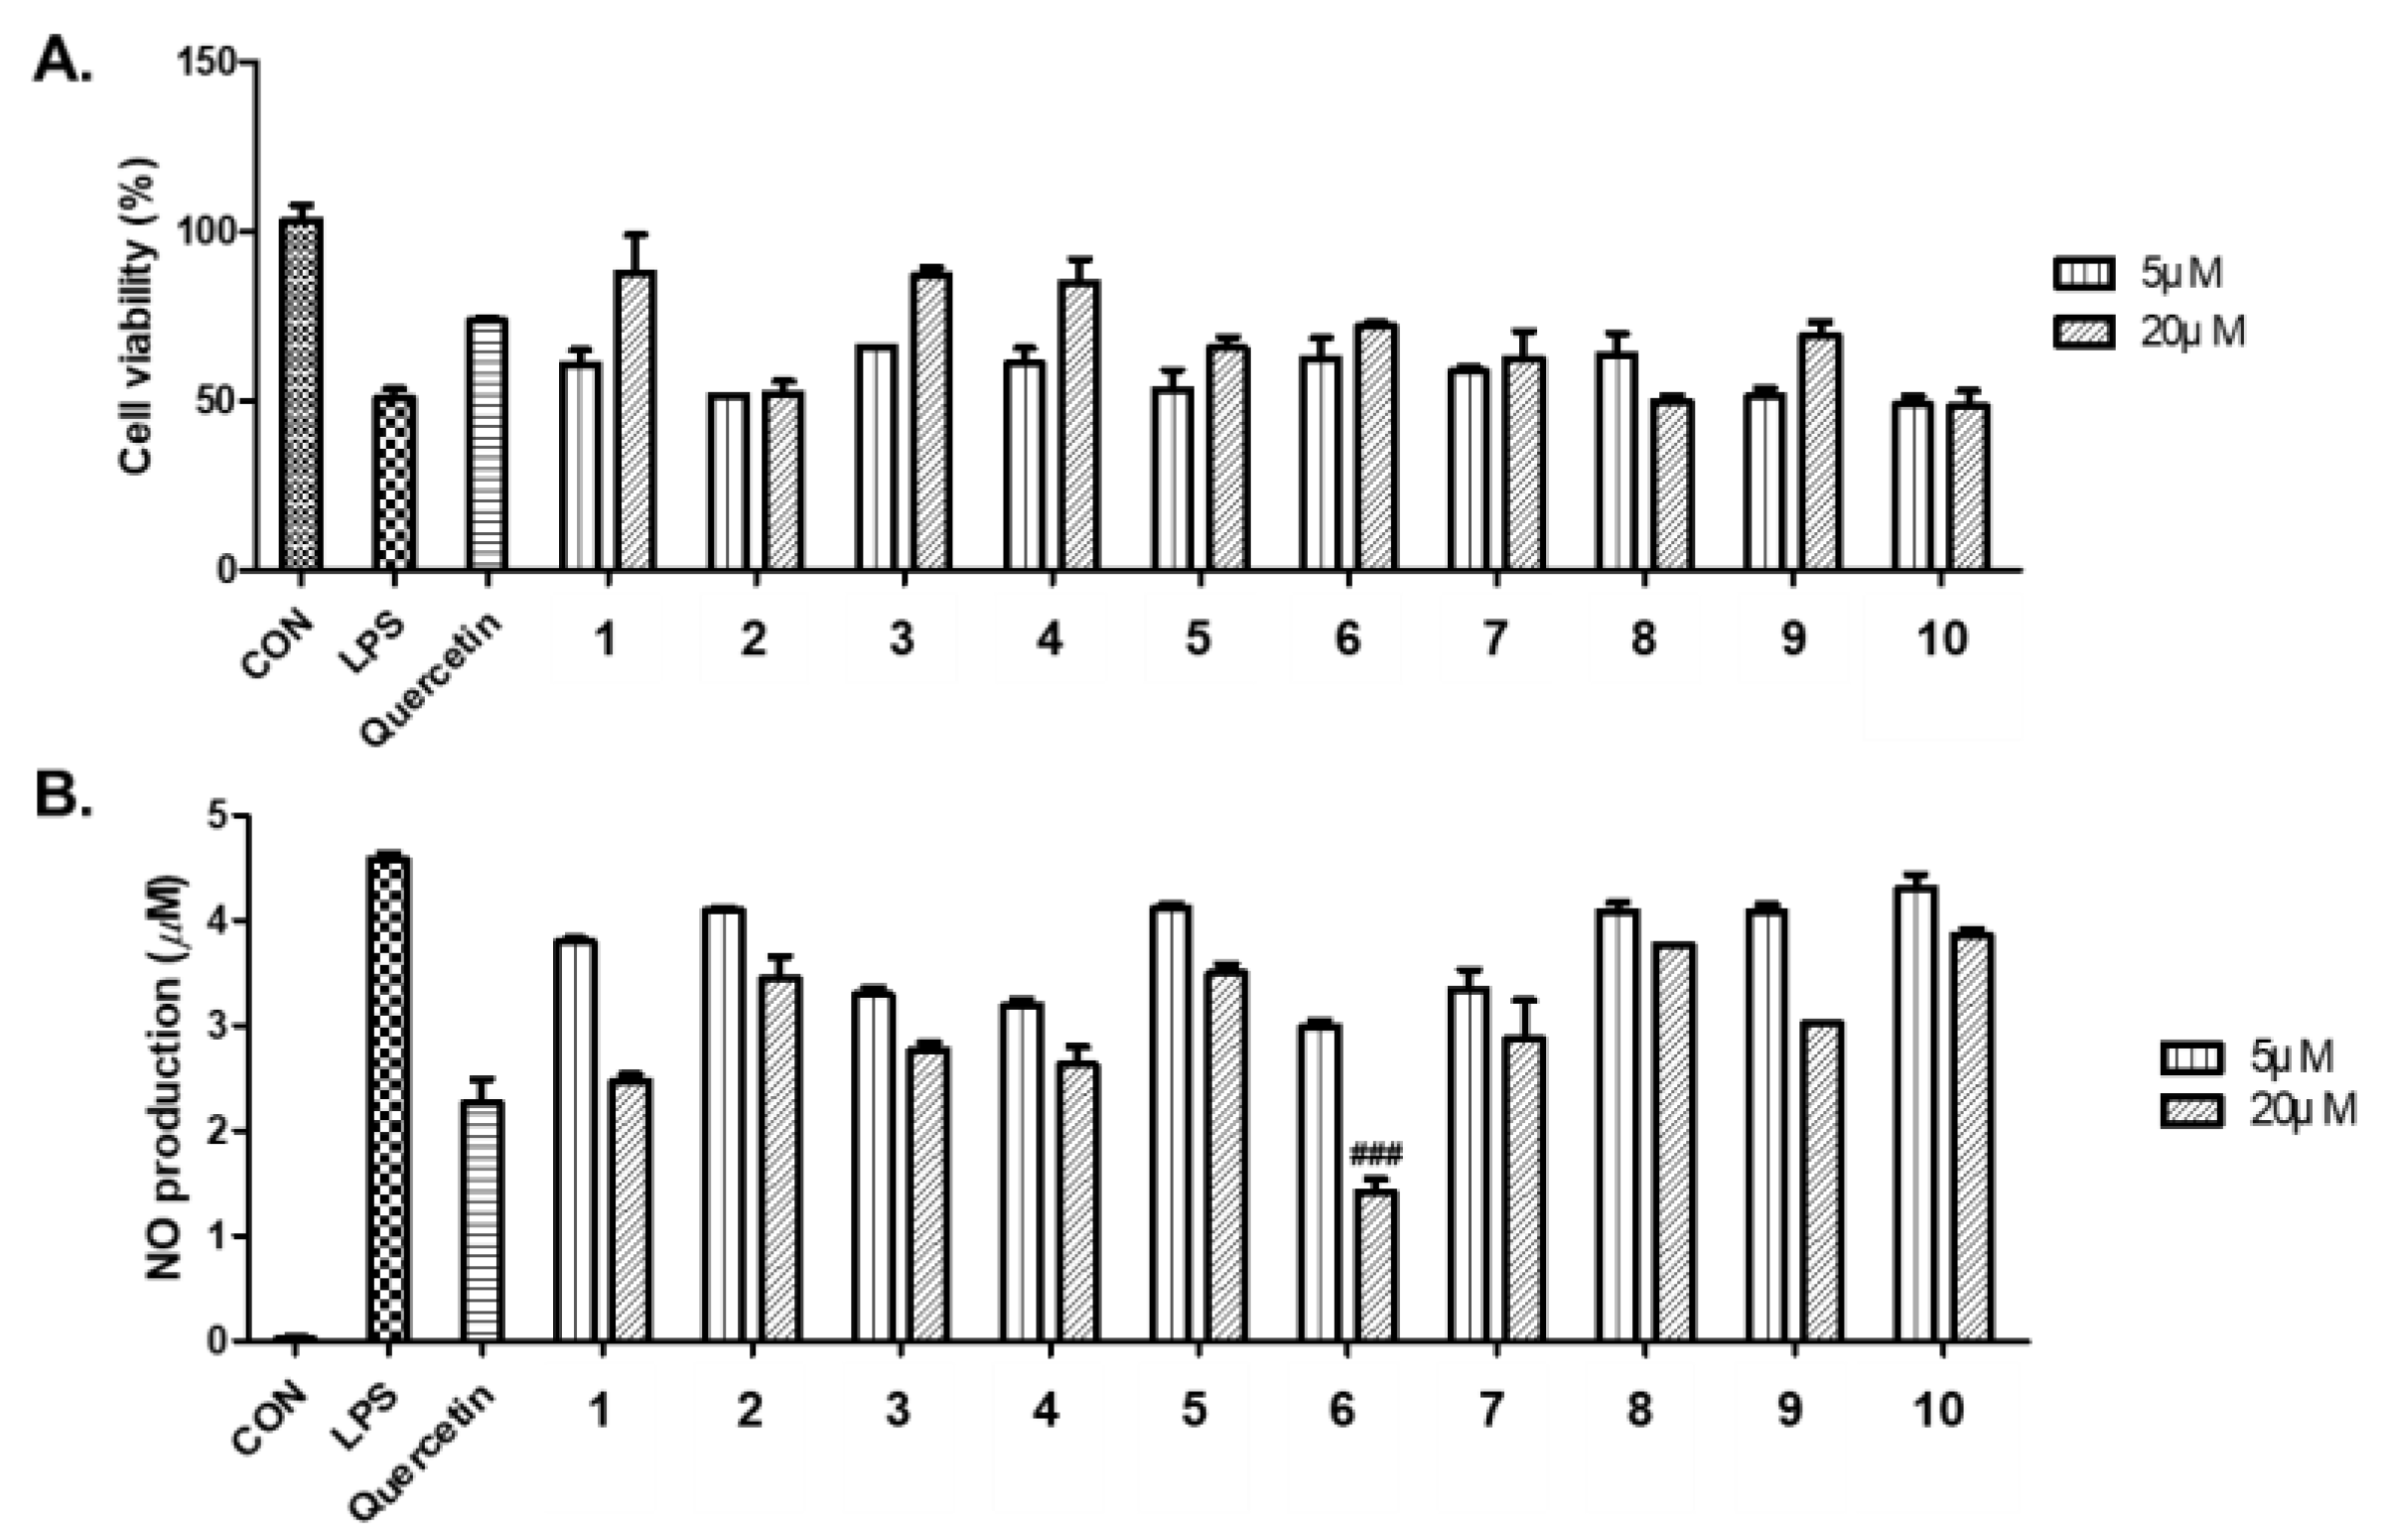
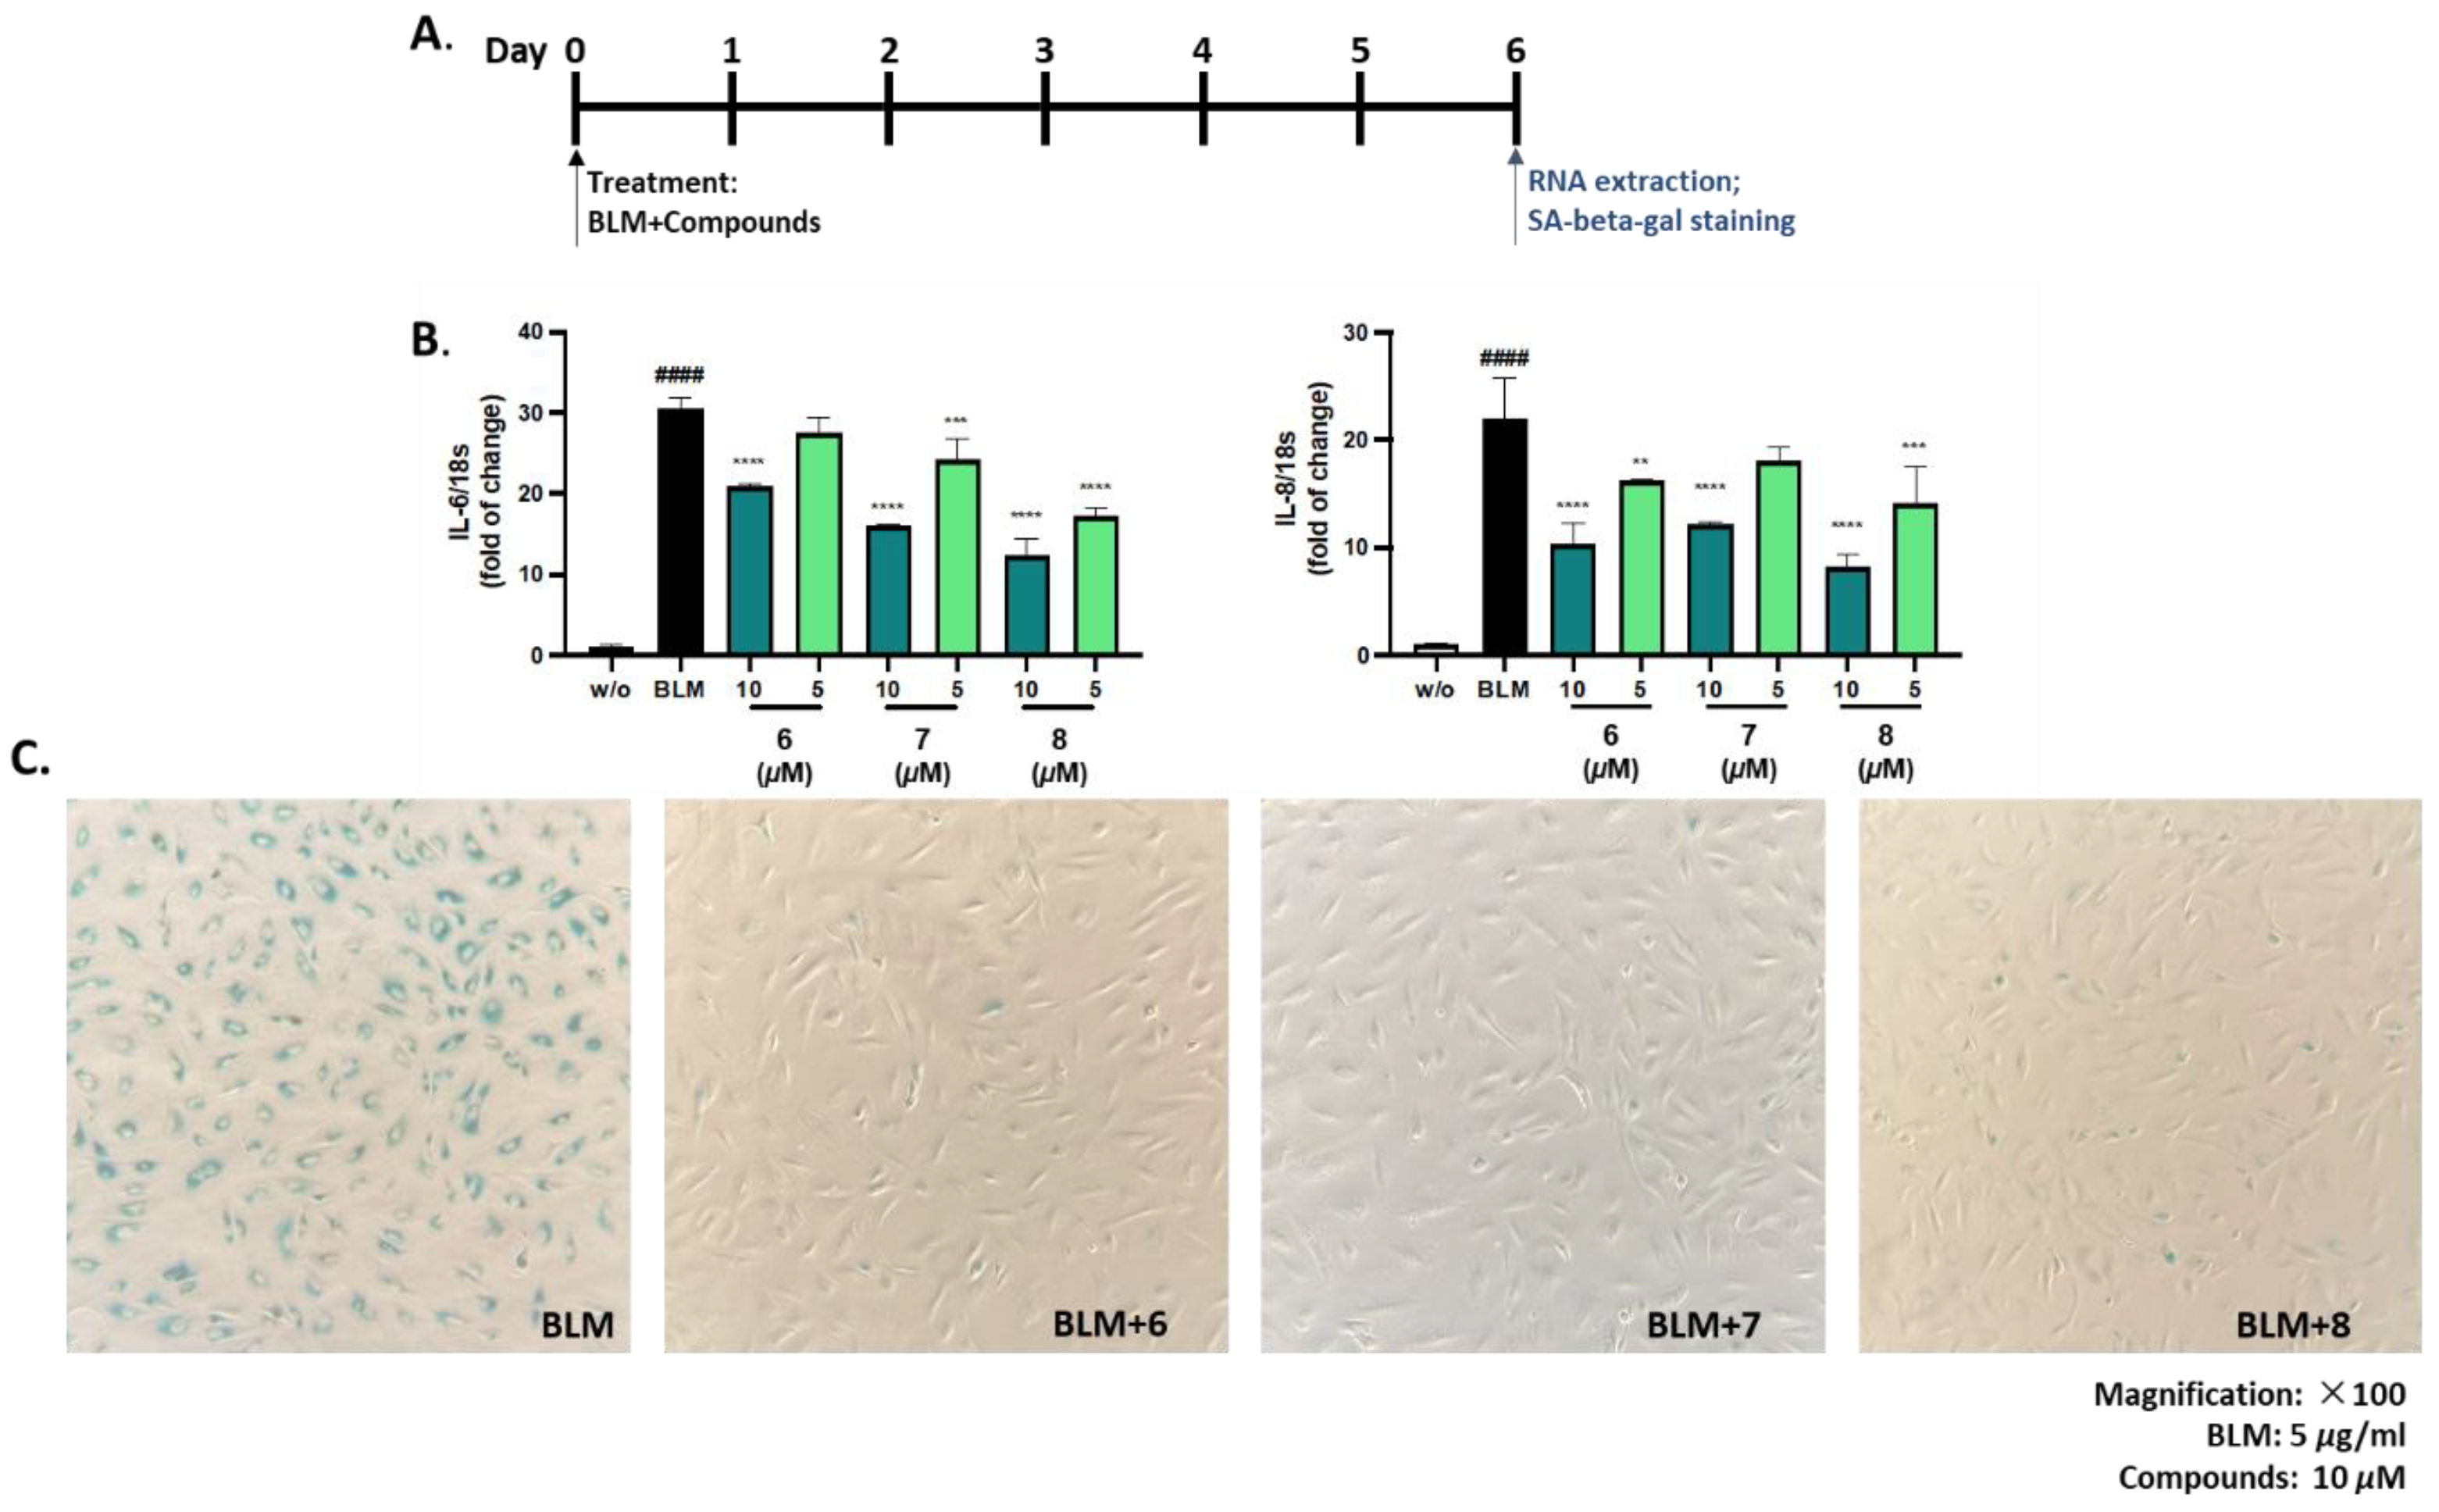
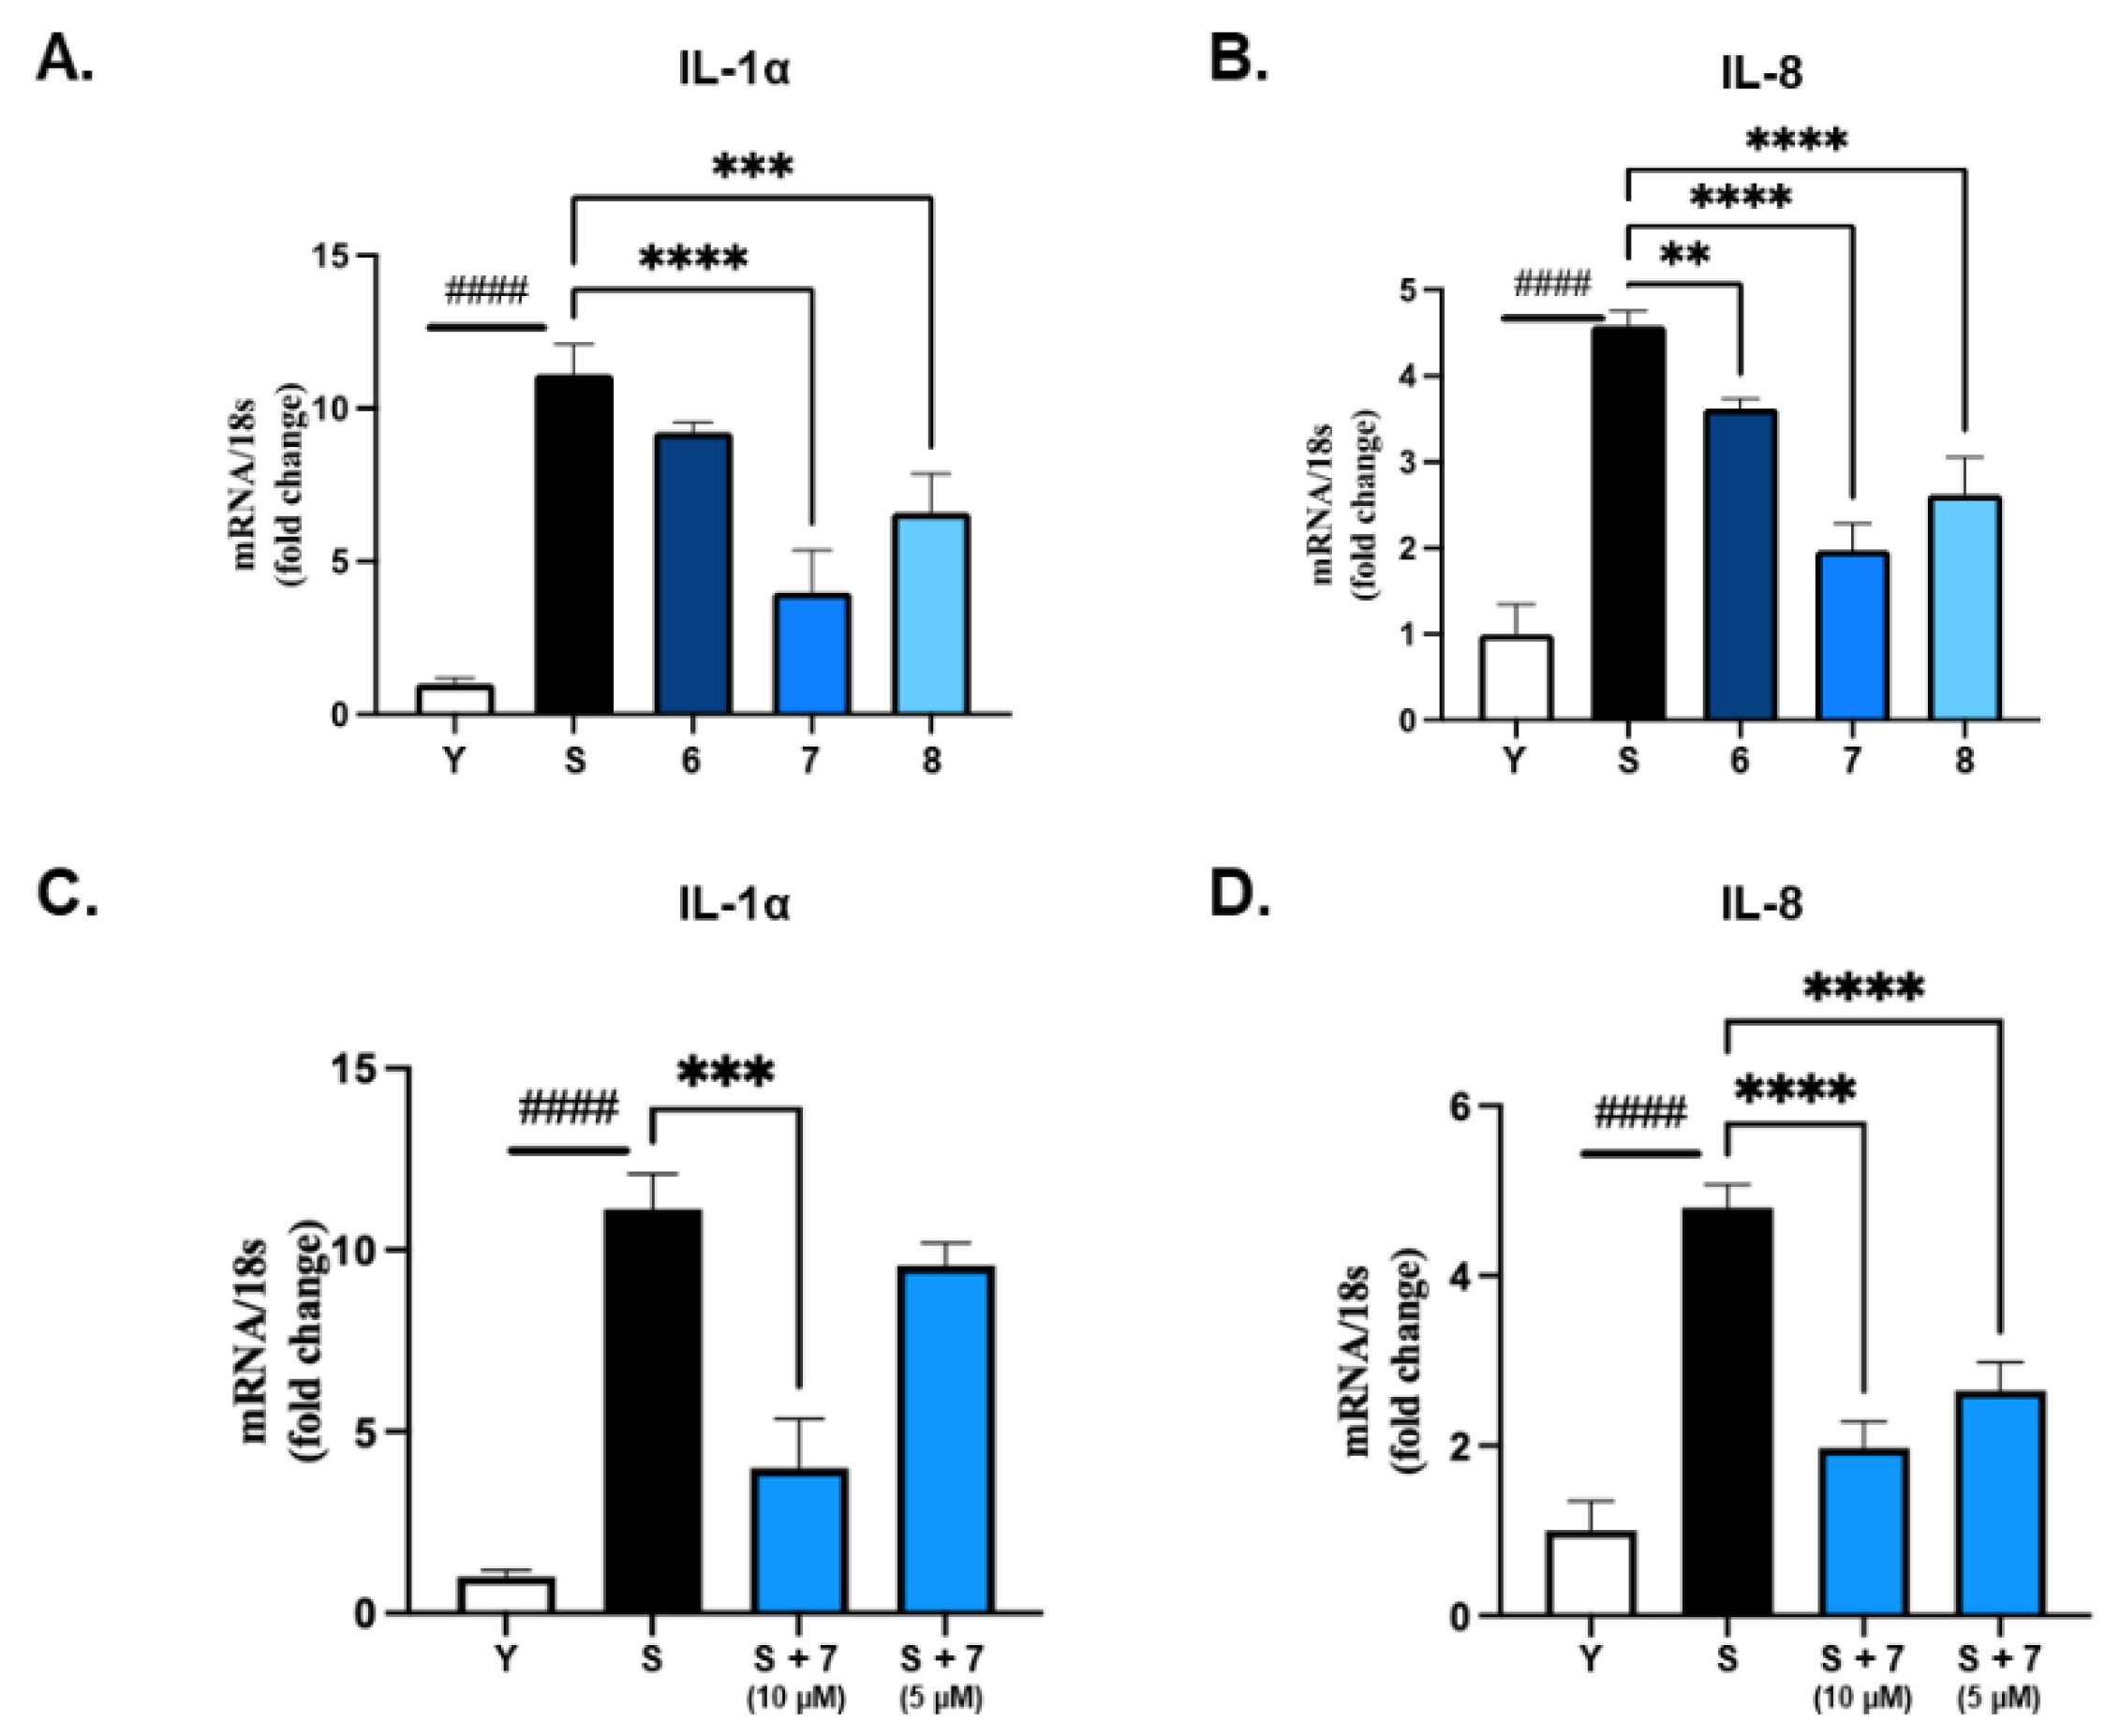
3.4. Bio-Activity of Isolated Compounds from A. hookeri
4. Discussion
5. Conclusions
Supplementary Materials
Author Contributions
Funding
Conflicts of Interest
References
- Fenwick, G.R.; Hanley, A.B.; Whitaker, J.R. The Genus Allium. Part 2. CRC Crit. Rev. Food Sci. Nutr. 1985, 22, 273–377. [Google Scholar] [CrossRef]
- Sabiu, S.; Madende, M.; Ajao, A.A.; Aladodo, R.A.; Nurain, I.O.; Ahmad, J.B. Chapter 9: The Genus Allium (Amaryllidaceae: Alloideae): Features, Phytoconstituents, and Mechanisms of Antidiabetic Potential of Allium cepa and Allium sativum. In Bioactive Food as Dietary Interventions for Diabetes; Academic Press: Cambridge, USA, 2019; pp. 137–154. [Google Scholar]
- Bae, G.C.; Bae, D.Y. The Anti-Inflammatory Effects of Ethanol Extract of Allium hookeri Cultivated in South Korea. Kor. J. Herbology 2012, 27, 55–61. [Google Scholar] [CrossRef]
- Bok, S.; Seo, J.; Bae, C.; Kang, B.; Cho, S.; Park, D. Allium hookeri Root Extract Regulates Asthmatic Changes through Immunological Modulation of Th1/Th2-related Factors in an Ovalbumin-induced Asthma Mouse Model. Mol. Med. Rep. 2019, 20, 3215–3223. [Google Scholar] [CrossRef]
- Jun, H.I.; Jang, H.; Ahn, D.; Kim, D.K.; Yang, J.H.; Yun, B.S.; Kim, Y.S. Isolation and Characterization of Phenolic Compound from Allium hookeri Root for Potential Use as Antioxidant in Foods. Food Sci. Biotechnol. 2015, 24, 2031–2034. [Google Scholar] [CrossRef]
- Kim, J.E.; Seo, J.H.; Bae, M.S.; Bae, C.S.; Yoo, J.C.; Bang, M.A.; Cho, S.S.; Park, D.H. Antimicrobial Constituents from Allium hookeri Root. Nat. Prod. Commun. 2016, 11, 237–238. [Google Scholar] [CrossRef]
- Roh, S.S.; Kwon, O.J.; Yang, J.H.; Kim, Y.S.; Lee, S.H.; Jin, J.S.; Jeon, Y.D.; Yokozawa, T.; Kim, H.J. Allium hookeri Root Protects Oxidative Stress-Induced Inflammatory Responses and β-Cell Damage in Pancreas of Streptozotocin-Induced Diabetic Rats. BMC Complement Altern. Med. 2016, 16, 1–10. [Google Scholar] [CrossRef]
- Park, S.H.; Bae, U.J.; Choi, E.K.; Jung, S.J.; Lee, S.H.; Yang, J.H.; Kim, Y.S.; Jeong, D.Y.; Kim, H.J.; Park, B.H.; et al. A Randomized, Double-Blind, Placebo-Controlled Crossover Clinical Trial to Evaluate the Anti-Diabetic Effects of Allium hookeri Extract in the Subjects with Prediabetes. BMC Complement Med. Ther. 2020, 20, 1–8. [Google Scholar] [CrossRef]
- Lee, Y.; Hyen Lee, S.; Sun Jeong, M.; Kim, J.B.; Hee Jang, H.; Choe, J.; Kim, D.W.; Lillehoj, H.S. In Vitro Analysis of the Immunomodulating Effects of Allium hookeri on Lymphocytes, Macrophages, and Tumour Cells. J. Poult. Sci. 2017, 54, 142–148. [Google Scholar] [CrossRef]
- Jang, J.Y.; Lee, M.J.; You, B.R.; Jin, J.S.; Lee, S.H.; Yun, Y.R.; Kim, H.J. Allium hookeri Root Extract Exerts Anti-Inflammatory Effects by Nuclear Factor-ΚB down-Regulation in Lipopolysaccharide-Induced RAW264.7 Cells. BMC Complement Altern. Med. 2017, 17, 1–9. [Google Scholar]
- Kim, H.; Rho, S.H.; Lim, J.; Park, H.J.; Jeong, H. Protective Effect of Linoleic Acid against Inflammatory Reactions by Mast Cell via Caspase-1 Cascade Pathways. J. Food Biochem. 2019, 43, 1–9. [Google Scholar] [CrossRef]
- Park, H.; Jeong, J.; Hyun, H.; Kim, J.; Kim, H.; Oh, H.; Choi, J.; Hwang, H.; Oh, D.; Kim, J.; et al. Effects of a Hot-Water Extract of Allium hookeri Roots on Bone Formation in Human Osteoblast-Like MG-63 Cells In Vitro and in Rats In Vivo. Planta Med. 2016, 82, 1410–1415. [Google Scholar] [CrossRef]
- Park, S.; No, K.; Lee, J. Anti-Obesity Effect of Allium hookeri Leaf Extract in High-Fat Diet-Fed Mice. J. Med. Food. 2018, 21, 254–260. [Google Scholar] [CrossRef]
- Yang, M.H.; Kim, N.H.; Heo, J.D.; Rho, J.R.; Ock, K.J.; Shin, E.C.; Jeong, E.J. Comparative Evaluation of Sulfur Compounds Contents and Antiobesity Properties of Allium hookeri Prepared by Different Drying Methods. Evid. Based Complement Alternat. Med. 2017, 2017, 1–10. [Google Scholar] [CrossRef]
- Hwang, J.S.; Lee, B.H.; An, X.; Jeong, H.R.; Kim, Y.E.; Lee, I.; Lee, H.; Kim, D.O. Total Phenolics, Total Flavonoids, and Antioxidant Capacity in the Leaves, Bulbs, and Roots of Allium hookeri. Korean J. Food Sci. Technol. 2015, 47, 261–266. [Google Scholar] [CrossRef]
- Park, S.Y.; Je, J.Y.; Ahn, C.B. Phenolic Composition and Hepatoprotective Activities of Allium hookeri Against Hydrogen-Peroxide-Induced Oxidative Stress in Cultured Hepatocytes. J. Food Biochem. 2016, 40, 284–293. [Google Scholar] [CrossRef]
- Li, R.; Wang, Y.F.; Sun, Q.; Hu, H. Bin Chemical Composition and Antimicrobial Activity of the Essential Oil from Allium hookeri Consumed in Xishuangbanna, Southwest China. Nat. Prod. Commun. 2014, 9, 863–864. [Google Scholar]
- Thiyagarajan, J.A.; Mikton, C.; Harwood, R.H.; Gichu, M.; Gaigbe-Togbe, V.; Jhamba, T.; Pokorna, D.; Stoevska, V.; Hada, R.; Steffan, G.S.; et al. The UN Decade of Healthy Ageing: Strengthening Measurement for Monitoring Health and Wellbeing of Older People. Age Ageing. 2022, 51, 1–5. [Google Scholar]
- Beard, J.R.; Officer, A.; de Carvalho, I.A.; Sadana, R.; Pot, A.M.; Michel, J.-P.; Lloyd-Sherlock, P.; Epping-Jordan, J.E.; Peeters, G.M.E.E. (Geeske); Mahanani, W.R.; et al. The World Report on Ageing and Health: A Policy Framework for Healthy Ageing. The Lancet 2016, 387, 2145–2154. [Google Scholar] [CrossRef]
- Boccardi, V.; Mecocci, P. Senotherapeutics: Targeting Senescent Cells for the Main Age-Related Diseases. Mech. Ageing. Dev. 2021, 197, 111526. [Google Scholar] [CrossRef]
- Sun, Y.; Coppé, J.P.; Lam, E.W.F. Cellular Senescence: The Sought or the Unwanted? Trends Mol. Med. 2018, 24, 871–885. [Google Scholar] [CrossRef]
- van Deursen, J.M. The Role of Senescent Cells in Ageing. Nature. 2014, 509, 439–446. [Google Scholar] [CrossRef]
- Li, W.; Qin, L.; Feng, R.; Hu, G.; Sun, H.; He, Y.; Zhang, R. Emerging Senolytic Agents Derived from Natural Products. Mech. Ageing Dev. 2019, 181, 1–6. [Google Scholar] [CrossRef]
- Luís, C.; Maduro, A.T.; Pereira, P.; Mendes, J.J.; Soares, R.; Ramalho, R. Nutritional Senolytics and Senomorphics: Implications to Immune Cells Metabolism and Aging – from Theory to Practice. Front Nutr. 2022, 9, 1–15. [Google Scholar] [CrossRef]
- Lee, Y.; Kim, H.M.; Kim, J.H.; Lee, J.-H.; Zhang, K.X.; Gao, E.M.; Jeon, J.-S.; Syed, A.S.; Son, R.H.; Kim, J.-Y.; et al. Chemical Constituents of the Ajuga Multiflora Bunge and Their Protective Effects on Dexamethasone-Induced Muscle Atrophy in C2C12 Myotubes. Nat. Prod. Res. 2023, 37, 1978–1985. [Google Scholar] [CrossRef]
- Lehbili, M.; Alabdul Magid, A.; Kabouche, A.; Voutquenne-Nazabadioko, L.; Abedini, A.; Morjani, H.; Gangloff, S.C.; Kabouche, Z. Antibacterial, Antioxidant and Cytotoxic Activities of Triterpenes and Flavonoids from the Aerial Parts of Salvia Barrelieri Etl. Nat. Prod. Res. 2018, 32, 2683–2691. [Google Scholar] [CrossRef]
- Myagchilov, A. V.; Gorovoi, P.G.; Sokolova, L.I. Flavonoids from Serratula komarovii Iljin (the Asteraceae Family). Russ. J. Bioorg. Chem. 2021, 47, 1418–1423. [Google Scholar] [CrossRef]
- Yanting, L.R.J.B.X.Z. Chrysoeriol-7-O-Beta-D Glucuronic Acid Methyl Ester and Extraction Method and Application Thereof. 2017, 1–9. https://worldwide.espacenet.com/patent/search/family/060495965/publication/CN107446009A?q=pn%3DCN107446009A. 1074. [Google Scholar]
- Sutthanut, K.; Sripanidkulchai, B.; Yenjai, C.; Jay, M. Simultaneous Identification and Quantitation of 11 Flavonoid Constituents in Kaempferia parviflora by Gas Chromatography. J. Chromatogr A. 2007, 1143, 227–233. [Google Scholar] [CrossRef]
- van Zadelhoff, A.; Vincken, J.P.; de Bruijn, W.J.C. Facile Amidation of Non-Protected Hydroxycinnamic Acids for the Synthesis of Natural Phenol Amides. 2022, 27.
- Zheng, Y.; Su, B.; Wang, Y.; Wang, H.; Liao, H.; Liang, D. New Tyramine- and Aporphine-Type Alkamides with NO Release Inhibitory Activities from Piper puberulum. J. Nat. Prod. 2021, 84, 1316–1325. [Google Scholar] [CrossRef]
- Chen, S.; Snyder, J.K. Diosgenin-Bearing, Molluscicidal Saponins from Allium Vineale: An NMR Approach for the Structural Assignment of Oligosaccharide Units. J. Org. Chem. 1989, 54, 3679–3689. [Google Scholar] [CrossRef]
- Thangnipon, W.; Ngampramuan, S.; Suthprasertporn, N.; Jantrachotechatchawan, C.; Tuchinda, P.; Nobsathian, S. Protective Roles of N-Trans-Feruloyltyramine Against Scopolamine-Induced Cholinergic Dysfunction on Cortex and Hippocampus of Rat Brains. Siriraj Med J. 2021, 73, 413–422. [Google Scholar] [CrossRef]
- Thangnipon, W.; Suwanna, N.; Kitiyanant, N.; Soi-ampornkul, R.; Tuchinda, P.; Munyoo, B.; Nobsathian, S. Protective Role of N-Trans-Feruloyltyramine against β-Amyloid Peptide-Induced Neurotoxicity in Rat Cultured Cortical Neurons. Neurosci. Lett. 2012, 513, 229–232. [Google Scholar] [CrossRef]
- Efdi, M.; Ohguchi, K.; Akao, Y.; Nozawa, Y.; Koketsu, M.; Ishihara, H. N-Trans-Feruloyltyramine as a Melanin Biosynthesis Inhibitor. Biol. Pharm. Bull. 2007, 30, 1972–1974. [Google Scholar] [CrossRef]
- Gao, X.; Wang, C.; Chen, Z.; Chen, Y.; Santhanam, R.K.; Xue, Z.; Ma, Q.; Guo, Q.; Liu, W.; Zhang, M.; et al. Effects of N-Trans-Feruloyltyramine Isolated from Laba Garlic on Antioxidant, Cytotoxic Activities and H2O2-Induced Oxidative Damage in HepG2 and L02 cells. 2019, 130, 130–141.
- Pu, Z.; Shen, C.; Zhang, W.; Xie, H.; Wang, W. Avenanthramide C from Oats Protects Pyroptosis through Dependent ROS-Induced Mitochondrial Damage by PI3K Ubiquitination and Phosphorylation in Pediatric Pneumonia. J. Agric. Food Chem. 2022, 70, 2339–2353. [Google Scholar] [CrossRef]
- Dhakal, H.; Yang, E.-J.; Lee, S.; Kim, M.-J.; Baek, M.-C.; Lee, B.; Park, P.-H.; Kwon, T.K.; Khang, D.; Song, K.-S.; et al. Avenanthramide C from Germinated Oats Exhibits Anti-Allergic Inflammatory Effects in Mast Cells. Sci. Rep. 2019, 9, 6884. [Google Scholar] [CrossRef]
- Lim, J.S.; Lee, D.Y.; Kim, H.S.; Park, S.C.; Park, J.T.; Kim, H.S.; Oh, W.K.; Cho, K.A. Identification of a Novel Senomorphic Agent, Avenanthramide C, via the Suppression of the Senescence-Associated Secretory Phenotype. Mech. Ageing Dev. 2020, 192, 111355. [Google Scholar] [CrossRef]
- Ramasamy, V.S.; Samidurai, M.; Park, H.J.; Wang, M.; Park, R.Y.; Yu, S.Y.; Kang, H.K.; Hong, S.; Choi, W.-S.; Lee, Y.Y.; et al. Avenanthramide-C Restores Impaired Plasticity and Cognition in Alzheimer’s Disease Model Mice. Mol. Neurobiol. 2020, 57, 315–330. [Google Scholar] [CrossRef]
| Pos. | 2 | |
|---|---|---|
| δCa | δH (J in Hz)b | |
| 2 | 165.5 | |
| 3 | 104.5 | 6.93, s |
| 4 | 183.3 | |
| 5 | 158.3 | |
| 6 | 95.6 | 7.20, overlap. |
| 7 | 163.7 | |
| 8 | 100.8 | 7.04, s |
| 9 | 163.4 | |
| 10 | 107.4 | |
| 1' | 122.4 | |
| 2' | 129.5 | 7.85, d (5.1) |
| 3' | 117.4 | 7.19, overlap. |
| 4' | 163.3 | |
| 5' | 117.4 | |
| 6' | 129.5 | |
| 1" | 100.0 | 6.03, d (7.3) |
| 2" | 77.8 | 4.65, t (7.8) |
| 3" | 78.7 | 4.47, t (8.8) |
| 4" | 73.3 | 4.52, t (8.8) |
| 5" | 77.5 | 4.88, d (8.5) |
| -C=O | 170.4 | |
| -COOCH3 | 52.6 | 3.62, s |
| 4'-OCH3 | ||
| 1''' | 103.1 | 6.45, s |
| 2''' | 72.9 | 4.84, br s |
| 3''' | 73.2 | 4.58, d (7.7) |
| 4''' | 74.5 | 4.38, t (9.1) |
| 5''' | 70.6 | 4.80, m |
| 6''' | 19.4 | 1.85, d (6.0) |
| a Recorded in Pyridine-d5 at 600 MHz, b Recorded in Pyridine-d5 at 150 MHz. | ||
Disclaimer/Publisher’s Note: The statements, opinions and data contained in all publications are solely those of the individual author(s) and contributor(s) and not of MDPI and/or the editor(s). MDPI and/or the editor(s) disclaim responsibility for any injury to people or property resulting from any ideas, methods, instructions or products referred to in the content. |
© 2024 by the authors. Licensee MDPI, Basel, Switzerland. This article is an open access article distributed under the terms and conditions of the Creative Commons Attribution (CC BY) license (https://creativecommons.org/licenses/by/4.0/).


