Preprint
Article

Life Cycle Assessment in Flange Part Production Comparing Wire and Arc Additive Manufacturing Method (WAAM) and Conventional Manufacturing in Terms of Energy Consumption, Greenhouse Gas Emissions and Solid Waste Generation

Altmetrics

Downloads

172

Views

142

Comments

0

Submitted:

13 October 2023

Posted:

17 October 2023

You are already at the latest version

Alerts
Abstract
Additive Manufacturing (AM) has been proving suitable to support or even replace traditional manufacturing in several industries, offering many advantages such as delivery time and reduction in terms of material waste, energy consumption and greenhouse gas (GHG) emissions. This study aimed to carry out a comparative assessment of the life cycle, from gate to gate, in the production of a low alloy carbon steel flange part using ER-90 wire. The methods utilized were Wire and Arc Additive Manufacturing (WAAM) and conventional manufacturing (CM) by forging, and comparative factors were energy demands, GHG emissions and generated solid waste. The total energy consumption in WAAM was 10,239.40 MJ, total carbon footprint in CO2 equivalent (CO2e) was 714.1 kgCO2e kg-1, and generated solid waste was 68.6 kg, respectively, 90%, 95% and 76% lower than consumption calculated in conventional manufacturing.
Keywords: 
Subject: Environmental and Earth Sciences  -   Sustainable Science and Technology

1. Introduction

Industry 4.0 has enabled a world of virtual and physical manufacturing systems that work jointly in a flexible way and on a global scale, with machines connected to each other to make decisions without human involvement [1,2,3,4]. The automation of the system and the exchange and accumulation of data in the production stages make the industry more productive and efficient, in addition to reducing waste [5,6,7,8,9]. A relatively new concept compared to other traditional processes on the market, additive manufacturing (AM) has proven to be essential to support this production shift present in Industry 4.0. It consists of a manufacturing method capable of creating objects on a large scale through a three-dimensional digital model [10,11,12,13]. Its application has proven to reduce use of materials and optimize the final product, as well as presenting high deposition rate and lower equipment cost. [14,15]. The F42 American Society Committee for Testing and Materials (ASTM) defined AM as a process of joining materials to make objects from 3D model data, usually layer upon layer, as opposed to subtractive manufacturing methodologies, thus obtaining, in a first result, a geometry closer to the final result of the part [16,17,18].
Among the various AM processes, the Wire Arc Additive Manufacturing (WAAM) stands out in the manufacture of metallic parts, aiming to save production time and cost by reducing raw material waste and generated energy, as well as making the production process more sustainable [19,20]. WAAM is a well-structured and complex process, derived from electric arc welding processes, in which a torch is used with continuous wire feed for deposition of base material [21,22]. Its effectiveness can be observed by carrying out a Life-Cycle Assessment (LCA), a method used for analyzing the environmental impact of a product, process, service or other economic activity, throughout its life cycle [23,24,25,26,27,28,29], being an important tool to help decision-making aligned with sustainable practices. It is, therefore, a comprehensive tool for quantifying and interpreting the environmental impacts of a product or service from cradle to grave, that is, from raw material extraction process to its final disposal [30,31].
In addition to environmental factors, LCA studies can be useful to evaluate cost and performance in order to improve decisions on processes and products. It can also identify transfers of environmental impacts and, aiding in control measurements, quantify emissions into the atmosphere, soil and effluents during the life cycle of a process or production [32,33,34]. Many LCA works allow the comparison between product and process alternatives, evaluating factors such as changes in the use of raw materials and production processes, in order to minimize their effects. For this purpose, it becomes necessary to evaluate the stages of the life cycle and their effects Subsequently, it is possible to carry out comparative analyses of life cycles of competing systems with the same function, to identify which one has lower impact in the environment by generating less pollution and requiring less resources, among other relevant indicators for decision-making [35,36,37].
LCA involves the collection, organization and evaluation of all inputs and outputs of a production system, allowing the analysis of the potential environmental impact throughout its life cycle. This comprehensive approach involves assessing all attributes and aspects related to natural environment, human health and resources, enabling the understanding and management of environmental impacts more efficiently. It also stands out for focusing on the perspective of products life cycle, which grants it a broad scope. This characteristic is fundamental to avoid the undesirable transfer from one phase of the life cycle to another, from one region to another [38,39].
Life-Cycle Assessment methodology can be useful to acquire a comprehensive knowledge of the environmental impacts generated by industrial products throughout their life cycle. However, in Latin America, local Life Cycle Inventory (LCI) data necessary for the industry is extremely scarce, despite initiatives to support LCA issues and ongoing efforts in developing local LCI data. The information needed for these evaluation methods can be measured or calculated, with consumption factors expressing the amount of materials and energy consumed by an activity per amount of final product, and emission factors expressing the amount of pollutant emitted by an activity per amount of final product generated or energy consumed [40,41,42,43,44,45].
However, despite many LCA applications, the methodology has limitations that should be take into account in the studies as well as in the evaluation of their results. In Brazil, in particular, the greatest limitations in LCA studies are national database unavailability, method uncertainty in relation to results for decision making, difficulties collecting primary data, complexity in life cycle inventory (LCI) phase, difficulty comparing quantitative results of studies with the same object and high cost and time spent to execute an LCA.
Since there is an environmental context of large emissions, discards, resources exploitation and environment degradation, it becomes increasingly necessary to change production processes and the initiative of industries to invest in these changes. By using norms, bibliographic research and collection of experimental data, this work proposes, in a Life Cycle Analysis, a comparison between two manufacturing methods: conventional subtractive manufacturing by forging and Wire and Arc Additive Manufacturing (WAAM), of the same flange piece, using energy demands, greenhouse gas (GHG) emissions and waste generated in each production process as comparative factors.

2. Materials and Methods

This work was developed by the National Laboratory of Welding Technology (LNTSold) and the Air Pollution Control Laboratory, both located at the Technology Center of the Federal University of Rio de Janeiro, Brazil. It aims to perform a comparative LCA between two manufacturing methods of the same flange part whose main function is to seal the connection between two pipes, preventing any fluid from escaping at these junctions.
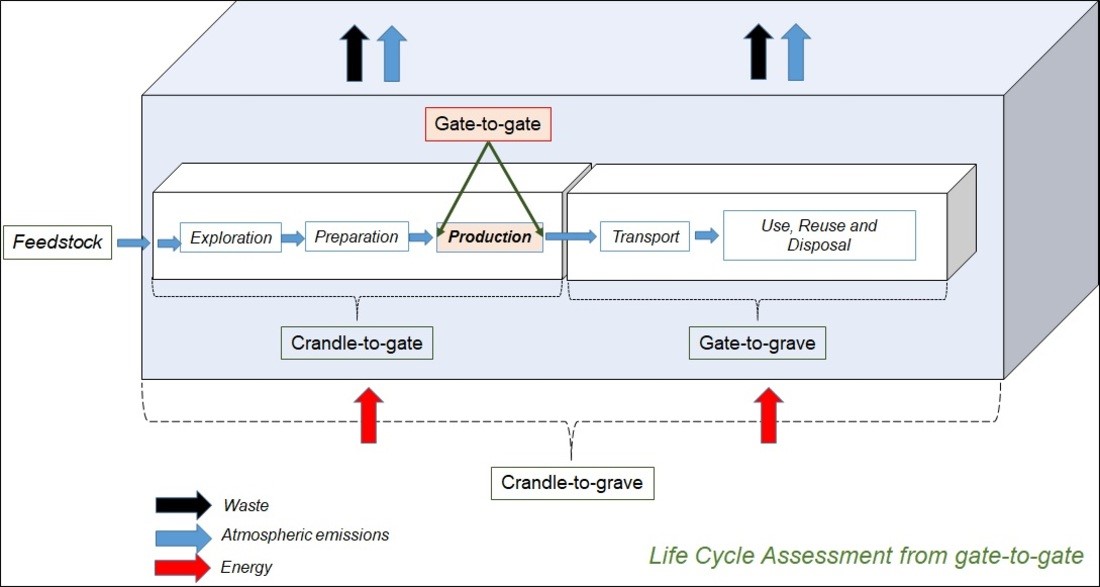
Life Cycle Assessment (LCA) was prepared in accordance with the ABNT NBR ISO 14040:2009 and ABNT NBR ISO 14044:2009 standards [46,47], with three defined stages: objective and scope; inventory analysis; and impact assessment. One more phase, interpretation, was added and is present in all stages, as shown in Figure 1.
This work adopted, as functional unit, the production of a flange unit considering the limit of gate-to-gate systems, and the phases assessed for the work analysis comprehend the material production until its manufacture in the factory. The study was restricted to the stage in which the company operates directly, within its production processes, having the transport stages removed from the analysis.

2.1. Data Quality

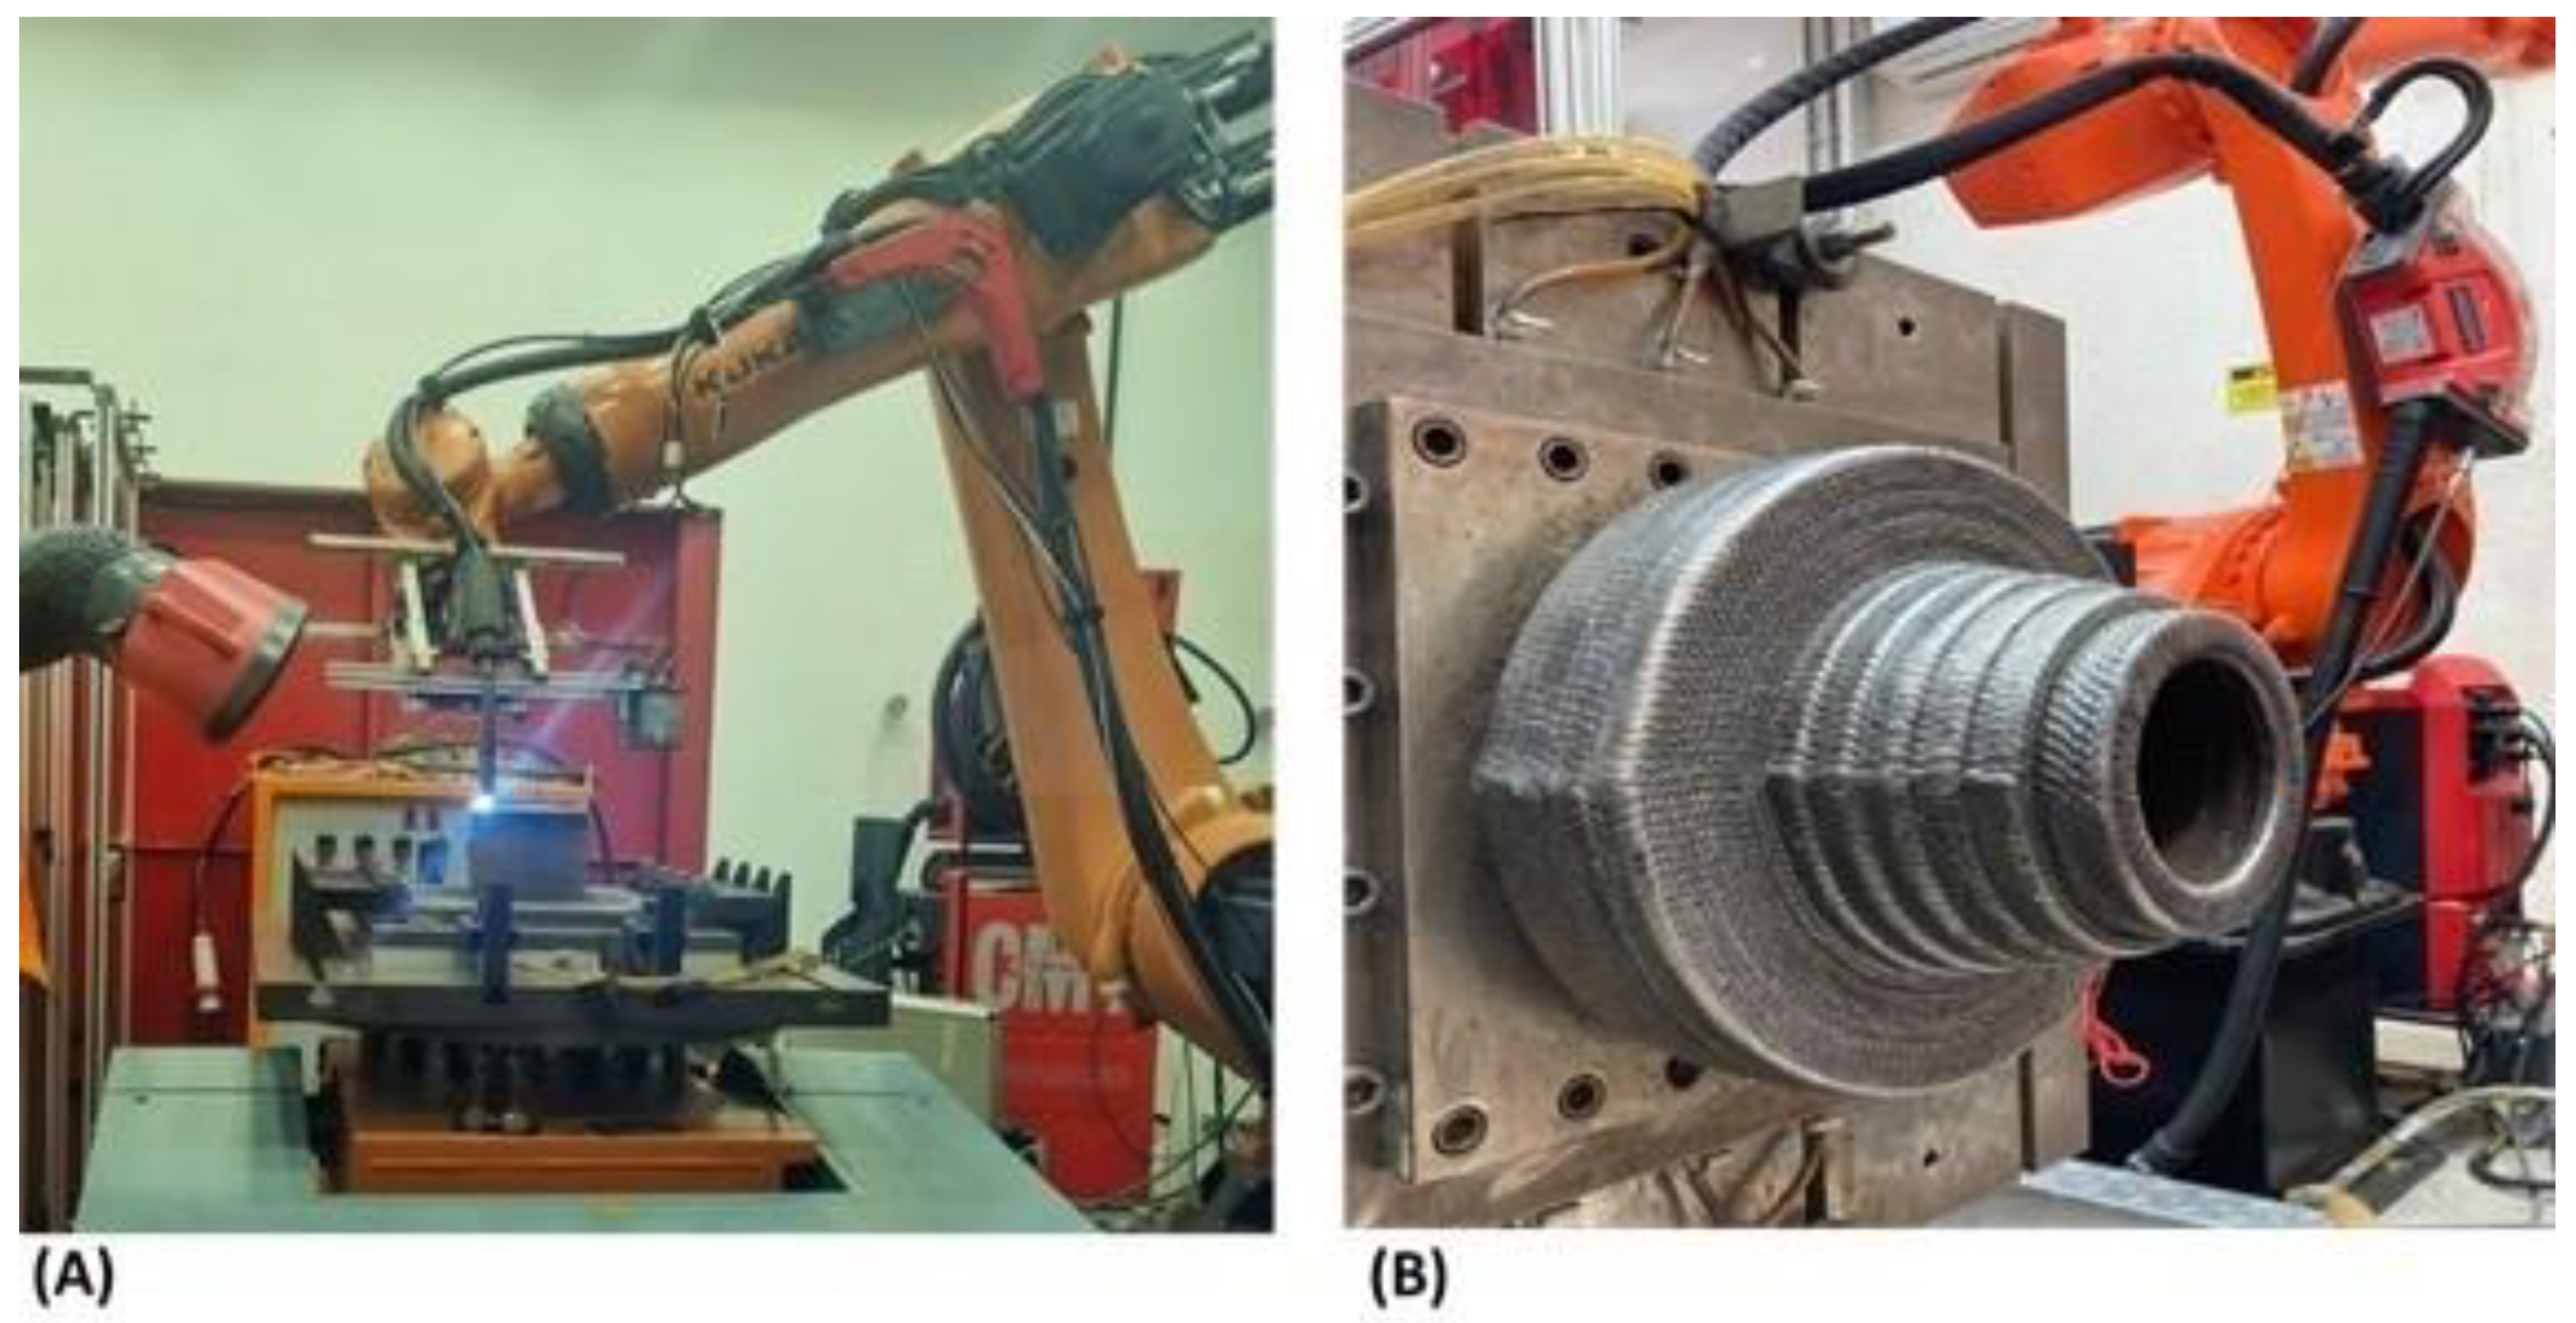
For the study to be successful, data quality and reliability are essential items. Thus, it used data from primary sources for information on WAAM system inputs and outputs measured by LNTSold laboratory. Figure 2 shows the construction of the flange part carried out in laboratory to obtain experimental data. Secondary and other data were obtained from bibliographic research and database.

2.1.1. Product and Equipment Edge System

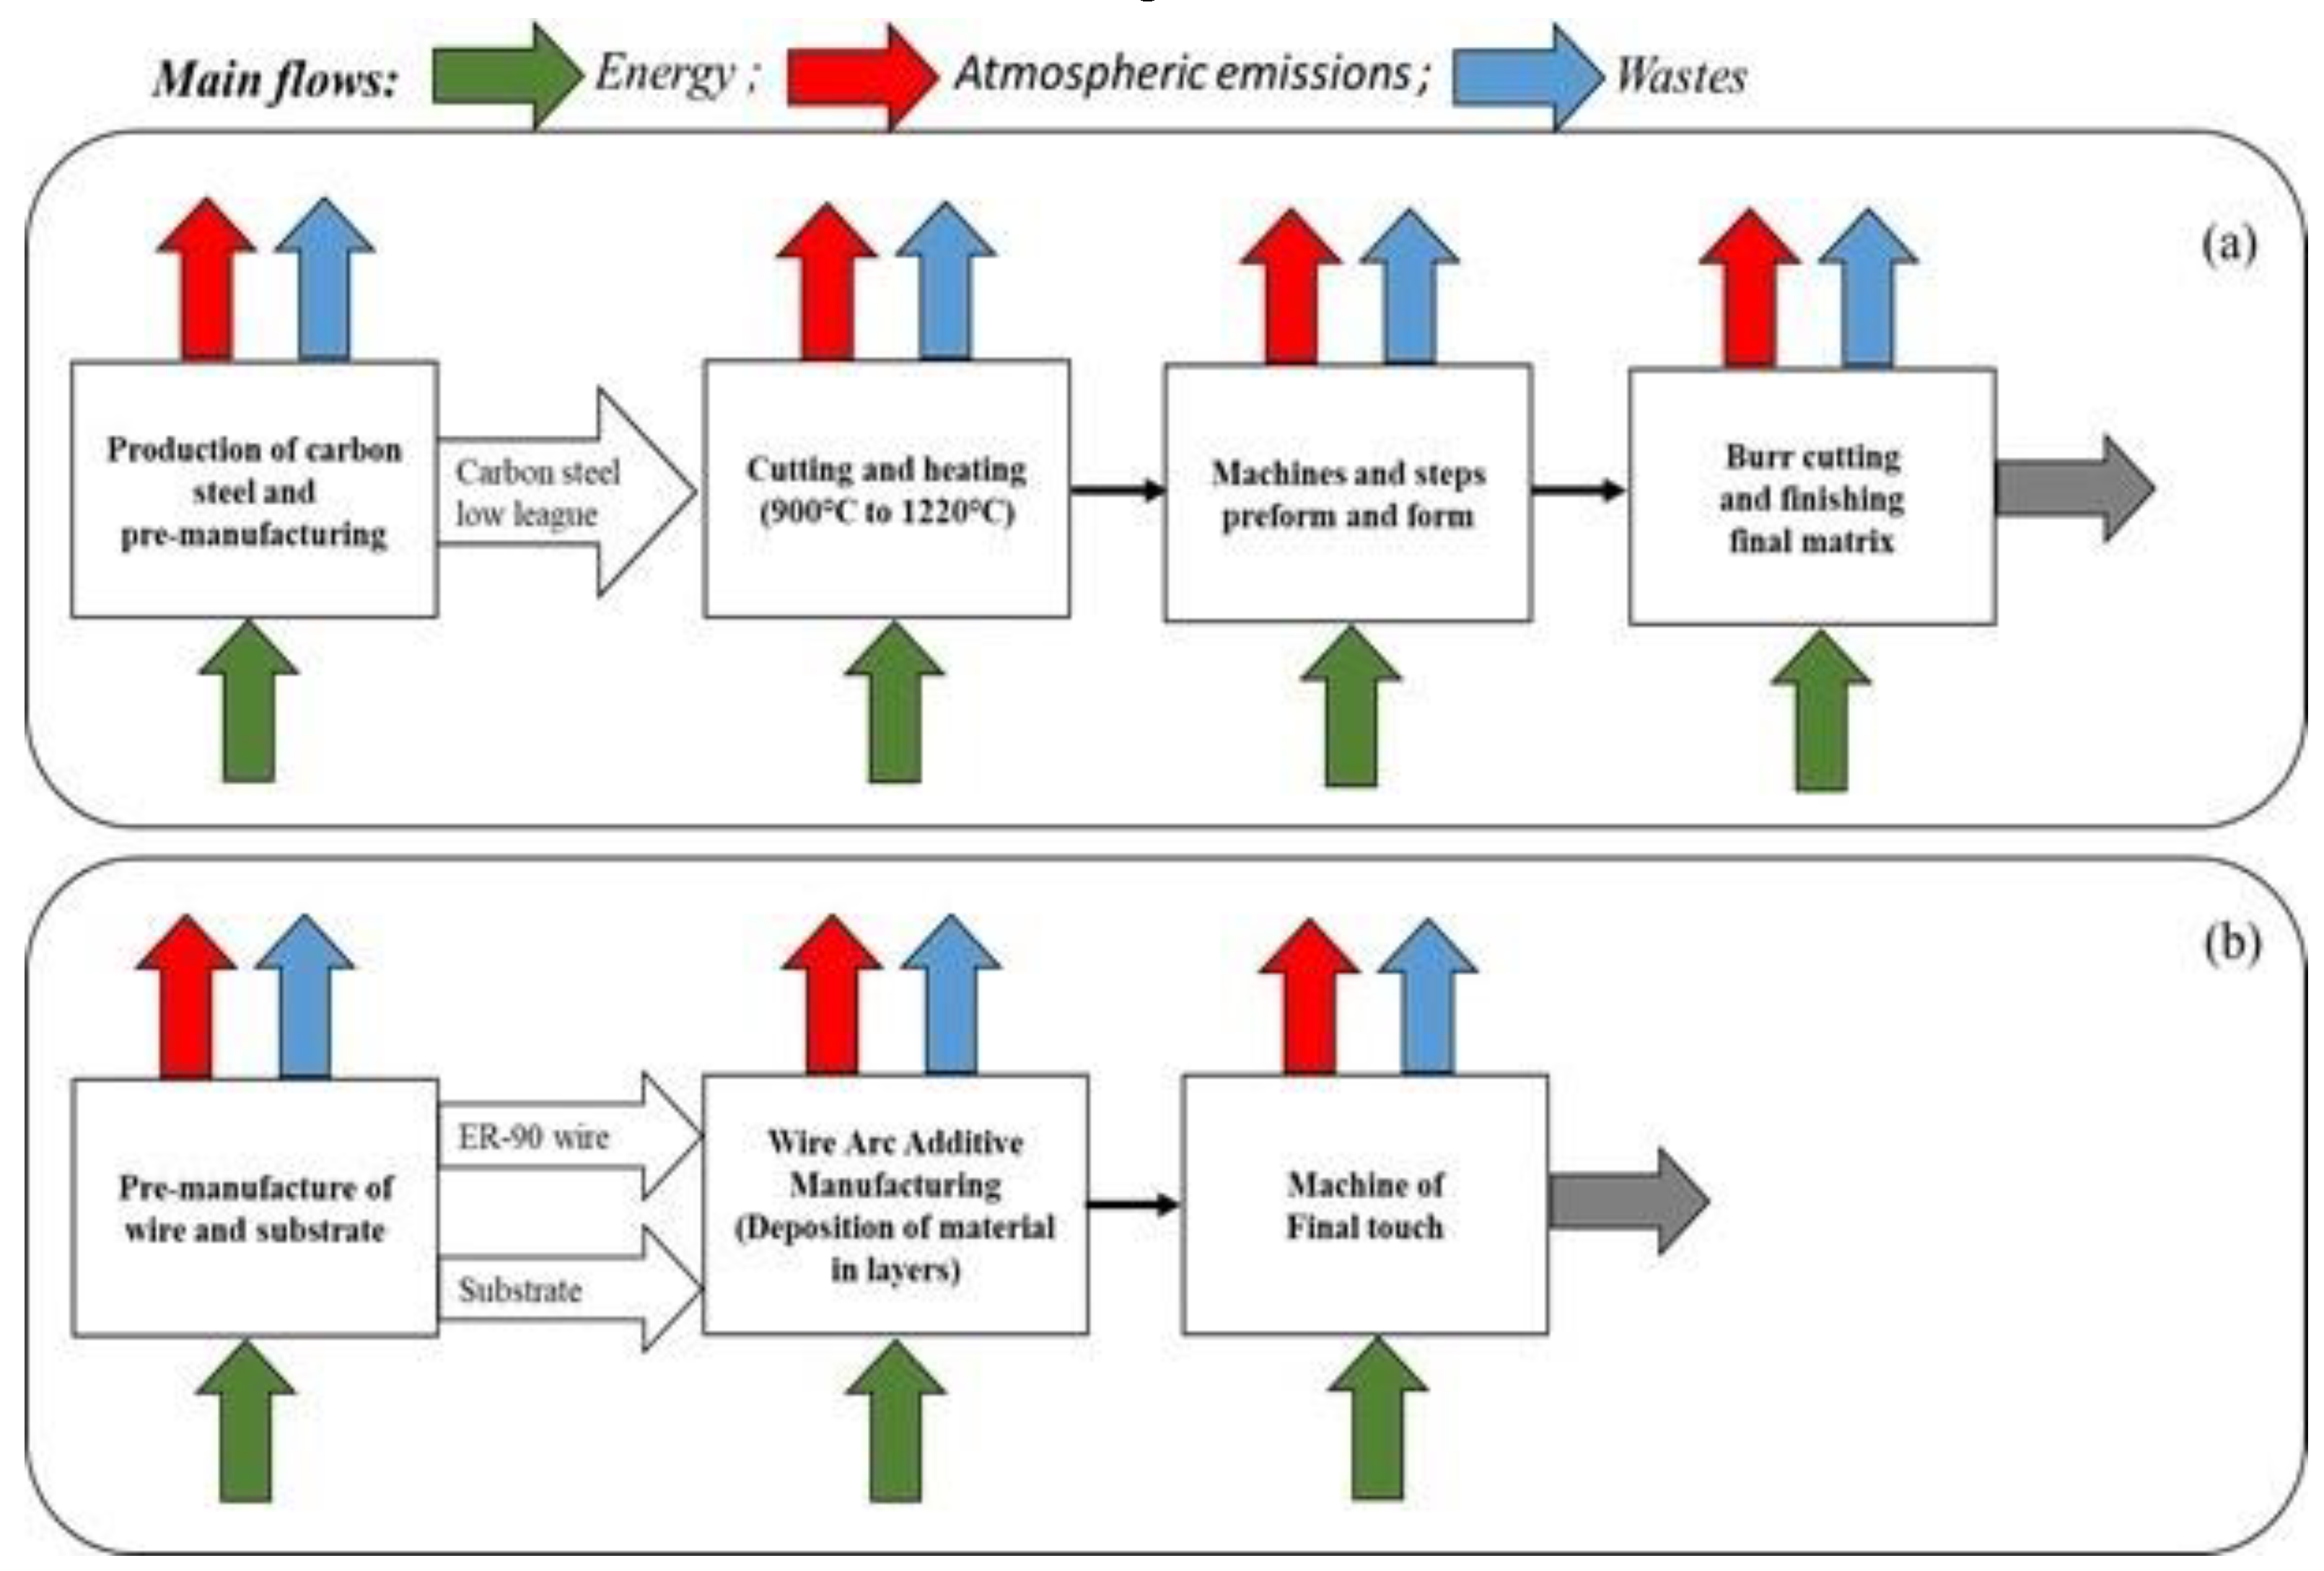
WAAM edge systems and conventional manufacturing are shown in Figure 3. Figure 3a shows the part production sequence by conventional manufacturing, using low alloy carbon steel, and Figure 3b presents WAAM flange production sequence, using ER-90 wire for the part production. Inputg flows work as electricity for running machines, while outputs are the gases emitted in the process and the solid waste discarded at each stage.

2.2. Life Cycle Inventory Analysis (LCI)

2.2.1. Conventional Manufacturing Data (Forging)

Data referring to the process shown in Figure 3a were found in literature per kg of the built part using the forging method [48] and, to obtain the results, they were multiplied by the mass used in the process to obtain a flange. Value of the raw material mass used in the calculation of results was based on the size of the flange produced by WAAM, obtaining a value of m = 340.5kg.

2.2.2. Impacts on WAAM Material Production and Pre-Manufacturing

The first stage of Figure 3a took into account the material fabrication, its hot rolling into large plates and wiredrawing. At this manufacturing stage, it was possible, with the use of literature [49], to obtain data on energy spent in the respective processes and emission of greenhouse gases (GHG) directly or indirectly into the atmosphere in CO2 equivalent (CO2e), and the results were 54.8 MJ kg-1 and 4.35 KgCO2e Kg-1, respectively.
Using information from Worldsteel Association (WSA) and Aço do Brasil institute, it was possible to obtain data on greenhouse gas (GHG) emissions in CO2e, waste generation and embodied energy related to crude steel production. It was also possible to remove emission data using the OpenLca software, and agribalyse database that contains some Ecoinvent data. The methodologies used were IMPACT 2002+, ReCiPe 2016 Midpoint (H) and IPCC 2013 GWP 100a. The values are shown in Table 1.
According to the Brazilian Steel Industry, in its 2021 sustainability report, more than 90% of co-products and waste generated in the steel production process can be reused. Its uses are diverse such as primary coating, bases and sub-bases to replace gravel, and in agriculture as a corrective of soil acidity replacing limestone. Even blast furnace slag is used in cement production. The calculation of stand-by times in the WAAM is shown in Table 2.
The time spent in deposition (Tmad) was calculated through the consumption of shielding gas. Once the consumption flow of 15 L/min, and the amount of volume used for deposition of 55,000 L, are known, the value obtained was 61.1 hours. The energy incorporated into the shielding gas for the WAAM deposition system was calculated and a value of 0.03 MJ/L obtained, considering shielding gas with a mixture of Argon with 8% of CO2. During the machining of the part, the material is extracted and removed, the holes in the flange are made, obtaining the part in its final format, ready for use. Machining data are presented in Table 3.

2.3. Life Cycle Impact Assessment (LCIA)

2.3.1. Calculation of Energy Demand in WAAM Process

In the second stage of the production process, shown in Figure 3b, the electrical energy required during the process was evaluated. For this calculation, the energy consumed by the machine in 2 operating moments was considered: during stand-by and during material deposition. Energy demand is calculated according to Equation (1):
E W A A M 2 = ( P m a s b ×   T m a s b ) + P m a d × T m a d + ( E g á s × C g × T m a d )
where,
E W A A M 2 : electrical energy demand of the WAAM unit process in step 2 (MJ)
P m a s b : WAAM system power demand in stand-by mode (kW)
T m a s b : time of initialization, configuration and wait between layers and strands (h)
P m a d : WAAM system power demand in deposition mode (kW)
T m a d : deposition time (h)
E g á s : shielding gas embodied energy (MJ/L)
C g : shielding gas consumption rate (L/h).
In step 3 of Figure 3b, for finishing machining, 2 machines are used, one to machine the internal diameter and the external part ad other to make the holes in the flange. For this stage, the operating and stand-by time of the machines was disregarded and the operating times were estimated according to manufacturing information. The required electrical energy was calculated according to Equation (2):
E M A A A 3 = ( P m q 1 ×   T m q 1 ) + P m q 2 × T m q 2
where,
EWAAAM3: electrical energy demand of the WAAM unit process in step 3 (MJ)
Pmq1: machining machine power demand (inside diameter) (kW)
Tmq1: machine time (h)
Pmq2: power demand of the machining machine (parts hole) (MJ)
Tmq2: final finishing machine time in cutting (h)

2.3.2. Calculation of CO2e Emissions in WAAM Process

To transform this measured energy into CO2 emissions in the environment, it is necessary to calculate the Carbon Emission Factor (CEF), an estimate of CO2 amount associated with a given electrical energy generation. This study is carried out by the Brazilian Ministry of Science, Technology, Innovations and Communications, which prepares constant inventories on CO2 Emission Factor in electricity generation in Brazilian National Interconnected System and makes them available on its online portal [50]. Through the CEF it is possible to value the environmental impact using electricity in machinery, and the average in the last 5 years, from 2018 to 2022, was calculated as 0.0759. It became then possible to calculate the average value of the Carbon Emission Factor of the local electricity network as 0.4943 kgCO2 kWh-1.
To calculate CO2 emission in the WAAM production process it was necessary to use electrical energy demands in WAAM found and applied in Equation (3):
C O 2   W A A M = (   E W A A M 2 +   E W A A M 3 ) × C E F + C f g a s
where,
C O 2   W A A M : CO2 emission in WAAM (kgCO2e)
E W A A M 2 : energy demand of WAAM unit process in step 2 (kWh)
E W A A M 3 : energy demand of WAAM unit process in step 3 (kWh)
C E F : Carbon Emission Factor of local electricity grid (kgCO2e kWh-1)
C f g a s : Carbon footprint related to shielding gas (kgCO2e)
In order to calculate the greenhouse gases (GHG) emission in CO2e in this work, it was necessary to convert the gas volume (Argon + 8% CO2) to kg. Using the European Life Cycle database and the Intergovernmental Panel on Climate Change [51,52], we could obtain the GHG emission factors involved in the production of gases, in kgCO2e Kg-1, for argon and CO2, 0.88425 and 0.811, respectively. The total CO2e emission present in shielding gas is shown in Table 4.

2.3.3. Calculation of Waste Generation from Conventional and Additive Manufacturing

Considering steps 2 and 3 of WAAM process (Figure 3) and steps 2, 3 and 4 of conventional manufacturing by forging, it was possible to calculate the amount of waste generated by the difference, in mass, between the amount of material used at the beginning of production and in the final part. For additive manufacturing, initial mass was considered as the wire amount necessary to manufacture the part, and for conventional manufacturing, initial mass was considered as the initial block mass before forging. The calculation is performed from Equation (4).
S o l i d   w a s t e   k g = I n i t i a l   m a s s w i r e   o r   b l o c k   k g F i n a l   m a s s   ( k g )
It is important to point out that at WAAM there is also the substrate used as support in the manufacturing process, cut and discarded at the end of production.

3. Results and Discussion

With primary and secondary data, measured and collected, presented in “Methodology”, it was possible to obtain information regarding energy demand, CO2e emissions and solid waste generation in the life cycle of the product manufactured using conventional methodology by forging and WAAM. The results obtained are shown on Table 5 and Table 6.

3.1. Environmental Impact

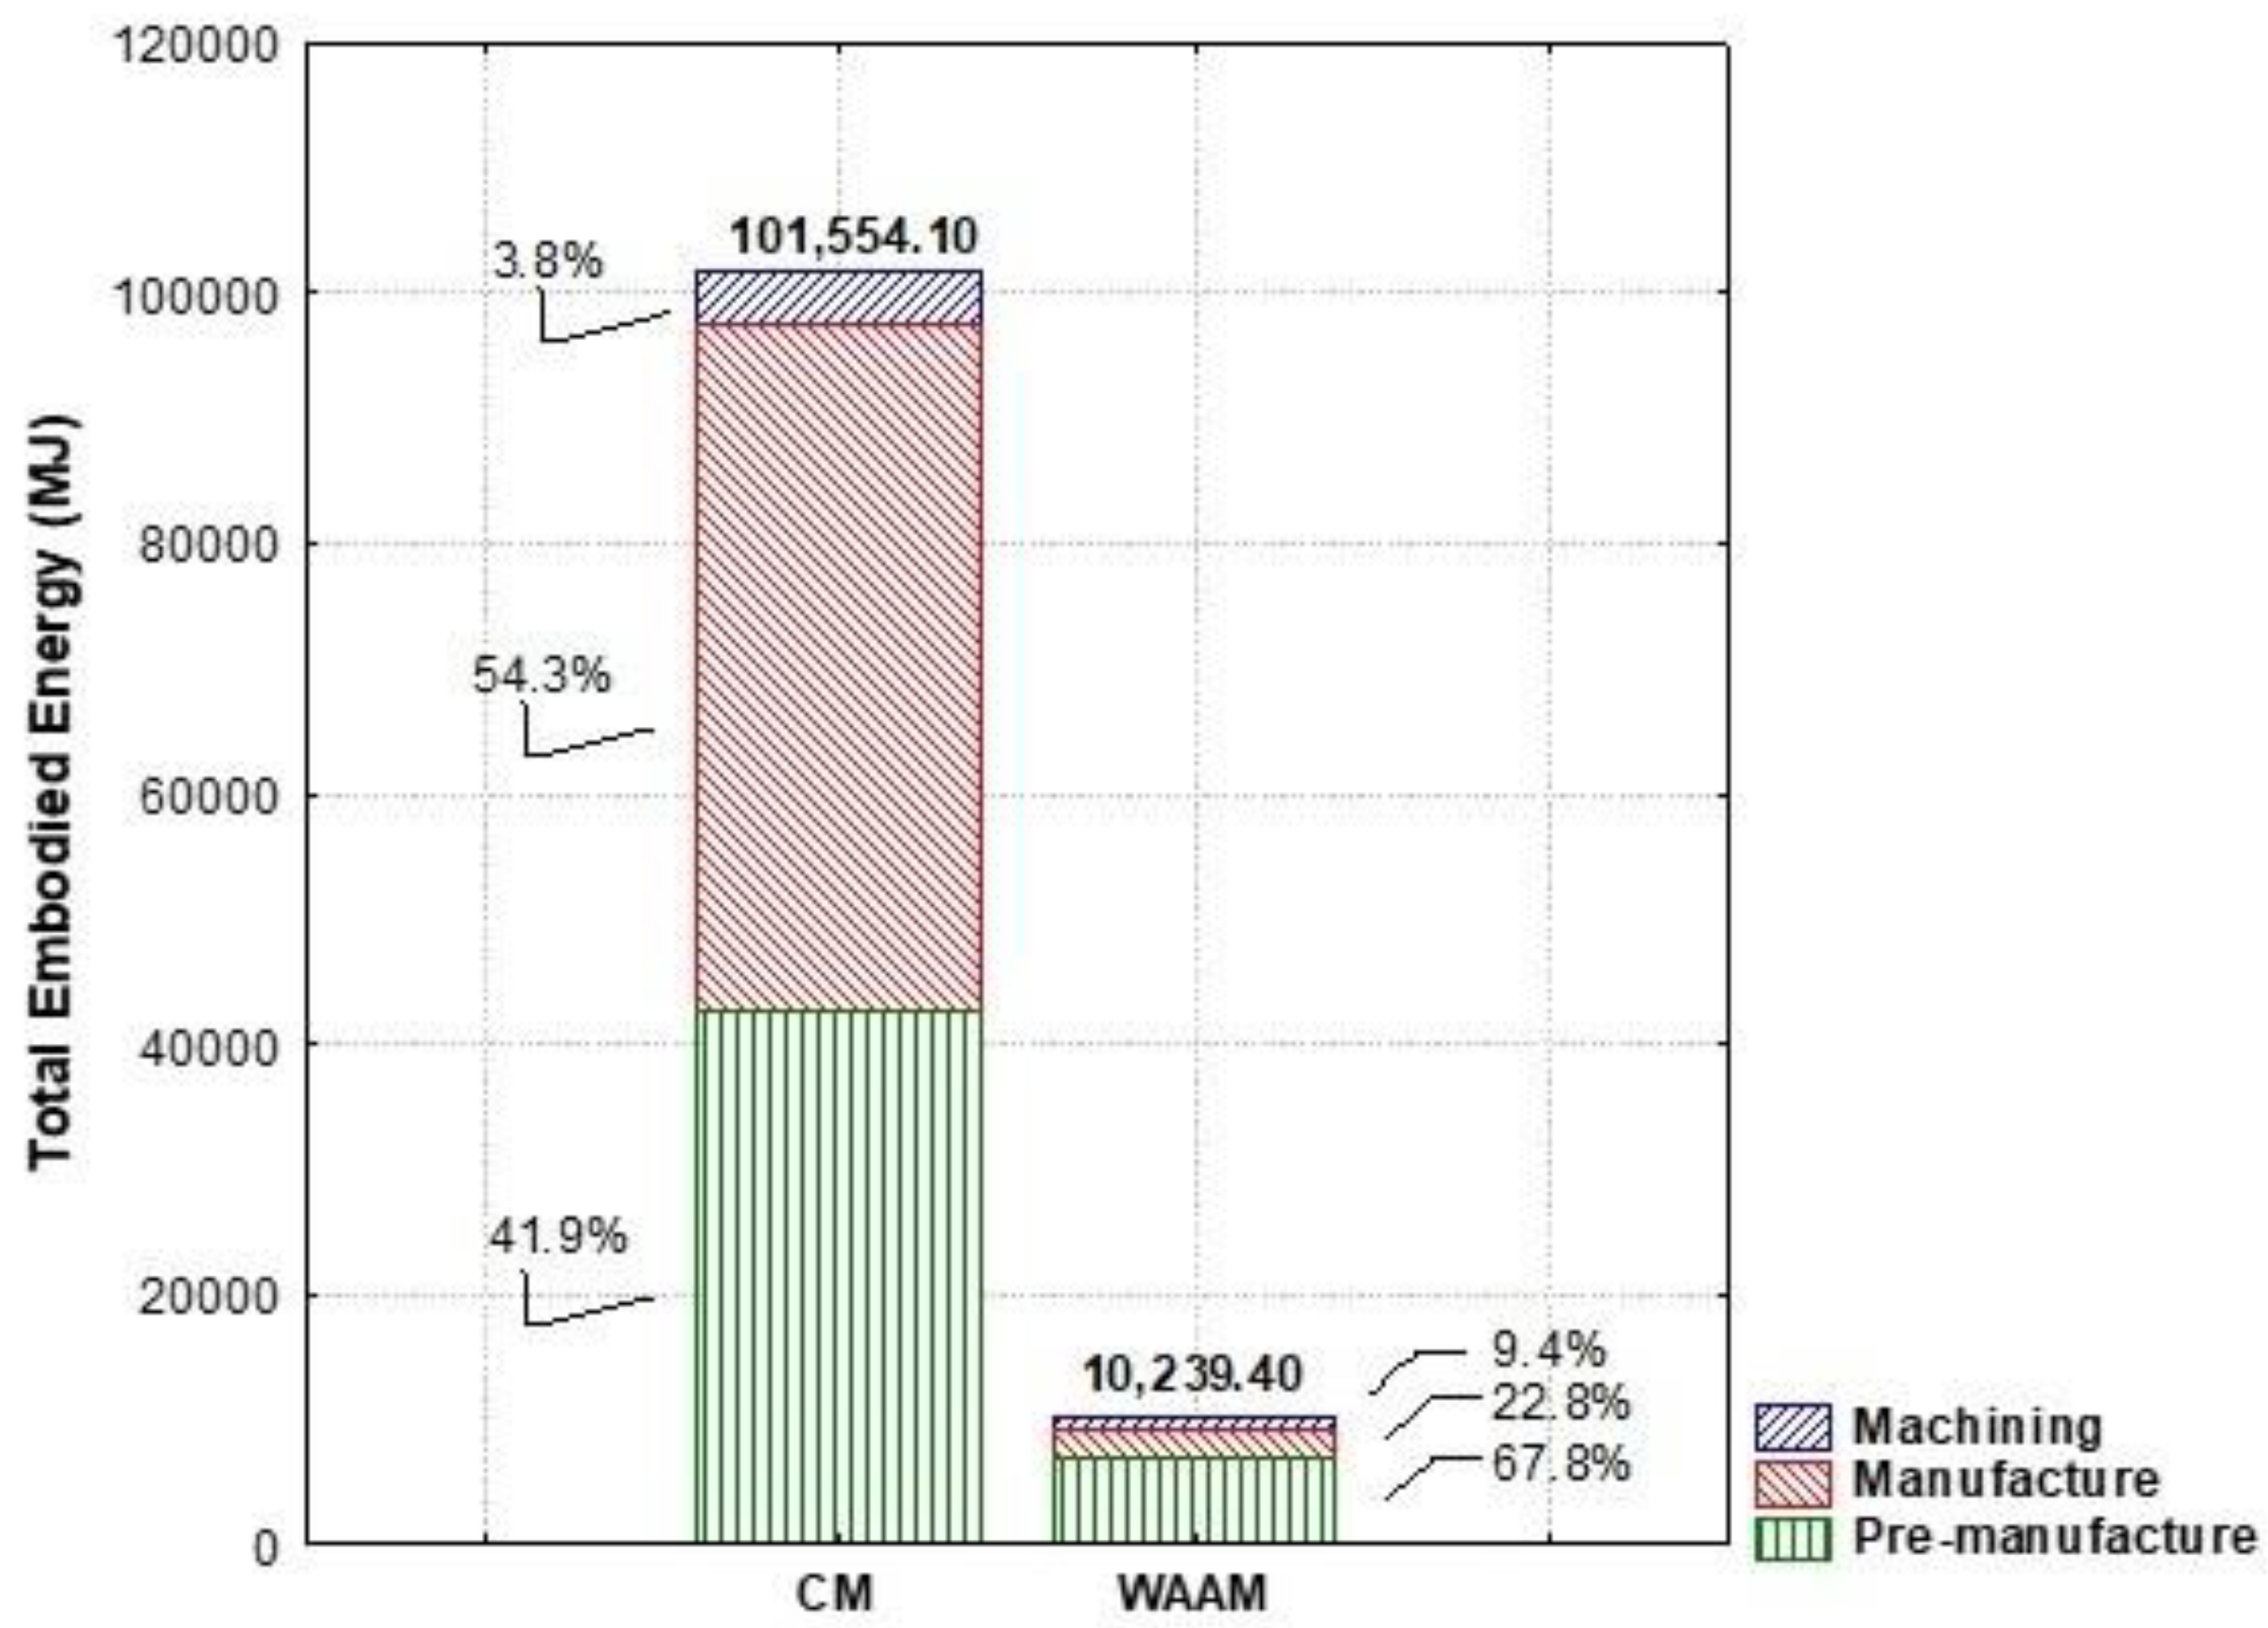
By using the data collected, modeled and calculated in the conventional and WAAM manufacturing processes presented in Table 5 and Table 6, we observed that the WAAM pre-manufacturing stage was the one that consumed the greatest amount of energy, 67.8% of the total, followed by the deposition manufacturing and the machining steps, with 22.8% and 9.4% energy consumption, respectively. The deposition manufacturing phase is dependent on the deposition rate of the solder material and in this work the Pulsed GMAW process was used, with 1.2 mm wire diameter and 1.9 kg h-1 melting/deposition rate. The WAAM process machining step showed lower energy consumption, 9.4%, as this phase is very efficient and spends shorter time and, consequently, lower energy consumption. The production stages of raw materials and pre-manufacturing were responsible for the highest electricity expense in both manufacturing techniques. The total result obtained from energy consumption in conventional manufacturing was about 90% greater than in WAAM, shown in Figure 4.
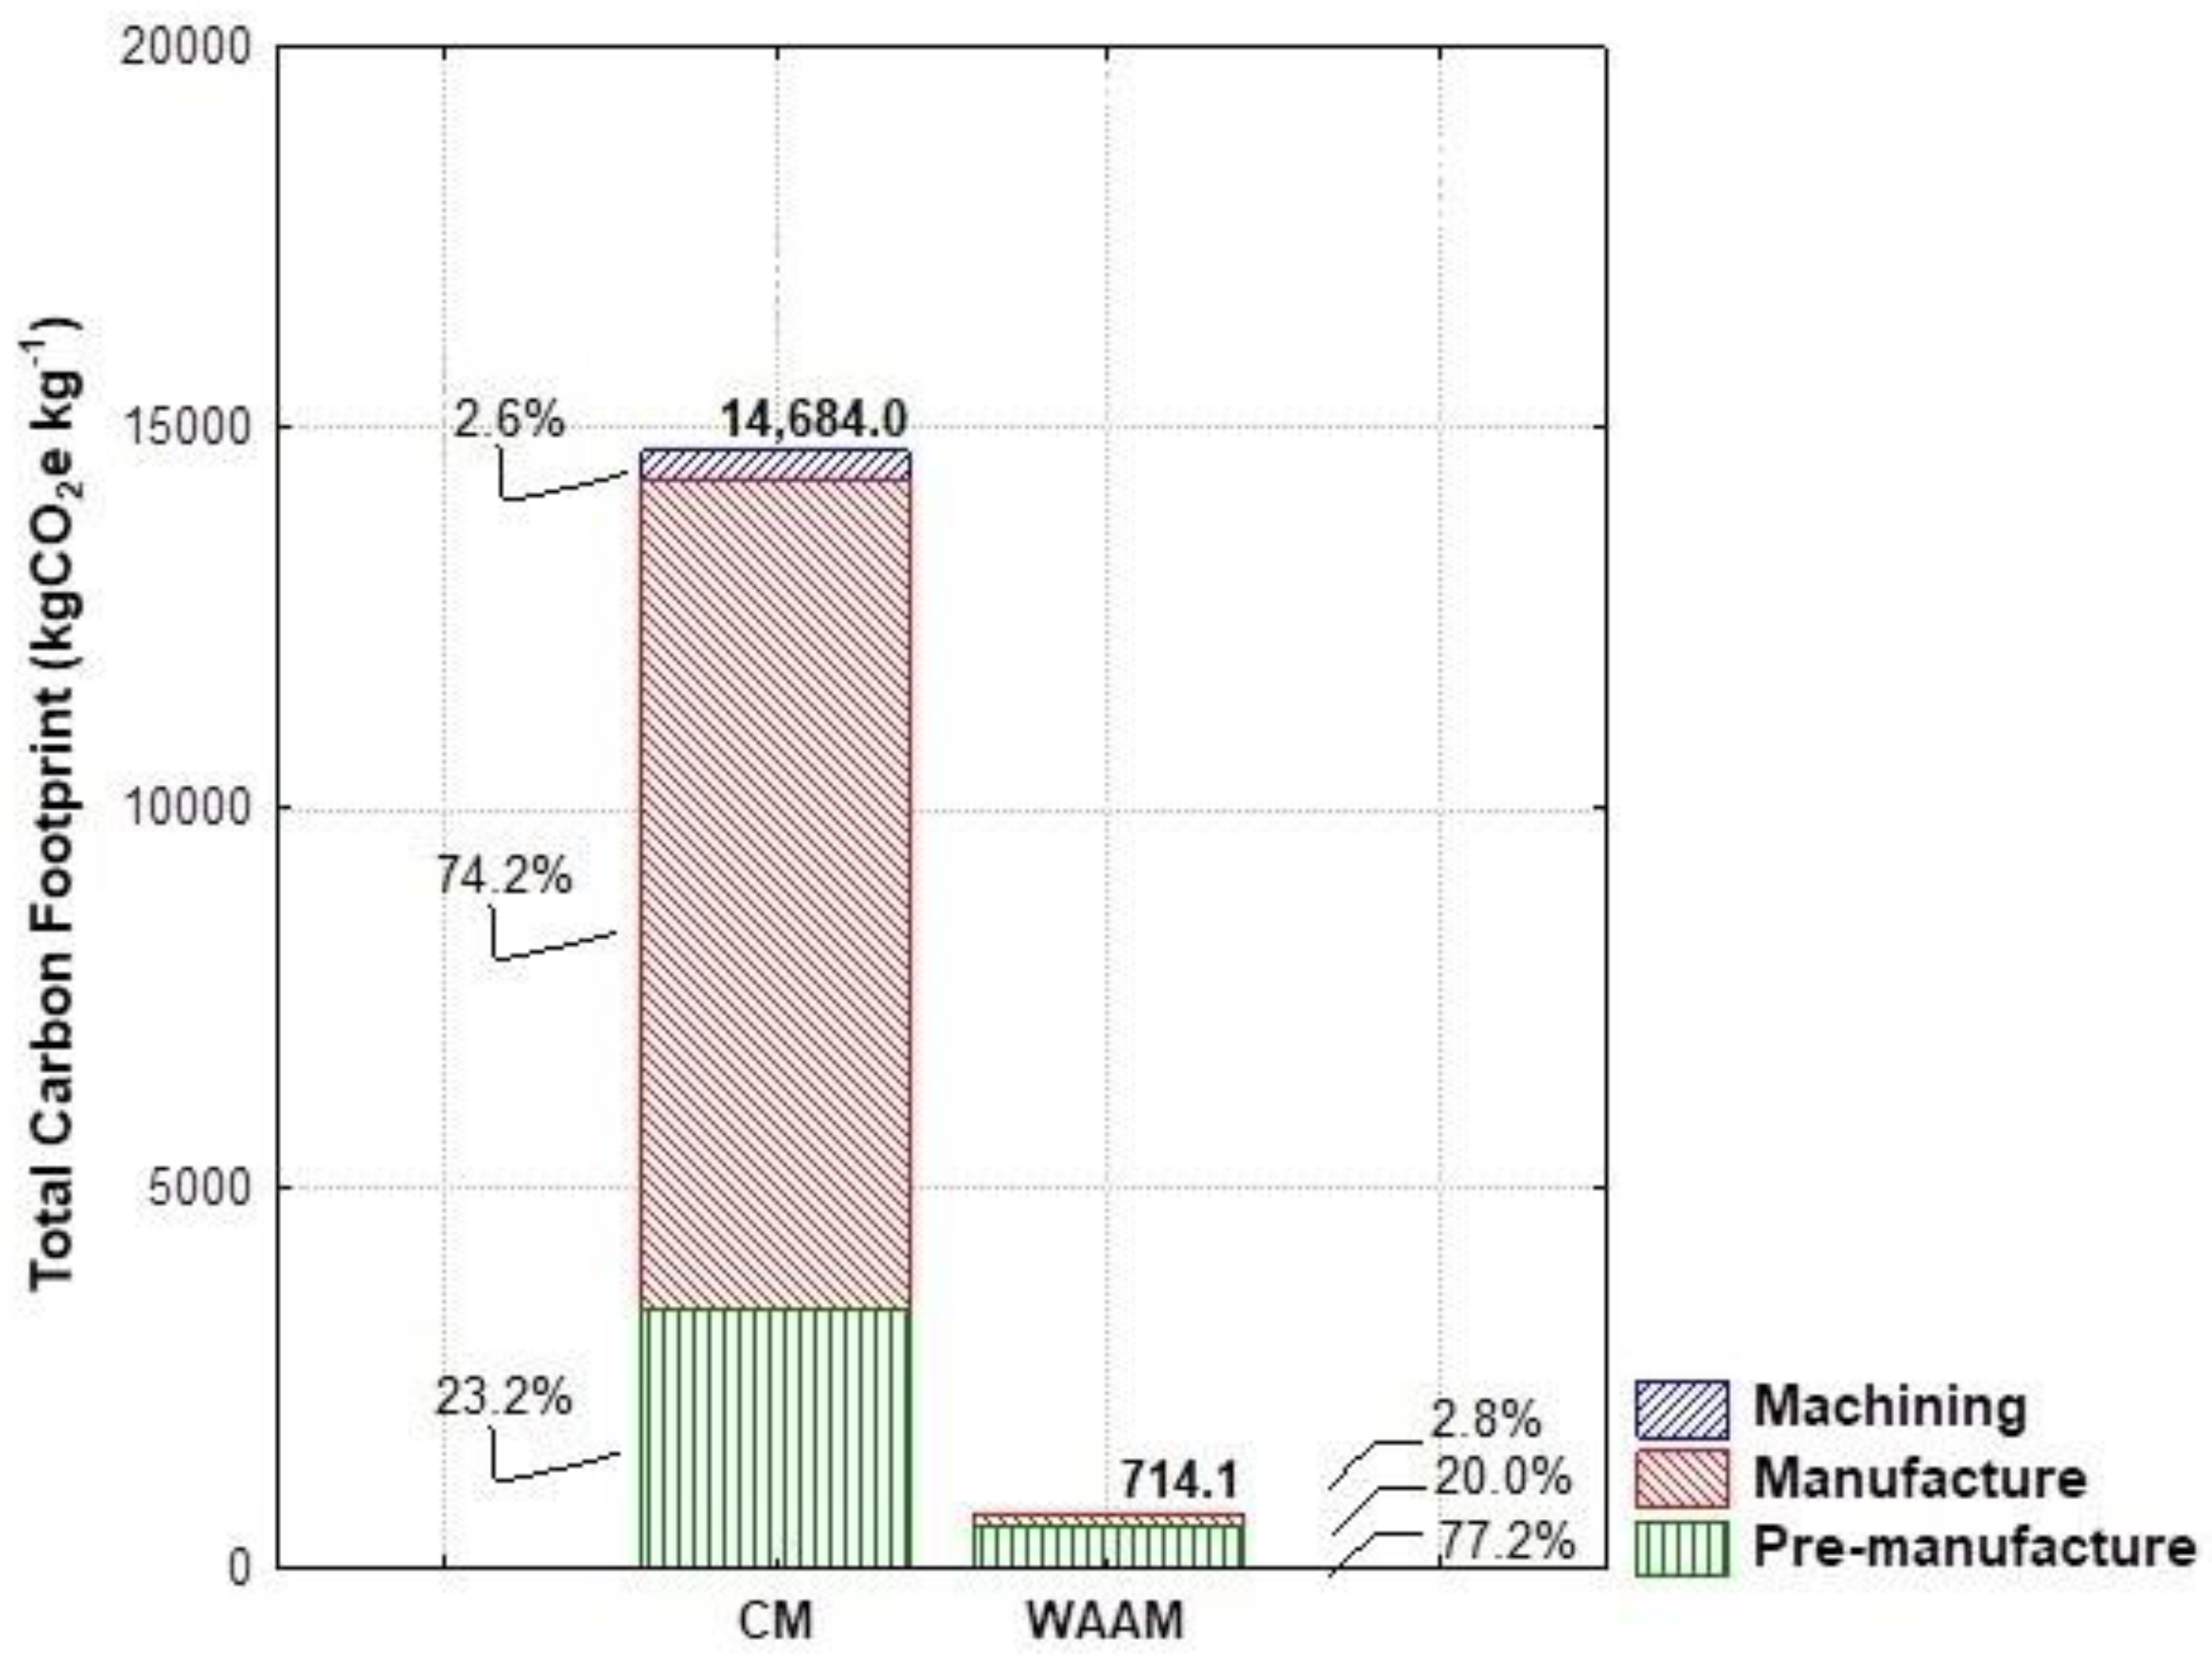
In WAAM, the highest CO2e emission occurred in pre-manufacturing, 77.2%, followed by deposition manufacturing with 20.0% and machining with 2.8%. It is important to highlight that in the deposition stage, the gas was only used during deposition and, when the machine was in stand-by mode, the shielding gas was not released from the cylinder. The greater the amount of material used in the manufacturing process, the greater the emission of CO2e. Reductions in environmental impact are predominantly propelled by reduction of shielding gas and electricity for fume extraction per kilogram of printed material. The result obtained from the total carbon footprint in conventional manufacturing was approximately 95% greater than in WAAM and is displayed in Figure 5. Conventional manufacturing generated higher CO2e emissions in steps 2 and 3 of Figure 3b, which requires high temperatures, consumes a lot of energy and consequently generates high concentrations of greenhouse gases.
In 2019, Brazil produced about 30 million tons of crude steel (WSA) and the global CO2 emissions of the steel sector in the same year were approximately 3.6 Gt, representing more than 8% of total energy use and than each ton of crude steel, generating about two tons of CO2 emissions [53]. In this context, when compared to conventional manufacturing, WAAM would be a promising manufacturing technique in terms of environmental impact.
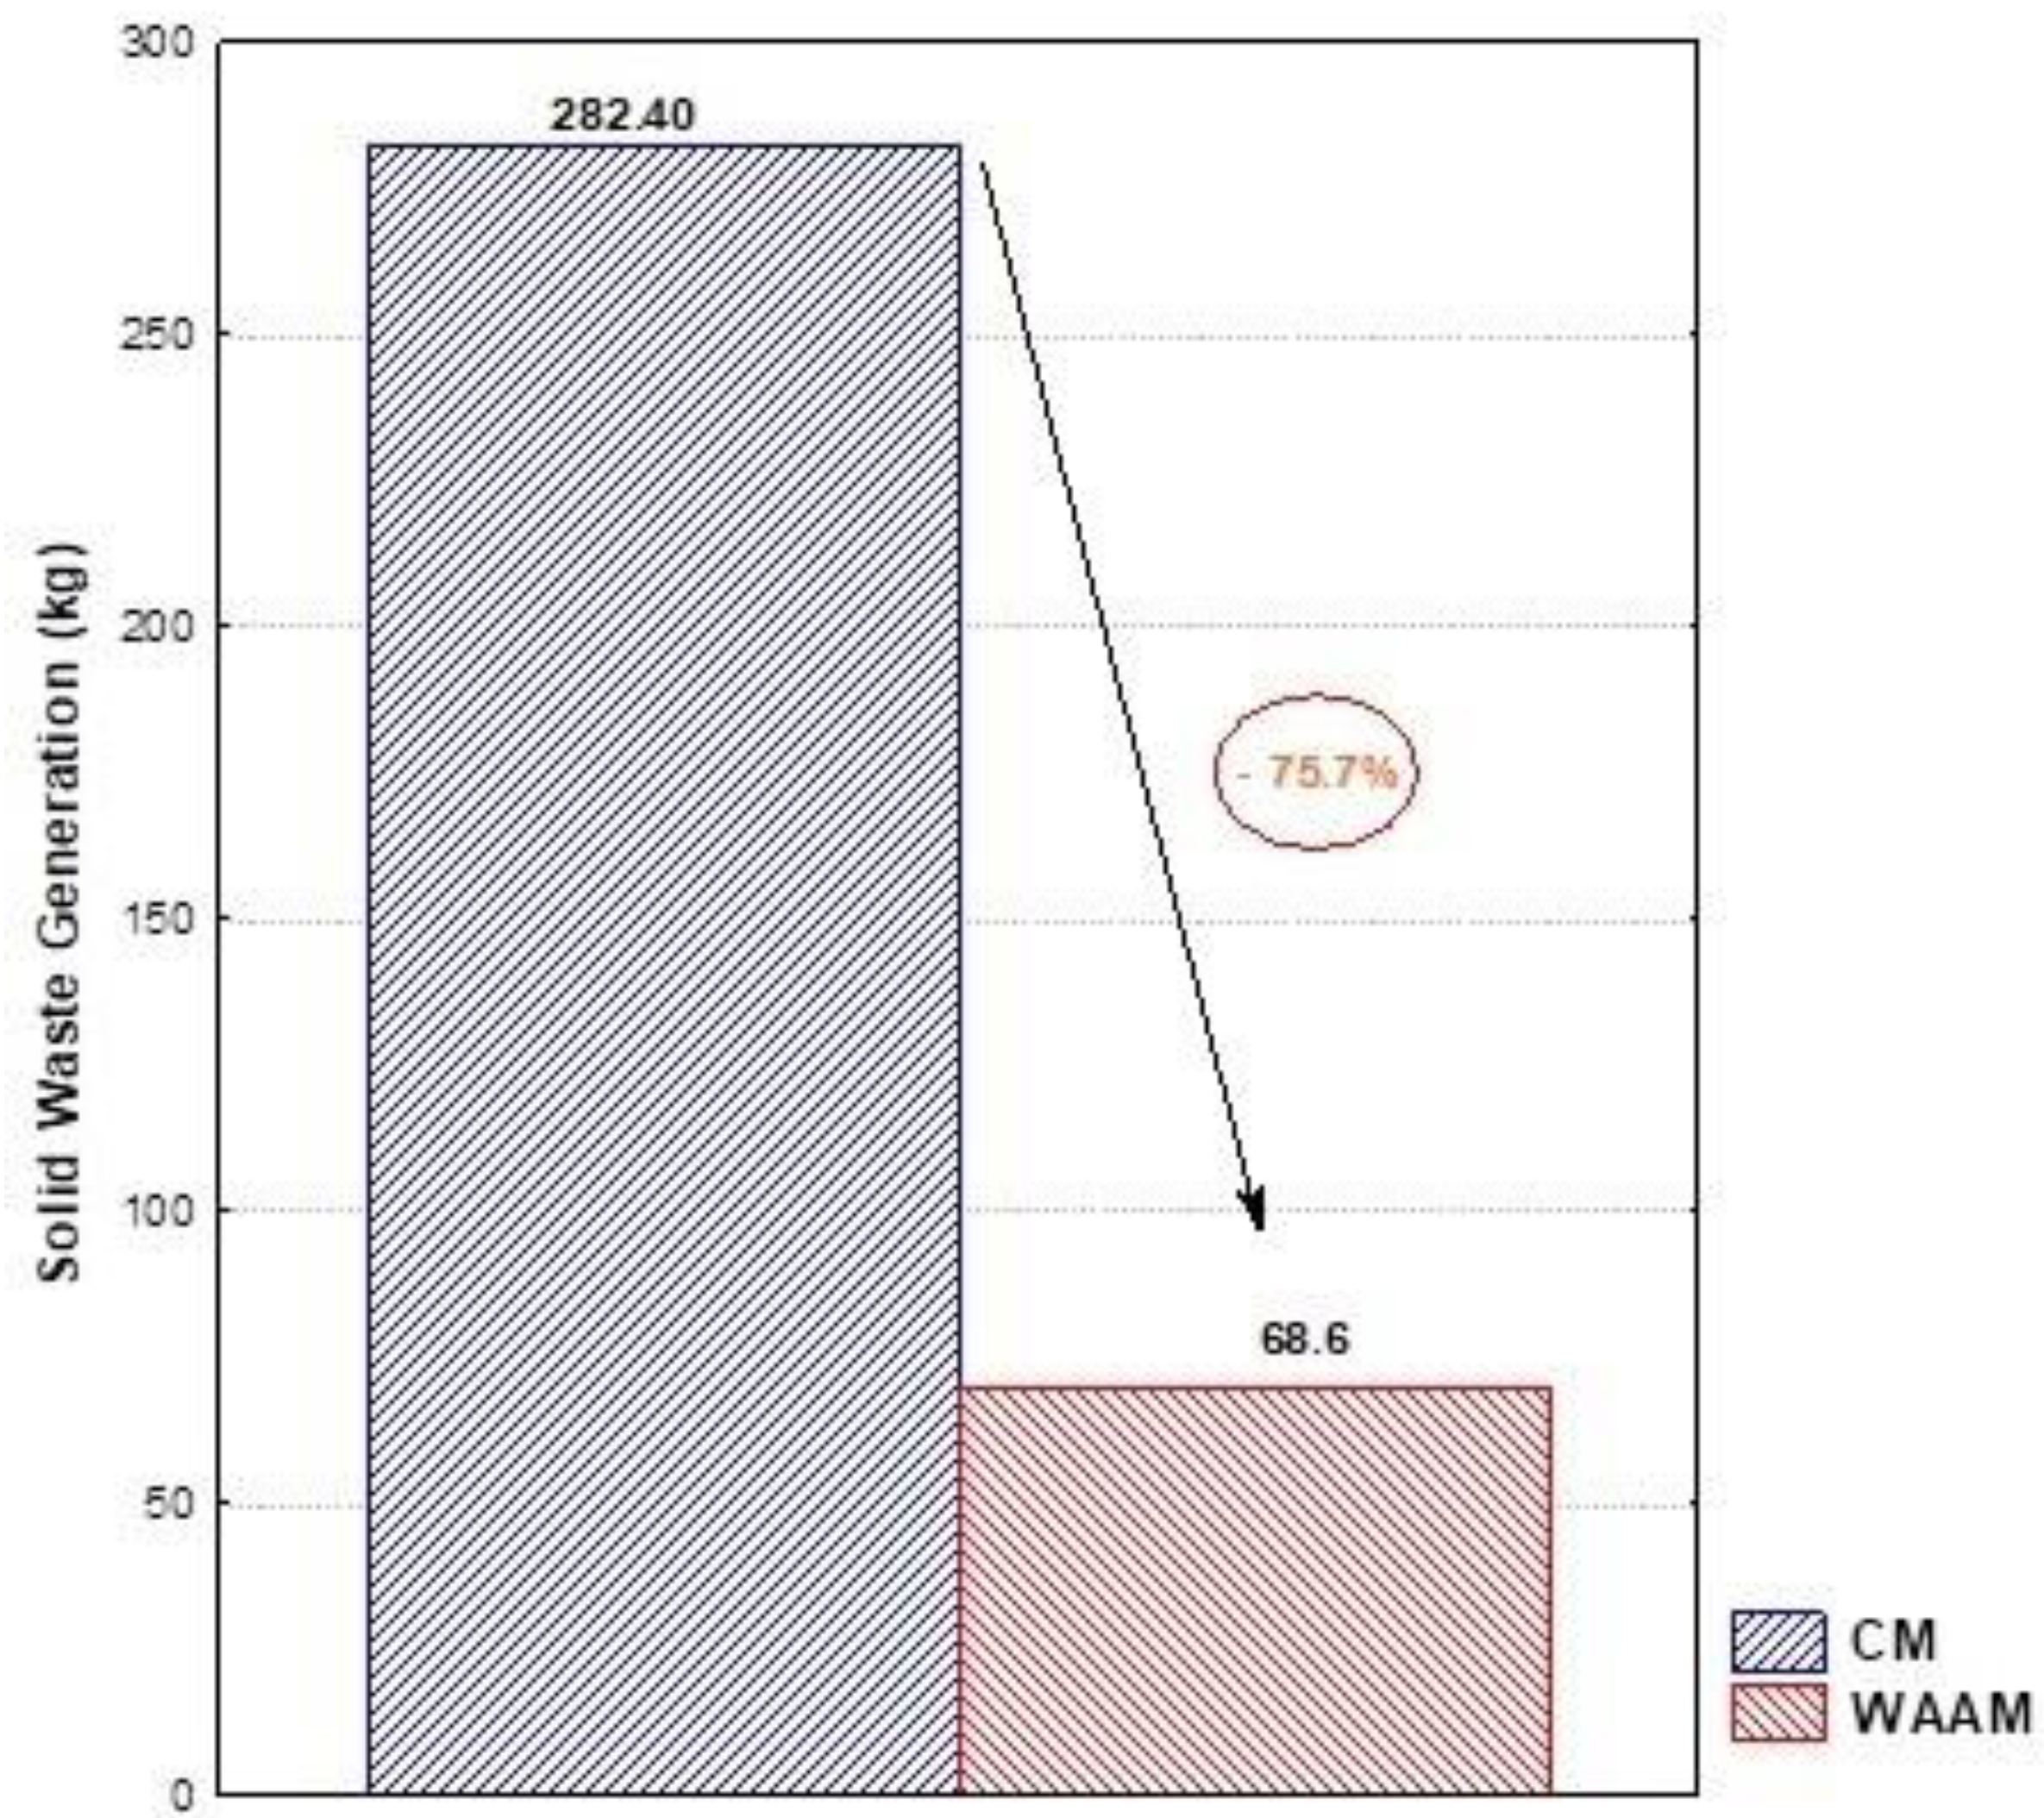
Solid waste generated in WAAM was 75.7% lower than in conventional manufacturing, proving that WAAM consumes less energy and emits less greenhouse gases into the atmosphere. Figure 6 shows the difference, per kg, of solid waste generated in the two manufacturing systems. Traditional manufacturing processes often involve cutting and shaping materials, causing additional waste and potentially lower energy efficacy compared to WAAM.
It is important to emphasize that at WAAM there is also the substrate used as support in the manufacturing process, cut from the part and discarded after production. However, it is important to note that this iron plate, the substrate, has a high recycling potential, since it presents little alteration during the process. There is a difference in the waste generated in the two processes: in WAAM the waste generated consists of iron chips, that is, small pieces of cast iron from the machining process. In conventional manufacturing, the main generated residue is mill scale, a superficial exfoliation formed by oxidized residues. That is to say scale is iron oxides, therefore, it has low recycling value, unlike cast iron chips.

4. Conclusions

Steel industry contributes to the harmful effects in the environment through material waste, resource and energy consumption and CO2 emissions, besides other greenhouse gases related to climate change. In this sense, Life Cycle Assessment (LCA) was the method used in this work to analyse life cycle during flange manufacturing and Wire and Arc Additive Manufacturing (WAAM), compared to Conventional Manufacturing. WAAM showed a high reduction of all parameters evaluated in this manufacturing technique, proving to be an excellent alternative in the steel industry and indicating a promising option for industries in the production of parts with lower environmental impact. WAAM provided acquisition of components with geometry similar to the final format design, with reduction of post-processing steps, low solid waste generation, reduced electricity and lower greenhouse gases emission throughout the production chain, proving to be a promising alternative for sustainable development.

Author Contributions

Claudinei de Souza Guimarães performed the modeling, analyzed the results and wrote the manuscript; Brunna Mothé Mattos carried out the literature review, modeling and calculations; João Payão Filho obtained the experimental results and revised the manuscript.

Funding

This work was funded by Shell Brasil Petróleo Ltd.a. (Shell Brasil, grant DPW019-W01) and Empresa Brasileira de Pesquisa e Inovação Industrial (Embrapii, grant PCOP-1904.0016,) with support from Agência Nacional de Petróleo, Gás Natural e Biocombustíveis (ANP).

Acknowledgments

The authors thank Diego Russo Juliano (senior subsea research engineer, Shell Brasil Petróleo Ltd.a.) for his invaluable contributions to this work.

Conflicts of Interest

The authors declare no conflict of interest.

References

  1. Nuttah, M.M.; Roma, P.; Nigro, G.L.; Perrone, G. Understanding blockchain applications in Industry 4.0: From information technology to manufacturing and operations management. J. Ind. Inf. Integr. 2023, 33. [Google Scholar] [CrossRef]
  2. Canbay, K.; Akman, G. Investigating changes of total quality management principles in the context of Industry 4.0: Viewpoint from an emerging economy. Technol. Forecast. Soc. Chang. 2023, 189. [Google Scholar] [CrossRef]
  3. Bilbao-Ubillos, J.; Camino-Beldarrain, V.; Intxaurburu-Clemente, G.; Velasco-Balmaseda, E. Industry 4.0 and potential for reshoring: A typology of technology profiles of manufacturing firms. Comput. Ind. 2023, 148. [Google Scholar] [CrossRef]
  4. Cannavacciuolo, L.; Ferraro, G.; Ponsiglione, C.; Primario, S.; Quinto, I. Technological innovation-enabling industry 4.0 paradigm: A systematic literature review. Technovation 2023, 124. [Google Scholar] [CrossRef]
  5. Huang, K.; Wang, K.; Lee, P.K.; Yeung, A.C. The impact of industry 4.0 on supply chain capability and supply chain resilience: A dynamic resource-based view. Int. J. Prod. Econ. 2023, 262. [Google Scholar] [CrossRef]
  6. Karmaker, C.L.; Al Aziz, R.; Ahmed, T.; Misbauddin, S.; Moktadir, A. Impact of industry 4.0 technologies on sustainable supply chain performance: The mediating role of green supply chain management practices and circular economy. J. Clean. Prod. 2023, 419. [Google Scholar] [CrossRef]
  7. Md. Sazzadur Rahman, Tapotosh Ghoshb, Nahid Ferdous Aurna, M. Shamim Kaiser, Mehrin Anannya, A.S.M. Sanwar Hosend. Machine learning and internet of things in industry 4.0: A review. Meas.: Sens. 2023, 28, 100822 [CrossRef].
  8. Mohd Javaid, AbidHaleem,Ravi Pratap Singh,Rajiv Suman. An integrated outlook of Cyber–Physical Systems for Industry 4.0: topical practices, architecture, and applications. Green Technologies and Sustainability. 2023, 1, 1000001 [CrossRef].
  9. Hajoary, P.K. Industry 4.0 Maturity and Readiness- A case of a Steel Manufacturing Organization. Procedia Comput. Sci. 2023, 217, 614–619. [Google Scholar] [CrossRef]
  10. Ogiemwonyi, O.; Alam, M.N.; Hago, I.E.; Azizan, N.A.; Hashim, F.; Hossain, S. Green innovation behaviour: Impact of industry 4.0 and open innovation. Heliyon 2023, 9, e16524. [Google Scholar] [CrossRef] [PubMed]
  11. Chua, C.K.; Leong, K.F. 3D Printing and Additive Manufacturing: Principles and Applications: The 5th Edition of Rapid Prototyping: Principles and Applications; WSPC: Singapore, 2017; pp. 1–426. [Google Scholar]
  12. Ngo, T.D.; Kashani, A.; Imbalzano, G.; Nguyen, K.T.Q.; Hui, D. Additive Manufacturing (3D Printing): A Review of Materials, Methods, Applications and Challenges. Compos. Part B Eng. 2018, 143, 172–196. [Google Scholar] [CrossRef]
  13. Gebler, M.; Schoot Uiterkamp, A.J.M. , Visser, C. A global sustainability perspective on 3D printing technologies. Energy Policy 2014, 74, 158–167. [Google Scholar] [CrossRef]
  14. May, G.; Psarommatis, F. Maximizing Energy Efficiency in Additive Manufacturing: A Review and Framework for Future Research. Energies 2023, 16, 4179. [Google Scholar] [CrossRef]
  15. Wu, B.; Pan, Z.; Ding, D.; Cuiuri, D.; Li, H.; Xu, J.; Norrish, J. A review of the wire arc additive manufacturing of metals: properties, defects and quality improvement. J. Manuf. Process. 2018, 35, 127–139. [Google Scholar] [CrossRef]
  16. Samruddha Kokare, J.P. Oliveira, Radu Godina. Life cycle assessment of additive manufacturing processes: A review. J. Manuf. Syst. 2023, 60, 536–559 [CrossRef]. [Google Scholar]
  17. ASTM F42/ISO TC 261 Develops Additive Manufacturing Standards. ASTM International, 2021. Available online: https://www.astm.org/COMMIT/F42_AMStandardsStructureAndPrimer.pdf (accessed on 10 Oct. 2022).
  18. ASTM. F2792-12a Standard Terminology for Additive Manufacturing Technologies, ASTM International. West Conshohocken, Pennsylvania, 2012. Available online: https://www.astm.org/f2792-12a.html (accessed on 10 Oct 2022).
  19. ASTM International.: Committee F42 on additive manufacturing Technologies, 2021. Available online: https://www.astm.org/COMMITTEE/F42.htm (accessed on 10 Oct. 2022).
  20. Ding, D.; Pan, Z.; Cuiuri, D.; Li, H. Wire-feed additive manufacturing of metal components: technologies, developments and future interests. Int. J. Adv. Manuf. Technol. 2015, 81, 465–481. [Google Scholar] [CrossRef]
  21. Priarone, P.C.; Campatelli, G.; Montevecchi, F.; Venturini, G.; Settineri, L. A modelling framework for comparing the environmental and economic performance of WAAM-based integrated manufacturing and machining. CIRP Ann. 2019, 68, 37–40. [Google Scholar] [CrossRef]
  22. Vimal, K.; Srinivas, M.N.; Rajak, S. Wire arc additive manufacturing of aluminium alloys: A review. Mater. Today: Proc. 2020, 41, 1139–1145. [Google Scholar] [CrossRef]
  23. Samruddha Kokare, J.P. Oliveira, Radu Godina. A LCA and LCC analysis of pure subtractive manufacturing, wire arc additive manufacturing, and selective laser melting approaches. J. Manuf. Process. 2023, 101, 67–85 [CrossRef]. [Google Scholar]
  24. Priarone, P.C.; Campatelli, G.; Catalano, A.R.; Baffa, F. Life-cycle energy and carbon saving potential of Wire Arc Additive Manufacturing for the repair of mold inserts. CIRP J. Manuf. Sci. Technol. 2021, 35, 943–958. [Google Scholar] [CrossRef]
  25. Izhar Hussain Shah, Nicolas Hadjipantelis, Lulu Walter, Rupert J. Myers, Leroy Gardner. Environmental life cycle assessment of wire arc additively manufactured steel structural componentes. J. Clean. Prod. 2023, 389, 136071 [CrossRef].
  26. Caldeira-Pires, A; Souza-Paula, M.C. De & Villas Bôas, R.C. A Avaliação do ciclo de vida: a ISO 14040 na América Latina. Brasília: Abipti, 2005, pp.337.
  27. Ferreira, H.; Leite, M.G.P. A Life Cycle Assessment study of iron ore mining. J. Clean. Prod. 2015, 108, 1081–1091. [Google Scholar] [CrossRef]
  28. Ingrao, C.; Bacenetti, J.; Adamczyk, J.; Ferrante, V.; Messineo, A.; Huisingh, D. Investigating energy and environmental issues of agro-biogas derived energy systems: A comprehensive review of Life Cycle Assessments. Renew. Energy 2019, 136, 296–307. [Google Scholar] [CrossRef]
  29. Barbhuiya, S.; Das, B.B. Life Cycle Assessment of construction materials: Methodologies, applications and future directions for sustainable decision-making. Case Stud. Constr. Mater. 2023, 19. [Google Scholar] [CrossRef]
  30. J. Iain Sword, Alexander Gallowa, Athanasios Toumpi. An environmental impact comparison between wire +arc additive manufacture and forging for the production of a titanium componente. SM&T. 2023, 36, e00600 2005 [CrossRef].
  31. Da Silva GA, Kulay LA. Environmental performance comparison of wet and termal routes for phosphate fertilizer production using LCA—a Brazilian experience. J. Clean. Prod. 2005, 13, 1321–5 [CrossRef].
  32. Benedikt Nilges, C’elia Burghardt, Kosan Rohb, Christiane Reinert, Niklas von der Aßen. Comparative life cycle assessment of industrial demand-side management via operational optimization. Comput. Chem. Eng. 2023, 177, 108323 [CrossRef].
  33. Farjana, S.H.; Tokede, O.; Tao, Z.; Ashraf, M. Life cycle assessment of end-of-life engineered wood. Sci. Total. Environ. 2023, 887, 164018. [Google Scholar] [CrossRef] [PubMed]
  34. Li, H.; Zhao, L. Life cycle assessment and multi-objective optimization for industrial utility systems. Energy 2023, 280. [Google Scholar] [CrossRef]
  35. Barkhausen, R.; Rostek, L.; Miao, Z.C.; Zeller, V. Combinations of material flow analysis and life cycle assessment and their applicability to assess circular economy requirements in EU product regulations. A systematic literature review. J. Clean. Prod. 2023, 407. [Google Scholar] [CrossRef]
  36. Arrigoni, A.; Arosio, V.; Peressut, A.B.; Latorrata, S.; Dotelli, G. Greenhouse Gas Implications of Extending the Service Life of PEM Fuel Cells for Automotive Applications: A Life Cycle Assessment. Clean Technol. 2022, 4, 132–148. [Google Scholar] [CrossRef]
  37. Ige, O.E.; Olanrewaju, O.A. Comparative Life Cycle Assessment of Different Portland Cement Types in South Africa. Clean Technol. 2023, 5, 901–920. [Google Scholar] [CrossRef]
  38. Gadaleta, G.; De Gisi, S.; Todaro, F.; Notarnicola, M. Environmental Comparison of Different Mechanical–Biological Treatment Plants by Combining Life Cycle Assessment and Material Flow Analysis. Clean Technol. 2022, 4, 380–394. [Google Scholar] [CrossRef]
  39. Curran, M.A. Life Cycle Assessment: a review of the methodology and its application to sustainability. Curr. Opin. Chem. Eng. 2013, 2, 273–277. [Google Scholar] [CrossRef]
  40. Finnveden, G.; Hauschild, M.Z.; Ekvall, T.; Guinée, J.B.; Heijungs, R.; Hellweg, S.; Koehler, A.; Pennington, D.; Suh, S. Recent developments in Life Cycle Assessment. J. Environ. Manag. 2009, 91, 1–21. [Google Scholar] [CrossRef] [PubMed]
  41. Brent, A.C.; Rohwer, M.B.; Friedrich, E.; von Blottnitz, H. Status of life cycle assessment and engineering research in South Africa. Int. J. Life Cycle Assess. 2002, 7, 167–172. [Google Scholar] [CrossRef]
  42. Hischier R, Ugaya C, Anderi da Silva G, lamb CMR, Rodriguez D. Capacity building for a national life cycle inventory database—lessons learned in real world. Case study of Swiss-Brazilian capacity building Project. 2nd International Conference on Life Cycle Assessment (CILCA), São Paulo, Brazil; 2007.
  43. de Eicker, M.O.; Hischier, R.; Kulay, L.A.; Lehmann, M.; Zah, R.; Hurni, H. The applicability of non-local LCI data for LCA. Environ. Impact Assess. Rev. 2010, 30, 192–199. [Google Scholar] [CrossRef]
  44. Margarita Ossés de Eiker, Roland Hischier, Hans Hurni, Rainer Zah. Using non-local databases for the environmental assessment of industrial activies: The case of Latin America. Environ. Impact Assess. Rev. 2010, 30, 145–157 [CrossRef].
  45. Wang, X.; Chen, Y.; Sui, P.; Gao, W.; Qin, F.; Wu, X.; Xiong, J. Efficiency and sustainability analysis of biogas and electricity production from a large-scale biogas project in China: an emergy evaluation based on LCA. J. Clean. Prod. 2014, 65, 234–245. [Google Scholar] [CrossRef]
  46. Brazilian Association of Technical Standards. ABNT NBR ISO 14040: Environmental Management—Life Cycle Assessment—Principles and structure. Brazil, 2009a.
  47. Brazilian Association of Technical Standards. ABNT NBR ISO 14044: Environmental Management—Life Cycle Assessment—Requirements and Guidelines. Brazil, 2009b.
  48. Priarone, P.C.; Ingarao, G.; Lunetto, V.; Di Lorenzo, R.; Settineri, L. The Role of re-design for Additive Manufacturing on the Process Environmental Performance. Procedia CIRP 2018, 69, 124–129. [Google Scholar] [CrossRef]
  49. Instituto Aço Brasil. Relatório 2020 de Sustentabilidade. 2021. Available online: https://acobrasil.org.br/relatoriodesustentabilidade/index.html (accessed on 17 Feb. 2023).
  50. Instituto Brasileiro de Informação em Ciência, Tecnologia, Inovações e Comunicações (IBICT). O que é Avaliação do Ciclo de Vida. Available online: http://acv.ibict.br/ (accessed on 19 Apr. 2023).
  51. ELCD Europian Reference Life Cycle Database. 2009. Available online: https://data.jrc.ec.europa.eu/collection/EPLCA (accessed on 05 Aug. 2023).
  52. IPCC (Intergovernmental Panel on Climate Change). Forest Lands. In Intergovernmental Panel on Climate Change Guidelines for National Greenhouse Gas Inventories; Institute for Global Environmental Strategies (IGES): Hayama, Japan, 2006; p. 83. [Google Scholar]
  53. IEA—Energy Technology Perspectives 2020, Energy Technology Perspectives; 2020.
Figure 1. Phases of Life Cicle Assesment (LCA).
Preprints 87781 g001
Figure 2. Stages in the manufacture of the flange carried out at the National Laboratory of Technology of the Federal University of Rio de Janeiro, Brazil. (A) Complete flange manufacturing system and (B) Flange ring deposition.
Preprints 87781 g002
Figure 3. Frontier of the conventional manufacturing system (a) and WAAM (b).
Preprints 87781 g003
Figure 4. Total energy consumption in Conventional Manufacturing (CM) and Wire and Arc Additive Manufacturing (WAAM).
Preprints 87781 g004
Figure 5. Total carbon footprint in Conventional Manufacturing (CM) and Wire and Arc Additive Manufacturing (WAAM).
Preprints 87781 g005
Figure 6. Solid waste generated in Conventional Manufacturing (CM) and Wire and Arc Additive Manufacturing (WAAM).
Preprints 87781 g006
Table 1. Environmental indicators of steel manufacturing.
Sustainability Indicator Reference Process and Material Average
(2018–2020)
GHG emissions
(kg CO2e kg-1
crude steel)
Brazil Steel Institute: World Steel Association Crude steel production 1.8
Brazil Steel Institute: IPCC methodology (2021) Crude steel production 1.7
OpenLca: IMPACT 2002+ Hot rolling of steel 1.846
Steel drawing 0.455
OpenLca: ReCiPe 2016Midpoint (H) Hot rolling of steel 1.959
Steel drawing 0.495
OpenLca: IPCC 2013 GWP 100a Hot rolling of steel 1.926
Steel drawing 0.486
Solid waste
(kg kg-1 crude steel)
Brazil Steel Institute Specific generation of
Co-products and wastes
0.620
Embodied energy
(MJ kg-1 crude steel)
World Steel Association Crude steel production 20.4
Table 2. Calculation of Stand-by Times in the WAAM.
Layer gap in flange thickening Cords per layer Waiting time per cord (min) Total waiting time between cords (min)
1-5 9 2 80
6-7 8 28
8-9 7 24
10-11 6 20
12-13 5 16
14-41 4 168
Total time spent waiting between cords (min): 336
Waiting time between layers (min): 4.5
Number of layers: 41
Total time spent waiting between layers (min): 180
Number of layers in the central cylinder deposition
(each layer has 1 cord):
120
Waiting time between layers (min): 2
Total time spent waiting between layers in the central cylinder (min): 238
Total time spent during WAAM initialization and adjustment (min) 30
Total time spent with WAAM in stand-by (Tmasb) 784
Table 3. Necessary data for machining the flange manufactured by WAAM.
Parameter Value
Electrical power demand: Machining machine 1
(inside diameter machining)
23.18 kW
Total time on Machine 1 4 hours
Electrical power demand: Machining machine 2
(parts drilling machining)
17.31 kW
Total time on Machine 2 10 hours
Table 4. Equivalent CO2 Emission (CO2e).
Gases present in the
shielding gas
Total volume ( L)
used in the process
Total mass (kg)
used in the process
GHG emissions
(kg CO2e)
Ar 255.0 79,18 70,0
CO2 (8%) 24.3 8,31 23,4
Total present in shielding gas (Cfgas) 93,4
Table 5. LCA Indicators for Conventional Manufacturing.
Conventional Manufacturing Results Value Unit
Pre-manufacture (step 1)
Embodied specific energy 125 MJ kg-1
Specific carbon footprint ratio 10 kg CO2e Kg-1
Mass of material used 340.50 kg
Total Embodied energy 42,561.90 MJ
Total Carbon Footprint 3,404.95 kg CO2e
Subtractive Manufacturing (step 2 and 3)
Specific energy consumption 45 kWh kg-1
Specific carbono footprint ratio 32 kgCO2e Kg-1
Total Embodied Energy 55,160.20 MJ
Total Carbon Footprint 10,895.85 kg CO2e
Machining (step 4)
Embodied specific energy 40 MJ kg-1
Specific carbono footprint ratio 4 kgCO2e Kg-1
Total Embodied Energy 3,832.0 MJ
Total Carbon Footprint 383.2 kg CO2e
Solid Waste Generation
Block volume 0.04332
Steel density 7.860 Kg m-³
Mass of material used 340.5 kg
Final part mass (post machining) 58.1 kg
Solid Waste generated 282.40 kg
Table 6. LCA Indicators for Wire Arc Additive Manufacturing (WAAM).
WAAM results Value Unit
Pre-manufacture (step 1)
Embodied specific energy 54.8 MJ kg-1
Specific carbon footprint ratio 4.35 kgCO2e Kg-1
Total mass of the flange once deposited 126.7 kg
Total Embodied Energy 6943.2 MJ
Total Carbon Footprint 551.1 kgCO2e
Additive Manufacturing—deposition (step 2 and 3)
WAAM system power demand in stand-by mode (Pmasb) 0.0426 kW
Total stand-by time (Tmasb) 13.07 hours
Waam system power demand in operation (Pmad) 3.5 kW
Time spent in deposition (Tmad) 61.1 hours
Embodied energy of shielding gas (Egas) 0.0285 MJ L-1
Shielding gas consumption flow (Cg) 15.0 L min-1
WAAM unit process electrical energy demand (EWAAM2) 2339.1 MJ
Carbon Emission Factor of the local electricity network 0.0759 kgCO2e kWh-1
Carbon Footprint in WAAM2 142.82 kgCO2e
Machining
Electrical power demand in machining 1 (Pmq1) 23.18 kW
Total time 1 (Tmq1) 4 hours
Electrical power demand in machining 2 (Pmq2) 17.314 kW
Total time 2 (Tmq2) 10 hours
WAAM unit process electrical energy demand (EWAAM3) 957.10 MJ
Carbon Footprint in WAAM3 20.19 kgCO2e
Solid Waste Generation
Mass deposited at WAAM (initial mass) 95.8 kg
Substrate mass 30.9 kg
Total mass deposited initially 126.7 kg
Mass of the final part (after machining) 58.1 kg
Waste generated 68.6 kg
Disclaimer/Publisher’s Note: The statements, opinions and data contained in all publications are solely those of the individual author(s) and contributor(s) and not of MDPI and/or the editor(s). MDPI and/or the editor(s) disclaim responsibility for any injury to people or property resulting from any ideas, methods, instructions or products referred to in the content.
Copyright: This open access article is published under a Creative Commons CC BY 4.0 license, which permit the free download, distribution, and reuse, provided that the author and preprint are cited in any reuse.
Prerpints.org logo

Preprints.org is a free preprint server supported by MDPI in Basel, Switzerland.

Subscribe

© 2024 MDPI (Basel, Switzerland) unless otherwise stated