Preprint
Article

Universal Form of Radial Hydraulic Machinery 4Q Equations for Calculations of Transient Processes

Altmetrics

Downloads

79

Views

18

Comments

0

A peer-reviewed article of this preprint also exists.

This version is not peer-reviewed

Submitted:

16 October 2023

Posted:

18 October 2023

You are already at the latest version

Alerts
Abstract
The Suter curves for Wh and Wm characteristics of collected and the first time presented Four-quadrant (4Q) diagrams of 11 radial pump-turbine models with different specific speeds (nq=24.34, nq=24.8, nq=27, nq=28.6, nq=38, nq=41.6, nq=41.9, nq=43.83, nq=50, nq=56, and nq=64.04) are given in the paper, as well as the Suter curves for 2 pump models (nq=25, and nq=41.8) which were already published in the literature. These 11+2 curves were analyzed to establish a certain universal law of behavior in dependence on the specific speed. For the determination of existing laws in behavior, the fitting procedure using the Regression and Spline methods was used. The paper presents a research plan and structures that include: data collection of four-quadrant diagrams for models of pump-turbines and pumps with different specific speeds (nq), the procedure of recalculation of Four-quadrant diagrams of the models into Suter curves for Wh and Wm characteristics, the definition of the optimal point for the pump and turbine operating mode in pump-turbine models for different specific speeds, and developing numerical models in the MATLAB program to obtain the Universal Equation for the Wh and Wm characteristics. The scientific contribution of this paper is the firstly published original mathematical curve named Universal Equation for the Wh and Wm characteristics for radial pumps and pump-turbines. Application of the equation has been demonstrated at the pumping station where two radial pumps are installed. The calculation of transient processes was performed using the numerical model developed by the authors in the mathematical program MATLAB. Comparison of the transition process results has been made for the two cases - when input data in the numerical model have been firstly used with the values of Suter curves for Wh and Wm characteristics obtained by recalculation from the Four-quadrant operating characteristics (Q11, n11, M11) of model’s specific speed, and then secondly with the values of the Suter curves for Wh and Wm characteristics obtained from the Universal Equation.
Keywords: 
Subject: Engineering  -   Mechanical Engineering

1. Introduction

The paper describes in detail the method of obtaining universal equations with all needed formulas, initial, intermediate and final diagrams, of the four-quadrant working characteristics (Q11, n11, M11), their transition from H/H*- Q/Q*, M/M*- Q/Q* diagrams to n/n*- Q/Q* diagram, in which H and M curves with various positive and negative percentage values are shown, and which were then transformed into the form of Suter diagrams.
The aim of the paper is the analysis of the possibility of a certain law existence in the Suter curves for various values of specific speeds.
As a classical example, the transition from the H/H*- Q/Q*, M/M*- Q/Q* diagrams to the n/n*- Q/Q* diagram is presented, in which the curves of H and M with various percentages values are shown. The mentioned diagrams are taken from the classical literature - Knapp RT (Nov. 1937) [1]; Stepanoff AJ (1959) [2] and then were transformed into Suter diagrams. This example is for a pump with nq=25(35) (original pump is a double suction pump, so the value of 25 corresponds to the impeller and 35 for the complete machine). There is not much data in the literature on four-quadrant pumps curves except for three specific speeds.
With the time lapse, a modification of the formulas for recalculation of the four-quadrant characteristics Q11, n11, M11 into Suter curves was made (Chaudhry MH (1979) [3]; Wylie EB, Streeter VL (1993) [4]; Thorley RD, Chaudry A (1996) [5]). The optimal point for the pump and turbine operating mode in pump-turbine models for different nq is defined. The method for recalculating the four-quadrant (4Q) characteristics Q11, n11, M11 into Suter curves (applied in [5]) was analyzed. And for the first time in this paper, Suter curves for pump-turbines (total of 11 models of different specific speeds nq) are presented. They will be used to analyze the existence of a general law in their forms to try to obtain universal curves dependent on the specific speed.
For the analysis of data and finding of the best fitting curve the Regression and Spline methods were used.
Experimental research for the determination of four-quadrant curve characteristics (Q11, n11, M11) carried out in laboratories with pump-turbine installations in Vienna - Austria, and Wuhan – China, are presented first. In the laboratory in Vienna there is an installation of a pump-turbine, while in the laboratory in Wuhan there are installations of two pump-turbines. The diagrams obtained by measurements are presented in the form of Suter curves for the optimal wicket gates (the conducting apparatus) openings for 11 models of radial pump-turbines (which the first author personally collected and recalculated) together with one Suter curve for one radial pump model from the book of Wylie EB, Streeter VL (1993). Fluid Transients in Systems [4]. Diagrams with Suter curves for pumps and pump-turbines with various values of nq, obtained from the Universal Suter equation for which the author of this paper developed a numerical model in the Matlab program, are given.

2. Literature Review

The subject of research are four-quadrant curves of turbomachines. For calculations of the transient processes on systems with the turbomachinery, four-quadrant curves of the machine are required. Almost, as a rule, the curves listed in the following literature are used:
-In the book – Stepanoff, A. J. (1959). Radial und Axialpumpen. Springer-Verlag Berlin Heidelberg GmbH [2];
-In the book – Donsky, B. (1961). Complete pump characteristics and the effects of specific speeds on hydraulic transients. J Basic Eng, Trans ASME, pp.685-699 [7];
-In the book - Chaudhry, M. H. (1979) Applied hydraulic transients. Van Nostrand Reinhold Company, New York, USA [3];
-In the book - Wylie, E. B. & Streeter, V. L. (1993). Fluid transients in systems. Prentice Hall, Englewood Cliffs, USA [4]; where the curves are given only for three specific speeds nq=25(35), nq=147, nq=261 (one radial, one semi-axial and one axial turbomachine).
System designers use the curves closest to the analyzed machine, even without interpolation. Of course, many approximations are used in calculations of transients fluid phenomena, but almost every one of them has been studied in the meantime (unsteady friction, sound speeds, fluid-structure interactions, ...), but as far as the wider knowledge that has been obtained is concerned, no thorough analysis of variation of specific speed (and impact) has been published.
Knapp, R. T. (Nov. 1937): Complete Characteristics of Centrifugal Pumps and their Use in the Prediction of Transient Behavior. Trans. A. S. M. E, pp. 683-689 [1]. This paper describes a technique for determining the complete operating characteristics of a hydraulic machine such as a centrifugal pump or turbine, together on a single diagram. The characteristics of modern pumps, high head and high efficiency are analyzed and presented. The use of these complete characteristics to predict the behavior of the machine during the transient process is discussed and the analytical background is presented. The assumptions involved are explored and experimental checks of their validity are offered. By comparing the possible operating conditions of a hydraulic turbine and a centrifugal pump installation, it soon became clear that pumps were subject to much wider and more involved variations than turbines, especially during transient states of starting, stopping, or emergency operations.
Donsky, B. (1961). Complete pump characteristics and the effects of specific speeds on hydraulic transients. J Basic Eng, Trans ASME, pp.685-699 [7]. The paper presents the complete characteristics of pumps of certain specific speeds 1800, 7600, and 13,500 (in gpm units), i.e., 25 (35), 147, and 261 (in SI units), whereby the basic test data for these three pumps were provided by Prof. Hollander from the California Institute of Technology. A method for creating complete pump characteristics from data obtained during the model tests is described. Three sets of pump characteristics were compared, and the effects of certain specific speeds on the hydraulic transients processes due to pump disconnection from the network or pump stop were shown. The condition of the transient processes that appear on the radial flow pump, the mixed flow pump, and the axial flow pump is described. It is described that in most cases complete pump characteristics are not available and that incomplete pump characteristics can be extended by homologous pump laws or similarity laws [5]. The most important connection between the model and the prototype of the pump or turbine are the relations of the laws of similarity, from these relations the equations for Q, H, and M are derived which are used during the conversion of data from the Four Quadrant curves to Suter curves. It is considered that if the specific speed of the pump under study is approximately the same as the available pump characteristics, the results of the water hammer will be satisfactory for most engineering purposes, as well as that some of the data obtained during the tests do not fit into the curves obtained by homologous laws, which does not mean that the data obtained during the tests are incorrect, but only means that the pump during the test did not follow the homologous laws in certain regions of abnormal operation. He stated that only with more test data can the average characteristic of the pumps be reached.
Chaudhry, M. H. (1979). Applied hydraulic transients. Van Nostrand Reinhold Company, New York, USA [3]. In this book, an analysis of transients caused by various pump operations was performed, a procedure for storing pump characteristics in a digital computer is presented, boundary conditions are developed and a typical problem is solved. A mathematical representation of the pump's working characteristics was also made. The boundary conditions for load rejection of the pump are explained, and the equations of characteristics and the conditions which put the boundary that are solved simultaneously to determine the boundary conditions are explained. Boundary conditions for more complex cases were developed, and in order to facilitate the understanding of their implementation, a simple system with only one pump and a very short suction line was first considered. A detailed analysis is also provided on the issue of obtaining curves, which show the relationships between variables called pump characteristics. It is explained that various authors have presented these curves in various graphical forms suitable for graphical or computer analysis, and that of all the methods proposed for storing pump characteristics in a digital computer, the method used by Marchal is the most suitable, with some modification. Also, it was emphasized that although pump characteristic data in the pumping zone is usually available, relatively little data is available for the dissipation zone or the turbine operation zone.
Wylie, E. B. & Streeter, V. L. (1993). Fluid Transients in Systems, Prentice Hall, Englewood Cliffs, NJ 07632 [4], Prof dr. Wylie, E.B. and Streeter, V.L they provided explanations related to transients processes and the causes of their occurrence. They explained that the changes in the working state of the turbomachine are the result of non-stationary flow in the hydraulic system, that this working condition can be caused by starting or stopping the centrifugal pump, or it can be caused by adjusting the load on the generator, which causes changes that occur at that moment on the hydraulic turbine. They gave explanations of how to apply the method of characteristics, as dimensionless homologous characteristics of turbopumps. They explained that conditions for turbines can be described in the same way as conditions for pumps, however, with turbine data, a set of characteristics may be required for each of the many wicket gate openings. They specified and analyzed four quantities involved in the characteristics - total dynamic head, discharge, shaft torque, and rotational speed. They stated the following two basic assumptions: the characteristics of the equilibrium state hold for the unstable state situation, and if the discharge and speed rotation change with time, their values in the moment determined the head and torque. They analyzed and explained homologous relations in detail, explained that homologous theories assume that the efficiency does not change with the size of the unit and that it is convenient to work with dimensionless characteristics h, β, v, and α.
In the previous period, the authors of this paper published two scientific papers dealing with the study and analysis of Four-quadrant operating characteristics (Q11, n11, M11) - (pumps and pump turbines), with the idea of determination of legality that exist [8,9].
Huokun et al. [11] developed a mathematical model that describes the complete characteristics of a centrifugal pump. In the developed mathematical model, they established a non-linear functional relationship between the characteristic parameters of the characteristic operating points (COPs) and the specific speed. The main contribution of this paper is that by combining a mathematical model with a non-linear relationship, the CPCs for a given specific speed are successfully predicted. The author of this paper verified the developed mathematical model in a case study, and the CPCs constructed by the mathematical model derived in this paper agree well with the measured CPCs. Transient processes at pumping stations can be successfully simulated with the CPCs prediction method proposed in this paper.
Jiangping et al. [12] analyzed the complete characteristics of centrifugal pumps and developed an ML model to calculate the complete characteristic curve and dimensionless head and torque curves from the Quadrant III data set with high accuracy. To obtain a full characteristic curve based on a manufacturer's normal performance curve, the authors of this paper developed an ML model that predicts full, complete Suter curves using specific pump speed with known parts of the Suter curve. The developed ML model is used to measure and predict the relationship between the data points of Quadrant III and those in Quadrants I, II and IV of the centrifugal pump performance characteristic curve.

3. Previously Done Personal Researches

3.1. Experimental Researches

The author of this paper performed experimental determination of four-quadrant characteristic curves (n11, Q11, M11) in laboratories with pump-turbine installations in Vienna - Austria (Institute for Energy Systems and Thermodynamics - Vienna University of Technology) and Wuhan - China (State Key Laboratory of Water Resources and Hydropower Engineering Science – Wuhan University, P.R. China. In the mentioned laboratories there are installations of pump-turbine models, in the laboratory in Vienna, there is an installation of one pump turbine nq=41.6, while in the laboratory in Wuhan there are installations of two pump turbines with the same nq=38, where the geometric profiles of the blades of the runners are different and input edges. During his stay in the aforementioned laboratories, the author of this paper performed measurements of different operating modes in all four quadrants of pump-turbines in stationary and non-stationary conditions.
In the laboratory of Institute for Energy Systems and Thermodynamics - Vienna University of Technology - first, the author of this paper was introduced to the complete installation of the pump-turbine model installed in this laboratory (upper and lower pressure tanks, supply and discharge pipelines, pre-turbine shutter, pump-turbine model) and was presented to me with the complete measuring system with the positions of the measuring instruments (instruments for measuring pressure along the inlet and outlet pipelines, spiral casing, draft tube, an instrument for measuring the number of revolutions, instrument for measuring torque on the turbine shaft, an instrument for measuring power on the generator, an instrument for measuring the opening of the wicket gates of the conducting apparatus and the displacement of the piston rod of the servomotor). Then, the author of this paper was introduced to the complete equipment in the control room where all the data measured at the installation of the pump-turbine are collected, in the control room the measuring data are processed and converted from analog to digital form, and on the monitor monitors the measurement of operating points on four-quadrant characteristic curves.
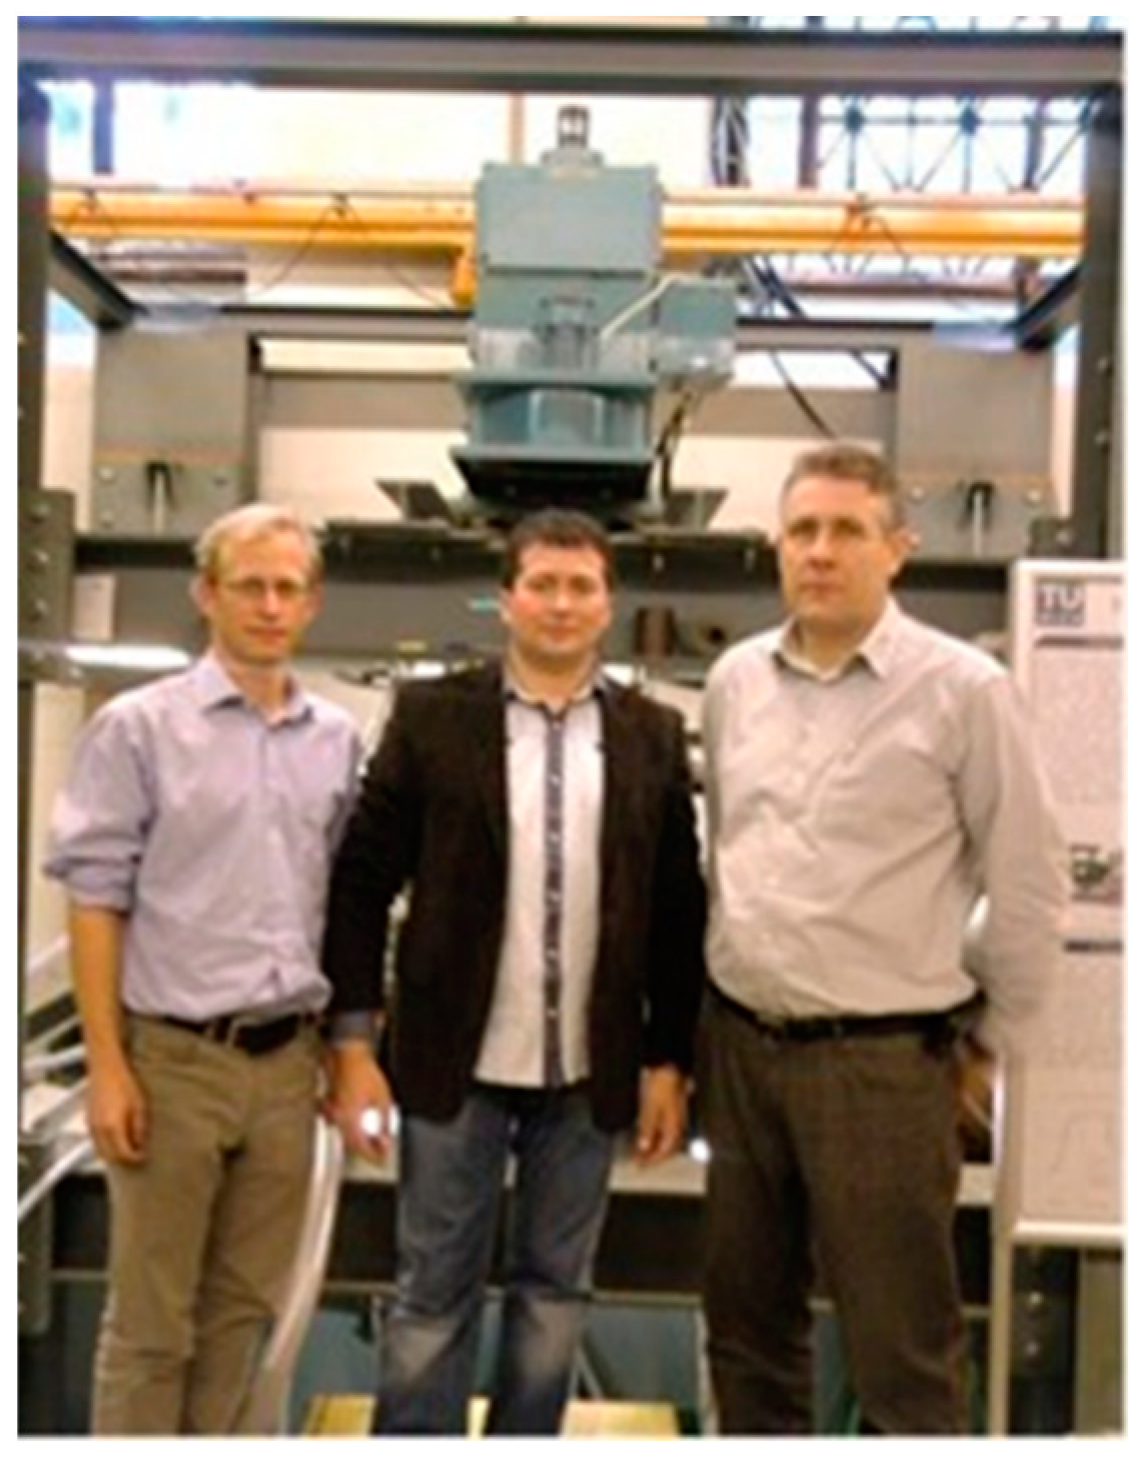
During measurements on the pump-turbine installation nq=41.6 in the Laboratory for Hydraulic Turbines - Institute for Energy Systems and Thermodynamics Vienna University of Technology, from 22.10.2012 to 26.10.2012, the author of this paper participated in the installation of the measuring equipment, the process of measuring around 100 measuring points on two four-quadrant curves for the two openings of the blades of the conducting apparatus, measurements were made in steady state in the entire area of four-quadrant characteristic curves: pumping mode, braking-energy dissipation, turbine mode up to the line of run out and continuation in braking mode, reversible pumping mode, start in pumping mode, and analysis of the obtained results. During these measurements, the laboratory staff and the author of this paper examined the pump-turbine in all four quadrants for the two openings of the blades of the conducting apparatus, 12mm and 22mm, and recorded about 100 measurement points. This was a unique opportunity for the author of this work to become familiar with the complete measurement process on the pump-turbine model, to monitor and analyze the changes in physical quantities and phenomena that occur during the operation of the pump-turbine, and to learn how complex the process is in the physical sense on the pump-turbine during pump-turbine operation in all four operating modes: normal pump mode – (negative rotation speed, positive torque, negative discharge); energy dissipation mode – (negative rotation speed, positive torque, positive discharge); normal turbine mode – (positive rotation speed, positive torque, positive discharge); reverse pump mode – (positive rotation speed, negative torque, negative discharge). During the mentioned measurements, the author of this work had a unique opportunity to physically experience what happens to a turbomachine - pump-turbine when it passes through all four working quadrants, how much instability and chaos there are during the transition from pump mode to turbine mode (zone of energy dissipation - discharge, torque, and speed of rotation change sign and direction), and how difficult it is to measure torque, discharge, and speed of rotation in this operating mode. A similar situation also occurs during the transition from turbine mode to pump mode (reversible pump mode - discharge, torque, and a number of revolutions change sign and direction), instability and chaos occur during this transition. It is very difficult to measure torque, discharge, and speed of rotation in this operating mode. Laboratory Vienna and Prof. Dr. Ing. Christian Bauer (TU Vienna), Zdravko Giljen Ph.D. student, Dr. Bernhard List (VOITH) – (from right to left) are shown in Figure 1.
In the State Key Laboratory of Water Resources and Hydropower Engineering Science - Wuhan University, P.R. China - the author of this paper was on an official visit from 29.02.2016 to 29.03.2016 at the invitation of Prof. dr. Yongguang Cheng Director, Research Section of Safety of Hydropower System The State Key Laboratory of Water Resources & Hydropower Engineering Science. In the laboratory on the test bench, pump-turbines were driven through all four-quadrant operations, four-quadrant characteristics were tested for two models of pump turbines in stationary and non-stationary conditions. Measurements were made in the entire area of the four-quadrant diagram: pump mode, braking, turbine mode to the line of runout and continuation in braking mode, reversible pump mode, and start in pump mode. After the aforementioned, the author of this paper analyzed the obtained data, which were made dimensionless, of the obtained Suter curves, and then the author of this paper made numerical experiments of transient phenomena (1D) in a system with such machines.
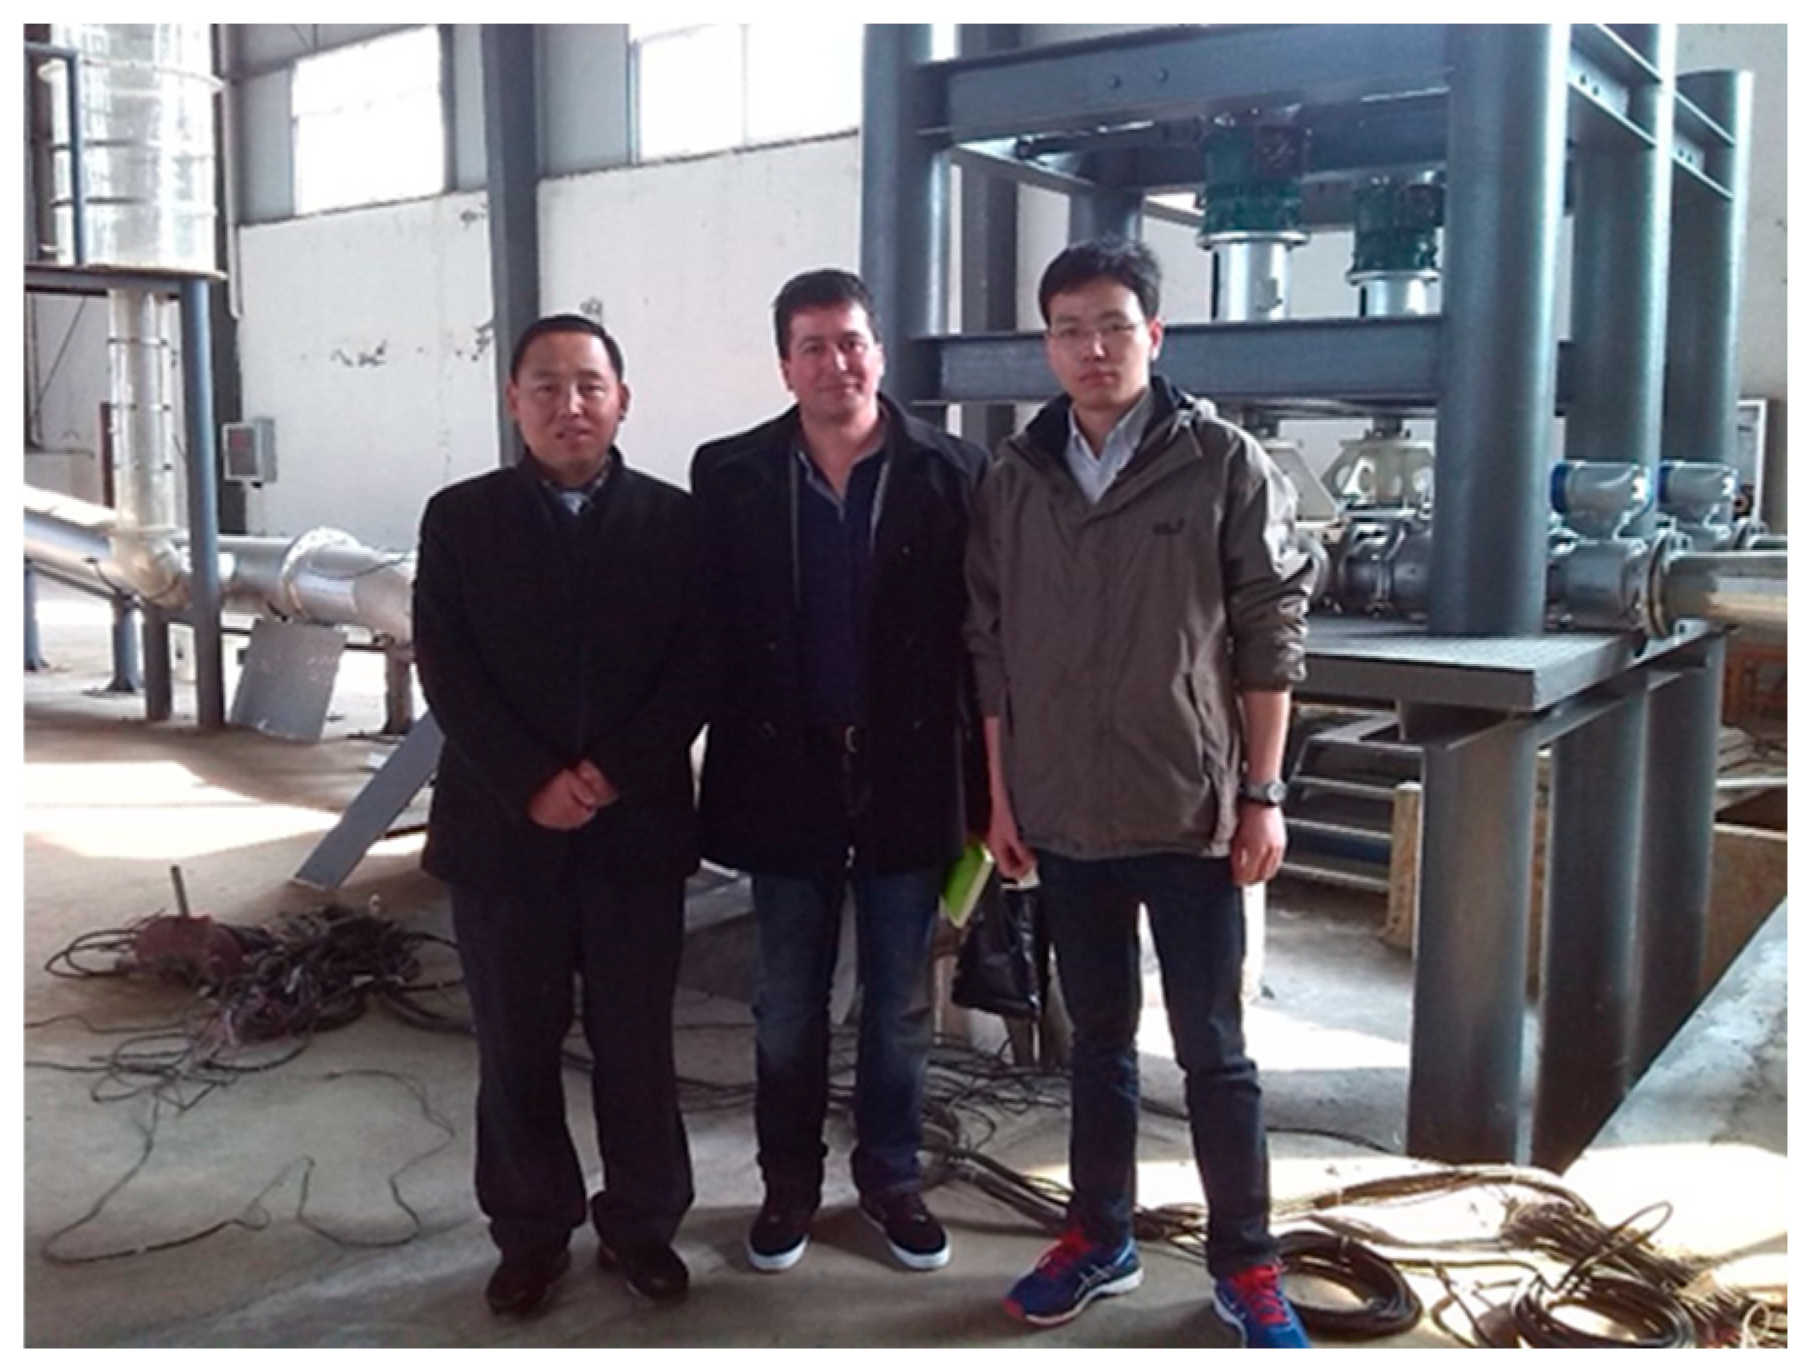
While performing measurements on the installations of these two pump turbines, the author of this paper learned how complex the process is in the physical sense on the pump-turbine during the operation of the pump-turbine in all four operating modes, how much instabilities and chaos are there during the transition from the pump mode to the turbine mode (zone of energy dissipation - discharge, torque, and speed of rotation change sign and direction), and how difficult it is to measure torque, discharge, and speed of rotation in this operating mode. The experimental platform in the laboratory - State Key Laboratory of Water Resources and Hydropower Engineering Science, Wuhan University, P. R. China consists of nine parts, and the equipment that is built into them and listed in the following part of the text: recycled water, excitation protection, speed control, frequency disguise, monitoring, load, measurement, model unit, diversion system. During his stay in the laboratory, the author of this paper worked on the development of his doctoral dissertation, he analyzed the results obtained during the transition processes on two models of pump turbines installed in this laboratory, as well as on the process of data transformation from four-quadrant pump-turbine characteristics curves to Suter curves. During this period, the author of this paper is familiar with the complete installations of the test bench of two pump-turbines installed in the State Key Laboratory - Wuhan (upstream reservoir, supply pipeline, upstream branch, installations of two pump turbine models, downstream branch, surge chamber, downstream pipeline, downstream reservoir). Then, the author of this paper is familiar with the complete equipment in the control room where all the data measured on the installations of these two models of pump turbines are collected, in the control room the complete measurement process is monitored on monitors, and in the adjacent room, there are devices that process and convert from analog to digital form all measurement signals from the complete installation and all measurement positions, the monitors monitor the measurement of working points on the four-quadrant characteristic curves both in stationary and non-stationary conditions. Then, the author of this paper analyzed the results measured during stationary and non-stationary operating conditions on these two pump-turbine models, at different operating modes. State Key Laboratory – Wuhan, China, and Prof. dr. Yongguang Cheng, Zdravko Giljen - Ph.D. student, Linsheng Xia (from left to right) are shown in Figure 2.

4. Investigation of Analytical Connection in Data for Working Curves Given in Four Quadrants for 11 Pump-Turbine Models and 2 Pump Models

During the previous years, the authors of this paper worked on data collection, research and analysis of four-quadrant diagrams for models of pump-turbines and pumps with different specific speed - nq, studied and applied the recalculation procedure of Four-quadrant diagrams with 11 models of pump-turbines (nq=24.34, nq=24.8, nq=27, nq=28.6, nq=38, nq=41.6, nq=41.9, nq=43.83, nq=50, nq=56, nq=64.04) in Suter curves. From the book - Stepanoff, A. J. (1959). Radial und Axialpumpen. Springer-Verlag Berlin Heidelberg GmbH [2], the authors of this paper took the Suter curves for 1 pump model (nq=25 radial pump). And from paper - Thorley, R. D. & Chaudry, A. (1996). Pump characteristics for transient flow analysis [5], the authors of this paper took Suter curves for 1 pump model (nq=41.8 radial pump).The authors of this paper collected 11 sets of four-quadrant characteristic curves for 11 models of radial pump-turbines (models were developed in laboratories in China, America, Russia, Austria), and most of the pump-turbine models, five in total, were obtained from State Key Laboratory of Water Resources and Hydropower Engineering Science, Wuhan University, P. R. China and Prof. Dr. Yongguang Cheng.
From four-quadrant diagrams for 11 radial pump-turbine models with the following nq (nq=24.34, nq=24.8, nq=27, nq=28.6, nq=38, nq=41.6, nq=41.9, nq=43.83, nq=50, nq=56, nq=64.04) the authors of this paper performed the process of readings the values for the following characteristics, n 11 = n D 1 H - unit speed of rotation, Q 11 = Q D 1 2 H - unit discharge, M 11 = M D 1 3 H - unit moment, with four-quadrant curves for various openings of the wicket gates of the conducting apparatus of each of the 11 radial pump-turbine models. Then, the authors of this paper calculated the degree of efficiency for all four-quadrant curves for various openings of the wicket gates of the conducting apparatus for 11 models of pump-turbines, and the optimum point with the highest degree of efficiency for pump and turbine mode was reached for each of the 11 pump-turbine models, data for H*, Q* and M* from the optimal points for all 11 pump-turbine models were taken from the pumping mode and were used in the further data recalculation procedure. Then the authors of this paper performed the process of calculating the values for H, Q and M for each point on the four-quadrant curves for each of the openings of the wicket gates of the conducting apparatus on all 11 models of pump-turbines, after this procedure, the authors of this paper calculated the values for, h = H H * - dimensionless head, β = M M * - dimensionless moment, α = n n * - dimensionless speed of rotation, v = Q Q * - dimensionless discharge variable. The complete previous procedure wich listed is refers to the procedure for converting Four Quadrant curves to Suter surves, Suter diagrams show the curves of characteristic head - W h ( θ ) = h α 2 + v 2 and characteristic moment - W m ( θ ) = β α 2 + v 2 expressed as a function of the angle θ which is defined by θ = a r c t g α v [6].
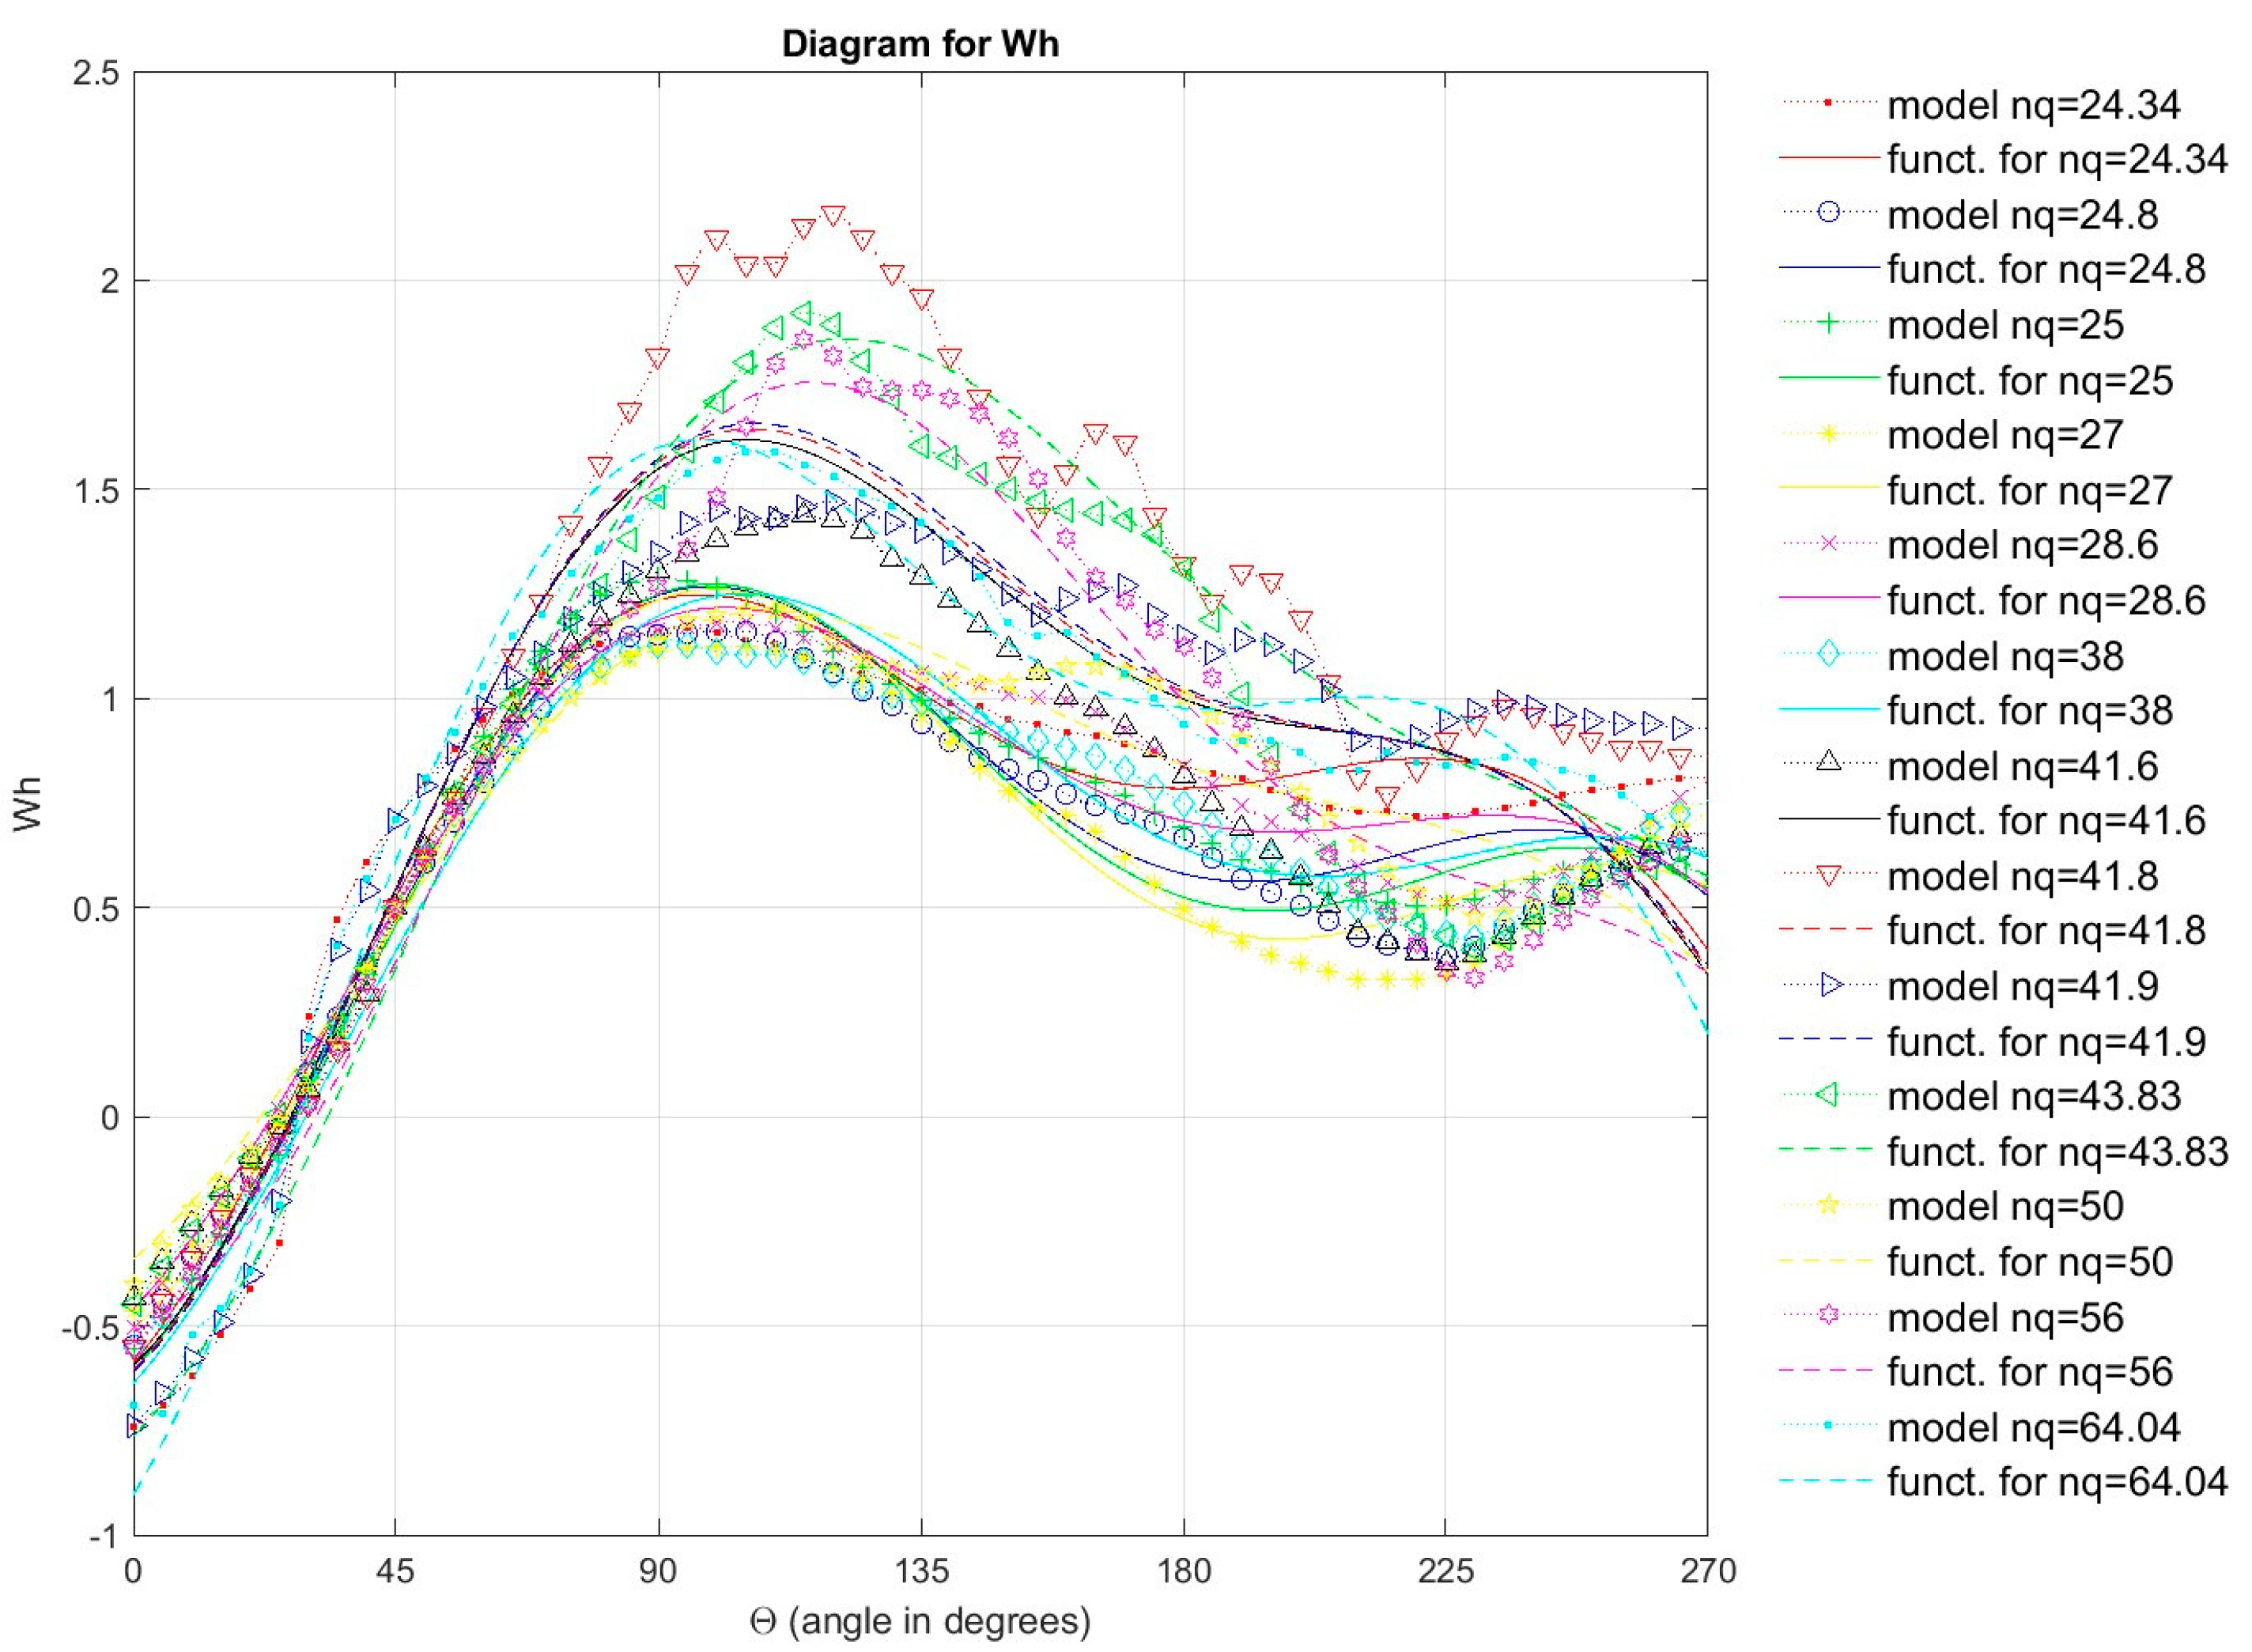
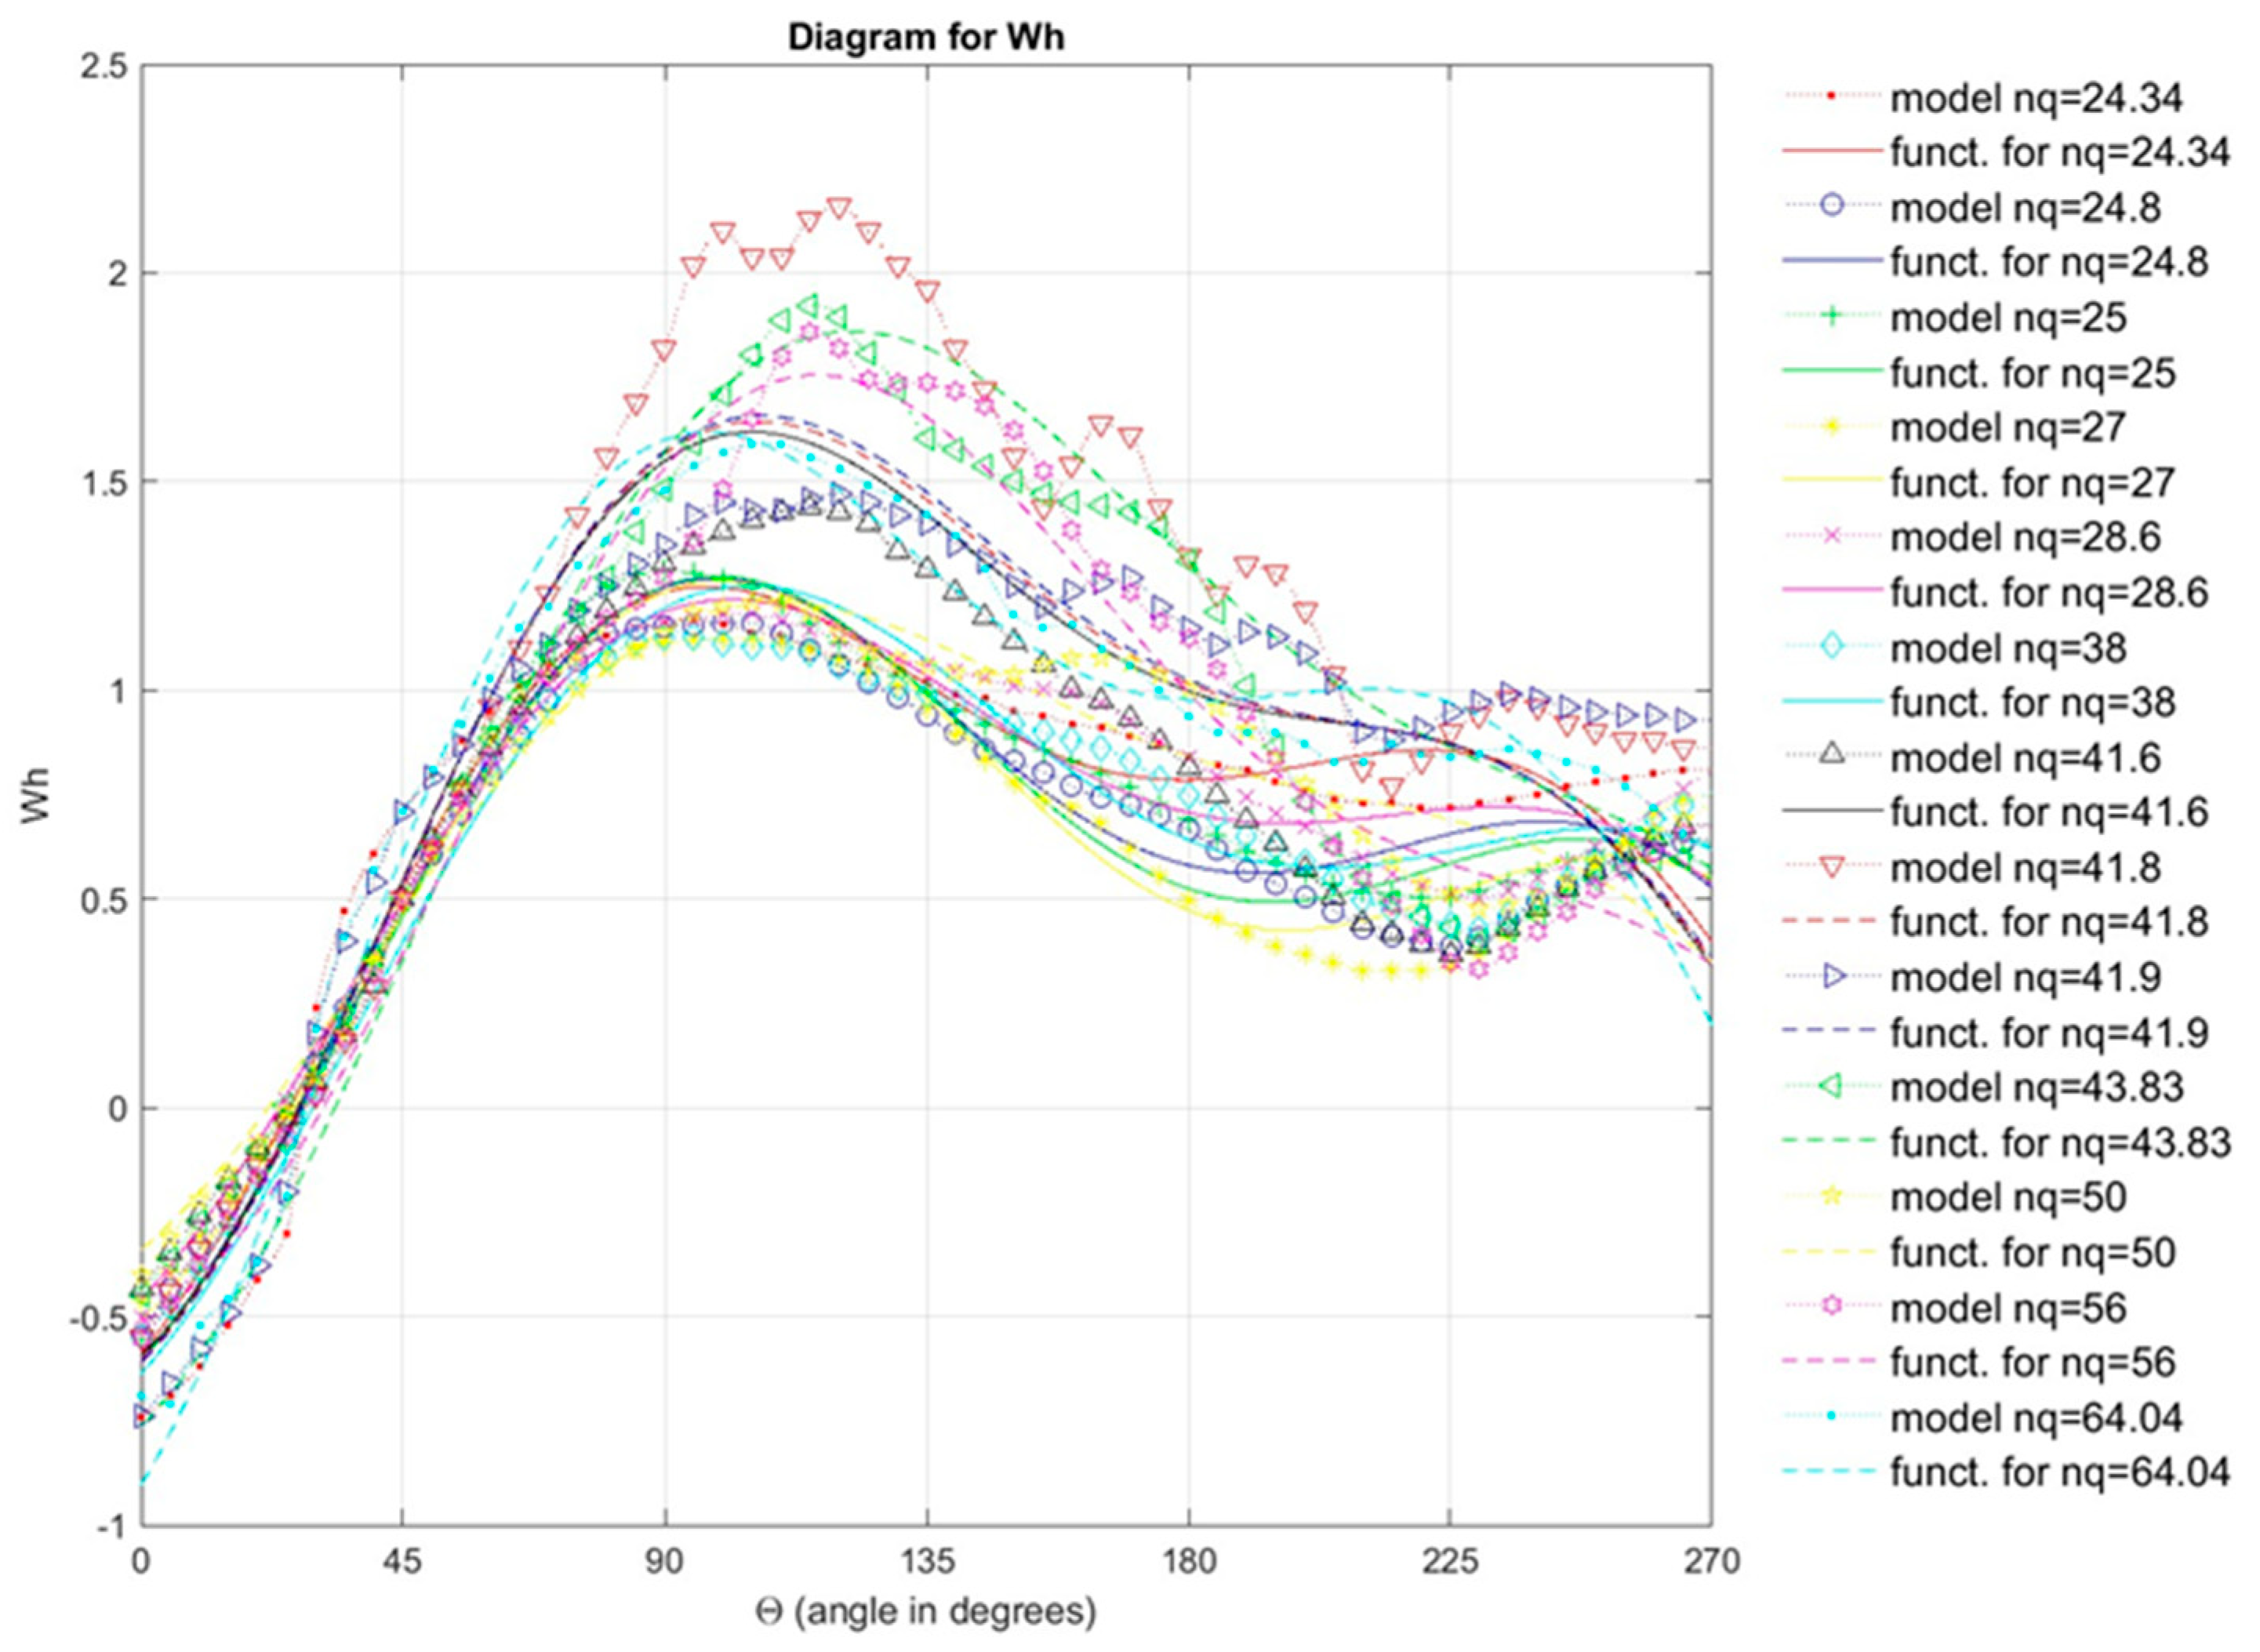
After the process by recalculation from the Four-quadrant curves into Suter curves for all openings of wicket gates of the conducting apparatus for 11 models of radial pump-turbines, a single diagram shown in Figure 3, presents Suter curves for the optimal opening of the wicket gates of the conducting apparatus for 11 models of radial pump-turbines and Suter curves for one model of radial pump (nq=25) taken from the book Stepanoff, A. J. (1959). Radial und Axialpumpen. Springer-Verlag Berlin Heidelberg GmbH [2], and Suter curves for one radial pump model (nq=41.8) taken from the paper Thorley, R. D. & Chaudry, A. (1996). Pump characteristics for transient flow analysis [5].
Pump-turbines – nq=24,34 - China - opening – 24mm; nq=24,8 – USA - PSP - Bad Creek - opening - 26mm; nq=27 – Serbia - PSP Bajina Basta - opening - 24mm; nq=28,6 - USA – opening 18o; nq=38 – China - opening - 24°; nq=41,6 – Austria - Vienna - opening -36mm; nq=41.9 – China – opening 20°; nq=43.83 - RON-Russia – opening- 28mm; nq=50 - China - opening - 20,03°; nq=56 - China - opening - 40mm; nq=64.04 - RON-Russia – opening - 16mm.
Pumps- nq=25- Stepanoff, A. J. (1959) [2], nq=41.8 - Thorley, R. D. & Chaudry, A. (1996) [5].
Figure 3 shows a diagram with 13 Suter curves, of which 11 are Suter curves of pump-turbine models and 2 are Suter curves of pump models. Eleven Suter curves of pump-turbine models were obtained by the authors of this paper by recalculation the Four Quadrant curves for eleven pump-turbine models, and one Suter curve of pump model is taken from the book Stepanoff, A. J. (1959). Radial und Axialpumpen. Springer-Verlag Berlin Heidelberg GmbH [2], also another one Suter Curve of pump models is taken from the paper Thorley, R. D. & A. Chaudry, A. (1996) - Pump characteristics for transient flow analysis [5]. According to the detailed analysis of the structure of the mentioned curves by the authors of this paper led to the conclusion that in the next steps they should observe Suter curves for pump-turbines and Suter curves for pumps together, and that based on them, in the developed numerical model in the Matlab program (developed by the authors of this paper), the Universal Equations for Wh and Wm characteristics are obtained. So, in the following part of the text, a variant of the numerical model which is developed in the Matlab program for obtaining the Universal Equation for Wh and Wm characteristics for pump-turbines and pumps will be explained (regression procedure - least squares method, interpolation procedure - spline method) [10], and the obtained results will be shown on the diagrams.

4.1. Details of the procedure and variants

Since the aim of the paper is the analysis of the Four Quadrant operating characteristics (Q11, n11, M11), with the idea of determination of legality that exist.It is known that in pump mode and turbine mode of the operating curves (Q11, n11, M11) are stable and the data for those regimes have been studied in more detail in the literature than for the complete Four Quadrant characteristic curves.
The authors of this paper are in the Matlab program based on the data of 11 Suter curves for 11 pump turbine models and based on the data of 1 Suter curve for 1 pump model from the paper - Thorley, R. D. & A. Chaudry, A. (1996) - Pump characteristics for transient flow analysis [5], and based on 1 Suter curve for 1 pump model from the book - Stepanoff, A. J. (1959). Radial und Axialpumpen. Springer-Verlag Berlin Heidelberg GmbH [2], developed a numerical model using the polynomial regression procedure, to obtain Universal equations for Wh and Wm characteristics, to analyze the existence of a more general legality in the form of the obtained curves depending on the specific speed - nq. The process of developing a numerical model to obtain the Universal Equation for Wh and Wm characteristics consists of the following steps that were carried out:
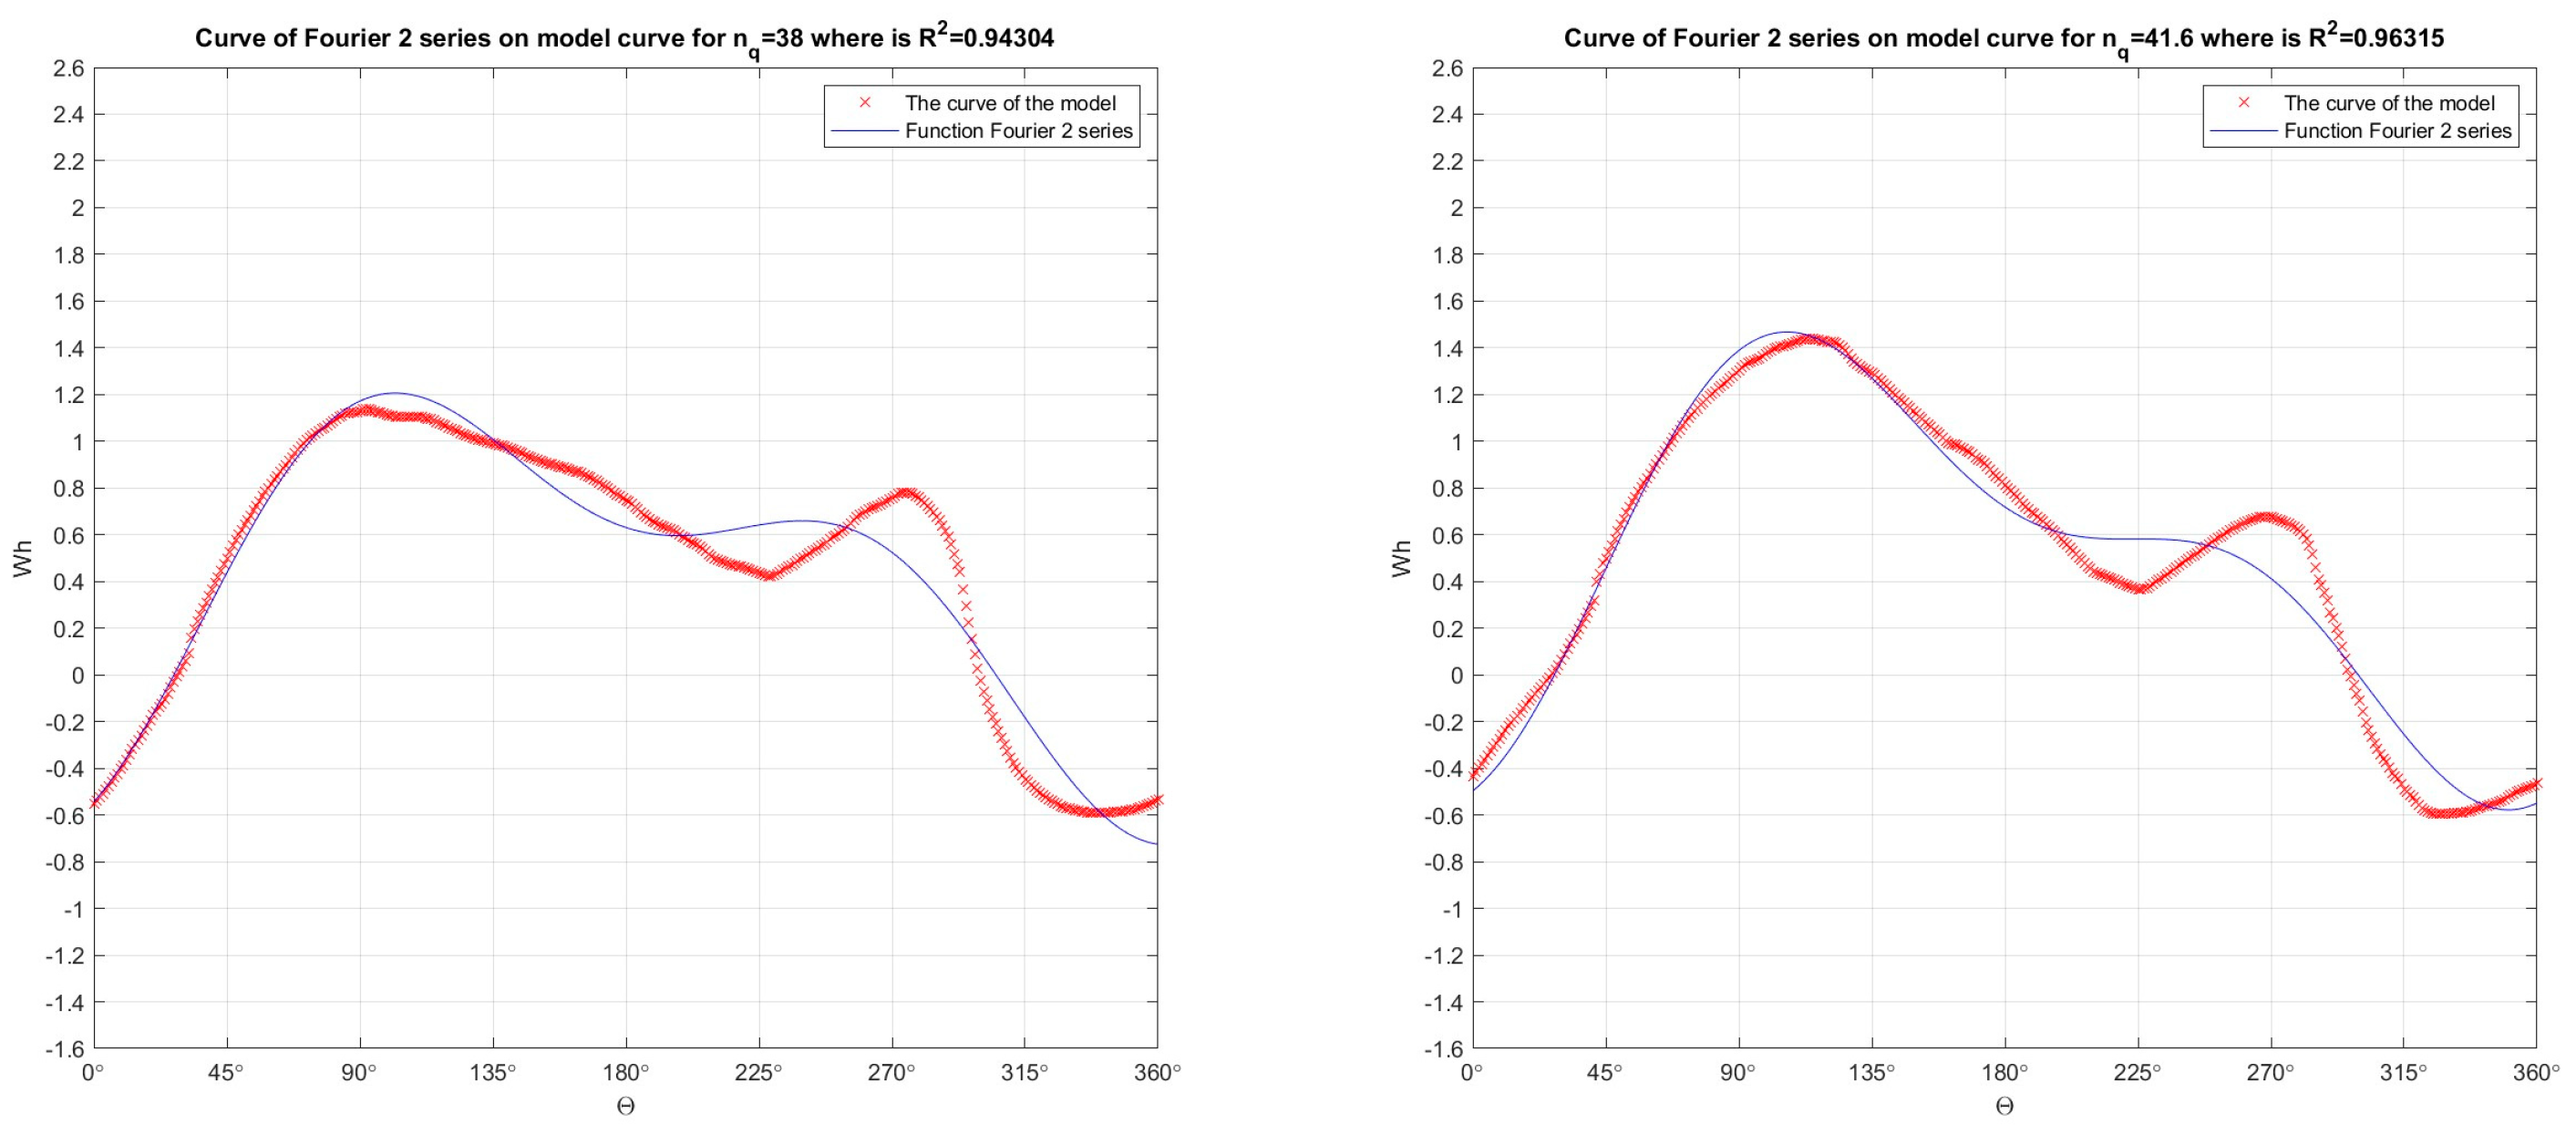
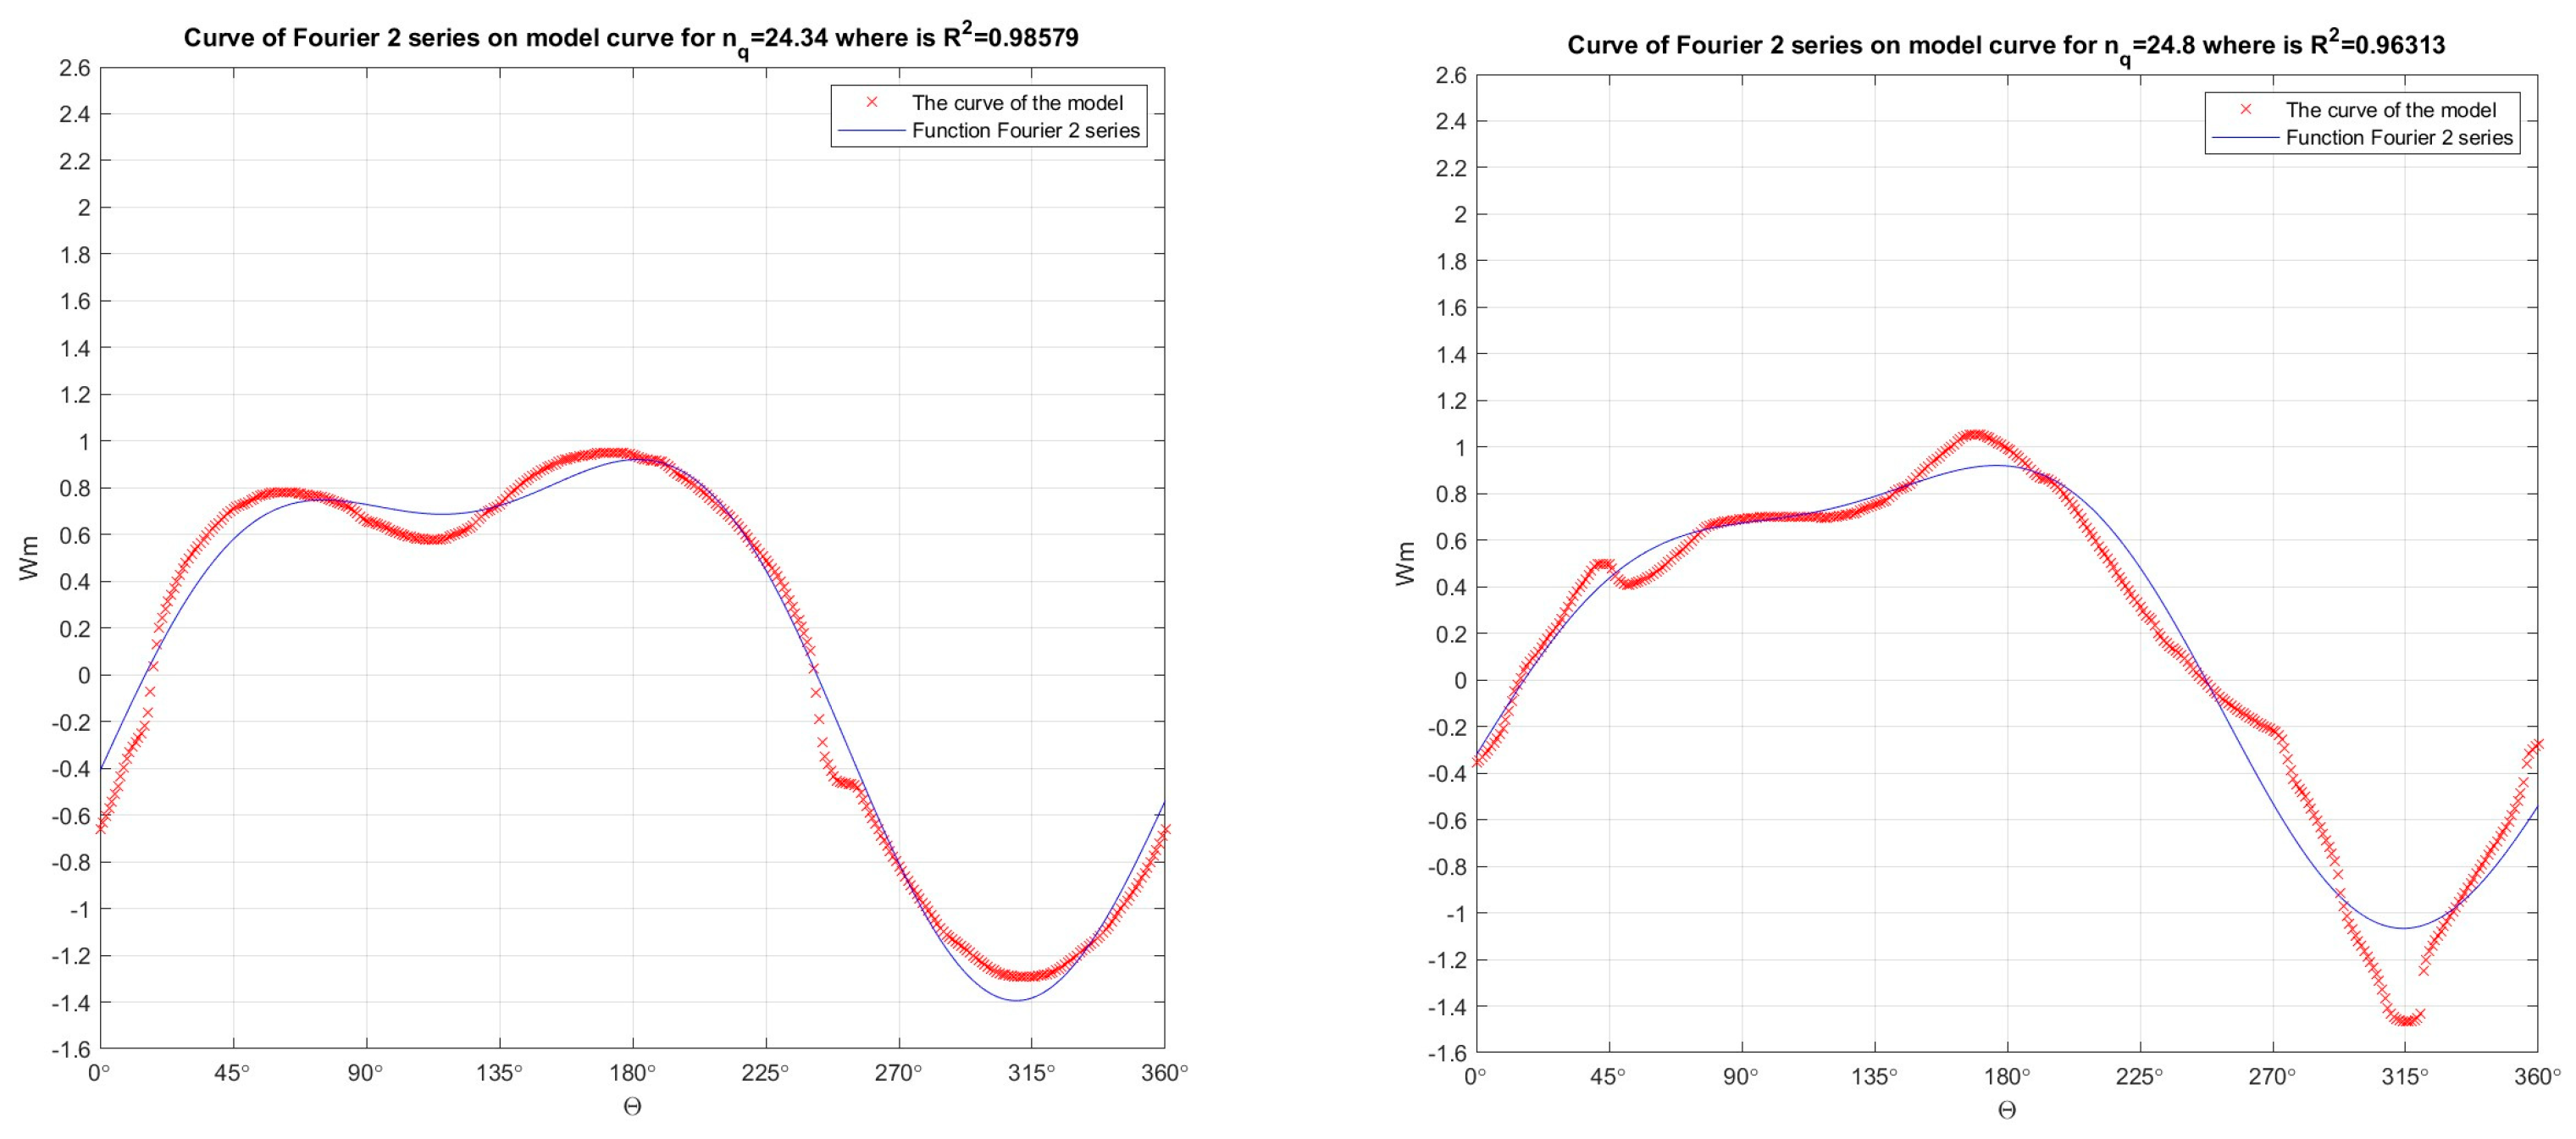
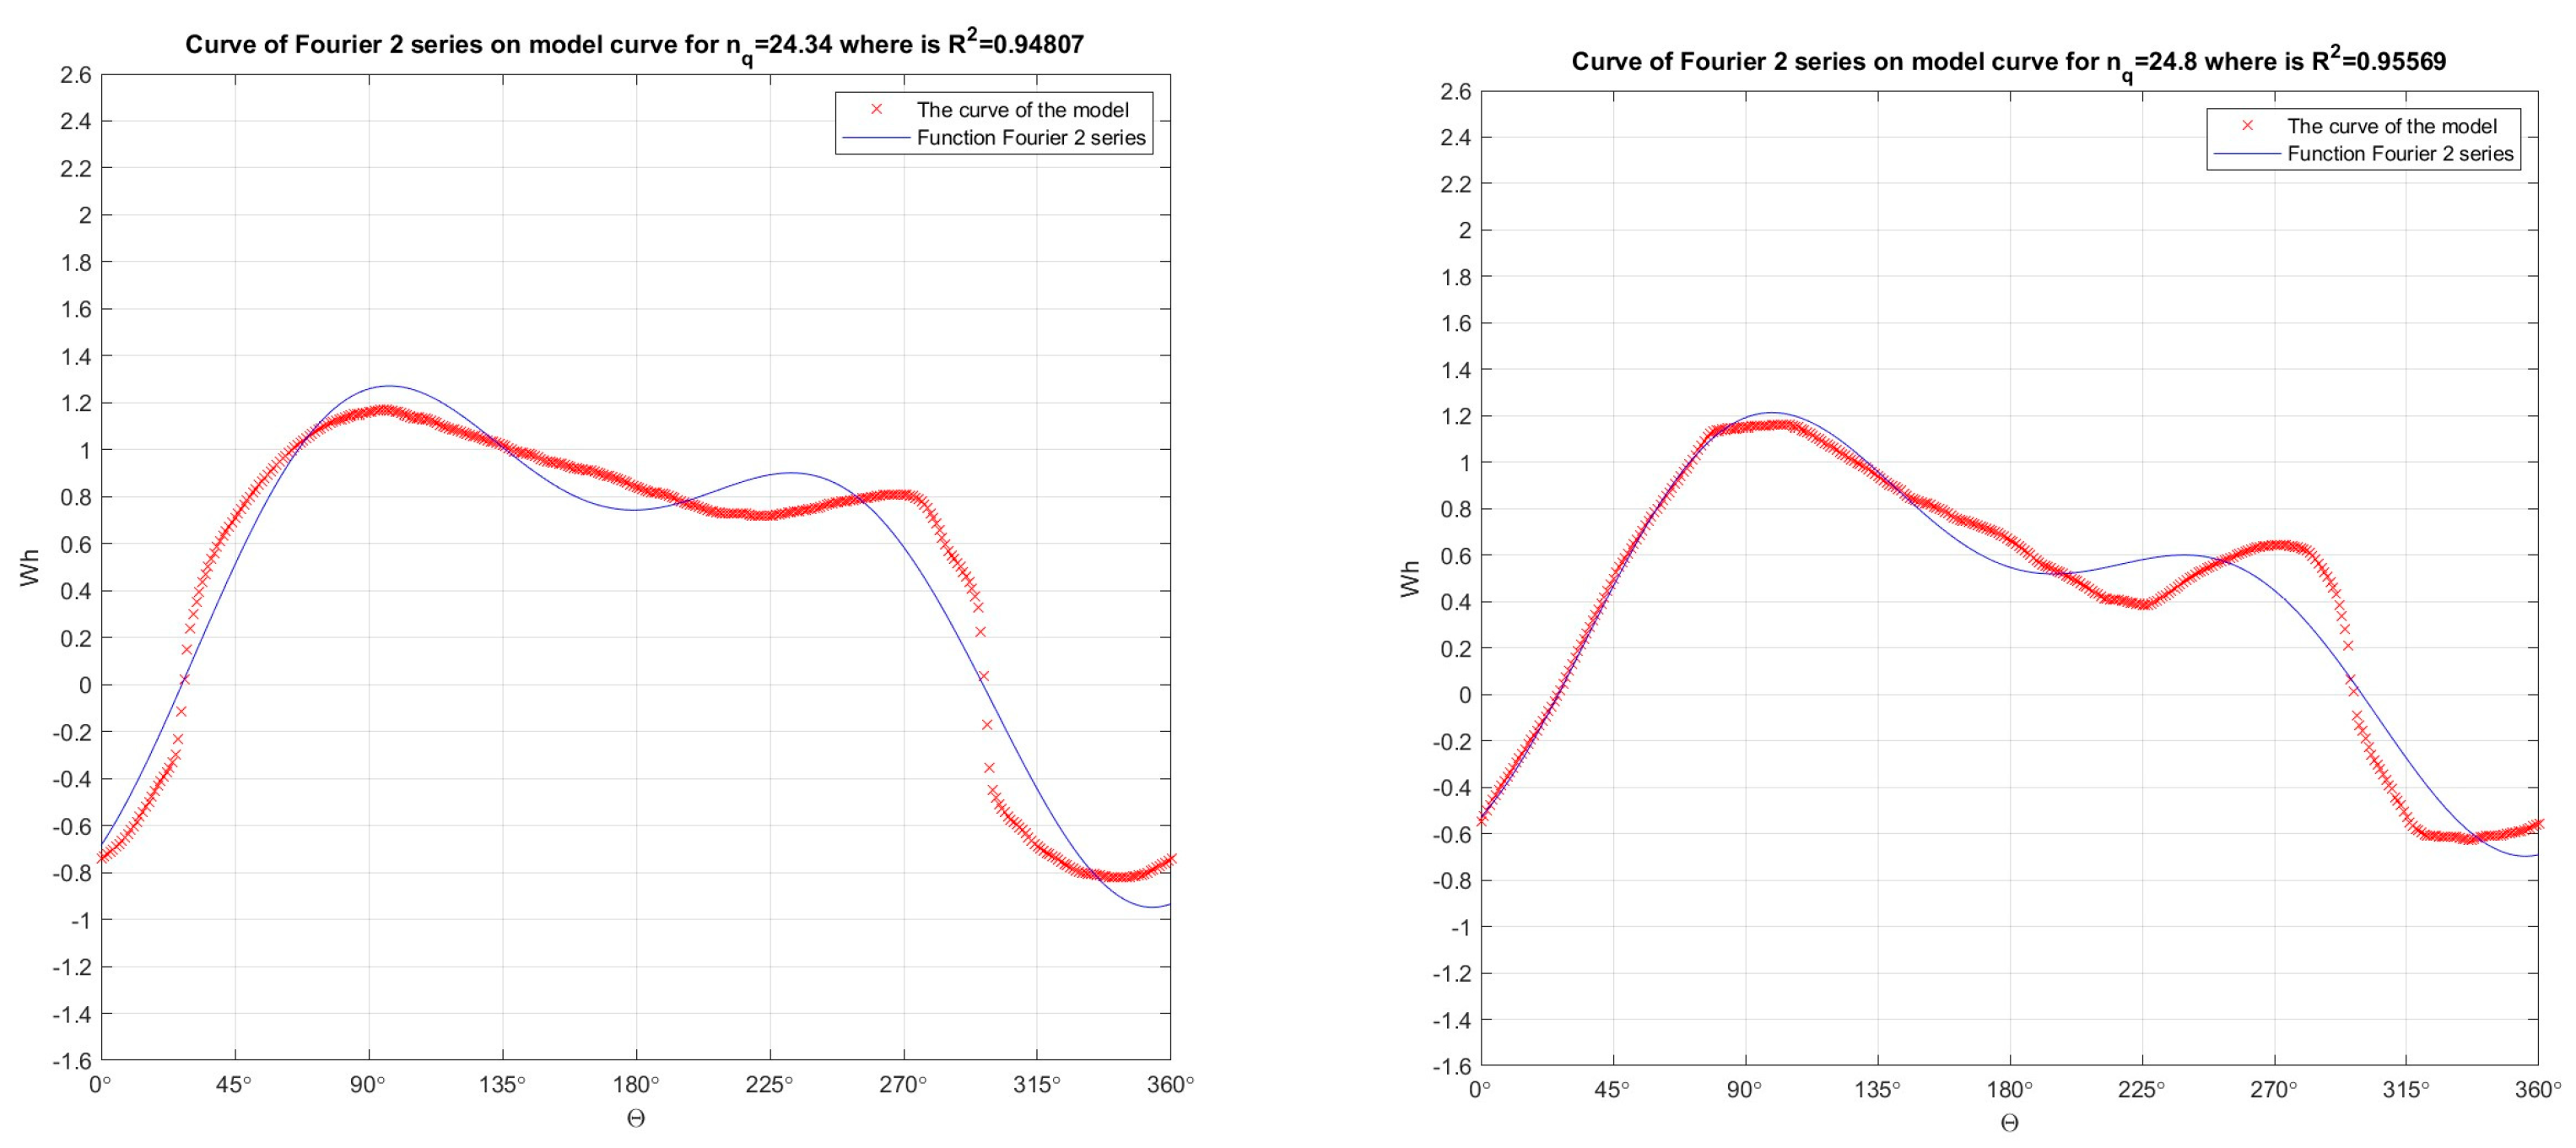
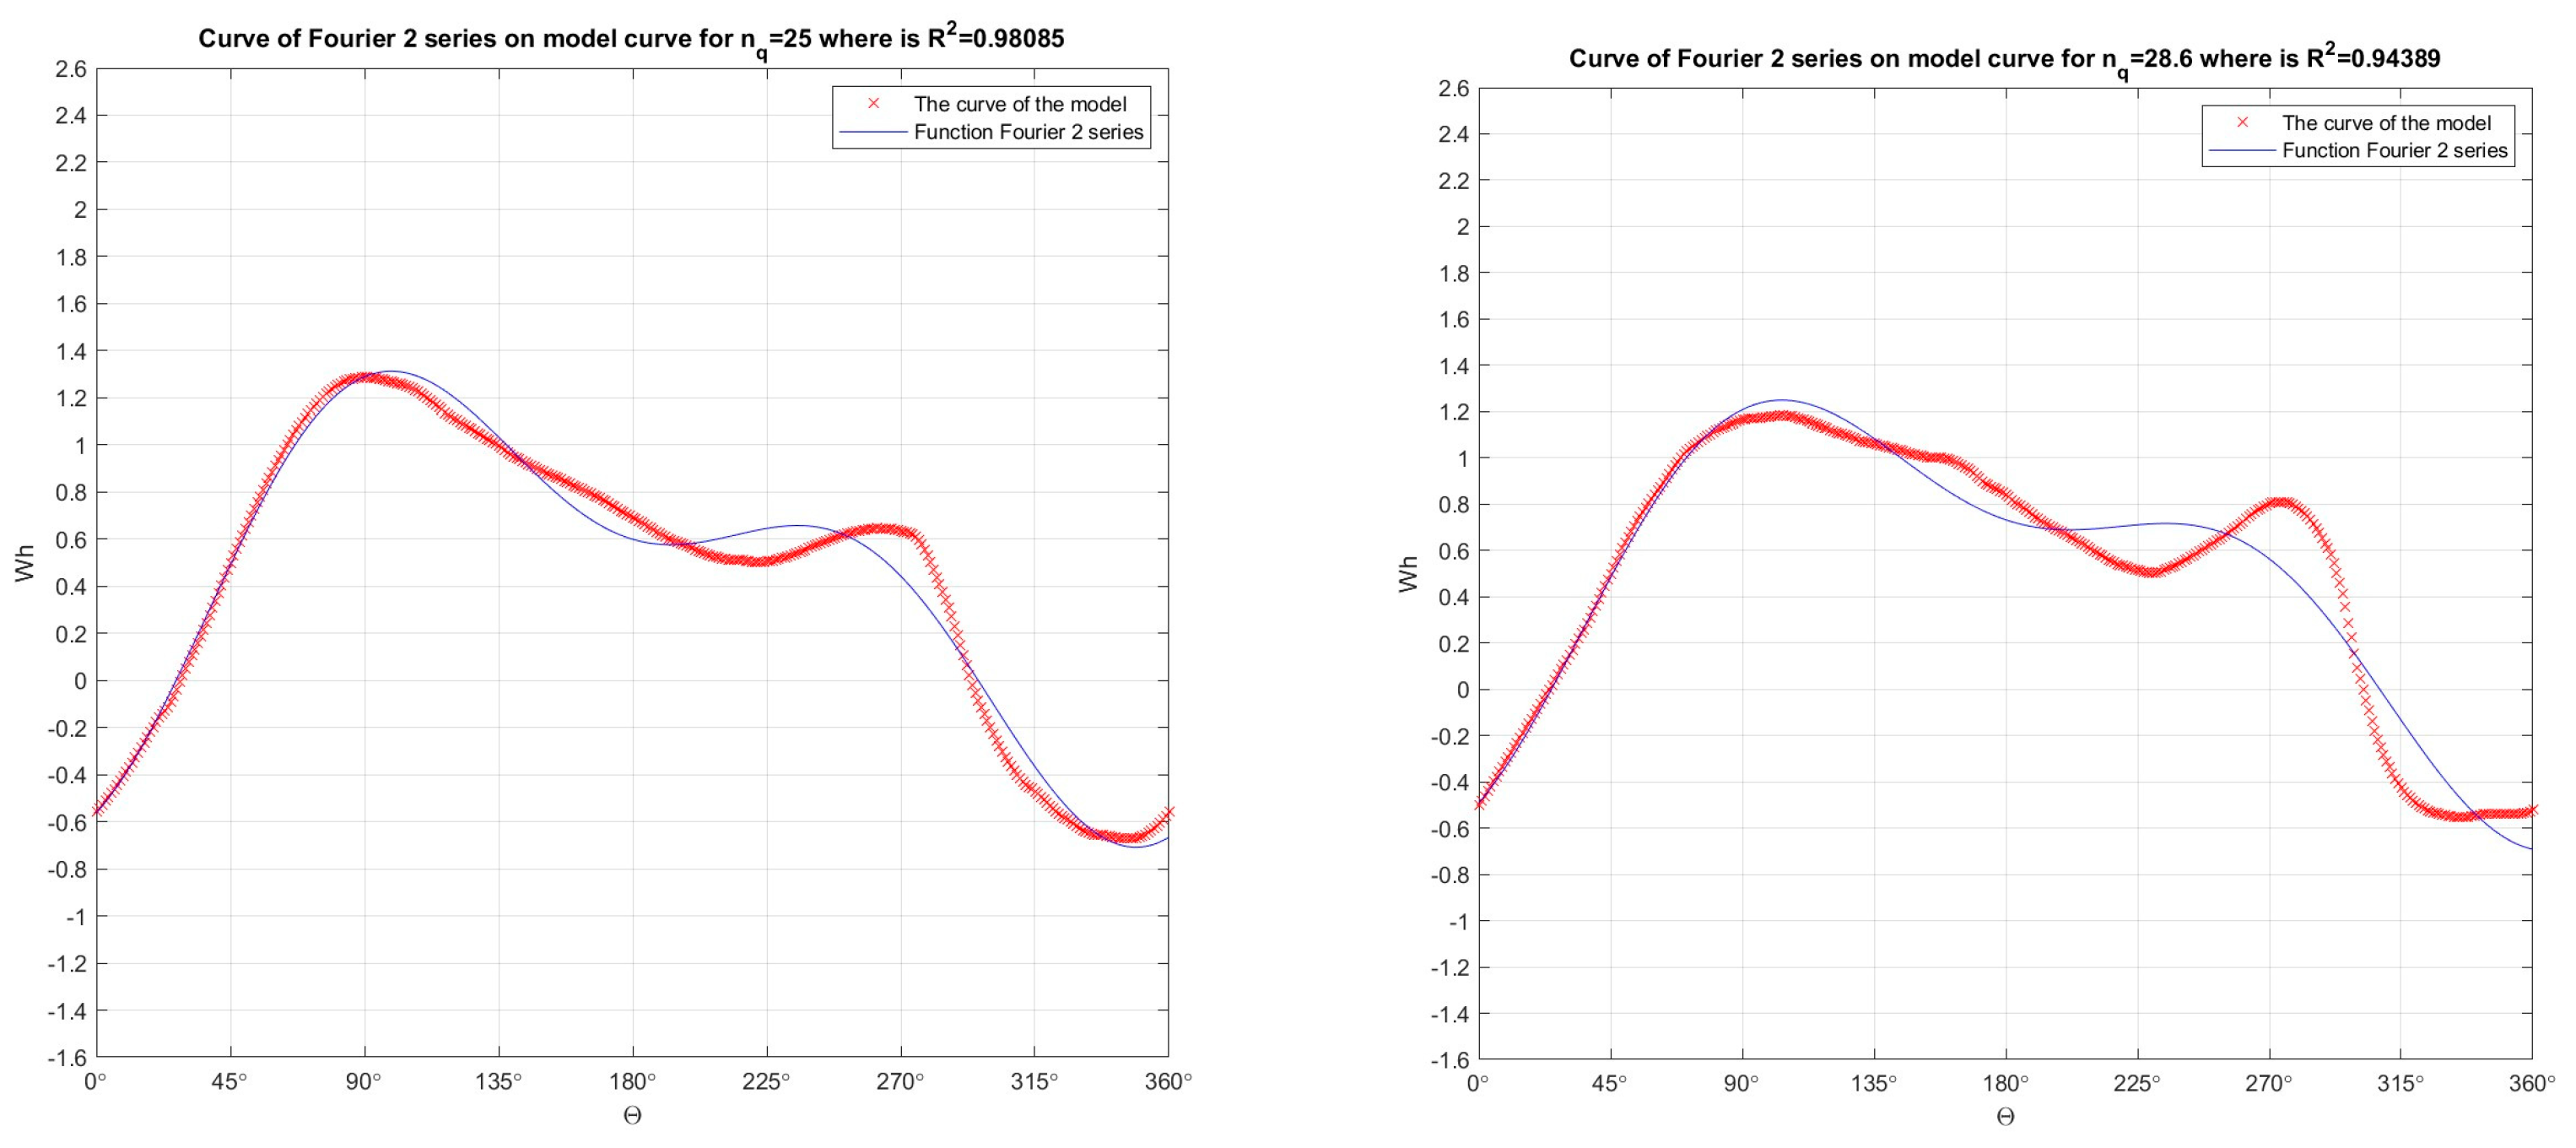
In the first step, for all thirteen Suter curves (for each curve separately for both the Wh characteristic and the Wm characteristic) for 11 pump-turbine models and 2 pump models in the theta range from 0° to 360°, is passed through each of thirteen Suter curves the Fourier function of 2 orders, which is clearly shown in the Figure 4, Figure 5 and Figure 6 (for Wh characteristic) and in the Figures 13–15 (for Wm characteristic), in this paper, not all diagrams for all thirteen Suter curves through which the Fourier function of 2 orders is passed are shown, in order not to overload this paper with a large number of diagrams, have already shown diagrams for six Suter curves with the following nq (nq=24.34, nq=24.8, nq=25, nq=28.6, nq=38, nq=41.6), for Wh and Wm characteristics.
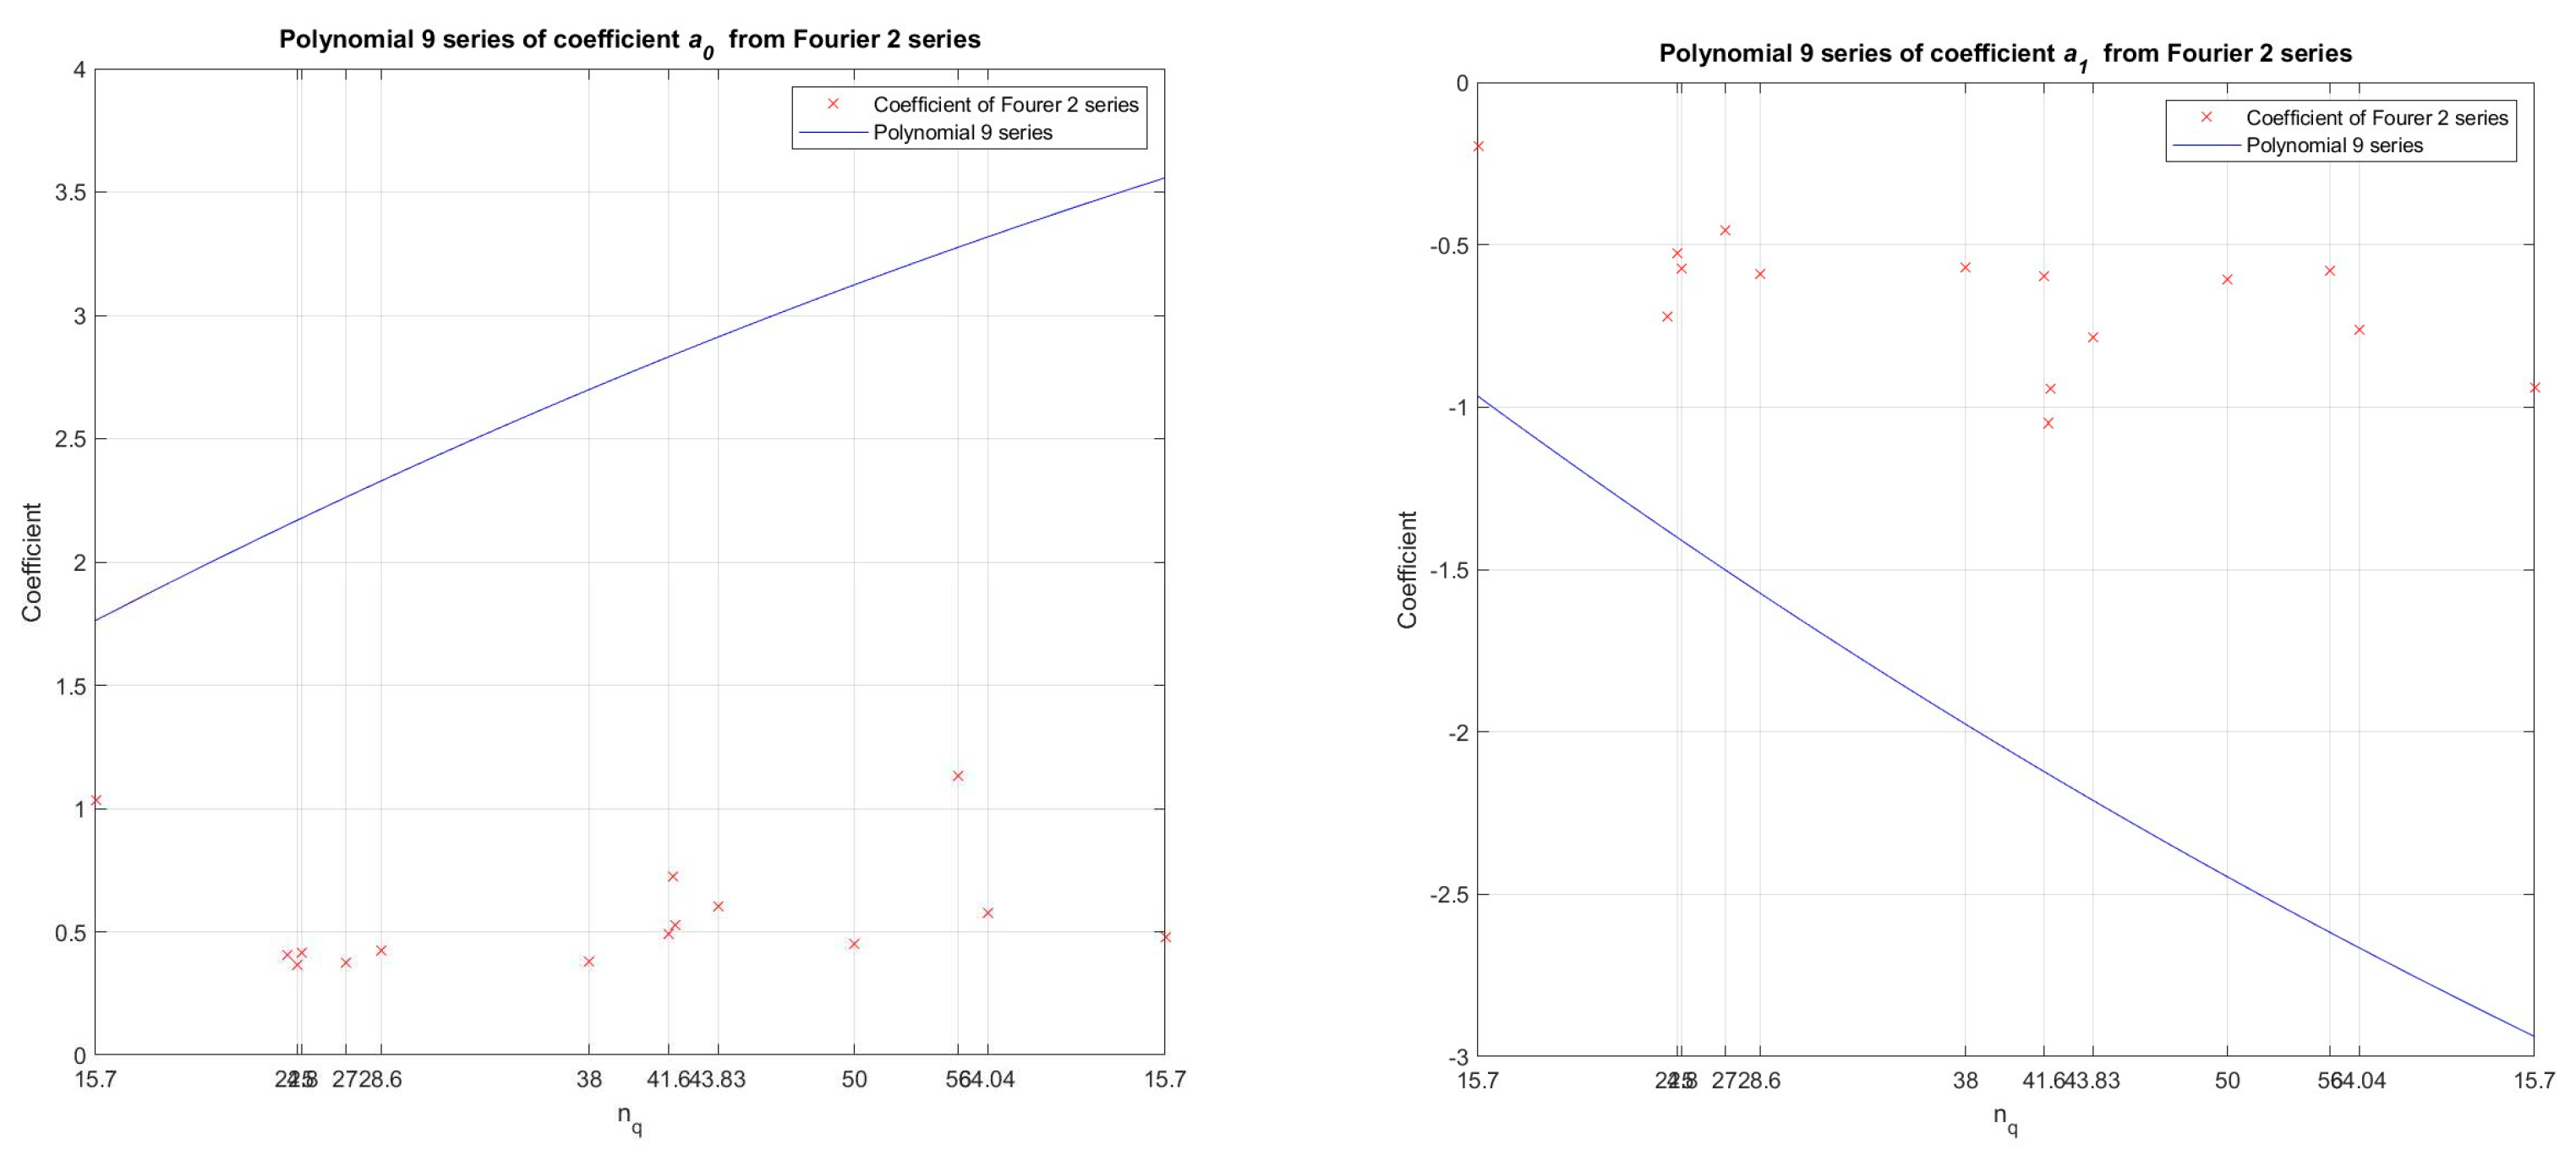
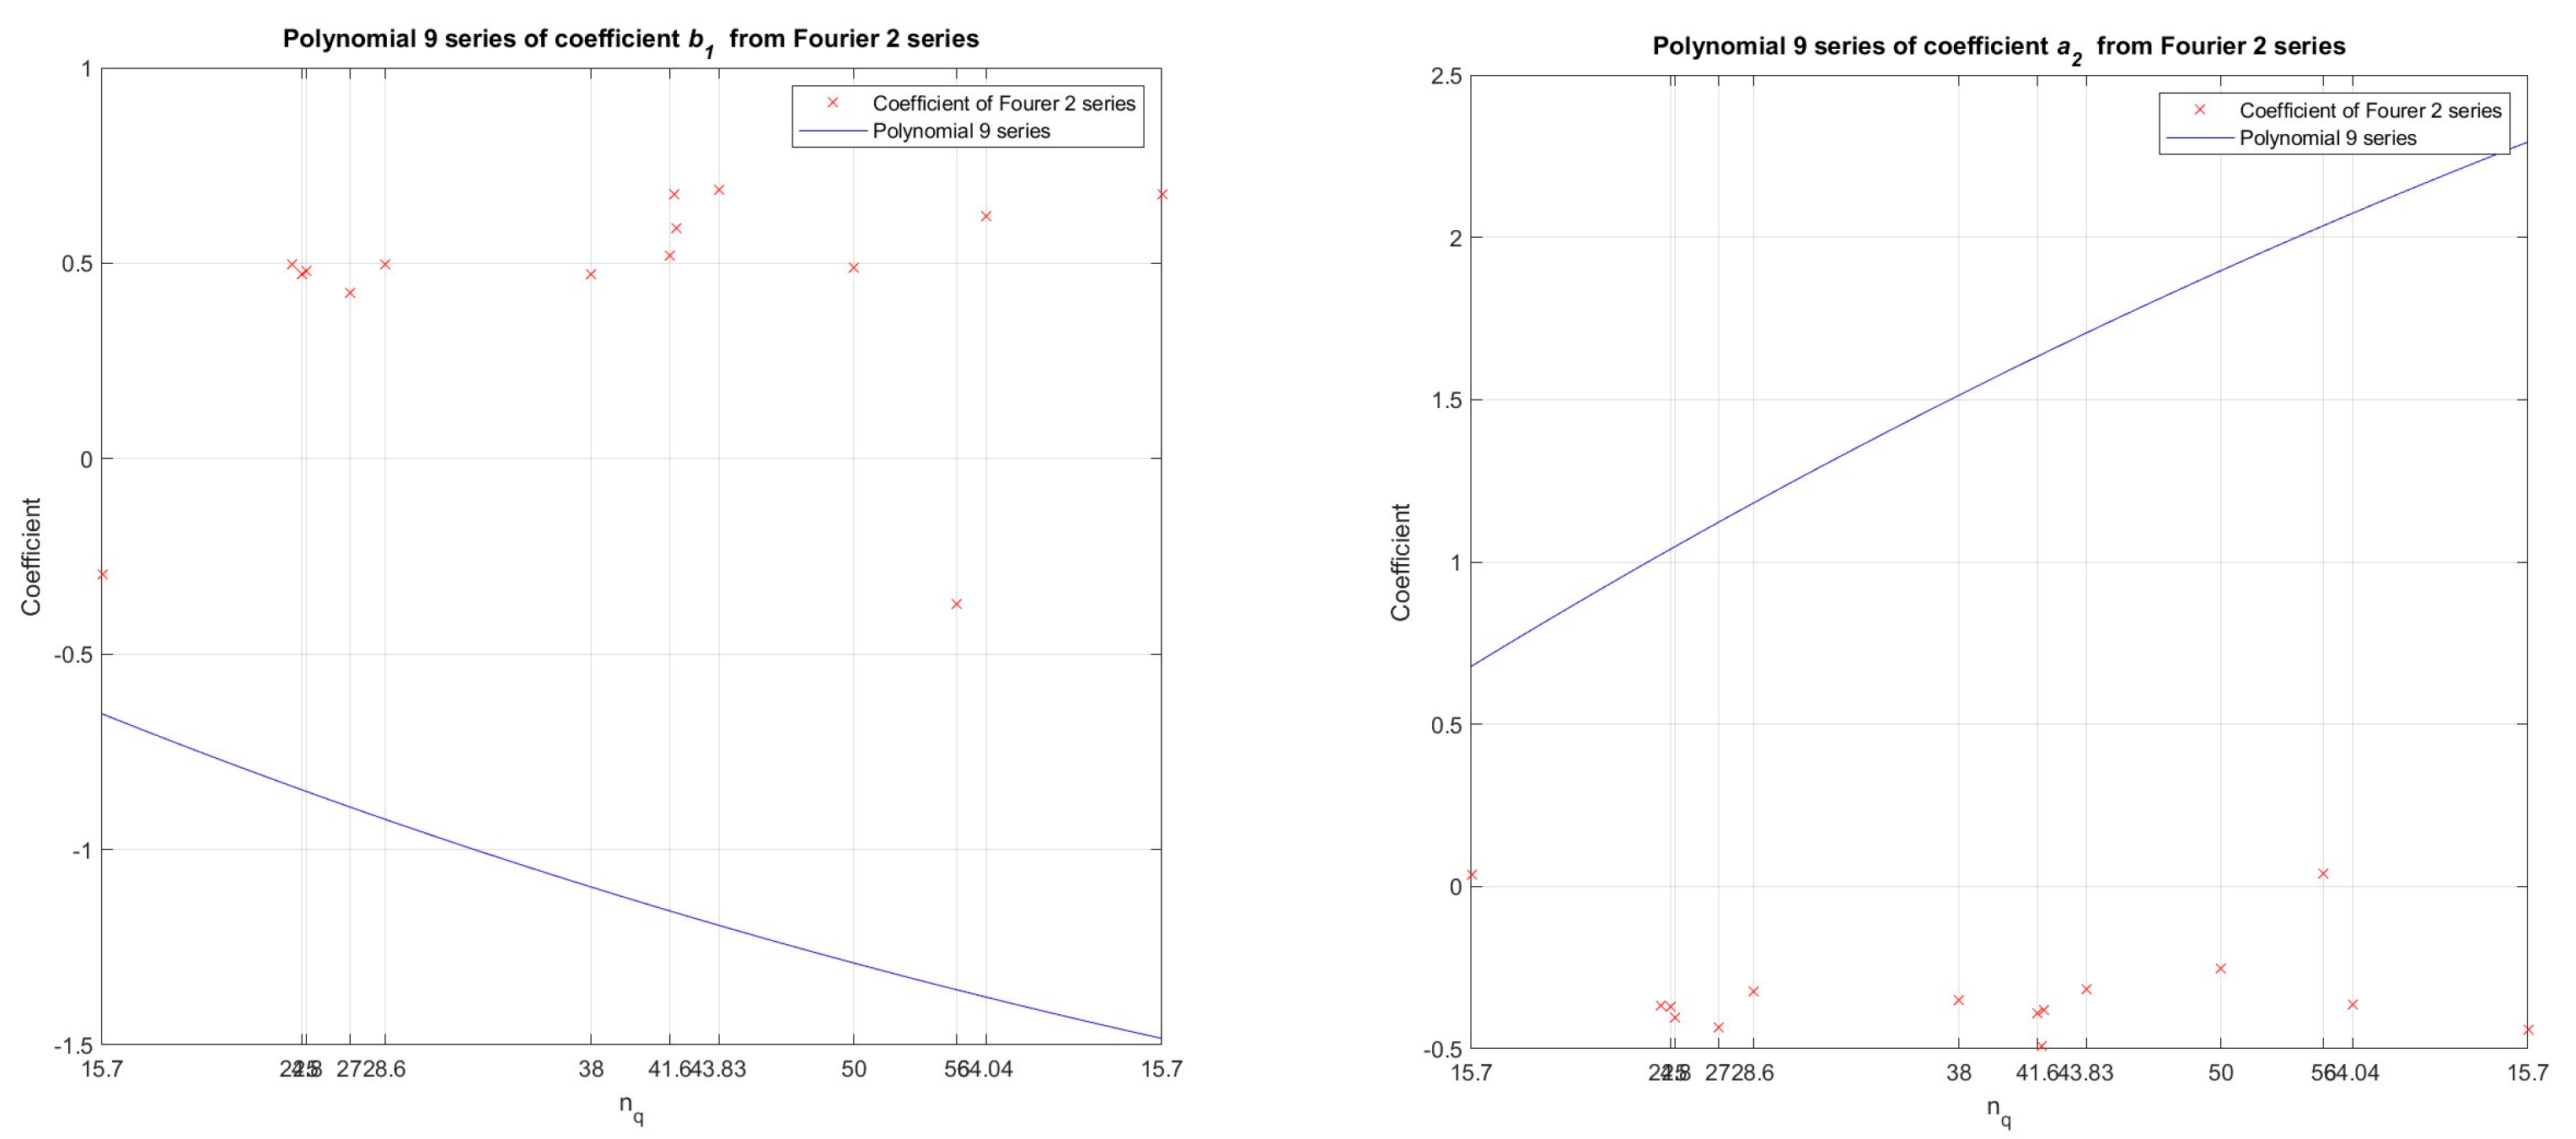
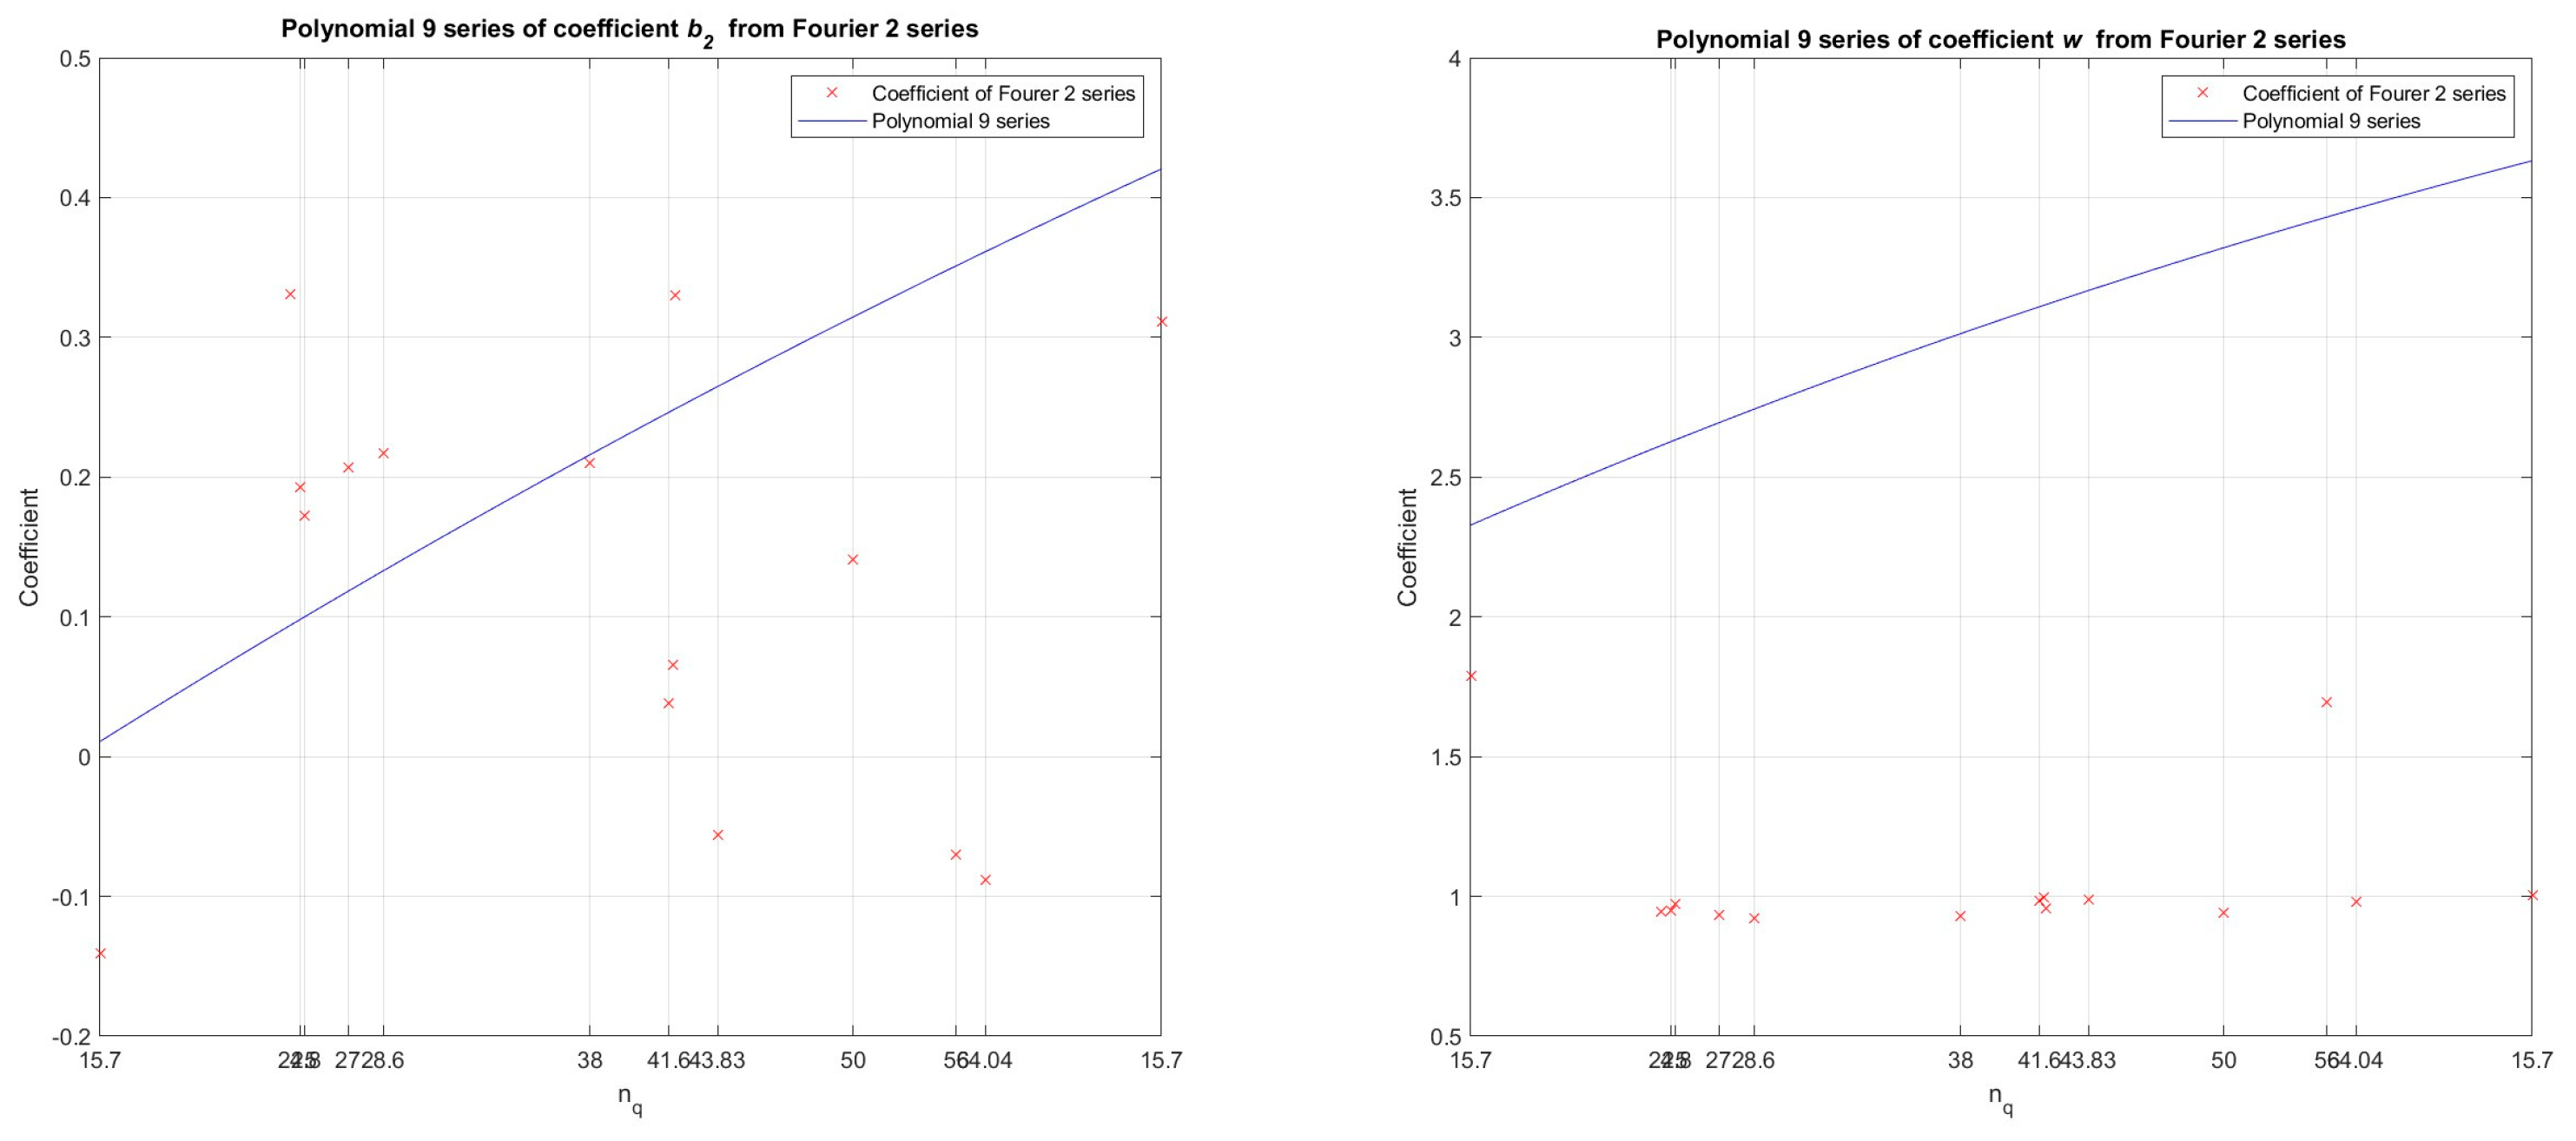
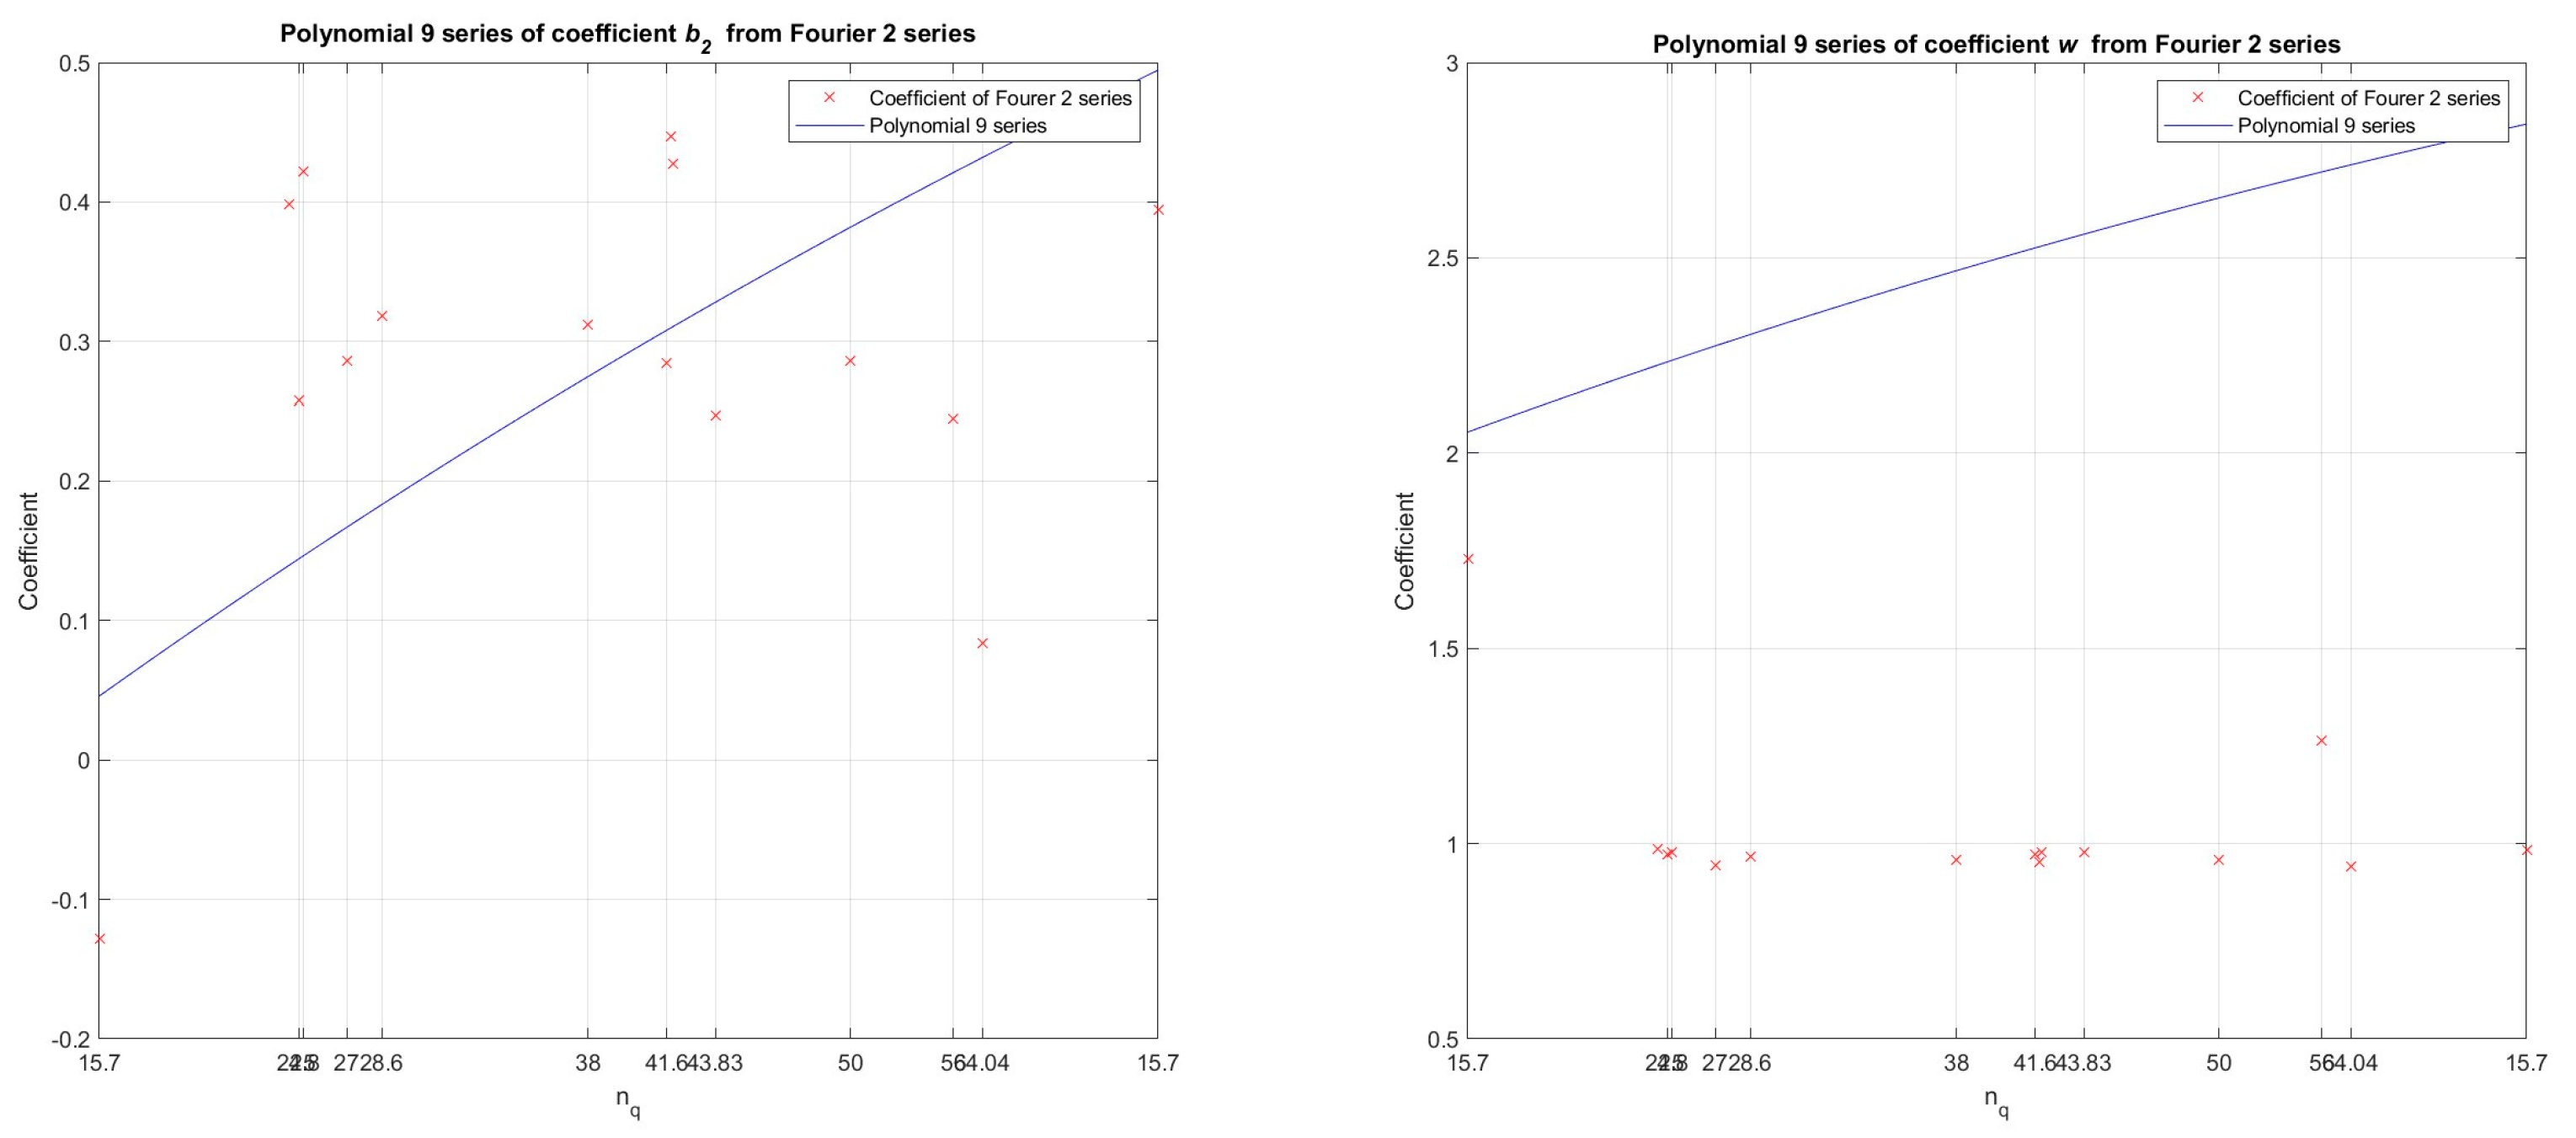
In the second step, the coefficients (ao, a1, a2, b1, b2, w) were taken from thirteen Fourier functions of 2 orders, which passed through each of thirteen Suter curves (11 pump-turbine models and 2 pump models), for each curve separately for both the Wh characteristic and the Wm characteristic. And then the authors of this paper separately (on separate diagrams) grouped the values for each of these coefficients from thirteen Fourier functions of 2 orders which passed through each of thirteen Suter curves (11 pump turbine models and 2 pump models), for each curve separately and for the Wh characteristic and for the Wm characteristic. On each of these diagrams, which are shown in Figure 7, Figure 8 and Figure 9 for the Wh characteristic and in Figures 16–18 for the Wm characteristic, the values of these coefficients from the Fourier functions of 2 orders are shown depending on the specific speed - nq. And on each of these diagrams, a polynomial of 9 orders is passed through the values of the coefficients listed on these diagrams, which are taken from thirteen Fourier functions of 2 orders which passed through each of thirteen Suter curves (11 pump-turbine models and 2 pump models), and each of these polynomials of 9 orders has the role of showing the dependence of these coefficients on the specific speed - nq.
In the third step, by polynomial regression (polynomial of 9 orders) in the developed numerical model in the Matlab program, the dependence between the values of the coefficients (ao, a1, a2, b1, b2, w) and specific speed – nq (11 pump turbine models and 2 pump models) was determined.
In the fourth step, based on the afore mentioned steps in the developed numerical model in the Matlab program, the Universal equation for the Wh characteristic and the Universal equation for the Wm characteristic were obtained depending on the specific speed. The Universal equation for Wh and Wm characteristics is expressed in the developed numerical model in the Matlab program with the Fourier equation of 2 orders depending on the specific speed.
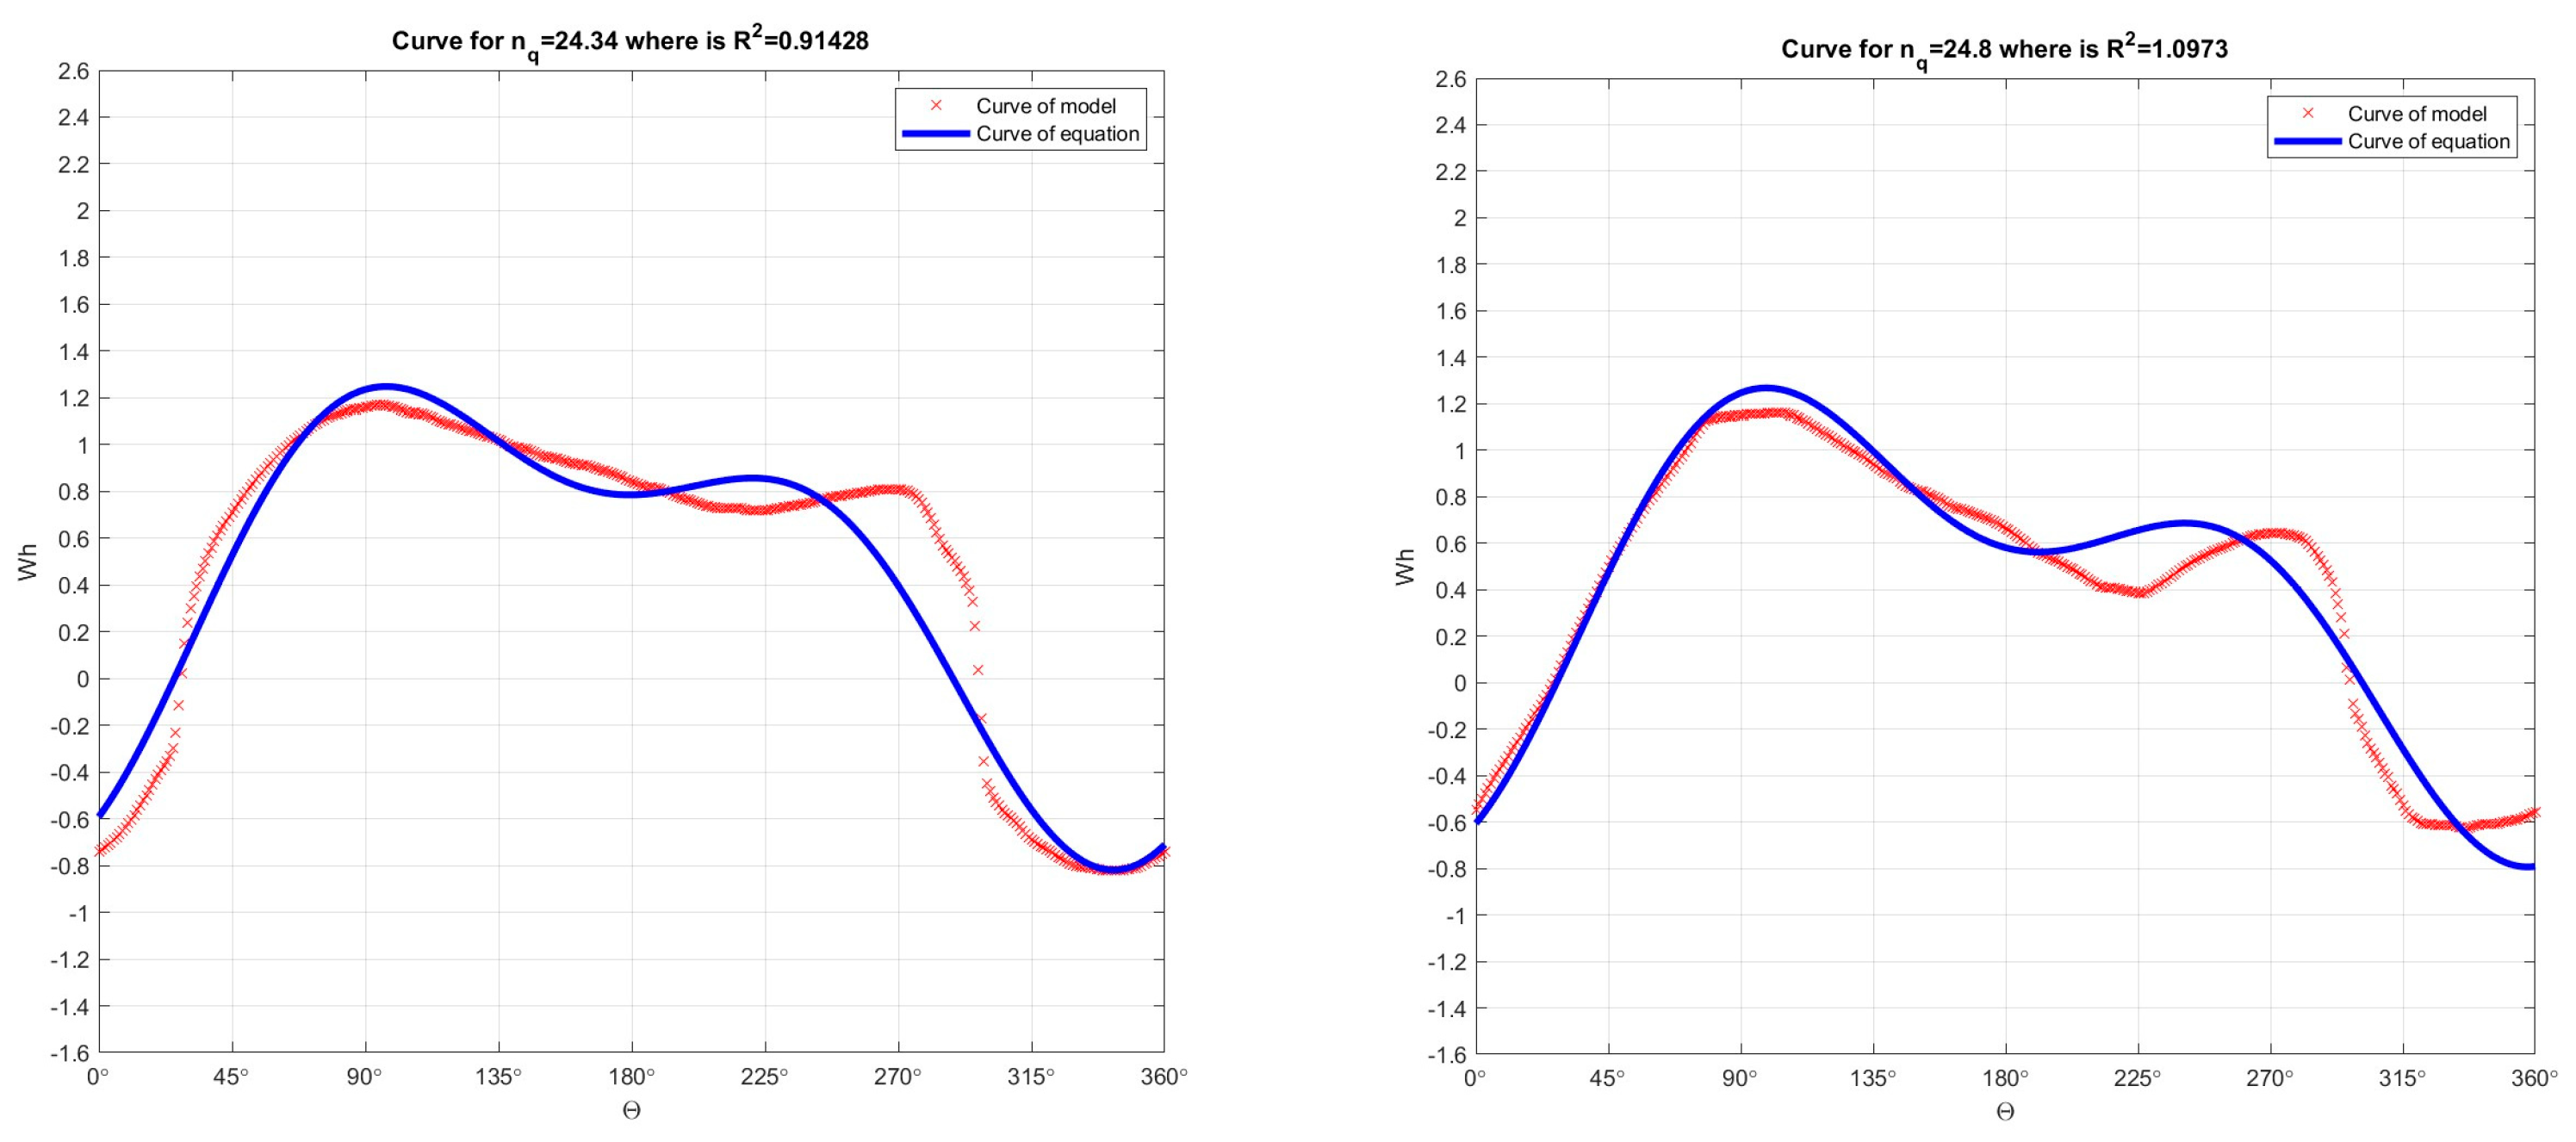
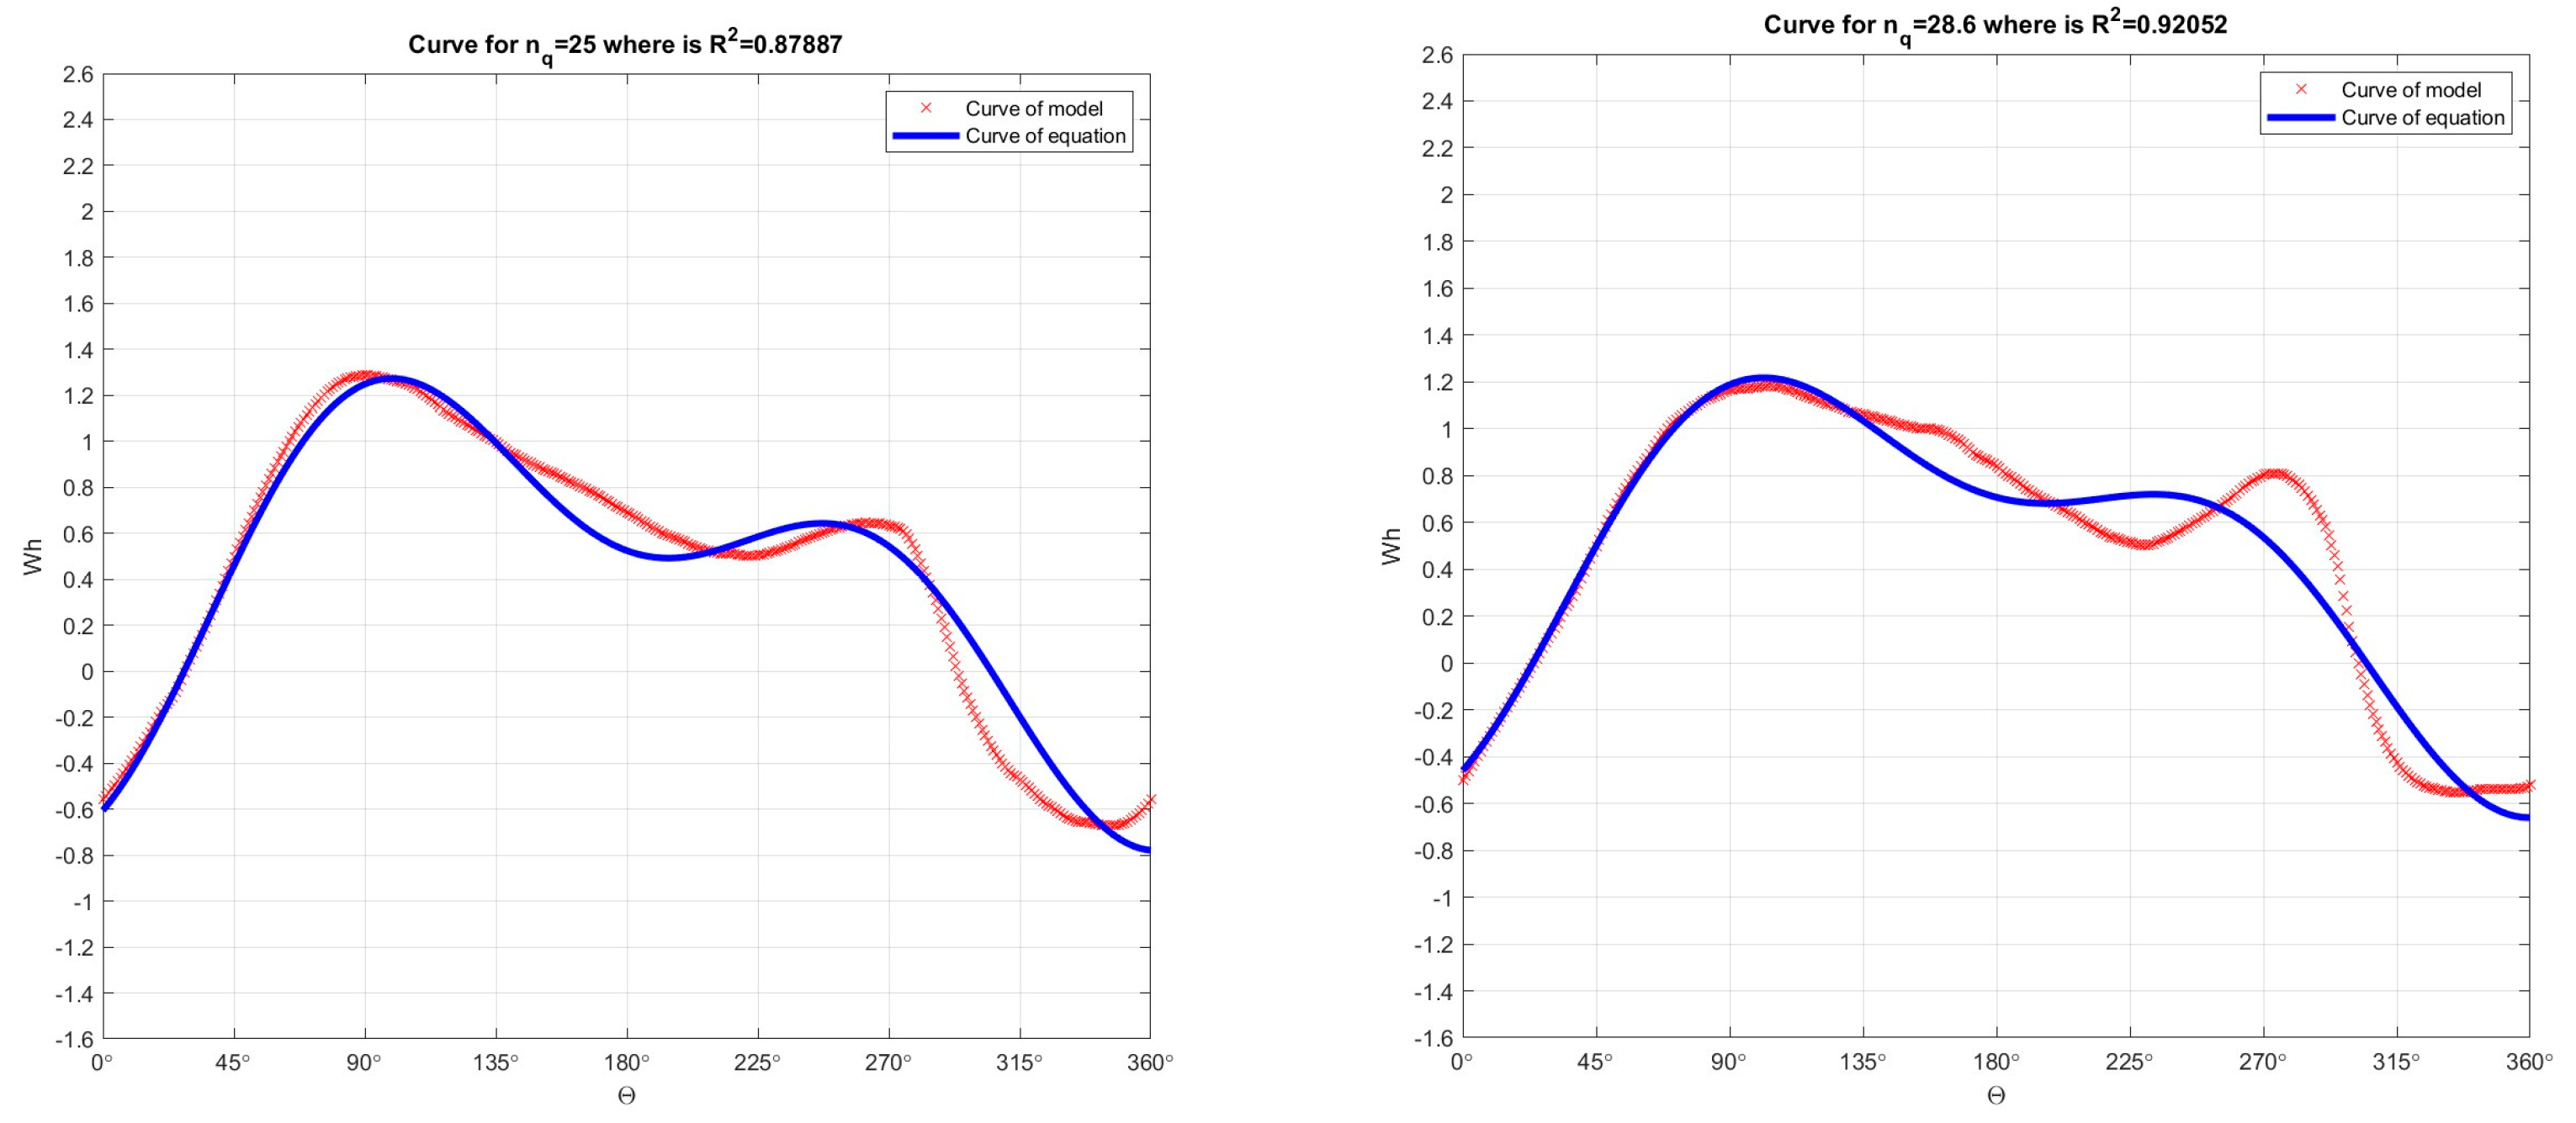
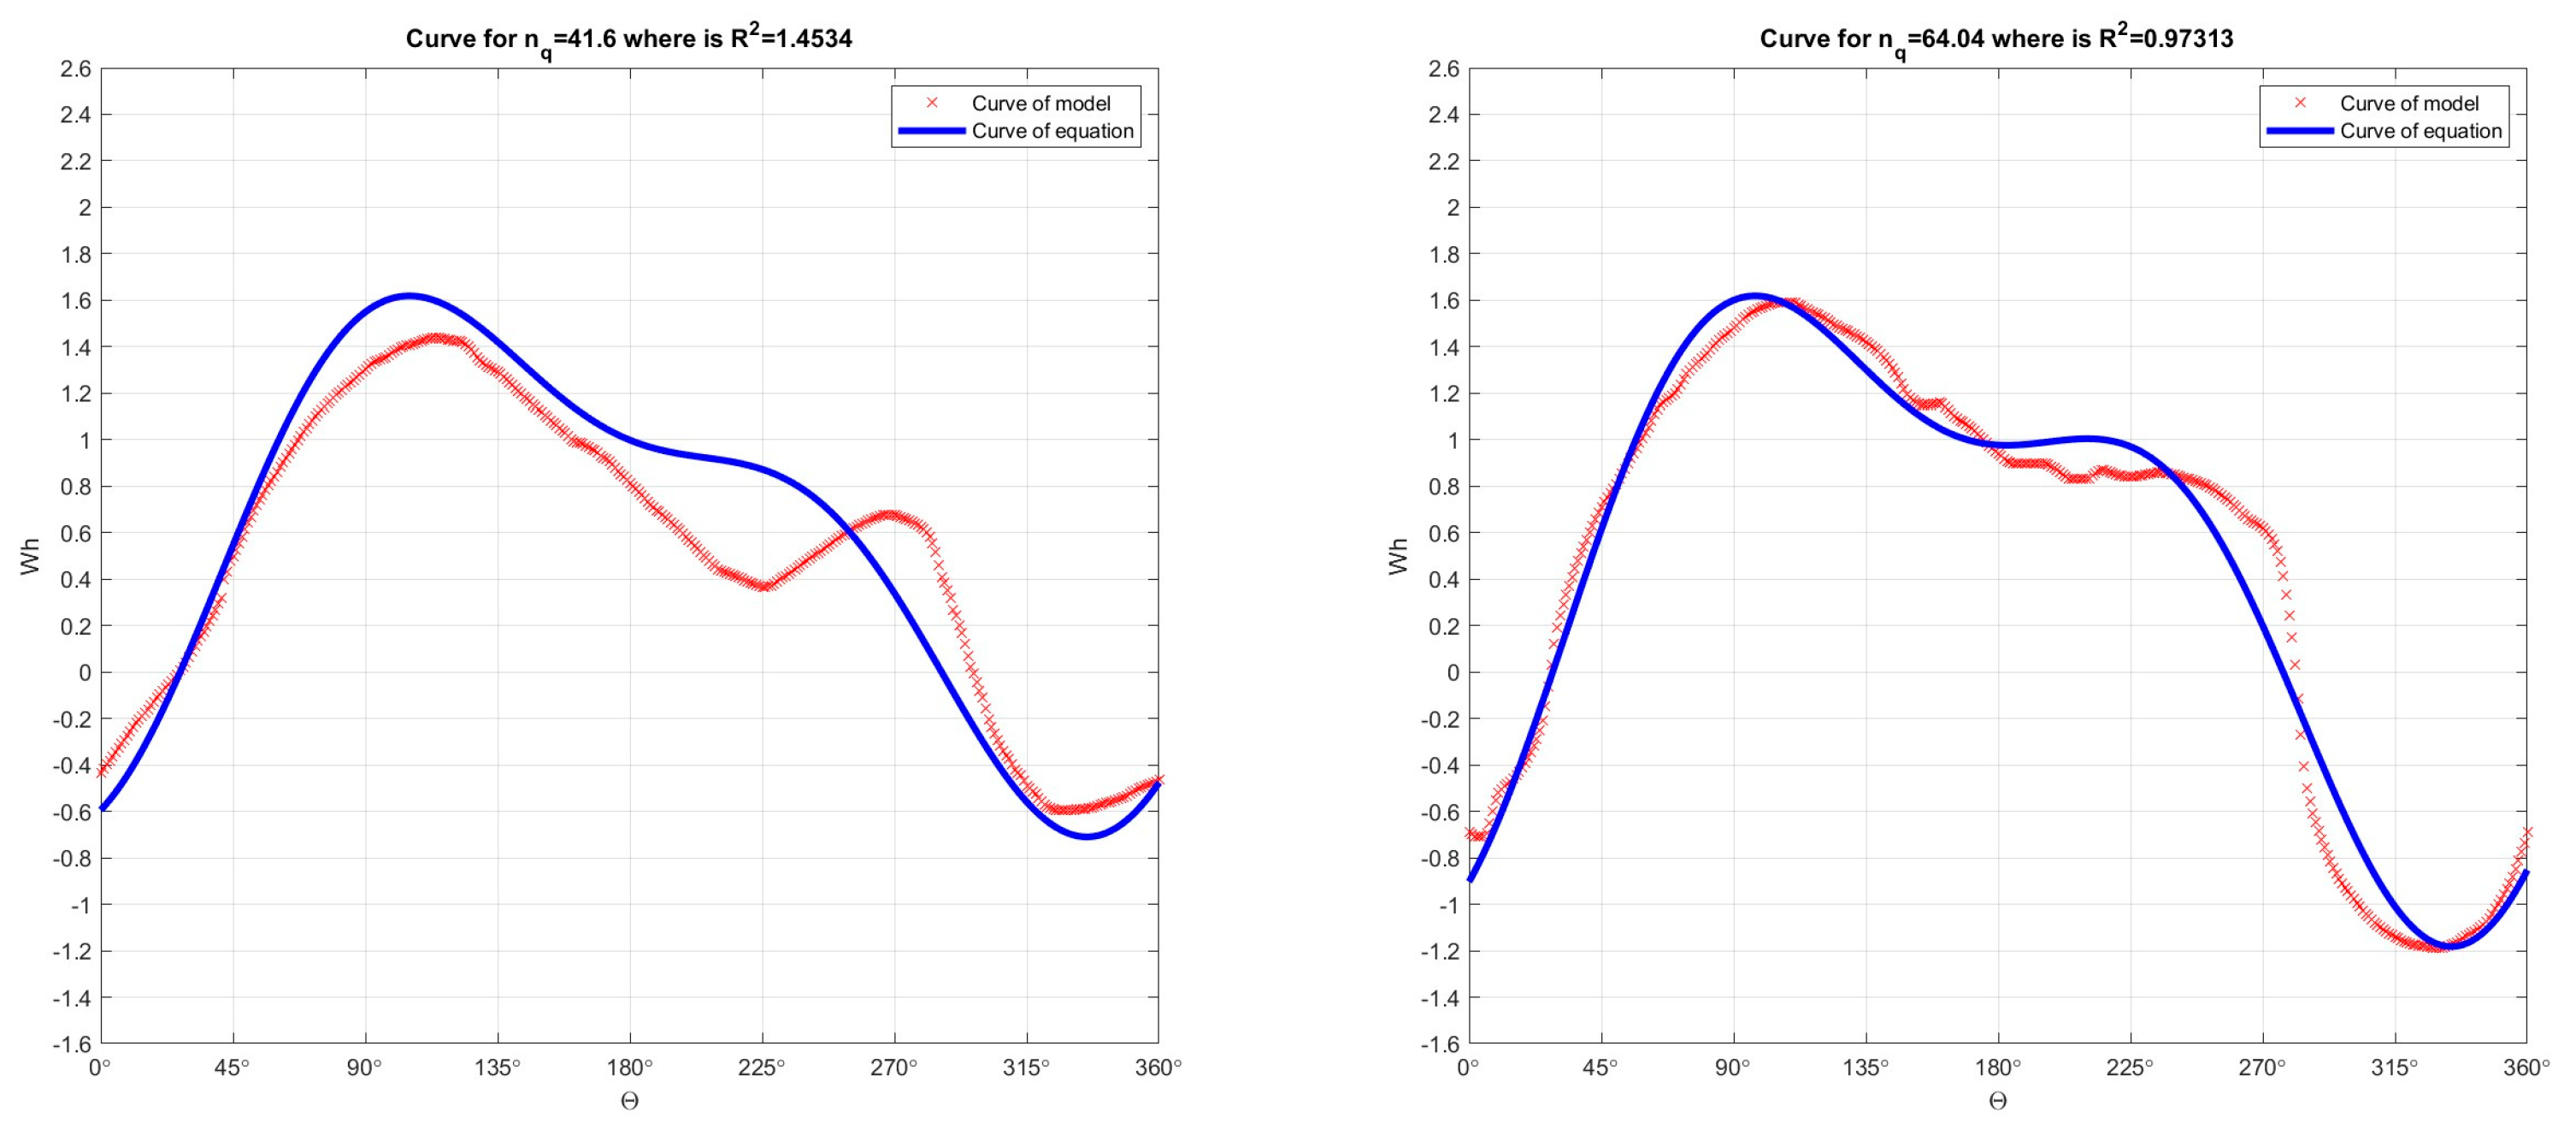
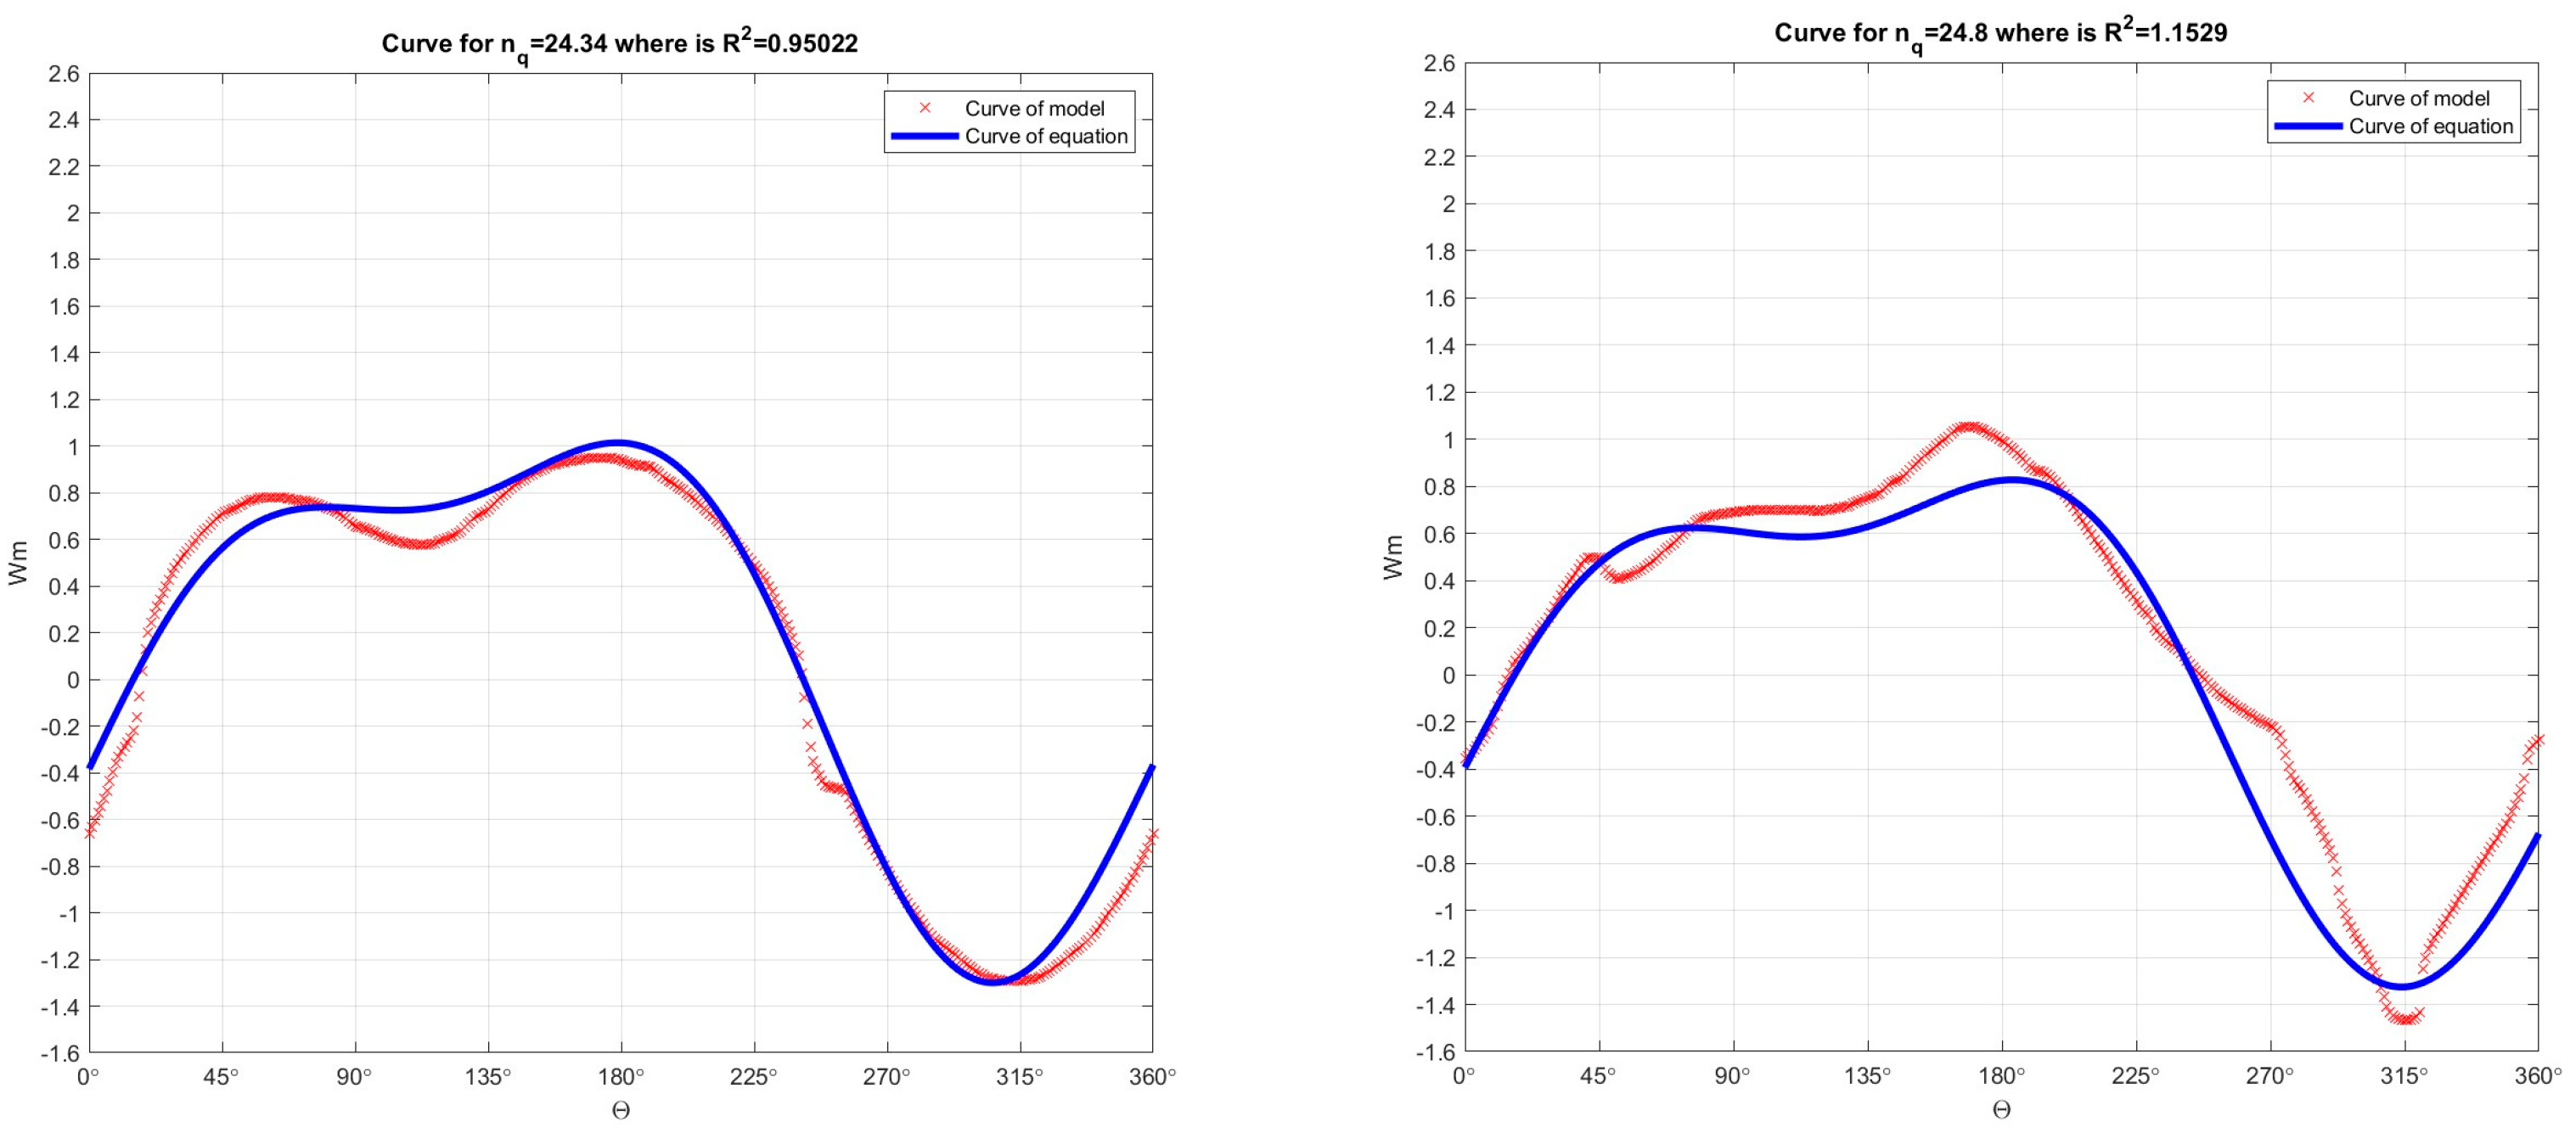
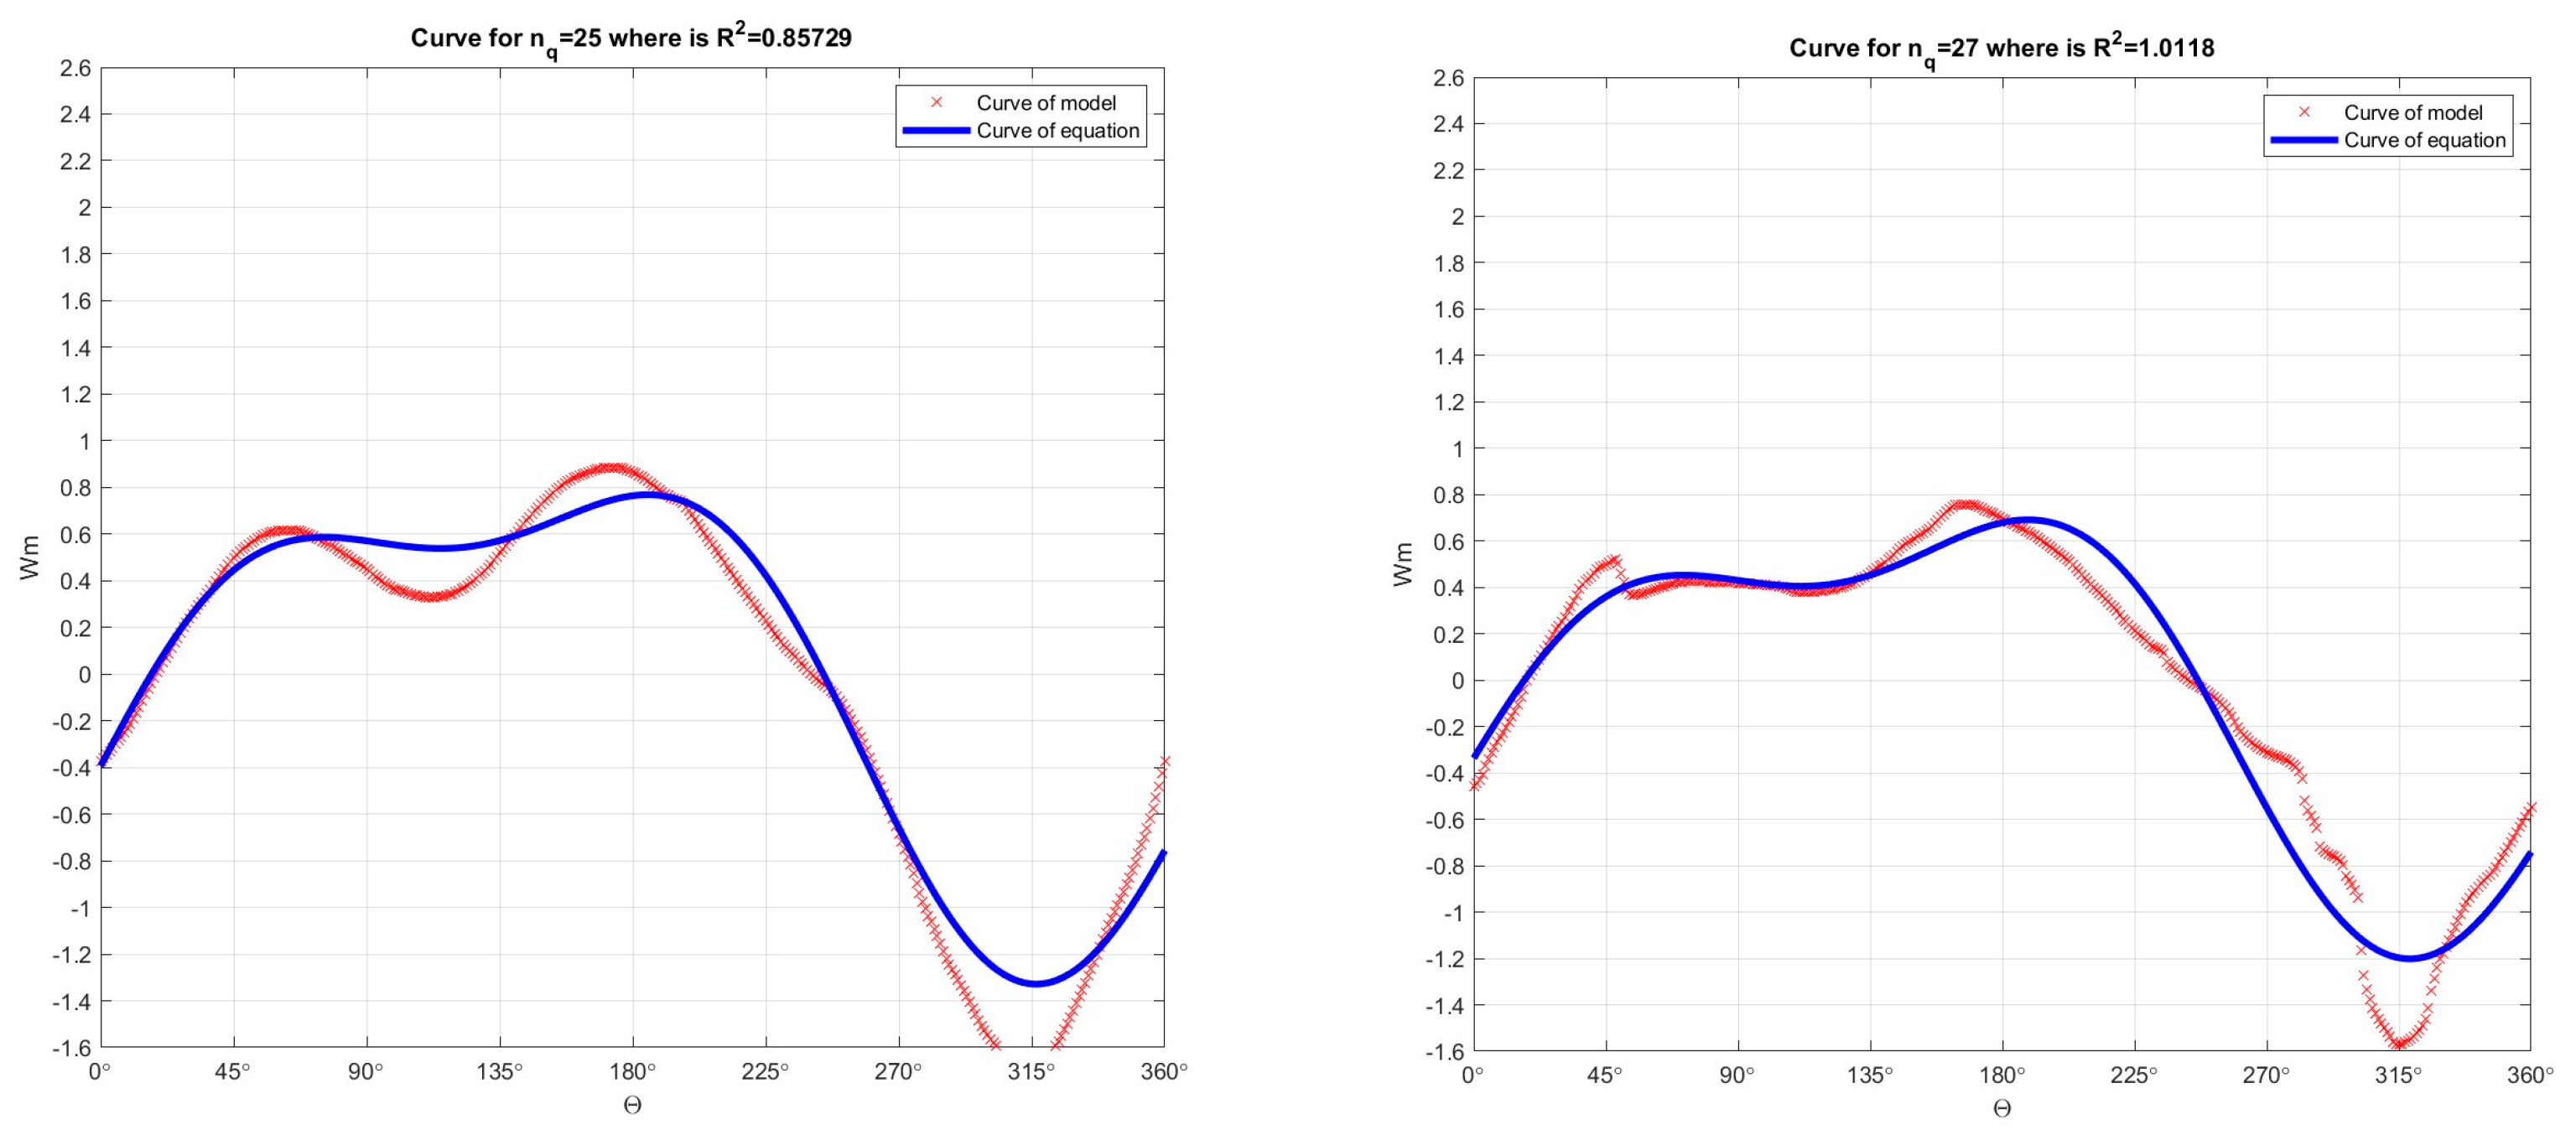
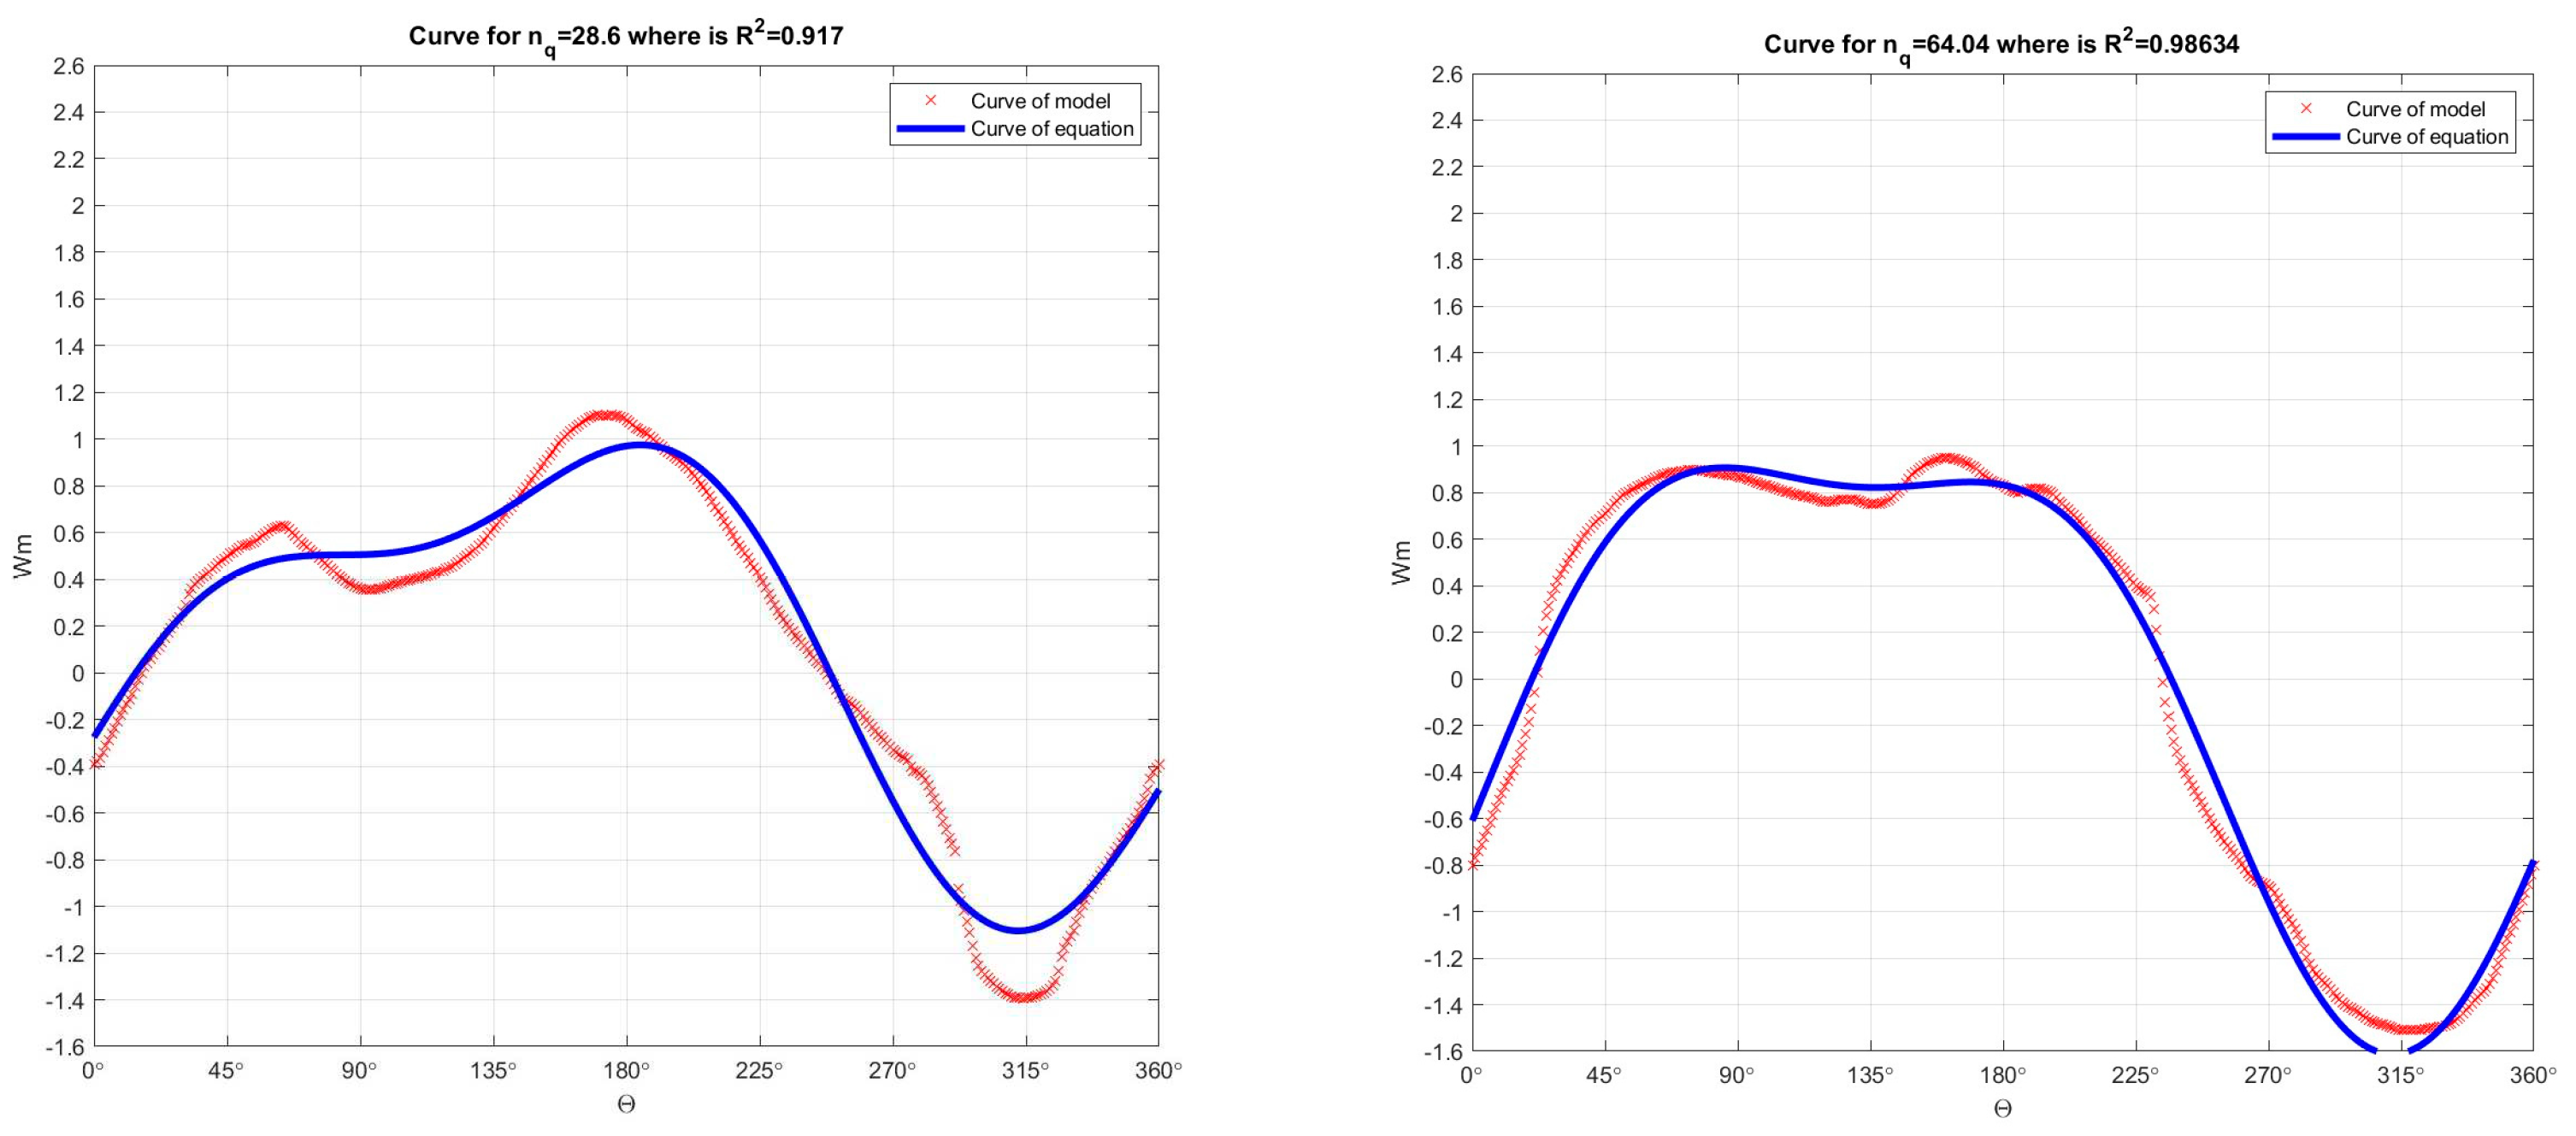
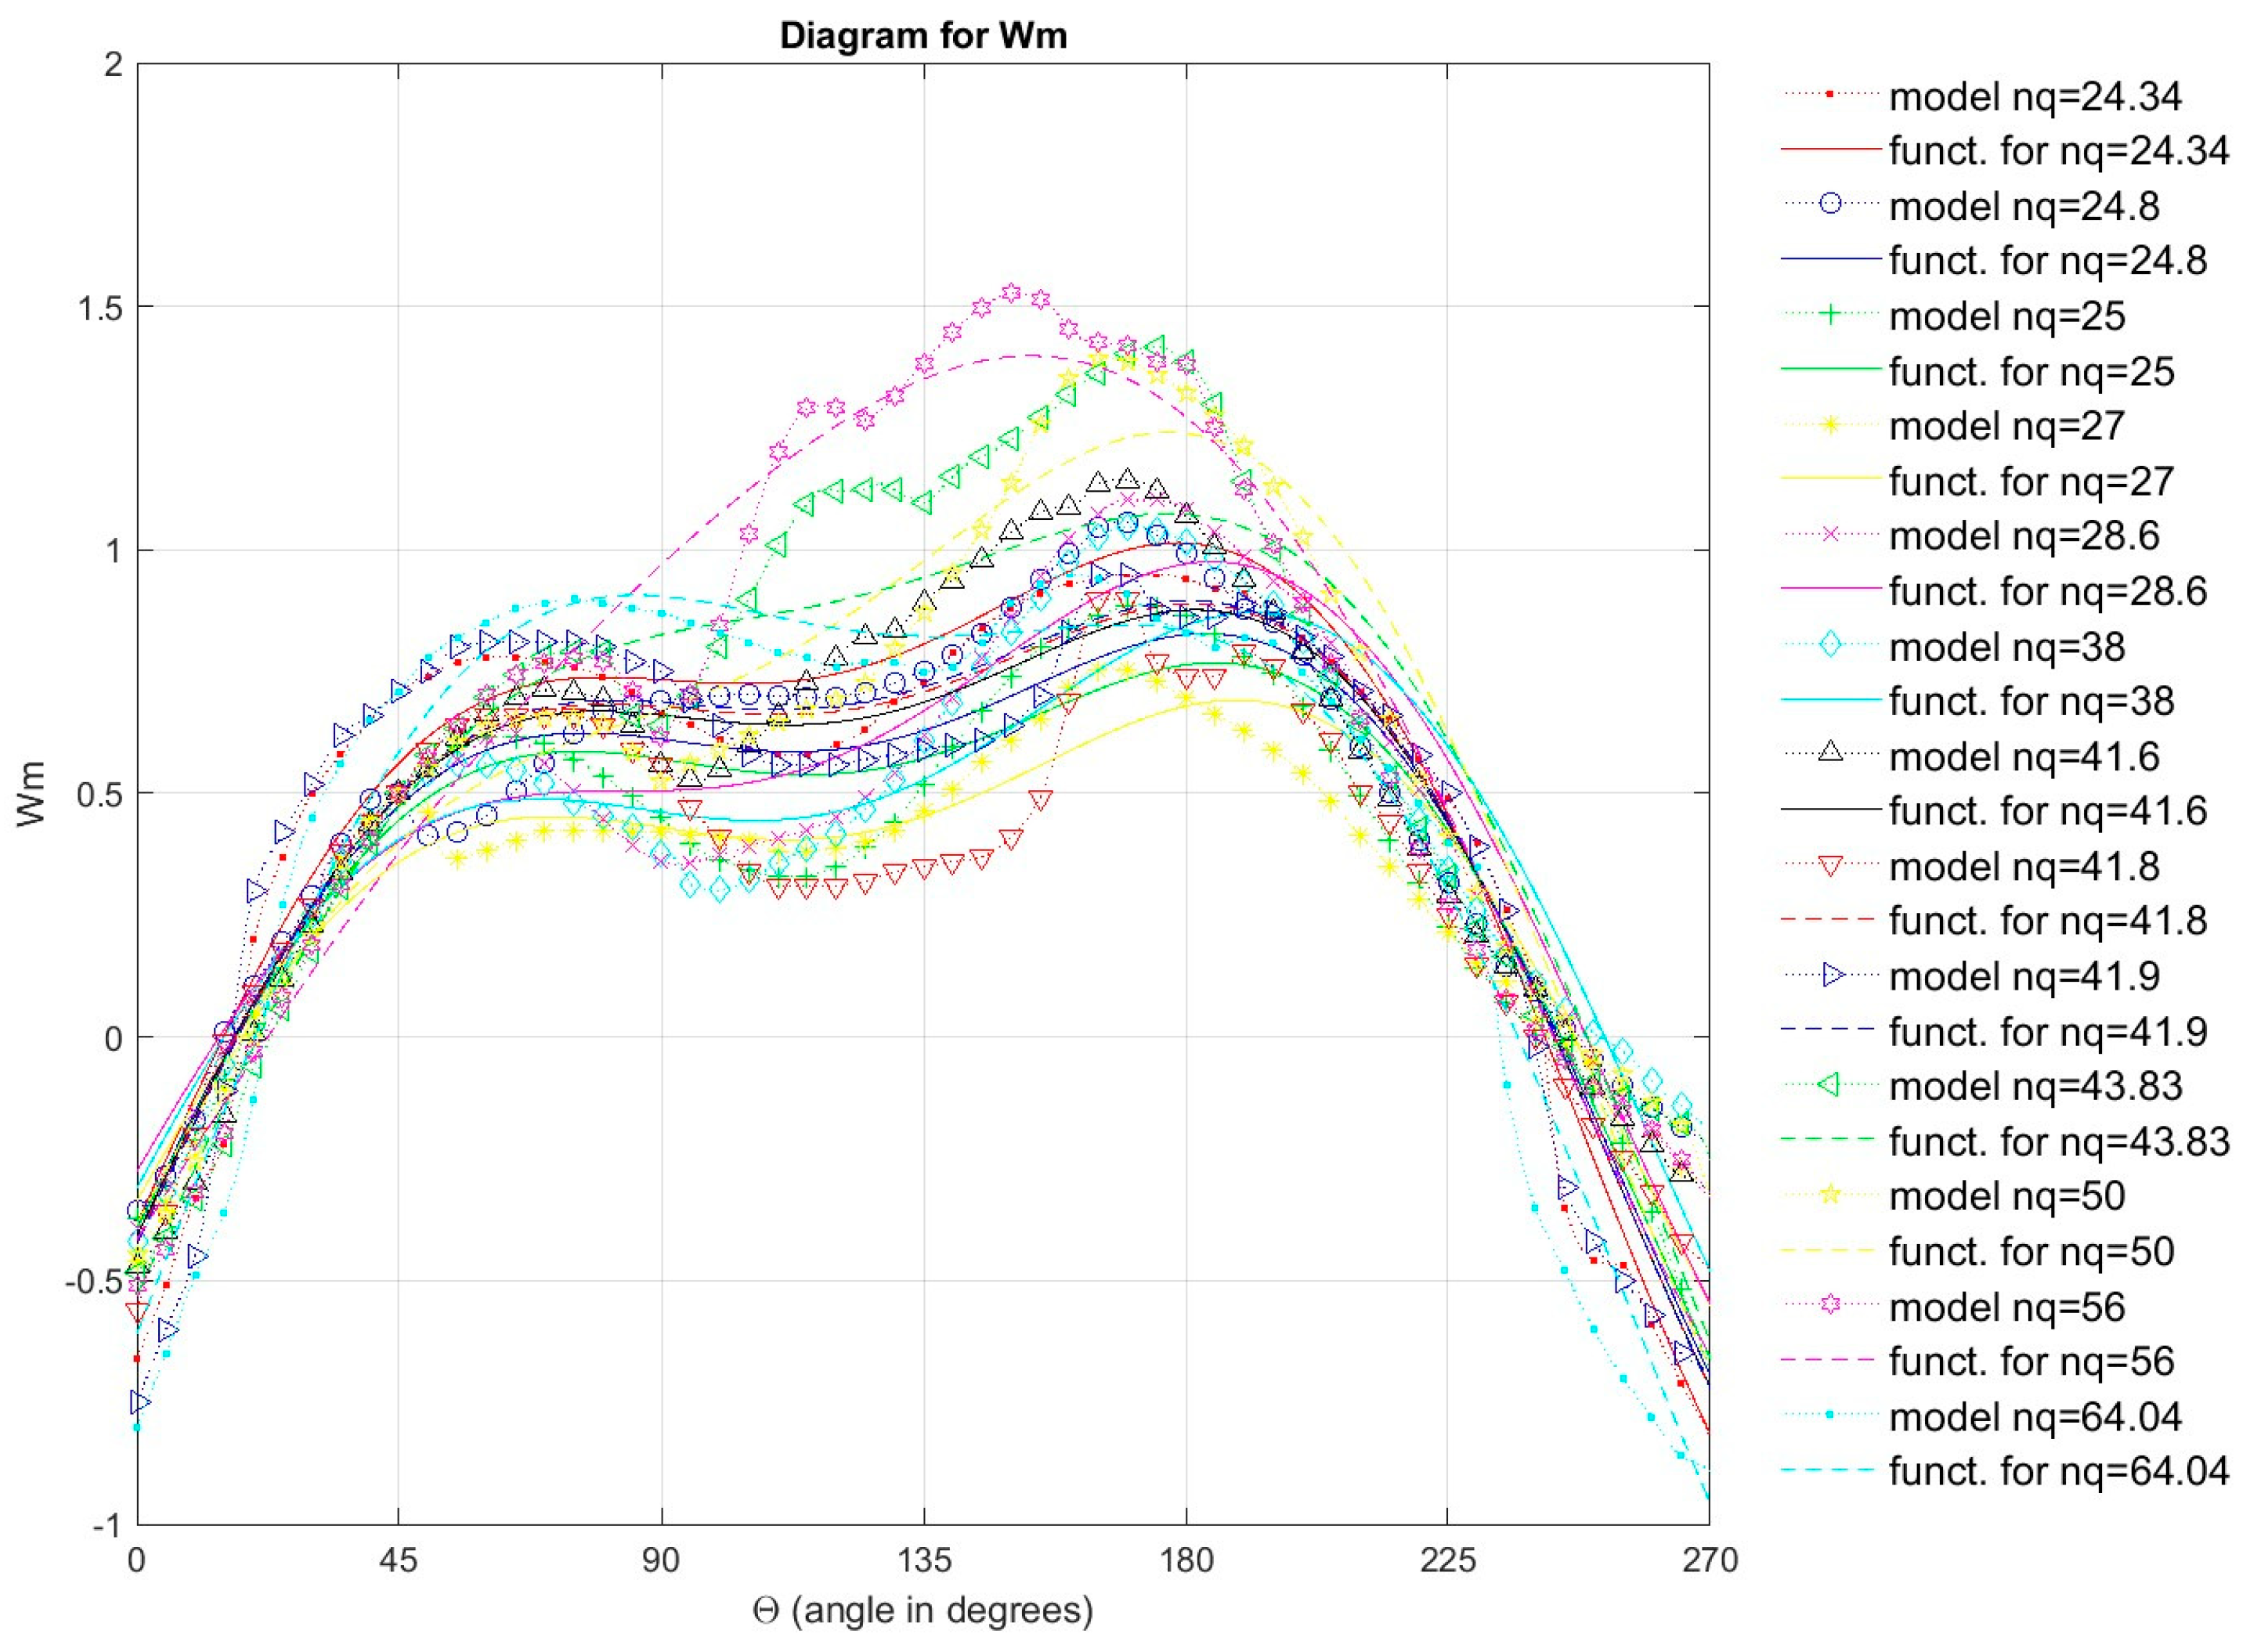
In the fifth step, based on the developed numerical model in the Matlab program, from the Universal equations for Wh and Wm characteristics, the authors of this paper obtained values for Wh and Wm characteristics for 13 Suter curves with different specific speed - nq and compared those values with the values for Wh and Wm characteristics for 13 Suter curves obtained by recalculation of model curves with different specific sped - nq (11 pump-turbine models and 2 pump models).The authors of this paper compared Suter curves for Wh and Wm characteristics which were obtained by recalculation from model curves, with Suter curves for Wh and Wm characteristics which were obtained from the developed Universal equations for Wh and Wm characteristics, in order not to overload this paper with a large number of diagrams, diagrams for six Suter curves are presented, as shown in Figure 10, Figure 11 and Figure 12 (for Wh characteristic for six Suter curves - nq=24.34, nq=24.8, nq=25, nq=28.6, nq=41.6, nq=64.04) and in the Figures 19–21 (for Wm characteristic for six Suter curves - nq=24.34, nq=24.8, nq=25, nq=27, nq=28.6, nq=64.04). Figure 22 shows Suter curves for Wh characteristics obtained by recalculation model curves and Suter curves for Wh characteristics obtained from the Universal equation for Wh characteristics (11 pump turbine-models and 2 pump models) and Figure 23 shows the Suter curves for Wm characteristics obtained by recalculation model curves and the Suter curves for Wm characteristics obtained from the Universal equation for Wm characteristics (11 pump-turbine models and 2 pump models).
The Matlab program has been developed with the numerical model for calculating the transient processes in a pumping plant where two pumps are installed (the method of characteristics - MOC was used to develop this numerical model), and as input data in this numerical model, the authors of this paper used the Suter curve for Wh and Wm characteristics, which were obtained by recalculation the model curves Q11, n11, M11 for different values of specific speed, also as input data in this numerical model, the authors of this paper used Suter curves for Wh and Wm characteristics obtained from Universal equations for Wh and Wm characteristics for various values of specific speed, more about the previously mentioned will be mentioned in the next chapter of this paper.
Figure 4. In the developed numerical model in the Matlab program, the Fourier function of 2 orders was passed through the Suter curves (which were obtained by recalculation the model curves Q11, n11, M11) for nq=24.34 (R2=0.94807) and for nq=24.8 (R2=0.95569), for Wh characteristics.
Preprints 87942 g004
Figure 5. In the developed numerical model in the Matlab program, the Fourier function of 2 orders was passed through the Suter curves (which were obtained by recalculation the model curves Q11, n11, M11) for nq=25 (R2=0.98085) and for nq=28.6 (R2=0.94389), for Wh characteristics.
Preprints 87942 g005
Figure 6. In the developed numerical model in the Matlab program, the Fourier function of 2 orders was passed through the Suter curves (which were obtained by recalculation the model curves Q11, n11, M11) for nq=38 (R2=0.94304) and for nq=41.6 (R2=0.96315), for Wh characteristics.
Preprints 87942 g006
Figure 7. By polynomial regression (polynomial of the 9 order) in the developed numerical model in the Matlab program, the dependence between the values of the coefficients (ao, a1 - from the Fourier function of 2 order) and specific speed - nq (11 pump-turbine models and 2 pump models) was determined, for Wh characteristics.
Preprints 87942 g007
Figure 8. By polynomial regression (polynomial of the 9 order) in the developed numerical model in the Matlab program, the dependence between the values of the coefficients (b1, a2 - from the Fourier function of 2 order) and specific speed - nq (11 pump-turbine models and 2 pump models) was determined, for Wh characteristics.
Preprints 87942 g008
Figure 9. By polynomial regression (polynomial of the 9 order) in the developed numerical model in the Matlab program, the dependence between the values of the coefficients (b2, w - from the Fourier function of 2 order) and specific speed - nq (11 pump-turbine models and 2 pump models) was determined, for Wh characteristics.
Preprints 87942 g009
Figure 10. Comparison of Suter curves for Wh characteristics which were obtained by recalculation the model curves Q11, n11, M11 with Suter curves for Wh characteristics which were obtained from the Universal equation for Wh characteristics, for nq=24.34 and for nq=24.8.
Preprints 87942 g010
Figure 11. Comparison of Suter curves for Wh characteristics which were obtained by recalculation the model curves Q11, n11, M11 with Suter curves for Wh characteristics which were obtained from the Universal equation for Wh characteristics, for nq=25 and for nq=28.6.
Preprints 87942 g011
Figure 12. Comparison of Suter curves for Wh characteristics which were obtained by recalculation the model curves Q11, n11, M11 with Suter curves for Wh characteristics which were obtained from the Universal equation for Wh characteristics, for nq=41.6 and for nq=64.04.
Preprints 87942 g012
Figure 13. In the developed numerical model in the Matlab program, the Fourier function of 2 orders was passed through the Suter curves (which were obtained by recalculation the model curves Q11, n11, M11) for nq=24.34 (R2=0.98579) and for nq=24.8 (R2=0.96313), for Wm characteristics.
Preprints 87942 g013
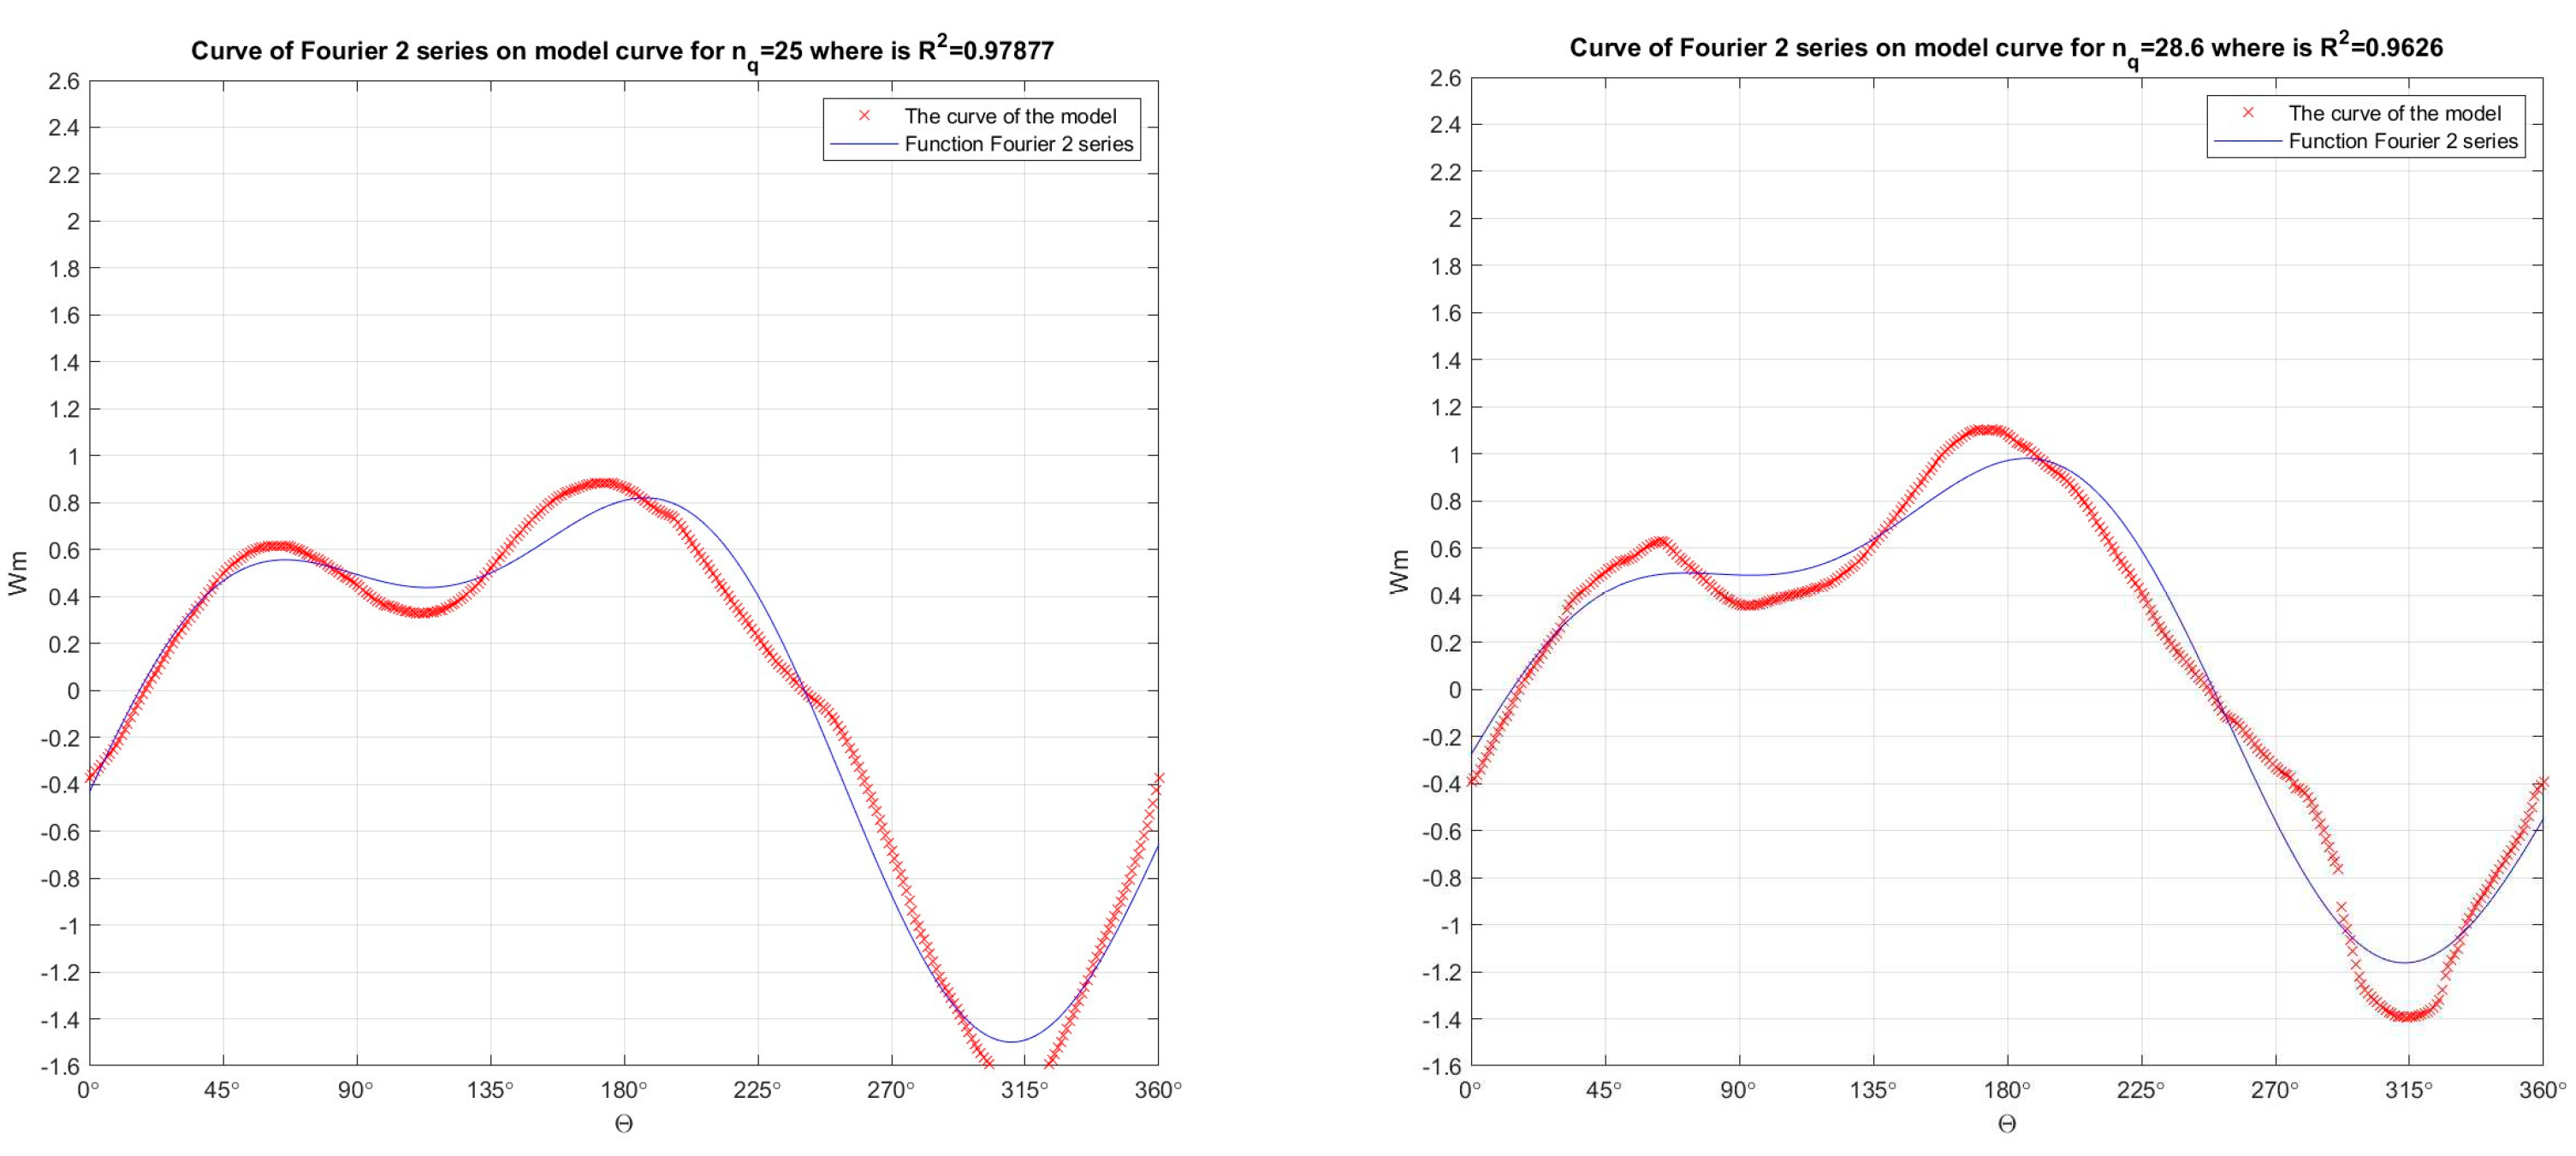
Figure 14. In the developed numerical model in the Matlab program, the Fourier function of 2 orders was passed through the Suter curves (which were obtained by recalculation the model curves Q11, n11, M11) for nq=25 (R2=0.97877) and for nq=28.6 (R2=0.9626), for Wm characteristics.
Preprints 87942 g014
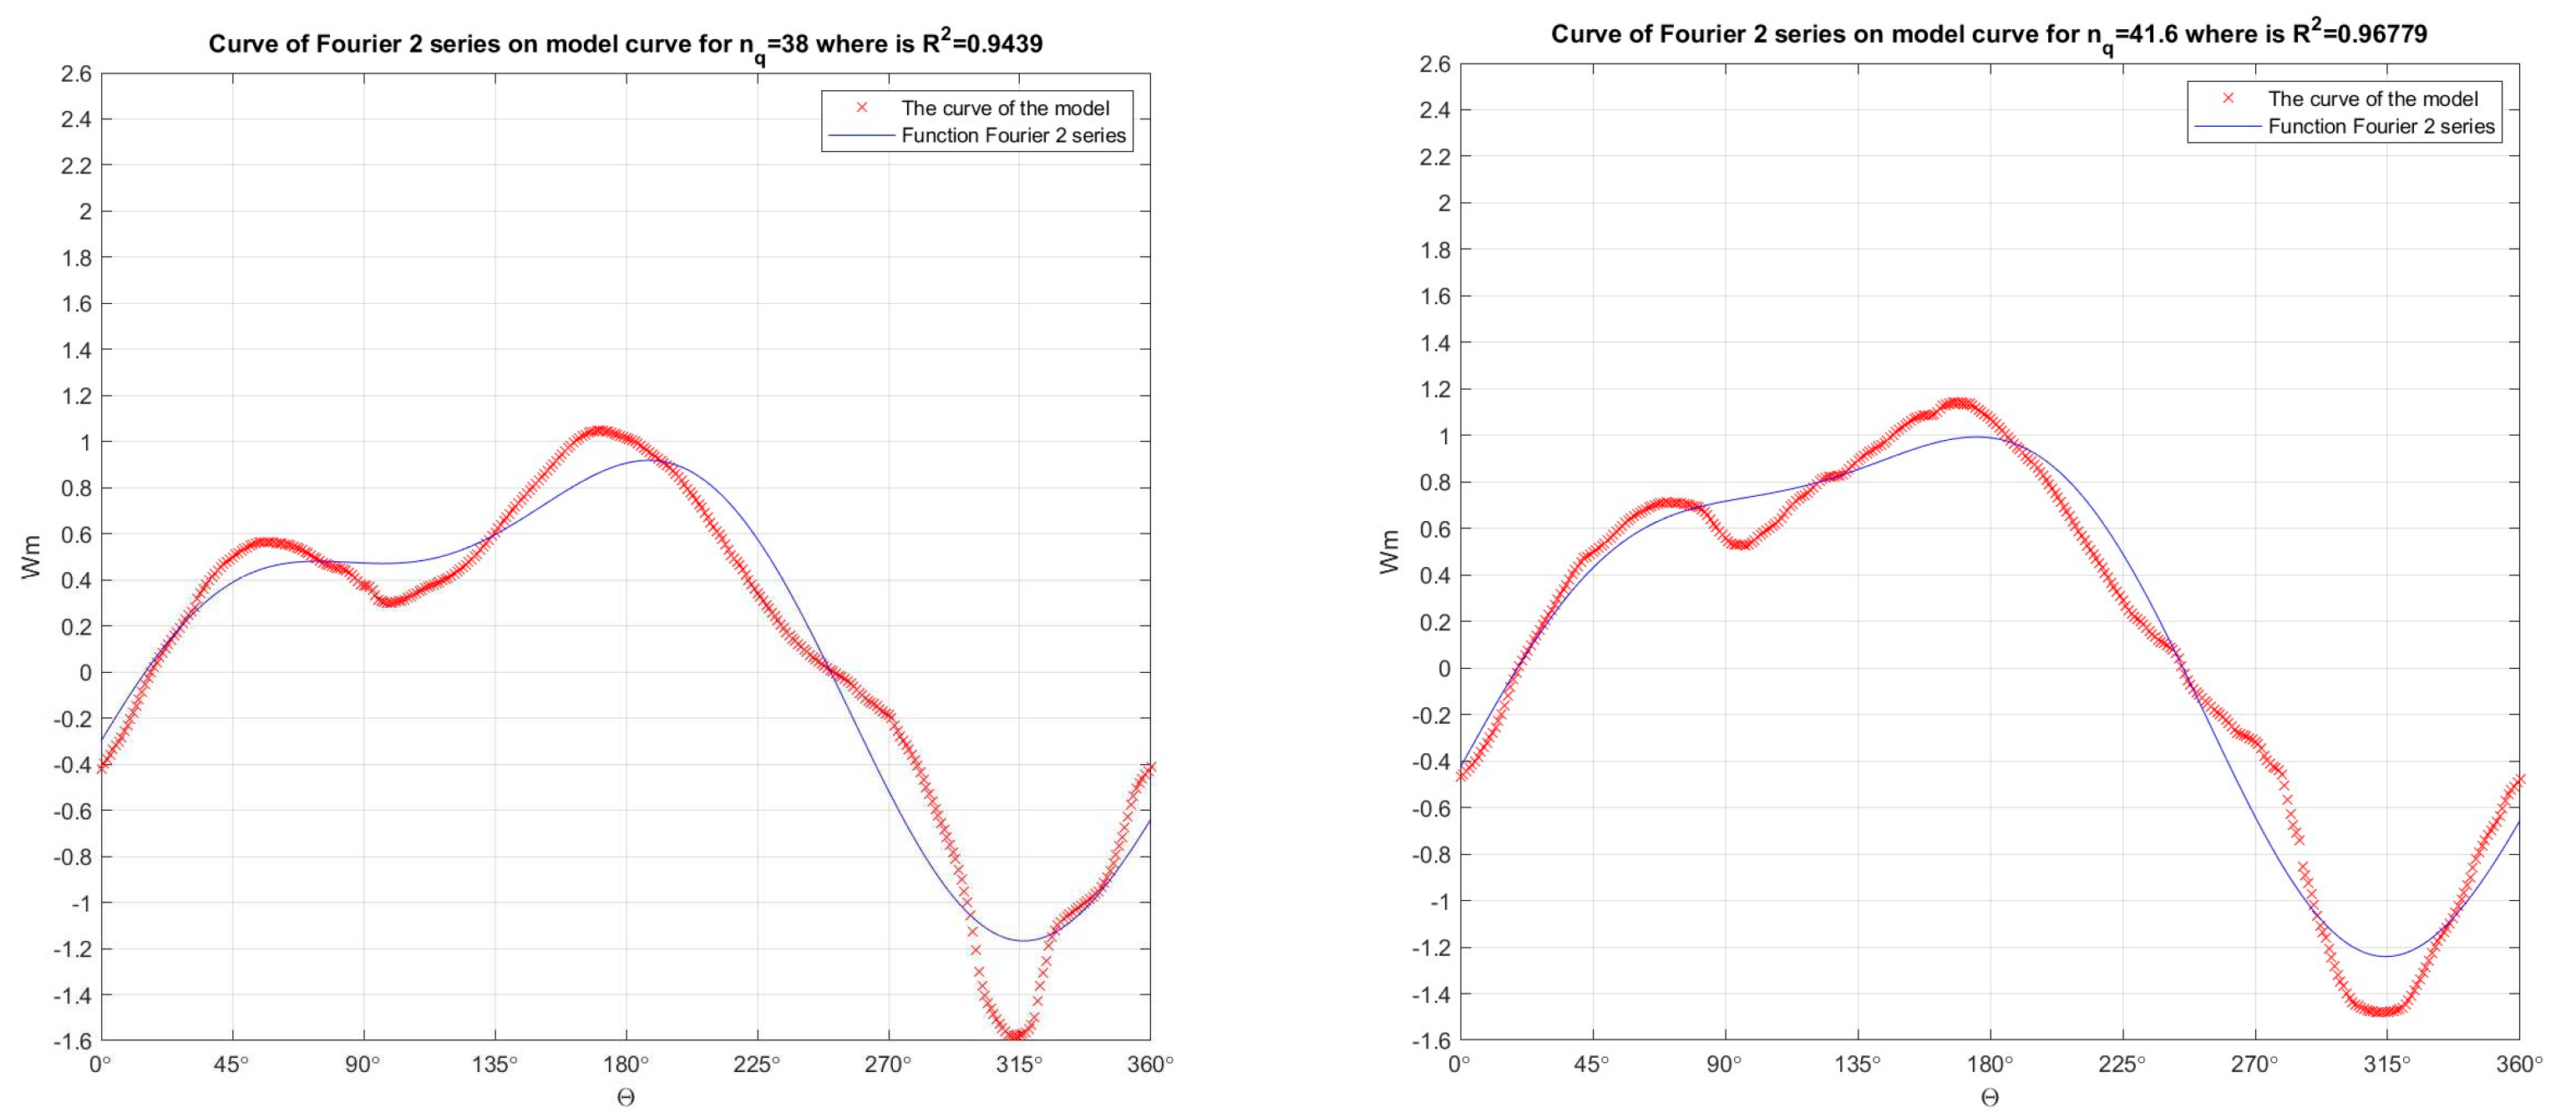
Figure 15. In the developed numerical model in the Matlab program, the Fourier function of 2 orders was passed through the Suter curves (which were obtained by recalculation the model curves Q11, n11, M11) for nq=38 (R2=0.9439) and for nq=41.6 (R2=0.96779), for Wm characteristics.
Preprints 87942 g015
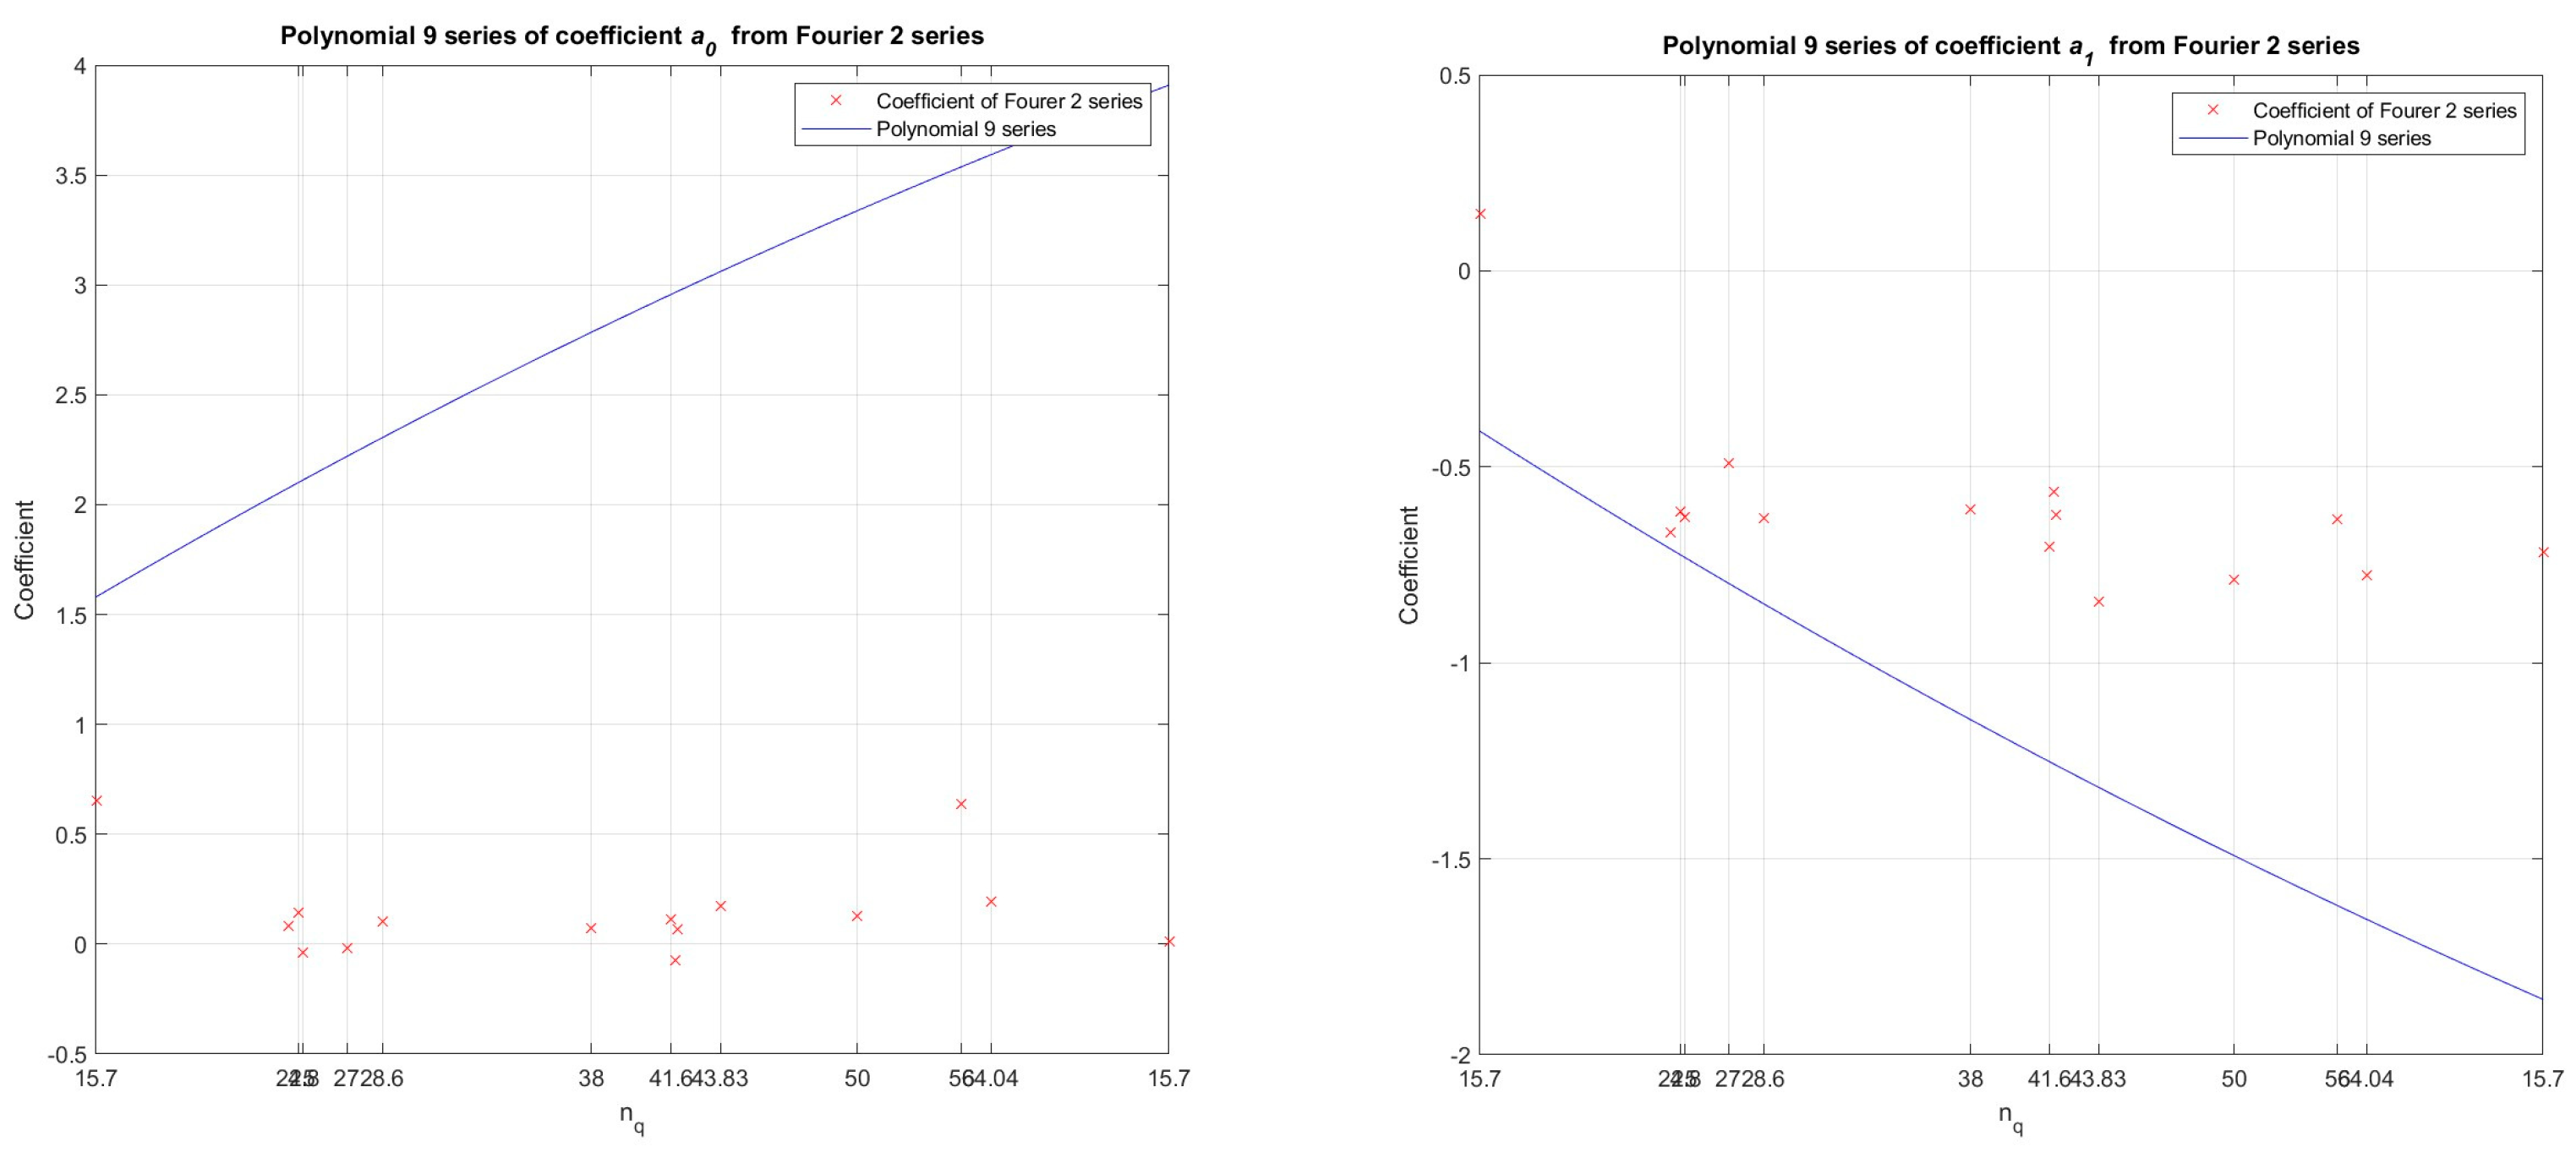
Figure 16. By polynomial regression (polynomial of the 9 order) in the developed numerical model in the Matlab program, the dependence between the values of the coefficients (ao, a1 - from the Fourier function of 2 order) and specific speed - nq (11 pump-turbine models and 2 pump models) was determined, for Wm characteristics.
Preprints 87942 g016
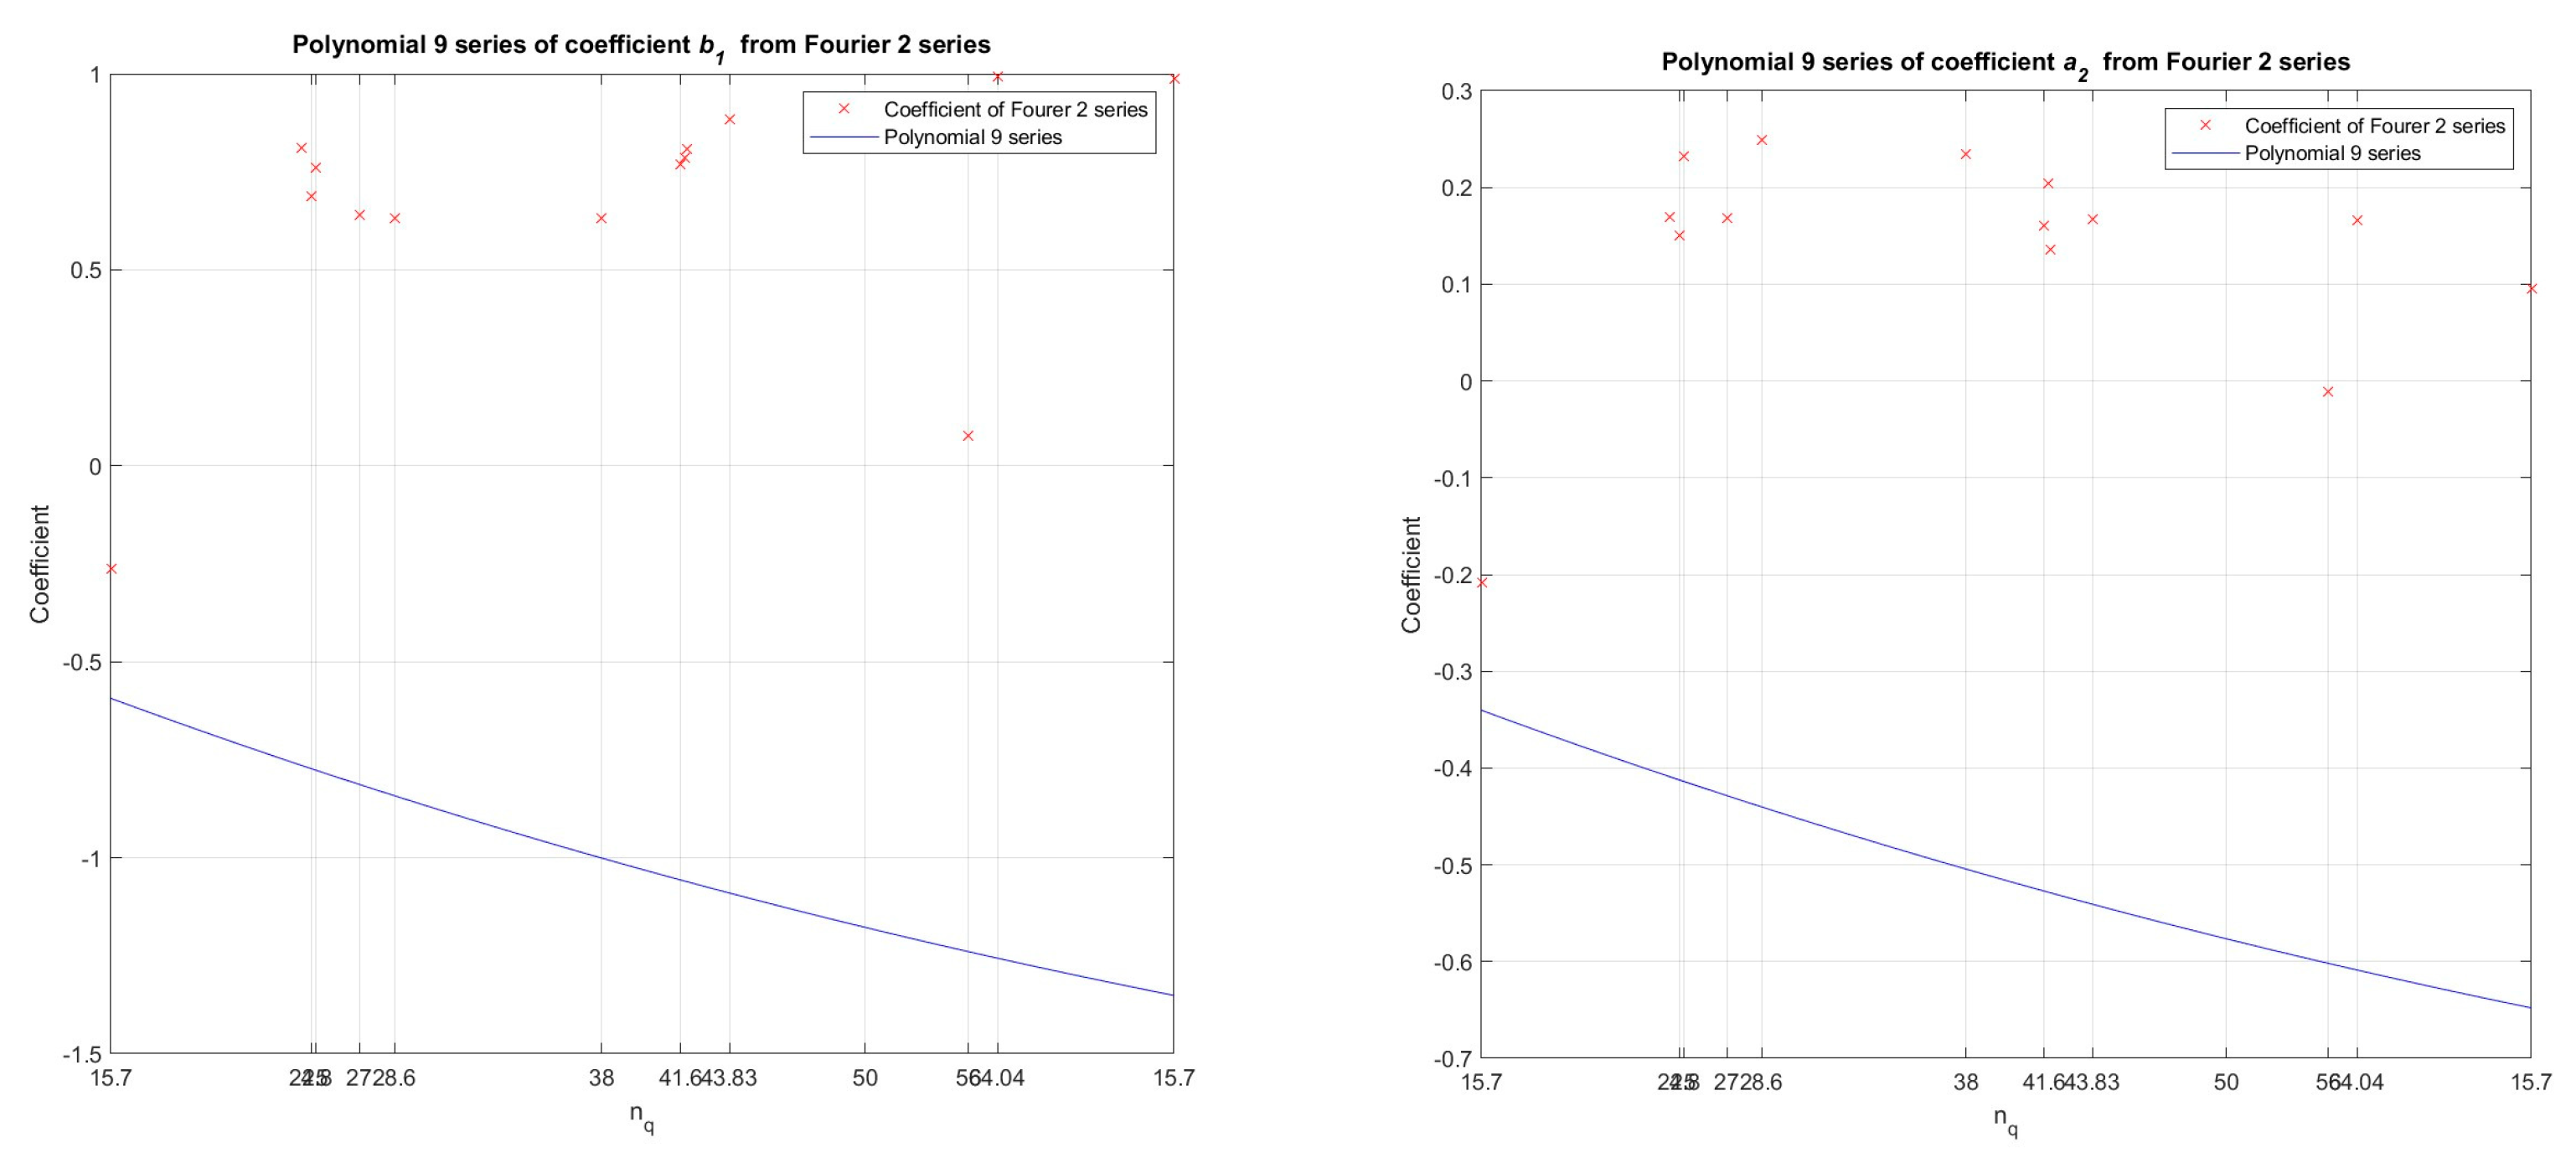
Figure 17. By polynomial regression (polynomial of the 9 order) in the developed numerical model in the Matlab program, the dependence between the values of the coefficients (b1, a2 - from the Fourier function of 2 order) and specific speed - nq (11 pump-turbine models and 2 pump models) was determined, for Wm characteristics.
Preprints 87942 g017
Figure 18. By polynomial regression (polynomial of the 9 order) in the developed numerical model in the Matlab program, the dependence between the values of the coefficients (b2, w- from the Fourier function of 2 order) and specific speed - nq (11 pump-turbine models and 2 pump models) was determined, for Wm characteristics.
Preprints 87942 g018
Figure 19. Comparison of Suter curves for Wm characteristics which were obtained by recalculation the model curves Q11, n11, M11 with Suter curves for Wm characteristics which were obtained from the Universal equation for Wm characteristics, for nq=24.34 and for nq=24.8.
Preprints 87942 g019
Figure 20. Comparison of Suter curves for Wm characteristics which were obtained by recalculation the model curves Q11, n11, M11 with Suter curves for Wm characteristics which were obtained from the Universal equation for Wm characteristics, for nq=25 and for nq=27.
Preprints 87942 g020
Figure 21. Comparison of Suter curves for Wm characteristics which were obtained by recalculation the model curves Q11, n11, M11 with Suter curves for Wm characteristics which were obtained from the Universal equation for Wm characteristics, for nq=28.6 and for nq=64.04.
Preprints 87942 g021
Figure 22. Comparison of Suter curves for Wh characteristics which were obtained by recalculation the model curves Q11, n11, M11 with Suter curves for Wh characteristics which were obtained from the Universal equation for Wh characteristics (11 models of pump-turbine and 2 models of pump).
Preprints 87942 g022
Figure 23. Comparison of Suter curves for Wm characteristics which were obtained by recalculation the model curves Q11, n11, M11 with Suter curves for Wm characteristics which were obtained from the Universal equation for Wm characteristics (11 models of pump-turbine and 2 models of pump).
Preprints 87942 g023

4.2. Universal Equation for Wh characteristic in dependence on nq obtained from the developed numerical model in the Matlab program with the Fourier function of 2 order

In the following part of the text, the obtained Universal Equation for the Wh characteristic from the numerical model developed in the Matlab program is shown:
The Universal Equation for Wh characteristic is presented in this form, and this is the main idea:
Wh, = f(nq,θ)
The Universal Equation for Wh characteristic has the appearance (Fourier function of 2 order):
W h = a 0 + a 1 · c o s θ · w + b 1 · s i n θ · w + a 2 · c o s 2 · θ · w + b 2 · s i n 2 · θ · w
The coefficients in the Universal Equation for Wh characteristic are expressed using a polynomial of 9 order:
a 0 = c 1 · n q 9 + c 2 · n q 8 + c 3 · n q 7 + c 4 · n q 6 + c 5 · n q 5 + c 6 · n q 4 + c 7 · n q 3 + c 8 · n q 2 + c 9 · n q + c 10 a 1 = c 1 · n q 9 + c 2 · n q 8 + c 3 · n q 7 + c 4 · n q 6 + c 5 · n q 5 + c 6 · n q 4 + c 7 · n q 3 + c 8 · n q 2 + c 9 · n q + c 10 b 1 = c 1 · n q 9 + c 2 · n q 8 + c 3 · n q 7 + c 4 · n q 6 + c 5 · n q 5 + c 6 · n q 4 + c 7 · n q 3 + c 8 · n q 2 + c 9 · n q + c 10 a 2 = c 1 · n q 9 + c 2 · n q 8 + c 3 · n q 7 + c 4 · n q 6 + c 5 · n q 5 + c 6 · n q 4 + c 7 · n q 3 + c 8 · n q 2 + c 9 · n q + c 10 b 2 = c 1 · n q 9 + c 2 · n q 8 + c 3 · n q 7 + c 4 · n q 6 + c 5 · n q 5 + c 6 · n q 4 + c 7 · n q 3 + c 8 · n q 2 + c 9 · n q + c 10 w = c 1 · n q 9 + c 2 · n q 8 + c 3 · n q 7 + c 4 · n q 6 + c 5 · n q 5 + c 6 · n q 4 + c 7 · n q 3 + c 8 · n q 2 + c 9 · n q + c 10
The coefficients listed in the Universal Equation for Wh characteristic have the following values listed in Table 1, these values were obtained from the numerical model developed in the Matlab program, based on the entire procedure specified in the previous part of the text.

4.3. Universal Equation for Wm characteristic in dependence on nq obtained from the developed numerical model in the Matlab program with the Fourier function of 2 order

In the following part of the text, the obtained Universal Equation for the Wm characteristic from the numerical model developed in the Matlab program is shown:
The Universal Equation for Wm characteristic is presented in this form, and this is the main idea:
Wm = f(nq,θ)
The Universal Equation for Wm characteristic has the appearance (Fourier function of 2 order):
W m = a 0 + a 1 · c o s θ · w + b 1 · s i n θ · w + a 2 · c o s 2 · θ · w + b 2 · s i n 2 · θ · w
The coefficients in the Universal Equation for Wm characteristic are expressed using a polynomial of 9 order:
a 0 = c 1 · n q 9 + c 2 · n q 8 + c 3 · n q 7 + c 4 · n q 6 + c 5 · n q 5 + c 6 · n q 4 + c 7 · n q 3 + c 8 · n q 2 + c 9 · n q + c 10 a 1 = c 1 · n q 9 + c 2 · n q 8 + c 3 · n q 7 + c 4 · n q 6 + c 5 · n q 5 + c 6 · n q 4 + c 7 · n q 3 + c 8 · n q 2 + c 9 · n q + c 10 b 1 = c 1 · n q 9 + c 2 · n q 8 + c 3 · n q 7 + c 4 · n q 6 + c 5 · n q 5 + c 6 · n q 4 + c 7 · n q 3 + c 8 · n q 2 + c 9 · n q + c 10 a 2 = c 1 · n q 9 + c 2 · n q 8 + c 3 · n q 7 + c 4 · n q 6 + c 5 · n q 5 + c 6 · n q 4 + c 7 · n q 3 + c 8 · n q 2 + c 9 · n q + c 10 b 2 = c 1 · n q 9 + c 2 · n q 8 + c 3 · n q 7 + c 4 · n q 6 + c 5 · n q 5 + c 6 · n q 4 + c 7 · n q 3 + c 8 · n q 2 + c 9 · n q + c 10 w = c 1 · n q 9 + c 2 · n q 8 + c 3 · n q 7 + c 4 · n q 6 + c 5 · n q 5 + c 6 · n q 4 + c 7 · n q 3 + c 8 · n q 2 + c 9 · n q + c 10
The coefficients listed in the Universal Equation for Wm characteristic have the following values listed in Table 2, these values were obtained from the numerical model developed in the Matlab program, based on the entire procedure specified in the previous part of the text.

5. Application of Universal Equations for Wh and Wm Characteristics in Calculations of Transient Processes on Radial Hydraulic Machinery and Analyses of Results

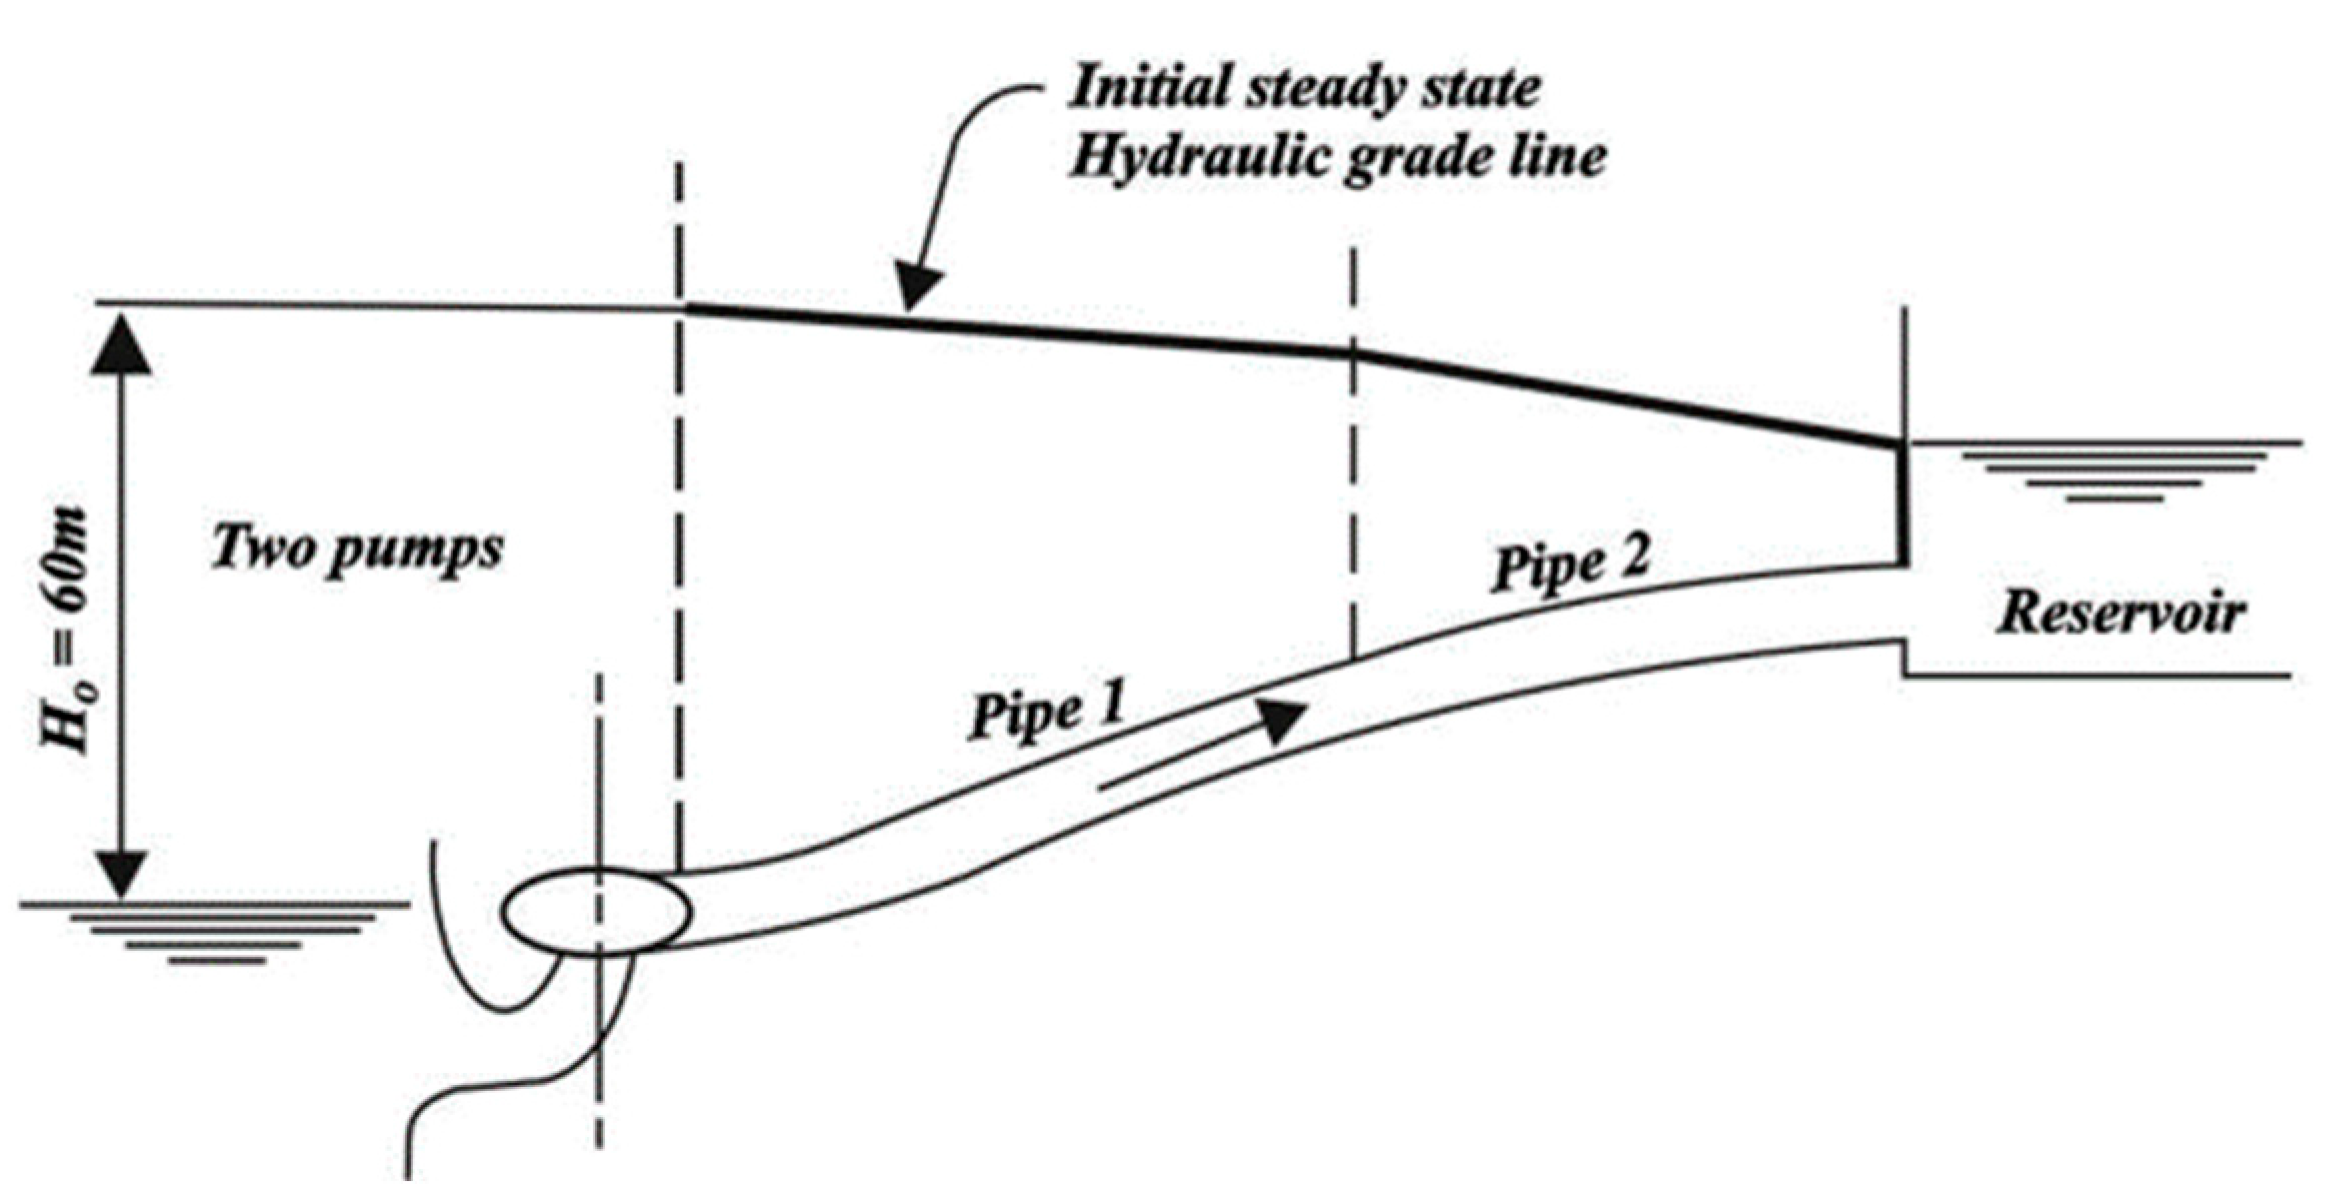
This paper presents a pumping plant in which two pumps are installed, the complete technical data of this plant are listed in Table 3, and a schematic representation of this pumping plant is shown in Figure 24. The data for this pumping station were taken from book – Chaudhry M.H. Applied hydraulic transients [3]. Calculation of transient processes that take place in this pumping plant during load rejection of pumps was performed in the numerical model which is developed by the authors of this paper in the program Matlab.
Figure 24. Schematic representation of the components of the pumping station.
Preprints 87942 g024
The authors of this paper developed a numerical model in the Matlab program for calculating the transient processes in a pumping plant where two pumps are installed (the method of characteristics - MOC was used to develop this numerical model),and as input data in this numerical model, the authors of this paper used Suter curves for Wh and Wm characteristics, which were obtained by recalculation the model curves Q11, n11, M11 for different values of specific speed - nq (11 models of radial pump -turbines with the following nq - nq=24.34, nq=24.8, nq=27, nq=28.6, nq=38, nq=41.6, nq=41.9, nq=43.83, nq=50, nq=56, nq=64.04; and two models of radial pumps – nq=25, nq=41.8), also as input data in this numerical model the authors of this paper used Suter curves for Wh and Wm characteristics obtained from Universal equations for Wh and Wm characteristics for various values of specific speed – nq (11 models of radial pump -turbines with the following nq - nq=24.34, nq=24.8, nq=27, nq=28.6, nq=38, nq=41.6, nq=41.9, nq=43.83, nq=50, nq=56, nq=64.04; and two models of radial pumps – nq=25, nq=41.8).
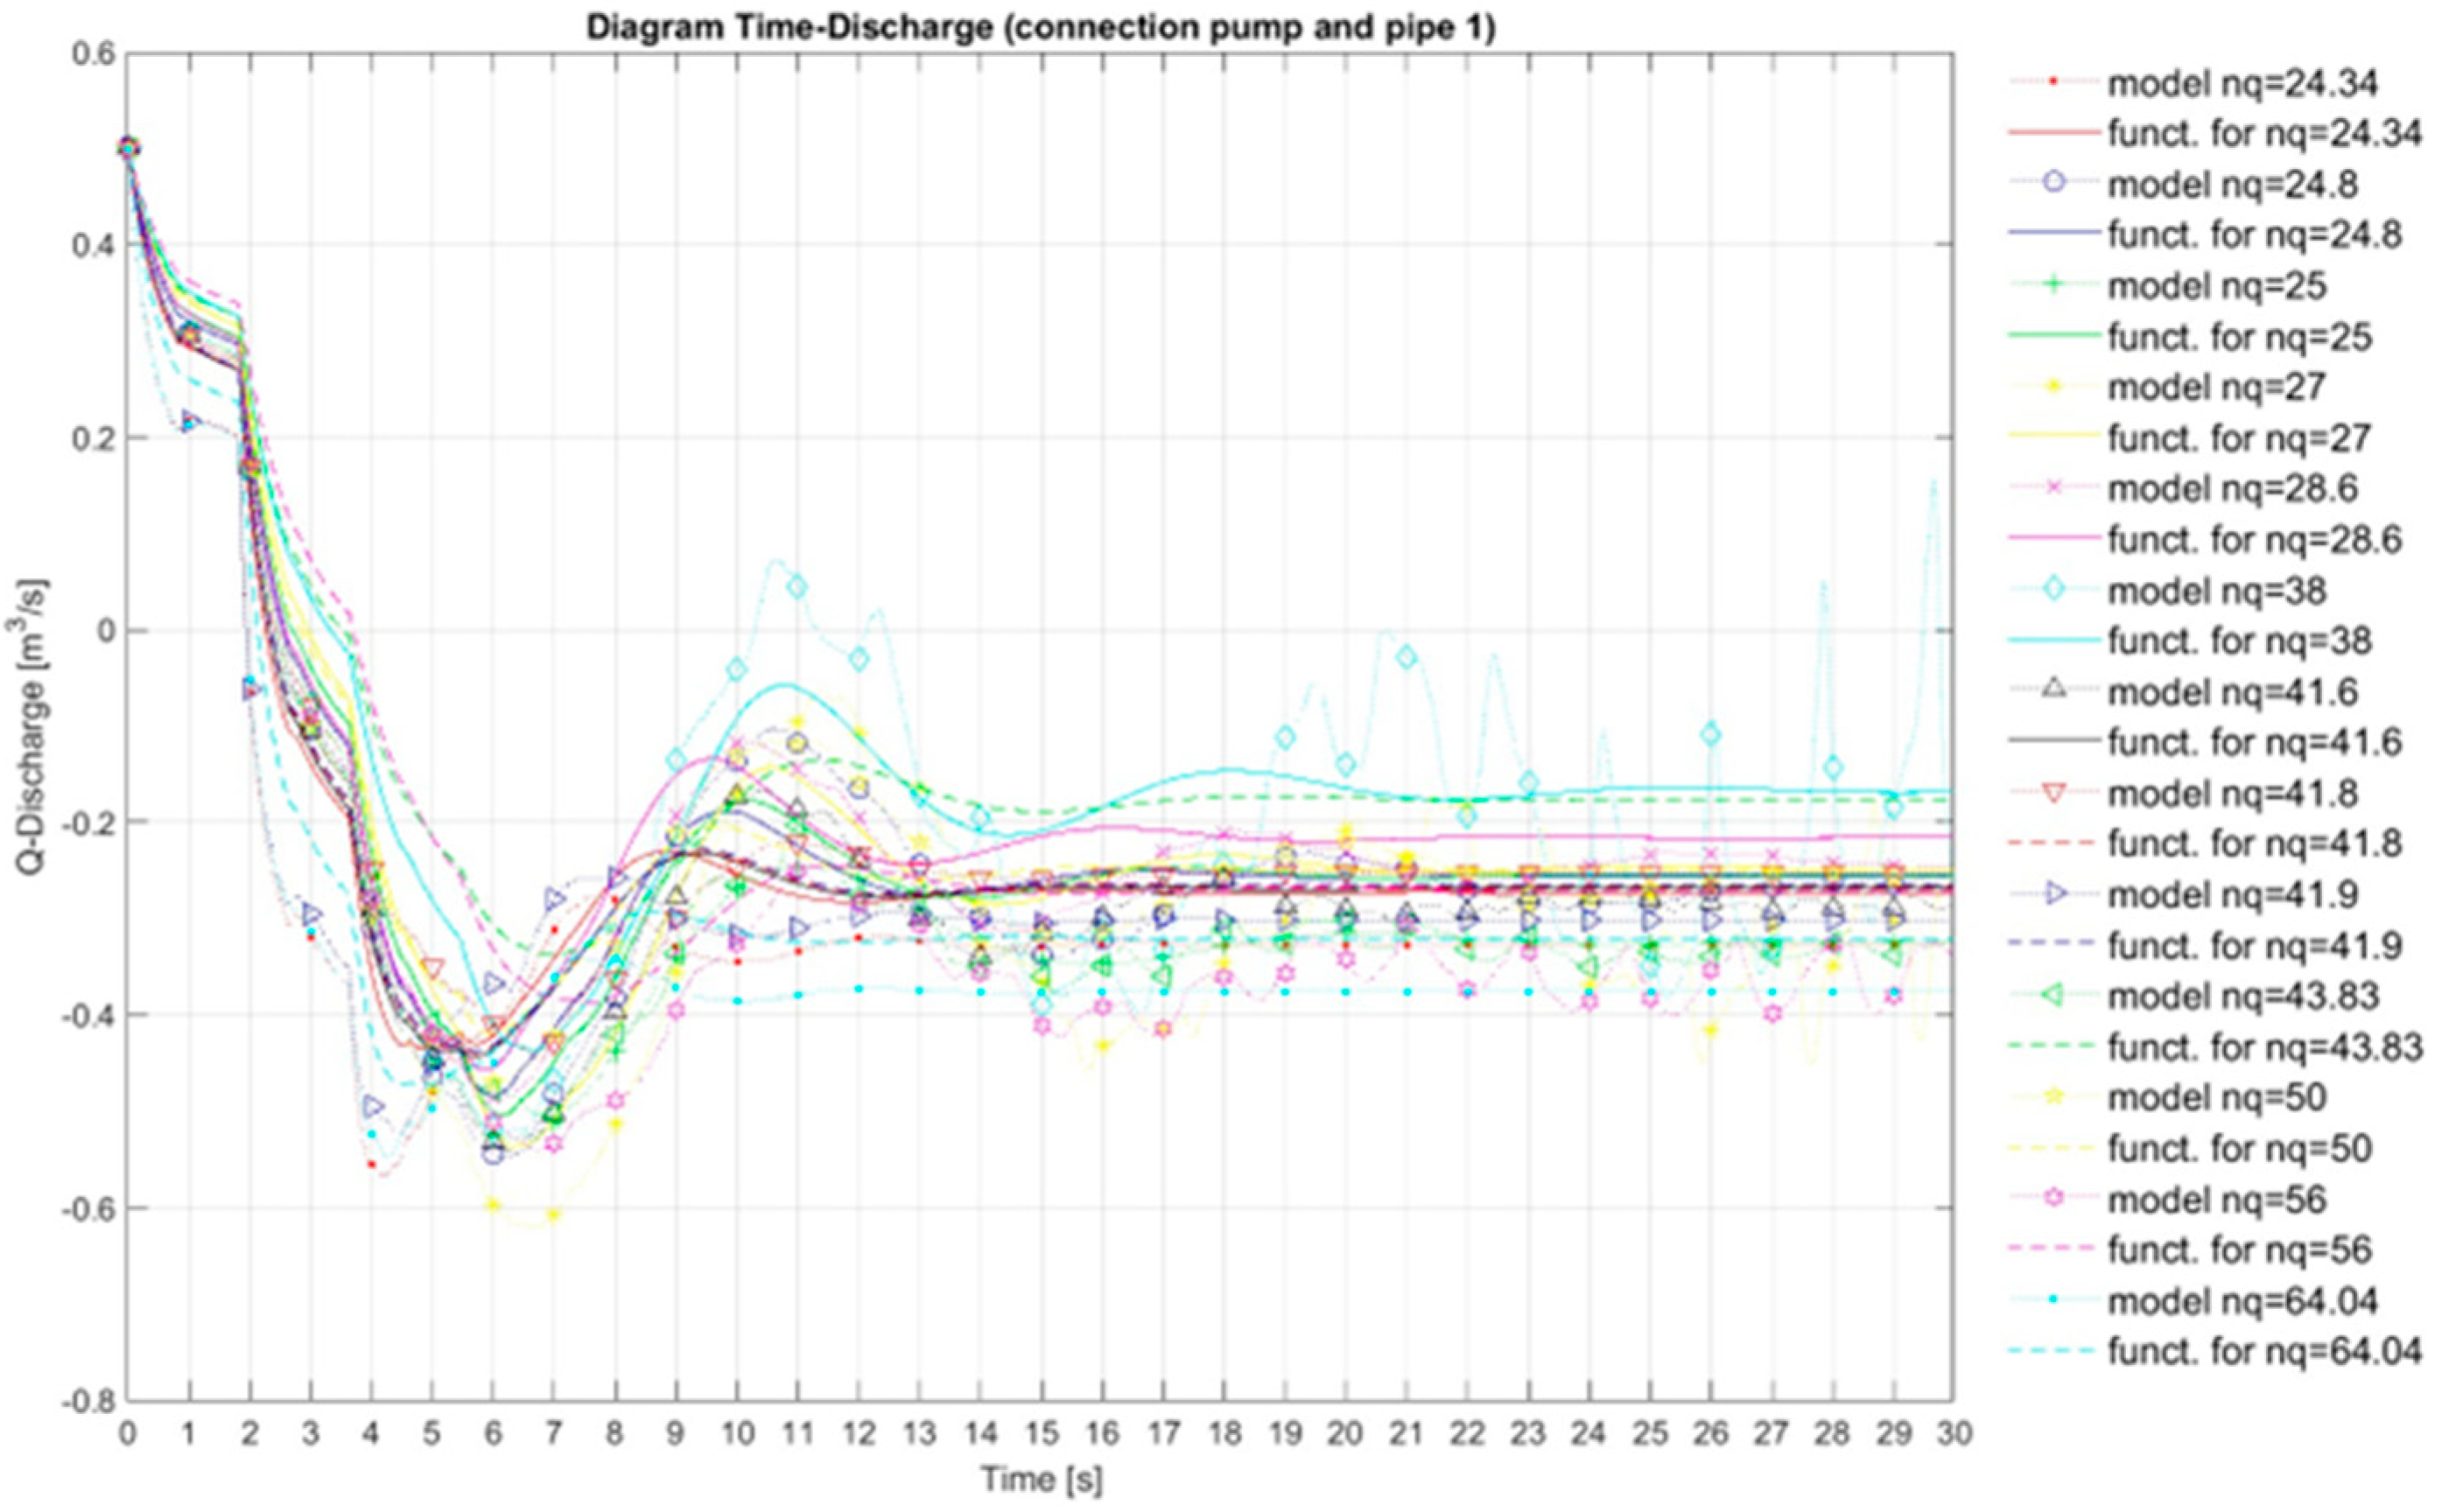
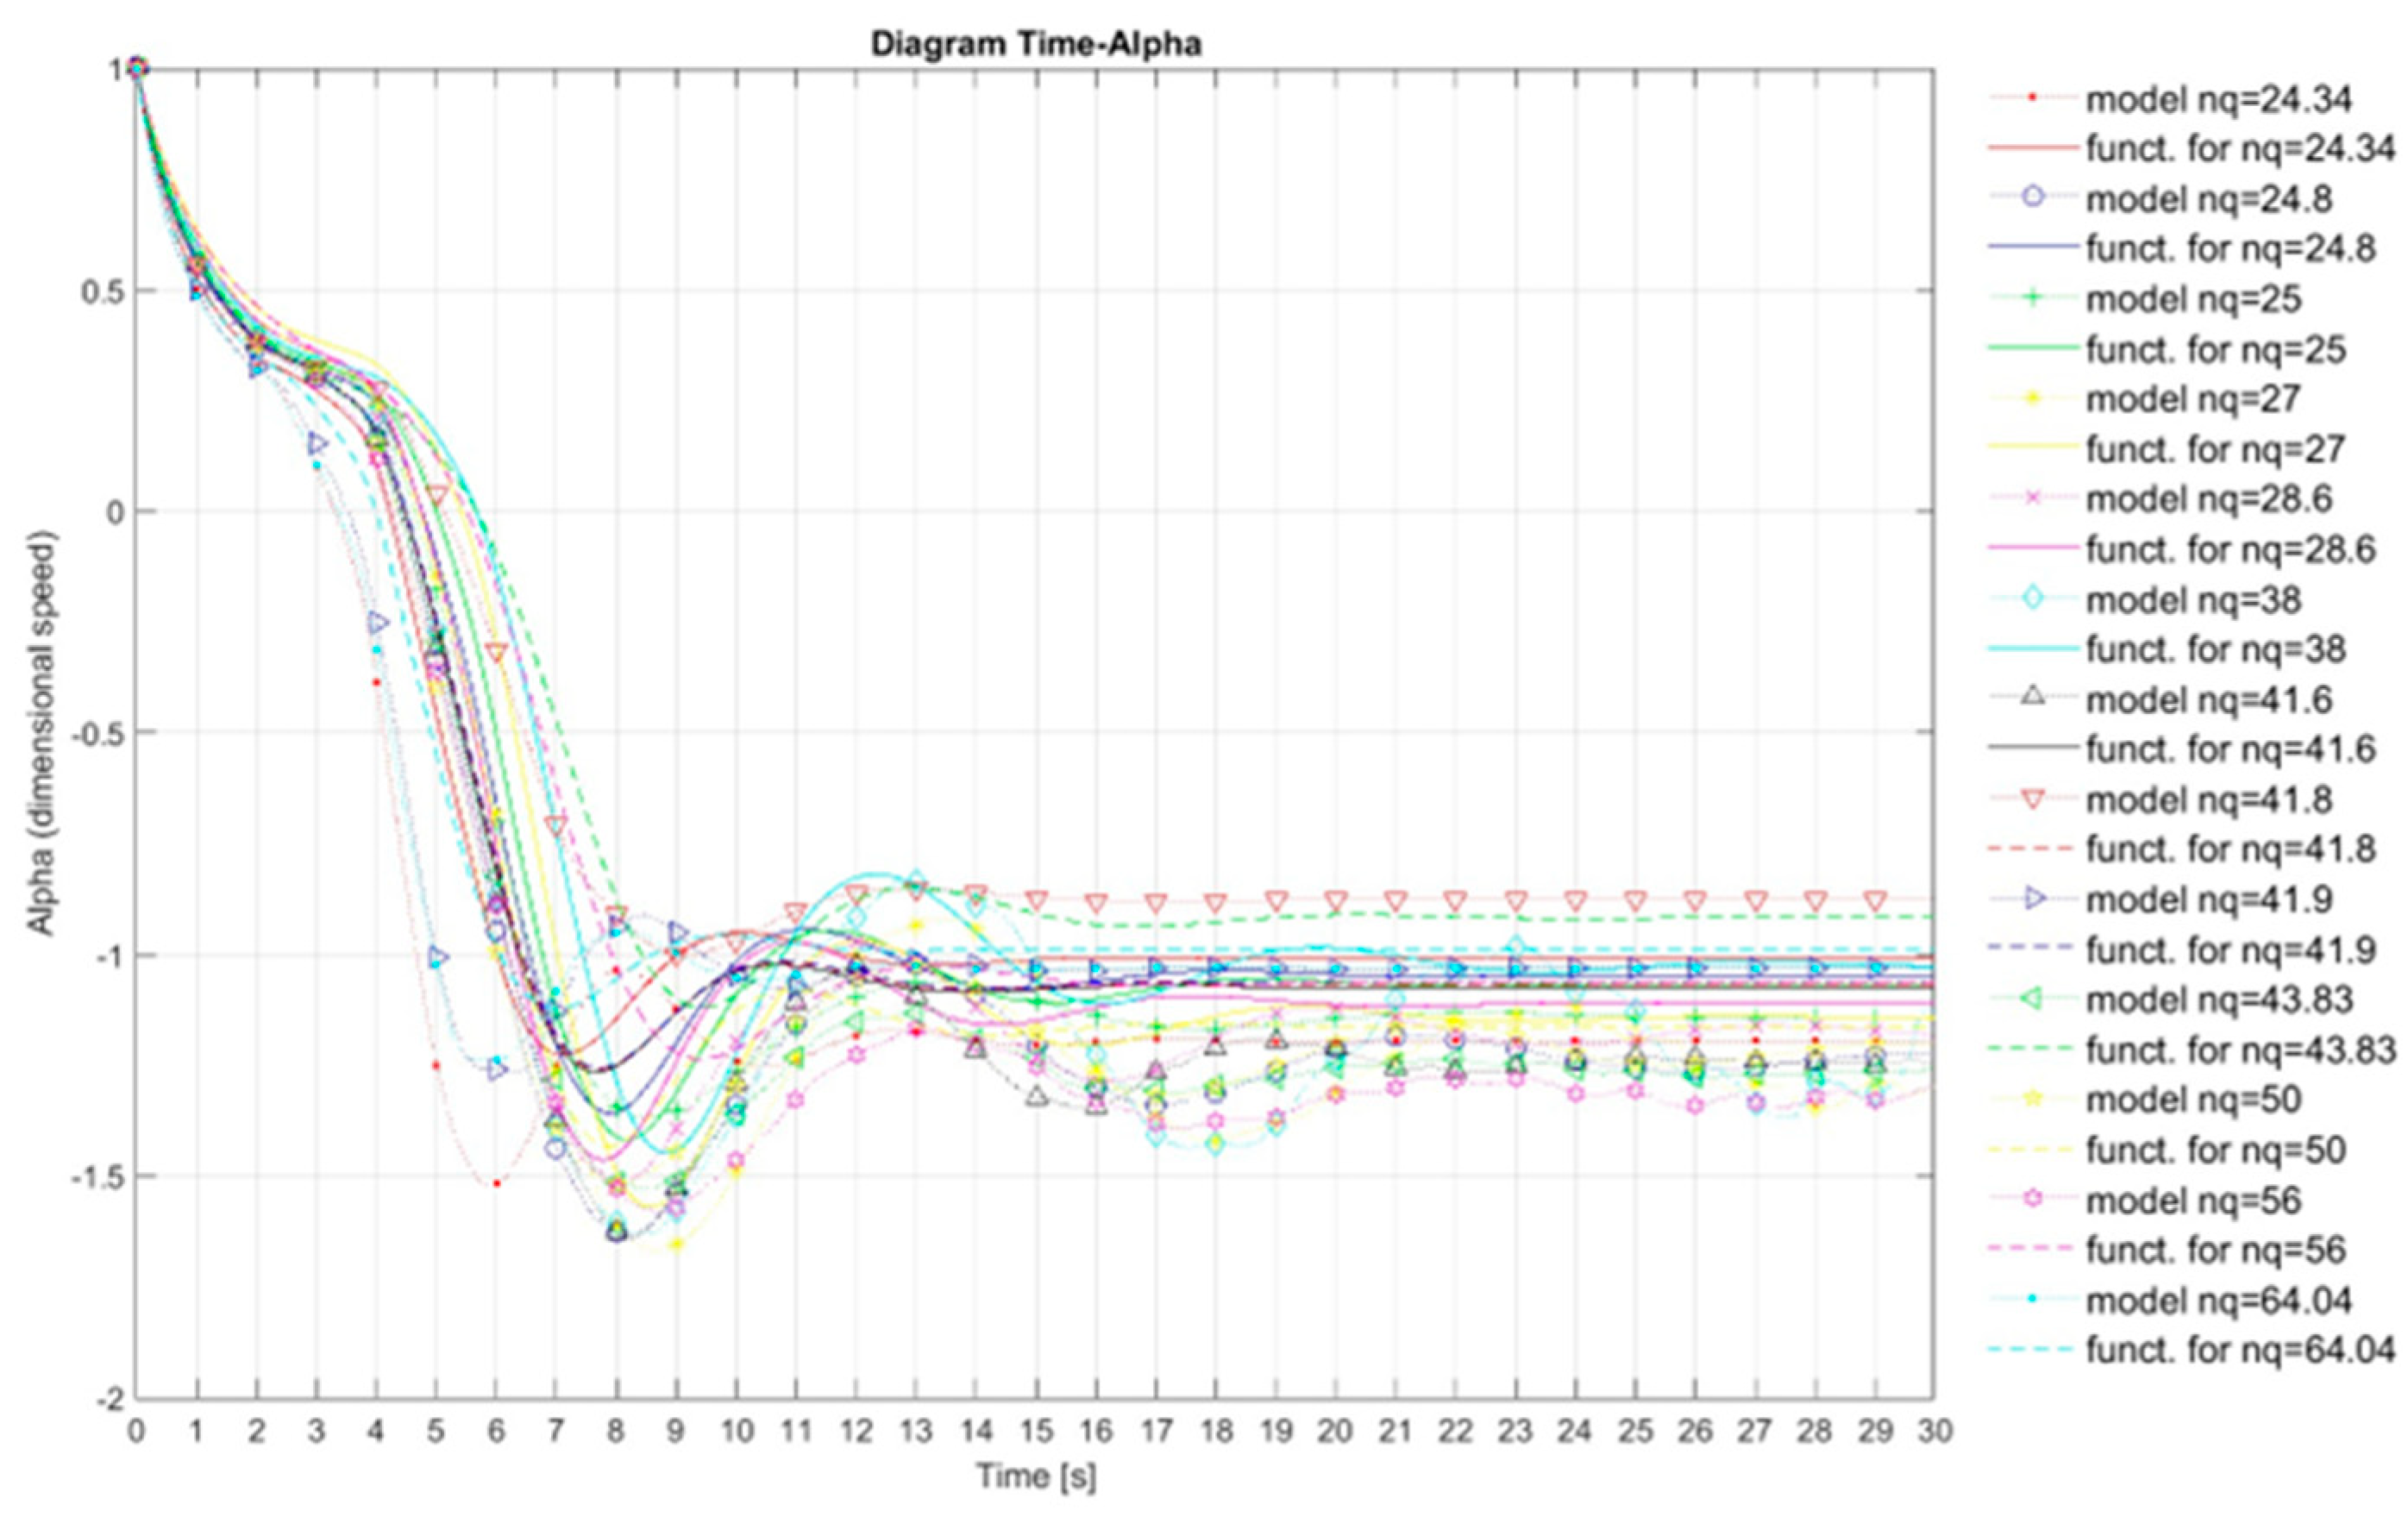
The results of the calculation of transient processes were presented in diagrams in Figure 25, Figure 26 and Figure 27. These diagrams show the changes in head, discharge, and speed of rotation during transient processes on the pump station (connection pump and pipe 1), and a comparison of the obtained results for 13 different specific speeds - nq was made.
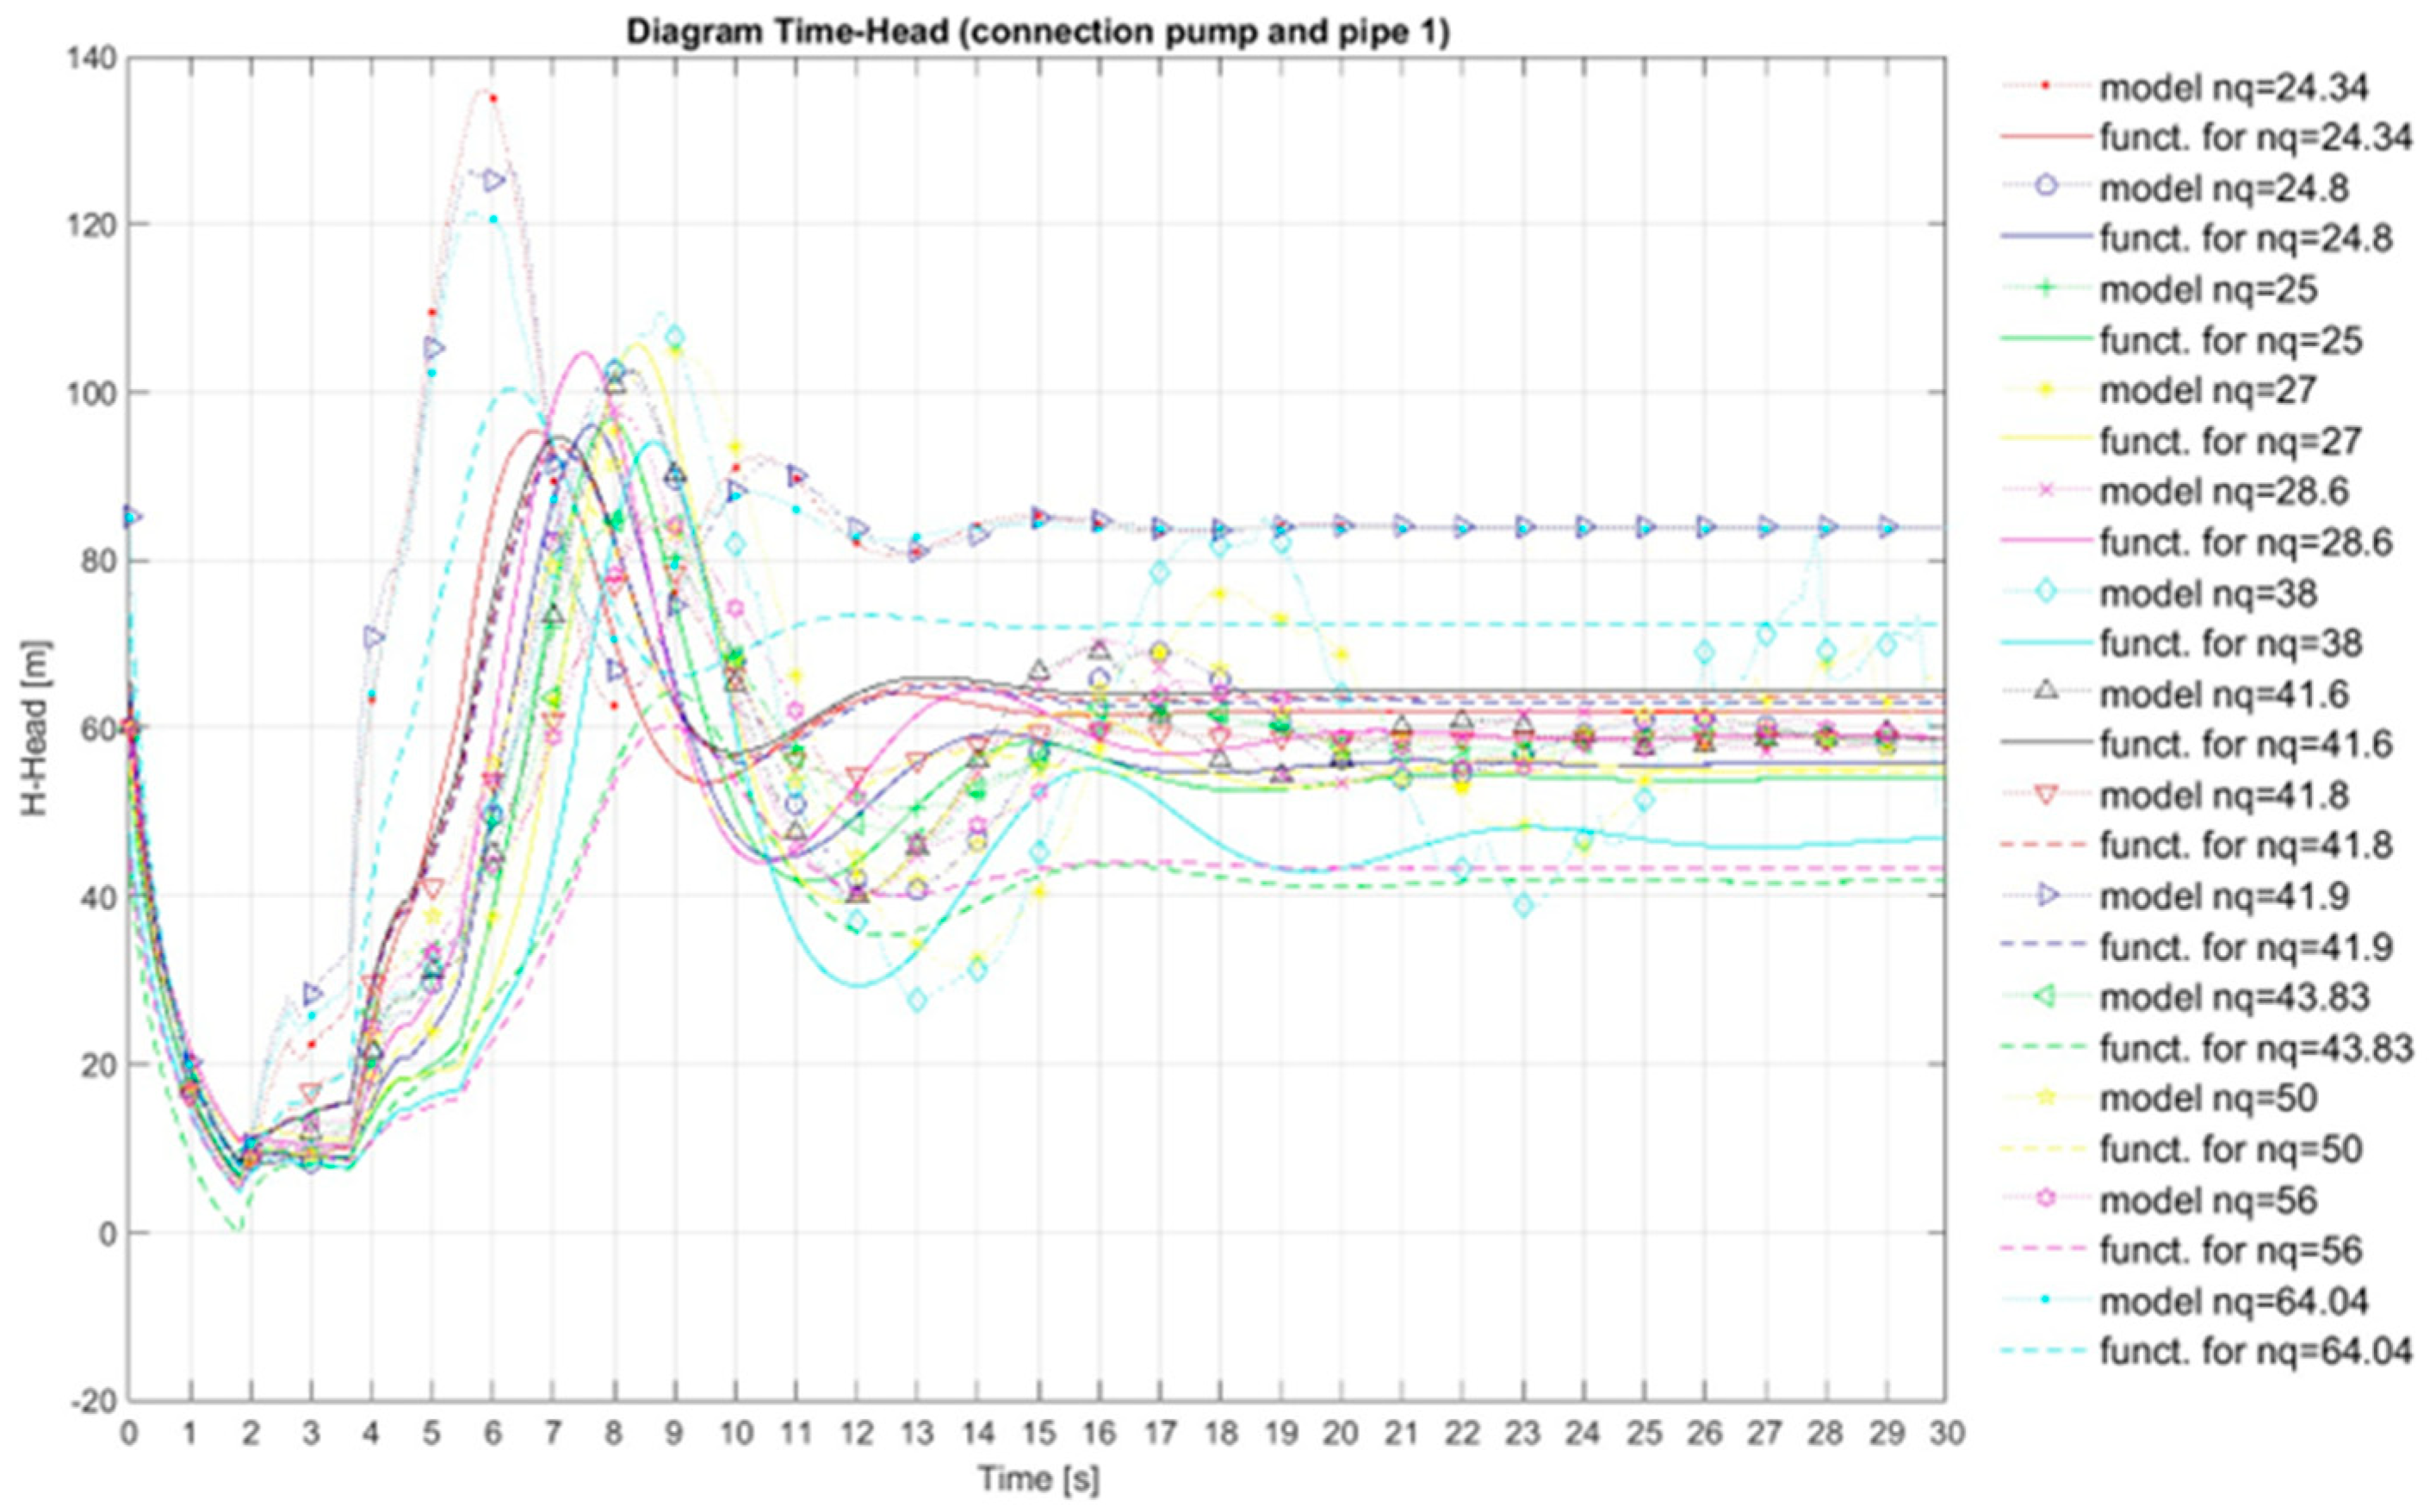
The diagram in Figure 25 presents the changes of the head during the transients process on the pump station (connection pump and pipe 1), and a comparison of the obtained results for 13 different specific speeds.
Figure 25. Display of the change of head during transients processes on the pump station (connection pump and pipe 1), and comparison of the obtained results for 13 different specific speeds - nq.
Preprints 87942 g025
In Figure 25, it can be seen that the pressure drop at the connection-section between the pump and pipeline 1 occurs after 2 seconds from the start of the transient process on the pump station, and that for all 13 specific speeds, this minimum pressure value at the connection-section between the pump and pipeline 1 has approximately the same value, around 6 m.w.c. While the maximum pressure value at the connection-section between the pump and pipeline 1 occurs in the interval between 5 seconds and 11 seconds from the beginning of the transient processes on the pump station,and this maximum pressure value at the connection-section between the pump and pipeline 1 has different values for each of the 13 specific speed – nq (for each of the 13 specific speed - nq, the values for Wh and Wm characteristics were obtained by recalculating the model characteristics Q11, n11, M11, and from the Universal equations for Wh and Wm characteristics, and then all these data for Wh and Wm characteristic were used as input data in the numerical model for the calculation of transitional processes), and varies in the range from 80 m.w.c to 138 m.w.c, and in this part, the influence of specific speed - nq on the change in pressure at the connection-section between the pump and pipeline 1 is clearly expressed, during the transient process on the pump station, and one of the main targets of this work is to show how much influence specific speed has on the transient processes on the pump station.
The diagram which presented in Figure 26 presented the changes of the discharge during the transients process on the pump station (connection pump and pipe 1), and a comparison of the obtained results for 13 different specific speeds was performed.
Figure 26. Display of the change of discharge during transient processes on the pump station (connection pump and pipe 1), and comparison of the obtained results for 13 different specific speeds – nq.
Preprints 87942 g026
In the diagram shown in Figure 26, it can be seen that the discharge drop at the connection-section between the pump and pipeline 1 occurs in the interval between 4 seconds and 8 seconds from the beginning of the transient processes on the pump station, and in this time interval, the discharge has the lowest value, and that for all 13 specific speed - nq this minimum value of the flow at the connection-section between the pump and pipeline 1 has approximately the same value around -0.55 m3/s. While the maximum discharge values at the connection-section between the pump and pipeline 1 occur in the interval between 9 seconds and 13 seconds from the beginning of the transient processes on the pump station, and this maximum discharge values at the connection-section between the pump and pipeline 1 has different values for each of the 13 specific speed – nq, and varies in the range from -0.38 m3/s to 0.11 m3/s, and in this part the influence of specific speed - nq on the change in discharge at the connection-section between the pump and pipeline 1 is clearly expressed, during the transient process on the pump station, and one of the main targets of this paper is to show how much influence specific speed - nq has on the transient processes on the pump station.
The diagram presented in Figure 27 shows the changes of the dimensional speed during the transient process of the pump, and a comparison of the obtained results for 13 different specific speeds.
In the diagram shown in Figure 27, it can be seen that the drop in the speed of rotation at the pump occurs in the interval between 5.5 seconds and 9.0 seconds from the beginning of the transient process on the pump station, and in this time interval the speed of rotation on the pump has the lowest value, and that for all 13 specific speed - nq this minimum values of the speed of rotation on the pump has different values and they vary in the range from -1.2 (dimensional speed) to –1.80 (dimensional speed). While the maximum value of the speed of rotation on the pump occurs in the interval between 9.5 seconds and 14 seconds from the beginning of the transient processes on the pump station, this maximum value of the speed of rotation on the pump has different values for each of the 13 specific speeds, and varies in the range from -1.1 (dimensional speed) to -0.8 (dimensional speed), and in this part, the influence of specific speed on the change in the speed of rotation at the pump, during the transient process on the pump station, is clearly expressed, and one of the main targets of this paper is to show how much influence specific speed has on the transient processes on the pump station.
Figure 27. The change of dimensional speed during transient processes on the pump, and comparison of the obtained results for 13 different specific speeds – nq.
Preprints 87942 g027
Also, the most important target of this paper is to show how well the results obtained by the calculation of transient processes on the pump station match (when all obtained results are shown together in the diagrams in Figure 25, Figure 26 and Figure 27), for all 13 specific speeds, (for each of the 13 specific speeds the values for the Suter curves for the Wh and Wm characteristics were obtained by recalculation of the model characteristics Q11, n11, M11, and from the Universal equations for the Wh and Wm characteristics, and then all these data for Suter curves for the Wh and Wm characteristics were used as input data in the numerical model for the calculation of transient processes on this pump station).

6. Conclusions

The Universal equations for the Wh and Wm characteristics in dependence on specific speed nq were for the first time obtained from the developed numerical model in the Matlab program. The final expressions of the equations, as well as the model used to obtain them, have been developed by the authors in the Matlab program, using the Fourier function of the 2nd order for fitting of the data.
Also, the results of the calculation of transient processes at the pumping plant were presented using comparison of all obtained results through the diagrams shown in Figure 25, Figure 26 and Figure 27 for 13 specific speeds. For each of the 13 specific speeds, the values for the Suter curves for the Wh and Wm characteristics were obtained by recalculation of model characteristics Q11, n11, M11, and from the Universal equations for the Wh and Wm characteristics. Then all these data for the Suter curves for the Wh and Wm characteristics were used as input data in the numerical model for the calculation of transient processes on this pump station. Entry into the program (developed numerical model in the Matlab program) in the first case is the set of points of the measured diagram is in a separate file – a file outside the program. And entry into the program (developed numerical model in the Matlab program) in the second case is the values obtained from Universal equations for the Wh and Wm characteristic, and this equation is in inside the program. Conclusion on the comparison of the calculated results, the Universal equations for the Wh and Wm characteristics in relation to the exact data gives almost the same results.

Author Contributions

Conceptualization, Z.G., M.N.; data curation, Z.G., M.N.; formal analysis, Z.G., M.N.; funding acquisition, Z.G., M.N.; investigation, Z.G., M.N.; methodology, Z.G., M.N.; project administration, Z.G., M.N.; resources, Z.G., M.N.; software, Z.G., M.N.; supervision, Z.G., M.N.; validation, Z.G., M.N.; visualization, Z.G., M.N.; writing—original draft, Z.G., M.N.; writing—review and editing, Z.G., M.N. All authors have read and agreed to the published version of the manuscript.

Funding

Not applicable.

Institutional Review Board Statement

Not applicable.

Informed Consent Statement

Not applicable.

Data Availability Statement

The data of this paper is available through e-mail via authors.

Acknowledgments

Special research was carried out on two pump-turbine models (nq=38 and nq=50) at the State Key Laboratory of Water Resources and Hydropower Engineering Science, Wuhan University, China, which provided the Q11, n11, and M11 4Q characteristic data. The help provided by the Director of the Research Section of the Safety of Hydropower Systems at the State Key Laboratory, Prof. Dr. Yongguang Cheng, is gratefully acknowledged. Also, special research was carried out on one pump-turbine model (nq=41.6) at the Laboratory of the Institute for Energy Systems and Thermodynamics - Vienna University of Technology, Austria, which provided the Q11, n11, and M11 4Q characteristic data. The help provided by Prof. Dr.- Ing. Christian Bauer, Head of Institute Vienna University of Technology, Institute for Energy Systems and Thermodynamics, Department of Fluid-Flow-Machinery i Institute Vienna University of Technology, is gratefully acknowledged.

Conflicts of Interest

The authors declare no conflicts of interest.

References

  1. Knapp, R.T. Complete Characteristics of Centrifugal Pumps and Their Use in the Prediction of Transient Behavior. Trans. ASME, 1937; 683–689. [Google Scholar] [CrossRef]
  2. Stepanoff, A.J. Radial–und Axialpumpen, Springer-Verlag Berlin Heidelberg (GmbH): Berlin, Germany, 1959.
  3. Chaudhry, M.H. Applied hydraulic transients, Van Nostrand Reinhold Company: New York, USA, 1979.
  4. Wylie, E.B.; Streeter, V.L. Fluid transients in systems, Prentice Hall: New York, Upper Saddle River, NJ07458, USA, 1993.
  5. Thorley, A.R.D.; Chaudry, A. Pump characteristics for transient flow analysis. In Proceedings of the BHR Group Conference Series, Publication No.19; 1996. [Google Scholar]
  6. Suter, P. Representation of pump characteristics for calculation of water hammer. Sulzer Technical Review, Research No. 66, pp.45-48, 1966.
  7. Donsky, B. Complete pump characteristics and the effects of specific speeds on hydraulic transients. Basic. Eng. Trans. ASME, 1961; 685–699. [Google Scholar] [CrossRef]
  8. Giljen, Z.; Nedeljkovic, M.; Cheng, Y.G. Analysis of four-quadrant performance curves for hydraulic machinery transient regimes. In Proceedings of the 17th International Conference on Fluid Flow Technologies, Budapest, Hungary. Paper No 98; 2018; pp. 1–8. [Google Scholar]
  9. Giljen, Z.; Nedeljkovic, M. Radial hydraulic machinery four-quadrant performance curves dependent on specific speed and applied in transient calculations. In Proceedings of the 29th IAHR Symposium on Hydraulic Machinery and Systems, Kyoto, Japan. Paper No 224, pp.1-10, 2018. https://iopscience.iop.org/article/10.1088/1755-1315/240/4/042002.
  10. Canale, R.P.; Chapra, S.C. Numerical Methods for Engineers, McGraw-Hill Education: New York, 2 Penn Plaza, NY 10121, USA, 2015.
  11. Huokun, L.; Hongkang, L.; Wei, H.; Jiazhen, L.; Min, Z.; Jiming, M.; Xin, H. A New Prediction Method for the Complete Characteristic Curves of Centrifugal Pumps. Energies 2021, 14, 8580. [Google Scholar] [CrossRef]
  12. Jiangping, Y.; Emmanuel, A.; Derek, K.D.; Liren, H. Predicting Centrifugal Pumps’ Complete Characteristics Using Machine Learning. Processes 2023, 11, 524. [Google Scholar] [CrossRef]
Figure 1. Laboratory Vienna - Prof. Dr. Ing. Christian Bauer (TU Vienna), Zdravko Giljen Ph.D. student, Dr. Bernhard List (VOITH) – (from right to left).
Preprints 87942 g001
Figure 2. State Key Laboratory Wuhan, China - Prof. dr. Yongguang Cheng, Zdravko Giljen Ph.D. student, Dr. Linsheng Xia - (from left to right).
Preprints 87942 g002
Figure 3. Suter curves Wh, 2 radial pumps (Stepanoff, A. J. (1959); Thorley, R. D. & Chaudry, A. (1996)), and 11 pump-turbines (the authors of the paper personally collected the original data and performed the process by recalculation).
Preprints 87942 g003
Table 1. Values of the coefficients specified in the Universal Equation for Wh characteristic.
a0 (c1) a0 (c2) a0 (c3) a0 (c4)
0.00000000008265728147910180 -0.000000029061457403003900 0.0000044563797292930600 -0.0003908511288069320000
a0 (c5) a0 (c6) a0 (c7) a0 (c8)
0.021587807156691600 -0.7779210582576410 18.268604739268900 -269.24654067798700
a0 (c9) a0 (c10) a1 (c1) a1 (c2)
2256.073852668840 -8170.186565443250 -0.00000000003574826987209740 0.000000013284959440729400
a1 (c3) a1 (c4) a1 (c5) a1 (c6)
-0.0000021539386394449600 0.0001997420301777020000 -0.011660699346564100 0.4438125887830780
a1 (c7) a1 (c8) a1 (c9) a1 (c10)
-10.995720789290900 170.69105909768900 -1503.076337278080 5703.007866291280
b1 (c1) b1 (c2) b1 (c3) b1 (c4)
-0.00000000007545693999908280 0.000000025845257002692800 -0.0000038551260024670600 0.0003284486762892260000
b1 (c5) b1 (c6) b1 (c7) b1 (c8)
-0.017601498848716700 0.6148165821380630 -13.985903630865500 199.60428369467500
b1 (c9) b1 (c10) a2 (c1) a2 (c2)
-1619.808788457710 5686.005279970290 0.00000000004853501014984870 -0.000000017313106387755800
a2 (c3) a2 (c4) a2 (c5) a2 (c6)
0.0000026990431414927000 -0.0002411556773051530000 0.013595507151620100 -0.5009101639852780
a2 (c7) a2 (c8) a2 (c9) a2 (c10)
12.042905981970900 -181.84512743002200 1561.180298581870 -5788.854265185760
b2 (c1) b2 (c2) b2 (c3) b2 (c4)
-0.00000000000127383719340139 0.000000000325499336592069 -0.0000000269258577483385 -0.0000000608514302740086
b2 (c5) b2 (c6) b2 (c7) b2 (c8)
0.000160991178062167 -0.0123557610666339 0.463796303315559 -9.65109389182705
b2 (c9) b2 (c10) w (c1) w (c2)
106.113132649951 -478.811119088044 0.00000000007617383679759340 -0.000000026492013127284700
w (c3) w (c4) w (c5) w (c6)
0.0000040165086974174600 -0.0003481612063995760000 0.019000243595516300 -0.6763948591316100
w (c7) w (c8) w (c9) w (c10)
15.691961350241300 -228.50130238754600 1892.295034951600 -6775.282084470940
Table 2. Values of the coefficients specified in the Universal Equation for Wm characteristic.
a0 (c1) a0 (c2) a0 (c3) a0 (c4)
0.00000000007001706587787730 -0.00000002501583155508980 0.000003904738113736460 -0.0003491912666863700
a0 (c5) a0 (c6) a0 (c7) a0 (c8)
0.01969645197701400 -0.725829938836100 17.44890963741950 -263.3977401451720
a0 (c9) a0 (c10) a1 (c1) a1 (c2)
2260.388398637760 -8377.01350286527 -0.00000000000917920346698776 0.00000000390905486841779
a1 (c3) a1 (c4) a1 (c5) a1 (c6)
-0.000000712669136566865 0.0000731932114855007 -0.00467292530266516 0.192408755177559
a1 (c7) a1 (c8) a1 (c9) a1 (c10)
-5.10821796821765 84.2463622056342 -782.004920168192 3104.72992929313
b1 (c1) b1 (c2) b1 (c3) b1 (c4)
-0.00000000007140759190709090 0.00000002451861776936950 -0.000003666867803655490 0.0003132713588738140
b1 (c5) b1 (c6) b1 (c7) b1 (c8)
-0.01683554373832690 0.589704417617438 -13.44994606400680 192.3971195389380
b1 (c9) b1 (c10) a2 (c1) a2 (c2)
-1564.118084049990 5496.89652832734 -0.00000000002473835428841850 0.00000000857389977038472
a2 (c3) a2 (c4) a2 (c5) a2 (c6)
-0.000001293799012428200 0.0001114657248249200 -0.00603673362973466 0.212934147809491
a2 (c7) a2 (c8) a2 (c9) a2 (c10)
-4.88728990817866 70.3140700082219 -574.701954526231 2029.92561253025
b2 (c1) b2 (c2) b2 (c3) b2 (c4)
0.00000000001532603895634640 -0.00000000534597810982802 0.000000813923958668984 -0.0000709535832980723
b2 (c5) b2 (c6) b2 (c7) b2 (c8)
0.00390090711682261 -0.140186188779757 3.29082695837552 -48.6175747114795
b2 (c9) b2 (c10) w (c1) w (c2)
409.662879623748 -1496.85732924952 0.00000000003725825084915130 -0.00000001307237112503680
w (c3) w (c4) w (c5) w (c6)
0.000002001304912505130 -0.0001753365232788030 0.00967969358670688 -0.348859201252643
w (c7) w (c8) w (c9) w (c10)
8.19843384947085 -120.9703220724220 1015.016628204550 -3679.33688058800
Table 3. The technical characteristics of the components of the pump station.
Pipe 1 –
Q1(discharge)
Pipe 1 –
a1(wave speed)
Pipe 1 –
f1(friction factor)
Pipe 1 –
D1p(diameter)
0.5 m3/s 900 m/s 0.01 0.75 m
Pipe 1
L1 (length)
Pipe 2
Q2 (discharge)
Pipe 2 –
a2(wave speed)
Pipe 2 –
f2(friction factor)
450 m 0.5 m3/s 1100 m/s 0.012
Pipe 2 –
D2p(diameter)
Pipe 2 –
L2(length)
Pump efficiency –
η
Pump moment of inertia -WR2
0.75 m 550 m 0.84 16.85 kg•m2
Pumprated speed of rotation – n* Pump rated head –
H*
Pump rated discharge –Q*
1100 rpm 60 m 0.25 m3/s
Disclaimer/Publisher’s Note: The statements, opinions and data contained in all publications are solely those of the individual author(s) and contributor(s) and not of MDPI and/or the editor(s). MDPI and/or the editor(s) disclaim responsibility for any injury to people or property resulting from any ideas, methods, instructions or products referred to in the content.
Copyright: This open access article is published under a Creative Commons CC BY 4.0 license, which permit the free download, distribution, and reuse, provided that the author and preprint are cited in any reuse.
Prerpints.org logo

Preprints.org is a free preprint server supported by MDPI in Basel, Switzerland.

Subscribe

© 2024 MDPI (Basel, Switzerland) unless otherwise stated