Submitted:
16 October 2023
Posted:
18 October 2023
You are already at the latest version
Abstract
Keywords:
1. Introduction
2. Dynamic Successive Assessment and System Dynamics Simulation Method of WRCC
2.1. Developing Indicator System for WRCC Using the PSR Framework
2.2. Assessment Method Based on VFPR and AHP Model
2.3. The Framework of WRCC System Dynamics of Hebei
3. Method Application
3.1. Study Site and Data
3.2. The WRCC Evaluation Results of Hebei Province
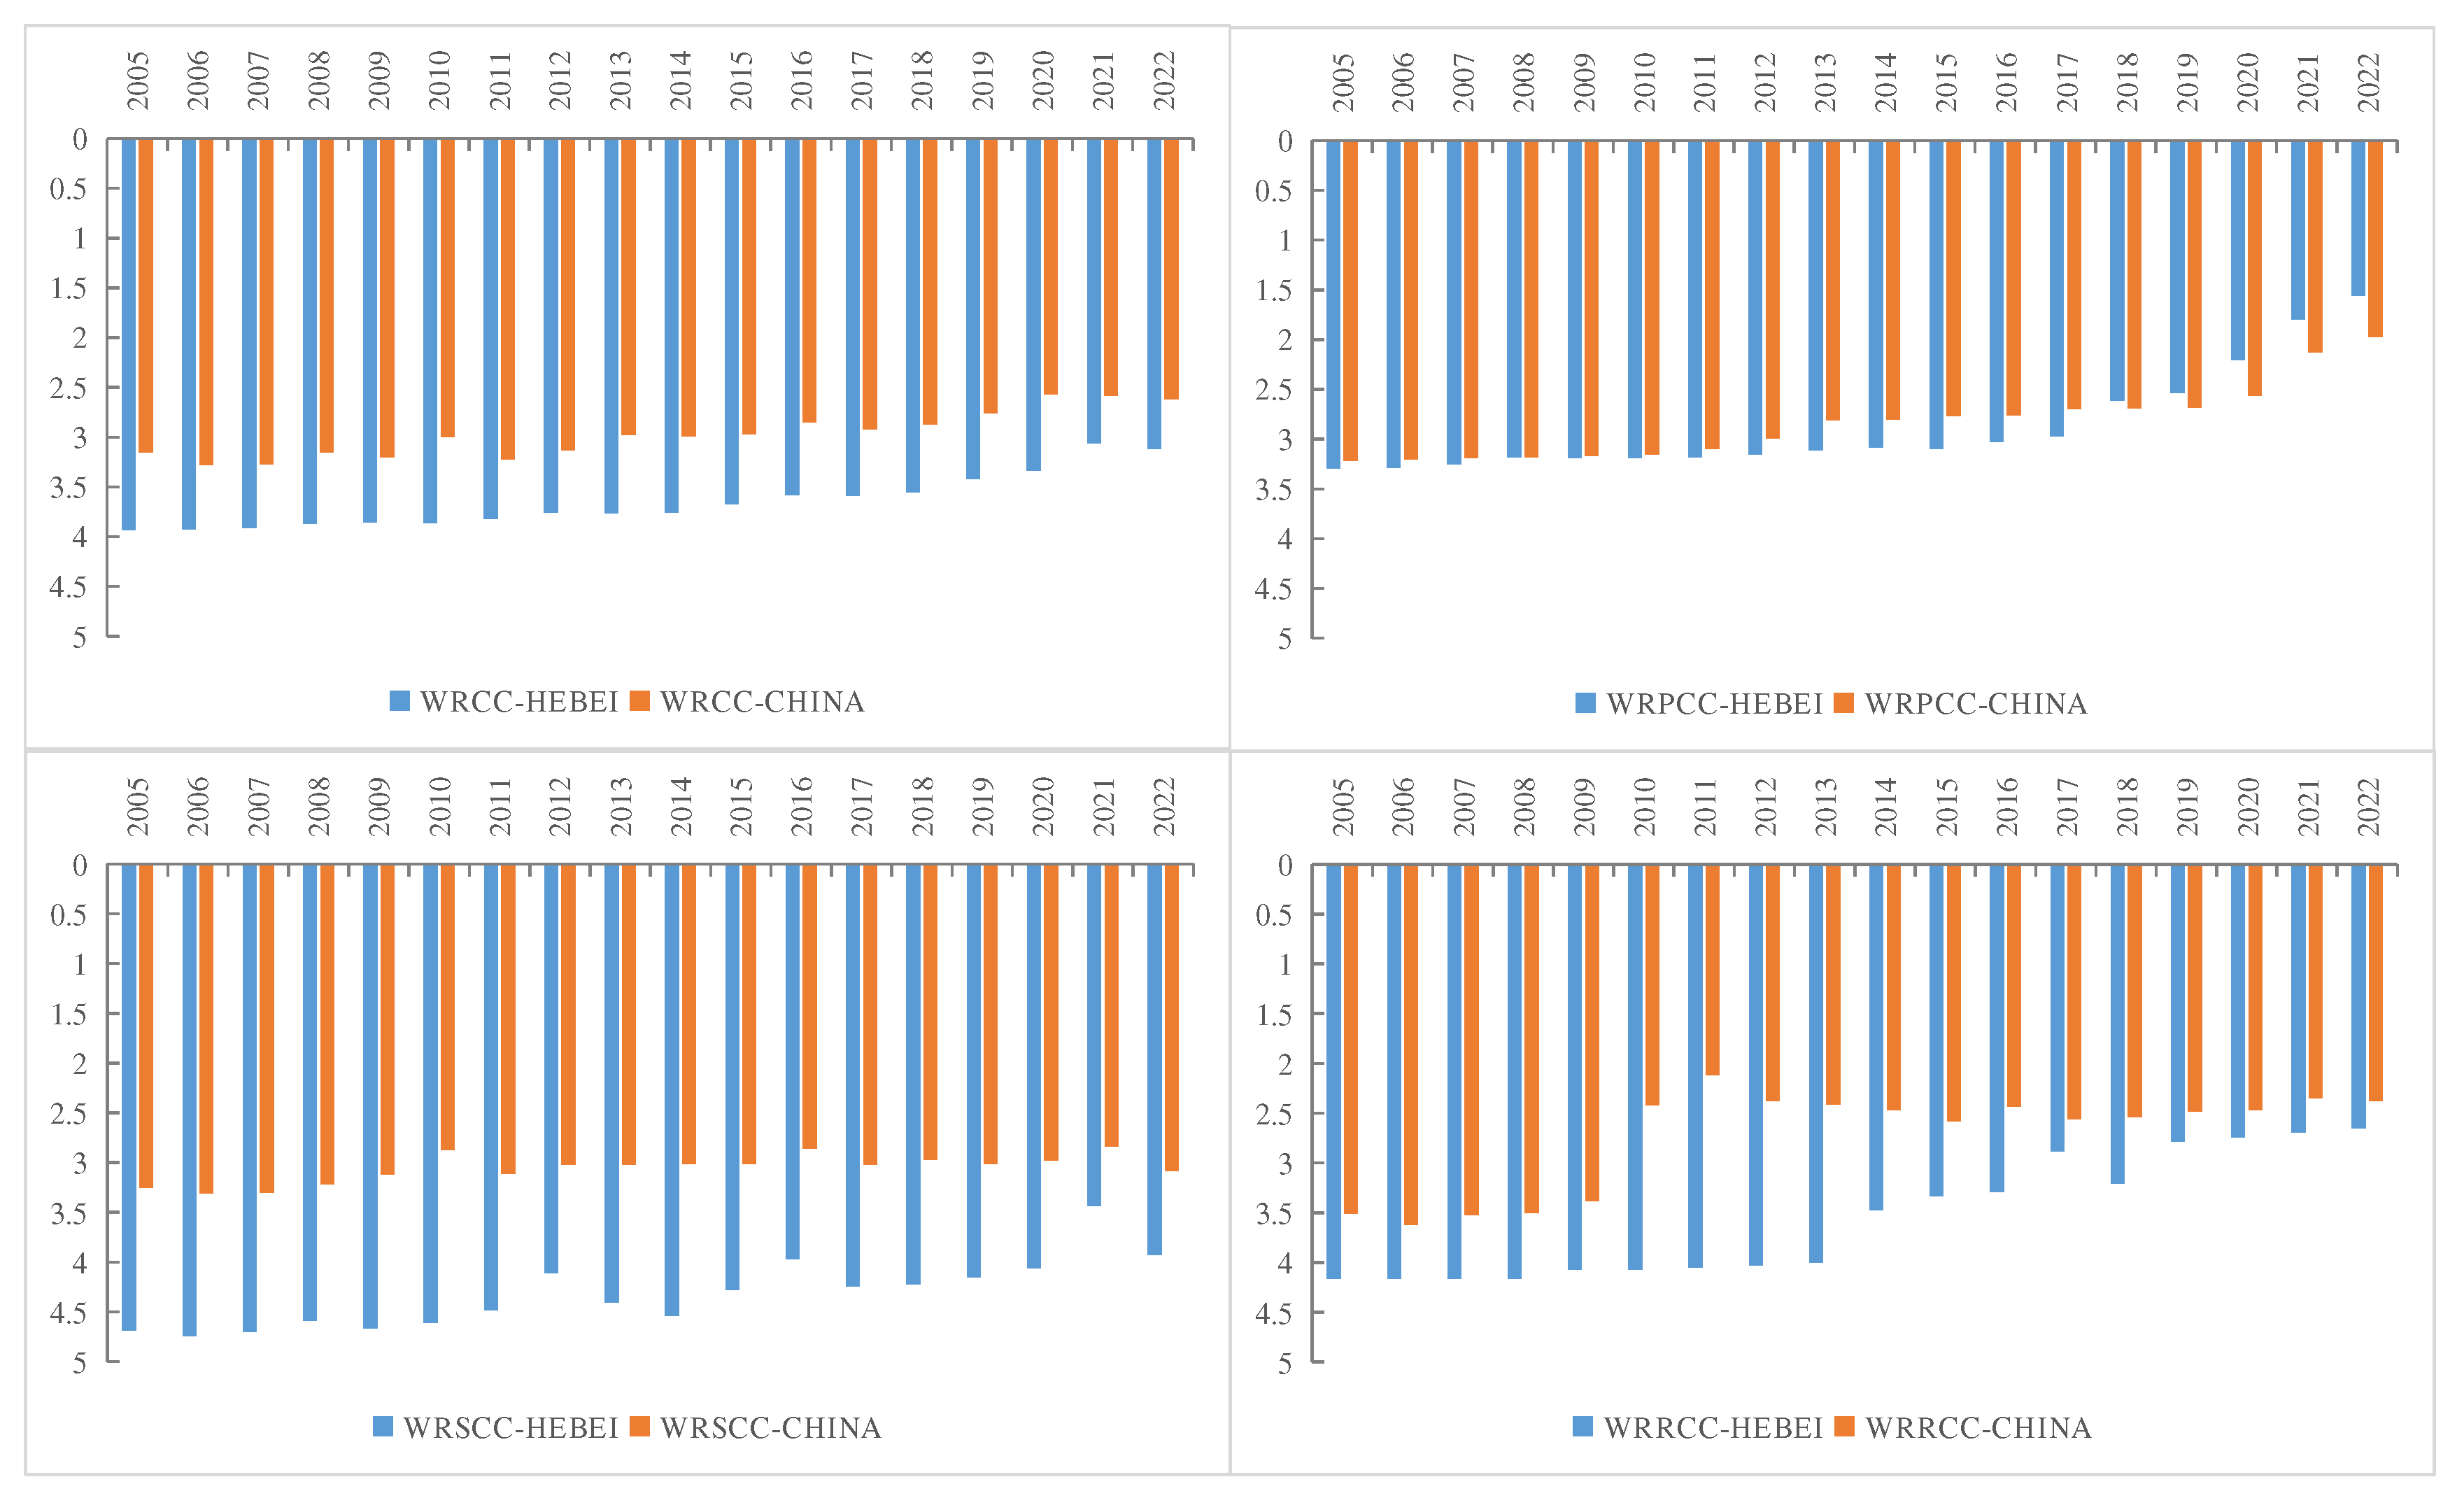
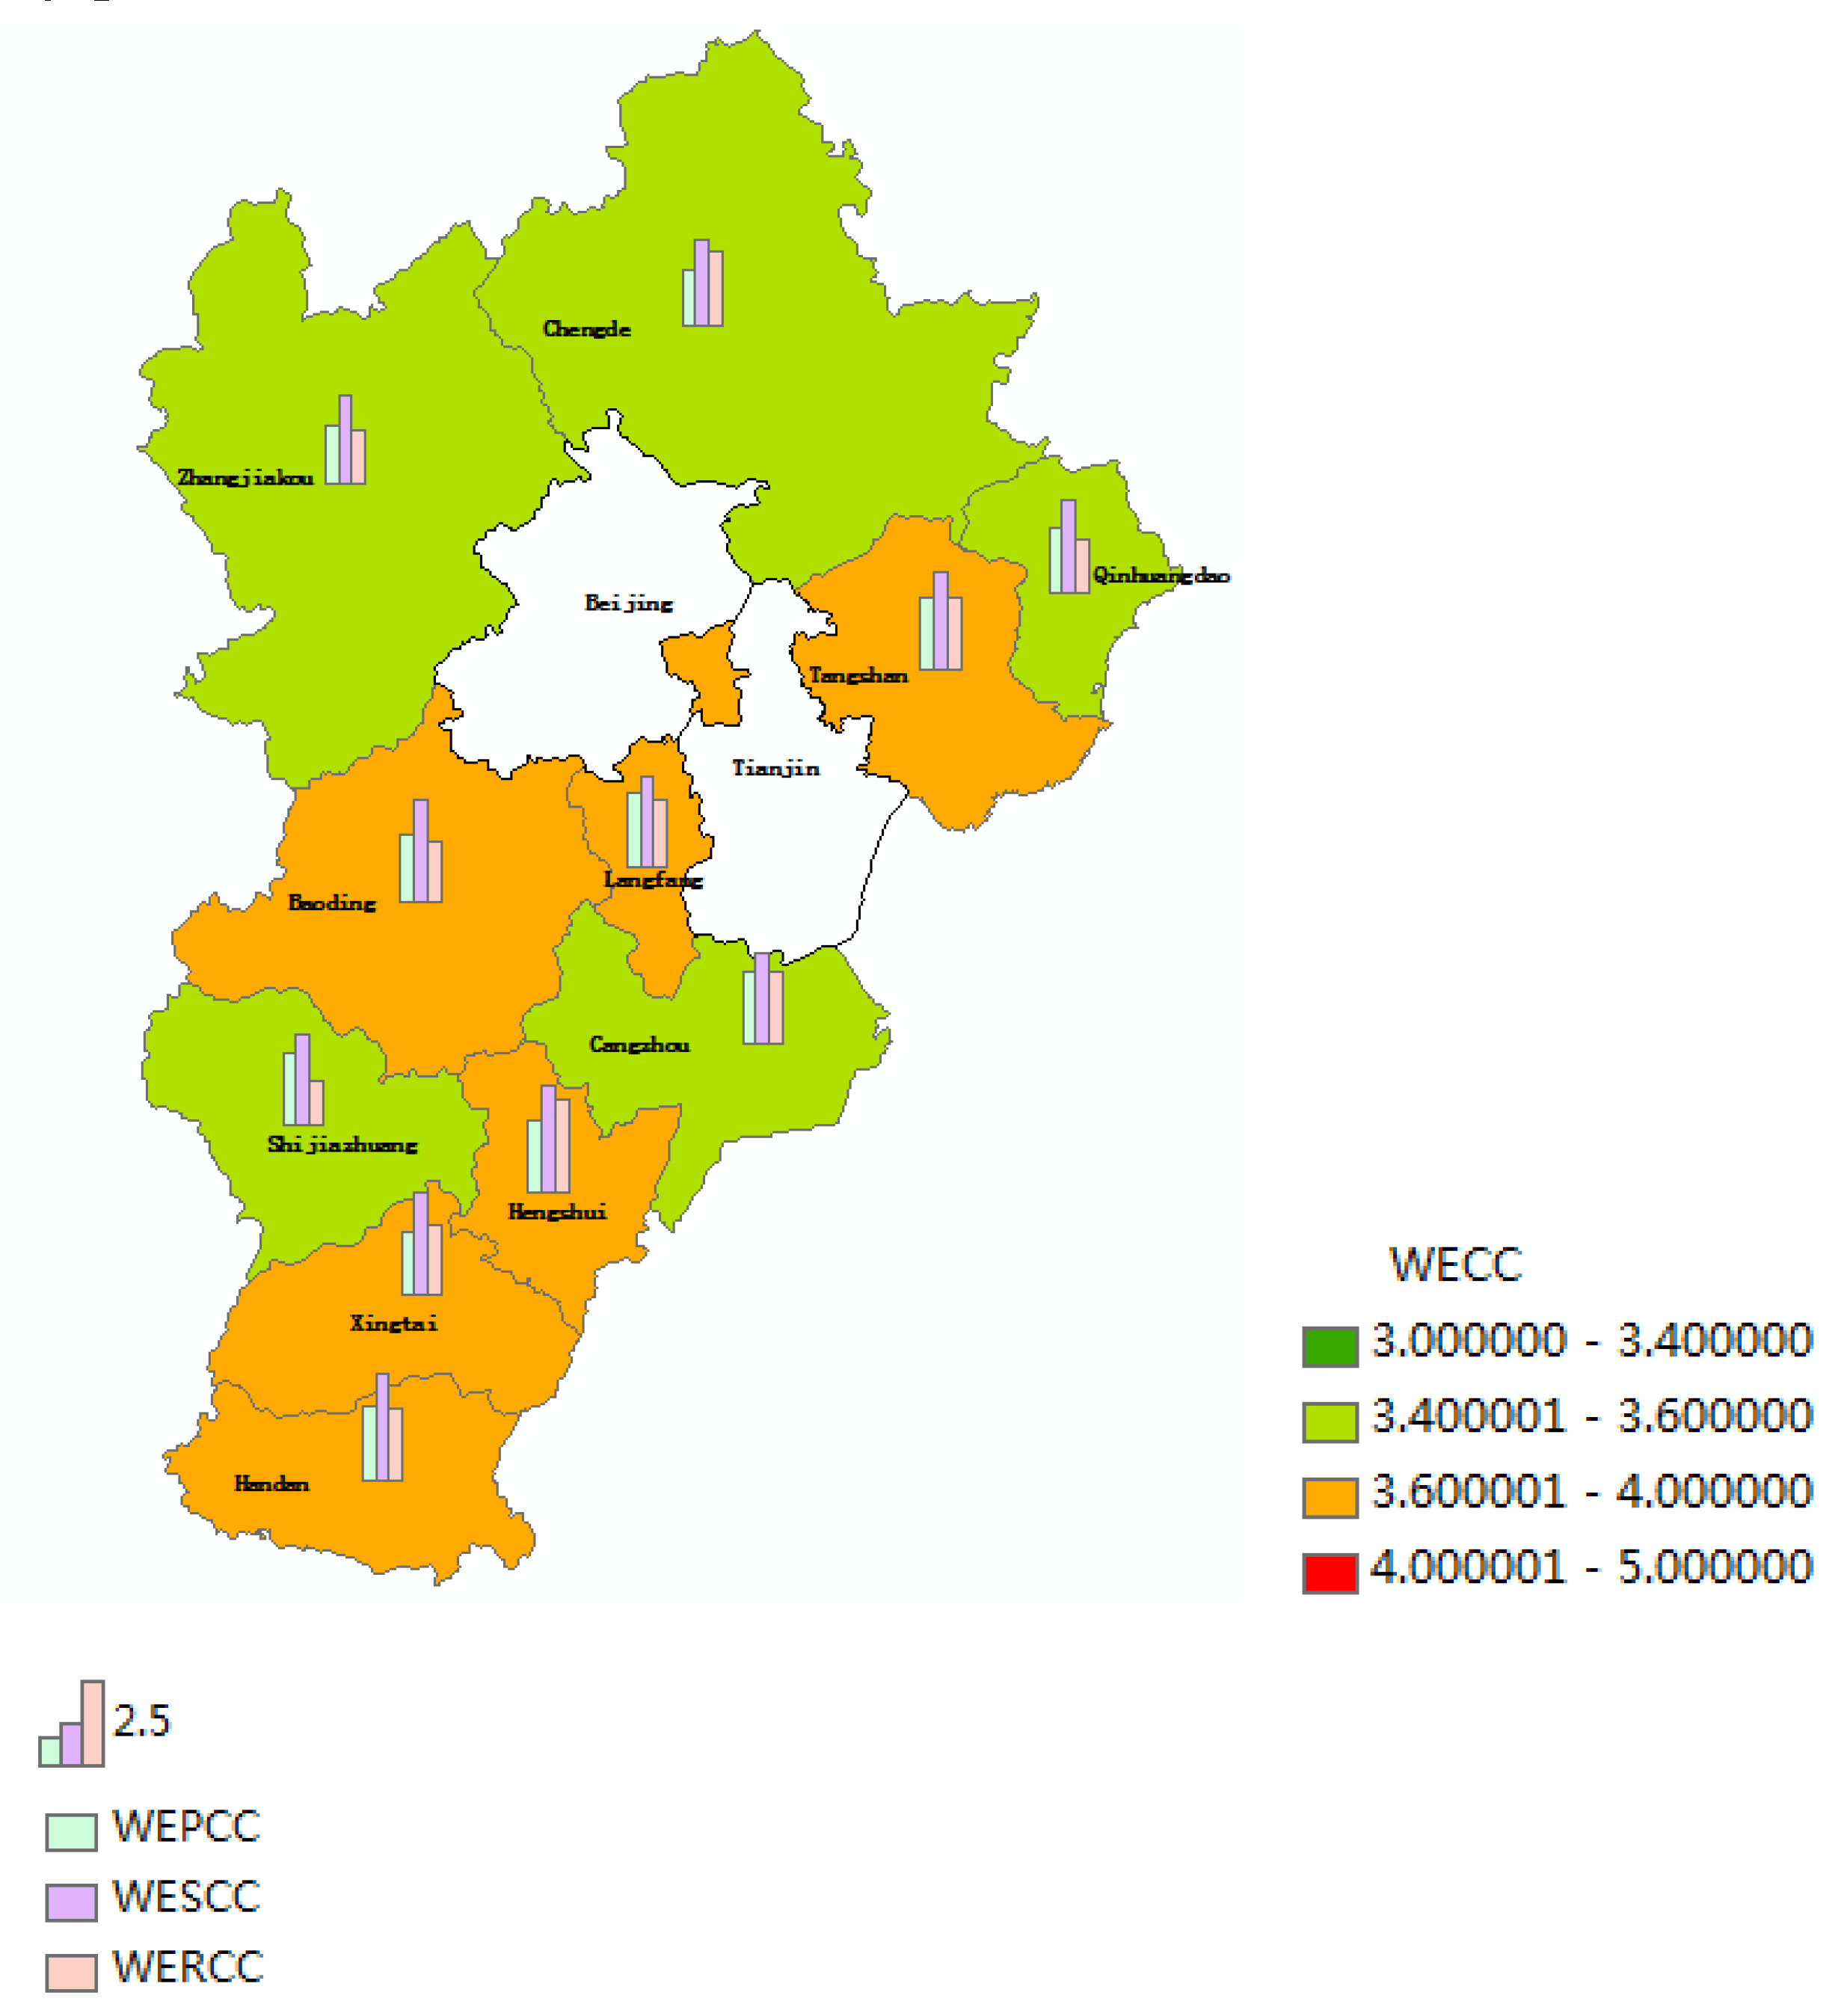
3.3. The WRCC Simulation Results of Hebei Province
4. Discussion
5. Conclusions
Author Contributions
Funding
Data Availability Statement
Acknowledgments
Conflicts of Interest
Appendix
| Year | Weighting methods | ||||
|---|---|---|---|---|---|
| Equal weighting | Entropy weighting | AHP | AHP-E | PCA | |
| 2005 | 3.490 | 3.610 | 3.816 | 3.931 | 3.709 |
| 2006 | 3.474 | 3.606 | 3.801 | 3.927 | 3.690 |
| 2007 | 3.428 | 3.587 | 3.764 | 3.913 | 3.627 |
| 2008 | 3.368 | 3.534 | 3.713 | 3.870 | 3.555 |
| 2009 | 3.336 | 3.529 | 3.688 | 3.858 | 3.521 |
| 2010 | 3.328 | 3.529 | 3.686 | 3.861 | 3.501 |
| 2011 | 3.296 | 3.496 | 3.650 | 3.822 | 3.461 |
| 2012 | 3.244 | 3.443 | 3.556 | 3.757 | 3.390 |
| 2013 | 3.251 | 3.436 | 3.608 | 3.767 | 3.408 |
| 2014 | 3.225 | 3.435 | 3.587 | 3.759 | 3.378 |
| 2015 | 3.155 | 3.378 | 3.452 | 3.675 | 3.294 |
| 2016 | 3.084 | 3.296 | 3.355 | 3.583 | 3.202 |
| 2017 | 3.087 | 3.289 | 3.381 | 3.590 | 3.211 |
| 2018 | 3.064 | 3.221 | 3.363 | 3.556 | 3.183 |
| 2019 | 2.999 | 3.094 | 3.276 | 3.423 | 3.100 |
| 2020 | 2.947 | 2.989 | 3.220 | 3.333 | 3.035 |
| 2021 | 2.768 | 2.783 | 2.905 | 3.063 | 2.816 |
| 2022 | 2.832 | 2.830 | 3.060 | 3.115 | 2.932 |
Appendix
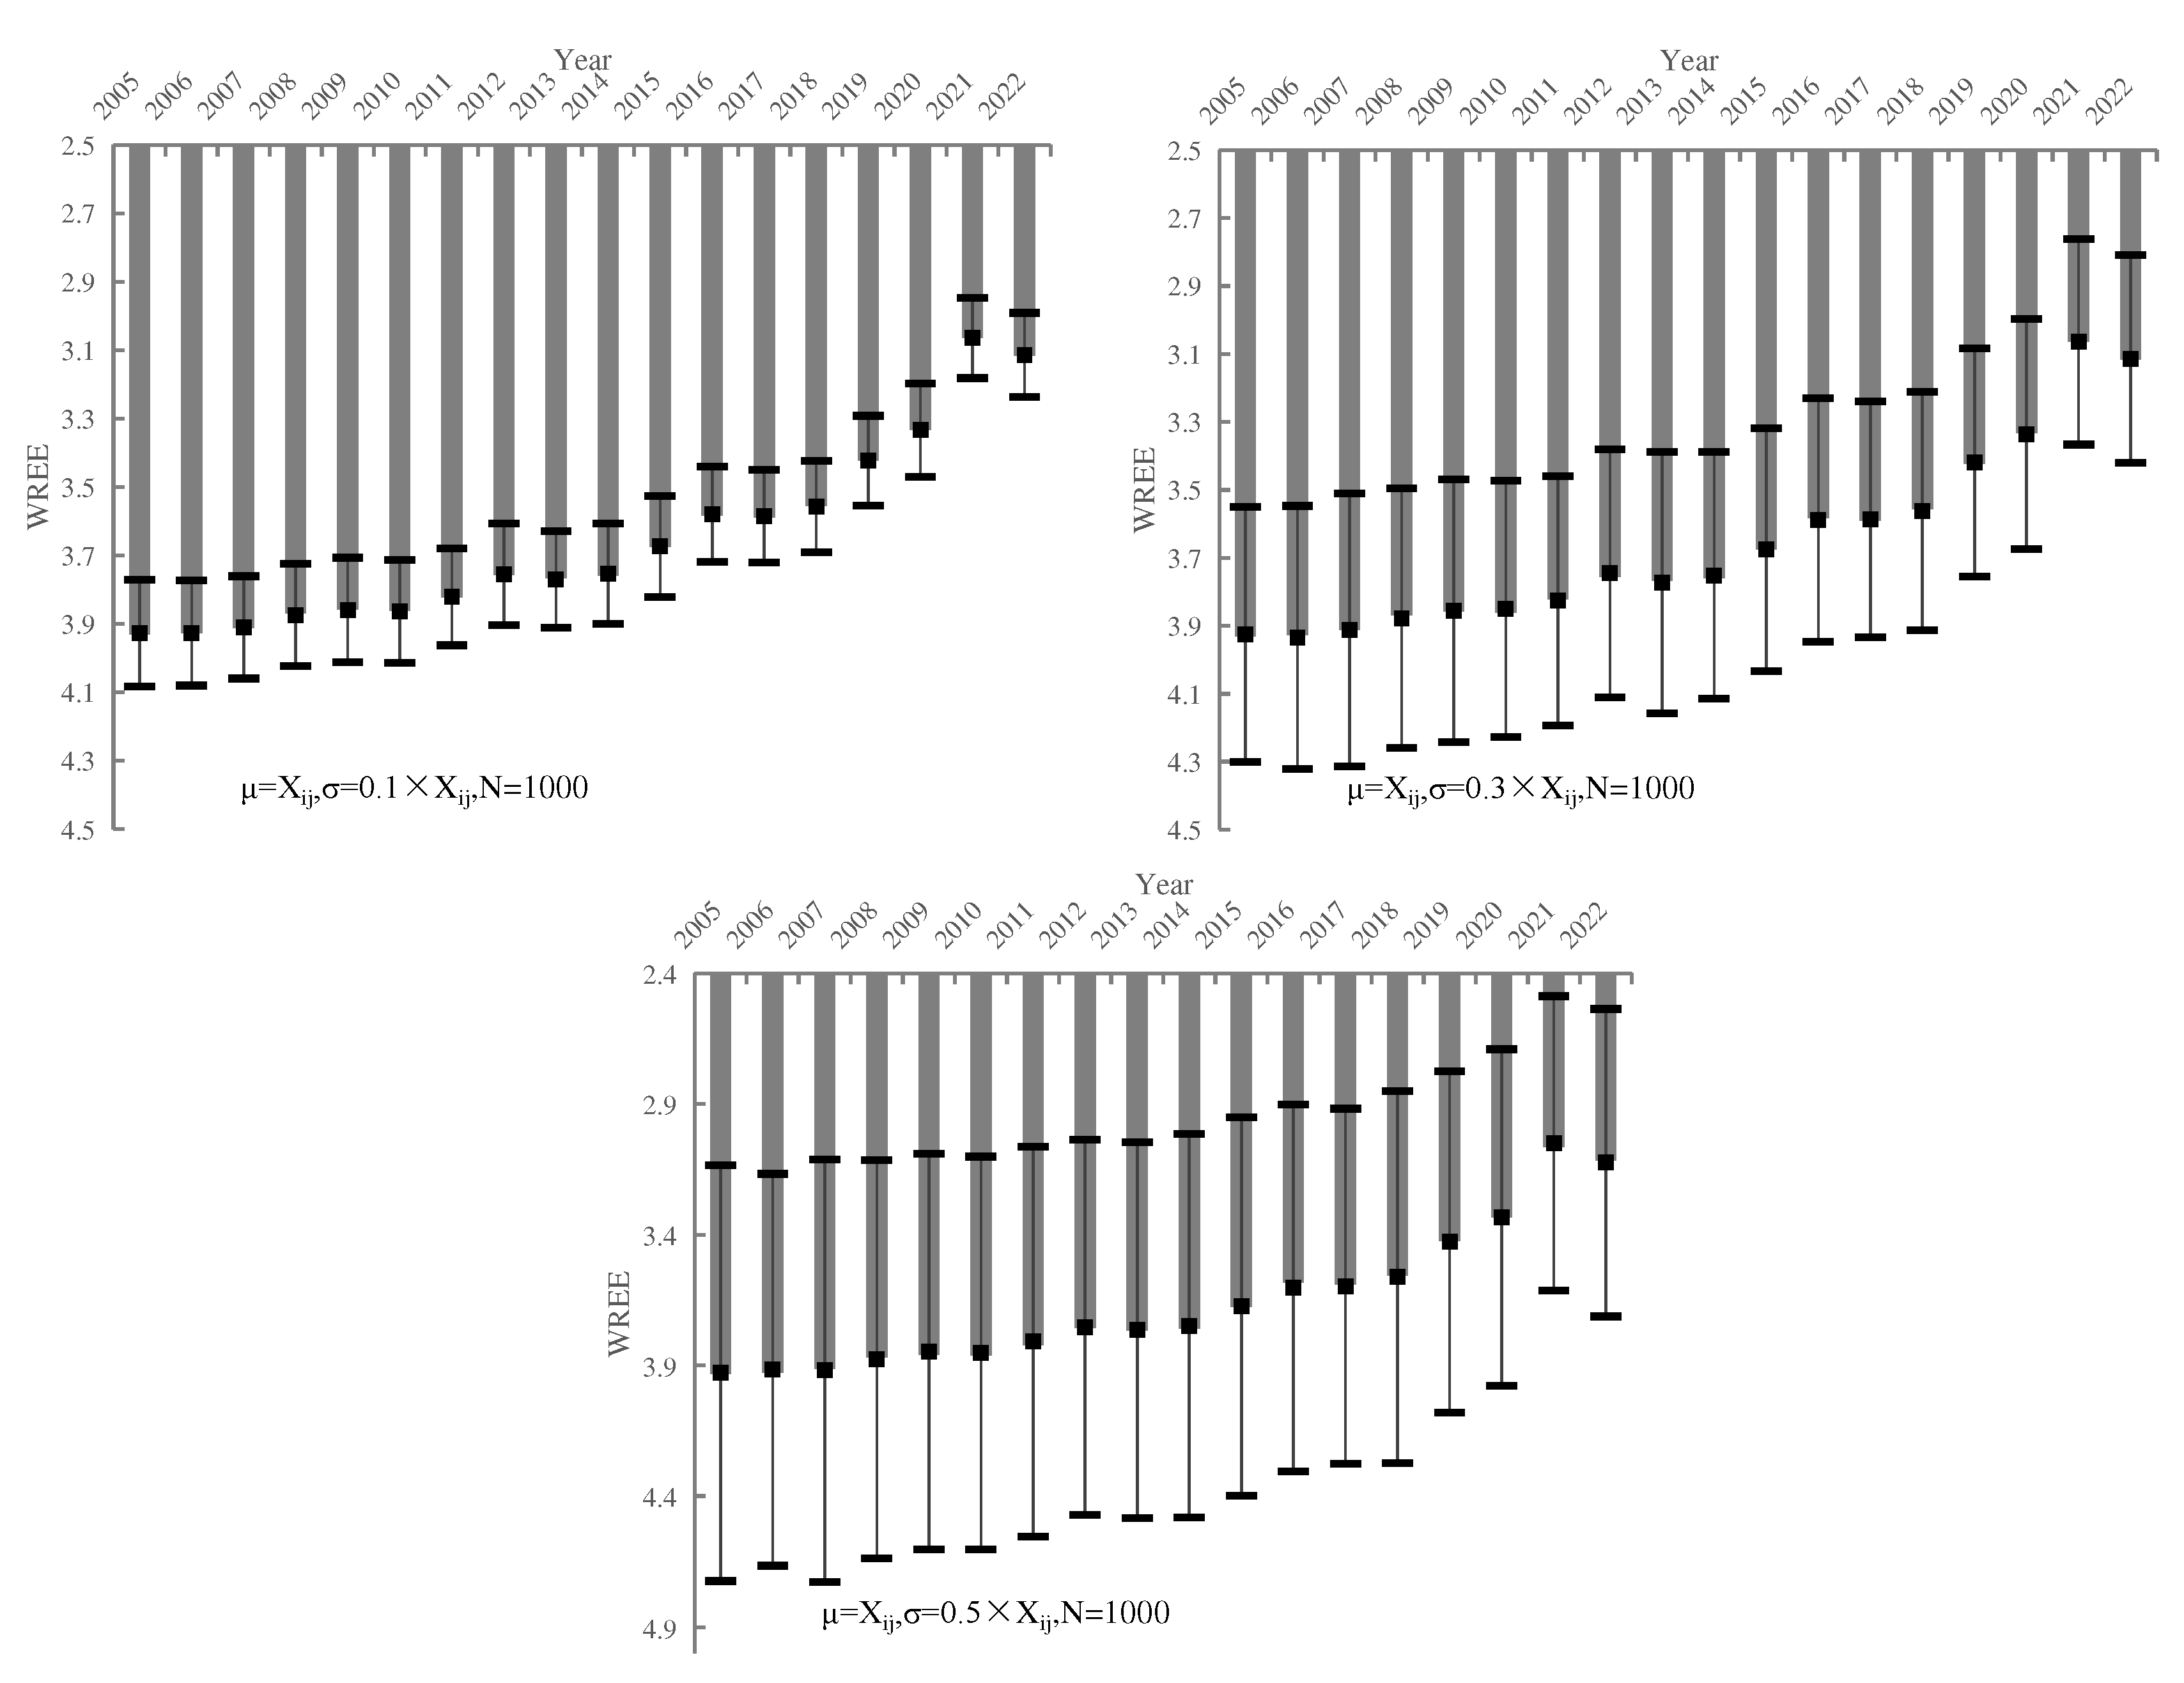
| Year | σ are 0.1 Xij | σ are 0.3 Xij | σ are 0.5 Xij | ||||||
|---|---|---|---|---|---|---|---|---|---|
| Mean | Confidence interval | Mean | Confidence interval | Mean | Confidence interval | ||||
| 2005 | 3.927 | 3.771 | 4.083 | 3.925 | 3.549 | 4.301 | 3.928 | 3.134 | 4.723 |
| 2006 | 3.927 | 3.774 | 4.080 | 3.935 | 3.547 | 4.322 | 3.916 | 3.167 | 4.665 |
| 2007 | 3.910 | 3.761 | 4.060 | 3.912 | 3.511 | 4.314 | 3.919 | 3.112 | 4.726 |
| 2008 | 3.874 | 3.725 | 4.023 | 3.878 | 3.495 | 4.260 | 3.877 | 3.115 | 4.639 |
| 2009 | 3.859 | 3.706 | 4.012 | 3.856 | 3.469 | 4.242 | 3.847 | 3.090 | 4.603 |
| 2010 | 3.864 | 3.713 | 4.014 | 3.850 | 3.472 | 4.228 | 3.853 | 3.101 | 4.604 |
| 2011 | 3.821 | 3.679 | 3.963 | 3.826 | 3.459 | 4.193 | 3.809 | 3.064 | 4.554 |
| 2012 | 3.756 | 3.607 | 3.904 | 3.746 | 3.380 | 4.111 | 3.754 | 3.037 | 4.471 |
| 2013 | 3.770 | 3.629 | 3.911 | 3.773 | 3.388 | 4.157 | 3.765 | 3.046 | 4.484 |
| 2014 | 3.754 | 3.607 | 3.900 | 3.751 | 3.388 | 4.115 | 3.748 | 3.014 | 4.482 |
| 2015 | 3.674 | 3.526 | 3.821 | 3.676 | 3.319 | 4.033 | 3.675 | 2.950 | 4.399 |
| 2016 | 3.580 | 3.441 | 3.719 | 3.588 | 3.230 | 3.947 | 3.603 | 2.902 | 4.305 |
| 2017 | 3.585 | 3.450 | 3.720 | 3.587 | 3.239 | 3.934 | 3.597 | 2.918 | 4.277 |
| 2018 | 3.557 | 3.423 | 3.691 | 3.562 | 3.211 | 3.913 | 3.562 | 2.851 | 4.274 |
| 2019 | 3.423 | 3.292 | 3.554 | 3.419 | 3.083 | 3.755 | 3.428 | 2.775 | 4.080 |
| 2020 | 3.333 | 3.197 | 3.470 | 3.336 | 2.997 | 3.674 | 3.334 | 2.691 | 3.977 |
| 2021 | 3.064 | 2.946 | 3.181 | 3.064 | 2.761 | 3.367 | 3.050 | 2.487 | 3.613 |
| 2022 | 3.114 | 2.991 | 3.237 | 3.115 | 2.809 | 3.420 | 3.124 | 2.536 | 3.712 |
References
- Ait-Aoudia, M. N., & Berezowska-Azzag, E. (2016). Water resources carrying capacity assessment: the case of Algeria's capital city. Habitat International, 58, 51-58. [CrossRef]
- Barati, A. A., Azadi, H., & Scheffran, J. (2019). A system dynamics model of smart groundwater governance. Agricultural Water Management, 221, 502-518. [CrossRef]
- Bayu, T., Kim, H., & Oki, T. (2020). Water governance contribution to water and sanitation access equality in developing countries. Water Resources Research, 56(4), e2019WR025330. [CrossRef]
- Chen, S., & Guo, Y. (2006). Variable fuzzy sets and its application in comprehensive risk evaluation for flood-control engineering system. Fuzzy Optimization and Decision Making, 5, 153-162.
- Chen, X., Xu, Q., & Cai, J. (2023). Research on the urban water resources carrying capacity by using system dynamics simulation. Hydrology Research, 54(3), 418-434. [CrossRef]
- Cui, Y., Feng, P., Jin, J., & Liu, L. (2018). Water resources carrying capacity evaluation and diagnosis based on set pair analysis and improved the entropy weight method. Entropy, 20(5), 359. [CrossRef]
- Dai, D., Sun, M., Lv, X., & Lei, K. (2020). Evaluating water resource sustainability from the perspective of water resource carrying capacity, a case study of the Yongding River watershed in Beijing-Tianjin-Hebei region, China. Environmental Science and Pollution Research, 27, 21590-21603. [CrossRef]
- Duan, C.Q., Liu, C.M., Cao, L.L., Chen, X.N., Qiu, L., 2009. Evaluation of water resources carrying capacity by a variable fuzzy set method. J. Beijing Norm. Univ. (Nat. Sci.)45, 582–584 (in Chinese).
- Fotovatikhah, F., Herrera, M., Shamshirband, S., Chau, K. W., Faizollahzadeh Ardabili, S., & Piran, M. J. (2018). Survey of computational intelligence as basis to big flood management: Challenges, research directions and future work. Engineering Applications of Computational Fluid Mechanics, 12(1), 411-437. [CrossRef]
- Gebrehiwet, T., & Luo, H. (2018). Risk level evaluation on construction project lifecycle using fuzzy comprehensive evaluation and TOPSIS. Symmetry, 11(1), 12. [CrossRef]
- Gong, L., & Jin, C. (2009). Fuzzy comprehensive evaluation for carrying capacity of regional water resources. Water resources management, 23, 2505-2513. [CrossRef]
- Huicheng, Z., Guoli, W., & Qing, Y. (1999). A multi-objective fuzzy pattern recognition model for assessing groundwater vulnerability based on the DRASTIC system. Hydrological Sciences Journal, 44(4), 611-618. [CrossRef]
- Liu, P., Lü, S., Han, Y., Wang, F., & Tang, L. (2022). Comprehensive evaluation on water resources carrying capacity based on water-economy-ecology concept framework and EFAST-cloud model: A case study of Henan Province, China. Ecological Indicators, 143, 109392. [CrossRef]
- OECD, 1998. Towards Sustainable Development Environmental Indicators: Environmental Indicators. OECD Publishing.
- Qiao, J. J. (2004). Application of improved entropy method in Henan sustainable development evaluation. Resources science, 26(1), 113-118.
- Qin, G., Li, H., Wang, X., & Ding, J. (2016). Research on water resources design carrying capacity. Water, 8(4), 157. [CrossRef]
- Rioul, O., & Magossi, J. C. (2014). On Shannon’s formula and Hartley’s rule: Beyond the mathematical coincidence. Entropy, 16(9), 4892-4910. [CrossRef]
- Shuai, L., Hong, W., Xi-lu, N. I., Yan-wen, G. U., & Chang-xiao, L. I. (2014). Evaluation of urban human settlement quality in Ningxia based on AHP and the entropy method. Yingyong Shengtai Xuebao, 25(9).
- Sun, B., & Yang, X. (2019). Simulation of water resources carrying capacity in Xiong’an New Area based on system dynamics model. Water, 11(5), 1085. [CrossRef]
- Wang, G., Xiao, C., Qi, Z., Meng, F., & Liang, X. (2021). Development tendency analysis for the water resource carrying capacity based on system dynamics model and the improved fuzzy comprehensive evaluation method in the Changchun city, China. Ecological Indicators, 122, 107232. [CrossRef]
- Wang, X., Liu, L., Zhang, S., & Gao, C. (2022). Dynamic simulation and comprehensive evaluation of the water resources carrying capacity in Guangzhou city, China. Ecological Indicators, 135, 108528.
- Wang, Q., Yuan, X., Zhang, J., Mu, R., Yang, H., & Ma, C. (2013a). Key evaluation framework for the impacts of urbanization on air environment–A case study. Ecological Indicators, 24, 266-272. [CrossRef]
- Wang, S., Yang, F. L., Xu, L., & Du, J. (2013b). Multi-scale analysis of the water resources carrying capacity of the Liaohe Basin based on ecological footprints. Journal of cleaner production, 53, 158-166. [CrossRef]
- Wang, T., & Xu, S. (2015). Dynamic successive assessment method of water environment carrying capacity and its application. Ecological Indicators, 52, 134-146. [CrossRef]
- Yang, J., Lei, K., Khu, S., & Meng, W. (2015). Assessment of water resources carrying capacity for sustainable development based on a system dynamics model: a case study of Tieling City, China. Water Resources Management, 29, 885-899. [CrossRef]
- Zhou, R., Pan, Z., Jin, J., Li, C., & Ning, S. (2017). Forewarning model of regional water resources carrying capacity based on combination weights and entropy principles. Entropy, 19(11), 574. [CrossRef]
- Zhao, X., Rao, H., Yi, Q., He, C. & Yang, H. (2012). Scenarios simulation on carrying capacity of water resources in Kunming City. Procedia Earth and Planetary Science 5, 107-112.
- Zhang, Z., Lu, W. X., Zhao, Y., & Song, W. B. (2014). Development tendency analysis and evaluation of the water ecological carrying capacity in the Siping area of Jilin Province in China based on system dynamics and analytic hierarchy process. Ecological modelling, 275, 9-21. [CrossRef]
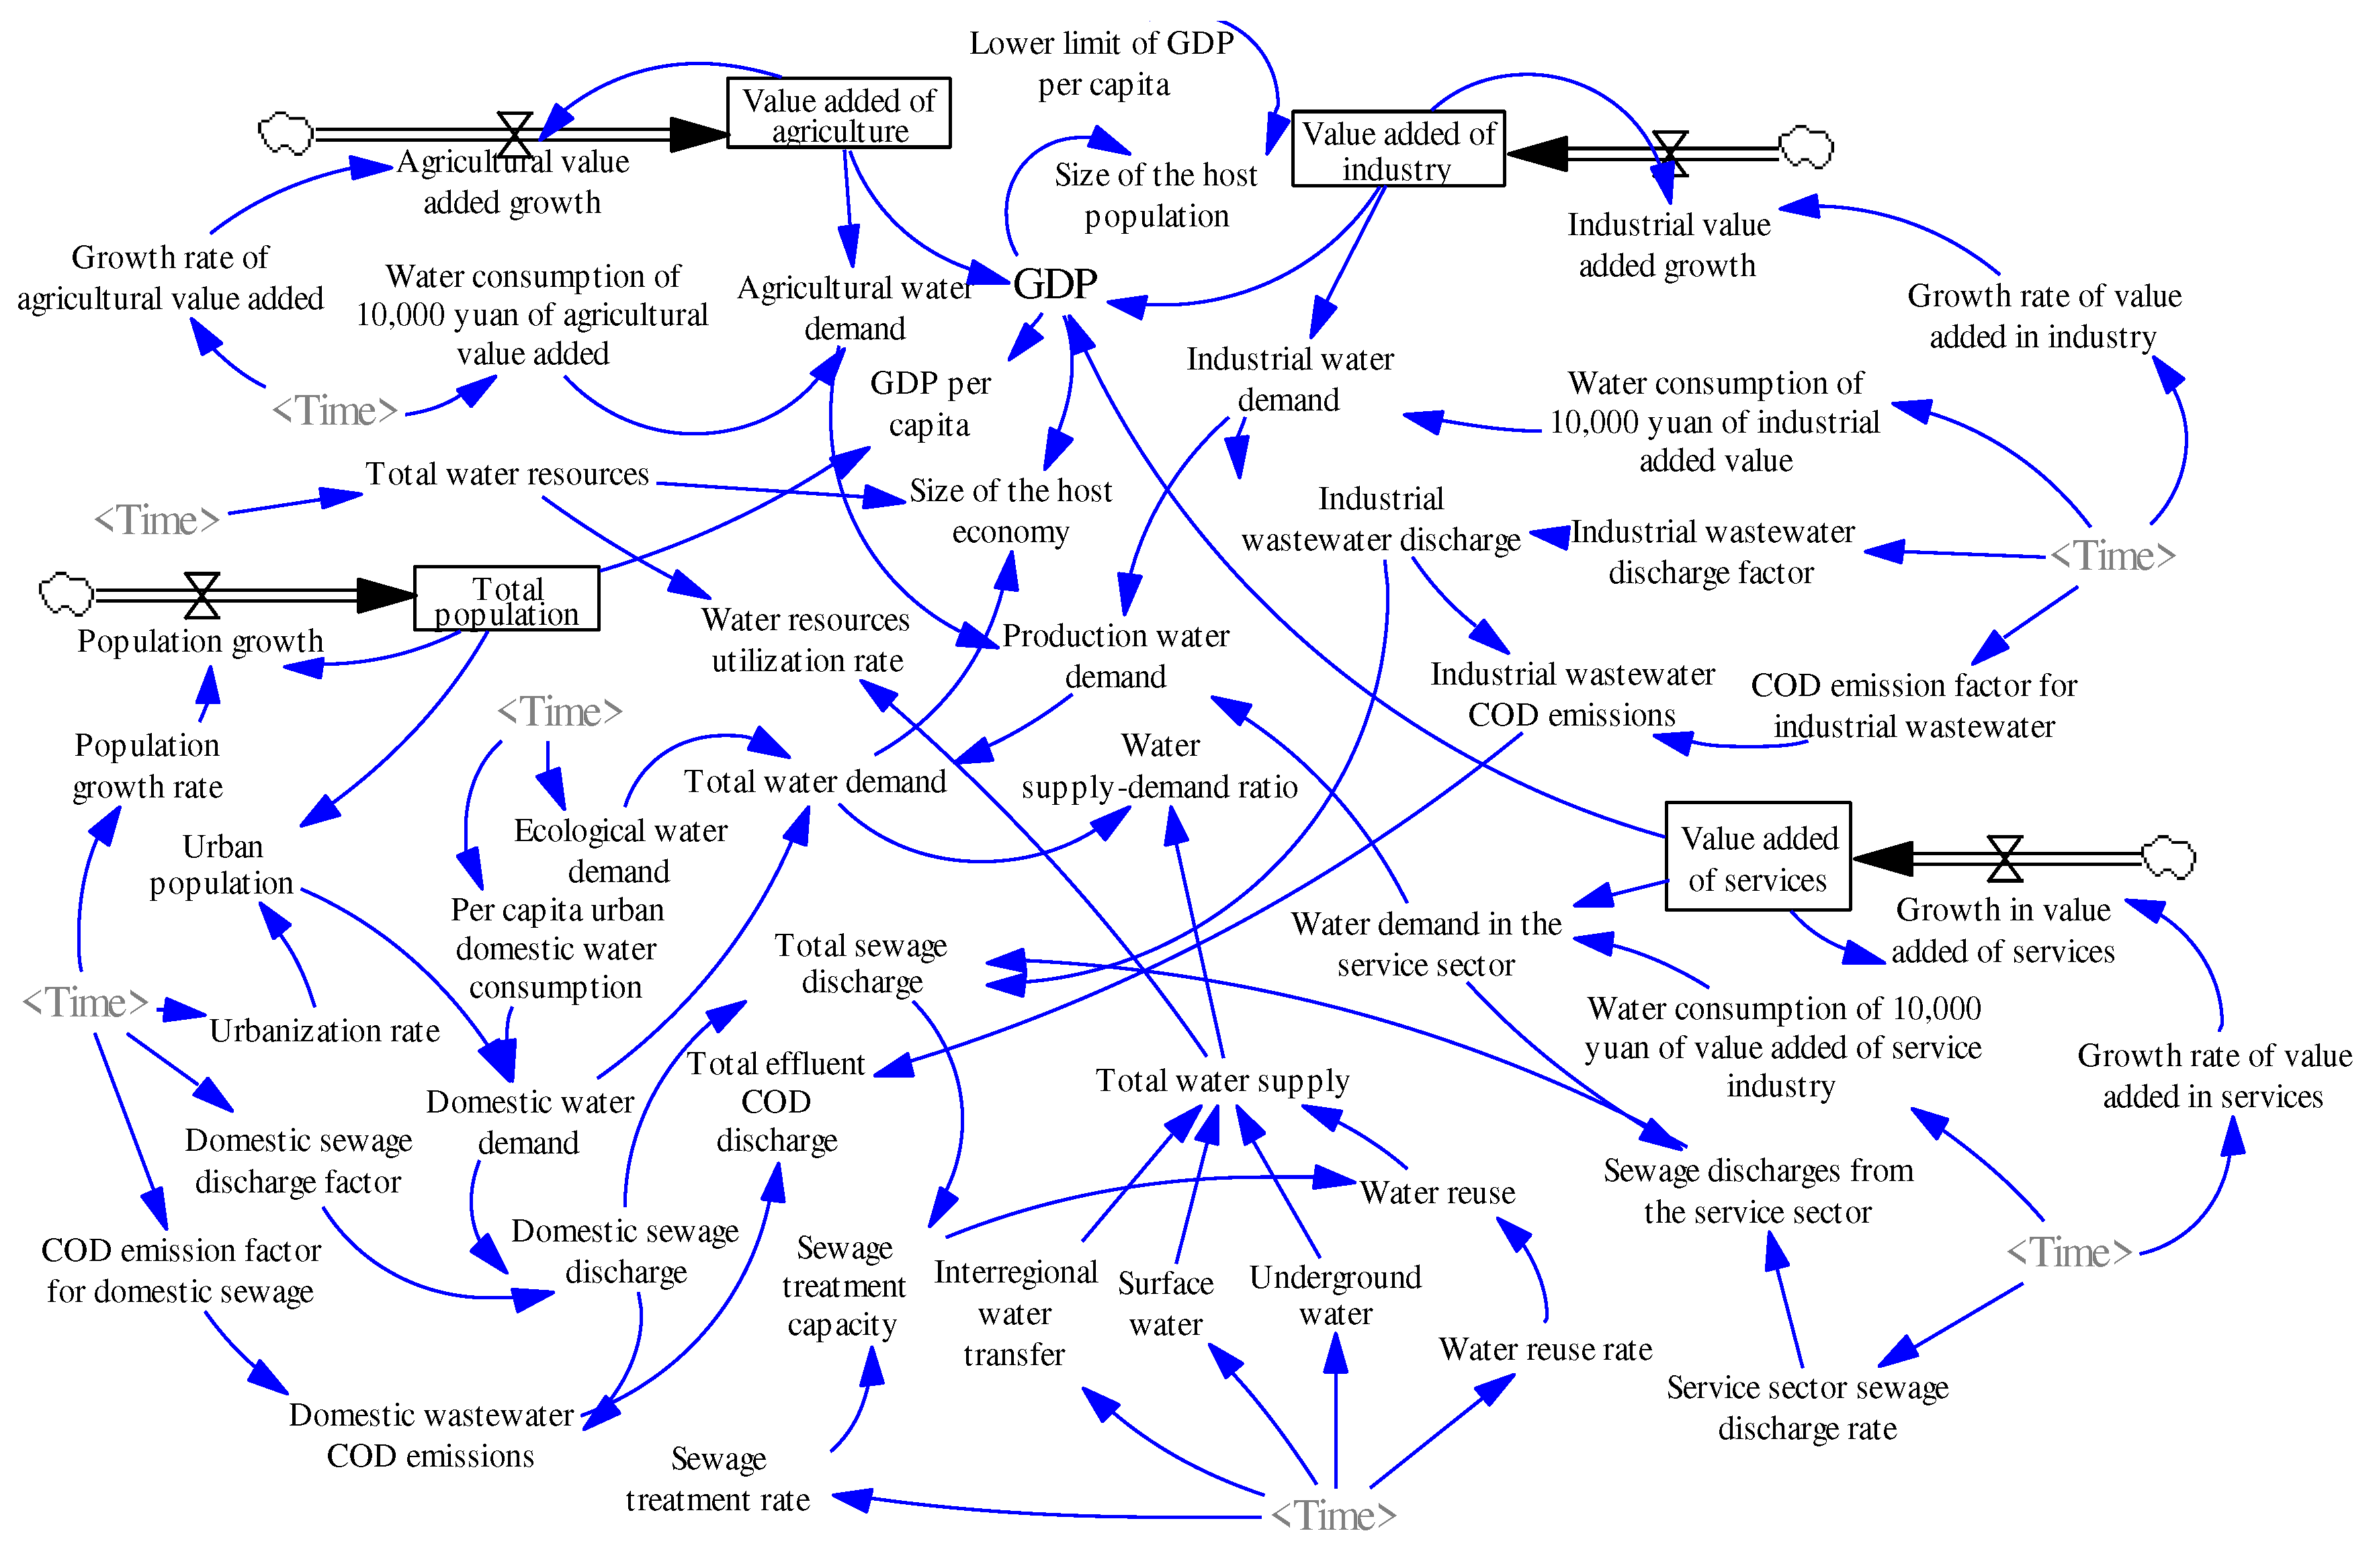
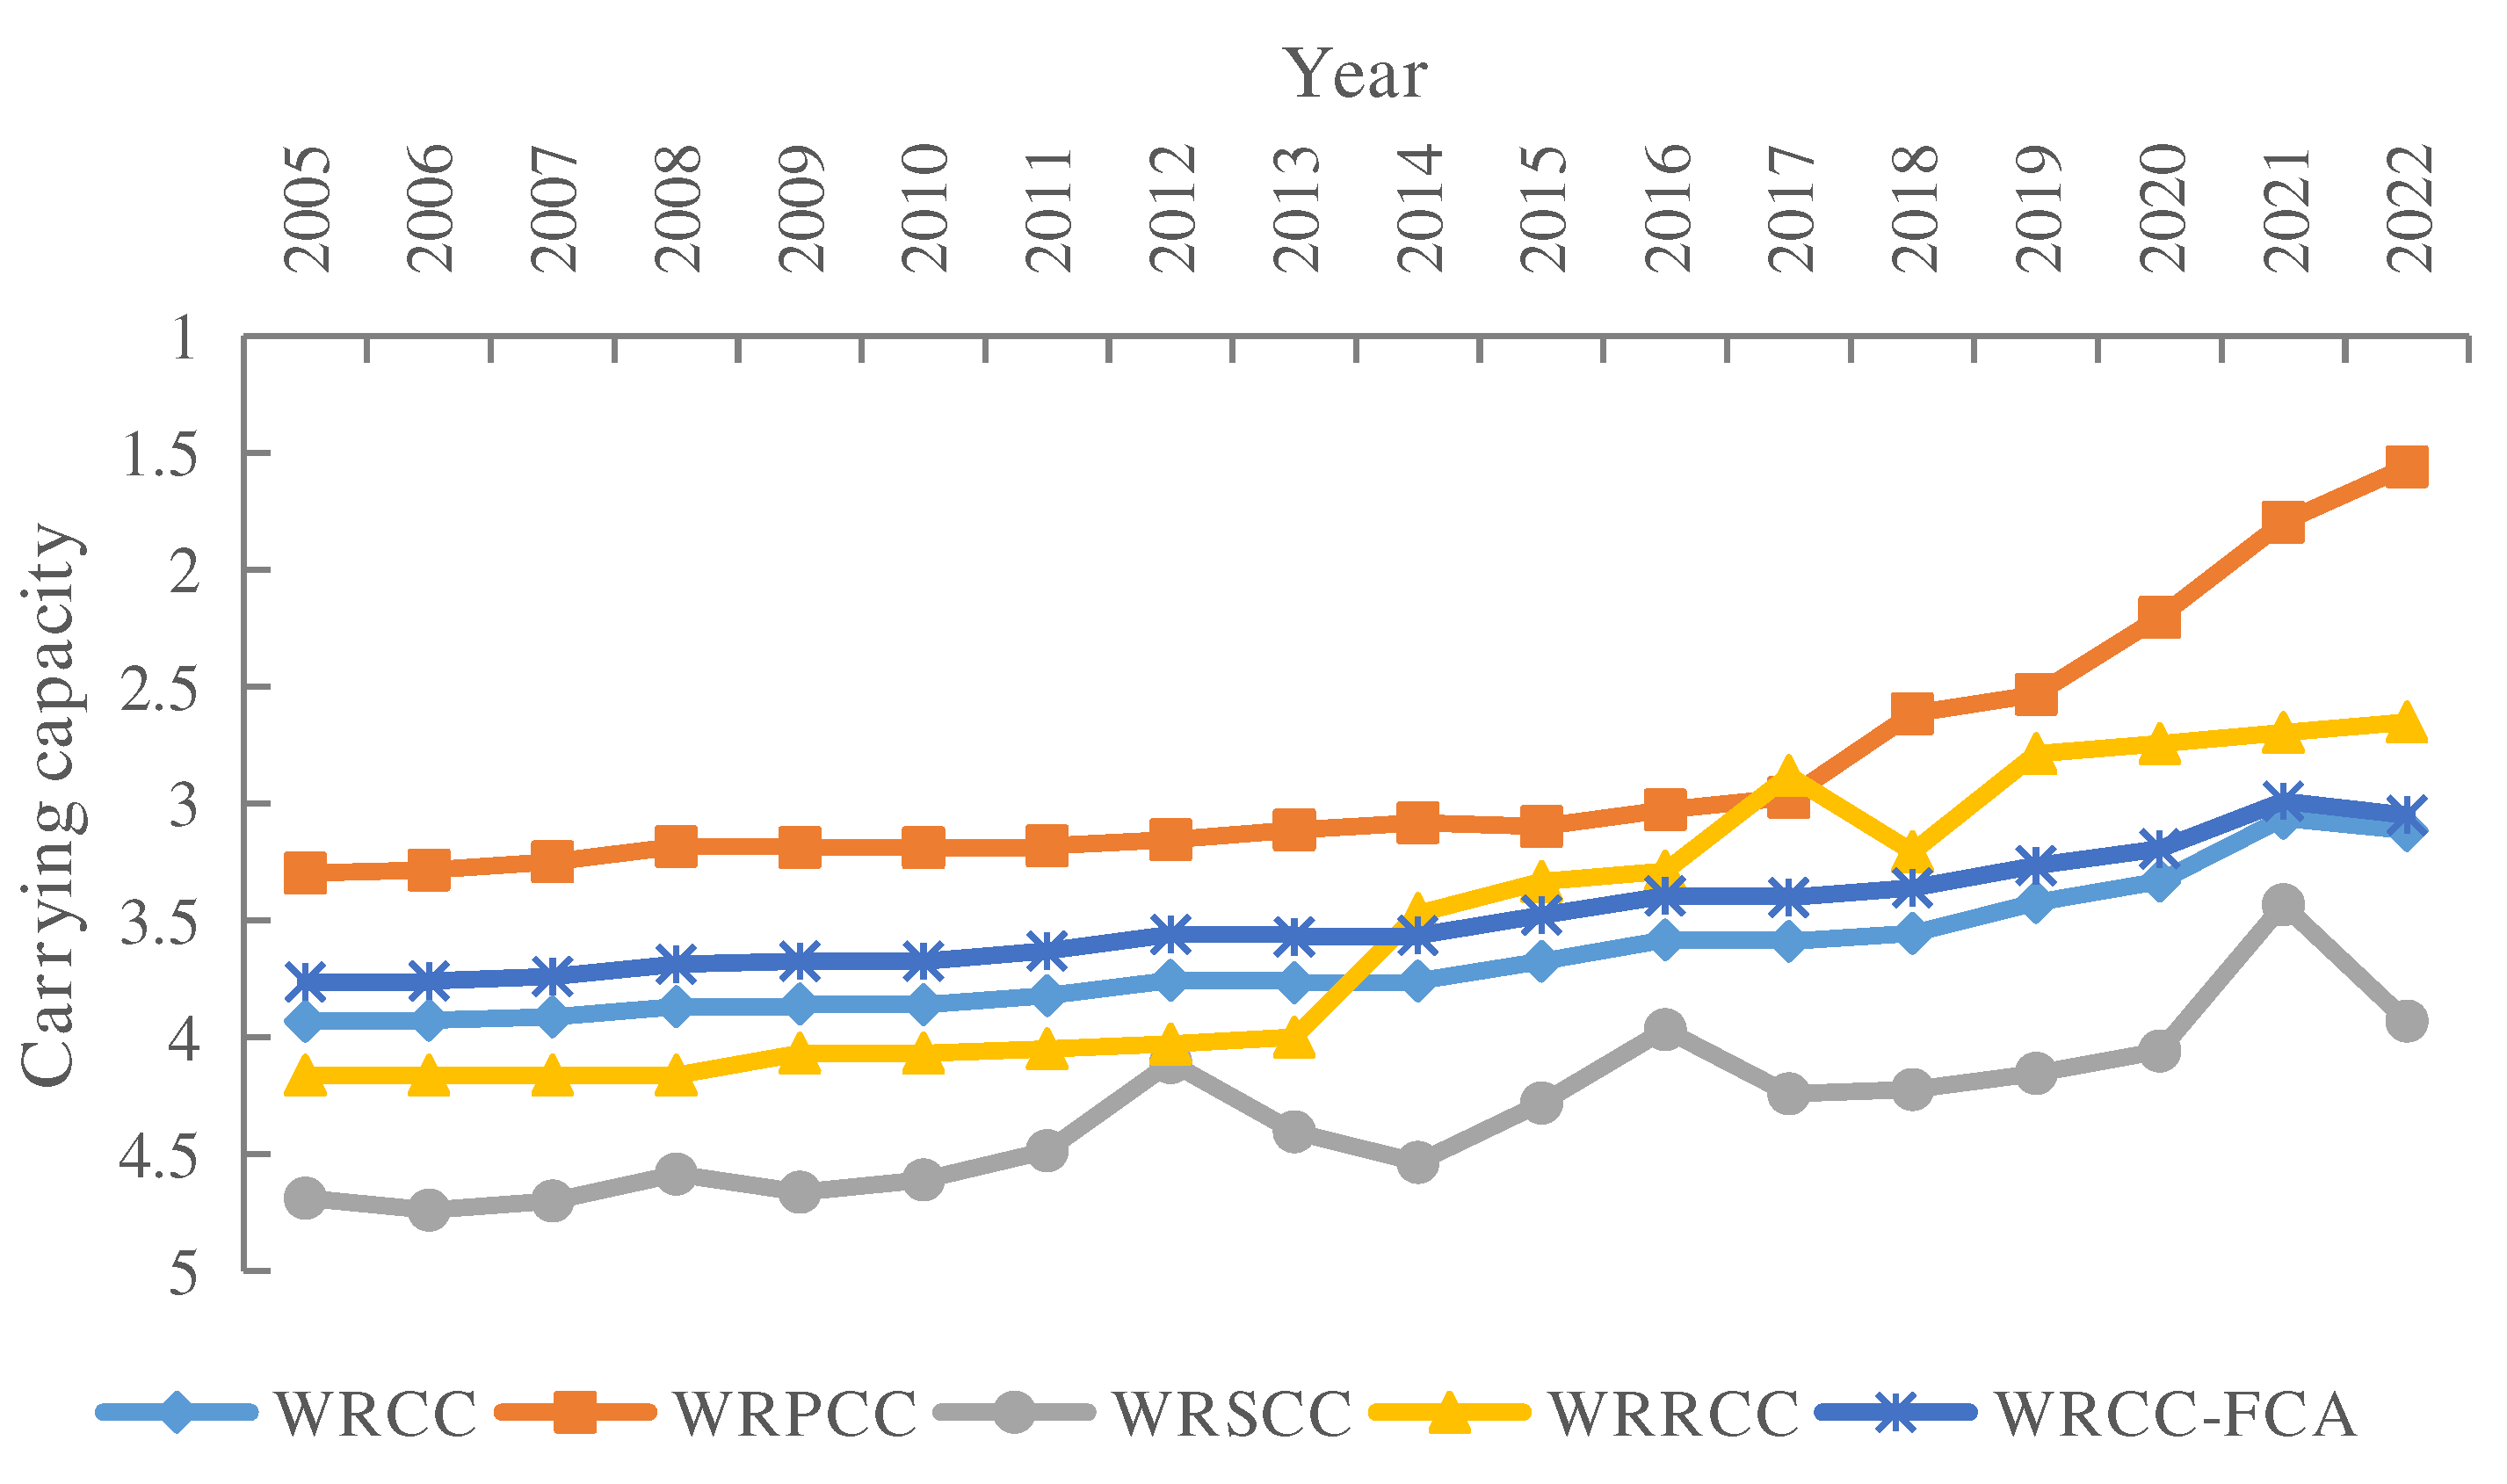
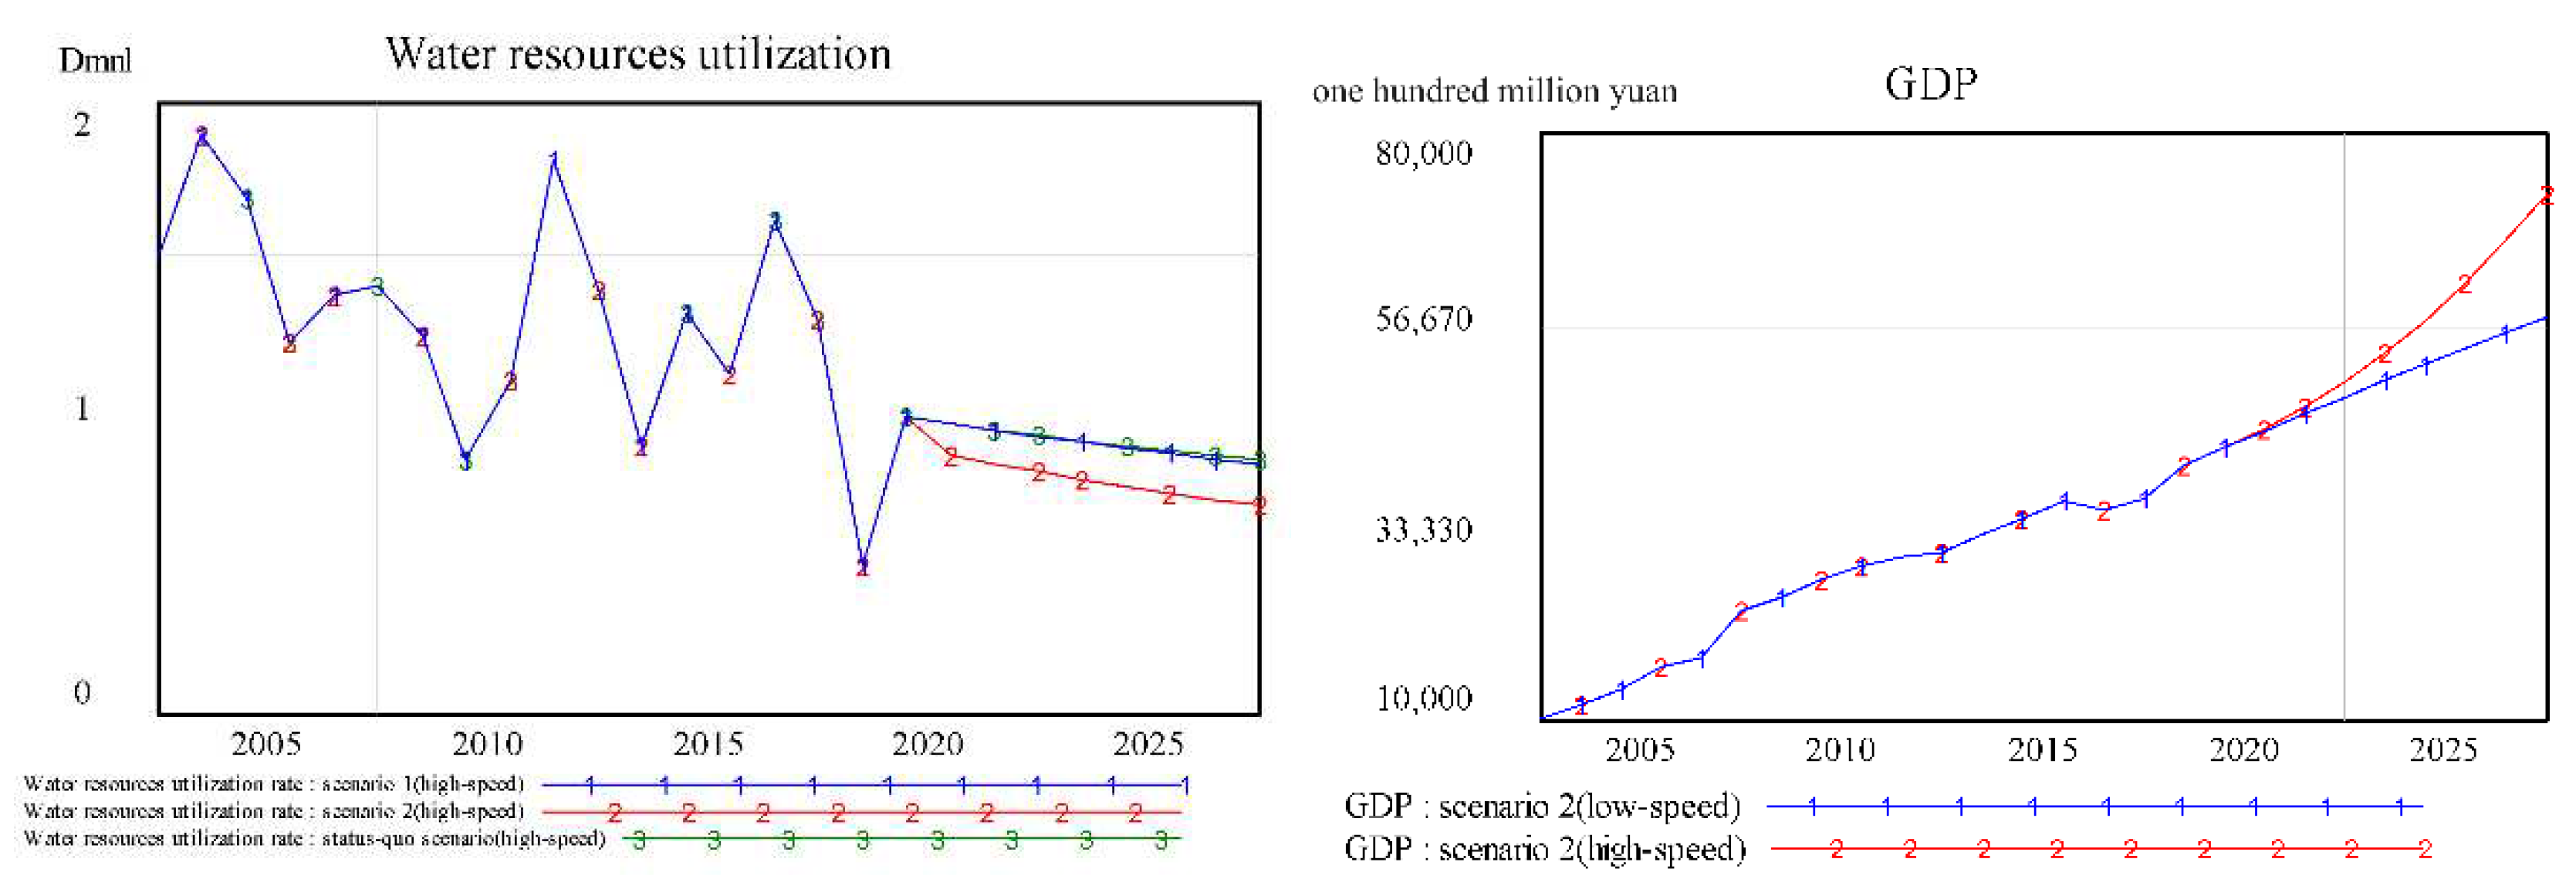
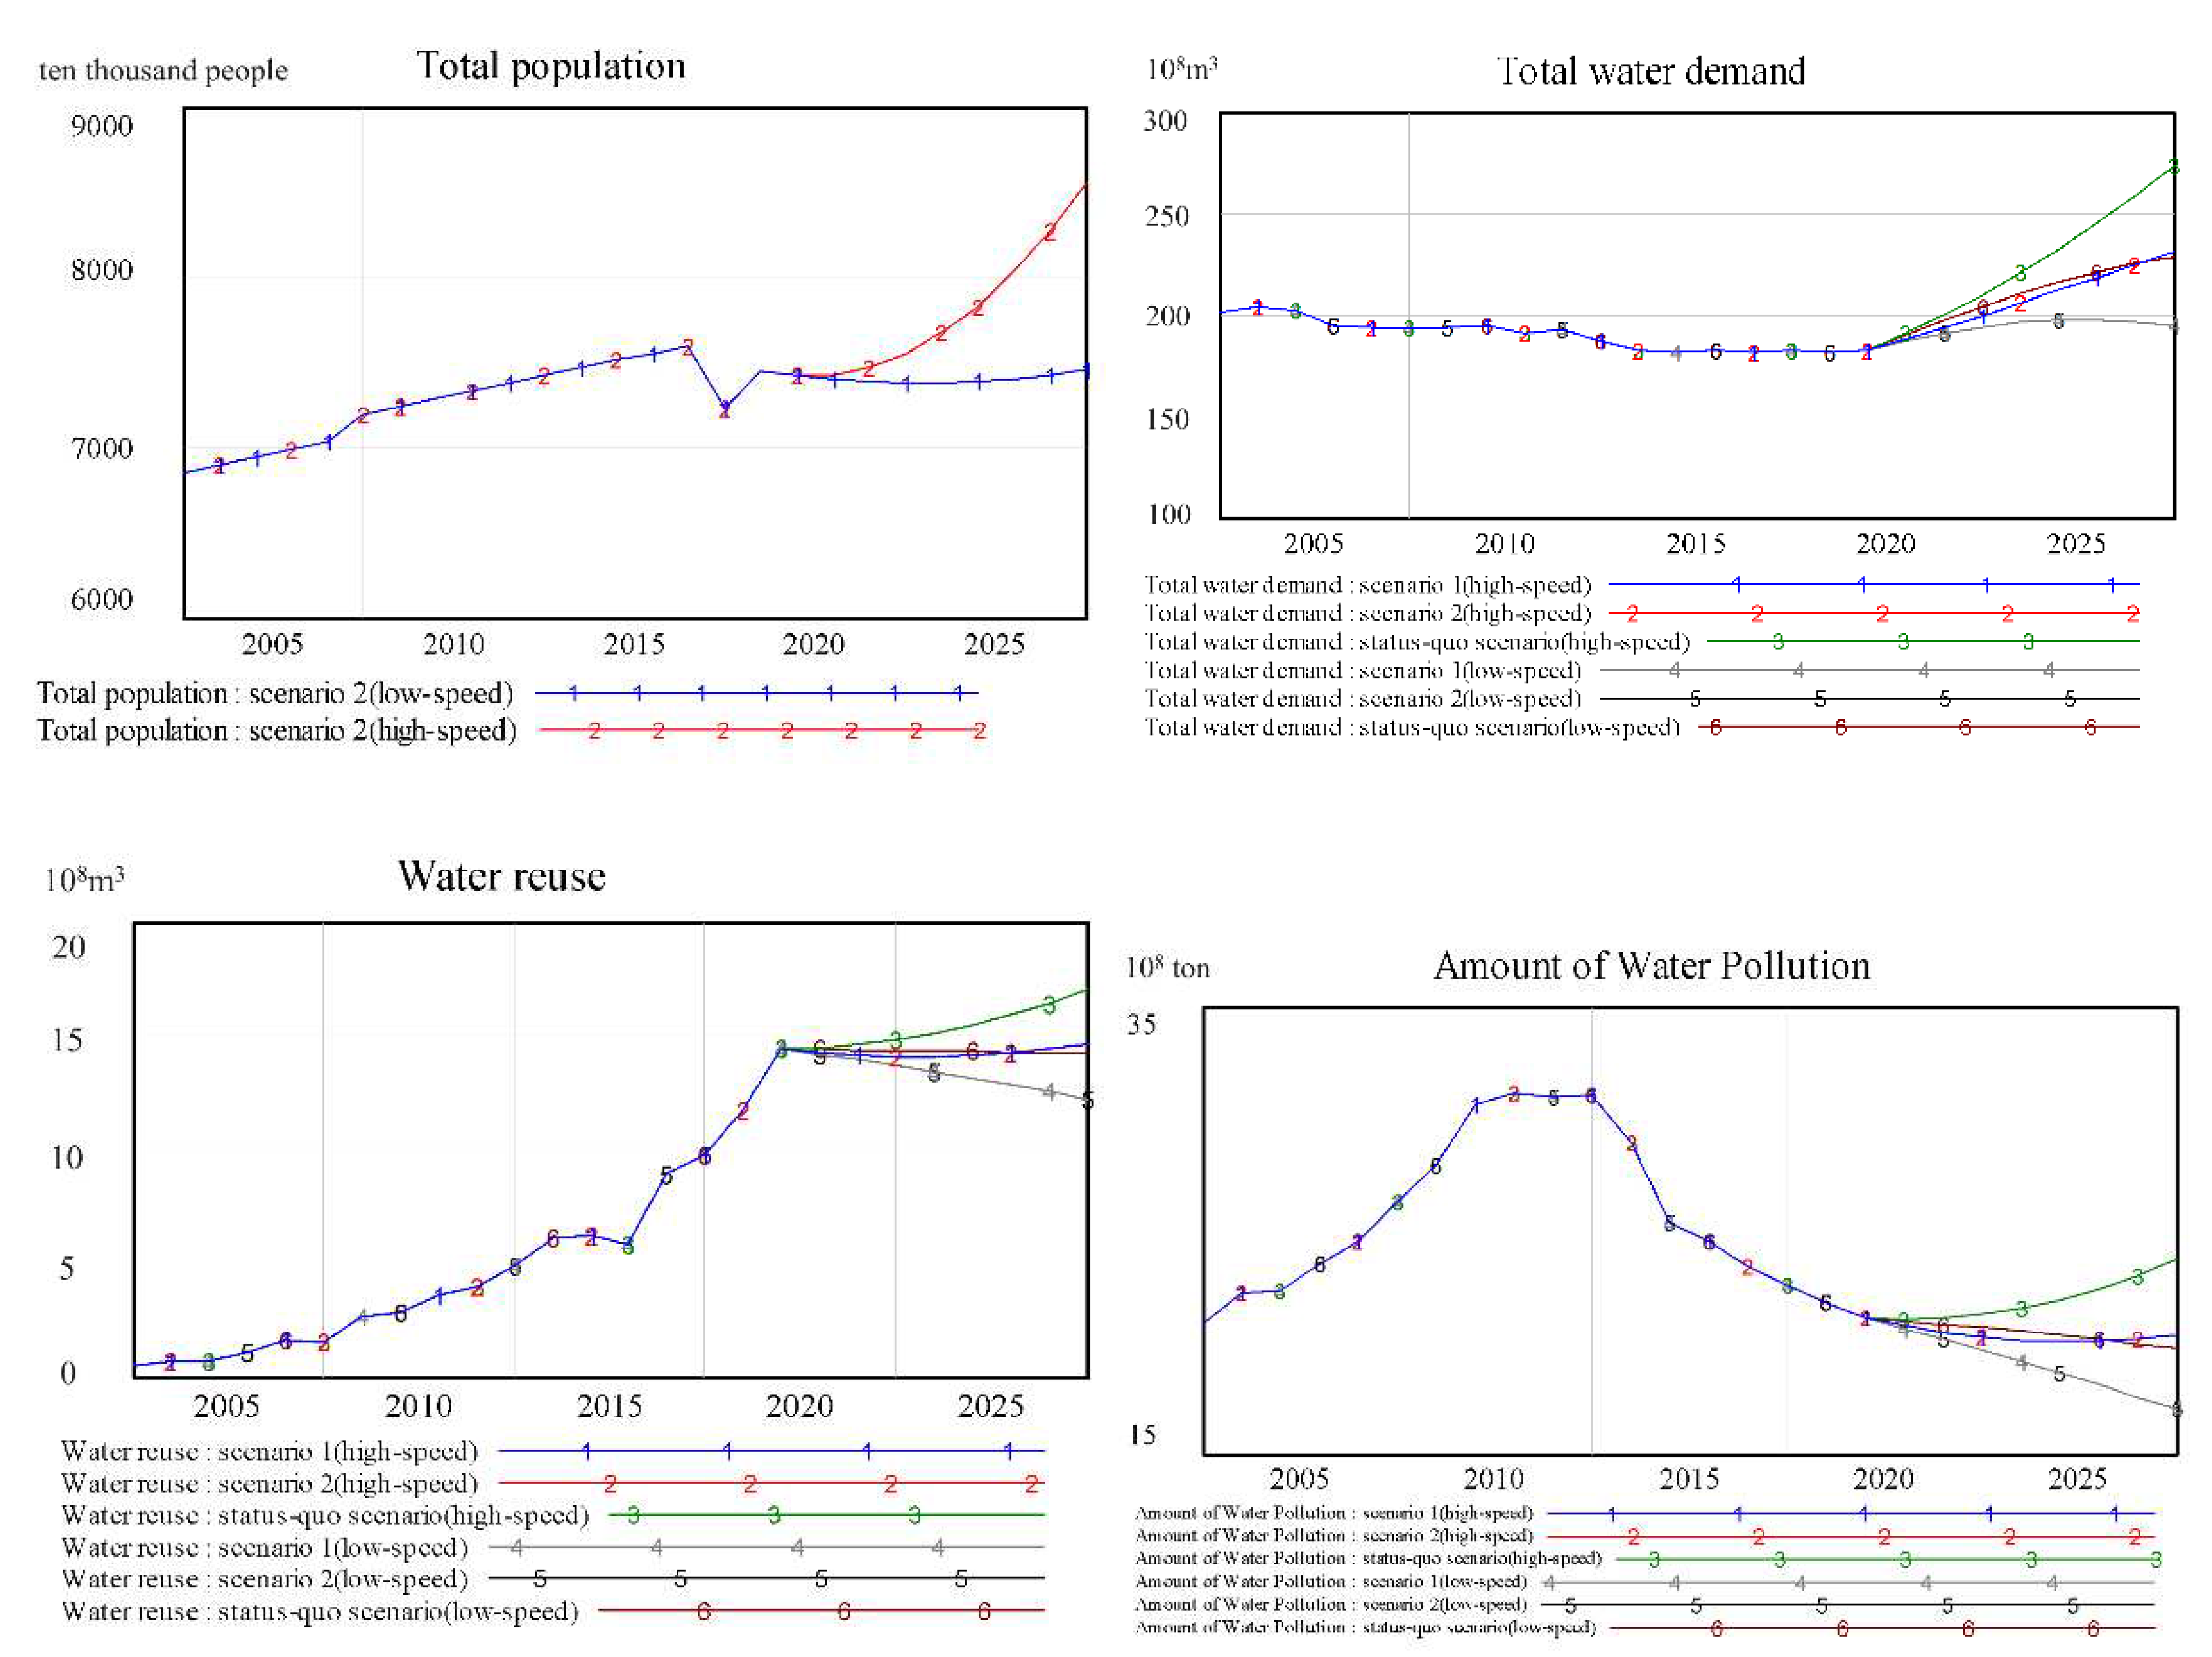
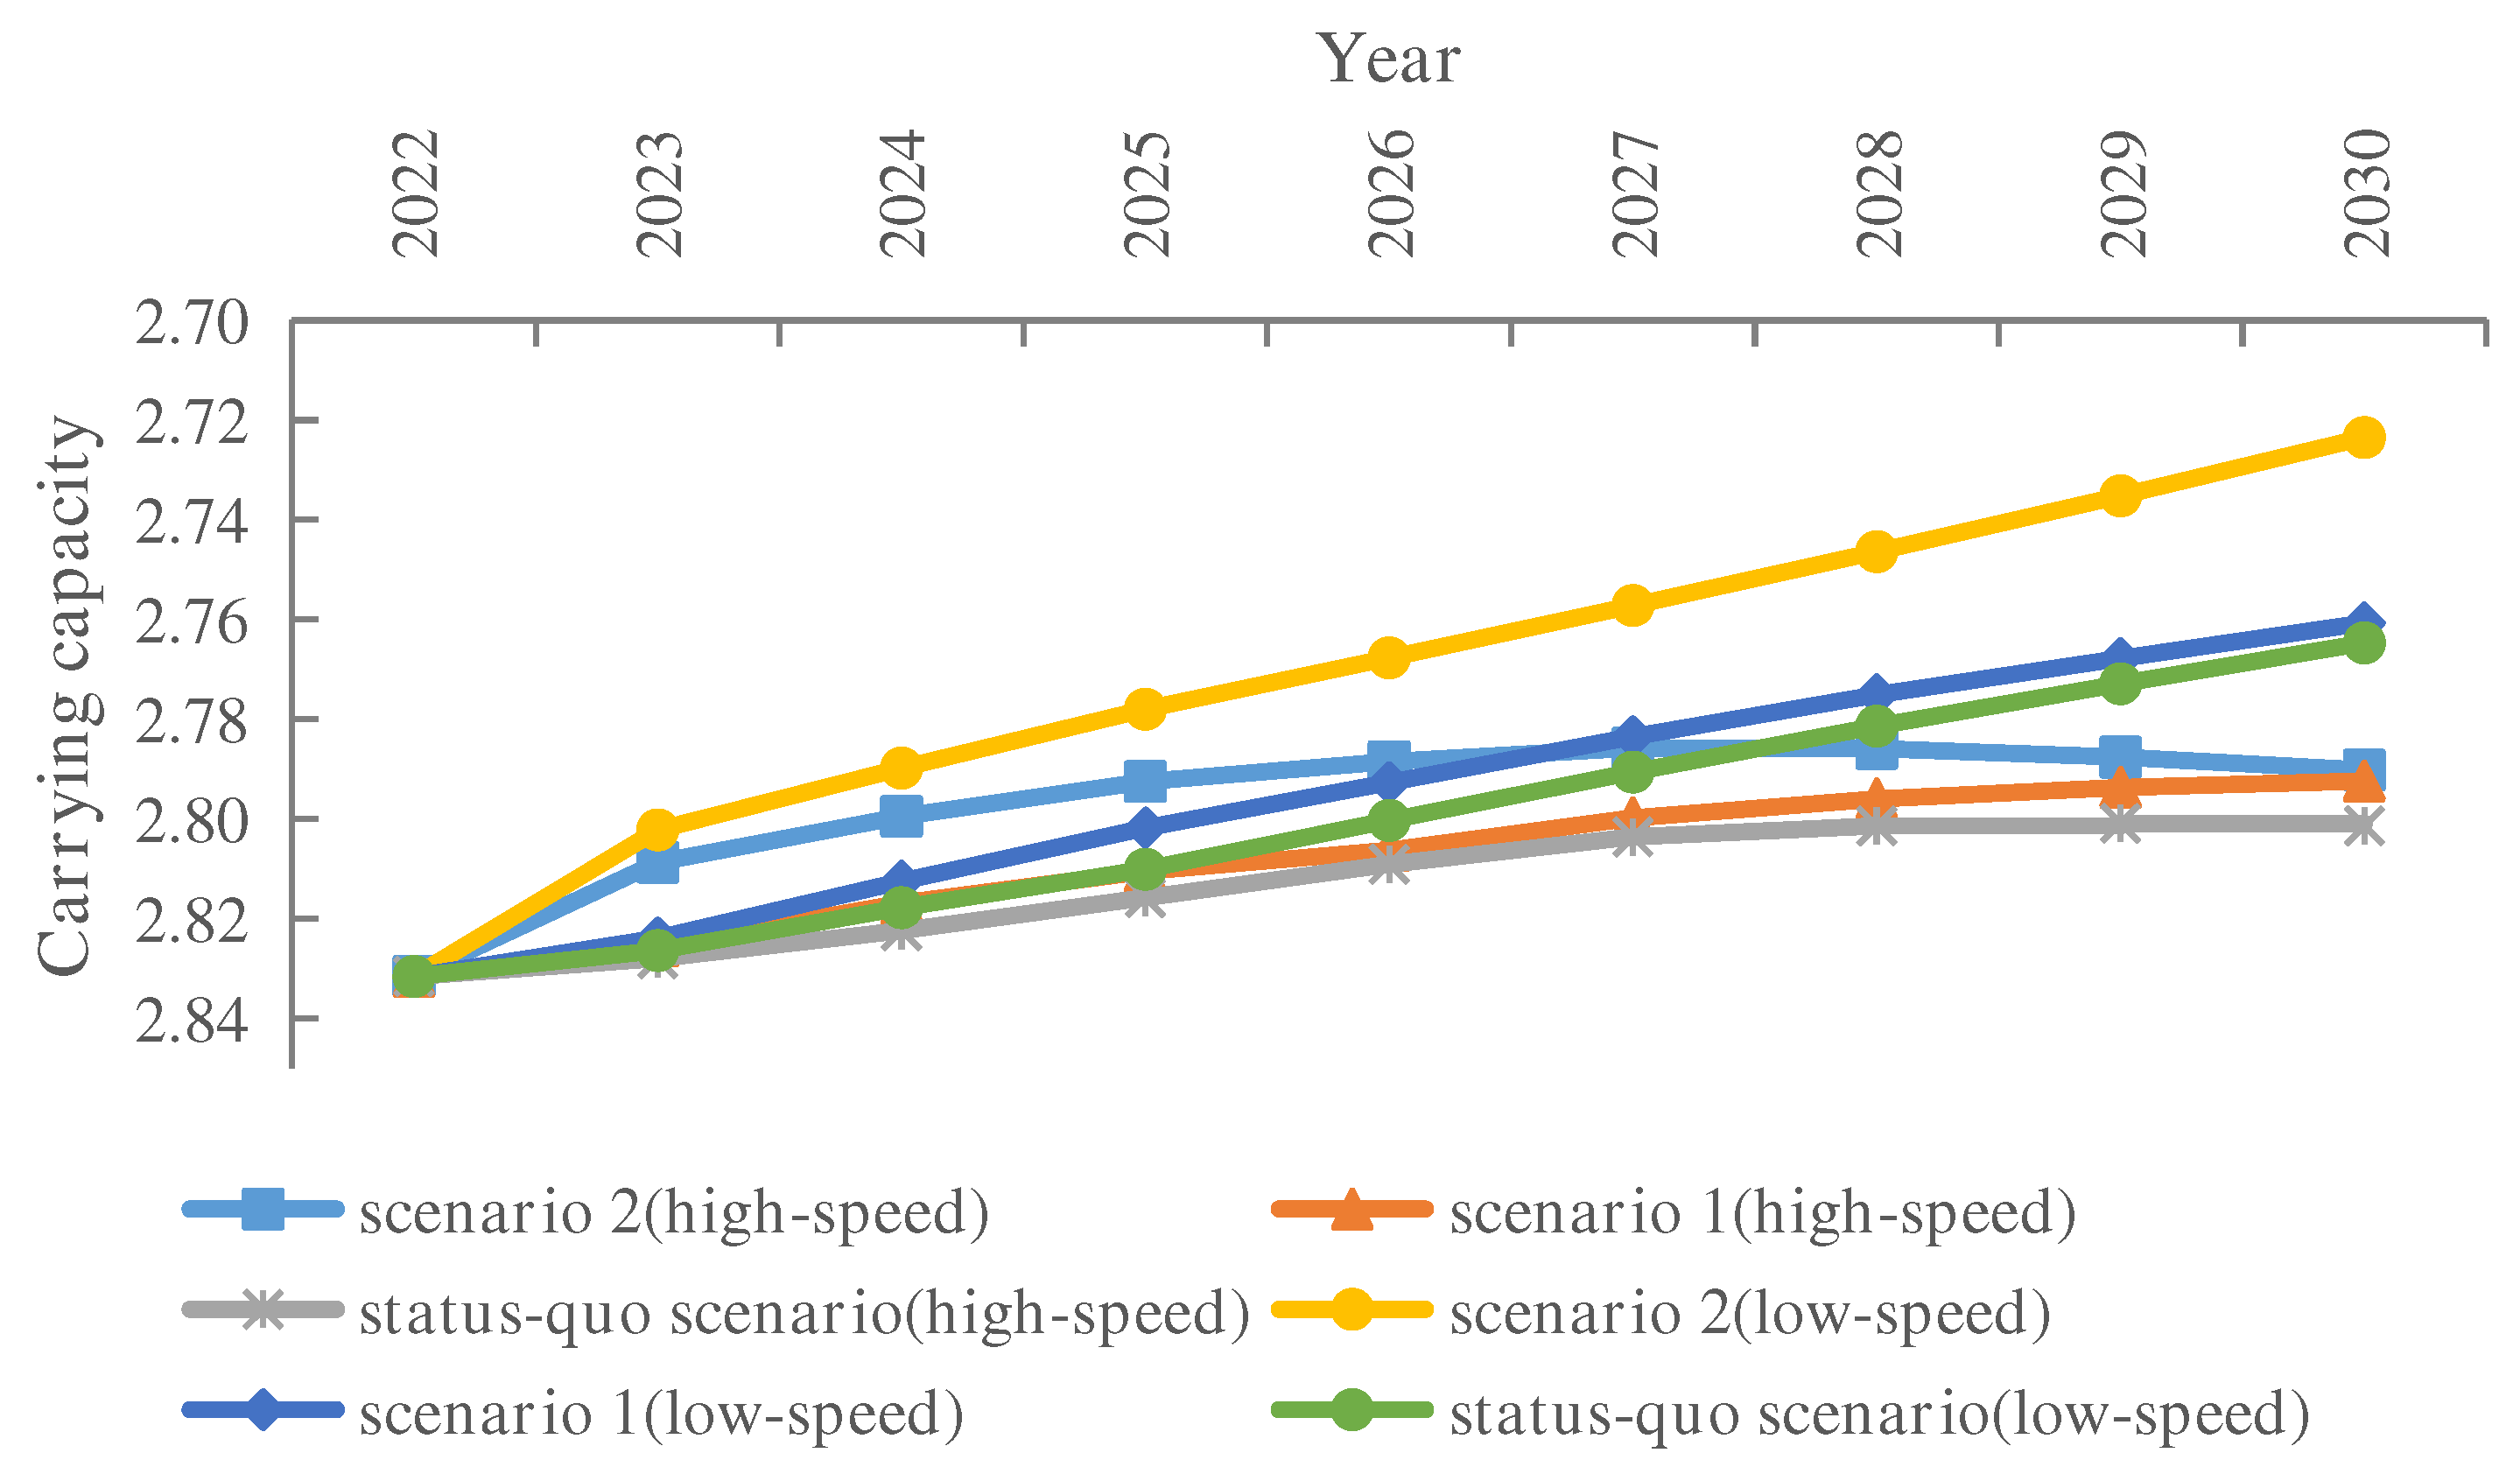
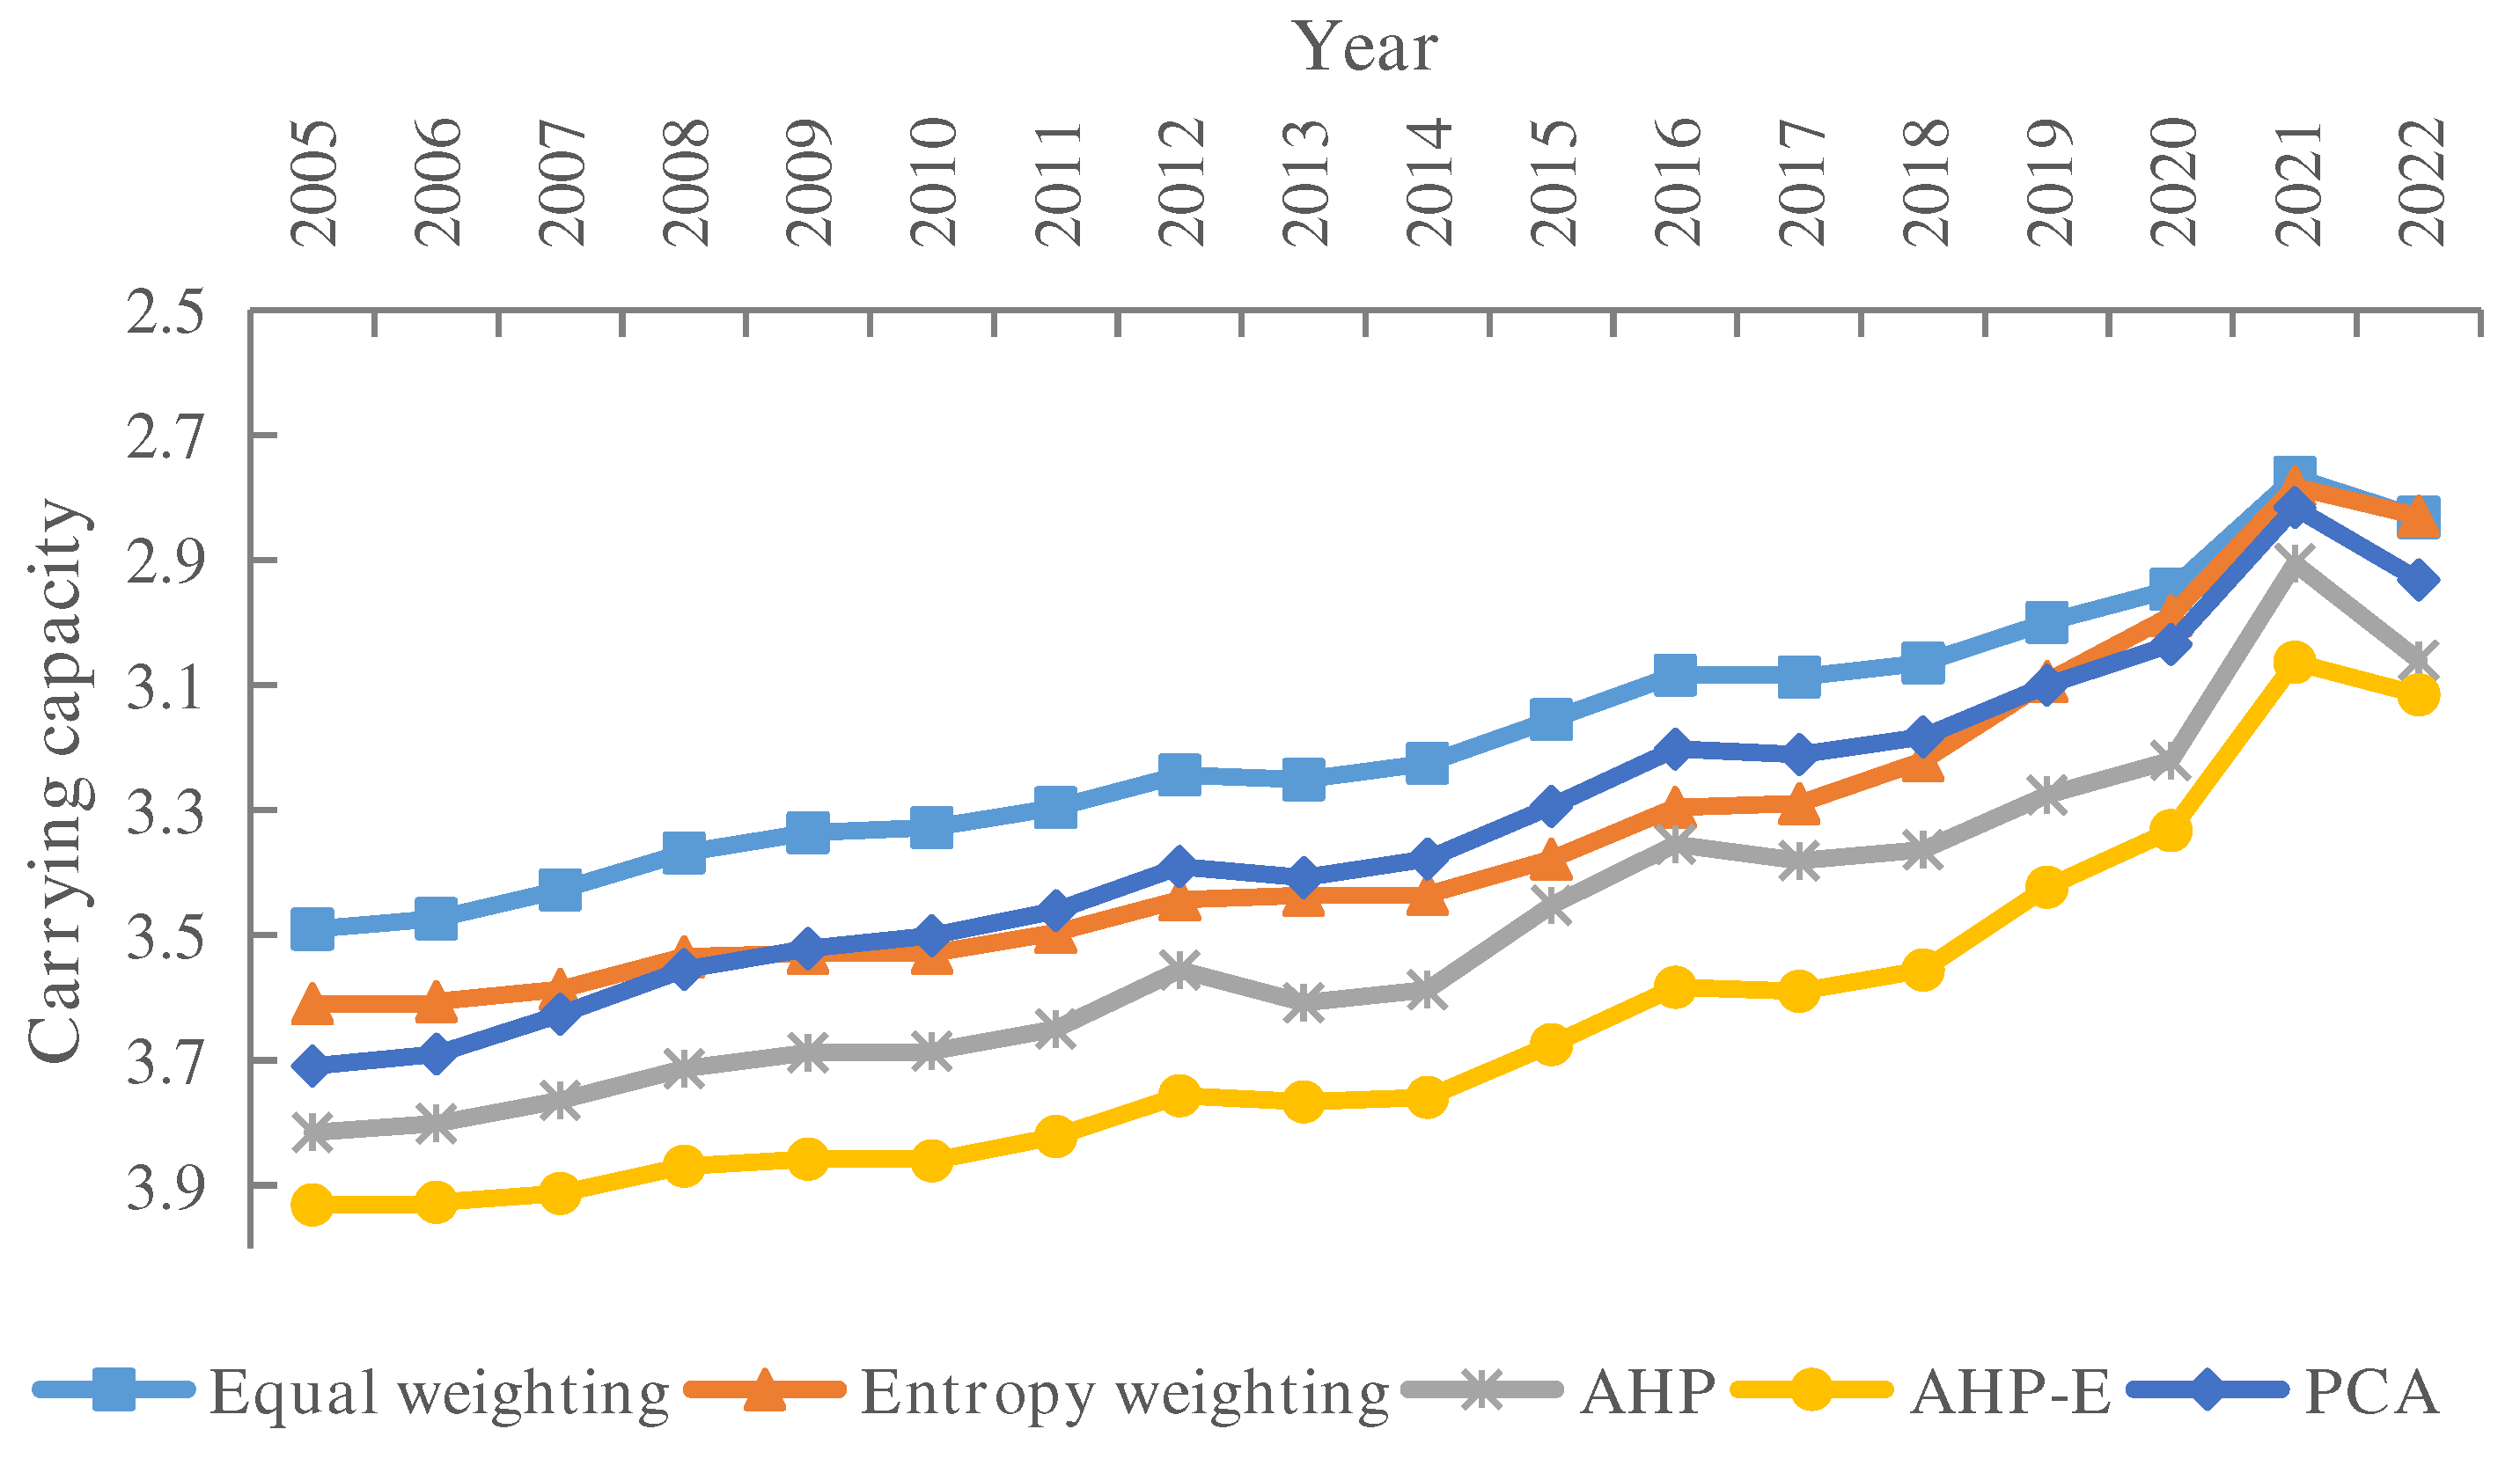
| Indicator system | Grades | |||||
|---|---|---|---|---|---|---|
| Subsystems | Indicators | 1 | 2 | 3 | 4 | 5 |
| WRPCC (Pressure) | Population density (PER/km2 , X1) | 10 | 100 | 300 | 600 | 1000 |
| Water consumption per capita (m3/PER, X2) | 200 | 300 | 400 | 600 | 900 | |
| Per capita ecosystem water use(m3/PER, X3) | 50 | 20 | 10 | 5 | 3 | |
| Water consumption intensity of GDP (m3/104 Yuan, X4) | 80 | 110 | 250 | 600 | 700 | |
| Ratio of water consumption(%, X5) | 50 | 60 | 65 | 70 | 80 | |
| Wastewater discharge of GDP (m3/104 Yuan, X6) | 7 | 10 | 15 | 20 | 30 | |
| WRSCC(State) | Modulus of water production (104 m³/km2) | 120 | 90 | 50 | 10 | 5 |
| Water resources per capita (m3/PER, X8) | 5000 | 3000 | 2000 | 1000 | 500 | |
| Annual precipitation (mm, X9) | 1600 | 800 | 600 | 400 | 200 | |
| Exploitation and utilization ratio of water resources (%, X10) | 10 | 20 | 40 | 60 | 100 | |
| Ratio of groundwater to water supply(%, X11) | 5 | 20 | 30 | 40 | 50 | |
| Ratio of water supply from other water resources(%, X12) | 5 | 2.5 | 1 | 0.5 | 0.1 | |
| WRRCC (Response) | Ratio of Wastewater treatment (%, X13) | 90 | 80 | 70 | 65 | 60 |
| Ratio of investment in environmental pollution control to GDP (%, X14) | 3 | 2 | 1 | 0.75 | 5 | |
| Ratio of municipal wastewater treatment reuse (%, X15) | 30 | 20 | 15 | 10 | 5 | |
| Forest coverage (%, X16) | 40 | 30 | 25 | 20 | 10 | |
| Name | Unit | Equations |
|---|---|---|
| GDP | 108 yuan | = Value added of agriculture+Value added of industry+Value added of services |
| Value added in agriculture | 108 yuan | = INTEG(Value added of agriculture×Growth rate of agricultural value added,Initial value of agricultural value added) |
| Agricultural water demand | 108 m3 | =Water consumption of 10,000 yuan of agricultural value added×Value added in agriculture/10000 |
| Value added of industry | 108 yuan | = INTEG(Value added of industry×Growth rate of value added in industry,Initial value of industry value added) |
| Industrial water demand | 108 m3 | =Water consumption of 10,000 yuan of industrial added value×Value added of industry/10000 |
| Industrial wastewater discharge | 108 ton | =Industrial wastewater discharge factor×Industrial water demand |
| Industrial wastewater COD emissions | 104 ton | =COD emission factor for industrial wastewater×Industrial wastewater discharge |
| Value added of services | 108 yuan | = INTEG(Value added of services×Growth rate of value added in services,Initial value of services value added) |
| Total population | 104 people | = INTEG(Total population×Population growth rate,Initial value of population) |
| Urban population | 104 people | =Total population×Urbanization rate |
| Domestic water demand | 108 m3 | =Urban population×Per capita urban domestic water consumption/10000 |
| Domestic sewage discharge | 108 ton | =Domestic sewage discharge factor×Domestic water demand |
| Domestic wastewater COD emissions | 104 ton | =COD emission factor for domestic sewage×Domestic sewage discharge |
| Total water demand | 108 m3 | =Production water demand+Ecological water demand+Domestic water demand |
| Production water demand | 108 m3 | =Agricultural water demand+Industrial water demand+Water demand in the service sector |
| Total water supply | 108 m3 | =Surface water+Underground water+Water reuse+Interregional water transfer |
| Water supply-demand ratio | dmnl | =Total water supply/Total water demand |
| GDP per capita | 104 yuan | =GDP/Total population |
| Amount of Water Pollution | 108 ton | =Industrial wastewater discharge+Domestic sewage discharge+Sewage discharges from the service sector |
| Sewage treatment capacity | 108 ton | =Amount of water pollution×Sewage treatment rate |
| Water reuse | 108 m3 | =Sewage treatment capacity*Water reuse rate |
| Total effluent COD discharge | 104 ton | =Industrial wastewater COD emissions+Domestic wastewater COD emissions |
| Weight of indicators | ||||||||||||||||
|---|---|---|---|---|---|---|---|---|---|---|---|---|---|---|---|---|
| Weighting methodology | X1 | X2 | X3 | X4 | X5 | X6 | X7 | X8 | X9 | X10 | X11 | X12 | X13 | X14 | X15 | X16 |
| Entropy weight | 0.069 | 0.044 | 0.140 | 0.024 | 0.036 | 0.027 | 0.091 | 0.082 | 0.054 | 0.036 | 0.121 | 0.091 | 0.033 | 0.093 | 0.058 | 0.069 |
| AHP | 0.045 | 0.045 | 0.045 | 0.045 | 0.023 | 0.045 | 0.061 | 0.061 | 0.035 | 0.123 | 0.146 | 0.073 | 0.106 | 0.057 | 0.057 | 0.045 |
| AHP-E | 0.046 | 0.029 | 0.093 | 0.016 | 0.012 | 0.018 | 0.081 | 0.073 | 0.028 | 0.065 | 0.261 | 0.098 | 0.052 | 0.078 | 0.048 | 0.046 |
| Equal weighting | 0.063 | 0.063 | 0.063 | 0.063 | 0.063 | 0.063 | 0.063 | 0.063 | 0.063 | 0.063 | 0.063 | 0.063 | 0.063 | 0.063 | 0.063 | 0.063 |
| PCA | 0.067 | 0.042 | 0.073 | 0.072 | 0.015 | 0.071 | 0.074 | 0.071 | 0.072 | 0.079 | 0.074 | 0.075 | 0.072 | 0.001 | 0.077 | 0.064 |
| Time | Total Population (10,000 Capita) | GDP (100 million) | Total Water demand (108 m3) | Amount of Water Pollution (104 ton) | ||||||||
|---|---|---|---|---|---|---|---|---|---|---|---|---|
| Historical Data | Simulated Data | Error (%) | Historical Data | Simulated Data | Error (%) | Historical Data | Simulated Data | Error (%) | Historical Data | Simulated Data | Error (%) | |
| 2005 | 6851 | 6851 | 0.000 | 10096 | 10096 | 0.000 | 202 | 202 | -0.058 | 20.8 | 20.9 | -0.189 |
| 2006 | 6898 | 6898 | 0.000 | 11661 | 11660 | 0.001 | 204 | 204 | -0.036 | 22.1 | 22.2 | -0.398 |
| 2007 | 6943 | 6943 | 0.000 | 13710 | 13710 | 0.001 | 202 | 203 | -0.060 | 22.2 | 22.3 | -0.224 |
| 2008 | 6989 | 6989 | 0.000 | 16189 | 16189 | 0.001 | 195 | 195 | -0.124 | 23.4 | 23.5 | -0.288 |
| 2009 | 7034 | 7034 | 0.000 | 17236 | 17235 | 0.000 | 194 | 194 | -0.075 | 24.4 | 24.5 | -0.348 |
| 2010 | 7194 | 7194 | 0.001 | 22825 | 22825 | 0.000 | 194 | 194 | -0.038 | 26.2 | 26.3 | -0.357 |
| 2011 | 7241 | 7241 | 0.000 | 24516 | 24516 | 0.001 | 194 | 194 | -0.023 | 27.8 | 27.9 | -0.283 |
| 2012 | 7288 | 7288 | 0.000 | 26575 | 26575 | 0.001 | 195 | 195 | -0.122 | 30.5 | 30.6 | -0.346 |
| 2013 | 7333 | 7333 | 0.000 | 28302 | 28301 | 0.001 | 191 | 191 | -0.078 | 31.0 | 31.1 | -0.346 |
| 2014 | 7384 | 7384 | -0.001 | 29422 | 29421 | 0.001 | 193 | 193 | -0.081 | 30.9 | 31.0 | -0.405 |
| 2015 | 7425 | 7425 | -0.001 | 29806 | 29806 | 0.001 | 187 | 187 | -0.085 | 31.0 | 31.1 | -0.344 |
| 2016 | 7470 | 7470 | -0.001 | 32071 | 32070 | 0.001 | 182 | 183 | -0.095 | 28.8 | 28.9 | -0.352 |
| 2017 | 7520 | 7520 | -0.001 | 34017 | 34016 | 0.001 | 181 | 182 | -0.091 | 25.3 | 25.4 | -0.303 |
| 2018 | 7556 | 7556 | -0.001 | 36011 | 36010 | 0.001 | 182 | 182 | 0.009 | 24.4 | 24.5 | -0.375 |
| 2019 | 7592 | 7592 | -0.002 | 35105 | 35105 | 0.001 | 182 | 182 | -0.091 | 23.3 | 23.4 | -0.334 |
| 2020 | 7232 | 7232 | -0.002 | 36208 | 36207 | 0.002 | 183 | 183 | -0.079 | 22.4 | 22.5 | -0.318 |
| 2021 | 7448 | 7448 | -0.001 | 40392 | 40391 | 0.002 | 182 | 182 | -0.102 | 21.7 | 21.7 | -0.329 |
| 2022 | 7420 | 7420 | -0.002 | 42371 | 42370 | 0.002 | 182 | 182 | -0.086 | 21.0 | 21.1 | -0.360 |
Disclaimer/Publisher’s Note: The statements, opinions and data contained in all publications are solely those of the individual author(s) and contributor(s) and not of MDPI and/or the editor(s). MDPI and/or the editor(s) disclaim responsibility for any injury to people or property resulting from any ideas, methods, instructions or products referred to in the content. |
© 2023 by the authors. Licensee MDPI, Basel, Switzerland. This article is an open access article distributed under the terms and conditions of the Creative Commons Attribution (CC BY) license (http://creativecommons.org/licenses/by/4.0/).


