1. Introduction
Conventional radio-frequency particle accelerators can only achieve acceleration gradients that are approximately 100 MeV/m, primarily due to issues related to breakdown phenomena. To surpass this boundary, a range of advanced acceleration techniques has been introduced in various stages of development within the field of accelerator physics. Among these innovative approaches, plasma wakefield acceleration (PWFA) is recognized as a standout contender. The unique properties of plasma medium inherently resistant to breakdown issue, which utilizes waves excited by an intense drive beam. In turn, these waves are exploited for the acceleration of a trailing beam. Remarkably, acceleration gradients exceeding 50 GeV/m have already been demonstrated by PWFA, as reported in [
1]. PWFAs have already demonstrated high acceleration efficiency [
2], as well as emittance preservation [
3]. The potential of PWFA applications is now being deeply explored by the global research community, leading to the commissioning of significant facilities dedicated to PWFA research [
4,
5,
6].
The potential for high-energy particle acceleration is inherent in PWFA, allowing for efficient high-gradient acceleration and the potential reduction of costs associated with achieving high energies in particle accelerators. A new experimental facility at SLAC, known as FACET-II, has the primary objective of studying plasma acceleration, beam plasma interactions, and novel light sources. When an intense driver beam is employed, the radial fields attain sufficient strength to expel all electrons, which are subsequently attracted back on-axis due to the restoring forces of the plasma, resulting in the formation of an electron-free ion column behind the driver bunch. This ion column is responsible for the emergence of characteristic uniform focusing and accelerating fields [
7]. The significance of the blowout regime lies in its capacity to provide high accelerating gradients and fields. Furthermore, it facilitates the diagnosis of beam parameters from the spectral and angular distribution of the betatron radiation, which encodes information about the beam-plasma interaction [
8,
9,
10,
11].
Under conditions where ≫, the plasma electron response becomes highly nonlinear, resulting in the attainment of relativistic electron velocities, an amplitude-dependent period, and the development of a large wave-breaking spike at the conclusion of the initial oscillation. The behavior of electrons within the plasma blowout regime is significantly influenced by the properties of the driving particle beam, including its energy, intensity, profile, spot size, and density distribution. Perturbations in these parameters can lead to variations in the oscillatory motion of electrons, thereby impacting the frequency, amplitude, and phase of their trajectories. The trajectory characteristics exert an influence on the betatron radiation spectrum, encompassing the range of frequencies emitted by the oscillating electrons.
In a broader context, the high-energy X-ray and -ray detector systems will have the capability to provide simultaneous angular and spectral flux information concerning the betatron radiation produced by electron beams as they traverse plasma on a shot-by-shot basis. Additionally, this system can be employed to detect deviations from ideal focusing conditions in the plasma, which may arise from ion collapse, posing a potentially severe challenge for linear collider beams in a PWFA.
This paper is organized as follows: In
Section 2, efforts have been undertaken to expand the functionality of the Positron-Electron Detector for Radiative Observations (PEDRO) as a more effective diagnostic tool. In
Section 3, the effects of perturbed beams on betatron radiation are presented through the results of PIC simulations. In
Section 4, the novel spectrometer currently being tested at UCLA is discussed. Finally, in
Section 5, the implications of our research for experiments at FACET-II and future plasma-based linear colliders are discussed.
2. Multi-shot radiation diagnostic
The software enabling the measurement of an incoming photon energy distribution with the PEDRO spectrometer has been equipped. In previous work [
6,
12,
13,
14], a comparison was made between QR Decomposition, Machine Learning, and a Maximum Likelihood Estimation-ML hybrid as potential methods of reconstruction. However, it was assumed in the research that the entire photon distribution could be measured in a single shot.
Future efforts are directed towards expanding the functionality of PEDRO to enable the measurement of multiple shots for the more effective measurement of incoming photon energy distributions. This approach involves taking multiple measurements or shots of the radiation over a series of observations or experiments and then using these data points to reconstruct and analyze the radiation spectrum. Upon completion of this expansion, PEDRO will operate as a more effective diagnostic tool.
To initiate this process, a new model for photon spatial distribution based on energy was proposed, as shown in
Figure 1. Photons in various energy ranges were assumed to be followed by a Gaussian distribution, with the spread inversely correlated to the photon energy. Subsequently, using an arbitrary gamma energy distribution, 201 energy subdistributions were created employing the proposed spatial distribution model. Each energy subdistribution was an energy distribution at an equally spaced interval along PEDRO’s offset axis. The design of the energy subdistributions ensured that those closer to a 0 mm offset had higher counts of low-energy photons, while energy subdistributions that were further offset (on either side) tended to have more high-energy photons.
Subsequently, 21 energy subdistributions (representing 10%) were chosen for reconstructive analysis from 201 energy subdistributions. These selected 21 energy subdistributions comprised 64 numbers, each corresponding to the frequency of photons in one of the 64 energy bins. Using the response matrix
, the energy subdistributions were transformed into PEDRO responses, and for the sake of simplicity, they were recovered through QR decomposition. From these reconstructed data, a calculated spatial distribution was extracted for each of the 64 energy bins. Each calculated spatial distribution consisted of 21 elements, representing the shots or selected energy subdistributions. These elements were subsequently plotted at evenly spaced intervals ranging from -10 mm to 10 mm offset. An illustrative example can be observed in the left graph of
Figure 1.
Subsequently, the calculated spatial distributions were integrated over the offset axis to derive an estimation of the actual number of photons present in each of the 64 energy bins. Due to the discrete nature of the calculated spatial distributions, trapezoidal Riemann sums were employed instead of the traditional Riemann integral method. The vector comprising the 64 integrals was then regarded as the attempted multi-shot reconstruction.
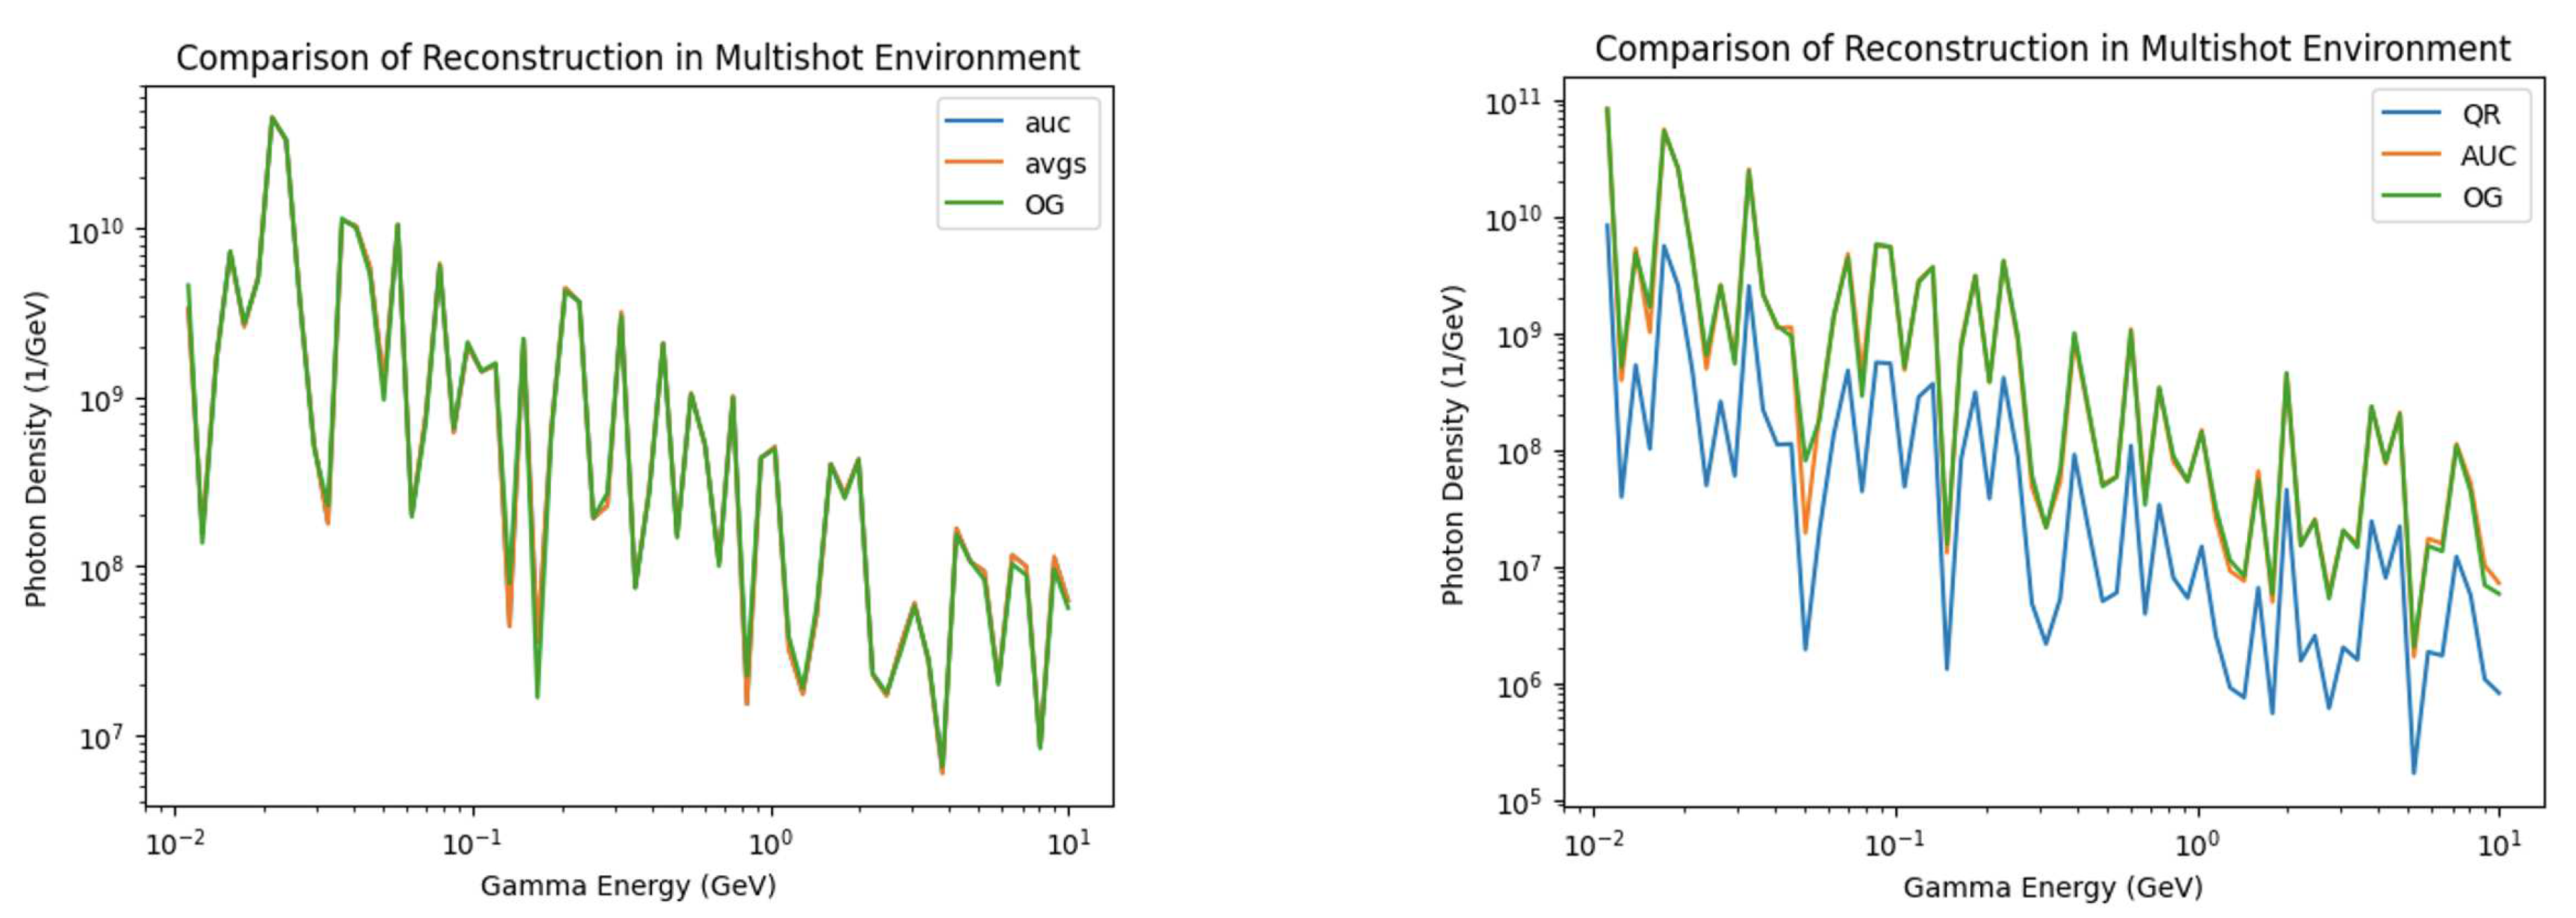
The reconstructions were compared against the true gamma distribution, as depicted in
Figure 2, and consistently, an error ranging from 7-12 % was observed when using this new Riemann sum method. It was consistently noted that the method tended to underestimate the number of photons in each of the bins. This outcome was anticipated, considering that the procedure relied on PEDRO operating with incomplete information. However, the relatively low error rate observed is promising and suggests the need for testing against experimental data (rather than solely synthesized data) to verify the method’s generalizability.
Both the spatial model for photons and the reconstruction method could benefit from further modifications. In the case of the photon spatial distribution model, the consideration of non-Gaussian stochastic distributions, such as skewed normal distributions, could be explored. Additionally, calculated spreads directly based on energy, as opposed to a simple linear calculation, might be worth investigating. Regarding the reconstruction method, the consistent underestimation observed could potentially be addressed through the utilization of a neural network trained on hundreds of arbitrary gamma distributions and their corresponding Riemann sum reconstructions. This approach could give rise to a new ML-Riemann sum hybrid method capable of achieving lower error rates. Lastly, the introduction of new data with noise is necessary to make the PEDRO reconstructions less pristine. This will serve to further assess the assumptions and capabilities of the Riemann sum method.
2.1. Deterministic Analysis
In scenarios where there is information about macro-particle dynamics, a deterministic algorithm can be used to determine how the photons will scatter along the offset axis. This model will allow for a consistent simulation of how the spectrometer will see incoming gamma energy distributions.
2.1.1. Photon Scattering Calculation
The energy (E), x-momentum (X’), y-momentum (Y’), and weight (or number of photons; W) of each macro-particle are relevant for this analysis. If the direction of forward motion for the photons is taken to be the z-axis, then their z-momenta can be represented by Z’. To determine where the macro-particles will be positioned at PEDRO’s offset axis, their
and
first need to be calculated.
If the z-momentum is taken to be standardized, then all Z’ = 1, which gives a direct method of computing the angular offsets from the momenta.
Once
and
are calculated, using the length of separation (L) between the IP and the detector, the x and y offsets can be calculated as follows:
2.1.2. Spectrum Reconstruction
The (x,y) coordinates allow for a prediction of where the macro-particles of different energies will intersect with PEDRO. Given that PEDRO has a detection tolerance of 0.5 mm (meaning at a given position, it can detect photons located 0.25 mm to the Be wire’s left and right), taking shots at intervals of 0.5 mm would be guaranteed to detect all photon scattering.
Since the offset of PEDRO is 10 mm to the left and right of the center, over a range of 20 mm, the spectrometer would need to take 40 shots to get maximal detection. Once the spectrum from each shot is obtained, converting them into corresponding gamma subdistributions will lead to the final phase of analysis.
Since each subdistribution would have no overlap in terms of detected photons, simply adding up the distributions will then yield the original gamma distribution. This analysis method also allows for detecting the overall angular offset of the photon beam.
2.1.3. Gamma Angular Shift
Higher energy photons experience the least amount of baseline angular variability, meaning that if the highest energy gammas of an incoming distribution are all systematically shifted, the photon beam must be fundamentally deflected. As such, each of the gamma subdistributions can be inspected to see which shot detected the highest energy photons along the offset axis.
Based on the shot with these gammas, rearranging Equation (
5) yields the overall beam deflection angle, which can then be used to determine more information about the initial interaction that gave rise to the photon beam.
3. Beam perturbation effects on betatron radiation
As high-energy particles interact,
radiation is emitted in a wide range of energies, aiding in the determination of the nature of the interacting particles. Gamma rays resulting from the betatron radiation process in under-dense plasma wakefields reveal unique experimental signatures that unveil interaction physics at challenging ultra-short spatial and temporal scales. The measurement of emittance inside the plasma, which conventional methods could not achieve, necessitates the development of new indispensable emittance diagnostic tools. In the numerical model for betatron radiation, macro particles are randomly sampled from the beam distribution and are tracked through focusing fields using a
order RK4 method. The particle trajectories are employed to numerically compute the radiation spectrum by integrating the Liénard–Wiechert (LW) potentials [
15].
Another method involves a electromagnetic Particle-in-Cell (PIC) code. The betatron radiation spectra, emitted by the intense electron beam, exhibit distinct signatures indicative of X-ray production. These photons are generated in the keV to GeV energy range, contributing to the unique characteristics of the radiation emissions. Understanding the influence of beam perturbations on betatron radiation is of paramount importance for applications such as advanced light sources, particle accelerators, and imaging techniques. Through the mitigation or control of beam perturbations, the quality and reliability of betatron radiation sources for various applications can be enhanced. Next we will study different kinds of perturbations and their effects on the betatron radiation generated in the plasma. The parameters shown in
Table 1 will be the same for all cases unless specified.
3.1. Separation between witness and drive beams
In this section, parameter scans over the separation between drive and witness beams are explored using Quasi-static PIC code QuickPIC [
16,
17]. The evolution of the separation between the two beams over the length of the plasma is studied. Beam centroid oscillations arise when the beam is propagated in a static ion column with some transverse offset with respect to the central axis of the column. In the two-bunch configuration of PWFA, an initial misalignment between the beams would lead to beam centroid oscillations if these oscillations were not suppressed, resulting in the growth of the hosing instability.
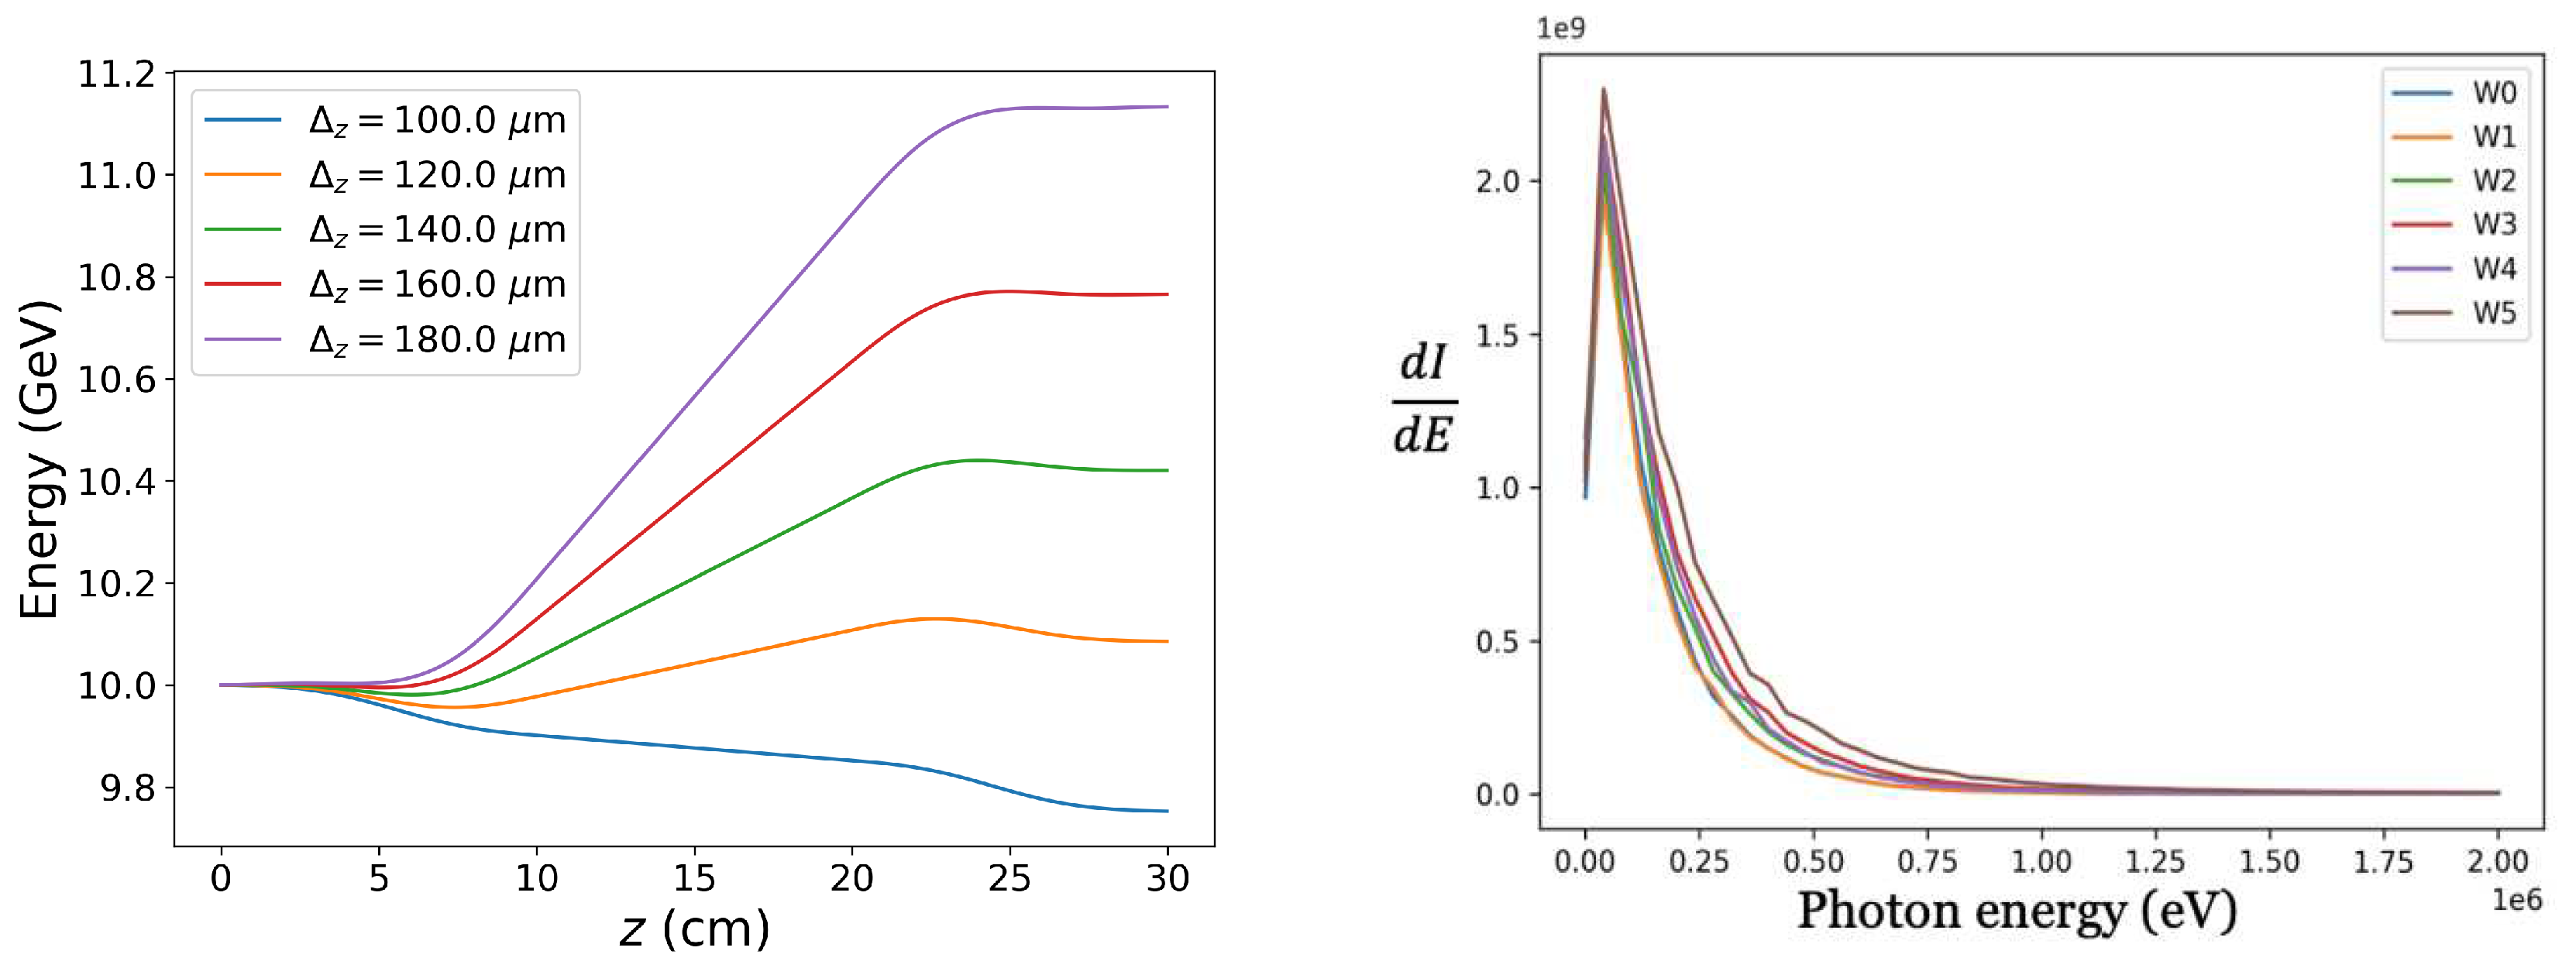
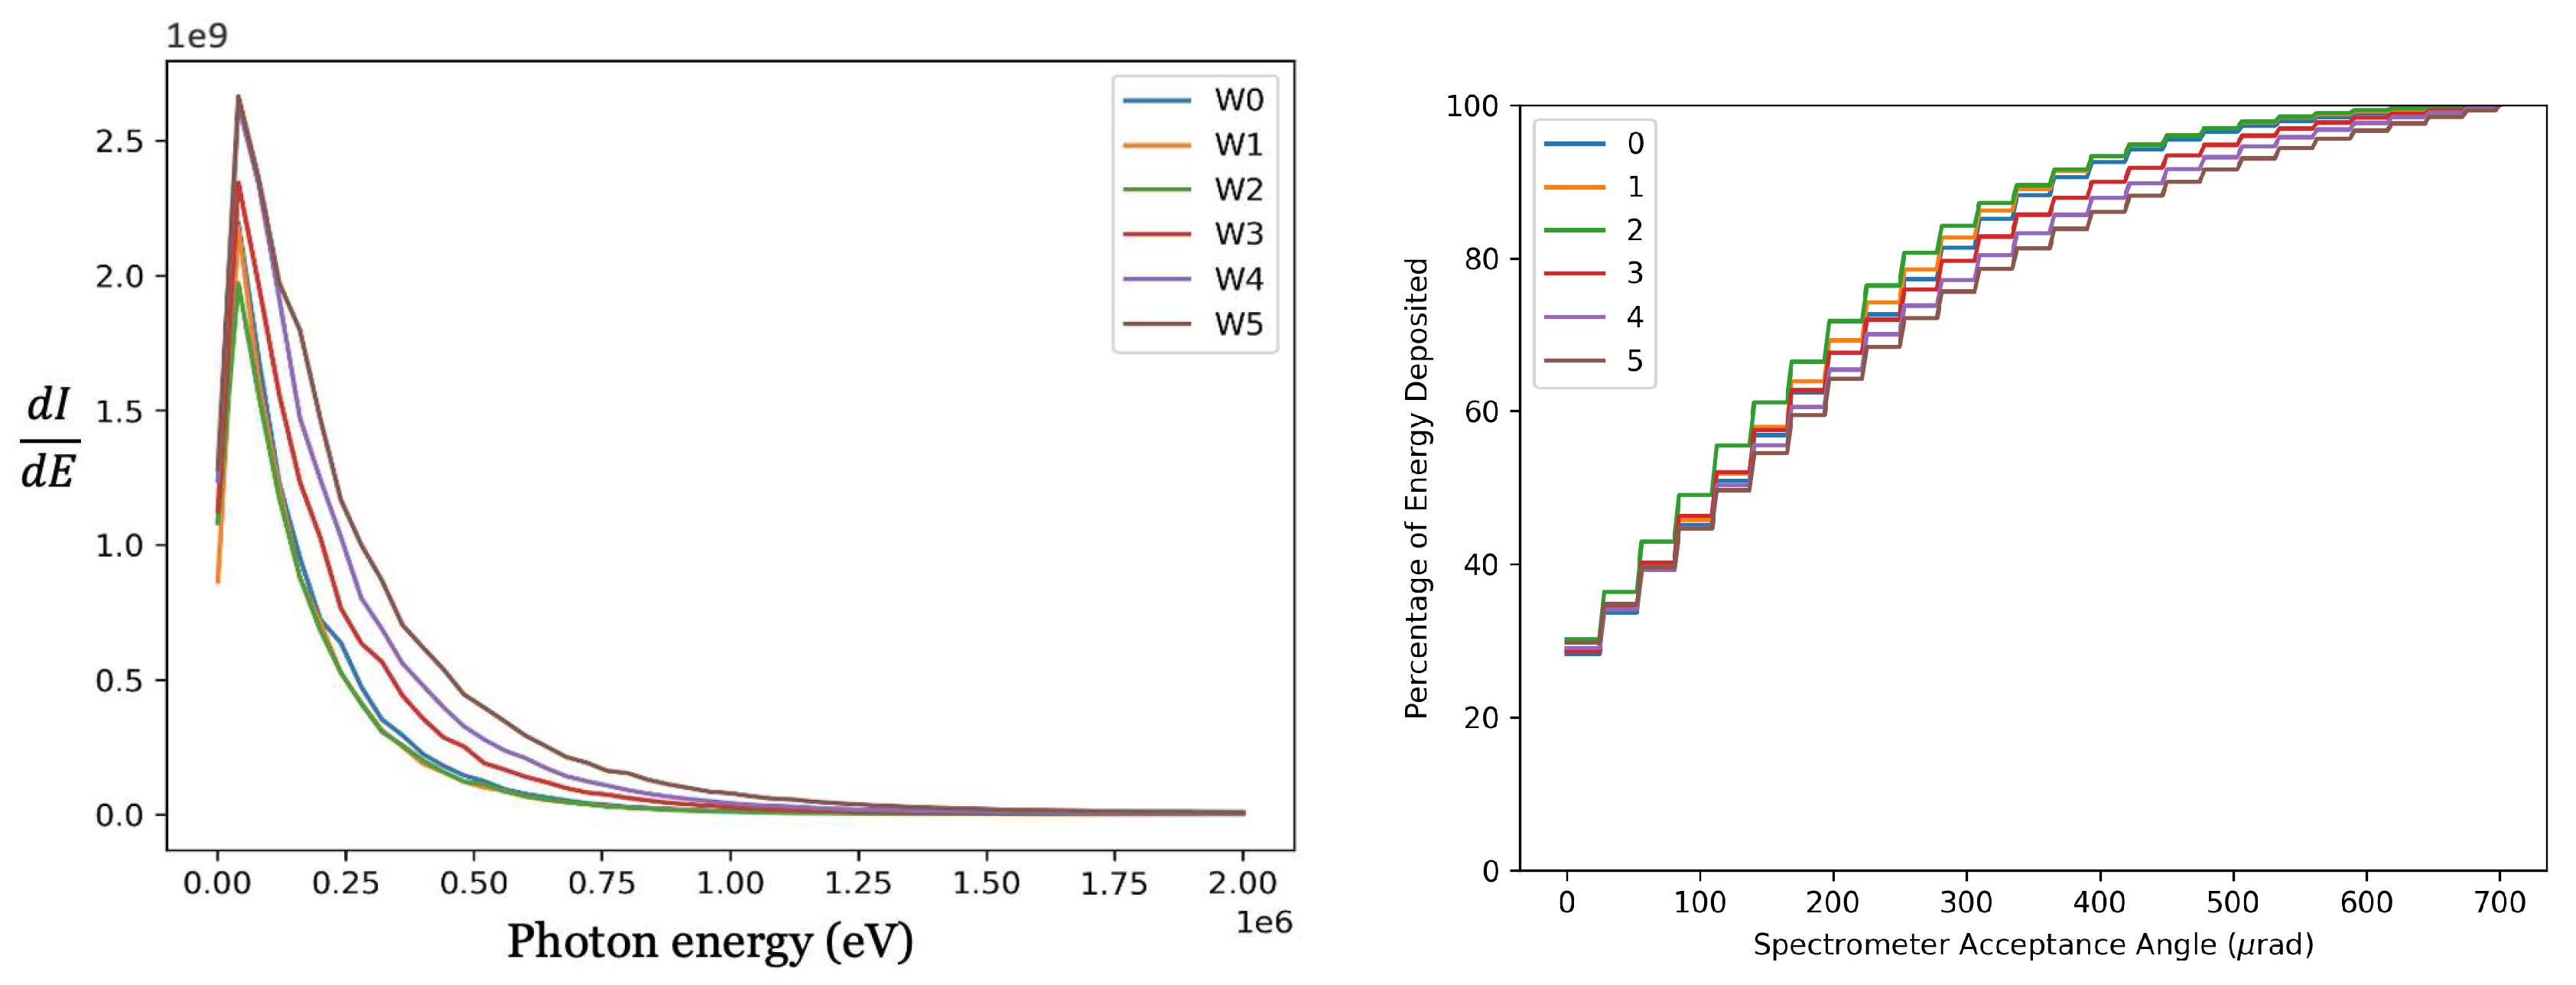
In
Figure 3, the radiation spectrum generated by the witness beam is depicted. It is observed that the variation in the linear spectrum, generated by the drive and witness beams, occurs predominantly at higher energies, and this variation is solely attributed to the separation between the witness beams. From the plotted data, it becomes evident that the witness spectrum is most significantly impacted when the drive-witness separation is set at 200
.
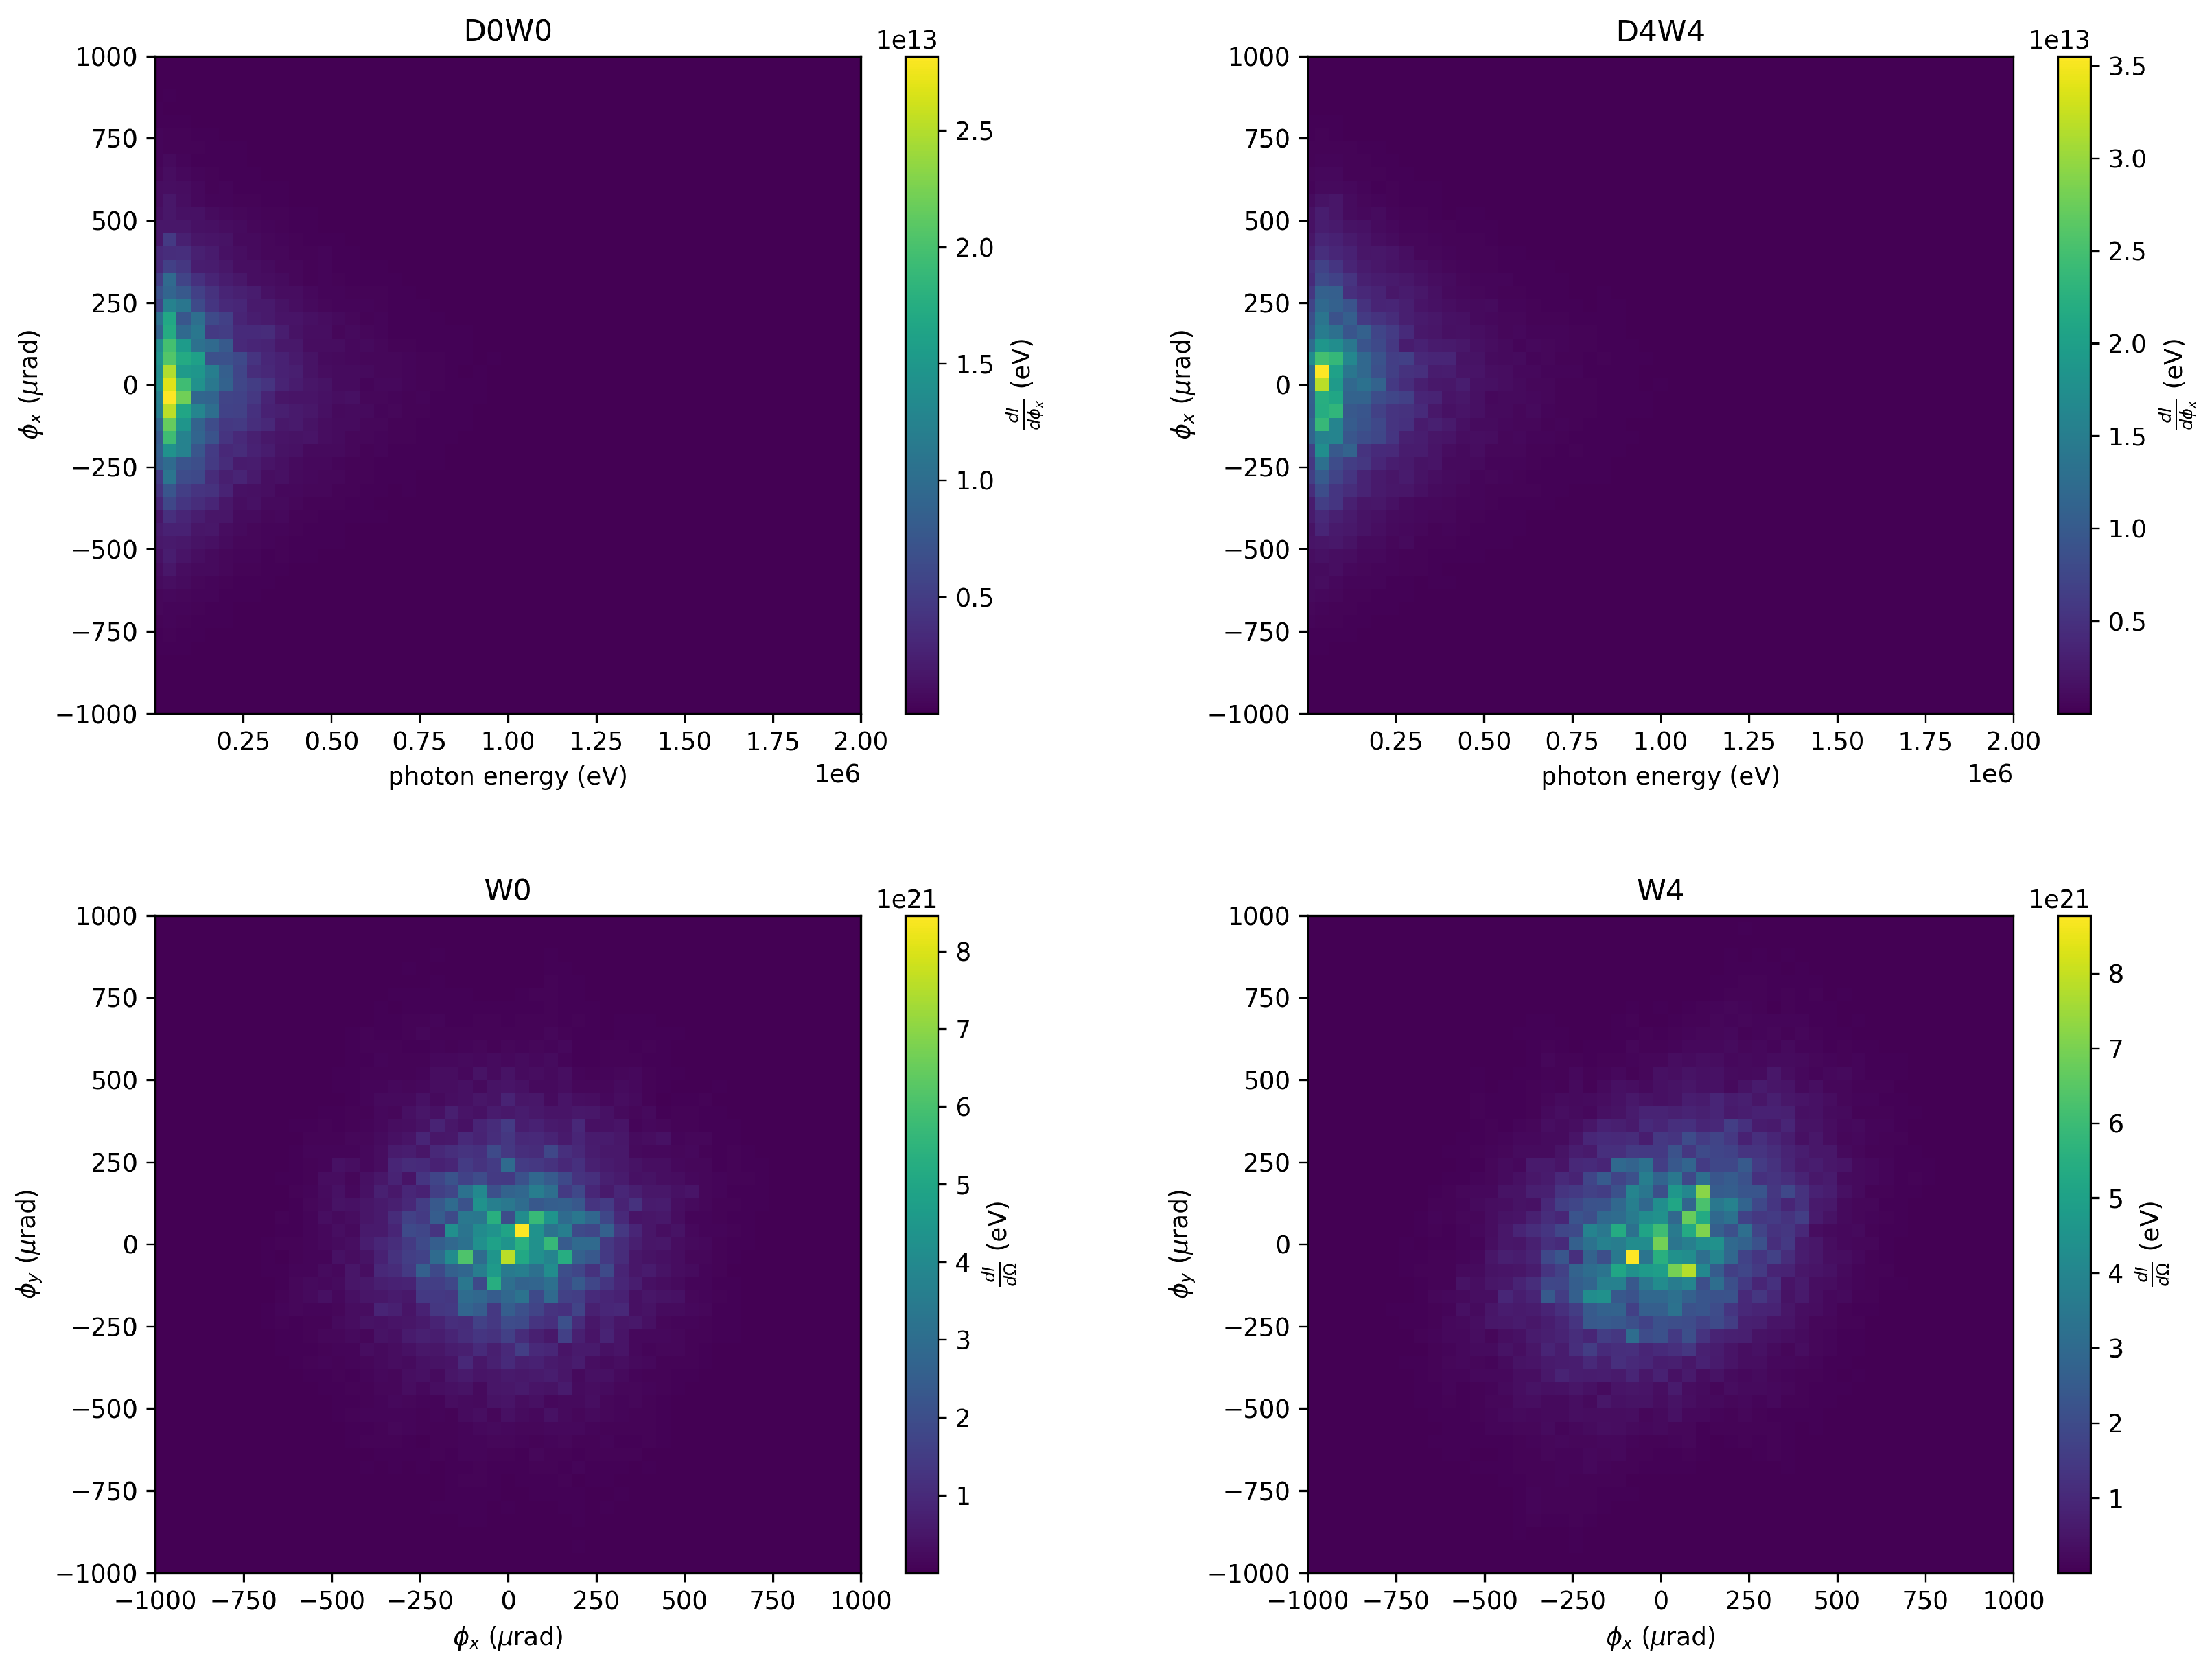
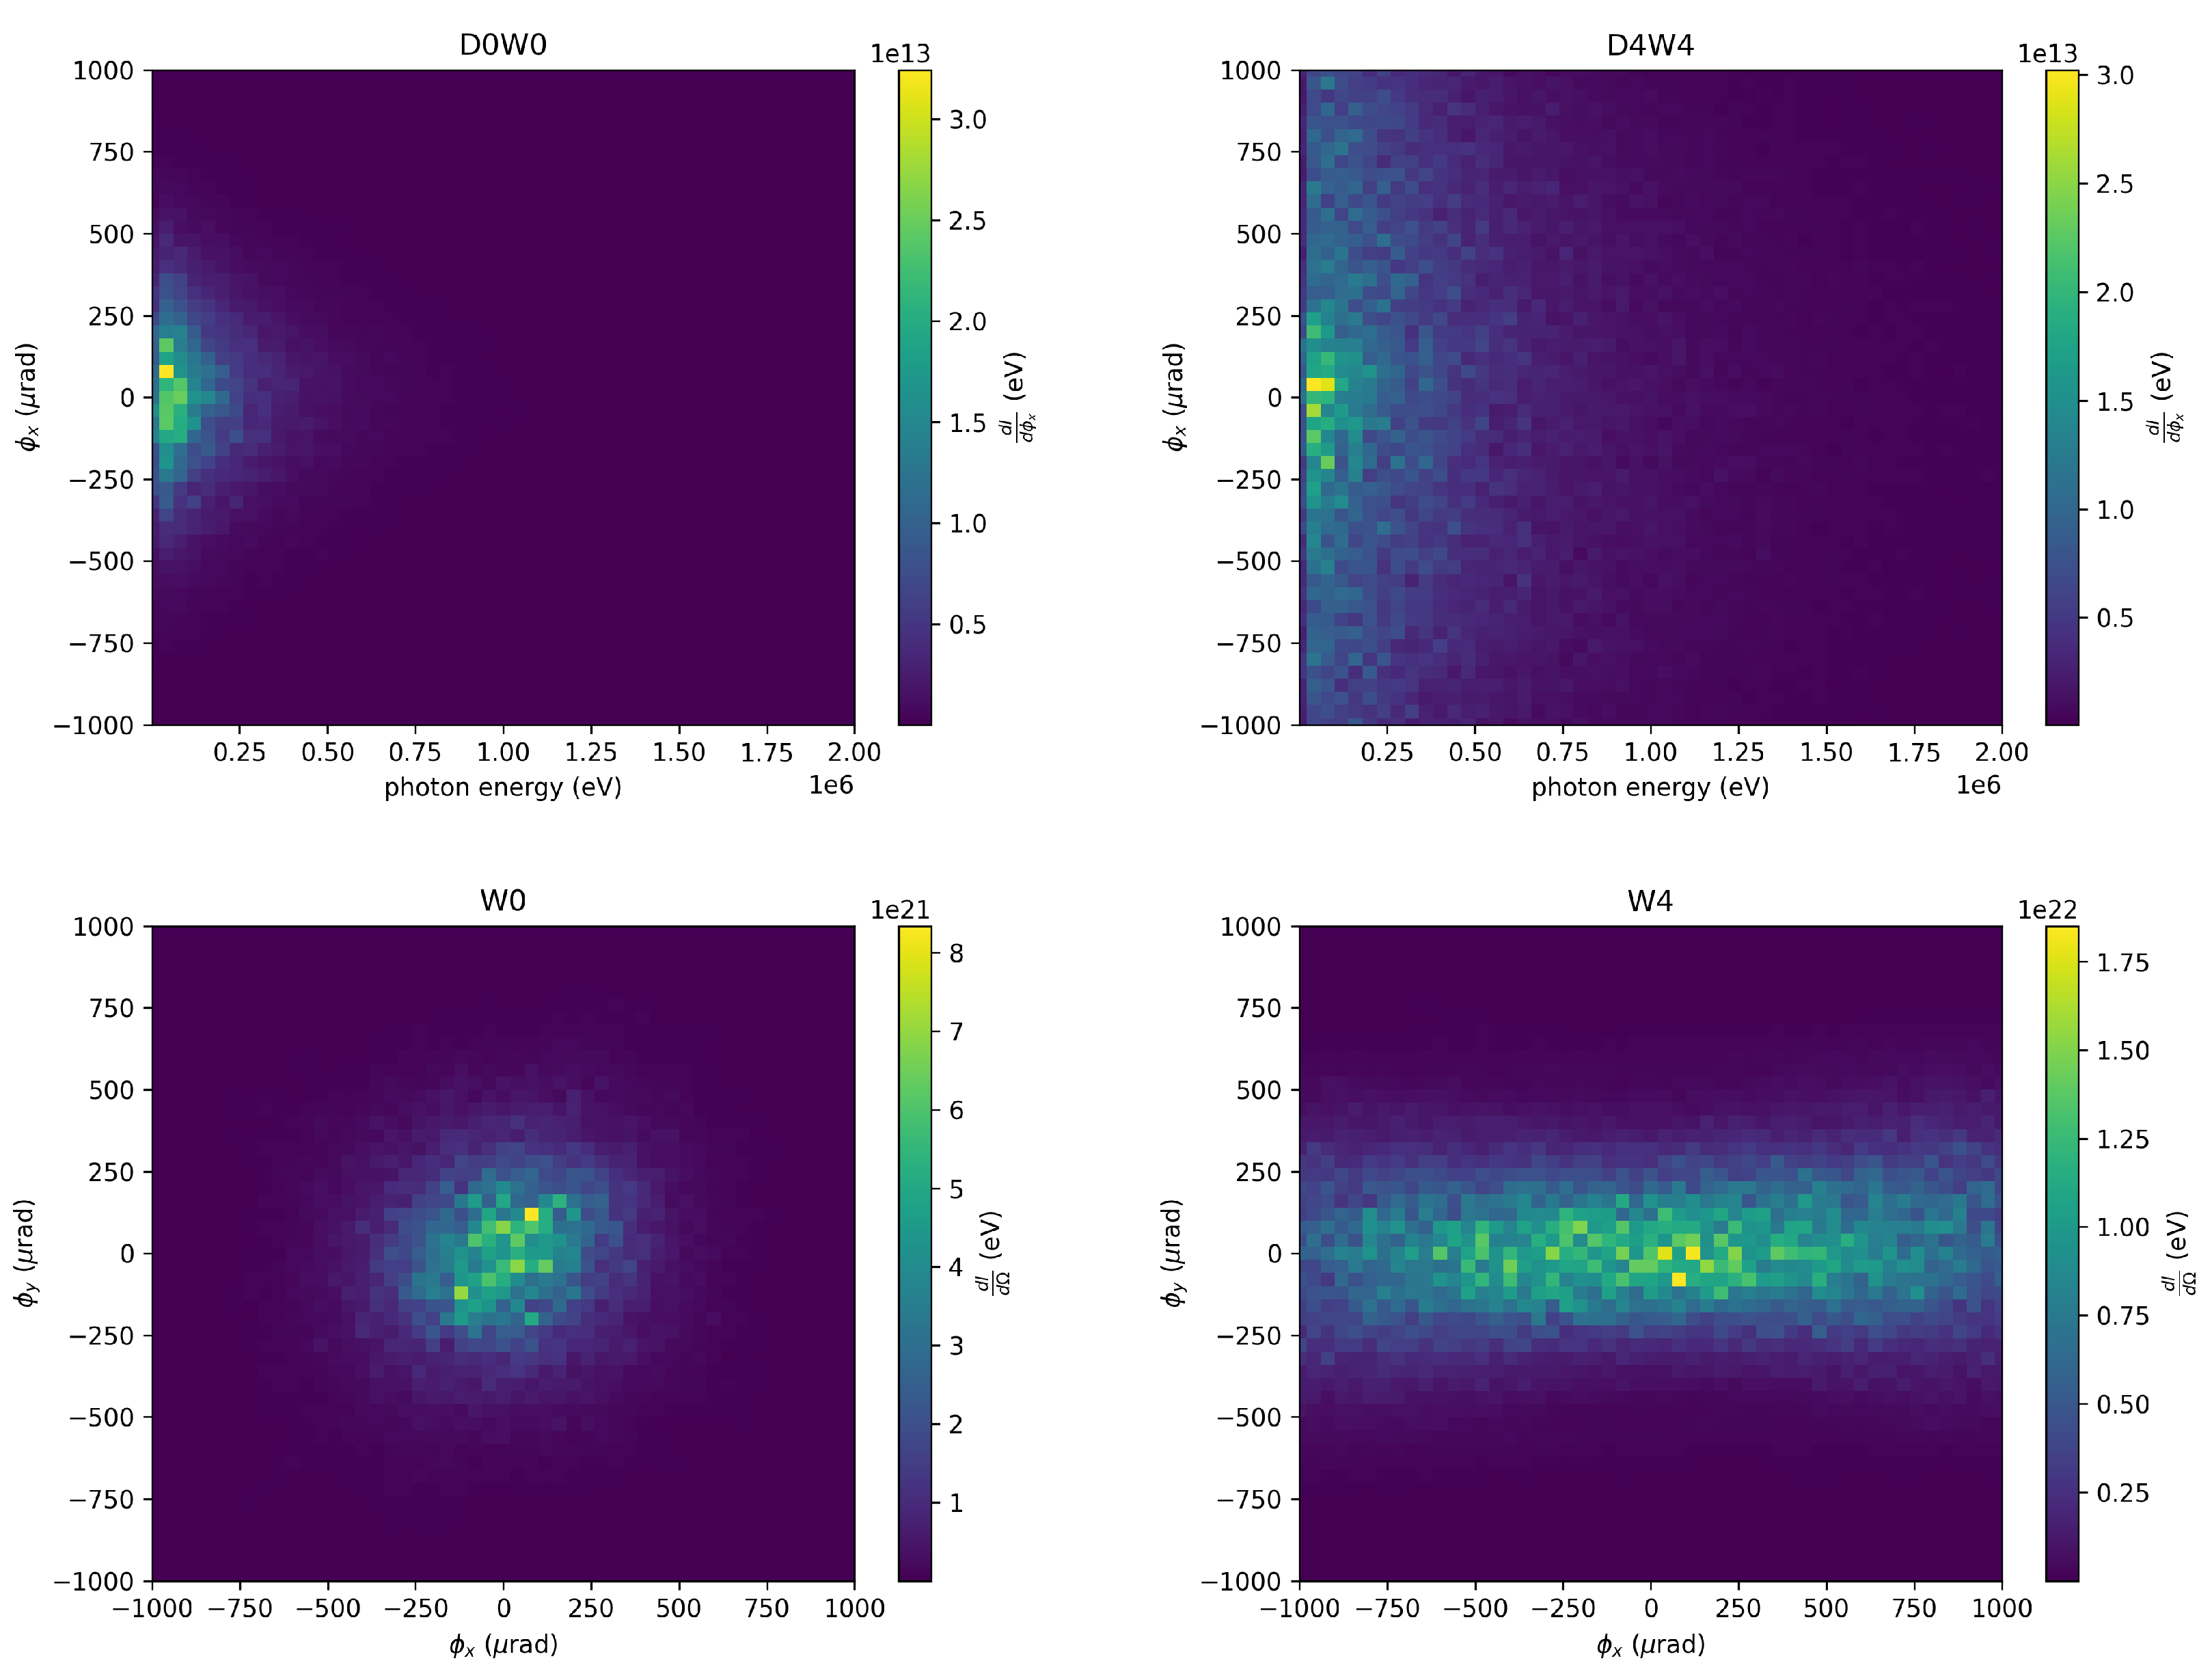
Figure 4 shows the angular distribution of the generated photons. Most of the generated photons distribution is in the range of few
scale.
3.2. Witness beam offset
A distinct betatron radiation signature was manifested when a witness beam was offset from the axis. Several simulations were conducted, where the x centroid of the witness beam was subjected to an offset denoted as . The simulation with was designated as the on-axis simulation. Nevertheless, the dynamics of the witness beam exhibited two prominent differences. Larger offset beams exhibited a more pronounced emittance growth and an increase in the x spot size. Some charge loss was observed in the case of larger offset beams.
Furthermore, the larger offset beams displayed a slightly smaller energy spread. For instance, in the case of , the energy spread was approximately , in contrast to the case, which exhibited an energy spread of approximately . Importantly, it was observed that the beam spot size underwent significant changes as the offset was increased.
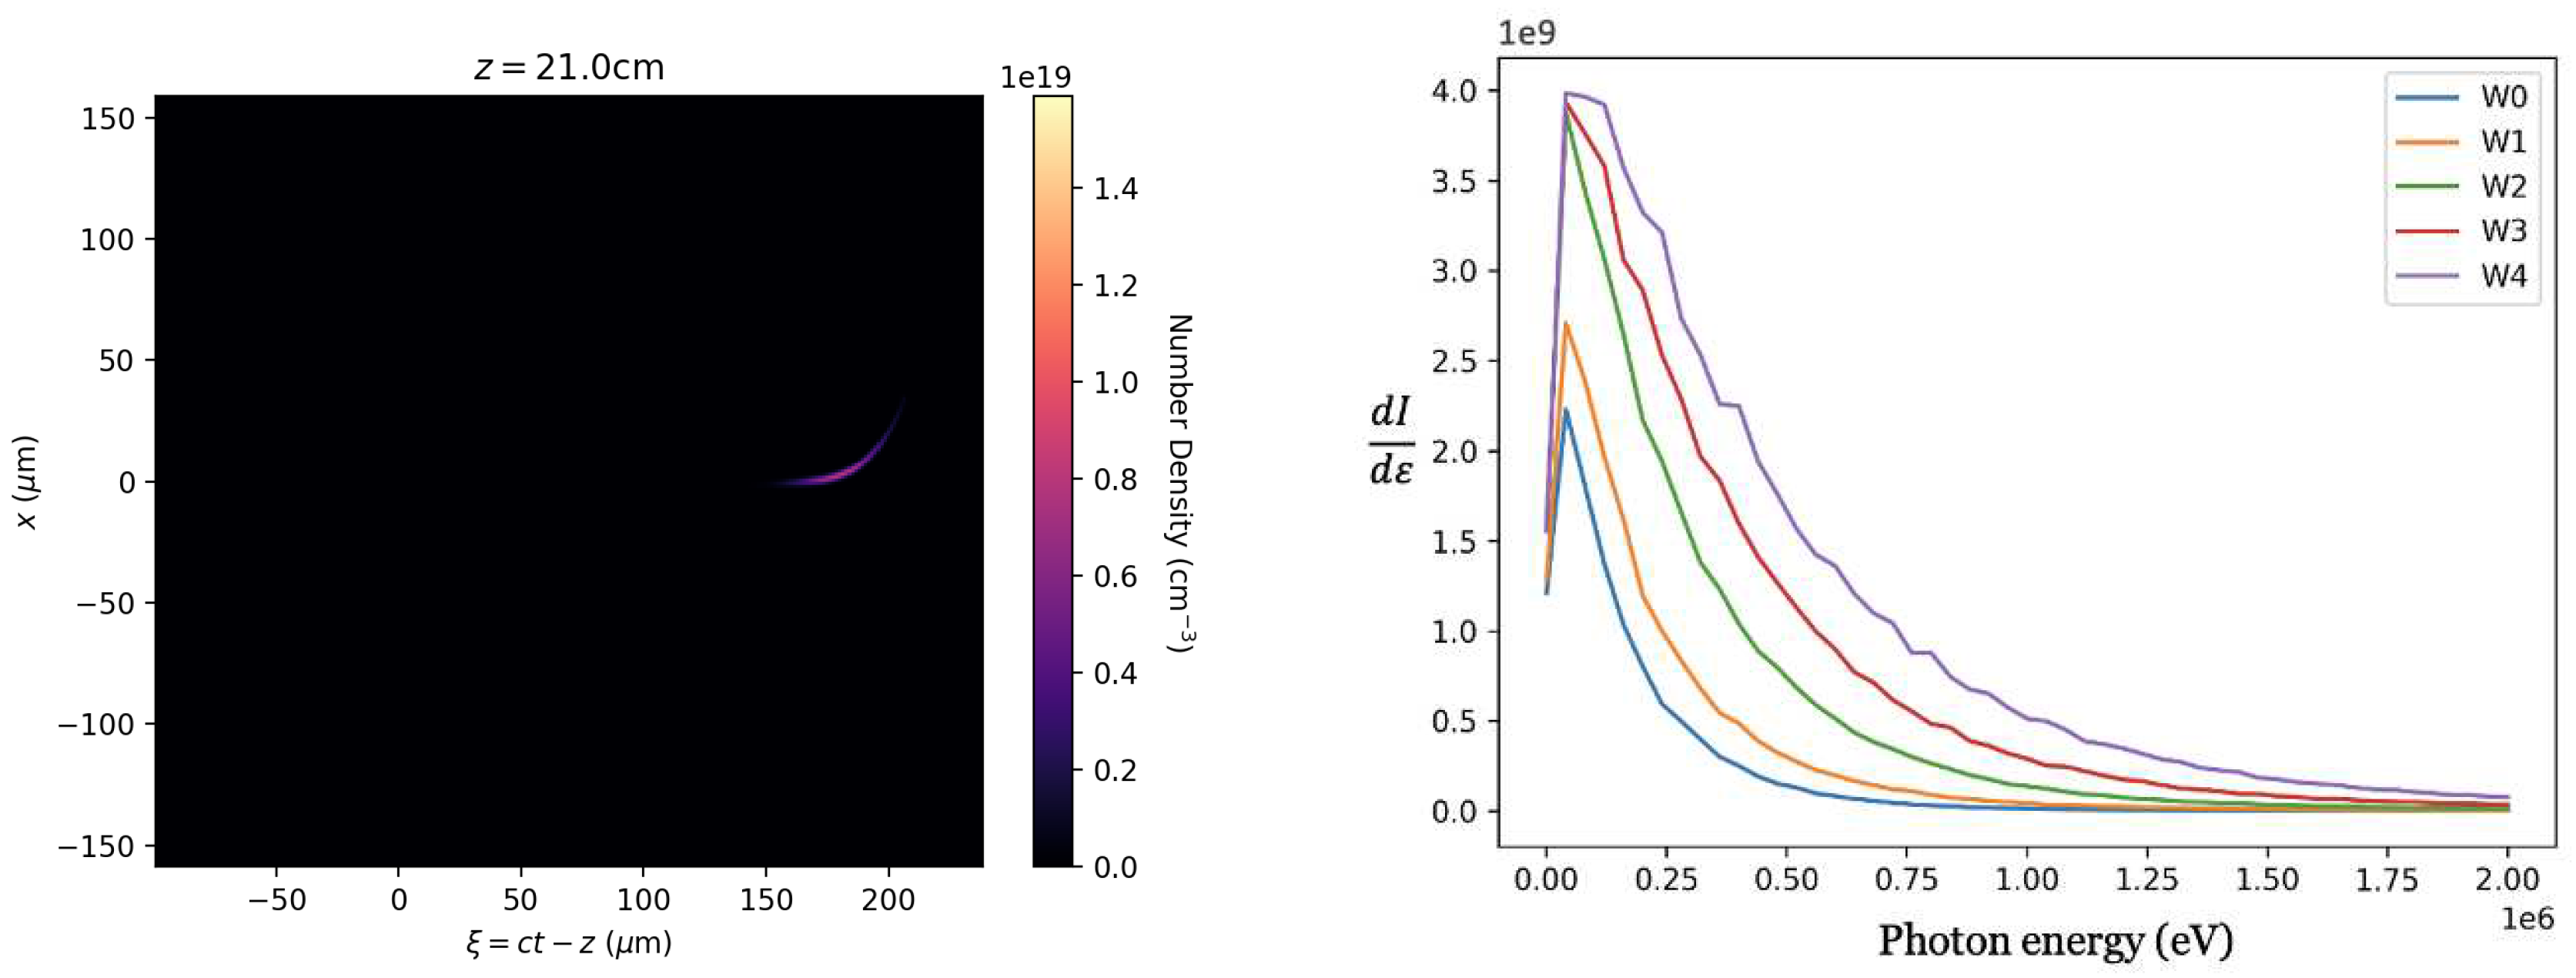
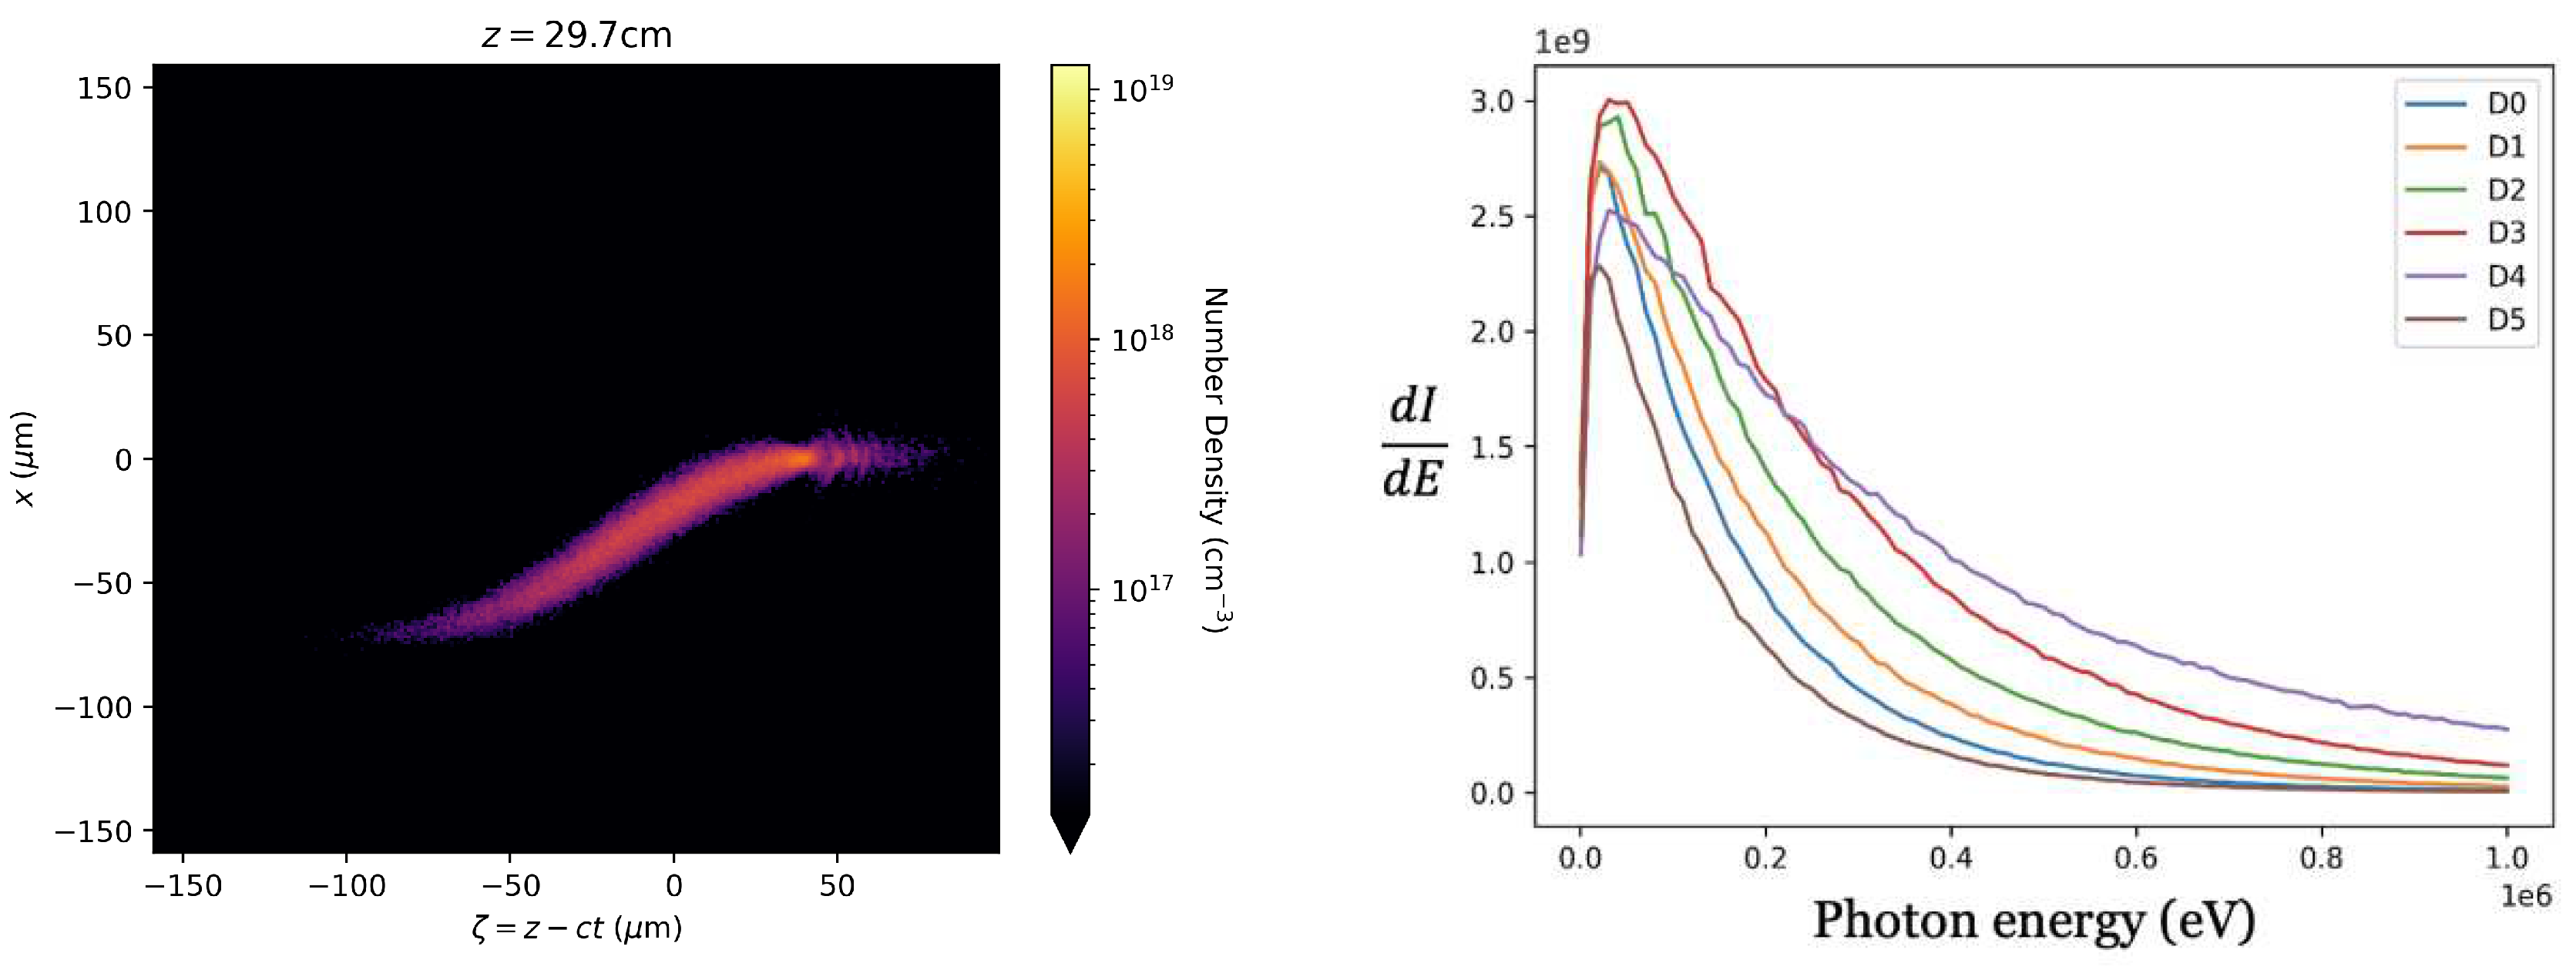
In
Figure 5, the beam evolution of a 20
beam in plasma is depicted. It is noteworthy that the tail of the witness beam exhibits more betatron oscillation when compared to the on-axis beam. On the right-hand side plot, the intensity versus photon energy spectrum is displayed.
Figure 6 showcases the double differential spectra of the beam for various offsets in the transverse direction. It is observed that beams with greater offsets exhibit a wider angular spread. Consequently, a larger detector screen is necessitated.
By analyzing the measured betatron spectrum and electron energy spectrum, one can determine beam parameters and emittance of electron beams. The properties of betatron radiation exhibit expected variations with changes in plasma density. A parametric scan on diverse perturbations is conducted to comprehend their effects on the betatron radiation spectrum and angular distribution. Advancements in betatron radiation diagnostics could also aid in detecting transverse beam misalignment alongside other beam parameters. Combined with the low-energy X-ray detector sub-system, the full spectrum of betatron radiation generated by electron beams within the plasma source is observed. This spectral and angular photon yield can then be integrated to indirectly measure the beam’s phase space distribution while traversing the plasma. This knowledge is pivotal for comprehending and optimizing beam dynamics within a plasma wakefield accelerator, particularly for high-brightness beam behavior in high-energy physics applications.
3.3. Witness beam spot size
The results of a parameter scan over the initial witness beam spot size are presented here. In
Figure 7, the radiation spectrum for different witness spot sizes are plotted. When matching conditions are not satisfied, oscillations of individual electrons lead to the generation of beam envelope oscillations, and the spot size of the beam oscillates while it is propagated in the plasma.
Simulations for different spot sizes for the witness electron beam were conducted. It is noted that the higher energy range spectrum is predominantly influenced by the drive beam, with the witness beam exerting a lesser impact on the radiation spectrum in lower energy ranges. In the recent study at SLAC, a small longitudinal sigma beam with a large transverse size was generated. The significance lies in the potential to achieve an accelerating gradient in the TeV/m range [
18]. Acceleration gradients of 10 GV/m over meter-scale plasma lengths can be supported by beam-driven PWFAs.
3.4. Banana drive beam
To investigate the effects of various types of drive beam perturbations on betatron radiation, the banana beam, where the density profile was given by Equation (
8). This perturbation aimed to study the effects of a beam head centroid perturbation, with coefficients A and B, and transverse and longitudinal sizes
,
, and
. Another perturbation involved rotating the drive beam by an angle
in the
plane, and three simulations of this type were carried out.
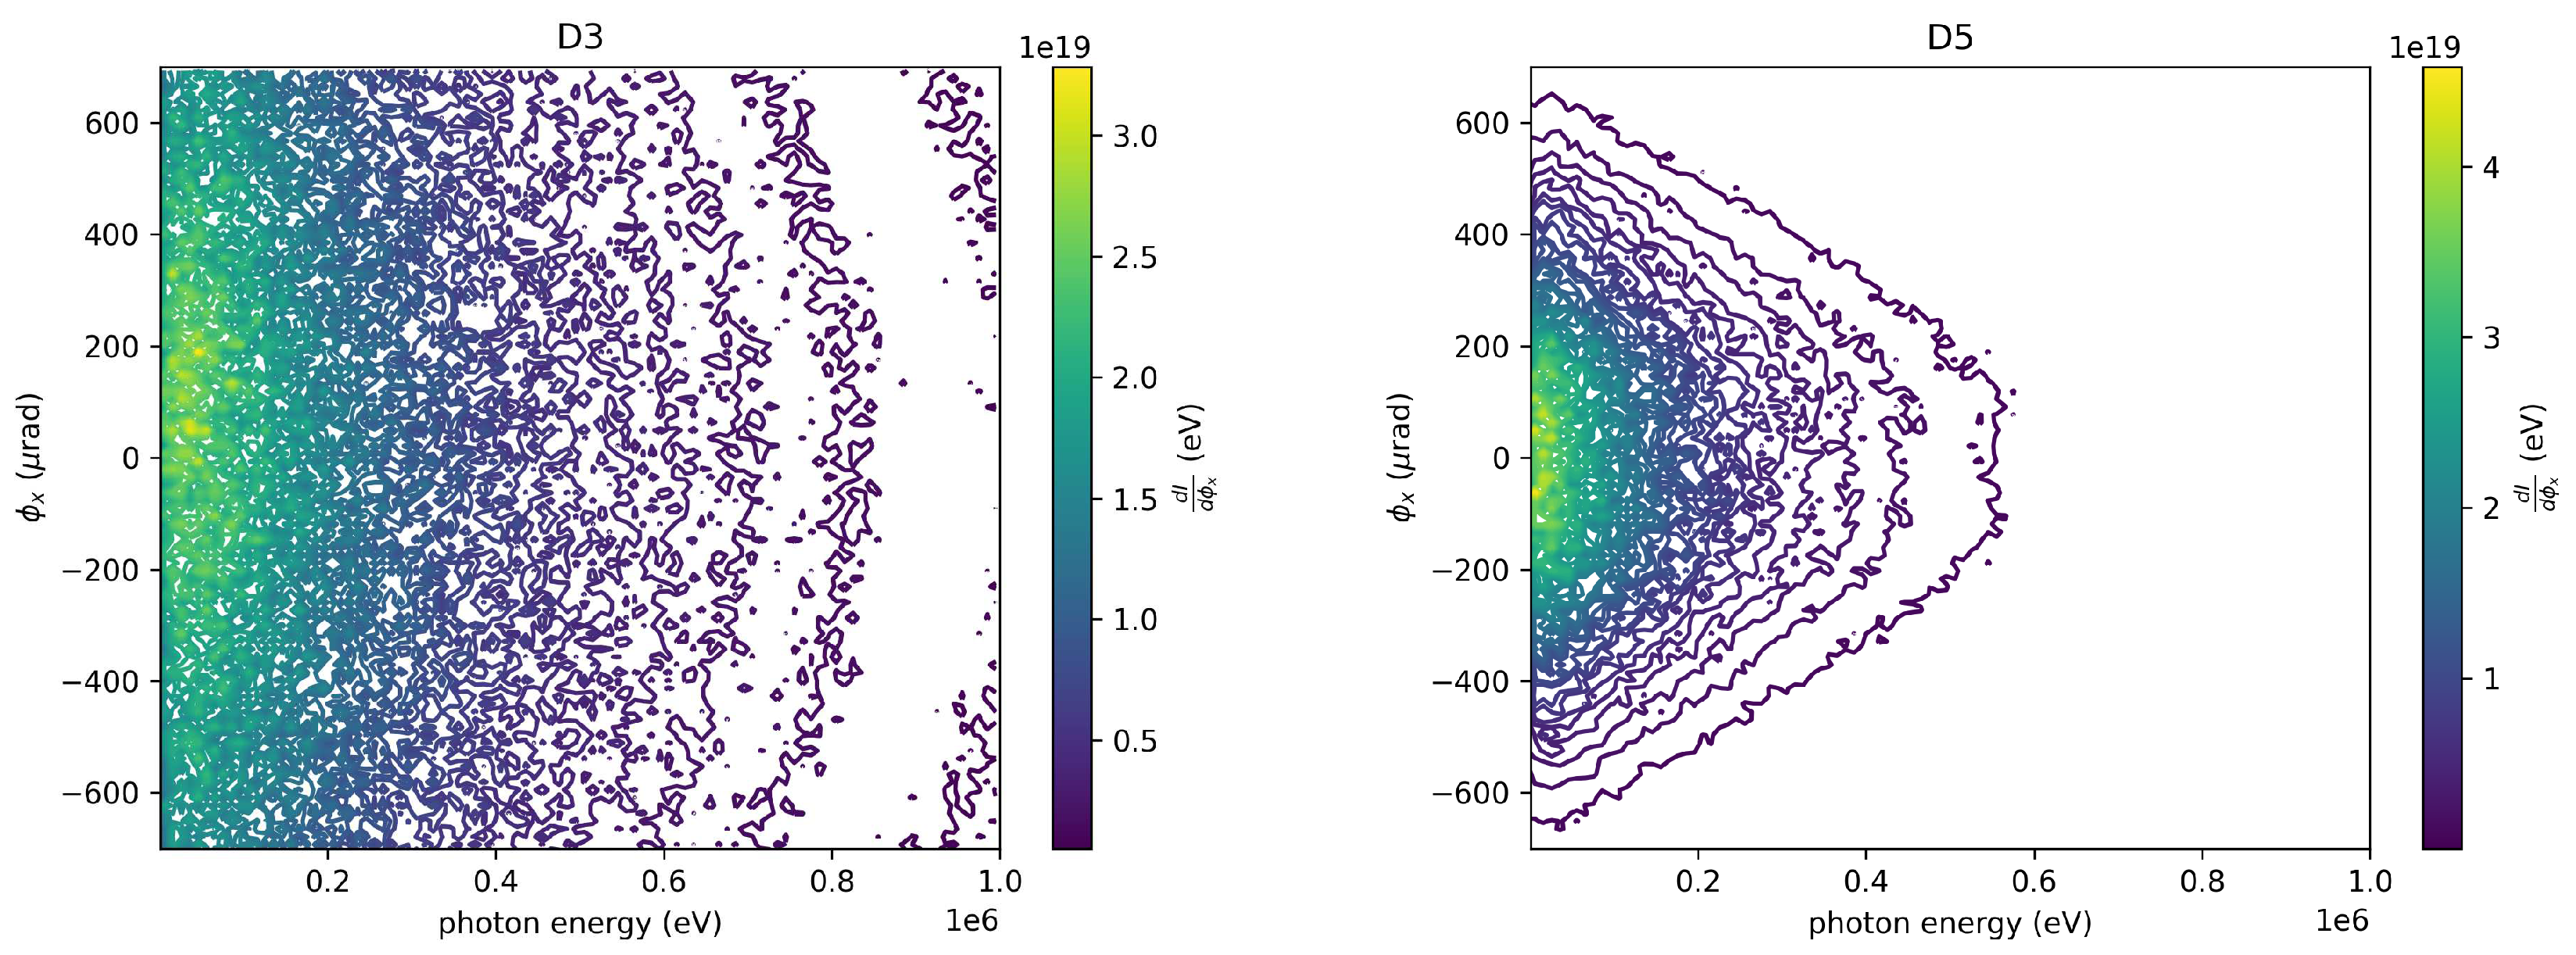
Figure 8, beam density profile of 20
offset beam and spectrum generated by a witness beam propagating in an underdense plasma are plotted. In
Figure 9 left side DDS of the beam with A=300, B= 300 and on right side beam with A=900, B= 900 are plotted. Tilted beam also have different radiation features. Tilted beam is generated by changing the centroid
x=[0,
,
] for a beam centered at
. [0,
/ A, B *
/ A], where
A is the
distance from the point where the centroid intercepts the axis to the point where the centroid is sigma
x away from the axis. (-B) is the xi coordinate point where the centroid intercepts the axis.
4. Gamma diagnostics for FACET-II
The gamma-ray measurement requirements for FACET-II have been the subject of continued discussion during the recent years of preparation before and during the commissioning of this important research facility. It is apparent from the recently published work [
9,
19] that the user community in the first phase of FACET-II research will be concerned with measurements centered on higher energy beam processes and relatively large emittances. Betatron radiation and related processes provide uniquely powerful probes of high-energy beam-plasma and beam-radiation interactions. A novel spectrometer has been designed at UCLA for the measurement of double differential photon spectra across several decades of energy, ranging from tens of keV to tens of GeV, with an angular resolution of 100
[
20,
21,
22,
23,
24,
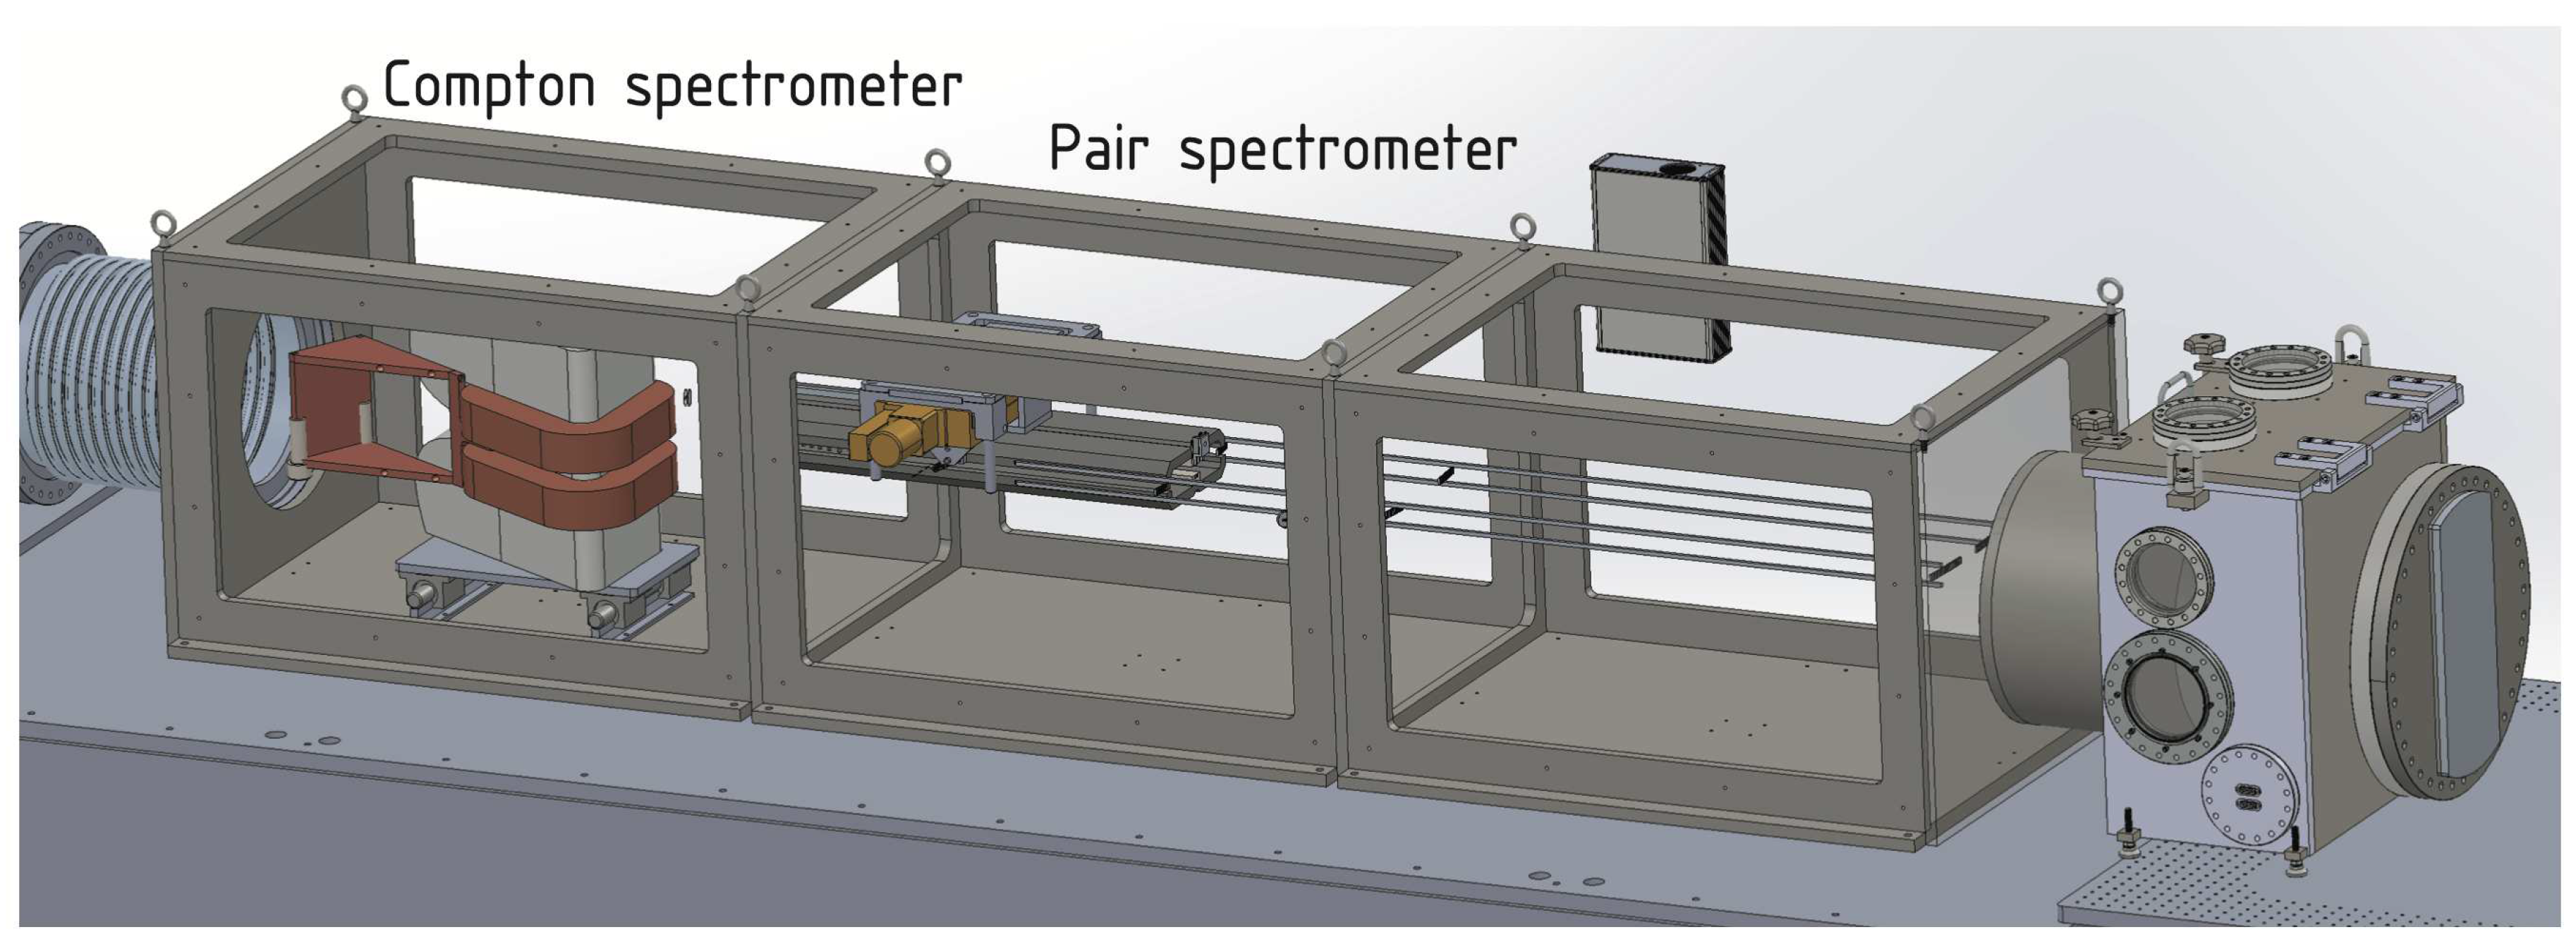
25]. The emitted radiation is directed into the spectrometer from the left of
Figure 10 and undergoes interactions with the converter, resulting in Compton scattering and pair production. The gamma energy range of the Compton spectrometer spans from 180 keV through 28 MeV, allowing for the coarse resolution of single-shot double-differential energy-angle gamma spectra. The gamma energy range of the pair spectrometer extends from 10 MeV through 10 GeV. Both spectrometers are equipped with shielding for x-rays and electromagnetic pulse (EMP).
The Compton spectrometer can resolve a single-shot gamma spectrum spanning an energy range from 200 keV to 20 MeV and also has capability to resolve angular-energy double differential spectra. This extensive energy range particularly valuable for diagnosing experiments related to plasma wakefield studies. In this process, gamma rays undergo Compton scattering and pair production off a beryllium target, resulting in the generation of electrons and positrons. Afterward, magnetic analysis is applied to these charged particles before precisely projecting them onto a scintillator screen. An out-of-vacuum camera captures the emitted scintillator light, enabling the acquisition of crucial experimental data and insights. Spectrometers will be locate in-vacuum to minimize background x-rays. Nominally there will be 40 mm of primary-to-gamma separation in the gamma detection chamber. Compton spectrometer will be in the first third of chamber, and pair spectrometer lives in the remainder.
When not in use, both spectrometers are positioned off the gamma beamline and do not interfere with downstream measurements. The design and simulation of Compton and pair spectrometers are focused on analyzing the higher portion of the photon spectrum. Emphasis is placed on spectral measurements in the low-energy range, spanning from 0.25 to 30 MeV, which encompasses many pertinent requirements for plasma wakefield research [
26] and forms the crucial low-energy component for strong-field quantum electrodynamics (SFQED) experiments. Further details regarding the installation and testing of the spectrometers will be discussed elsewhere .
5. Discussion and Conclusion
These perturbation effects the charged particle motion and betatron radiation intensity. Plasma instabilities, like the Weibel, introduce irregularities in plasma, affecting particle trajectories and betatron radiation intensity, which can either be enhanced or suppressed based on specific conditions. The interaction of plasma with its boundaries, including solid walls and magnetic confinement, also influences particle behavior and, consequently, betatron radiation. Understanding these perturbations is crucial for both fundamental research in plasma physics and practical applications in fields. Changes in the spectrum due to beam perturbations can result in alterations in the distribution of emitted radiation across different frequencies. The discussed perturbations find potential applications in various PWFA experiments, including those at FACET-II or other electron beam facilities, where betatron radiation serves as a robust and accessible experimental measurement revealing fundamental aspects of beam-plasma interaction. Distinct betatron radiation signals arise from the interaction between the witness beam and driver beam, with the unique nonlinear focusing of beam fields contributing to spectral broadening.
The physics of significantly important phenomena in PWFA has been explored in a theoretical and computational approach placed in the particular experimental context of the FACET-II research program. The issues examined here provide a study of beam parameters and multi-shot spectrum reconstruction. Successful exploration of the physical effects involved should give confidence in the physical understanding of PWFA and its experimental control, as should advancements in the area of beam diagnostics, which are of necessity in the current state-of-the-art accelerators. However, to fully comprehend the experimental scenarios, further research is required.
Author Contributions
Conceptualization, M. Yadav and J. Rosenzweig; methodology, M. Yadav, M. H. Oruganti, B. Naranjo and J. Rosenzweig; software, M. Yadav, M. H. Oruganti, B. Naranjo, J. Phillips, S. Liang, K. Letko; resources, B. Naranjo, G. Andonian, and J. Rosenzweig; writing—original draft preparation, M. Yadav, M. H. Oruganti; writing—review and editing, J. Rosenzweig; visualization, M. Yadav; supervision, J. Rosenzweig; funding acquisition, J. Rosenzweig. All authors have read and agreed to the published version of the manuscript.
Funding
This work was performed with the support of the US Department of Energy, Division of High Energy Physics, under Contract No. DE-SC0009914, NSF PHY-1549132 Center from Bright Beams, DARPA under Contract N.HR001120C007.
Data Availability Statement
Data available on request to main author’s mail addresses.
Conflicts of Interest
The authors declare no conflict of interest.
Abbreviations
The following abbreviations are used in this manuscript:
| PWFA |
Plasma wakefield Acceleration |
| FACET-II |
Facility for Advanced Accelerator Experimental Tests Accelerator Directorate |
| SLAC |
Stanford linear Accelerator centre |
| PEDRO |
Positron-Electron Detector for Radiative Observations |
| LW |
Liénard–Wiechert |
| SFQED |
Strong-Field Quantum Electrodynamics |
References
- Blumenfeld, I.; et al. Energy doubling of 42GeV electrons in a metre-scale plasma wakefield accelerator. Nature 2007, 445, 741–744. [Google Scholar] [CrossRef]
- Litos, M.; et al. High-efficiency acceleration of an electron beam in a plasma wakefield accelerator. Nature 2014, 515, 1476–4687. [Google Scholar] [CrossRef]
- Lindstrøm, C.; Thévenet, M. Emittance preservation in advanced accelerators. Journal of Instrumentation 2022, 17, P05016. [Google Scholar] [CrossRef]
- Wiedemann, H. Particle Accelerator Physics; Graduate Texts in Physics; Springer: Cham, 2015. [Google Scholar] [CrossRef]
- Jackson, J.D. Classical electrodynamics, 12. print ed.; Wiley: New York, 1962. [Google Scholar]
- Kim, K.J.; Huang, Z.; Lindberg, R. Synchrotron Radiation. In Synchrotron Radiation and Free-Electron Lasers: Principles of Coherent X-Ray Generation; Cambridge University Press, 2017; pp. 33–73. [Google Scholar] [CrossRef]
- Rosenzweig, J.B.; et al. "Acceleration and focusing of electrons in two-dimensional nonlinear plasma wake fields". Phys. Rev. A 1991, 44, R6189–R6192. [Google Scholar] [CrossRef] [PubMed]
- Suk, H.; et al. Plasma Electron Trapping and Acceleration in a Plasma Wake Field Using a Density Transition. Phys. Rev. Lett. 2001, 86, 1011–1014. [Google Scholar] [CrossRef] [PubMed]
- Yakimenko, V.; et al. FACET-II facility for advanced accelerator experimental tests. Phys. Rev. Accel. Beams 2019, 22, 101301. [Google Scholar] [CrossRef]
- Corde, S.; et al. "Femtosecond x rays from laser-plasma accelerators". Rev. Mod. Phys. 2013, 85, 1–48. [Google Scholar] [CrossRef]
- Tajima, T.; Dawson, J.M. Laser Electron Accelerator. Phys. Rev. Lett. 1979, 43, 267–270. [Google Scholar] [CrossRef]
- Yadav, M.; et al. Reconstruction of electron radiation spectra and beam parameters from photon spectrometer data in accelerator experiments using machine learning, https://arxiv.org/abs/2209.12119, 2022. [CrossRef]
- Oruganti, M.; et al. Comparing Methods of Recovering Gamma Energy Distributions from PEDRO Spectrometer Responses. JACoW 2022, IPAC2022, WEPOST040. [Google Scholar] [CrossRef]
- Curcio, A.; et al. Trace-space reconstruction of low-emittance electron beams through betatron radiation in laser-plasma accelerators. Phys. Rev. Accel. Beams 2017, 20, 012801. [Google Scholar] [CrossRef]
- Yadav, M.; et al. Modeling betatron radiation using particle-in-cell codes for plasma wakefield accelerator diagnostics. arXiv 2023, arXiv:physics.acc-ph/2303.04213. [Google Scholar]
- Huang, C.; et al. QUICKPIC: A highly efficient particle-in-cell code for modeling wakefield acceleration in plasmas. Journal of Computational Physics 2006, 217, 658–679. [Google Scholar] [CrossRef]
- An, W.; et al. An improved iteration loop for the three dimensional quasi-static particle-in-cell algorithm: QuickPIC. Journal of Computational Physics 2013, 250, 165–177. [Google Scholar] [CrossRef]
- Emma, C.; et al. Terawatt attosecond x-ray source driven by a plasma accelerator. APL Photonics 2021, 6, 076107. [Google Scholar] [CrossRef]
- Joshi, C.; et al. Plasma wakefield acceleration experiments at FACET II. Plasma Physics and Controlled Fusion 2018, 60, 034001. [Google Scholar] [CrossRef]
- Naranjo, B.; et al. Compton spectrometer for FACET-II. 2021, 4332–4335. [Google Scholar] [CrossRef]
- Naranjo, B.; et al. Pair Spectrometer for FACET-II 2021. pp. 4336–4339. [CrossRef]
- Ahrens, J.; et al. A compton spectrometer for the energy range between 10 and 300 MeV and its application to photon flux and photon absorption measurements. Nuclear Instruments and Methods 1973, 108, 517–523. [Google Scholar] [CrossRef]
- Gai, W.; et al. Experimental demonstration of wake-field effects in dielectric structures. Physical Review Letters 1988, 61, 2756–2758. [Google Scholar] [CrossRef]
- Sakai, Y.; et al. "Single shot, double differential spectral measurements of inverse Compton scattering in the nonlinear regime". Phys. Rev. Accel. Beams 2017, 20, 060701. [Google Scholar] [CrossRef]
- Corvan, D.J.; et al. Design of a compact spectrometer for high-flux MeV gamma-ray beams. Review of Scientific Instruments 2014, 85, 065119. [Google Scholar] [CrossRef]
- Deng, A.; et al. Generation and acceleration of electron bunches from a plasma photocathode. Nature Physics 2019, 15, 1156–1160. [Google Scholar] [CrossRef]
|
Disclaimer/Publisher’s Note: The statements, opinions and data contained in all publications are solely those of the individual author(s) and contributor(s) and not of MDPI and/or the editor(s). MDPI and/or the editor(s) disclaim responsibility for any injury to people or property resulting from any ideas, methods, instructions or products referred to in the content. |
© 2023 by the authors. Licensee MDPI, Basel, Switzerland. This article is an open access article distributed under the terms and conditions of the Creative Commons Attribution (CC BY) license (http://creativecommons.org/licenses/by/4.0/).

