Submitted:
18 October 2023
Posted:
19 October 2023
You are already at the latest version
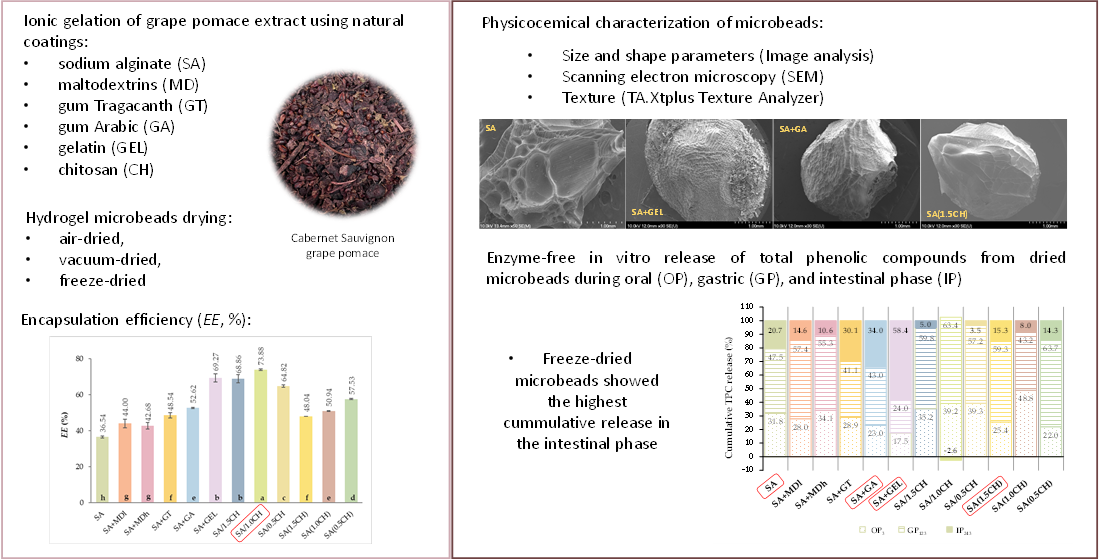
Abstract
Keywords:
1. Introduction
2. Results and Discussion
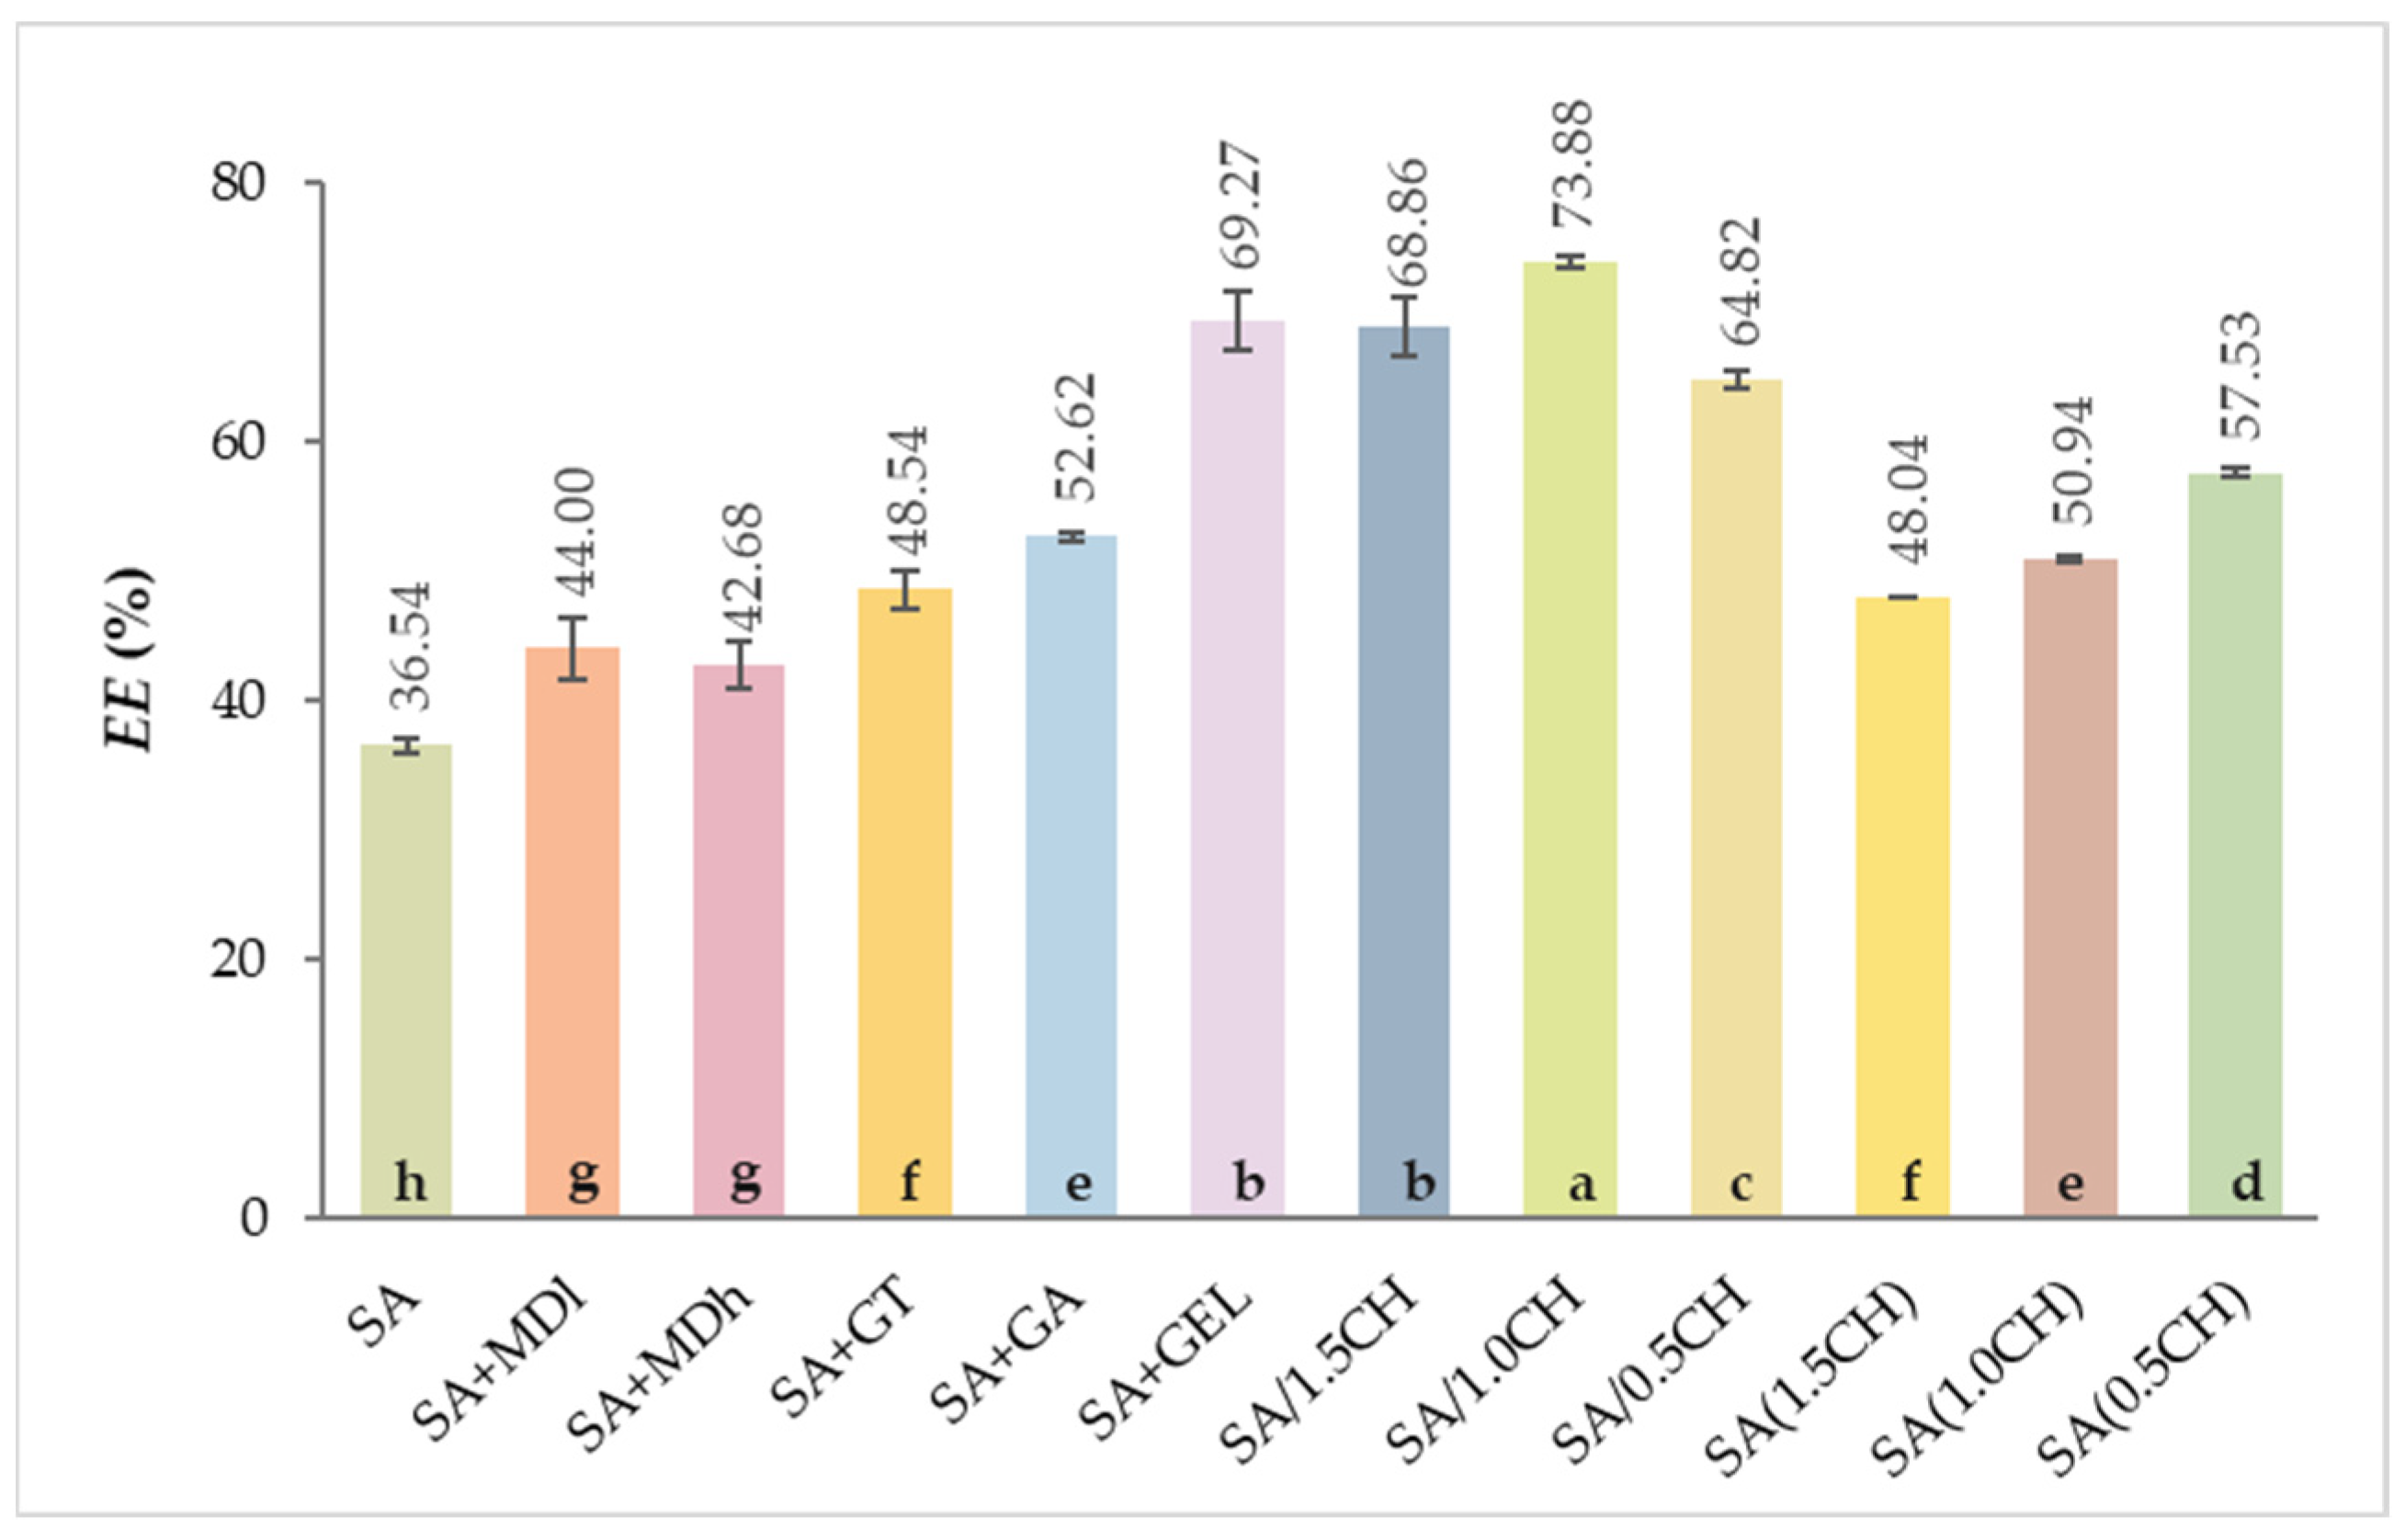
2.1. Encapsulation Efficiency of the Total Phenolic Compounds
2.2. Hydrogel Microbeads and Dried Microbeads Characterization
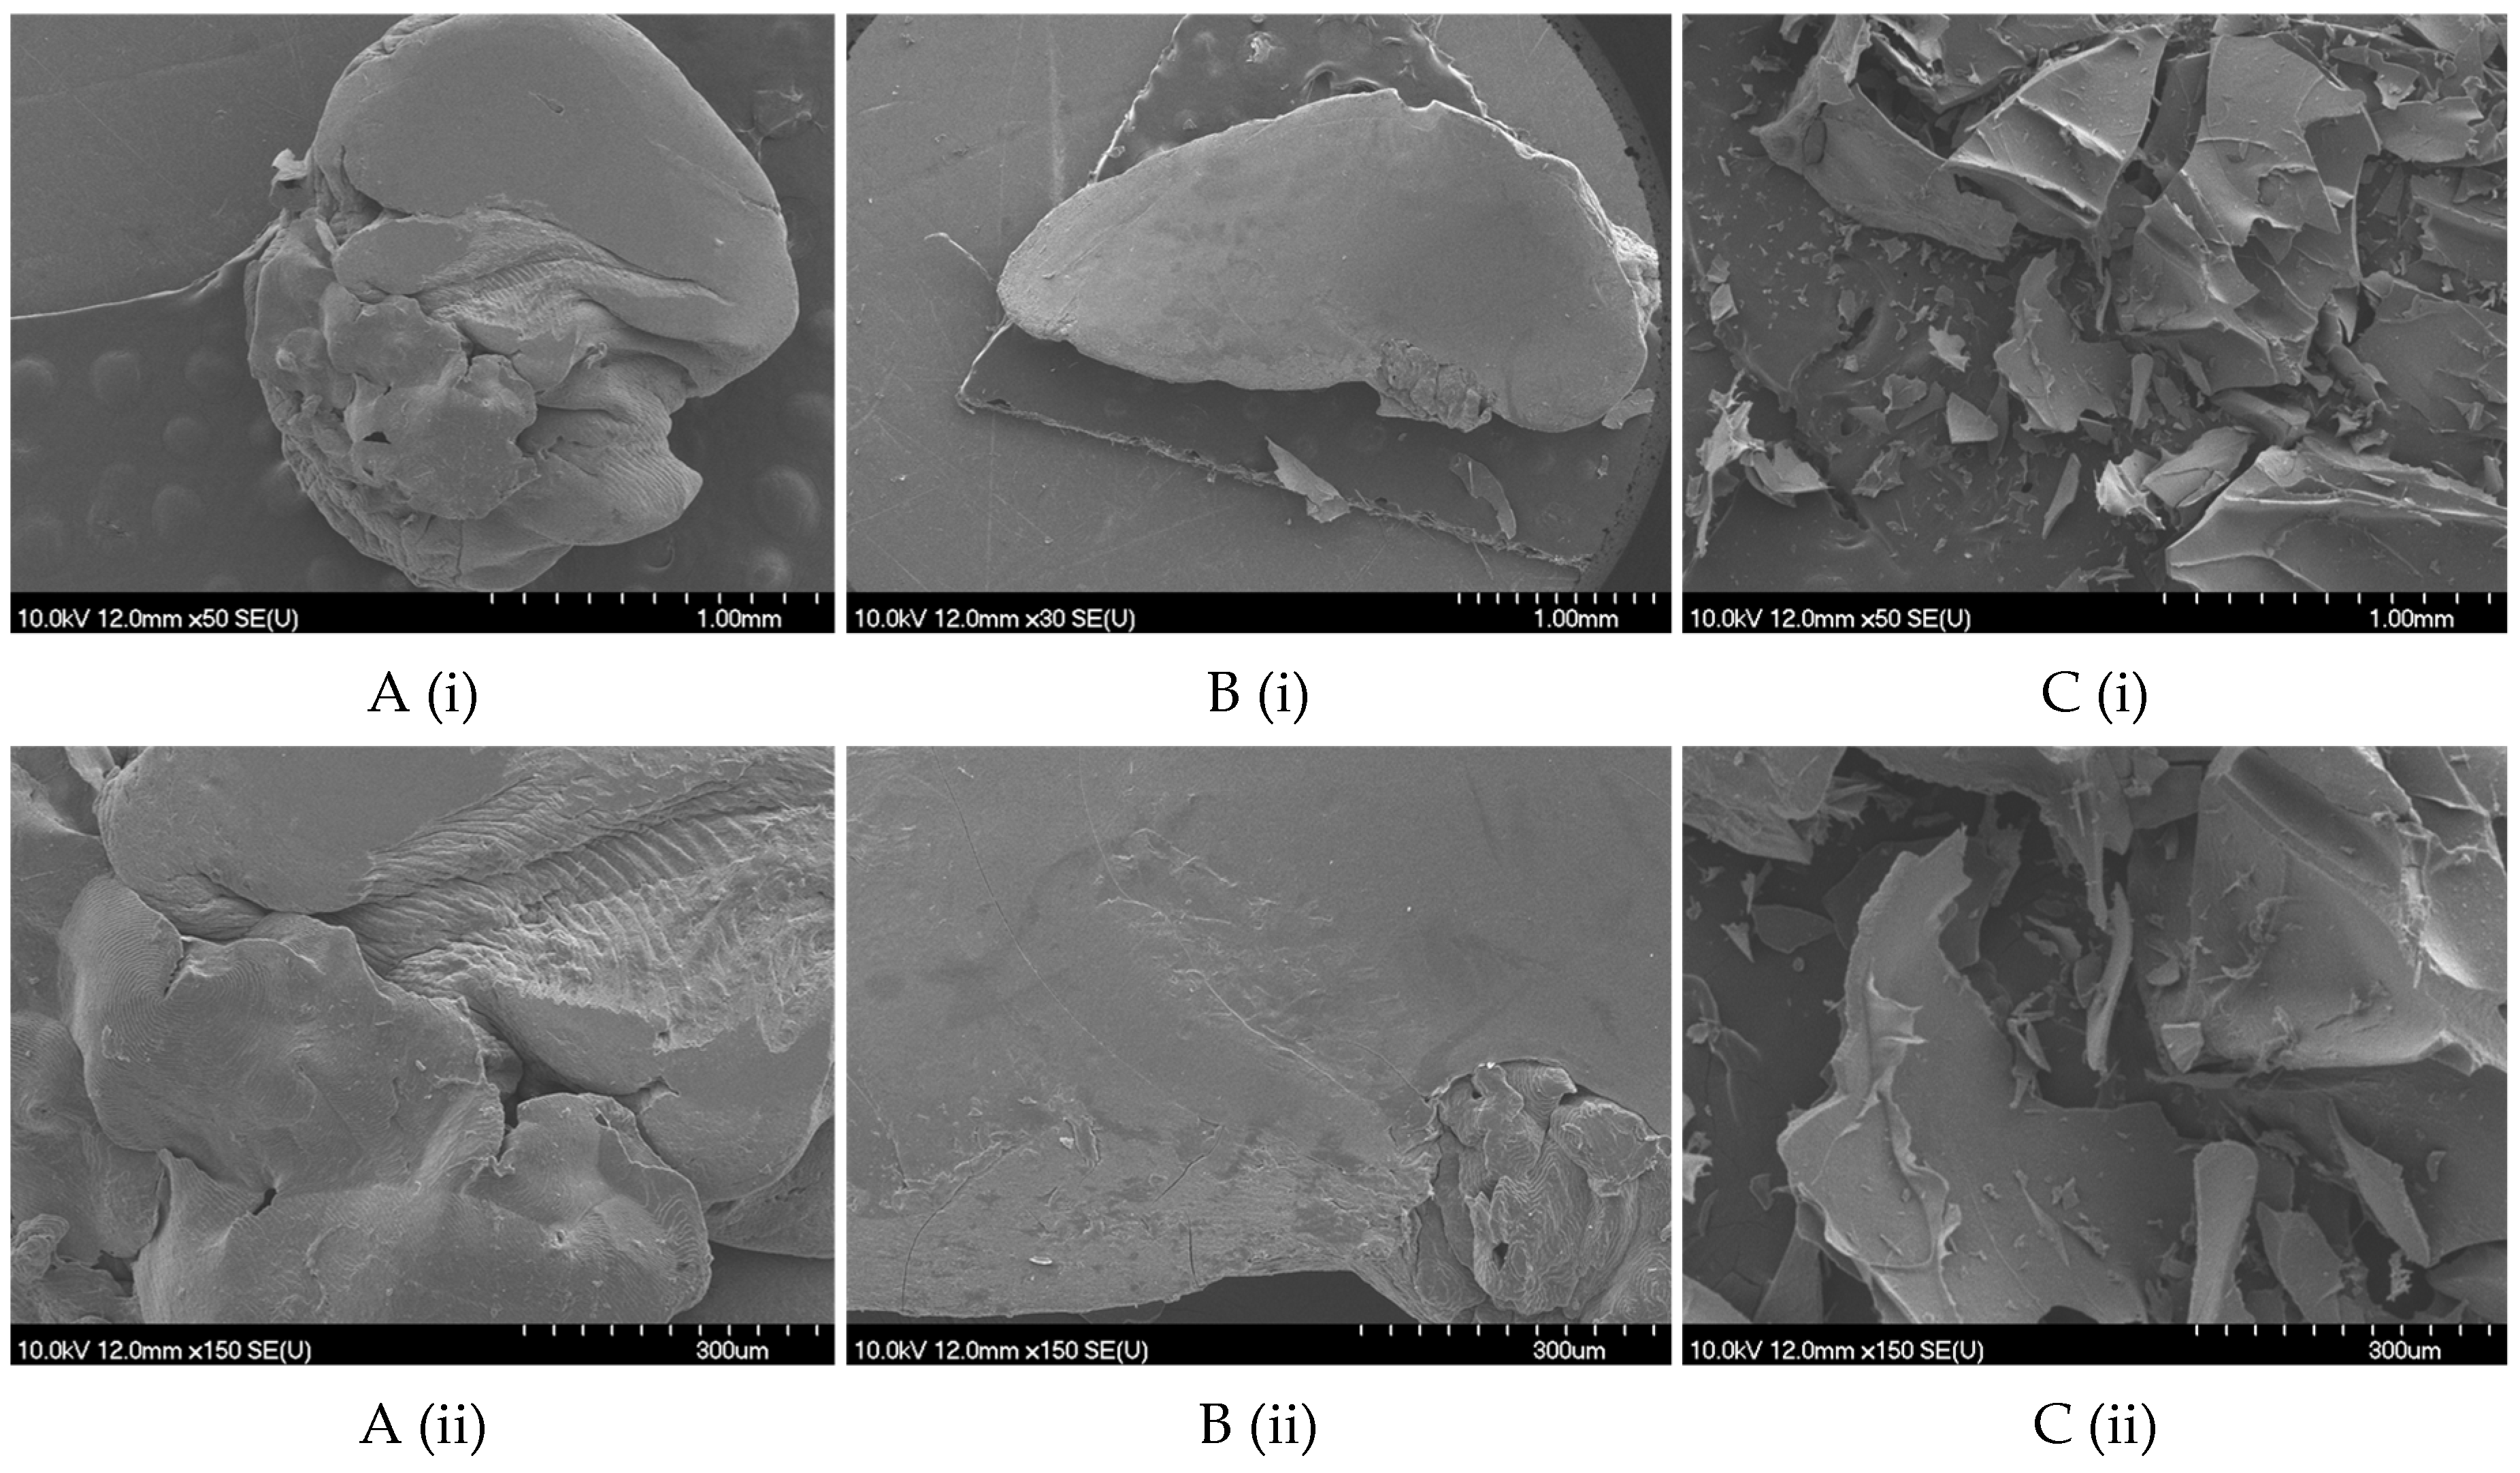
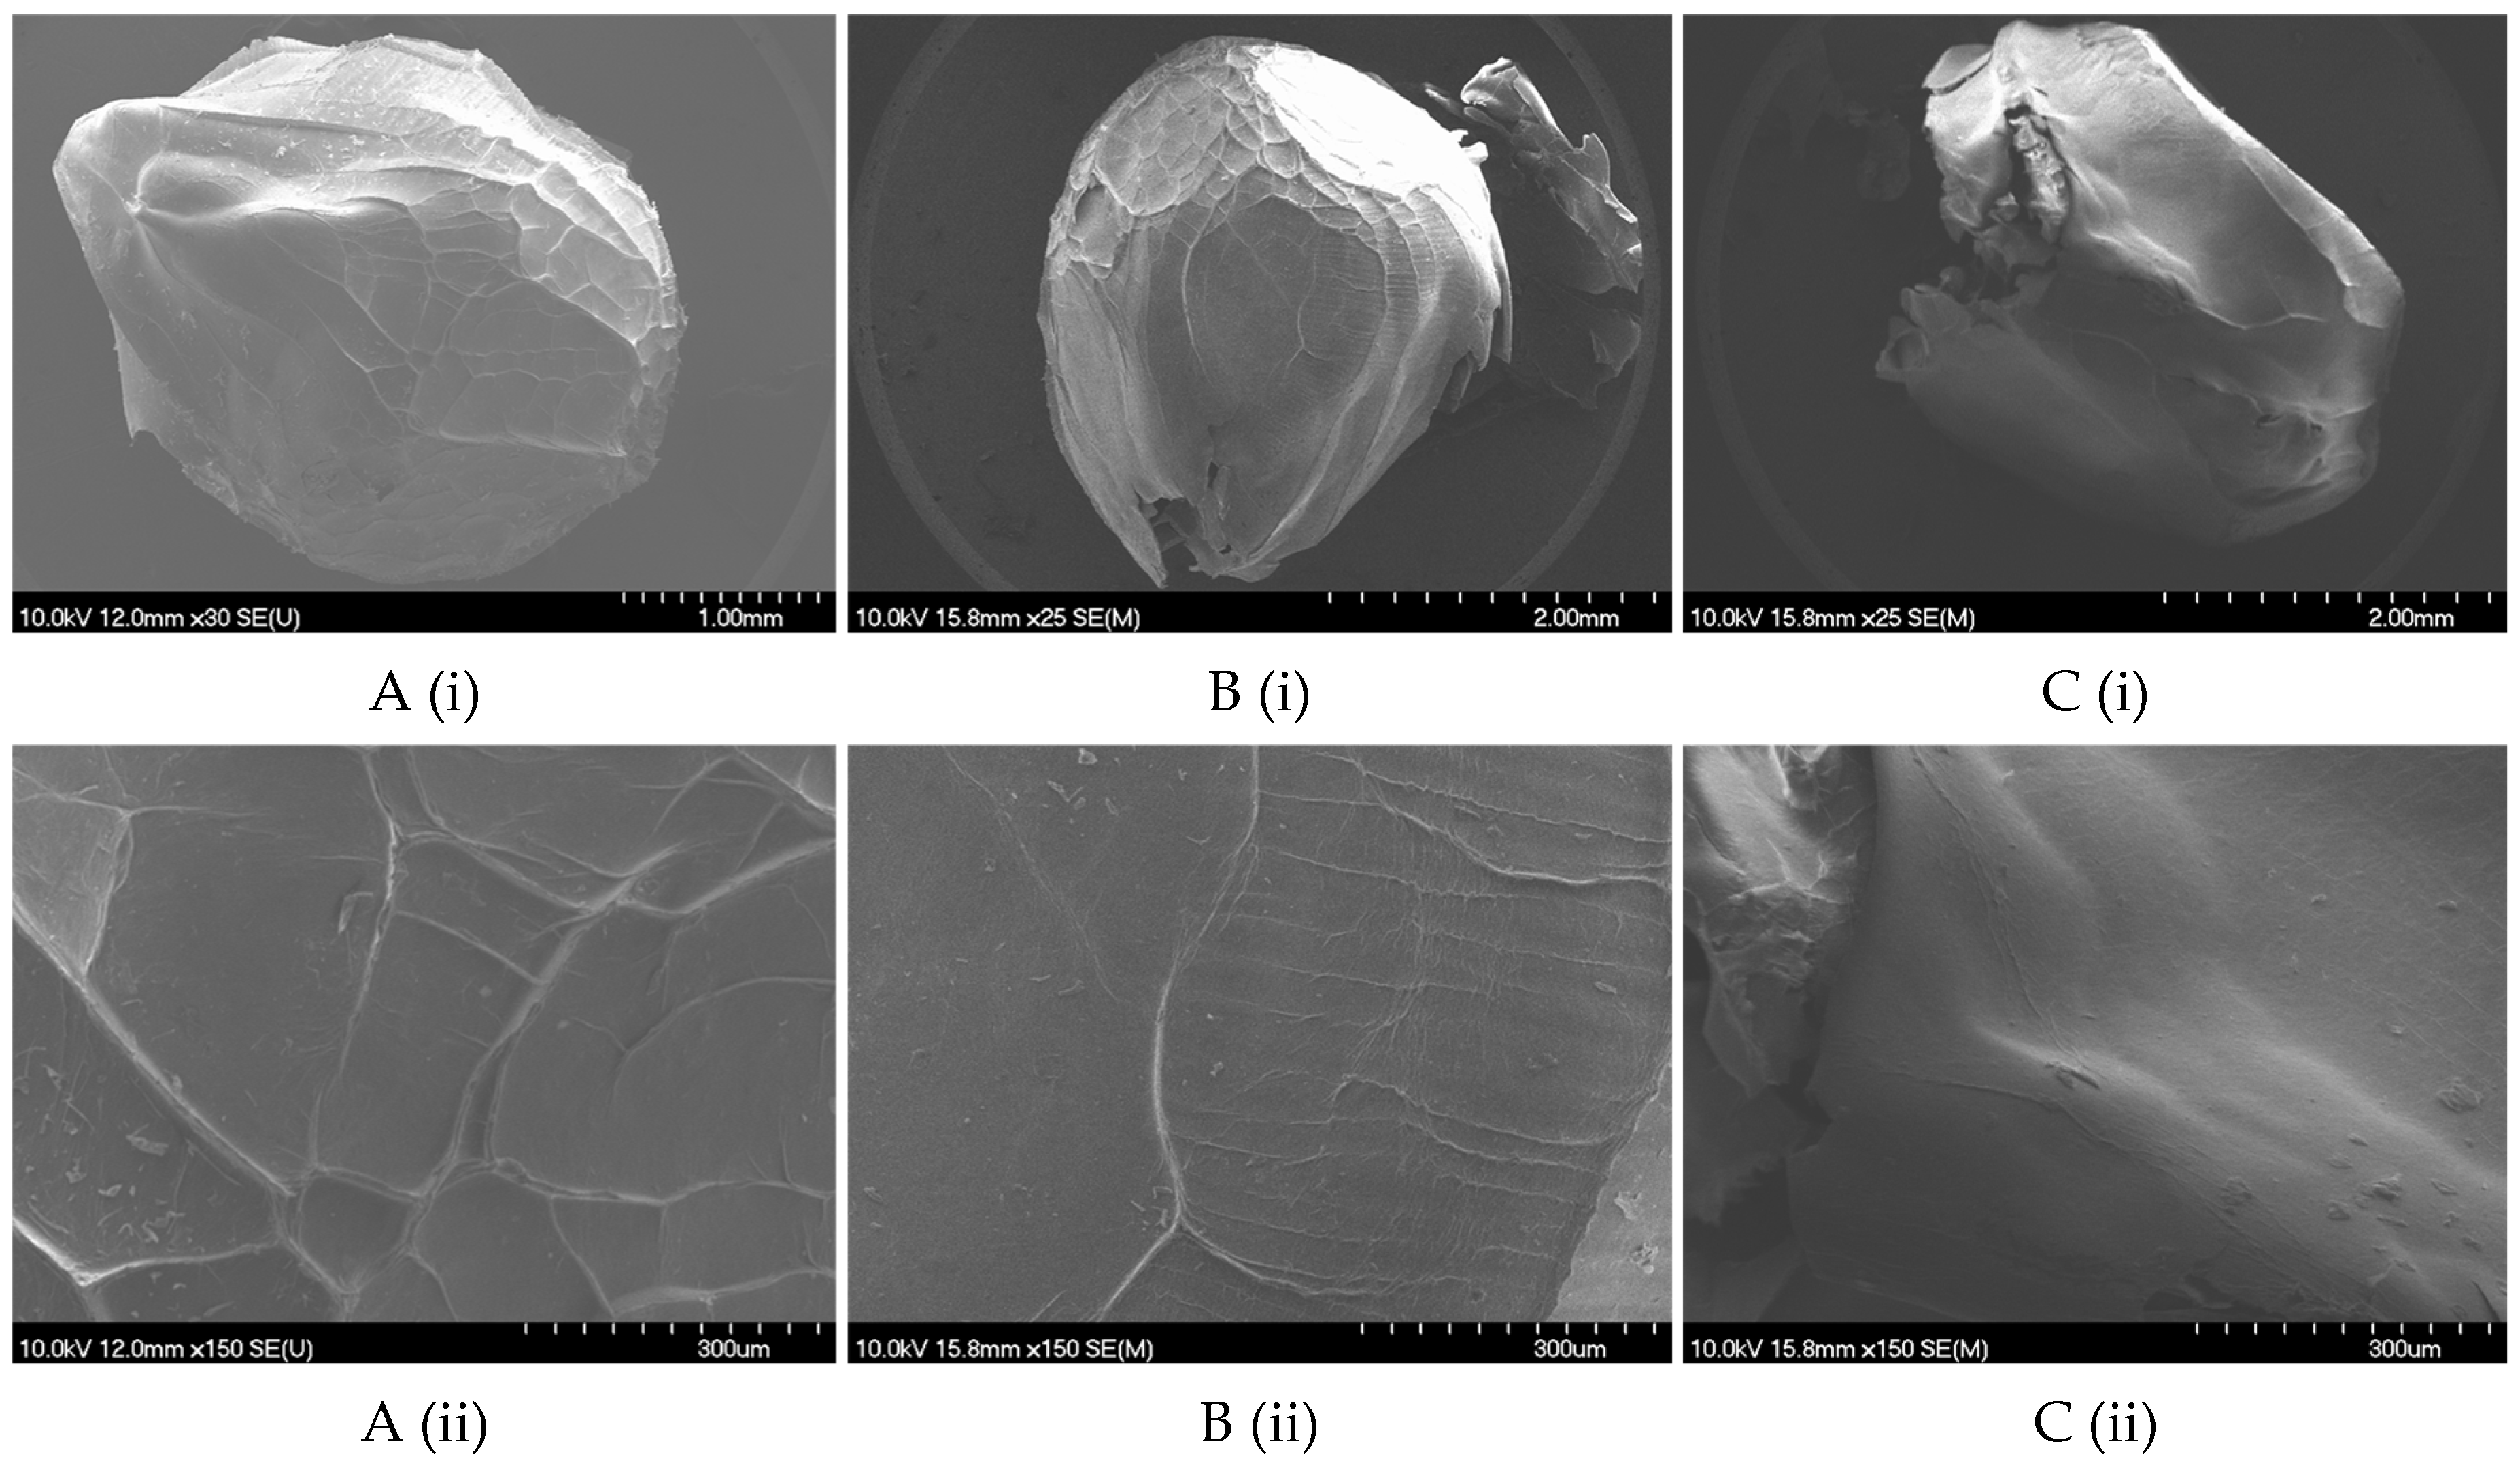
2.2.1. Size, Shape, and Morphology
2.2.2. Texture
2.3. In Vitro Release of Encapsulated Phenolic Compounds
3. Conclusions
4. Materials and Methods
4.1. Reagents and Chemicals
4.2. Grape Pomace
4.3. Phenol-Rich Grape Pomace Extract Preparation
4.4. Determination of Total Phenolic Content
4.5. Encapsulation by Ionic Gelation
4.6. Encapsulation Efficiency Determination
4.7. Hydrogel Drying Methods
- Air drying—the hydrogels were placed on glass Petri dish so they did not touch, and dried at room temperature for 24 hours;
- Vacuum drying—the hydrogels were placed in Petri dishes, places so they did not touch, and dried in preheated vacuum dryer (WOV-30, Witeg, Wertheim, Germany) at 50 °C under pressure of 300 mbar for 5 to 8 hours, depending on sample;
- Freeze-drying—the hydrogel microbeads previously frozen at -80 °C (SWUF Ultra Low Temperature Smart Freezer, Witeg, Wertheim, Germany) were dried in freeze-drier (Freeze-dryer Alpha 2-4 LSCplus, Christ, Osterode am Harz, Germany) at -83 °C under a vacuum 0.250 mbar for 24–72 hour, depending on sample.
4.8. Characterization of Hydrogels and Dried Microbeads
4.8.1. Determination of Geometric Characteristics
4.8.2. Scanning Electron Microscopy (SEM)
4.8.3. Texture Determination
4.9. Release Study of Encapsulated Phenolic Compounds
4.10. Statistical Analysis
Supplementary Materials
Author Contributions
Funding
Institutional Review Board Statement
Informed Consent Statement
Data Availability Statement
Acknowledgments
Conflicts of Interest
References
- Zabot, G.L.; Schaefer Rodrigues, F.; Polano Ody, L.; Vinícius Tres, M.; Herrera, E.; Palacin, H.; Córdova-Ramos, J.S.; Best, I.; Olivera-Montenegro, L. Encapsulation of Bioactive Compounds for Food and Agricultural Applications. Polymers 2022, 14, 4194. [Google Scholar] [CrossRef]
- Antonić, B.; Jančíková, S.; Dordević, D.; Tremlová, B. Grape Pomace Valorization: A Systematic Review and Meta-Analysis. Foods 2020, 9, 1627. [Google Scholar] [CrossRef]
- Ćorković, I.; Pichler, A.; Šimunović, J.; Kopjar, M. Hydrogels: Characteristics and Application as Delivery Systems of Phenolic and Aroma Compounds. Foods 2021, 10, 1252. [Google Scholar] [CrossRef] [PubMed]
- Ta, L.P.; Bujna, E.; Antal, O.; Ladányi, M.; Juhász, R.; Szécsi, A.; Kun, S.; Sudheer, S.; Gupta, V.K.; Nguyen, Q.D. Effects of Various Polysaccharides (Alginate, Carrageenan, Gums, Chitosan) and Their Combination with Prebiotic Saccharides (Resistant Starch, Lactosucrose, Lactulose) on the Encapsulation of Probiotic Bacteria Lactobacillus Casei 01 Strain. Int. J. Biol. Macromol. 2021, 183, 1136–1144. [Google Scholar] [CrossRef]
- Wang, P.; Luo, Z.; Xiao, Z. Preparation, Physicochemical Characterization and In Vitro Release Behavior of Resveratrol-Loaded Oxidized Gellan Gum/Resistant Starch Hydrogel Beads. Carbohydr. Polym. 2021, 260, 117794. [Google Scholar] [CrossRef]
- Sahoo, D.R.; Biswal, T. Alginate and Its Application to Tissue Engineering. SN Appl. Sci. 2021, 3, 30. [Google Scholar] [CrossRef]
- Qin, Y. Alginate Fibres: An Overview of the Production Processes and Applications in Wound Management. Polym. Int. 2008, 57, 171–180. [Google Scholar] [CrossRef]
- Gong, Y.; Han, G.T.; Zhang, Y.M.; Zhang, J.F.; Jiang, W.; Tao, X.W.; Gao, S.C. Preparation of Alginate Membrane for Tissue Engineering. J. Polym. Eng. 2016, 36, 363–370. [Google Scholar] [CrossRef]
- Kurowiak, J.; Kaczmarek-Pawelska, A.; Mackiewicz, A.G.; Bedzinski, R. Analysis of the Degradation Process of Alginate-Based Hydrogels in Artificial Urine for Use as a Bioresorbable Material in the Treatment of Urethral Injuries. Processes 2020, 8, 304. [Google Scholar] [CrossRef]
- Stoll, L.; Costa, T.M.H.; Jablonski, A.; Flôres, S.H.; De Oliveira Rios, A. Microencapsulation of Anthocyanins with Different Wall Materials and Its Application in Active Biodegradable Films. Food Bioprocess. Technol. 2016, 9, 172–181. [Google Scholar] [CrossRef]
- Pudziuvelyte, L.; Marksa, M.; Sosnowska, K.; Winnicka, K.; Morkuniene, R.; Bernatoniene, J. Freeze-Drying Technique for Microencapsulation of Elsholtzia Ciliata Ethanolic Extract Using Different Coating Materials. Molecules 2020, 25, 2237. [Google Scholar] [CrossRef]
- Tonon, R.V.; Brabet, C.; Pallet, D.; Brat, P.; Hubinger, M.D. Physicochemical and Morphological Characterisation of Açai (Euterpe Oleraceae Mart.) Powder Produced with Different Carrier Agents. Int. J. Food Sci. Technol. 2009, 44, 1950–1958. [Google Scholar] [CrossRef]
- Riseh, R.S.; Tamanadar, E.; Pour, M.M.; Thakur, V.K. Novel Approaches for Encapsulation of Plant Probiotic Bacteria with Sustainable Polymer Gums: Application in the Management of Pests and Diseases. Adv. Polym. Technol. 2022, 2022, 1–10. [Google Scholar] [CrossRef]
- Böger, B.R.; Georgetti, S.R.; Kurozawa, L.E. Microencapsulation of Grape Seed Oil by Spray Drying. Food Sci. Technol. 2018, 38, 263–270. [Google Scholar] [CrossRef]
- Zuanon, L.A.C.; Malacrida, C.R.; Telis, V.R.N. Production of Turmeric Oleoresin Microcapsules by Complex Coacervation with Gelatin–Gum A Rabic. J. Food Process Eng. 2013, 36, 364–373. [Google Scholar] [CrossRef]
- Rigon, R.T.; Zapata Noreña, C.P. Microencapsulation by Spray-Drying of Bioactive Compounds Extracted from Blackberry (Rubus Fruticosus). J. Food Sci. Technol. 2016, 53, 1515–1524. [Google Scholar] [CrossRef] [PubMed]
- Estevinho, B.N.; Damas, A.M.; Martins, P.; Rocha, F. Microencapsulation of β-Galactosidase with Different Biopolymers by a Spray-Drying Process. Food Res. Int. 2014, 64, 134–140. [Google Scholar] [CrossRef] [PubMed]
- Sharifi, S.; Rezazad-Bari, M.; Alizadeh, M.; Almasi, H.; Amiri, S. Use of Whey Protein Isolate and Gum Arabic for the Co-Encapsulation of Probiotic Lactobacillus Plantarum and Phytosterols by Complex Coacervation: Enhanced Viability of Probiotic in Iranian White Cheese. Food Hydrocoll. 2021, 113, 106496. [Google Scholar] [CrossRef]
- Balaghi, S.; Mohammadifar, M.A.; Zargaraan, A. Physicochemical and Rheological Characterization of Gum Tragacanth Exudates from Six Species of Iranian Astragalus. Food Biophys. 2010, 5, 59–71. [Google Scholar] [CrossRef]
- Yoon, H.J.; Shin, S.R.; Cha, J.M.; Lee, S.-H.; Kim, J.-H.; Do, J.T.; Song, H.; Bae, H. Cold Water Fish Gelatin Methacryloyl Hydrogel for Tissue Engineering Application. PLoS ONE 2016, 11, e0163902. [Google Scholar] [CrossRef] [PubMed]
- Al-Nimry, S.; Dayah, A.A.; Hasan, I.; Daghmash, R. Cosmetic, Biomedical and Pharmaceutical Applications of Fish Gelatin/Hydrolysates. Mar. Drugs 2021, 19, 145. [Google Scholar] [CrossRef] [PubMed]
- Raza, Z.A.; Khalil, S.; Ayub, A.; Banat, I.M. Recent Developments in Chitosan Encapsulation of Various Active Ingredients for Multifunctional Applications. Carbohydr. Res. 2020, 492, 108004. [Google Scholar] [CrossRef] [PubMed]
- Vaz, J.M.; Pezzoli, D.; Chevallier, P.; Campelo, C.S.; Candiani, G.; Mantovani, D. Antibacterial Coatings Based on Chitosan for Pharmaceutical and Biomedical Applications. Curr. Pharm. Des. 2018, 24, 866–885. [Google Scholar] [CrossRef]
- Ong, S.-Y.; Wu, J.; Moochhala, S.M.; Tan, M.-H.; Lu, J. Development of a Chitosan-Based Wound Dressing with Improved Hemostatic and Antimicrobial Properties. Biomaterials 2008, 29, 4323–4332. [Google Scholar] [CrossRef]
- Bhattarai, N.; Gunn, J.; Zhang, M. Chitosan-Based Hydrogels for Controlled, Localized Drug Delivery. Adv. Drug Deliv. Rev. 2010, 62, 83–99. [Google Scholar] [CrossRef]
- Ranganathan, S.; Balagangadharan, K.; Selvamurugan, N. Chitosan and Gelatin-Based Electrospun Fibers for Bone Tissue Engineering. Int. J. Biol. Macromol. 2019, 133, 354–364. [Google Scholar] [CrossRef] [PubMed]
- Laine, P.; Kylli, P.; Heinonen, M.; Jouppila, K. Storage Stability of Microencapsulated Cloudberry (Rubus Chamaemorus) Phenolics. J. Agric. Food Chem. 2008, 56, 11251–11261. [Google Scholar] [CrossRef]
- Apoorva, A.; Rameshbabu, A.P.; Dasgupta, S.; Dhara, S.; Padmavati, M. Novel pH-Sensitive Alginate Hydrogel Delivery System Reinforced with Gum Tragacanth for Intestinal Targeting of Nutraceuticals. Int. J. Biol. Macromol. 2020, 147, 675–687. [Google Scholar] [CrossRef]
- Li, Q.; Duan, M.; Hou, D.; Chen, X.; Shi, J.; Zhou, W. Fabrication and Characterization of Ca(II)-Alginate-Based Beads Combined with Different Polysaccharides as Vehicles for Delivery, Release and Storage of Tea Polyphenols. Food Hydrocolloids 2021, 112, 106274. [Google Scholar] [CrossRef]
- Dos Santos, M.A.; Grenha, A. Polysaccharide Nanoparticles for Protein and Peptide Delivery. In Advances in Protein Chemistry and Structural Biology; Donev, R., Ed.; Elsevier, 2015; Vol. 98, pp. 223–261 ISBN 978-0-12-802828-5.
- Mateus, N.; Carvalho, E.; Luı́s, C.; De Freitas, V. Influence of the Tannin Structure on the Disruption Effect of Carbohydrates on Protein–Tannin Aggregates. Anal. Chim. Acta 2004, 513, 135–140. [Google Scholar] [CrossRef]
- Shahidi, F.; Dissanayaka, C.S. Phenolic-Protein Interactions: Insight from in-Silico Analyses—a Review. Food Prod. Process. Nutr. 2023, 5, 2. [Google Scholar] [CrossRef]
- Moschona, A.; Liakopoulou-Kyriakides, M. Encapsulation of Biological Active Phenolic Compounds Extracted from Wine Wastes in Alginate-Chitosan Microbeads. J. Microencapsul. 2018, 35, 229–240. [Google Scholar] [CrossRef] [PubMed]
- Xing, N.; Li, Y.K.; Li, M.S.; Tian, F. Insight into Effects of Different Drying Methods on Morphological Properties of Sodium Alginate-Chitosan Double Coacervation Hydrogel Beads. Appl. Mech. Mater. 2012, 184–185, 1025–1029. [Google Scholar] [CrossRef]
- Bušić, A.; Belščak-Cvitanović, A.; Vojvodić Cebin, A.; Karlović, S.; Kovač, V.; Špoljarić, I.; Mršić, G.; Komes, D. Structuring New Alginate Network Aimed for Delivery of Dandelion (Taraxacum Officinale L.) Polyphenols Using Ionic Gelation and New Filler Materials. Food Res. Int. 2018, 111, 244–255. [Google Scholar] [CrossRef] [PubMed]
- Lin, C.-C.; Metters, A.T. Hydrogels in Controlled Release Formulations: Network Design and Mathematical Modeling. Adv. Drug Deliv. Rev. 2006, 58, 1379–1408. [Google Scholar] [CrossRef] [PubMed]
- Abdin, M.; Salama, M.A.; Riaz, A.; Akhtar, H.M.S.; Elsanat, S.Y. Enhanced the Entrapment and Controlled Release of Syzygium Cumini Seeds Polyphenols by Modifying the Surface and Internal Organization of Alginate-based Microcapsules. J. Food Process. Preserv. 2021, 45, e15100. [Google Scholar] [CrossRef]
- Guzman-Villanueva, D.; El-Sherbiny, I.M.; Herrera-Ruiz, D.; Smyth, H.D.C. Design and In Vitro Evaluation of a New Nano-Microparticulate System for Enhanced Aqueous-Phase Solubility of Curcumin. Biomed. Res. Int. 2013, 2013, 1–9. [Google Scholar] [CrossRef]
- Parikh, D.M. Vacuum Drying: Basics and Application. Chem. Eng. 2015, 122, 48–54. [Google Scholar]
- Essifi, K.; Brahmi, M.; Berraaouan, D.; Ed-Daoui, A.; El Bachiri, A.; Fauconnier, M.-L.; Tahani, A. Influence of Sodium Alginate Concentration on Microcapsules Properties Foreseeing the Protection and Controlled Release of Bioactive Substances. J. Chem. 2021, 2021, 1–13. [Google Scholar] [CrossRef]
- Devi, N.; Kakati, D.K. Smart Porous Microparticles Based on Gelatin/Sodium Alginate Polyelectrolyte Complex. J. Food Eng. 2013, 117, 193–204. [Google Scholar] [CrossRef]
- Nayak, A.K.; Pal, D. Development of pH-Sensitive Tamarind Seed Polysaccharide–Alginate Composite Beads for Controlled Diclofenac Sodium Delivery Using Response Surface Methodology. Int. J. Biol. Macromol. 2011, 49, 784–793. [Google Scholar] [CrossRef]
- Tsai, F.-H.; Kitamura, Y.; Kokawa, M. Effect of Gum Arabic-Modified Alginate on Physicochemical Properties, Release Kinetics, and Storage Stability of Liquid-Core Hydrogel Beads. Carbohydr. Polym. 2017, 174, 1069–1077. [Google Scholar] [CrossRef]
- Dai, Y.; Li, P.; Zhang, J.; Wang, A.; Wei, Q. Swelling Characteristics and Drug Delivery Properties of Nifedipine-loaded pH Sensitive Alginate–Chitosan Hydrogel Beads. J. Biomed. Mater. Res. 2008, 86B, 493–500. [Google Scholar] [CrossRef] [PubMed]
- Siripatrawan, U.; Vitchayakitti, W. Improving Functional Properties of Chitosan Films as Active Food Packaging by Incorporating with Propolis. Food Hydrocoll. 2016, 61, 695–702. [Google Scholar] [CrossRef]
- Kurozawa, L.E.; Hubinger, M.D. Hydrophilic Food Compounds Encapsulation by Ionic Gelation. Curr. Opin. Food Sci. 2017, 15, 50–55. [Google Scholar] [CrossRef]
- Deladino, L.; Anbinder, P.S.; Navarro, A.S.; Martino, M.N. Encapsulation of Natural Antioxidants Extracted from Ilex Paraguariensis. Carbohydr. Polym. 2008, 71, 126–134. [Google Scholar] [CrossRef]
- Anbinder, P.S.; Deladino, L.; Navarro, A.S.; Amalvy, J.I.; Martino, M.N. Yerba Mate Extract Encapsulation with Alginate and Chitosan Systems: Interactions between Active Compound Encapsulation Polymers. J. Encapsulation Adsorpt. Sci. 2011, 1, 80–87. [Google Scholar] [CrossRef]
- Belščak-Cvitanović, A.; Komes, D.; Karlović, S.; Djaković, S.; Špoljarić, I.; Mršić, G.; Ježek, D. Improving the Controlled Delivery Formulations of Caffeine in Alginate Hydrogel Beads Combined with Pectin, Carrageenan, Chitosan and Psyllium. Food Chem. 2015, 167, 378–386. [Google Scholar] [CrossRef] [PubMed]
- Belščak-Cvitanović, A.; Đorđević, V.; Karlović, S.; Pavlović, V.; Komes, D.; Ježek, D.; Bugarski, B.; Nedović, V. Protein-Reinforced and Chitosan-Pectin Coated Alginate Microparticles for Delivery of Flavan-3-Ol Antioxidants and Caffeine from Green Tea Extract. Food Hydrocoll. 2015, 51, 361–374. [Google Scholar] [CrossRef]
- Antigo, J.L.D.; Bergamasco, R.D.C.; Madrona, G.S. Effect of Ph on the Stability of Red Beet Extract (Beta Vulgaris l.) Microcapsules Produced by Spray Drying or Freeze Drying. Food Sci. Technol. 2017, 38, 72–77. [Google Scholar] [CrossRef]
- Martinović, J.; Lukinac, J.; Jukić, M.; Ambrus, R.; Planinić, M.; Šelo, G.; Klarić, A.-M.; Perković, G.; Bucić-Kojić, A. Physicochemical Characterization and Evaluation of Gastrointestinal In Vitro Behavior of Alginate-Based Microbeads with Encapsulated Grape Pomace Extracts. Pharmaceutics 2023, 15, 980. [Google Scholar] [CrossRef] [PubMed]
- Martinović, J.; Lukinac, J.; Jukić, M.; Ambrus, R.; Planinić, M.; Šelo, G.; Klarić, A.-M.; Perković, G.; Bucić-Kojić, A. In Vitro Bioaccessibility Assessment of Phenolic Compounds from Encapsulated Grape Pomace Extract by Ionic Gelation. Molecules 2023, 28, 5285. [Google Scholar] [CrossRef] [PubMed]
- Waterhouse, A.L. Determination of Total Phenolics. In Current Protocols in Food Analytical Chemistry; Wrolstad, R.E., Ed.; John Wiley & Sons Inc.: New York, NY, USA, 2001; pp. I1.1.1–I1.1.8. [Google Scholar]
- ImageJ User Guide IJ 1.46r. Available online: https://imagej.nih.gov/ij/docs/guide/146.html (accessed on 10 January 2023).
- Brodkorb, A.; Egger, L.; Alminger, M.; Alvito, P.; Assunção, R.; Ballance, S.; Bohn, T.; Bourlieu-Lacanal, C.; Boutrou, R.; Carrière, F.; et al. INFOGEST Static In Vitro Simulation of Gastrointestinal Food Digestion. Nat. Protoc. 2019, 14, 991–1014. [Google Scholar] [CrossRef] [PubMed]


| # | Coating | Encapsulation feed | Crosslinking solution | Immersion solution | |||
|---|---|---|---|---|---|---|---|
| 1 | SA | CSE sodium alginate |
1.0% 3.0% |
CaCl2 | 0.25 M | - | |
| 2 | SA+MDl | CSE sodium alginate maltodextrin (DE 4–7) |
1.0% 3.0% 1.2% |
CaCl2 | 0.25 M | - | |
| 3 | SA+MDh | CSE sodium alginate maltodextrin (DE 16.5–19.5) |
1.0% 3.0% 1.2% |
CaCl2 | 0.25 M | - | |
| 4 | SA+GT | CSE sodium alginate gum Tragacanth |
1.0% 3.0% 0.15% |
CaCl2 | 0.25 M | - | |
| 5 | SA+GA | CSE sodium alginate gum Arabic |
1.0% 3.0% 1.6% |
CaCl2 | 0.25 M | - | |
| 6 | SA+GEL | CSE sodium alginate gelatin |
1.0% 3.0% 5.0% |
CaCl2 | 0.25 M | - | |
| 7 | SA/1.5CH | CSE sodium alginate |
1.0% 3.0% |
CaCl2 chitosan |
0.25 M 1.5% |
- | |
| 8 | SA/1.0CH | CSE sodium alginate |
1.0% 3.0% |
CaCl2 chitosan |
0.25 M 1.0% |
- | |
| 9 | SA/0.5CH | CSE sodium alginate |
1.0% 3.0% |
CaCl2 chitosan |
0.25 M 0.5% |
- | |
| 10 | SA(1.5CH) | CSE sodium alginate |
1.0% 3.0% |
CaCl2 | 0.25 M | chitosan | 1.5% |
| 11 | SA(1.0CH) | CSE sodium alginate |
1.0% 3.0% |
CaCl2 | 0.25 M | chitosan | 1.0% |
| 12 | SA(0.5CH) | CSE sodium alginate |
1.0% 3.0% |
CaCl2 | 0.25 M | chitosan | 0.5% |
Disclaimer/Publisher’s Note: The statements, opinions and data contained in all publications are solely those of the individual author(s) and contributor(s) and not of MDPI and/or the editor(s). MDPI and/or the editor(s) disclaim responsibility for any injury to people or property resulting from any ideas, methods, instructions or products referred to in the content. |
© 2023 by the authors. Licensee MDPI, Basel, Switzerland. This article is an open access article distributed under the terms and conditions of the Creative Commons Attribution (CC BY) license (http://creativecommons.org/licenses/by/4.0/).


