1. Introduction
Sustainable development is defined in the Brundtland Report (UN World Commission on Environment and Development, 1987) as “development that meets the needs of the present without compromising the ability of future generations to meet their own needs”. In the financial world, it translates into the term ESG, which was coined in 2004 with the publication of the report “Who Cares Wins” by the UN Global Compact (2004). According to this acronym, companies should care about three pillars while conducting their businesses:
The environmental pillar: it evaluates the sustainability of those companies’ activities carrying a direct and indirect impact on the environment;
The social pillar: it evaluates the sustainability of the corporations by looking at the way they can manage the impact of business activities on the social dimension;
The governance pillar: it is related to how a firm is managed by its top management, and it focuses on the alignment between the interests of the executive management of a company and those of its shareholders and stakeholders, as well on issues concerning business ethics and the management board independence, diversity, and structure.
According to the well-known Shareholder Theory by Friedman (2007), the ultimate objective of a company consists in the maximization of the shareholders' value. According to this theory, companies should not deal with these issues, unless this is instrumental to increasing the value generated for shareholders. However, in the last years, an inversion of this trend has been observed due to a higher consciousness of sustainability issues. This fact has its roots in the higher frequency of extreme weather events, social scandals affecting some of the biggest players in the market, and the financial crisis affecting the financial markets in 2008 (which had a huge negative impact on the wealth of consumers). All these events led to higher attention towards sustainability by some relevant stakeholders, such as policymakers, NGOs, and citizens. Furthermore, in the latest years, financial actors have realized that investing in sustainable companies leads to higher returns, as demonstrated by several studies investigating the relationship between the ESG pillars and corporate performances; among them, the most comprehensive is the one by Friede, Busch and Bassen (2015). As a result, as reported by the Global Sustainable Investment Alliance (2021), the sustainable investing assets under management are continuing to increase worldwide. The largest increase (48% of sustainable assets growth) over the past two years has been observed in Canada, followed by The United States (42%) and Japan (34%). This trend, in turn, led to a call for objective metrics able to provide a comprehensive picture of the sustainability performances achieved by the target companies. As a result, several rating agencies developed their own approach to ESG performance appraisal. More specifically, the ESG risk ratings assess the extent to which a company’s economic value is at risk due to ESG factors. However, differently from credit ratings, ESG measurement is affected by two main issues: the heterogeneity among the evaluation criteria used by the rating agencies, and the absence of disclosure. Both problems are due to a lack of regulation and standards. The methodologies used by different rating agencies are so diverse that a company could receive a high rating from one agency and a low rating from another. This divergence in the evaluation by the various rating agencies is creating many problems both for companies and investors. In particular, financial investors may be disorientated and may be led to ignore these ratings in their decision-making processes. This study aims to examine the impact of the ratings released by MSCI and Refinitiv on financial markets. It will analyze the relationship between the regular upgrades or downgrades announced by these two rating agencies and the market value of a selected group of major publicly traded companies.
2. Lierature Review
In the growing body of literature concerning ESG, two fundamental topics are those concerning the relationship between sustainability and financial performances on the one hand, and the ESG ratings divergence phenomenon, on the other. Starting from the first issue, several contributions can be found in literature, which investigate the link between environmental, social, and governance performances and financial performances and/or the market value of a company. For example, the papers by Derwall et al. (2004) and Manrique and Martí-Ballester (2004) prove that “eco-friendly" portfolios are the ones experiencing higher financial performances, especially in financial crisis periods. As for the social pillar, Edmans (2011) investigates the impact that a high level of employee satisfaction could have on long-run stock returns. This paper shows that a socially sustainable portfolio shows an extra return of 3.5% compared to the non-socially sustainable one. Lastly, referring to the governance pillar, the studies by Gompers, Ishii and Metrick (2003) and Velte (2017) show the existence of a positive correlation between corporate governance performances and the financial performances of companies.
The next step aims at investigating the most relevant papers that study in a comprehensive way the impact of ESG performances on the firm's ones, considering the three pillars at the same time. In this regard, the most exhaustive paper to be cited is the one by Friede, Busch and Bassen (2015), which is a recapitulatory work that provides a comprehensive of more than 2000 studies’ findings, demonstrating that most of these papers agree on the positive correlation between ESG and firms’ value and performances. However, it must be underlined that most of the works analyzed by the authors do not use the term “ESG” (since these works predate the time when the term “ESG” was coined), and just a few of them use the scores provided by ESG rating agencies as the reference metric of the ESG performance of a company.
If, instead, we limit the analysis to the works that take into consideration the ESG metrics provided by the rating agencies, the number of works is considerably reduced. Among the most recent and interesting papers, we can cite the one by Garcia and Orsato (2020), who examined the correlation between ESG performances (as measured by Thomson Reuters ASSET4) and financial performances of 2165 companies from both developed and developing countries. The main findings are that firms from developed countries show a positive correlation between ESG and financial performances, while this is not true for companies based in developing countries. Yoon, Lee and Byun (2018) analyze the effect of ESG ratings on the value of Korean firms. The ESG rating agency used is KCGS. The results show that sustainability performances positively and significantly affect a firm’s market value. However, quite surprisingly the impact is lower for companies that operate in “environmentally-sensitive” industries (i.e. industries characterized by high environmental impact) than for those operating in “non-sensitive” ones. Another work that focuses on the impact of ESG practices on firm profitability and value in emerging countries is the one by Naeem, Ullah and Jan (2021). ESG data are extracted from Thomson Reuters ASSET4. The analysis shows that ESG performances have a significant positive impact both on firms’ profitability (measured through ROA) and firm value (measured through Tobin’s Q). Similarly, Zhou, Liu and Luo (2022) investigate the relationship between ESG performance and firm value in a sample of Chinese listed companies. The ESG rating data are extracted from Syn Tao Green Finance. The peculiarity of this work is that measures of financial performances, operating capacity, and growth rate are used as intermediary variables, mediating the effect of ESG performances on firm value (measured through Tobin Q). The results show that the improvement of ESG performances is conducive to enhancing the market value of a firm and that operating capacity (but not financial performances) plays a relevant mediating effect.
The second topic analyzed in the literature review focuses on the “ESG rating divergence” phenomenon: in this regard, one of the most important studies is that by Berg, Kölbel and Rigobon (2022). The authors investigate the divergence of ESG ratings, and they conclude that this phenomenon exists and can be explained by looking at three principal constituents, namely:
Scope divergence: it happens when the ratings are based on different sets of attributes;
Measurement divergence: in this case, the rating agencies measure the same attribute using different indicators;
Weights divergence: the rating agencies give different relative importance to the attributes.
A similar analysis is conducted by Capizzi et al. (2021) on a sample of Italian-listed companies, leading to similar results. The same can be said about the results of the analysis conducted by Zumente and Lāce (2021).
Moving from these considerations, in their interesting work Billio et al. (2021). created two different types of portfolios:
An “ESG-consistent” portfolio: it is the portfolio composed of the stocks of those companies that are considered ESG leaders by all the analyzed rating agencies;
A “non-ESG” portfolio: it is the one built through a negative screening approach, including all the stocks of those companies that are excluded by institutional investors (due to their poor ESG performances).
What emerges from this study is that, differently from what was stated by most of the previous literature, there are no relevant differences in the performances of the two types of portfolios.
According to the authors, these results can be explained by the frequent divergence in ESG evaluations of the same company by different agencies, which disperses the effect of the ESG investors’ preferences on stocks’ prices, so that, even when there is an agreement, the ESG effect is attenuated and its impact on performances is neutralized.
Starting from the outcome of the literature review, the present work is aimed at investigating the reaction of financial markets to rating agencies’ ESG grade updates, understanding whether possible variations in the sustainability ratings of publicly listed companies have a direct impact on their market value. In doing so, the purpose of this work was to try to answer the following research questions:
I. Does a sustainability rating update have an impact on the market value of a company?
II. Has the reaction of the financial market to the sustainability ratings updates become stronger in the last years, due to growing awareness about sustainability issues and, consequently, the higher degree of attention devoted to this issue by all stakeholders?
3. Materials and Methods
To accomplish these objectives, the methodology adopted was the Event Study, which is a model used to evaluate the impact of an economic event on the valuation of the corporations through the assessment of their Cumulated Average Abnormal Returns (CAAR). This quantitative approach is built on one fundamental pillar: the efficiency of financial markets, meaning that every single economic event is incorporated into the price of financial assets. Hence, the effects of an economic event can be assessed by observing the company’s price in a specific short time window.
3.1. Input Data
The data that was used to feed the model and run the analysis can be classified into two clusters:
▪ The pool of companies analyzed.
▪ The selected rating agencies and their evaluations.
The first step of the analysis consists of the choice of the pool of companies that were at the center of the study. More specifically, the choices made in this regard were taken according to three main drivers, namely the pool dimension, the reference financial markets, and, eventually, the sectors the selected companies belong to. For what concerns the size of the sample, the main constraint for this important decision was represented by the trade-off between the statistical significance of the analysis and the amount of data to be processed in the model. Indeed, the higher the number of companies forming the testing cluster, the higher the robustness of the analysis results but, on the other hand, also the volume of the data to be collected and managed increases exponentially, requiring a higher processing effort. To strike a balance between the two constraints, we opted to select a group of 75 firms for the following reasons. In addition, the companies were chosen to maintain diversity at a global level. This included selecting businesses from major financial markets around the world. In this phase, the selection criteria for the list of firms was based on choosing those with the highest market capitalization while also ensuring a diverse mix of industries. Concerning the criteria used to select the rating agencies, the main constraint was represented by the availability of data: indeed, to have access to the ESG ratings it is necessary either to pay a subscription fee to the rating provider or to be licensed to access to their databases. For these reasons, the choice fell on two of the most relevant and widely acknowledged ESG rating agencies, namely Refinitiv and MSCI.
It is important to clarify why we chose a specific time horizon for our analysis at this point. Due to the significant rise in interest in ESG themes over the past few years and the trade-off between data volume and management effort, we have decided to focus on the period from 2016 to 2021. So, due to the annual updating frequency of ESG ratings, each company had access to a set of 6 events.
3.2. Research Methodology
The methodology used to analyze data was the “Event Study”. To implement the analysis, the present work refers to the typical Event Studies phases illustrated by Campbell, Lo and Mackinlay (1997):
1) Event definition: the first phase consists in the definition of the event of interest and of the event window's length. The focal event of the present work was represented by the sustainability ratings publications by the two selected ESG rating providers: this may lead to three possible events: upgrading, downgrading, or confirmation of the evaluations. These sub-categories were investigated through three distinct and independent Event Studies. As a consequence, the total number of event typologies was equal to 6 (three of each rating agency).
Table 1 reports the number of events for each type of grade update.
To study these events, the event window was represented by a 12 market days time- horizon, and it started two days before the arising of the focal event to avoid possible insider trading behaviors.
2) Selection criteria: this phase of the methodology refers to the choice of the selection criteria adopted to define the sample of companies to be used in the Event Study methodology. In particular, the main steps for the companies’ selection were the following three: the first screening was done according to the reference stock exchange markets; after this choice, the companies experiencing the highest market capitalizations were selected, not forgetting to take into account as a third driver also the industry sectors the firms belong to;
3) Computation of normal and abnormal return: to evaluate the effect of an event, the Event Study methodology recurs to the measurement of the abnormal returns. The abnormal return is defined as the actual ex-post return experienced by the company over the event window minus the normal return of the security over the same period. The normal return, instead, is the return expected in a normal condition, without the occurrence of the specific economic event. To compute the normal returns, the Market Model was selected; this statistical model derives the returns of a specific stock from the return of its belonging market through the formulation presented below:
Starting from this formula, after having estimated the parameters of the Market Model, it is possible to compute the abnormal returns by subtracting the expected returns (that are the ones of the market) from the actual returns of the stock:
4) Estimation procedure: this phase consists in the estimation of the Market Model’s parameters. To implement this step, it was necessary to define the estimation window, which is the period before the arising of the event and used to assess the value of the parameters characterizing the Market Model’s equation. Even for this decision, as in the case of the event window, there was a trade-off; in particular, as the length of the estimation window increases, so does the amount of effort needed to manage the available data, but on the other hand, the robustness of the estimated model will increase too. All the mentioned elements drove the decision of setting the length of the estimation window equal to 30 market days (i.e., from 32 to 2 market days before the focal event).
5) Testing procedure: having estimated the set of all the needed parameters, the abnormal returns can be computed for each ESG rating update event. In particular, to detect if the event of interest has an impact on the security’s price, it was necessary to perform the aggregation of the abnormal return observations. This aggregation was conducted along two dimensions, namely across time and across securities. The first step consisted in aggregating data concerning each security; after this process was completed, it was then possible to proceed with the aggregation both across securities and through time. From the cumulation process described above it was possible to derive the Cumulated Average Abnormal Returns (CAARs) associated with each event typology, which were necessary to test the impact of the rating agencies’ announcements on the stocks’ prices.
4. Results
This section is devoted to the illustration of the results of the empirical analysis. Before moving to the explanation of the results, it is fundamental to explain the criterion applied to interpret the output. The particularity of the applied model consists in the fact that the interpretation of its results can be visualized through a graphical representation. Indeed, the outcome of the model is a graph composed of two fundamental elements:
Two boundaries (the lower bound and upper bound), which delimit the confidence region in which the event can be considered as not impacting;
The CAAR, which, as previously explained in the previous section, represents the cumulated value of the abnormal returns through time and across securities.
To understand if an event can be considered relevant or not from a statistical viewpoint, the following rule is applied:
An event is defined as impactful for the value of the companies if the CAAR exceeds one of the two confidence boundaries;
On the contrary, an event is classified as not relevant for the value of the companies if the CAAR remains between the two confidence boundaries.
4.1. The Findings Concerning the First Research Question
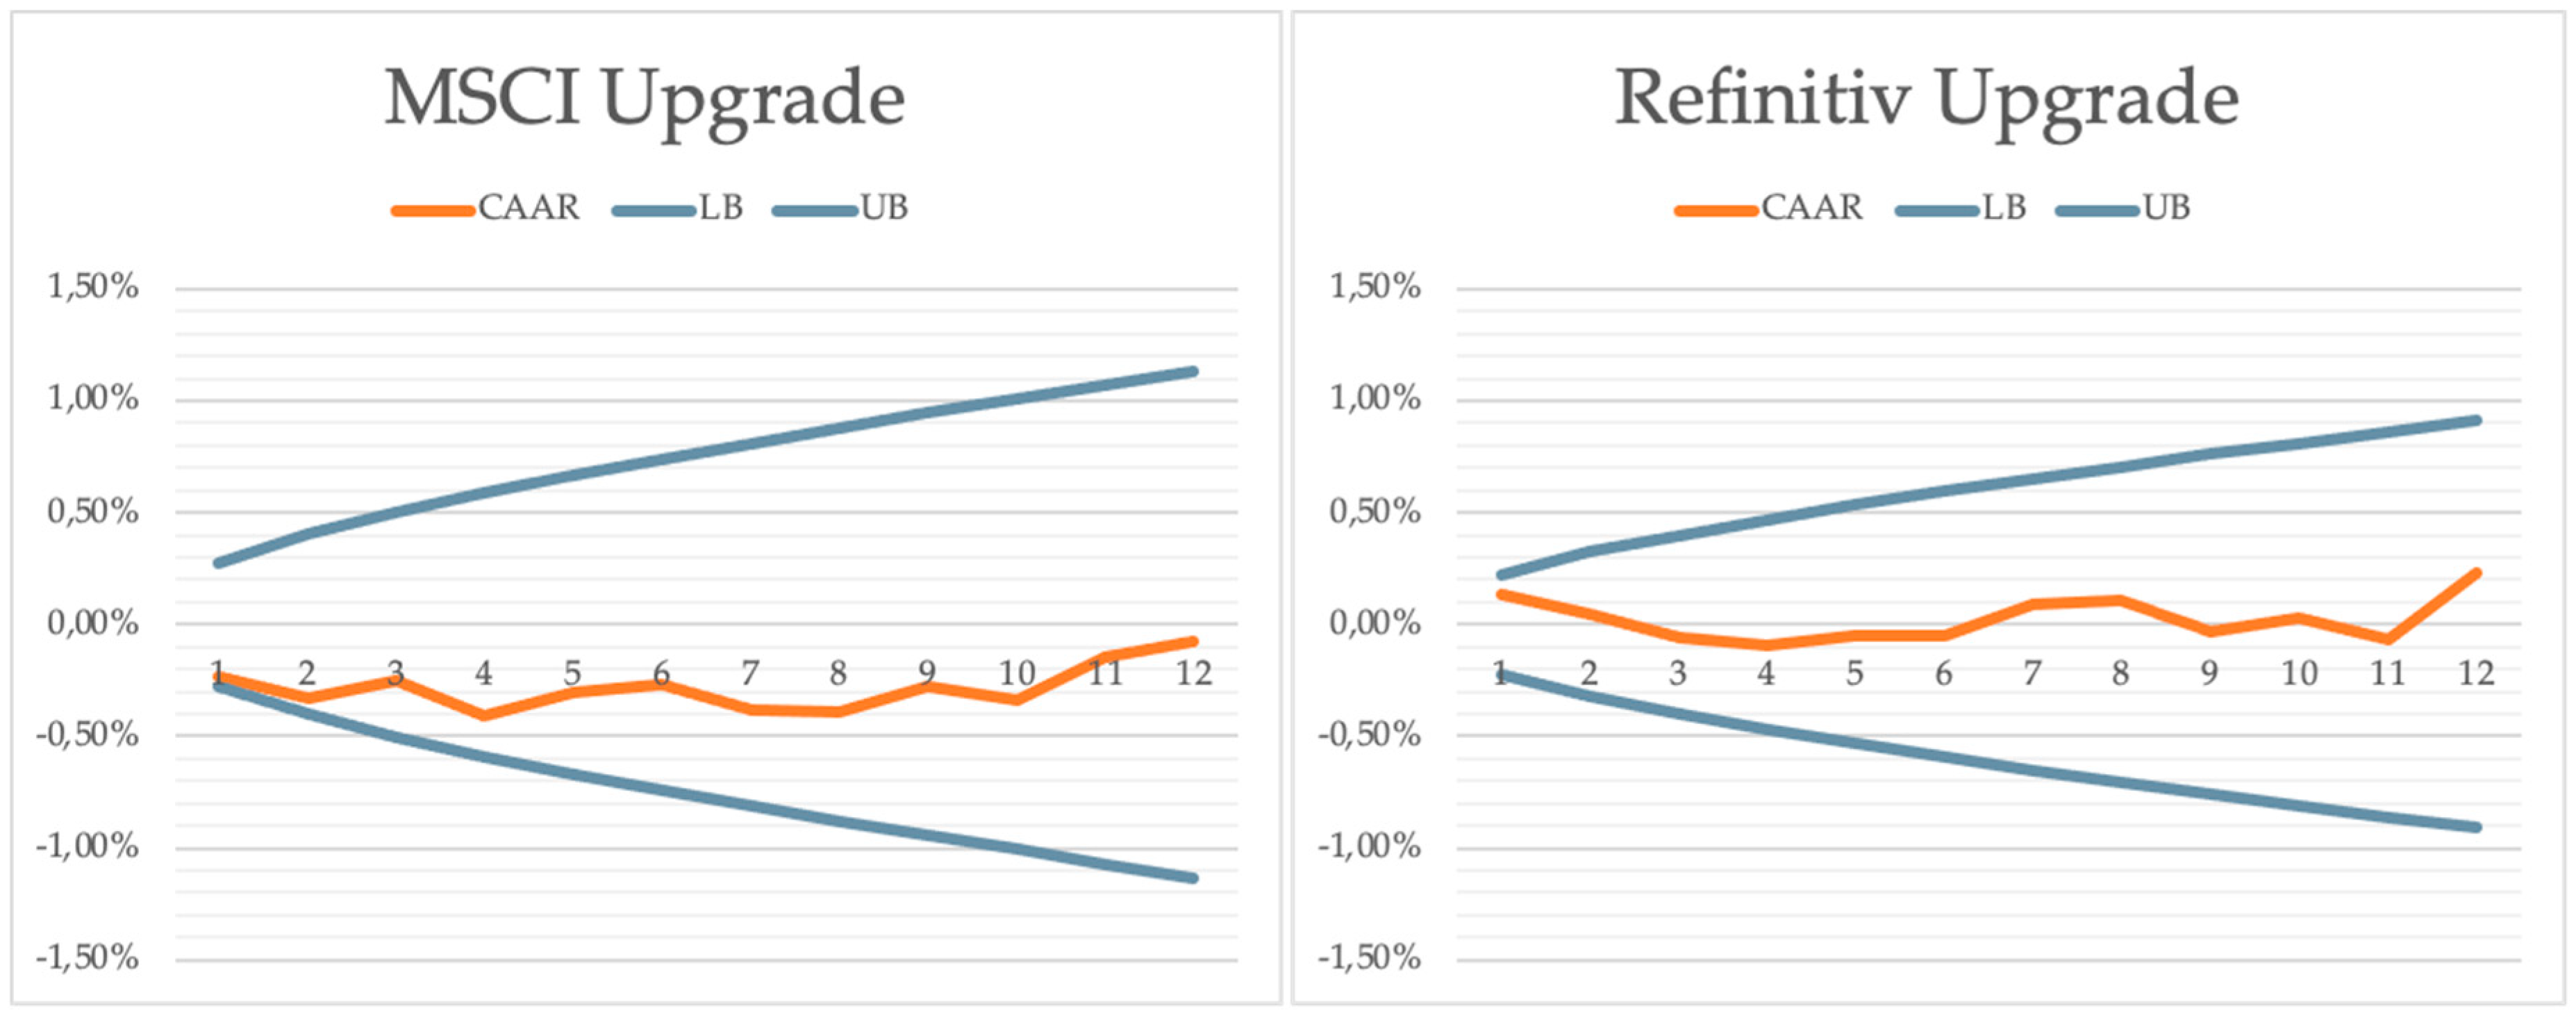
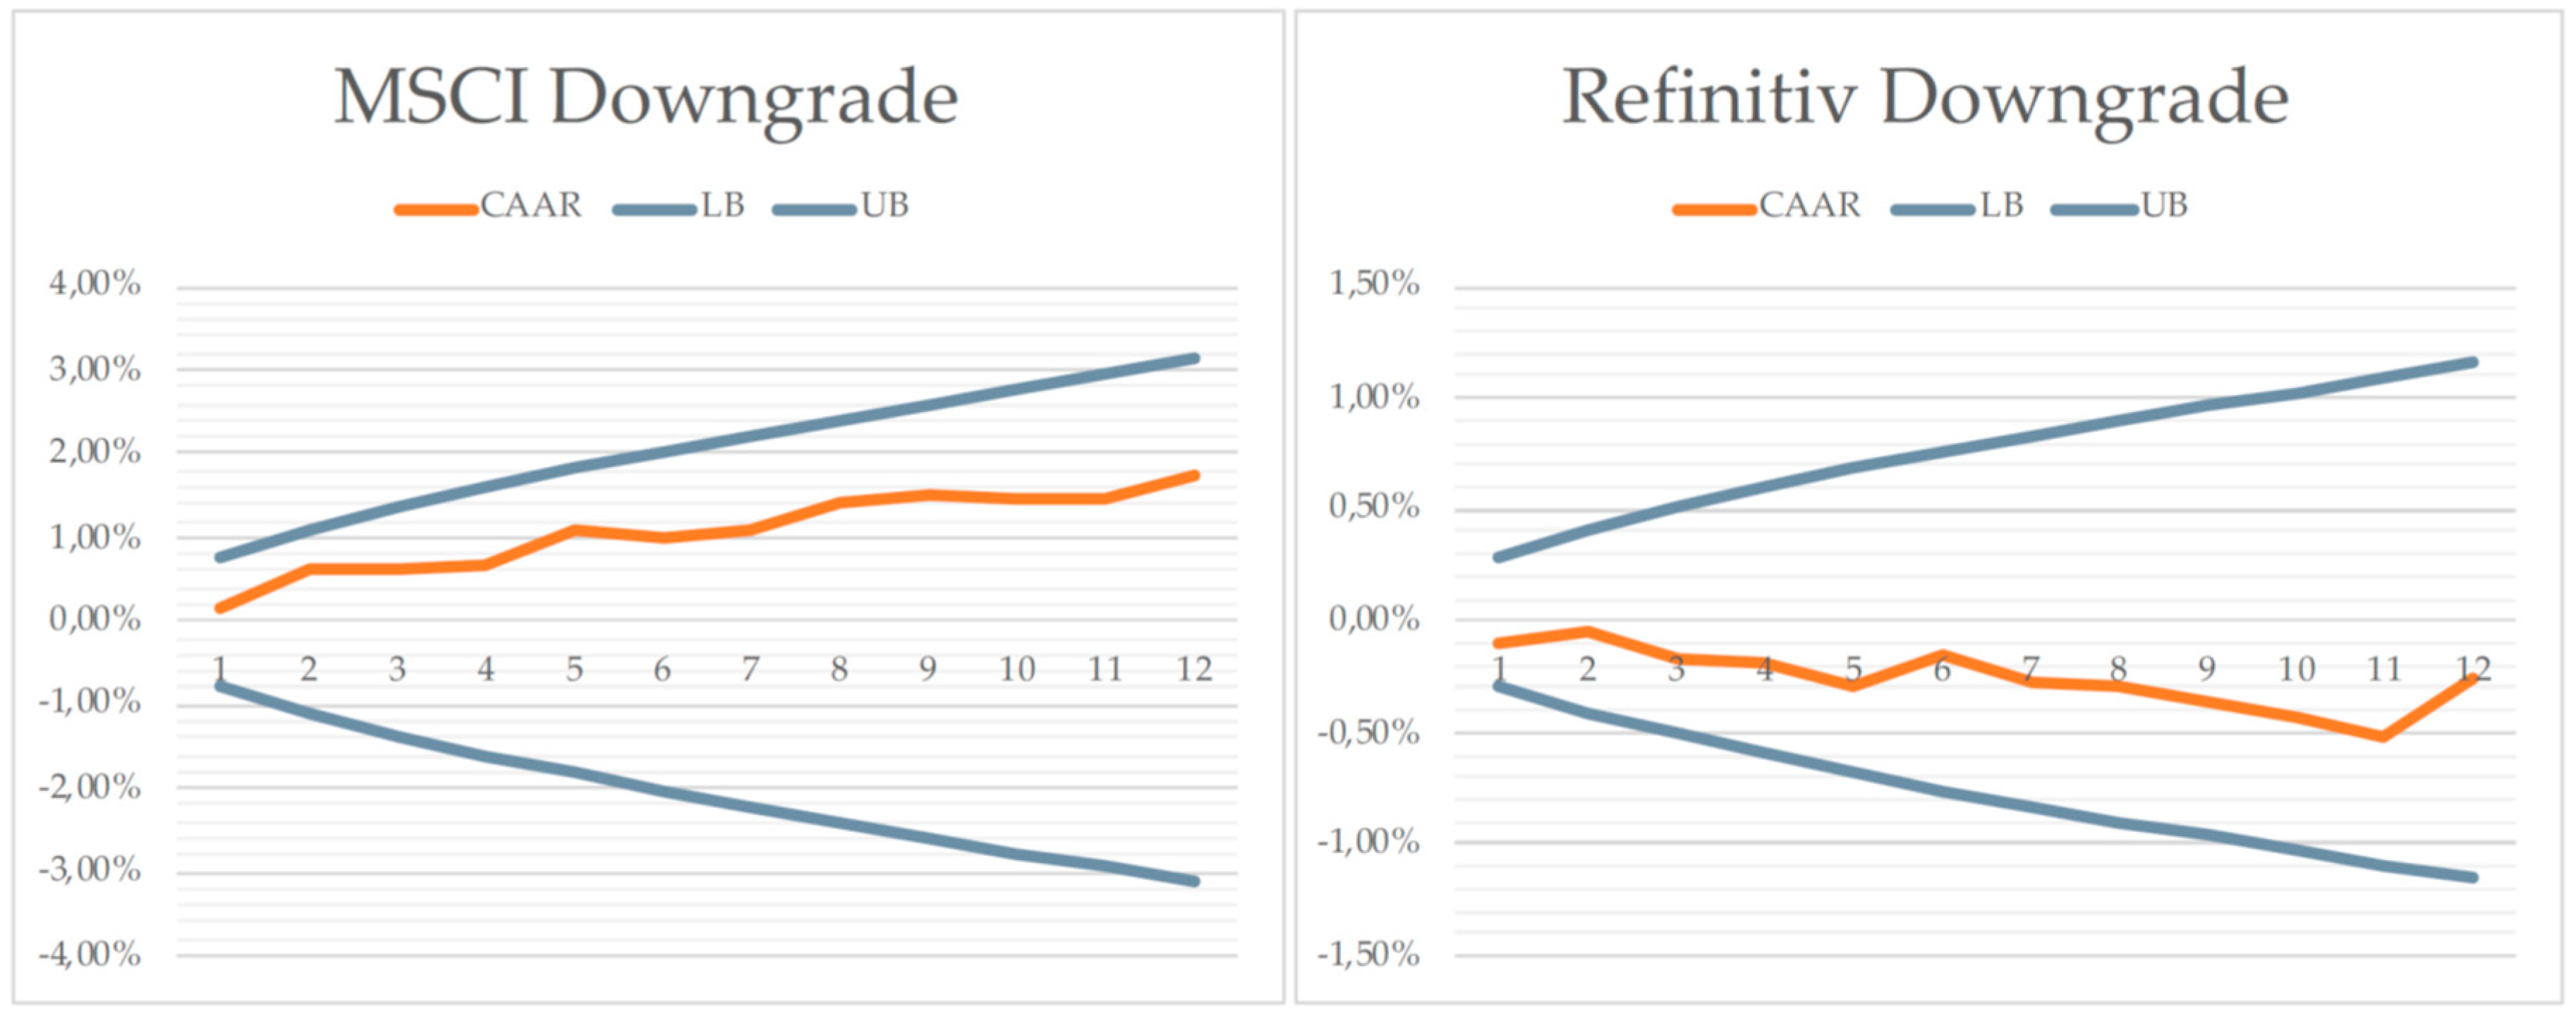
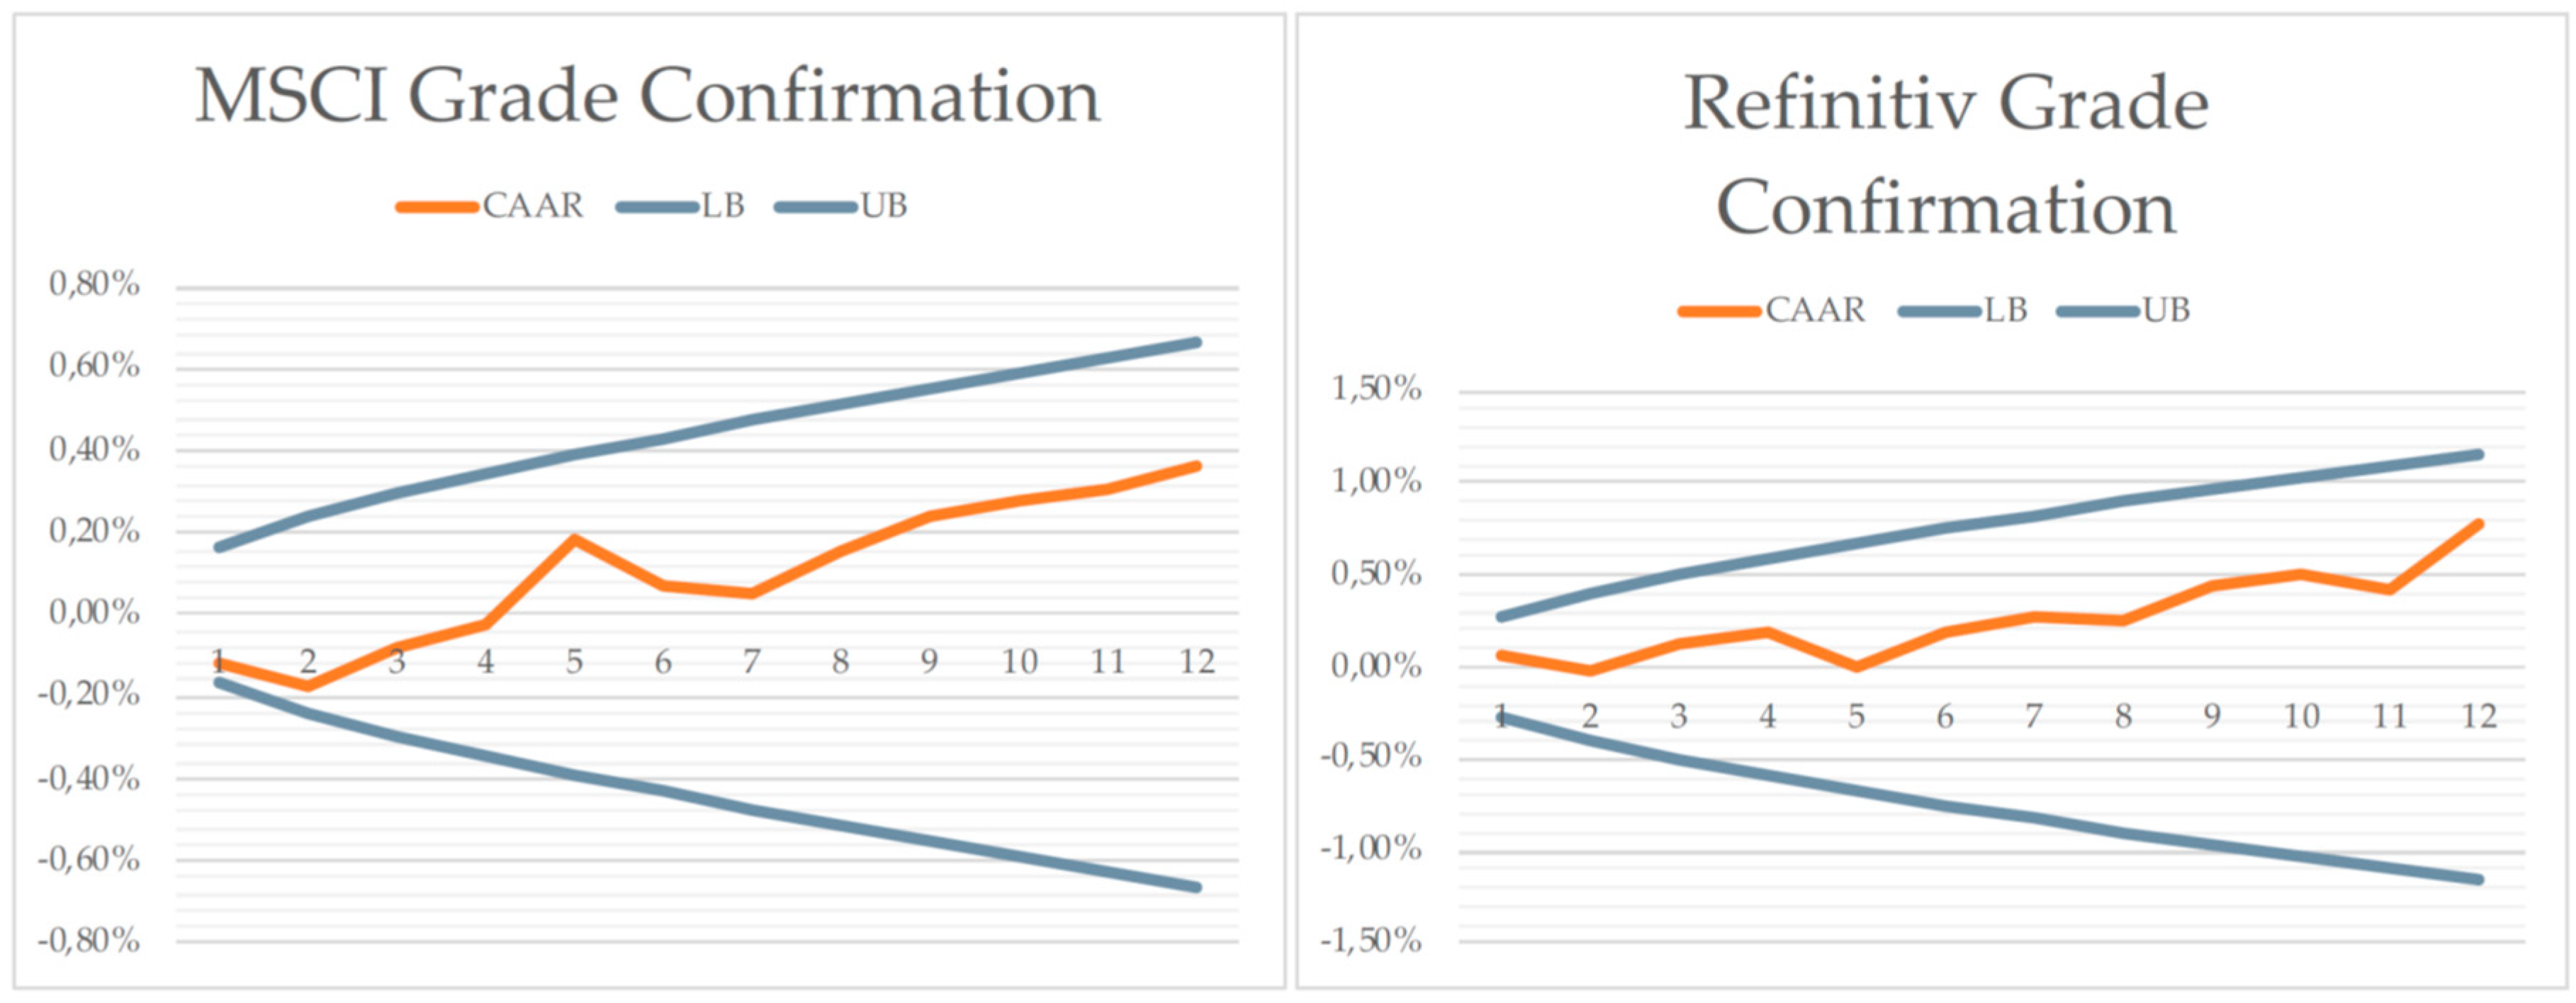
Once that the interpretation of the graphical representations is clear, it is possible to start analyzing the core results of the Event Study. As can be easily noticed looking at
Figure 1,
Figure 2 and
Figure 3, that the CAARs remain inside the confident region in all six cases, meaning that the ESG rating updates do not have a relevant impact on the value of the companies involved in the study. In the following paragraphs, results will be illustrated for each type of rating update (respectively upgrade, downgrade, and confirmation of the evaluation).
Starting from the results for the upgrade events shown in
Figure 1, the trend of the CAAR is mostly flat. The only difference that can be noticed is that, on the one hand, the CAAR of Refinitiv tends to remain stable over time while, on the other hand, the response to the MSCI’s upgrade seems to be negative in the first observation days, but without exceeding the lower confidence boundary.
Moving on to analyzing the downgrade event, even in this case the CAAR’s tendency is to remain stable over time for both the rating providers. In particular, the reaction of the market to the MSCI announcement has an opposite trend compared to the one observed in the upgrade case: as shown in the graph, it can be observed that this reaction is slightly positive, although this correlation is not statistically relevant. For what concerns Refinitiv, as in the upgrade case the CAAR maintains more stability over time, without presenting any particular trend.
Finally, looking at the case of the ESG grade confirmation, it is possible to observe that there are no specific patterns in the fluctuation of the CAAR (see
Figure 3). In particular, for both the rating providers, the CAAR remains permanently inside the confident region, without ever approaching the two external boundaries. Given the fact that both upgrades and downgrades did not result impactful for the market companies, what is found in the case of grade confirmation is reasonable and coherent.
4.2. The Findings Concerning the Second Research Question
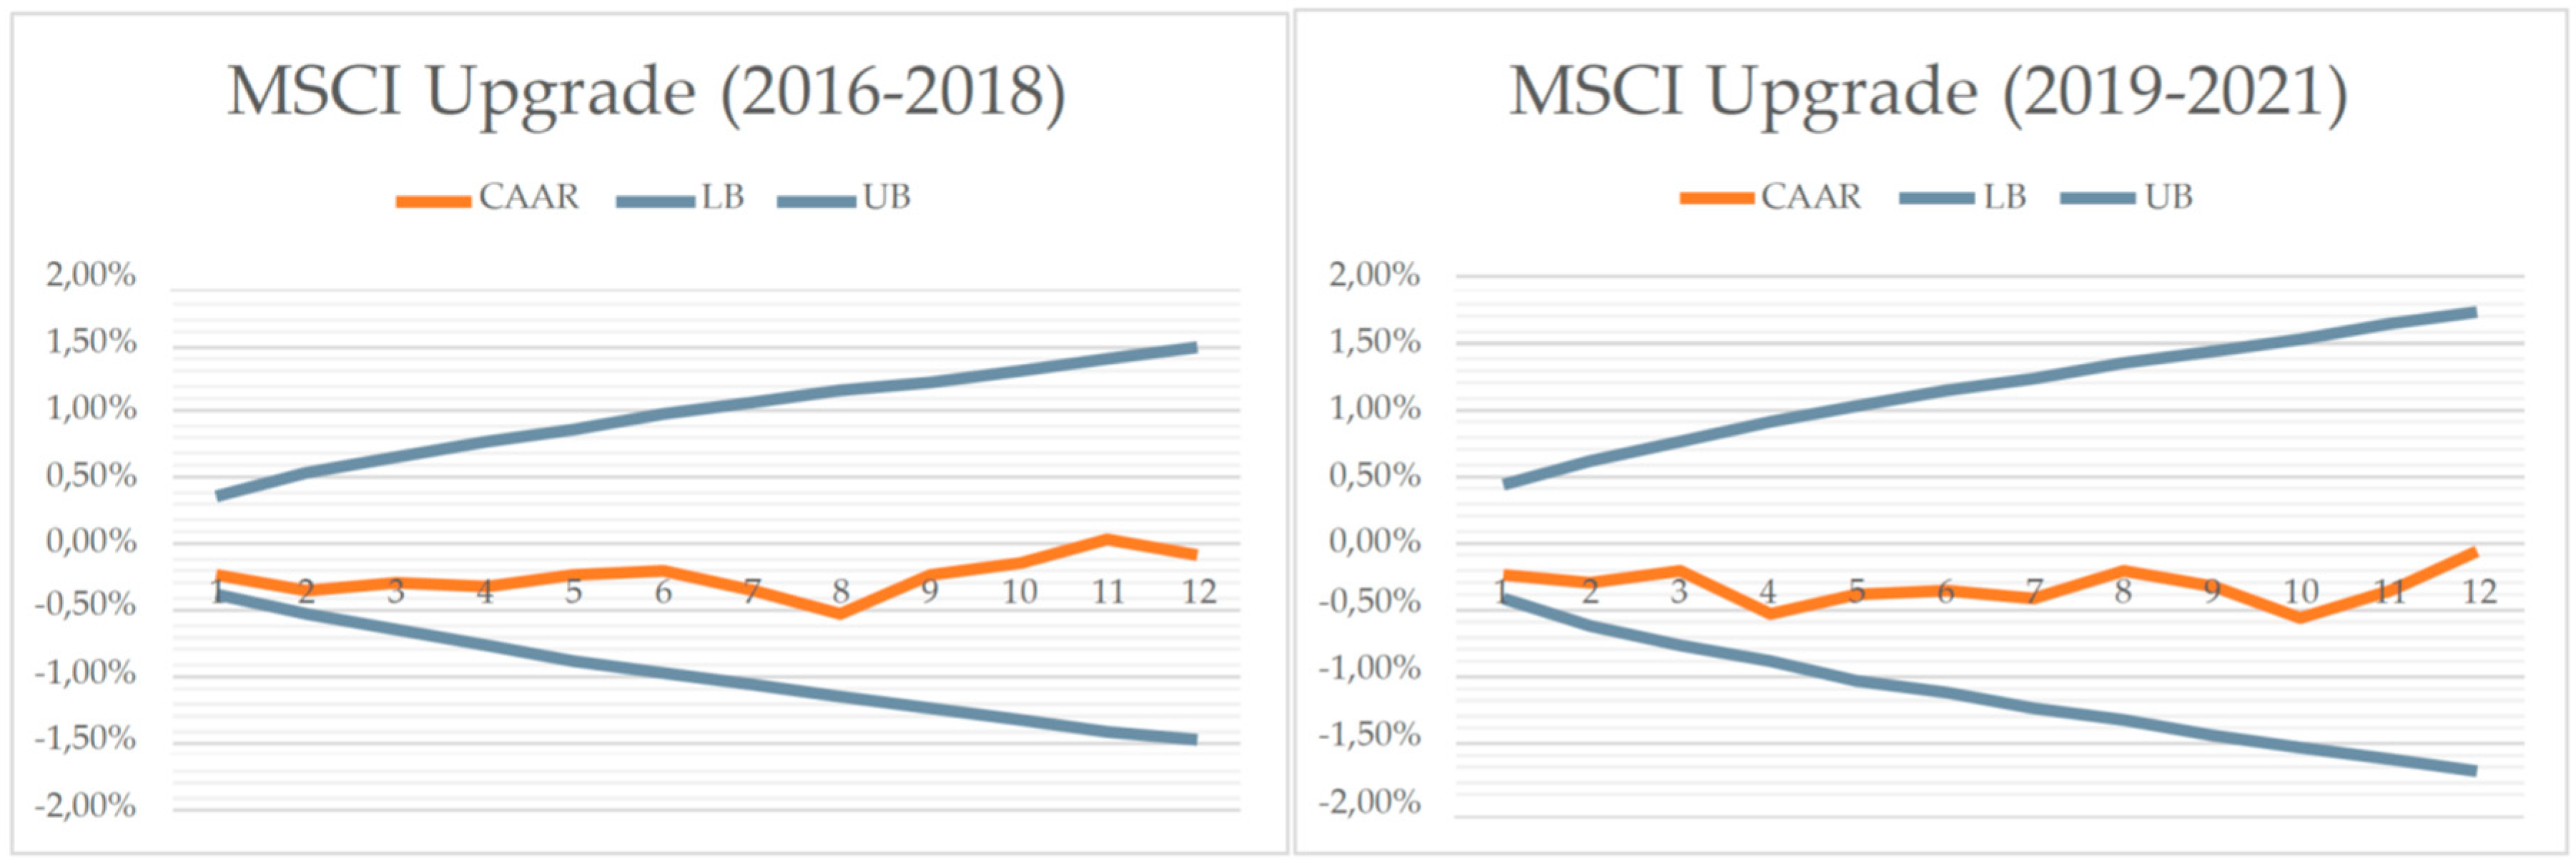
This section is devoted to the illustration of the results of the analysis aimed at understanding if the ESG ratings have assumed a higher relevance in the eyes of investors in the last years. To do so, the same analysis is conducted dividing the initial 6-year time horizon into two temporal subsets of 3 and 2 years respectively. In particular, the first period goes from 2016 to 2018, while the second one ranges from 2019 to 2021. The last two years are considered coupled and not separated to have a wider pool of data and, consequently, a higher statistical relevance of the analysis results; in this regard, it is important to note that, as in the case of the Italian market’s analysis, the MSCI downgrade case cannot be considered as highly statistically relevant due to the reduced number of events. To make this analysis’s results more understandable, the results are analyzed separately for the two rating agencies.
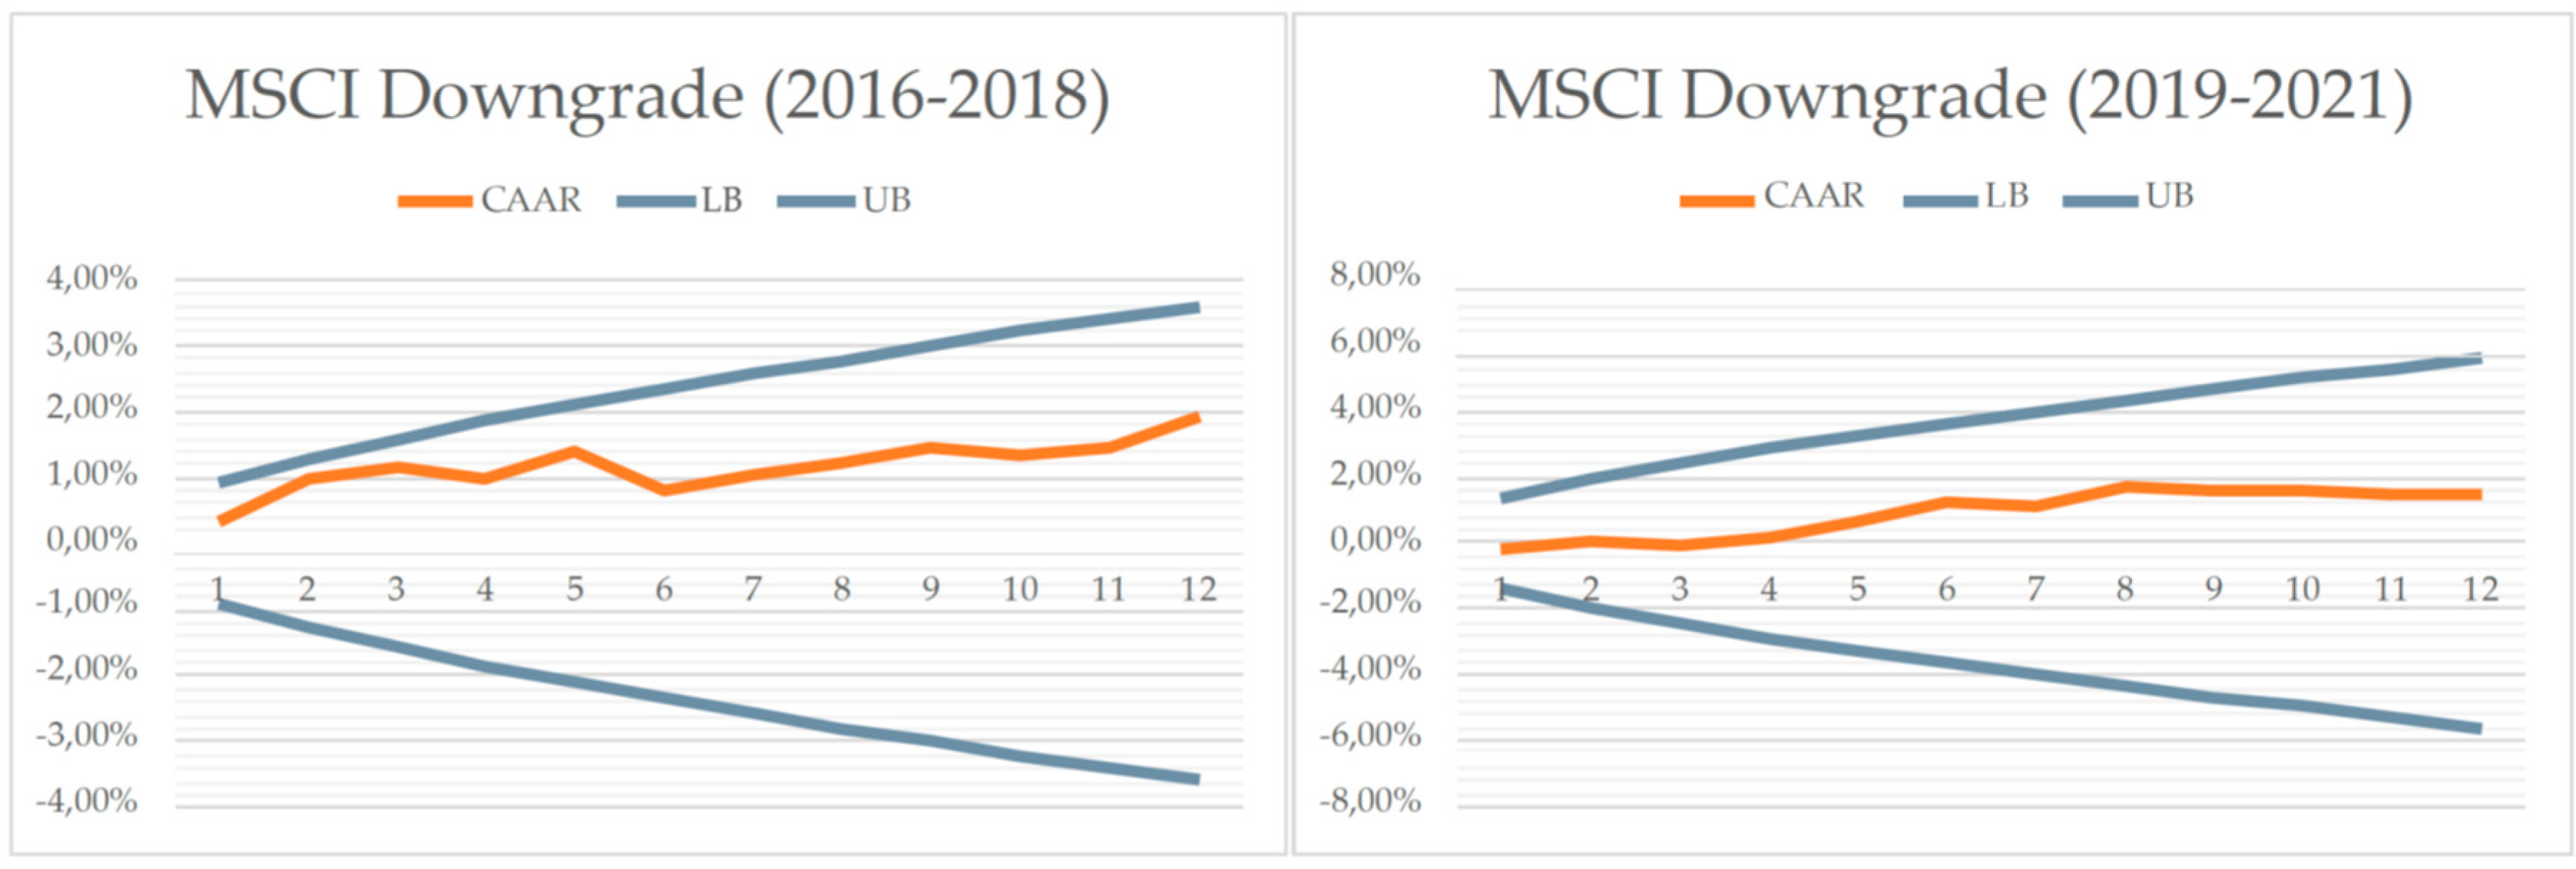
Starting from MSCI, the first general consideration to be done is that in all 6 cases, the CAAR does not cross either the upper boundary or the lower one, remarking the fact that the impact of the ESG rating updates is not relevant in all cases (see
Figure 4,
Figure 5 and
Figure 6). Going more in-depth with the analysis of the different events, as
Figure 4 shows, the upgrade case’s CAAR seems to show the same trend in both periods.
As for the downgrade case, instead, the CAAR of the downgrade case seems to be flatter and closer to the lower boundary in 2019-21 compared with the previous period, in which it shows an unexpected increase of the abnormal returns in the first days of observation (see
Figure 5).
Lastly, the case of the grade confirmation returns the most particular results among the three event typologies. Indeed, in the first period of analysis, the CAAR remains constantly near zero (see
Figure 6). Instead, after 2019, the CAAR is close to the lower boundary in the first market days, while it increases and gets closer to the upper bound in the last ones. This behavior is hard to be explained: indeed, since this is the most neutral typology of event, one would expect higher stability (a sort of “flat” trend).
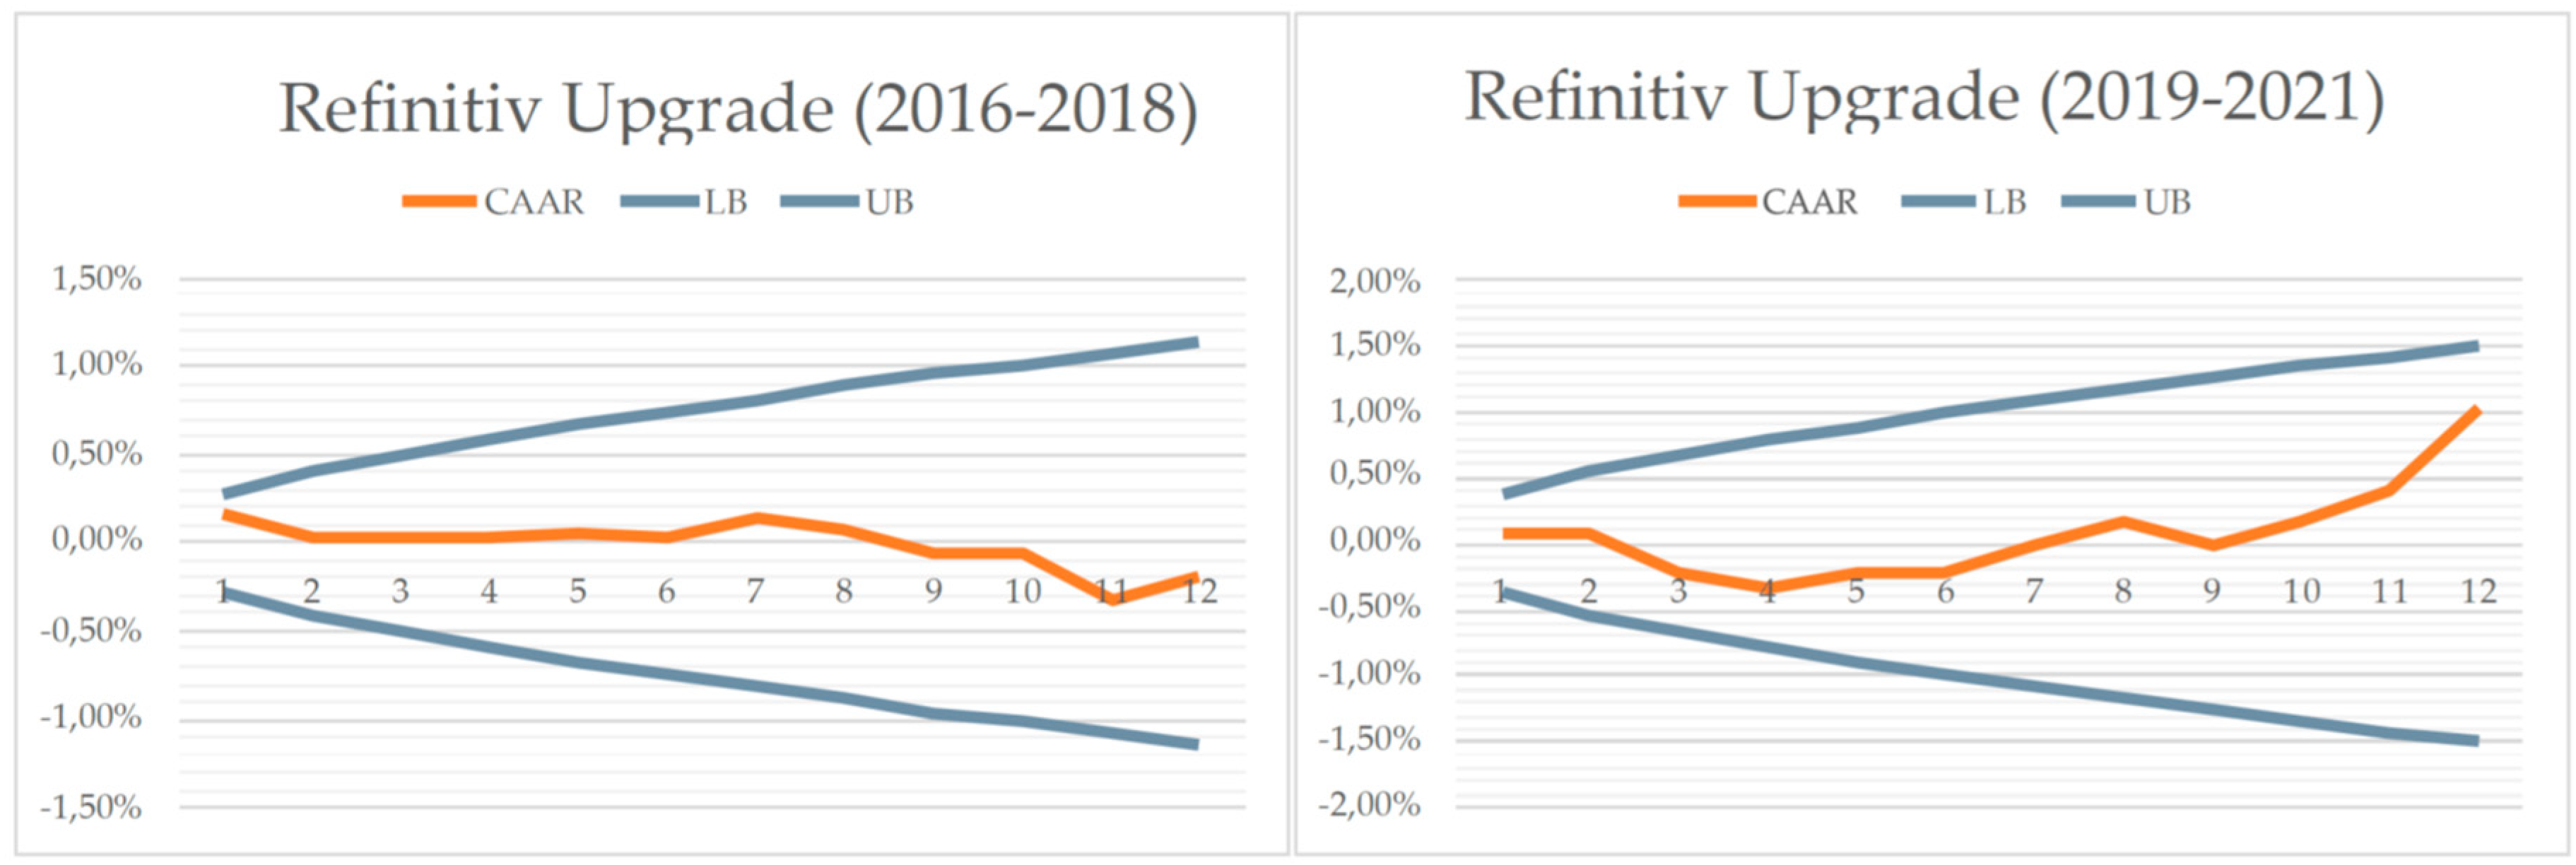
Moving to Refinitiv, even in this case there is not any significant event, regardless of the typology. For what concerns the upgrade case, it seems to be the only one showing a slightly positive change in the reaction of the markets to the ESG grade updates in the last two years. Indeed, as shown in
Figure 7, the CAAR remains constantly stable (around zero) in the first period, while it shows a positive trend in the second time frame.
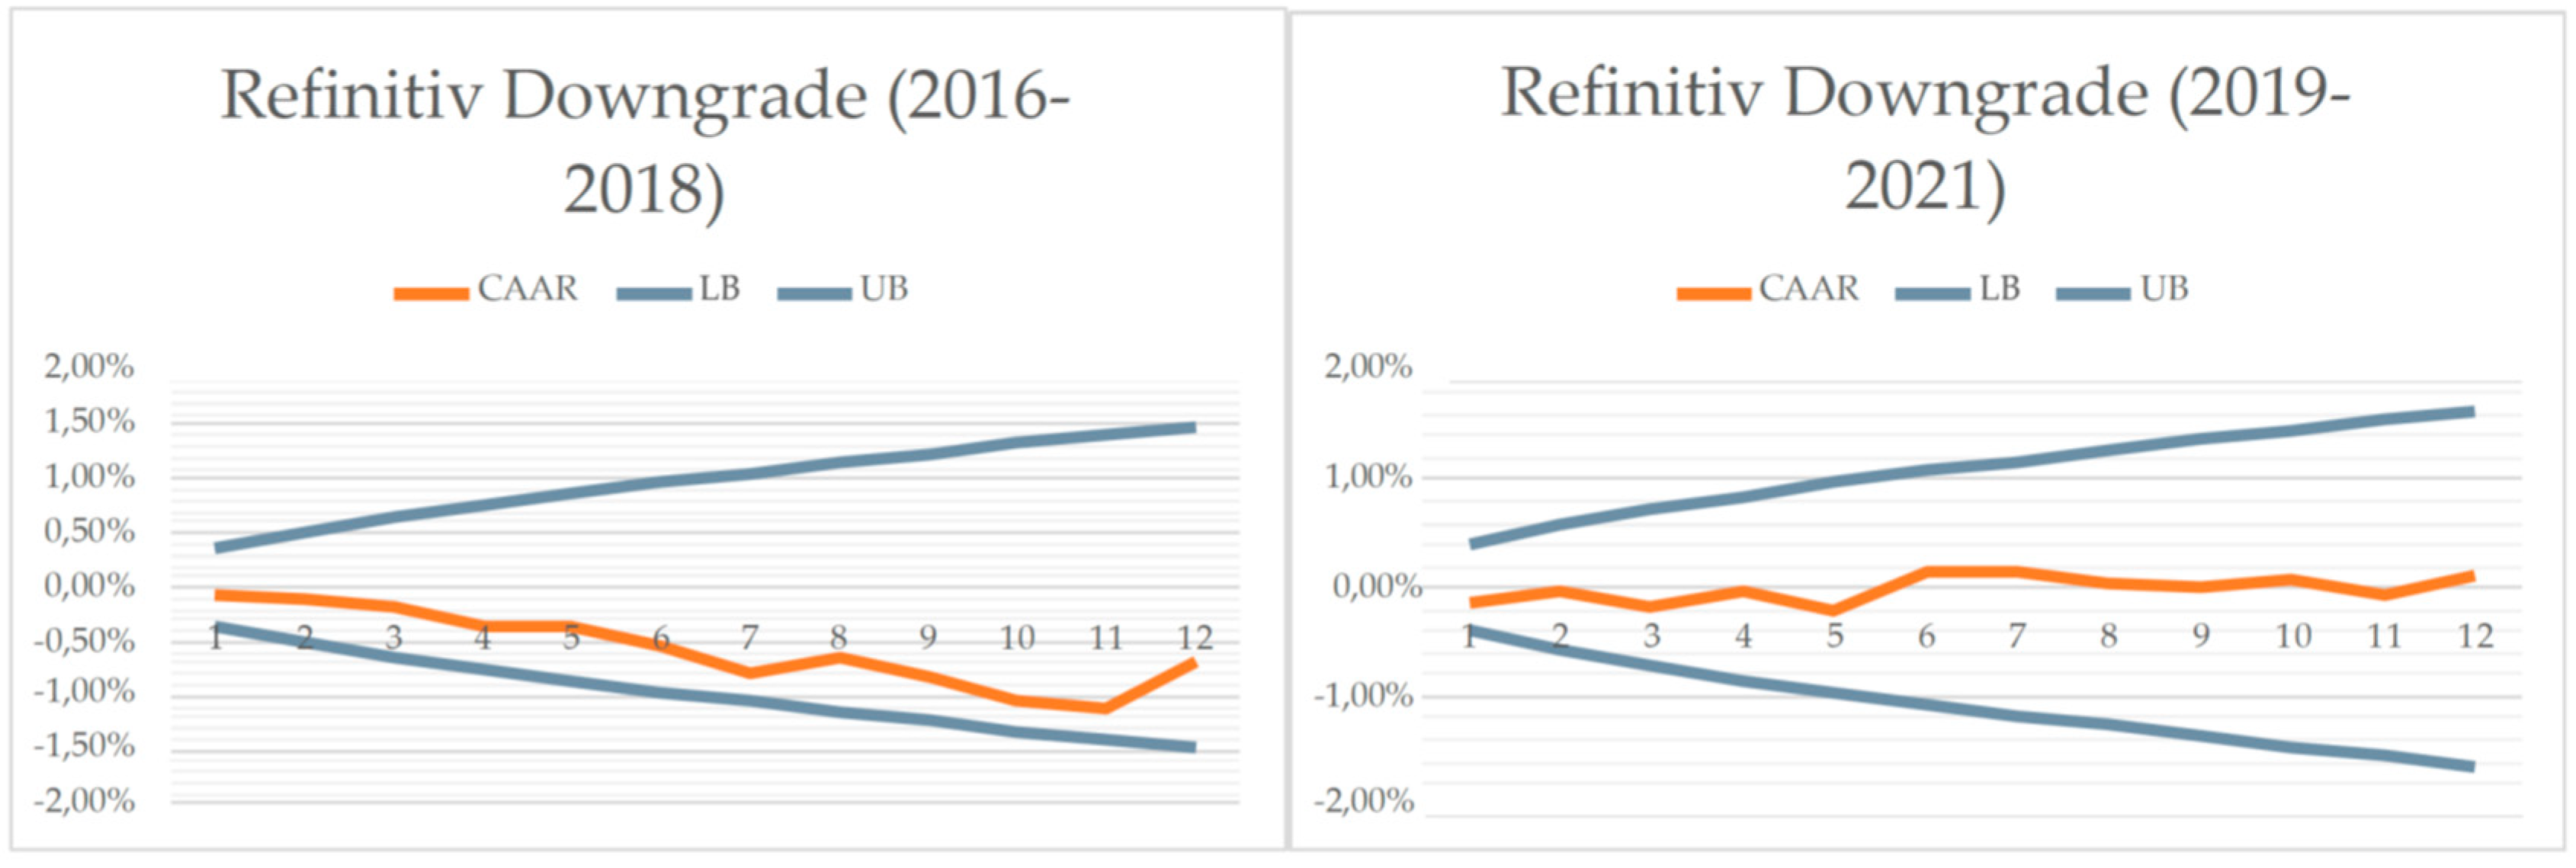
Differently from the upgrade case, the downgrade one shows quite contrasting results (see
Figure 8): on the one hand, in the 2016-2018 period the CAAR is close to the lower bound (i.e., close to having a – statistically – negative impact on the market value), which is what one may expect (at least intuitively). On the other hand, in the last two years the negative trend is not confirmed: indeed, the CAAR remains permanently in the central area of the confidence region.
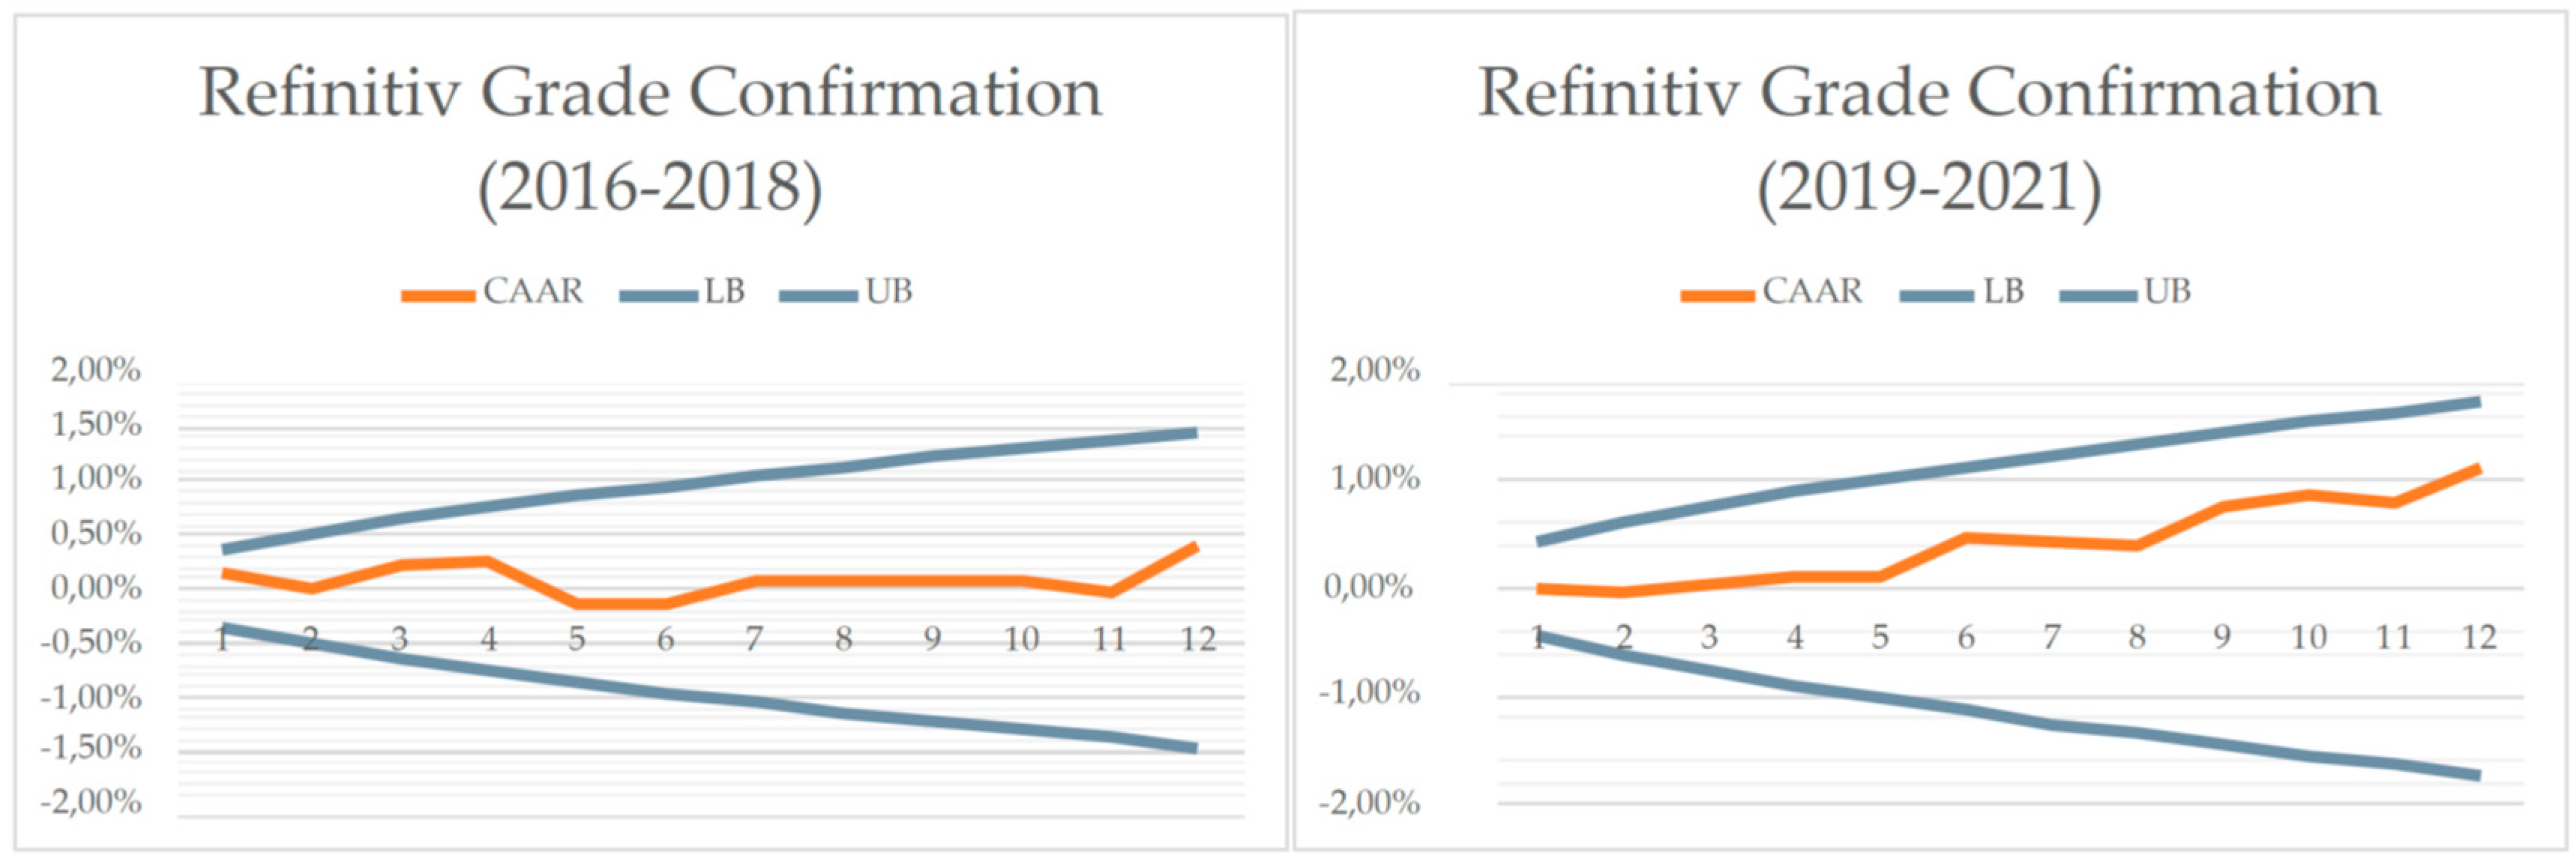
Lastly, the case of the grade confirmation (
Figure 9) returns a result that is very comparable to the one obtained in the corresponding event in the analysis concerning MSCI. Indeed, the CAAR shows a flat trend before 2019 while, after this threshold, it assumes a counterintuitive positive trend, moving parallelly to the upper bound.
5. Discussion
The results of this study show that financial markets seem not to attribute great importance to the assessments made by ESG rating agencies (at least to those issued by MSCI and Refinitiv). Indeed, the shares’ market prices of the analyzed companies is not significantly affected by the upgrades or downgrades included in the periodic reports issued by these two major rating agencies. Moreover, the results does not change significantly if we limit the analysis to the most recent years. These findings are quite in line with the results of the study by Billio et al (2021). Moreover, no significant difference emerges if we split the time horizon into two subperiods (2016-18 and 2019-21) and we compare the reaction of financial markets: even in this case in none of the two time periods the correlation between the improvement or deterioration of ESG performances and the trend of the market price is statistically significant, and there is no significant change in the reaction by financial markets (as one could expect, given the growing attention paid to sustainability issues in the latest years). One possible explanation may consist in the ESG divergence phenomenon highlighted by many scholars (Berg, Kölbel, and Rigobon. 2022; Capizzi et al., 2021): the frequent contrasting judgments on the same company by different rating agencies have the effect of disorienting financial investors, which often do not know which rating agency they have to believe to. The result may be that in a lot of cases the evaluations provided by ESG rating agencies tend to be neglected.
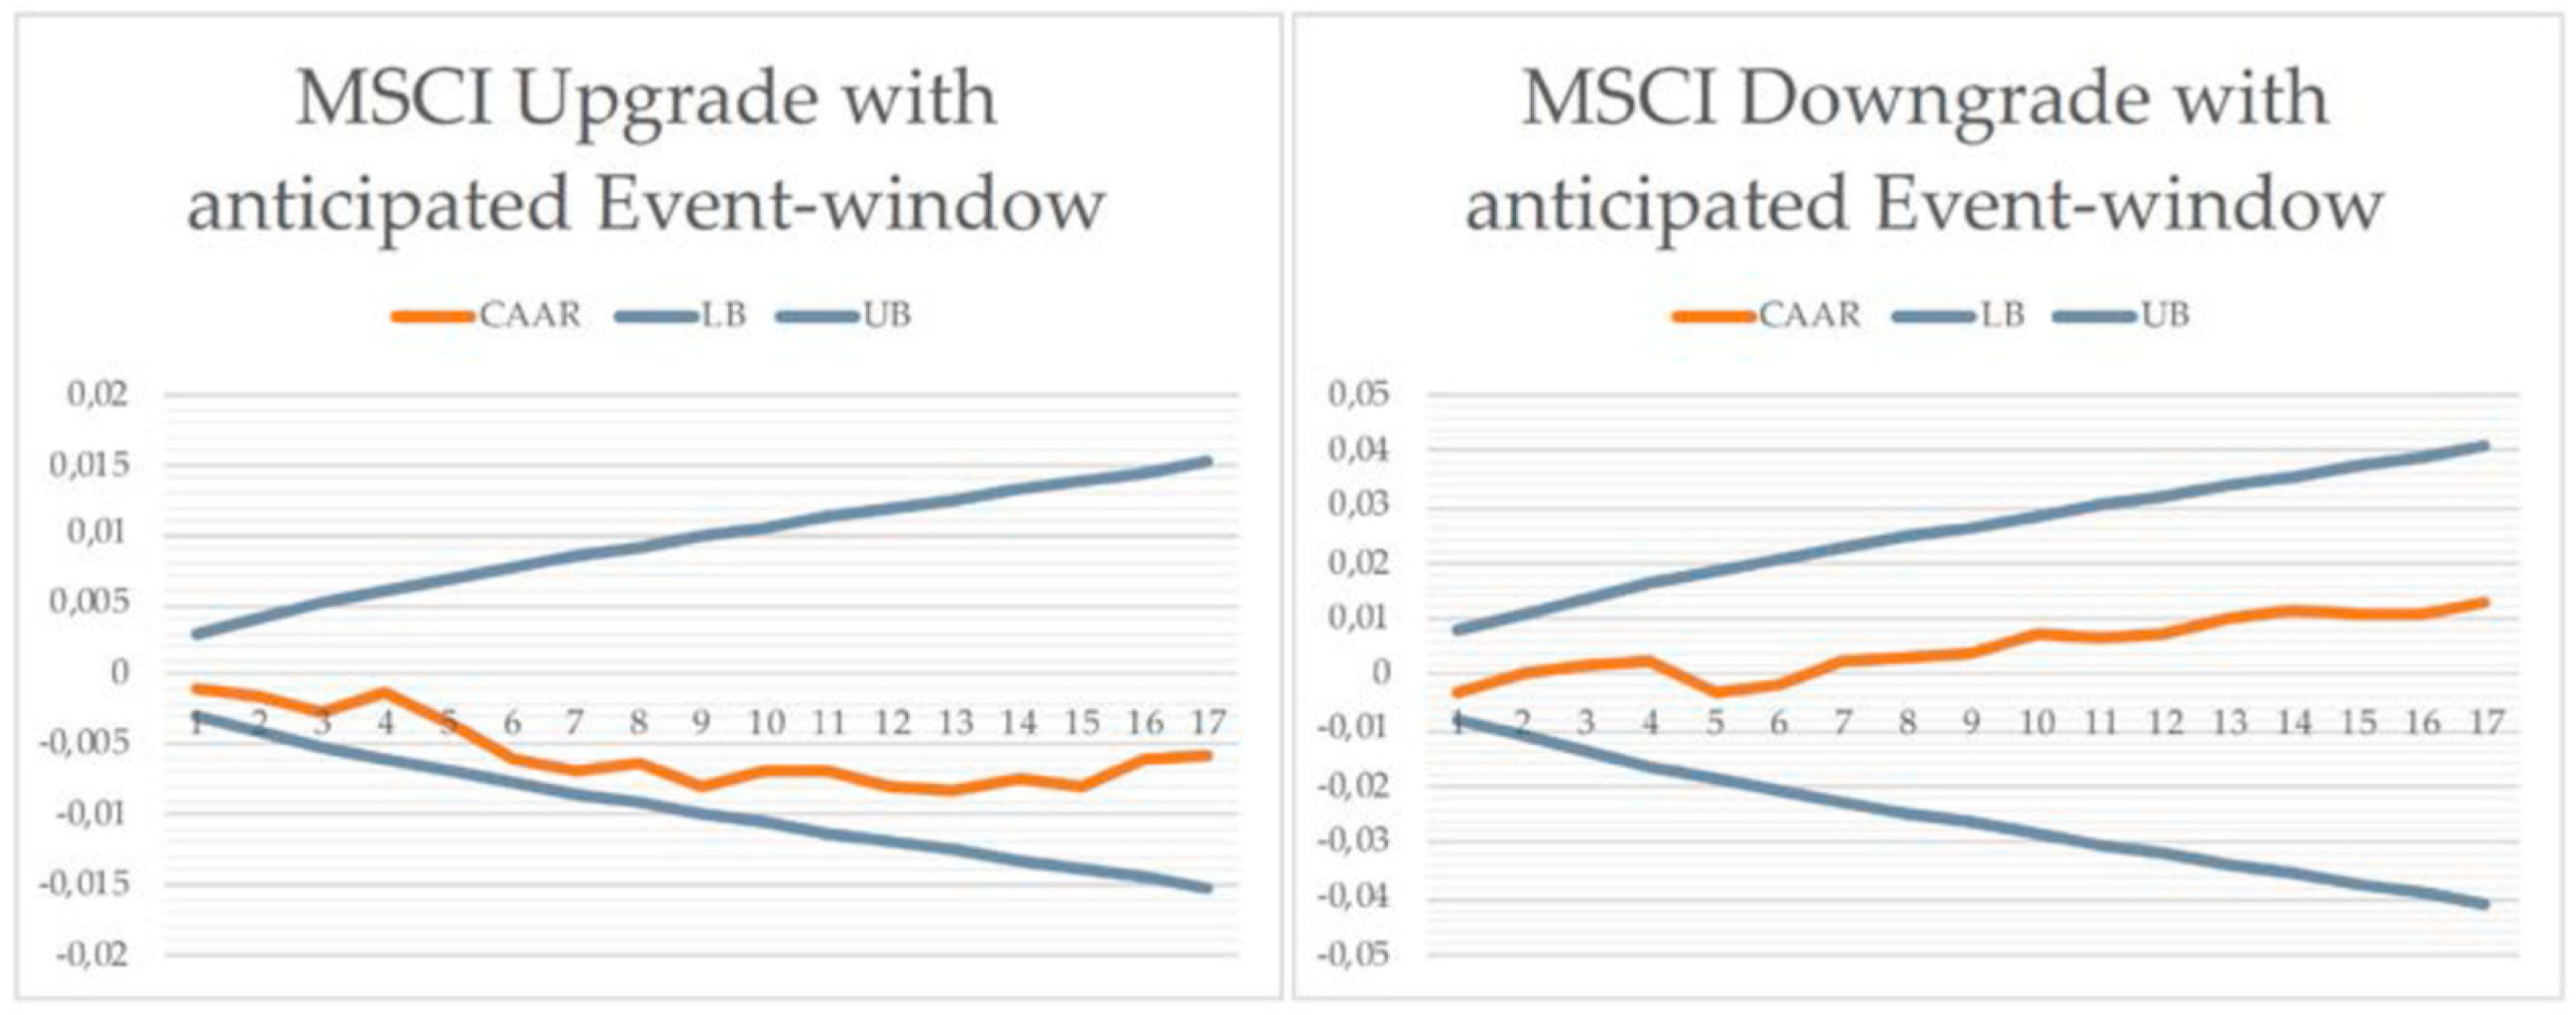
Another possible explanation is that provided by Miyamoto (2016): in his study, the author found that the Japanese stock market reacted negatively to the upgrade of the credit rating. In that case, the author explained this dynamic with the capacity of financial investors to anticipate the positive announcement of the change in the rating, buying the stocks before and selling them just after the occurrence of the event (i.e., the publication of the rating upgrade), thus leading to a depreciation of the stock value. The same may happen also in the case of changes in the ESG grades: this may explain the slightly downward fluctuation of the CAAR in the first time buckets of the observation period (in case of an upgrade). Similarly, in case of an expected downgrading financial investors may decide to short-sell stocks, causing a slight increase in the securities’ price after the occurrence of the event. In order to test the validity of Miyamoto hypothesis, the empirical analysis was replicated anticipating the time window by 5 market days. As it is possible to see from
Figure 10, the CAAR does not show any evident fluctuation in the days immediately preceding the event, both in the case of upgrades and downgrades.
So, the explanation assumed by Miyamoto seems not to be valid in this case, unless we assume that the rumors (about the upgrading/downgrading) were already circulating in the financial environment even earlier.
6. Conclusions
The main outcomes of this work are the following:
The change in the ESG ratings issued by two major ESG rating agencies does not have a statistically significant impact on the market value of the analyzed companies.
Financial markets in the latest years have not shown a significant trend towards increased sensitivity to changes in companies' ESG performances, whether positive or negative.
If confirmed by other studies, these results pose some relevant questions about the real value provided by rating agencies and confirms the urgent call for a standardization of the approaches used to measure ESG performances (a request that is getting stronger and stronger from both financial investors and companies).
In conclusion, it is important to highlight the main limits and the possible areas of improvement of the present work. The limitations of this work are mainly related to the data-gathering process. In particular, the study focused just on two rating providers, namely MSCI and Refinitiv. It would be interesting to see whether the same analysis conducted using data provided by other relevant rating bodies (such as Sustainalytics or Dow Jones Sustainability Index or Bloomberg, for example) would lead to similar results. Another limitation of this study consists in the relatively low size of the sample: a larger sample may enable also a breakdown by industries. It would be interesting to investigate if there are significant differences in the financial market behavioral pattern according to the industry in which companies operate. A possible further development is to investigate whether financial market reactions become more statistically significant when ratings from all agencies are aligned. This analysis would help to understand whether the “ESG divergence” phenomenon plays a relevant role or not. Another possible development may consist in comparing the results obtained in this study (which focuses on short-term reactions on financial markets) with those derived by the application of other methodologies, which look more at the long-term effects of upgrades/downgrades provided by ESG rating agencies.
Author Contributions
Conceptualization, P.M.; methodology, P.M.; investigation: A.I. and S.I.; writing—original draft preparation, A.I. and S.I.; writing—review and editing, P.M.; supervision, P.M. All authors have read and agreed to the published version of the manuscript.
Funding
This research received no external funding.
Institutional Review Board Statement
Not applicable.
Informed Consent Statement
Not applicable.
Conflicts of Interest
The authors declare no conflict of interest.
References
- Berg, F.; Kölbel, J.F.; Rigobon, R. Aggregate Confusion: The Divergence of ESG Ratings. Rev. Financ. 2022, 26, 1315–1344. [Google Scholar] [CrossRef]
- Billio, M.; Costola, M.; Hristova, I.; Latino, C.; Pellizzon, L. Inside the ESG ratings: (Dis)agreement and performance. Corp. Soc. Responsib. Environ. Manag. 2021, 28, 1426–1445. [Google Scholar] [CrossRef]
- Campbell, J.Y.; Andrew, W.L.; MacKinlay, A.C. The Econometrics of Financial Markets; Princeton University Press: Princeton, New Jersey, USA, 1997. [Google Scholar]
- Capizzi, V.; Gioia, E.; Giudici, G.; Tenca, F. The Divergence of ESG Ratings: An Analysis of Italian Listed Companies. J. Financ. Manag. Mark. Inst. 2021, 9, 1–21. [Google Scholar] [CrossRef]
- Derwall, J.; Guenster, N.; Bauer, R.; Koedijk, K. The Eco-Efficiency Premium Puzzle. Financ. Anal. J. 2004, 61, 51–63. [Google Scholar] [CrossRef]
- Edmans, A. Does the stock market fully value intangibles? Employee satisfaction and equity prices. J. Financ. Econ. 2021, 101, 621–640. [Google Scholar] [CrossRef]
- Friede, G.; Busch, T.; Bassen, A. ESG and financial performance: Aggregated evidence from more than 2000 empirical studies. J. Sustain. Financ. Invest. 2015, 5, 210–233. [Google Scholar] [CrossRef]
- Friedman, M. The Social Responsibility of Business is to Increase its Profits in Corporate Ethics and Corporate Governance; W.C. Zimmerli, M. Holzinger, K. Richter, Ed.; Springer: Heidelberg, Germany, 2007; pp. 173–178. [Google Scholar]
- Alexandre Sanches, G.; Renato, J.O. Testing the institutional difference hypothesis: A study about environmental, social, governance, and financial performance. Business Strategy and the Environment 2020, 29, 3261–3272. [Google Scholar] [CrossRef]
- Global Sustainable Investment Alliance, 2021. Global Sustainable Investment Review. Available online: https://www.gsi-alliance.org.
- Gompers, P.A.; Joy, L.I.; Metrick, A. Corporate Governance And Equity Prices. Q. J. Econ. 2003, 118, 107–155. [Google Scholar] [CrossRef]
- Manrique, S.; Marti-Ballester, C.-P. Analyzing the Effect of Corporate Environmental Performance on Corporate Financial Performance in Developed and Developing Countries. Sustainability 2017, 9, 1957. [Google Scholar] [CrossRef]
- Miyamoto, M. Event Study of Credit Rating Announcement in the Tokyo Stock Market". Journal of Economics, Business and Management 2016, 4, 138–143. [Google Scholar] [CrossRef]
- Naeem, M. Ullah, H.; Jan, S. he impact of ESG Practices on Firm Performance: Evidence from Emerging Countries. Indian J. Econ. Bus. 2021, 20, 731–750. [Google Scholar]
- UN Global, Compact. The Global Compact Leaders Summit 2004 – Final Report. 2004. Available online: https://unglobalcompact.org/library/255.
- UN World Commission on Environment and, Development. Our Common Future. 1987. Available online: https://digitallibrary.un.org/record/139811.
- Velte, P. Does ESG performance have an impact on financial performance? Evidence from Germany. J. Glob. Responsib. 2017, 8, 169–178. [Google Scholar] [CrossRef]
- Yoon, B.; Lee, J.H.; Byun, R. Does ESG Performance Enhance Firm Value? Evidence from Korea. Sustainability 2018, 10, 3635. [Google Scholar] [CrossRef]
- Zhou, G.; Liu, L.; Luo, S. Sustainable development, ESG performance and company market value: Mediating effect of financial performance. Bus. Strategy Environ. 2022, 31, 3371–3387. [Google Scholar] [CrossRef]
- Zumente, I.; Lāce, N. ESG Rating—Necessity for the Investor or the Company? Sustainability 2021, 13, 8940. [Google Scholar] [CrossRef]
|
Disclaimer/Publisher’s Note: The statements, opinions and data contained in all publications are solely those of the individual author(s) and contributor(s) and not of MDPI and/or the editor(s). MDPI and/or the editor(s) disclaim responsibility for any injury to people or property resulting from any ideas, methods, instructions or products referred to in the content. |
© 2024 by the authors. Licensee MDPI, Basel, Switzerland. This article is an open access article distributed under the terms and conditions of the Creative Commons Attribution (CC BY) license (https://creativecommons.org/licenses/by/4.0/).
