Preprint
Article

Bioactive Compounds Concentrations and Stability in Ilex paraguariensis Genotypes

Altmetrics

Downloads

97

Views

36

Comments

0

Submitted:

18 October 2023

Posted:

20 October 2023

You are already at the latest version

Alerts
Abstract
An especially important species in southern Brazil, yerba mate (Ilex paraguariensis) is traditionally consumed as tea, chimarrão and tererê. Yerba mate consumption has been stimulated by scientific discoveries that have identified high concentrations of bioactive compounds and their health benefits. There are no studies or scientific evidence to certify or guarantee stability of these compounds’ concentrations during different years in the same plants. We were interested in quantifying caffeine, theobromine, total phenolic compounds and proteins concentrations in leaves of yerba mate genotypes and their stability in the same plants over four consecutive years. Mature leaves from yerba mate genotypes selected on a provenance and progenies trial were collected in August of 2015, 2016, 2017 and 2018. Methylxanthines (caffeine and theobromine), total phenolic compounds and total protein contents were quantified. Our results indicate large variations between genotypes regarding caffeine (0.035 to 2.385 g 100 g-1), theobromine (0.0004 to 1.772 g 100 g-1), total phenolic compounds (7.028 to 9.424 g 100 g-1) and proteins (10.39 to 16.58 g 100 g-1) contents, and also high stability of those compounds over the four evaluated years. A great variation of the studied bioactive compounds in different Ilex paraguariensis genotypes was found and its stability over four consecutive years was showed.
Keywords: 
Subject: Environmental and Earth Sciences  -   Other

1. Introduction

Ilex paraguariensis A.St.-Hil. or yerba mate is native to South America and traditionally consumed as a tonic and non-alcoholic stimulant beverage. From the first reports of its consumption by Guarani Indians to current consumption models, yerba mate has played a central role in the socio-economic and cultural evolution of South American people. Mainly consumed in Argentina, Brazil, Paraguay and Uruguay, its consumption has become a cultural expression [1], reaching 10 kg per person per year in some regions [2]. It is a competitive product in terms of price, quality, regulatory compliance and innovation [3], although regional consumption forms do not favor its commercial expansion to expression markets, with significant lower consumption than its competitors Coffea spp. in Europe and North America and Camelia sinensis in Asia and Europe [4].
The genetic resources of yerba mate are fundamentally important for selecting specific genotypes that can subsidize the industry and emergence of new products, thus directing science and innovation in this market [5]. Focusing on regional consumption, mate breeding programs have been selecting genotypes with characteristics adapted to biotic and abiotic factors and high production of commercial biomass for decades [5,6]. Recently, emphasis has been placed on selecting genotypes that contain higher concentrations of certain chemical compounds [4,7,8,9,10]. Such findings have aroused interest and increased consumption worldwide, mainly because health benefits provided by these compounds [3,4,11).
Consumed among indigenous people of different ethnic groups, yerba mate has been empirically used to treat different pathologies. Recently, scientific proof of its antioxidant, anti-inflammatory, anti-obesity and cardioprotective functions have been reported [2,4,11]. Yerba mate dry leaf biomass composition is quite rich and diverse, including nutrients, minerals and water-soluble vitamins [4]. Its chemical composition contains polyphenols (phenolic acids, flavonoids), alkaloids (methylxanthines, including caffeine, theobromine, theophylline) and terpenes (carotenoids, saponins) [1,2]. Despite its variety of compounds, most research has focused on the caffeine, theobromine and theophylline contents in commercial products of yerba mate [3,4,12] and antioxidants [2,13].
Chemical compounds present in yerba mate are responsible for its stimulant and medicinal properties [2,4,11]. However, the absence of genetic materials selected for this purpose makes the variation in this content one of the limitations of its use, depending strongly on the preparation mode and quantity ingested, but mainly of the raw material used for production [14,15,16].
There is a gap in studies on the stability of concentrations of these biocompounds during different years in the same plants, and our hypothesis is that this variation is not influenced by the harvest year. Thus, in this study, we evaluated caffeine, theobromine, total phenolic compounds and protein on leaves of yerba mate genotypes for four consecutive years on the same plants to determine the composition and stability of this compounds over time.

2. Materials and Methods

2.1 Plant material and sample preparation

Fifty-five yerba mate genotypes were selected based on their productivity, leaf morphotype and sex, from a provenance and progenies trial installed in Ivaí-PR, Brazil (25º01'S and 50º48'W, 600 m asl, 1500-1600 mm) [5]. This trial began in November 1997 with 156 progenies in 3 x 2 m spacing and full sun conditions [5], and voucher specimens were preserved at the Fernando Cardoso da Silva Herbarium (HFC) with voucher (HFC 10592), in Colombo-PR, Brazil.
In August of 2015, 2016, 2017 and 2018, mature leaves with no injuries were collected throughout the treetops at a height of ~1.6 m. Leaves were stored in "kraft" packages, identified and sent to the Non-Timber Products Technology Laboratory of Embrapa Florestas. Samples were dried in a microwave oven (power 1,500 W, frequency 2,450 MHz) for approximately 4 min, alternating leaves position at 60-second intervals for homogenous drying [17]. Subsequently, leaves were crushed, sieved at 0.5 mm, packed and stored in a freezer (-20 ºC).
To determine the content of caffeine, theobromine and total phenolic compounds, aqueous extracts containing 0.1 g of plant material were prepared in 50 mL of ultrapure water type I heated to its boiling temperature (100 ºC under pressure of 1 atm). Then, they were homogenized in ultrasound (Ultracleaner 1,400 A) for 30 min, cooled to room temperature and filtered, with volume completed to 100 mL in a volumetric flask, and frozen (-20 ºC) [18].

2.2 Determination of methylxanthines

Extracts were thawed and manually homogenized for 30 s. About 2 mL of extracts were filtered in a 0.22 μm membrane with a syringe and holder. After that, an aliquot was transferred to a 1.5 mL amber vial with teflon cap. These samples were injected directly into the chromatograph. Methylxanthines (caffeine and theobromine) were quantified through High Efficiency Liquid Chromatography (HPLC), using Agilent 1260 Infinity model controlled by ChemStation software and equipped with a G1311B quaternary pump, G1329B automatic injector, DAD G4212B detector and FLD G1321B detector available at the Multi-User Laboratory of Environmental Equipment and Analysis of the Federal Technological University of Paraná (LAMEAA-UTFPR). The Acclaim 120 C18 column (Dionex® 2.1x150 mm, 3 m) with an Acclaim C18 2.1 mm, 5 m guard cartridge was used to separate compounds. The conditions used to separate compounds from the aqueous extracts (10 μL injection) were: 30 °C with flow of 0.3 mL min-1 of eluent with the mobile phase A (H2O: acetic acid J.T. Baker – 99.5:0.5 v/v) and B (Merck® acetonitrile - 100%). The wavelength used to detect the compound was 280 nm (fixed). The gradient elution program was: 0-8 min (4% B), 8-12 min (4-5% B), 12-30 min (5% B).
The compounds caffeine (1,3,7-trimethylxanthene) and theobromine (3.7-dimethylxane) were quantified using analytical curves obtained with Sigma® standards for caffeine (R² = 0.99989) and theobromine (R² = 0.99964). The results were expressed in g of compound per 100 gram of dry sample (g 100 g-1). We studied 54 genotypes for caffeine and 55 genotypes for theobromine.

2.3 Determination of total phenolic compounds

Quantification of total phenolic compounds was made according to Folin-Ciocalteau spectrophotometric method (Singleton and Rossi, 1965), with modifications. Briefly, 0.1 mL of extract, 6.0 mL of distilled water and 0.5 mL of Folin-Ciocalteau reagent were added to a volumetric flask and stirred for 1 minute. Afterwards, 2 mL of 15% Na2CO3 solution was added and stirred for another 30 seconds. Final volume was adjusted with distilled water to 10 mL. The reaction was kept in dark at room temperature for 2 hours and subsequently absorbances were recorded in a spectrophotometer at 760 nm. Analytical curve was obtained with total phenolic compounds (3,4,5-trihydroxybenzoic acid) between concentrations of 0.25 and 13 mg L-1 (R² = 0.9988) and the results expressed in mg of gallic acid were equivalent to the total phenolic compounds per gram of dry sample (mg GAE g-1). We studied 55 genotypes for total phenolic compounds.

2.4 Determination of moisture and proteins

The analyses of moisture and total proteins followed the official methods from Association of Official Analytical Chemists International (AOAC 2016). To determine moisture content, we used thermogravimetric method at 105 degrees, up to constant mass and total protein content by the micro-Kjeldahl method, using total nitrogen content multiplied by conversion factor 6.25 to obtain the total protein content. We studied 54 genotypes for protein and moisture content.

2.5 Statistical analysis

Genotypes stability was observed throughout four years based on the existence of interaction with years analyzed by the AMMI (Additive Mail effects and Multiplicative Interaction) procedure. This procedure complemented the deviance analyses, obtained from generalized linear model with Gamma probability function. Initially proposed by Mendel [19], the AMMI method was used to decompose sources of variation of the additive effects for genotypes and years and the multiplicative effects for interaction via main components. This method provides more accurate estimates of genotypic responses and a graphical interpretation of the results through the biplot procedure with scores of the interaction effects for each genotype and year plotted simultaneously [20]. Interpretation is based on the magnitude and signal of coefficients for each main component axis. Low values indicate genotypes and/or years that contribute little or almost nothing to the interaction, demonstrating statistical stability.
Preliminarily, the model of casualized blocks, processed for each year, was adjusted according to the equation:
y i j k = μ + b a j k + g i + a j + g a i j + ε i j k
In which, the concentration of Caffeine, Theobromine, Total phenolic compounds, and Proteins of the ‘i’ genotype in the ‘j’-th year and the ‘k’-th block ( y i j k )was estimated by the overall mean ( μ ) of the concentration, comprising all the genotypes, per block and per year; by the effect of the ‘k’-th block in the ‘j’-th year ( b a j k ); by the effect of the ‘i’-th genotype ( g i ) ; by the effect of the ‘j’-th year ( a j ) ; by the effect of the interaction of the ‘i’-th genotype with the ‘j’-th environment ( g a i j ); added to the random error ( ε i j k ) . Following this adjustment, the model AMMI was applied in accordance with the analysis of joint variance proposed by Duarte and Vencovsky [21]:
Y i j = μ + g i + a j + k = 1 n λ k γ i k α j k + ρ i j + e i j ¯
In which, the average response of the concentration of Caffeine, Theobromine, Total phenolic compounds, and Proteins of the ‘i’ genotype in the year ‘j’, for the purpose of stability, was obtained through the overall mean ( μ ) of the concentration comprising all the genotypes by year; by the effect of the ‘i’ genotype ( g i ); by the effect of the year ‘j’ ( a j ); by the summation of the product between the singular value ( λ k ), the singular vector ( γ i k ) corresponding to the ‘i’-th genotype in the ‘k’-th column vector, and the singular vector ( α j k ) corresponding to the ‘j’-th year in the ‘k’-th row vector in the matrix of per-year genotype interaction; by the non-controlled trial variance, named as noise ( ρ i j ) of the classical interaction of the ‘i’ genotype with the year ‘j’, and the mean trial error ( e i j ) . The decomposition of the interaction matrix into row and column vectors was performed through the analysis of principal components. The recovery of variation, for the purpose of measuring genotypic stability, was only performed by the deterministic portion of the components most strongly associated with the interaction (rows and columns of the matrix g a i j ), discarding the additional residue ρ i j . The interpretation of the biplot regarding the GxA interaction was carried out by observing the magnitude and sign of genotype and production year scores on the interaction axes. Therefore, low scores (close to zero) are indicative of genotypes that have contributed little or almost nothing to the interaction, characterizing them as stable. The "ward.D2" method minimizes the sum of the squares of the differences in axis scores within the groups formed during hierarchical clustering [22].

3. Results

The joint analysis of variance for Caffeine, Theobromine, Total phenolic compounds, and Proteins (Tables 1, 3, 5 and 7, respectively) revealed significant differences (p<0,01) for genotypes (G), evaluation years (A), and their interaction (GxA). It was observed that, even with only four evaluation years, it was possible to detect differences among them, indicating rather varied conditions for genotype evaluation. In terms of absolute F-statistic values, we noted that the genotype variation source magnitude was much higher for the traits Caffeine and Theobromine, being accountable for the majority of the observed variation. For the traits Total phenolic compounds and Proteins, the magnitude of the year-variation source was higher. It can thus be inferred that the years effects contributed more significantly to the variation of these traits. The interaction results for all the studied traits indicated either the need to identify and select genotypes capable of capturing genetic gains across different yield years or that those are less susceptible to environment variations due to the year. Based on these results, a more detailed study on the significant interaction was conducted, through the analysis of the phenotypic stability of the genotypes, via AMMI. The multiplicative effect of the interaction GxA was diagnosed through the analysis of the main compounds, by decomposing the sum of the squares of the interaction (SQ) in three axes (IPCA), adopting the positive criterion (use of hypothesis tests), through the F-test presented by Cornelius et al. [23].

3.1 Caffeine

Descriptive statistics results show wide genetic variability for caffeine content in yerba mate progenies, with genotype strongly influencing its concentration. First component describes 58.35% of the variability observed in the genotype-environment interaction (Table 1).
Table 1. Variance analysis associated with the breakdown of interaction effect (GxA) for the concentration of Caffeine of the yerba mate genotypes tested across four years of yield.
Variation sources GL SQ F (Pr>F)
Model 56 119.84
Genotype (G) (53) (119.03) 37.87 (<0.0001)
Year (A) (3) (0.81) 4.57 (0.0042)
High Variance (%)
Axes Value Explained Cumulative
GxA 159 9.43
1   5.50  58.35    58.35 IPCA1 (55) (5.50) 3.04(<0.0001)
2   2.14  22.74    81.10 IPCA2 (53) (2.15) 1.23 (0.1491)
3   1.78  18.90    100.00 IPCA3 (51) (1.78) 1.06 (0.3731)
Mean Error 290 9.57
Adjusted Total 215 129.27
GL: liberty levels; SQ: sum of the square; Pr>F: probability estimate by F-test (Fischer-Snedecor).
Caffeine content varied from 0.0348 to 2.3846 g 100 g-1 on different genotypes (Table 2). Similarity observed in distribution of years and genotypes makes it possible to group samples according to caffeine concentration; however, the large number of genotypes generates overlap, especially in areas of interest.
The individually examined years tended to contribute more to the GxE interaction than the genotypes (Figure 1). This can be observed by the greater dispersion of points or vectors associated with the years compared to the vector associated with genotypes in the biplot (IPCA1 x IPCA2).
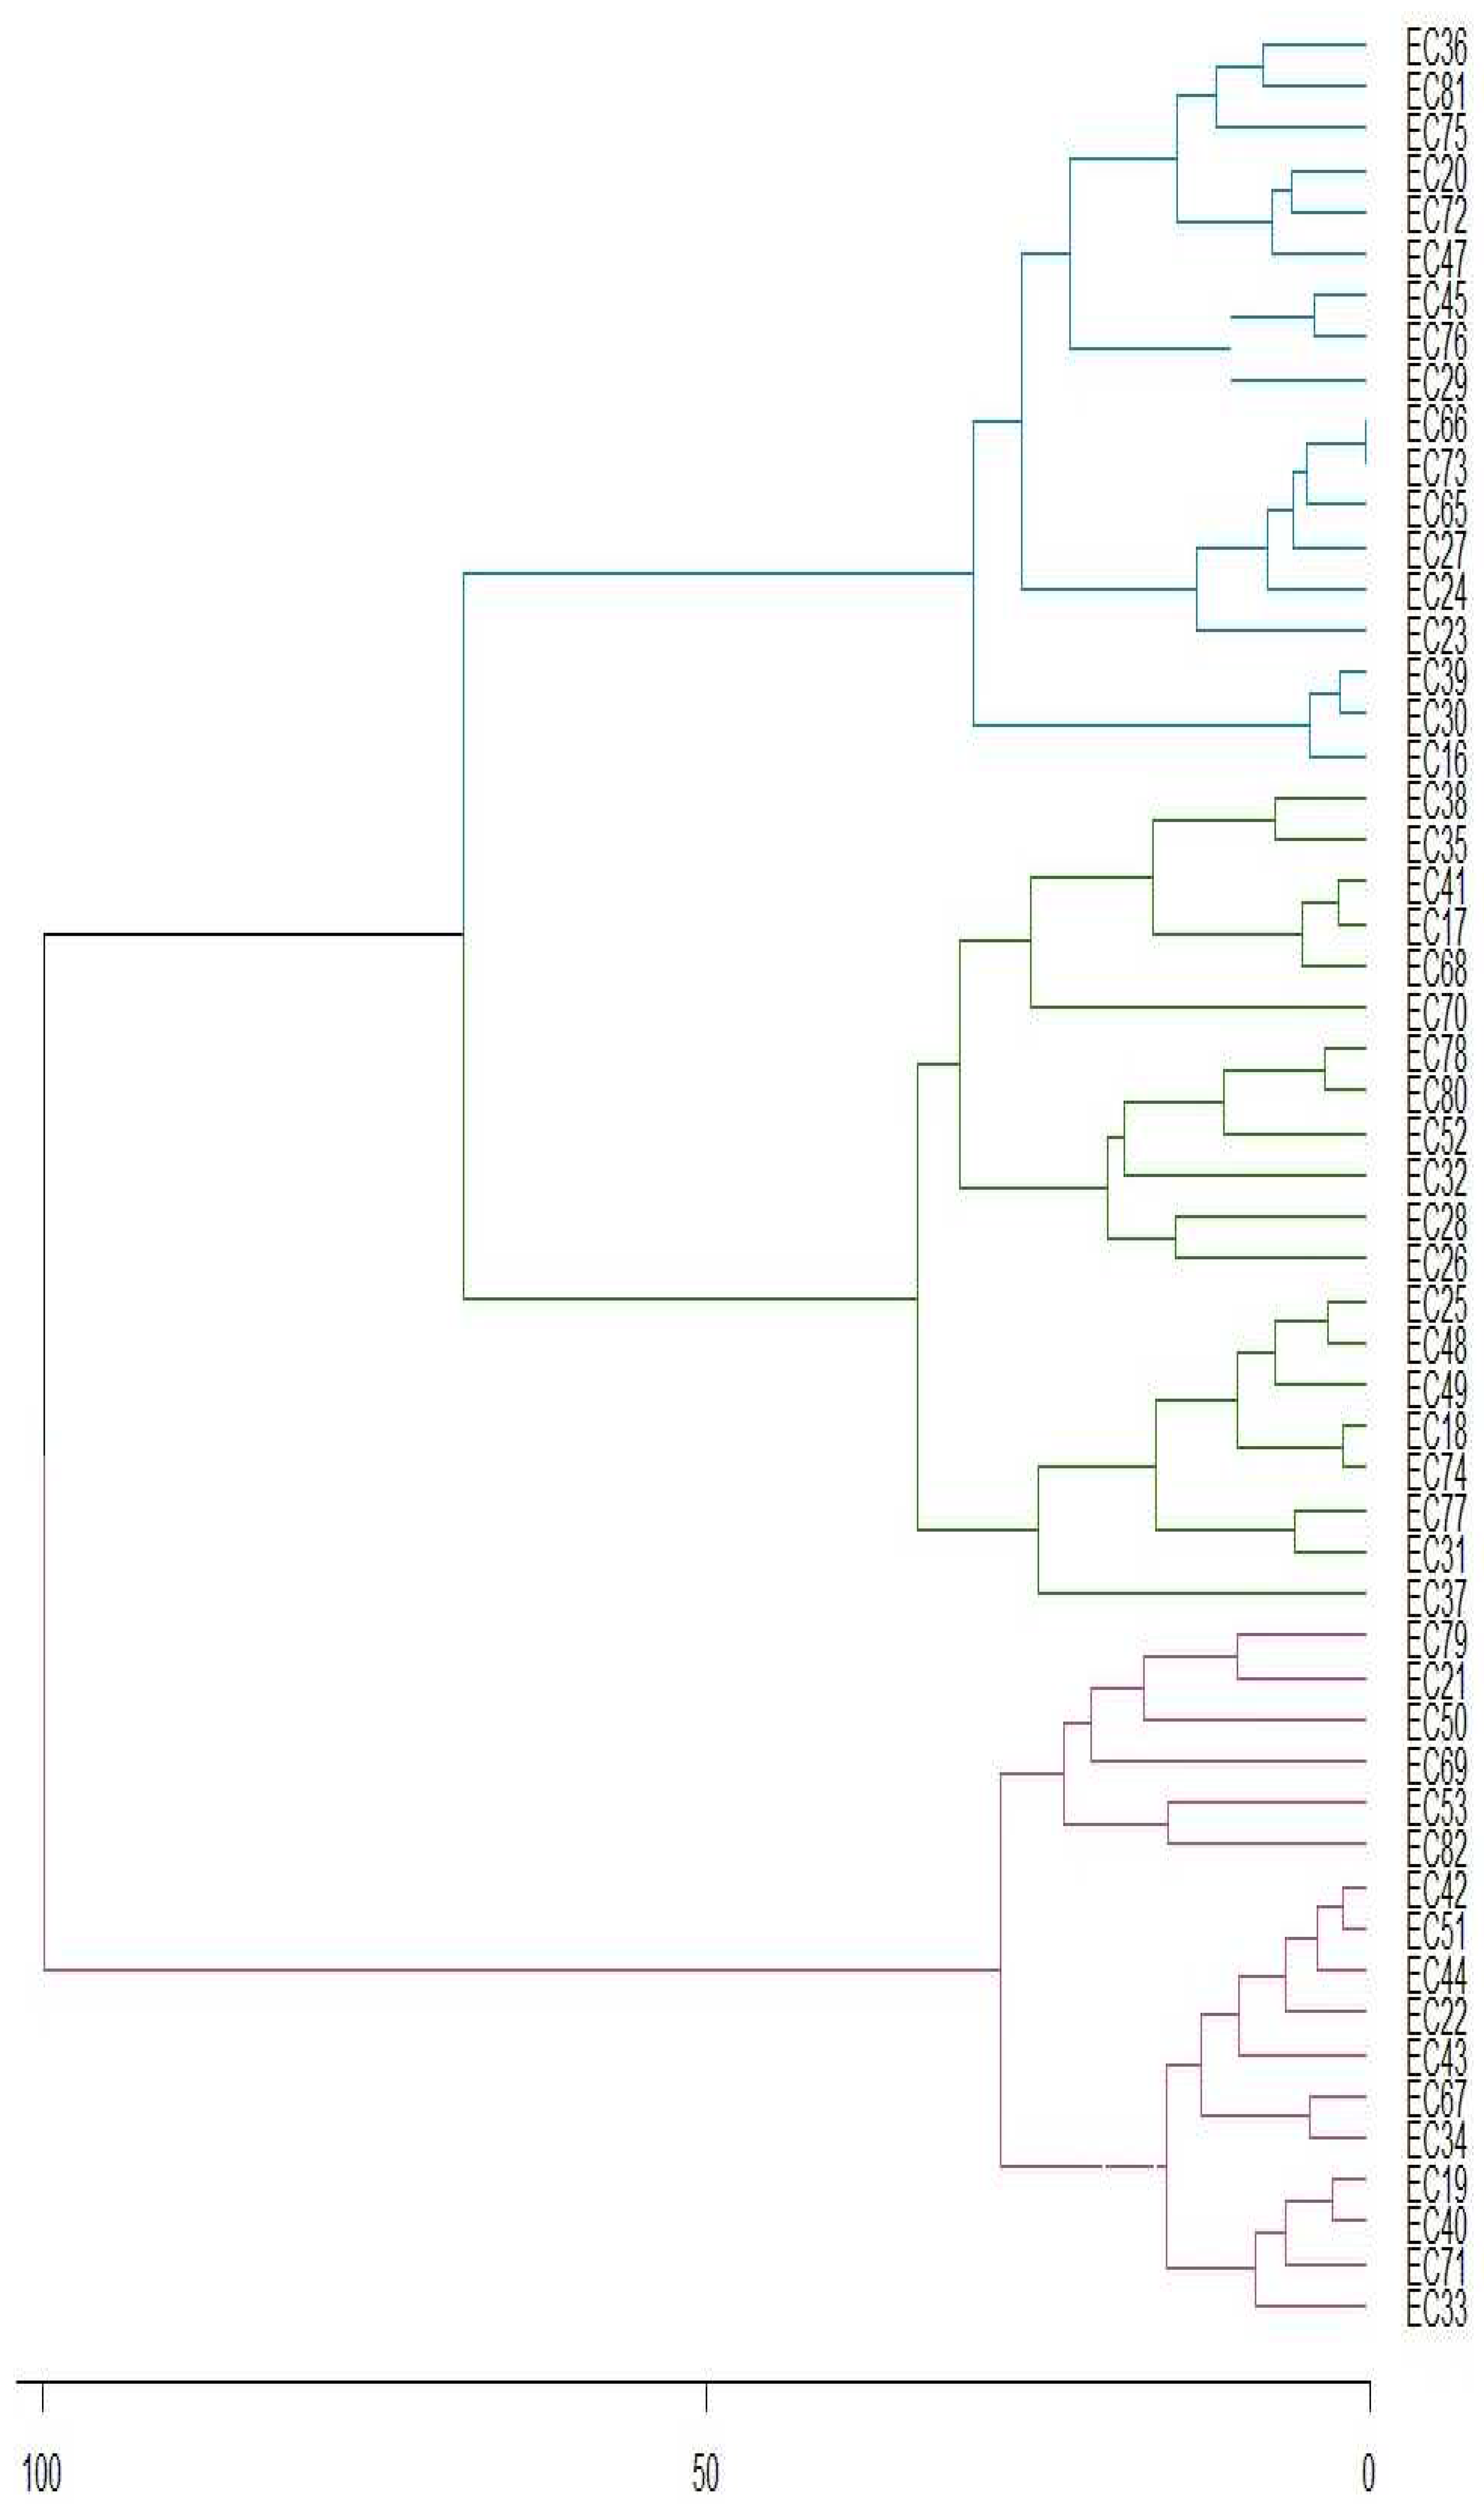
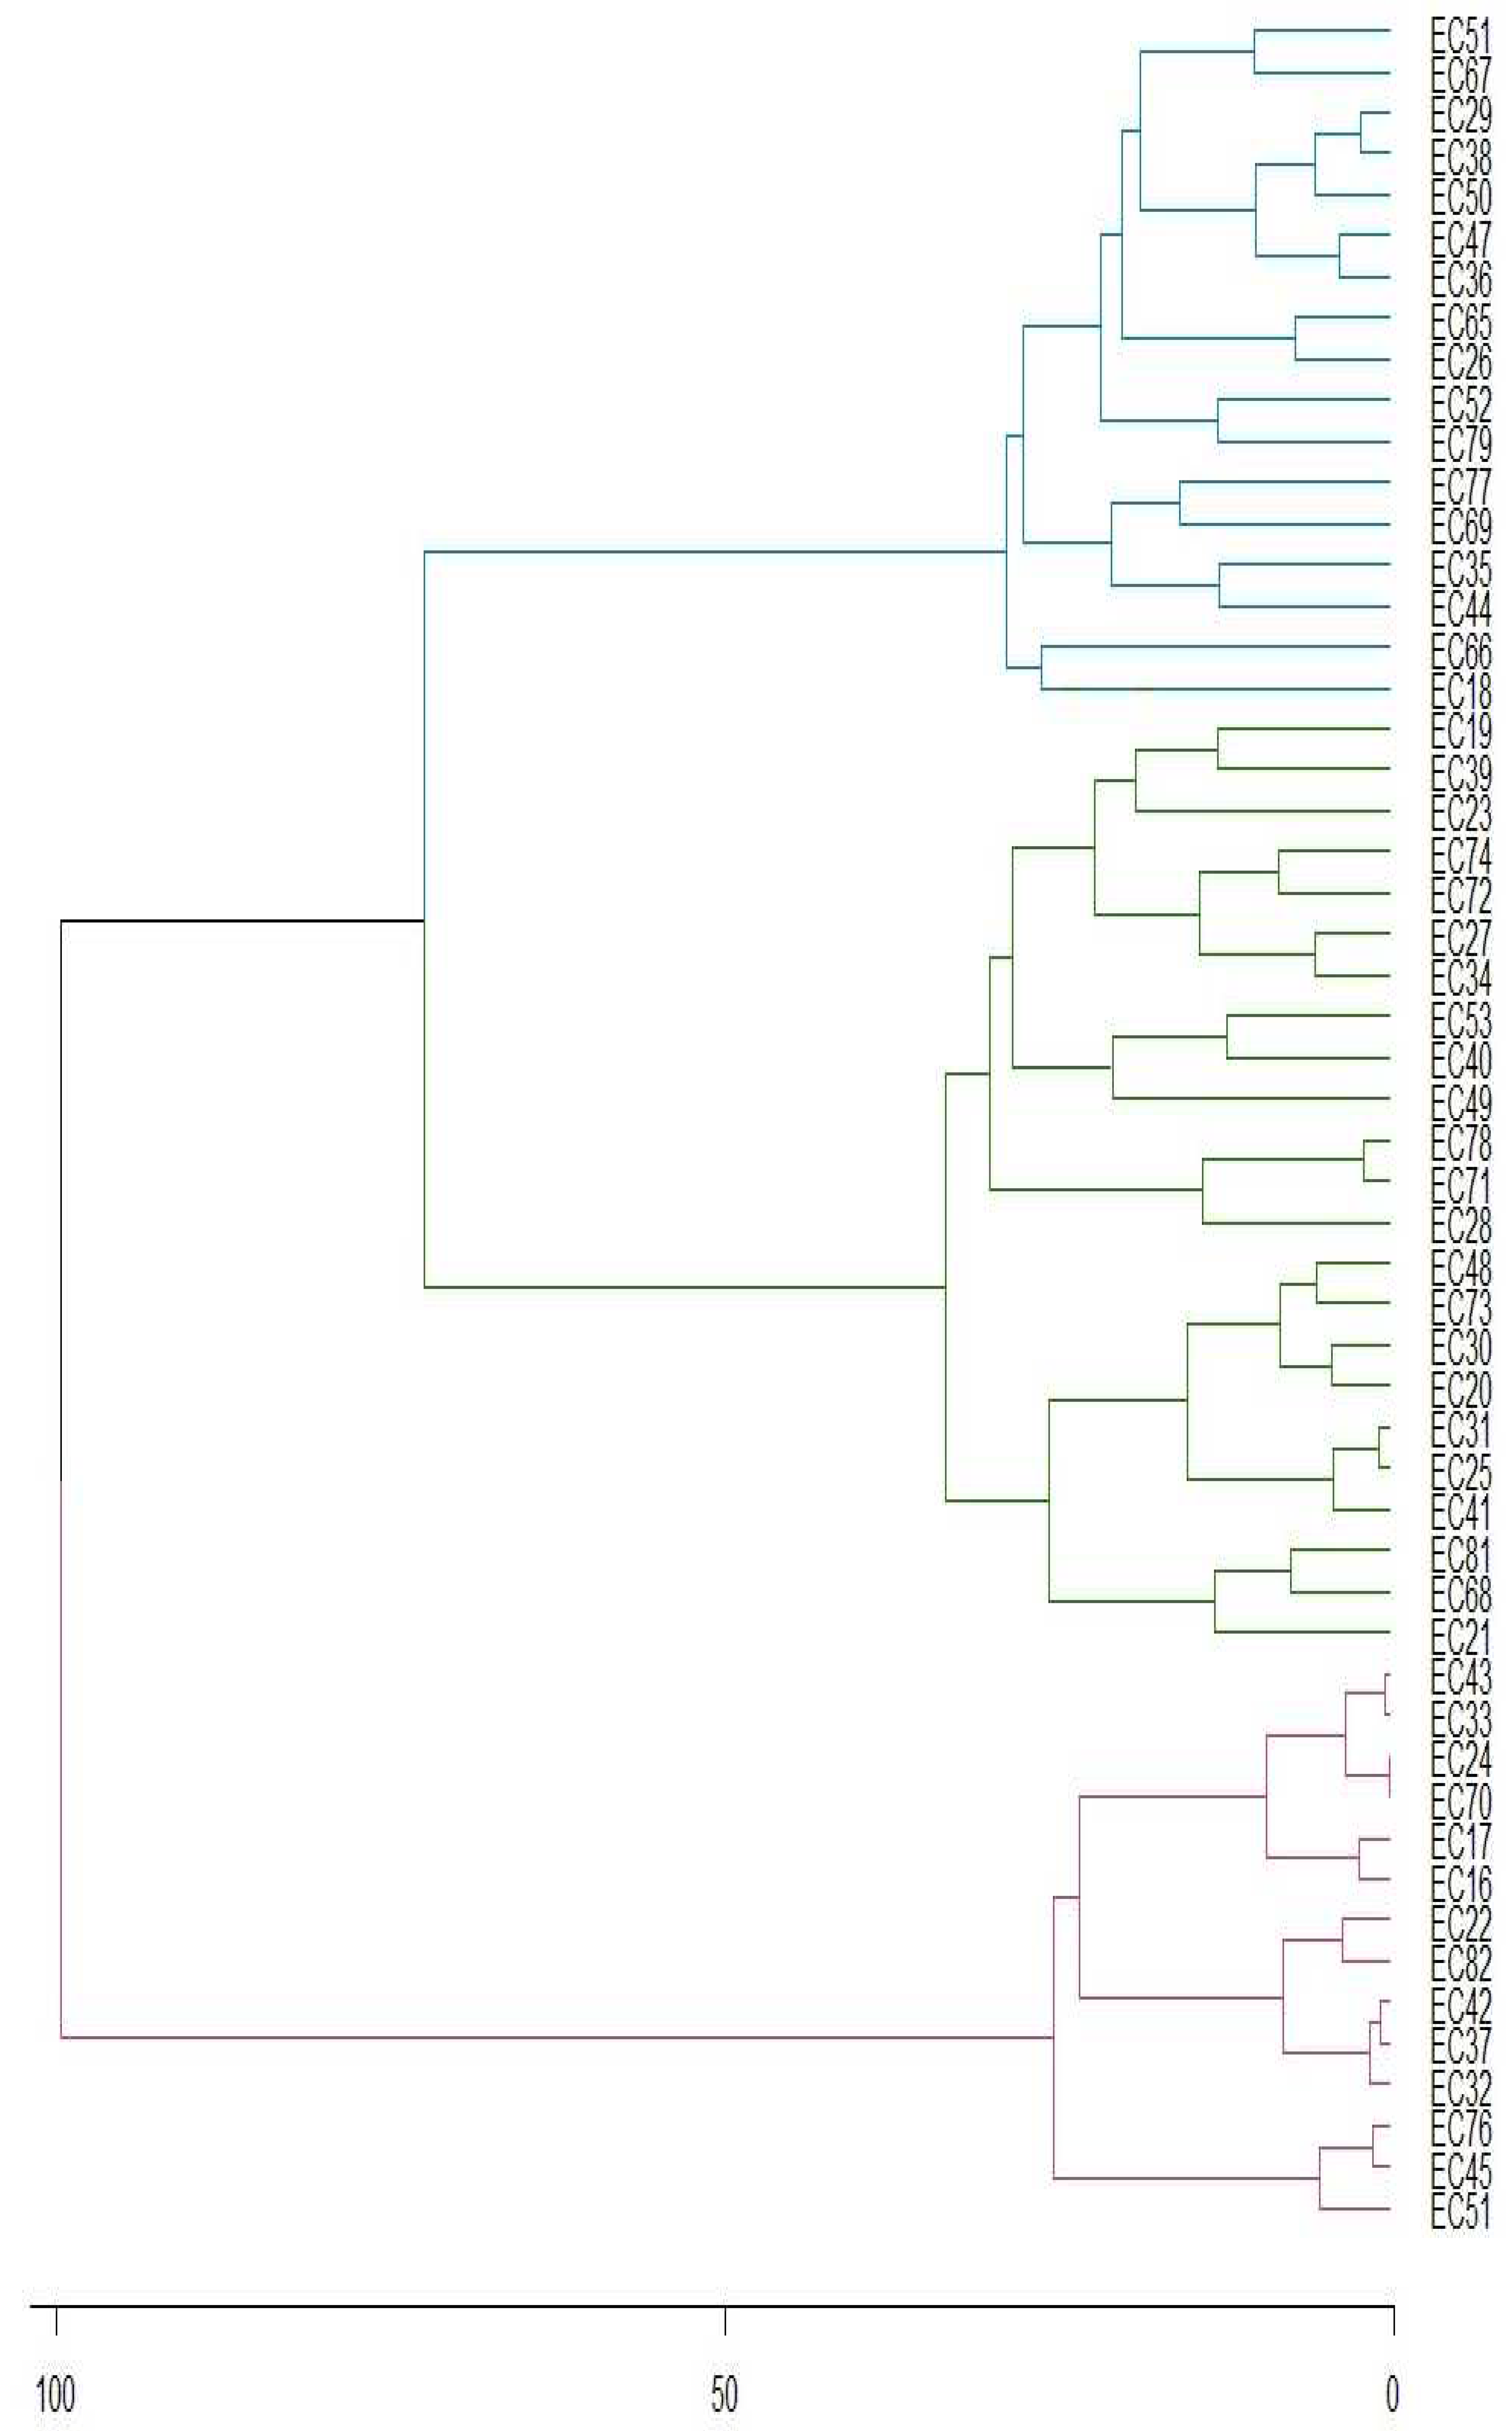
Principal component analysis shows that the first two components describe 81.09% of total variance, implying great dependence of genotype on caffeine concentrations. Horizontal axis accounts for 58.35% of variation, while vertical axis corresponds to 22.74% (Figure 1). Figure 2 shows genotypes stability, with 44,5% of them stable at 1% probability of error (represented in blue). Additionally, 24,1% of genotypes are stable at 5% (represented in green) and 31,5% of genotypes are not stable throughout the four years (represented in red).

3.2 Theobromine

The statistics results show wide genetic variability for theobromine content in yerba mate progenies (Table 3).
Table 3. Variance analysis associated with the breakdown of interaction effect (GxA) for theobromine concentration of yerba mate genotypes (EC) tested across four consecutive years.
Variation sources GL SQ F (Pr>F)
Model 57 19.86
Genotype (G) (54) (19.38) 12.71 (<0.0001)
Year (A) (3) (0.48) 5.70 (0.0010)
High Variance (%)
Axes Value Explained Cumulative
GxA 162 4.57
1   2.73  59.78    59.78 IPCA1 (56) (2.73) 3.11 (<0.0001)
2   1.25  27.35    87.13 IPCA2 (54) (1.25) 1.47 (0.0238)
3   0.59  12.87    100.00 IPCA3 (52) (0.59) 0.72 (0.9237)
Mean Error 295 4.63
Adjusted Total 219 24.43
GL: liberty levels; SQ: sum of the square; Pr>F: probability estimate by F-test (Fischer-Snedecor).
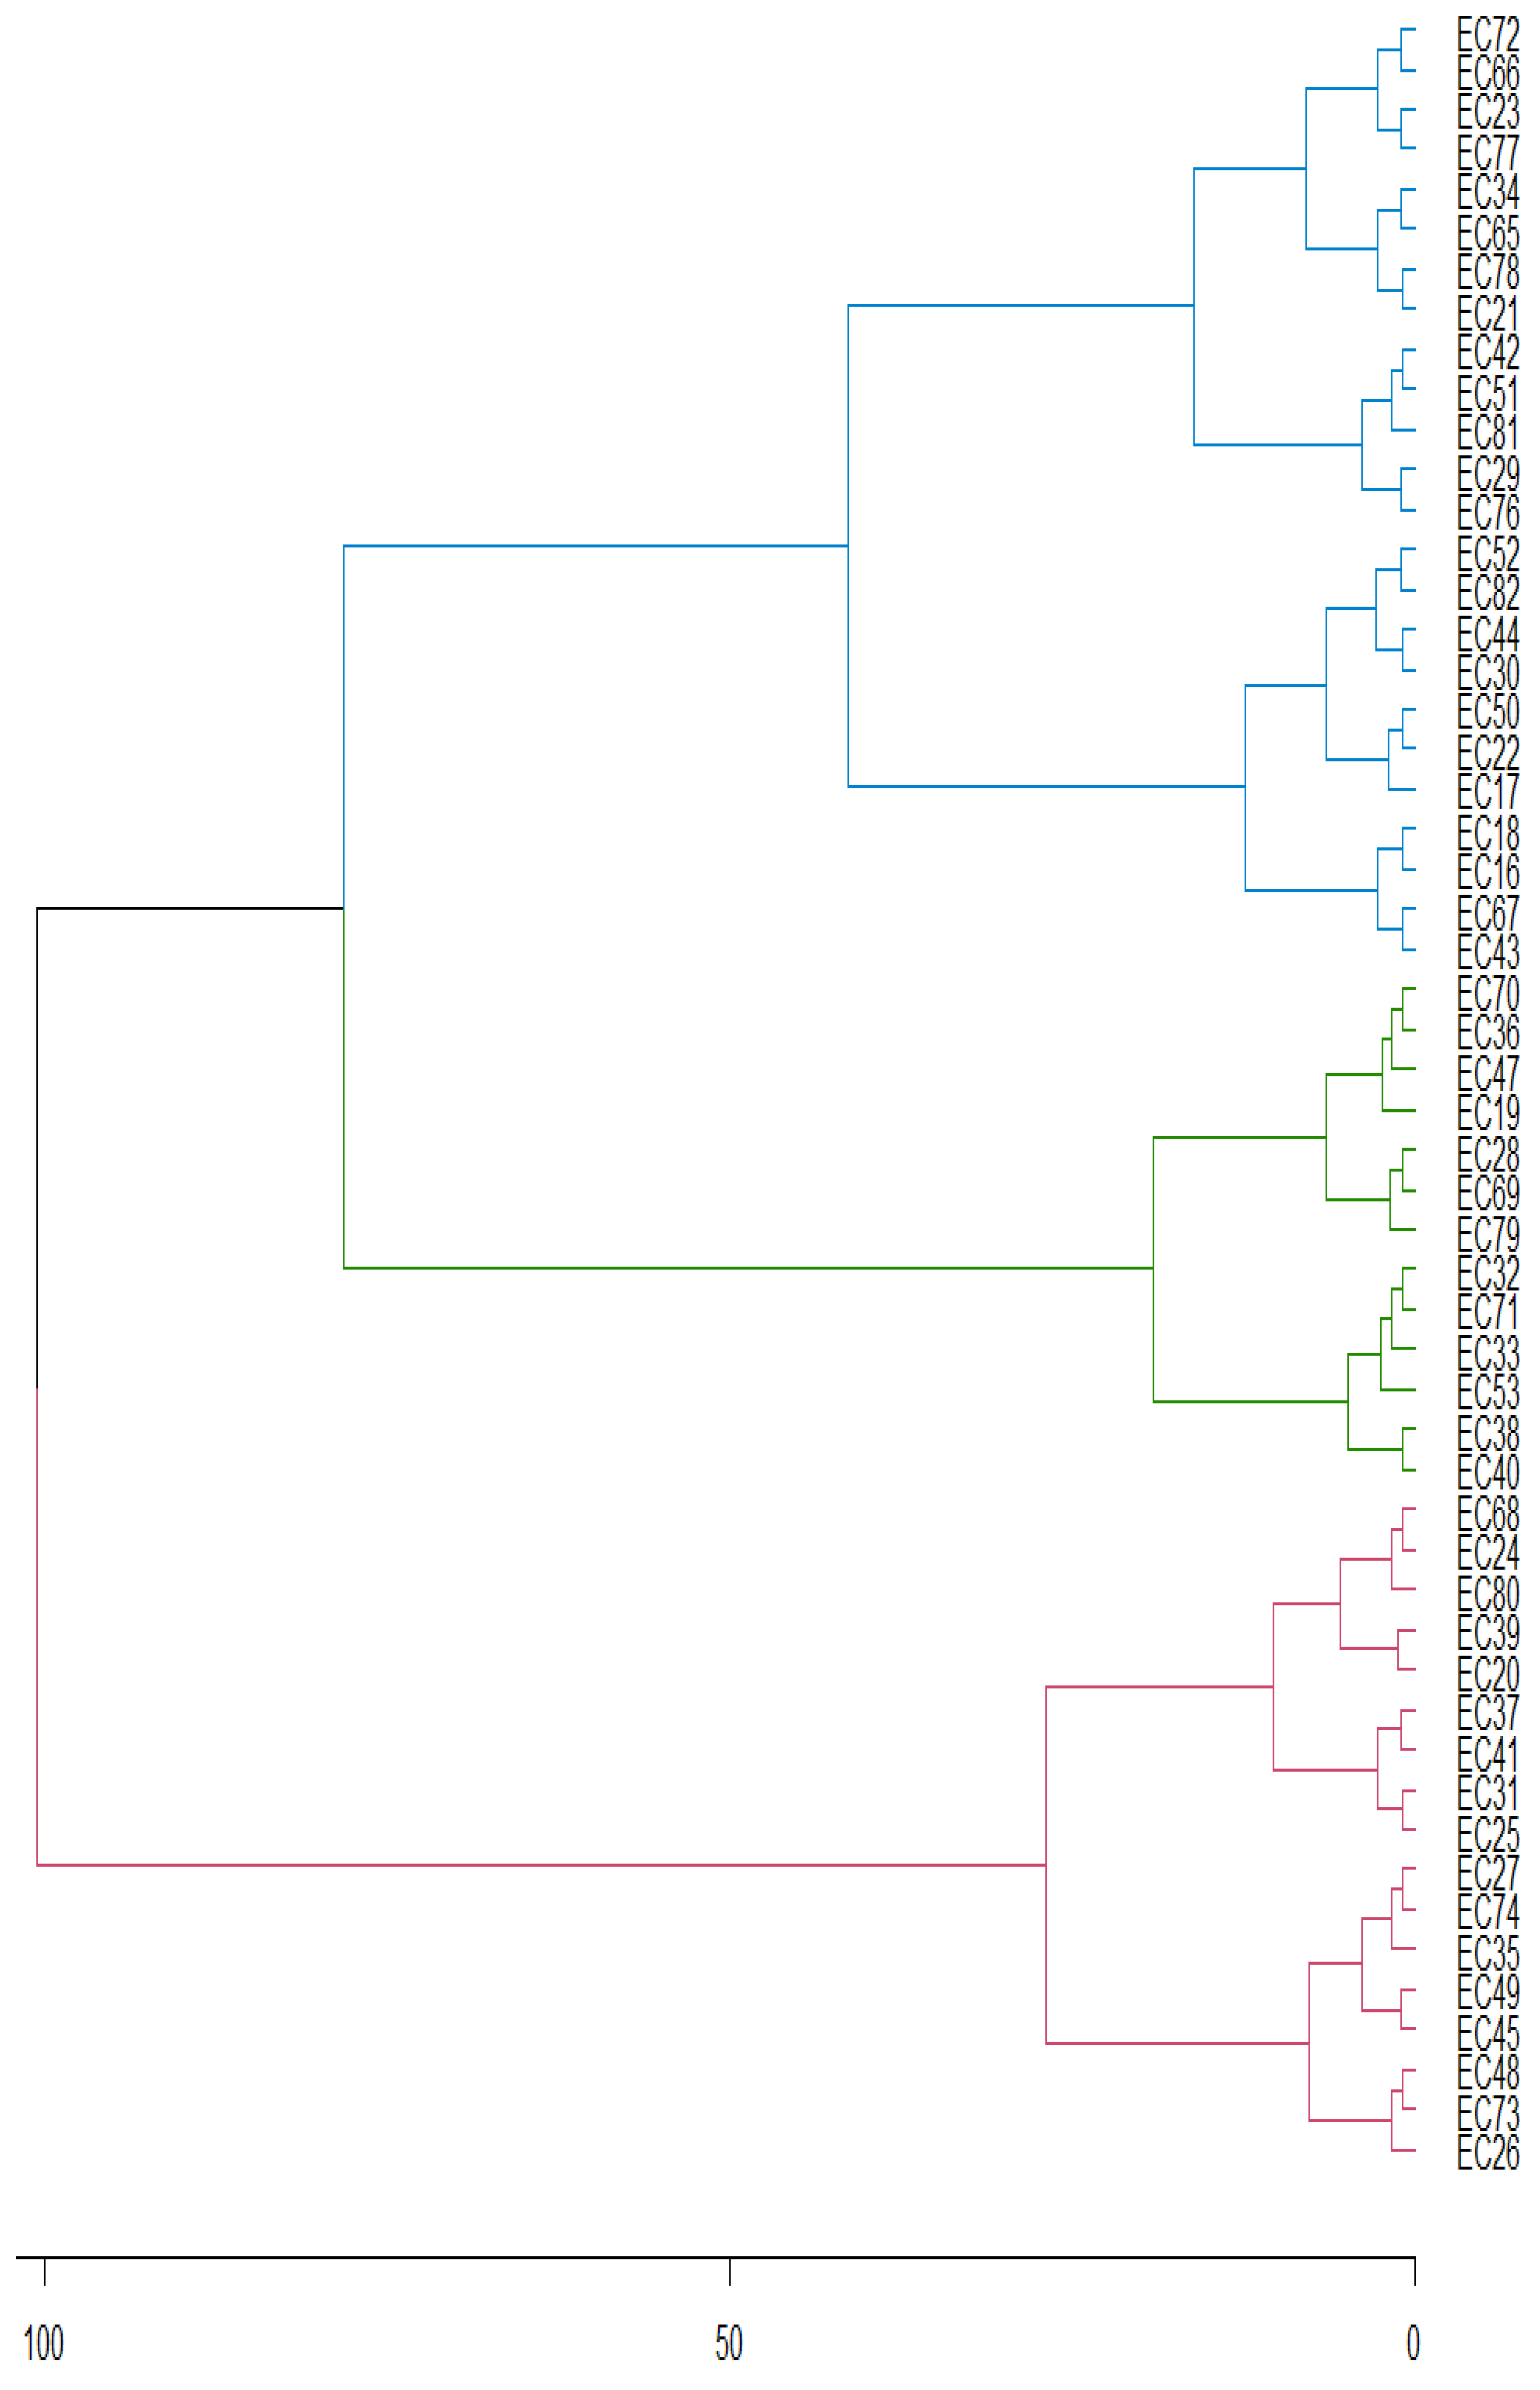
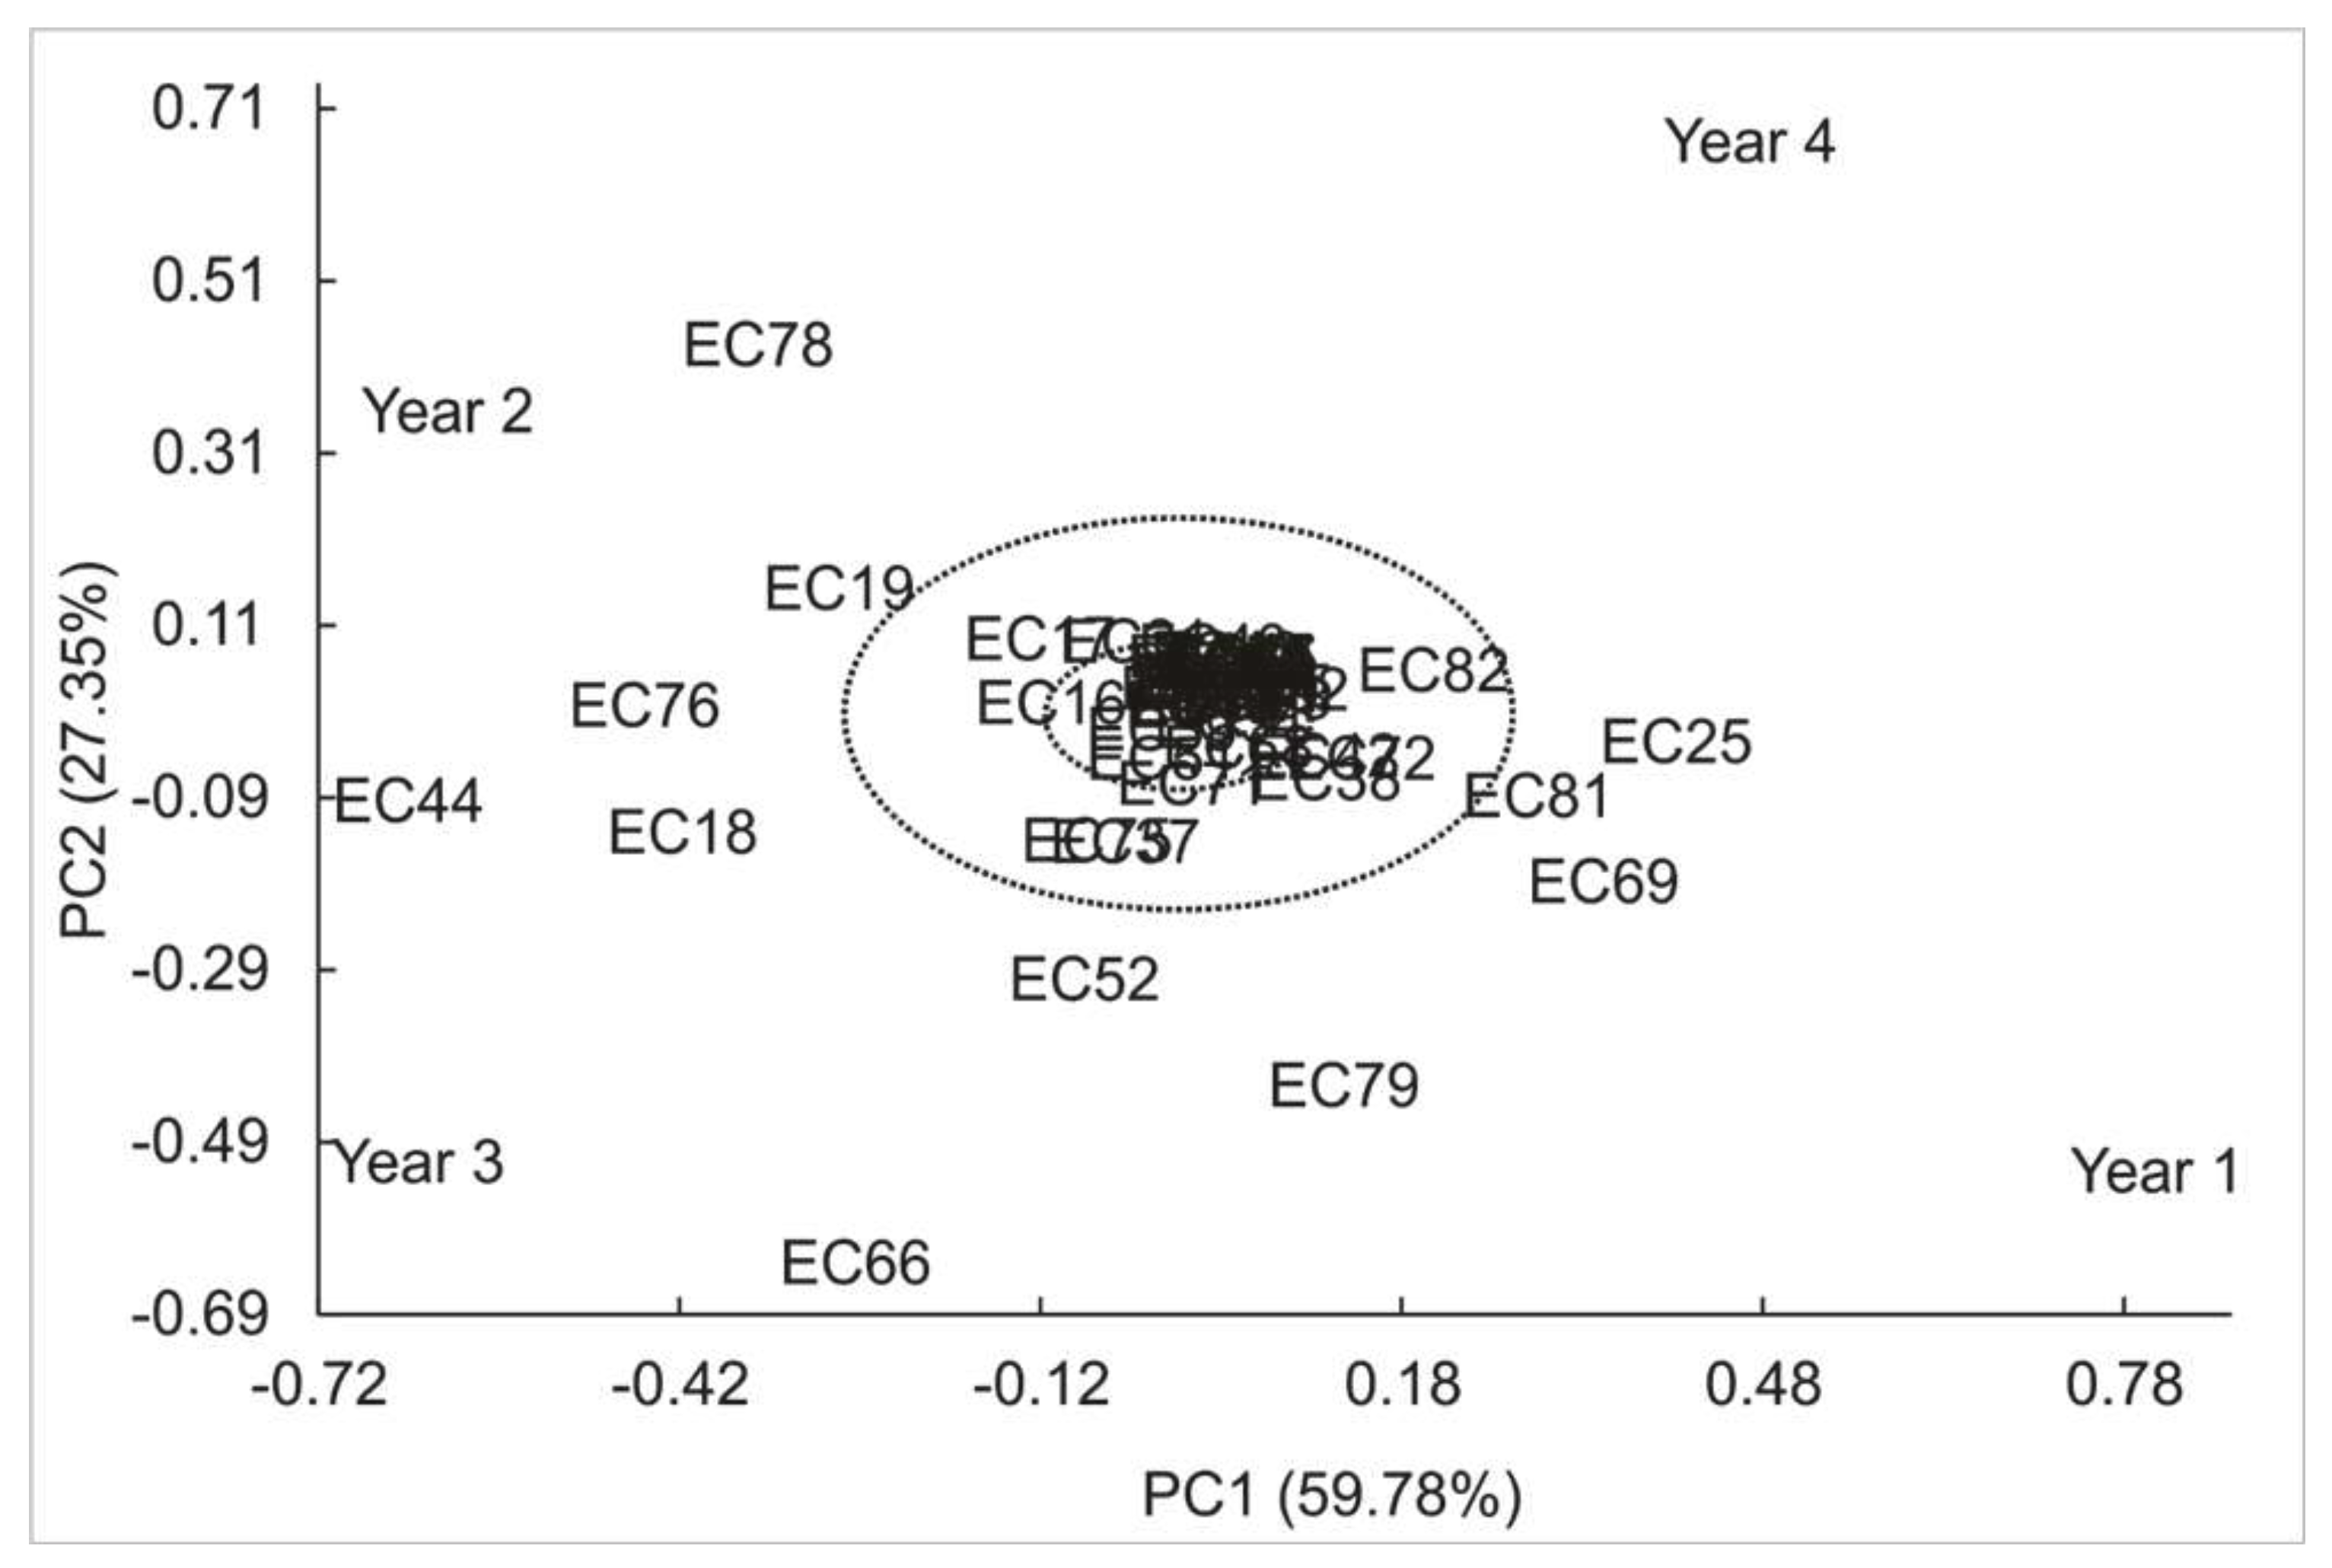
The theobromine concentrations ranged from 0.0004 to 1.7719 g 100 g-1 in the 55 analyzed genotypes (Table 4), with the first component describing 59.78% of variance observed in genotype-environment interaction.
Homogeneity of genotype distribution from 0 and 0.5 g 100 g-1 shows lower theobromine concentrations in yerba mate plants when compared to caffeine (Figure 3).
Principal component analysis shows that first two components describe 81.12% of total variance, implying great dependence of genotype on theobromine concentrations. Figure 4 shows the stability of genotypes, with 69.1% of genotypes stable at 1% probability of error (represented in blue). Additionally, 10.9% of the genotypes are stable at 5% (represented in green), while 20% of genotypes are non-stable (represented in red).

3.3 Total phenolic compounds

Similar to methylxanthines, we found wide variability in total phenolic compounds (Table 5).
Table 5. Variance analysis associated with the breakdown of interaction effect (GxA) for total phenolic compounds concentration of yerba mate genotypes (EC) tested across four consecutive years.
Variation sources GL SQ F (Pr>F)
Model 57 95.58
Genotype (G) (54) (54.76) 1.38 (0.0642)
Year (A) (3) (40.82) 18.50 (<0.0001)
High Variance (%)
Axes Value Explained Cumulative
GxA 162 118.50
1   54.03  45.60    45.60 IPCA1 (56) (54.03) 2.37 (<0.0001)
2   50.41  42.54    88.13 IPCA2 (54) (50.41) 2.29 (<0.0001)
3   14,06  11.87    100.00 IPCA3 (52) (14.06) 0.66 (0.9625)
Mean Error 295 120.12
Adjusted Total 219 214.08
GL: liberty levels; SQ: sum of the square; Pr>F: probability estimate by F-test (Fischer-Snedecor).
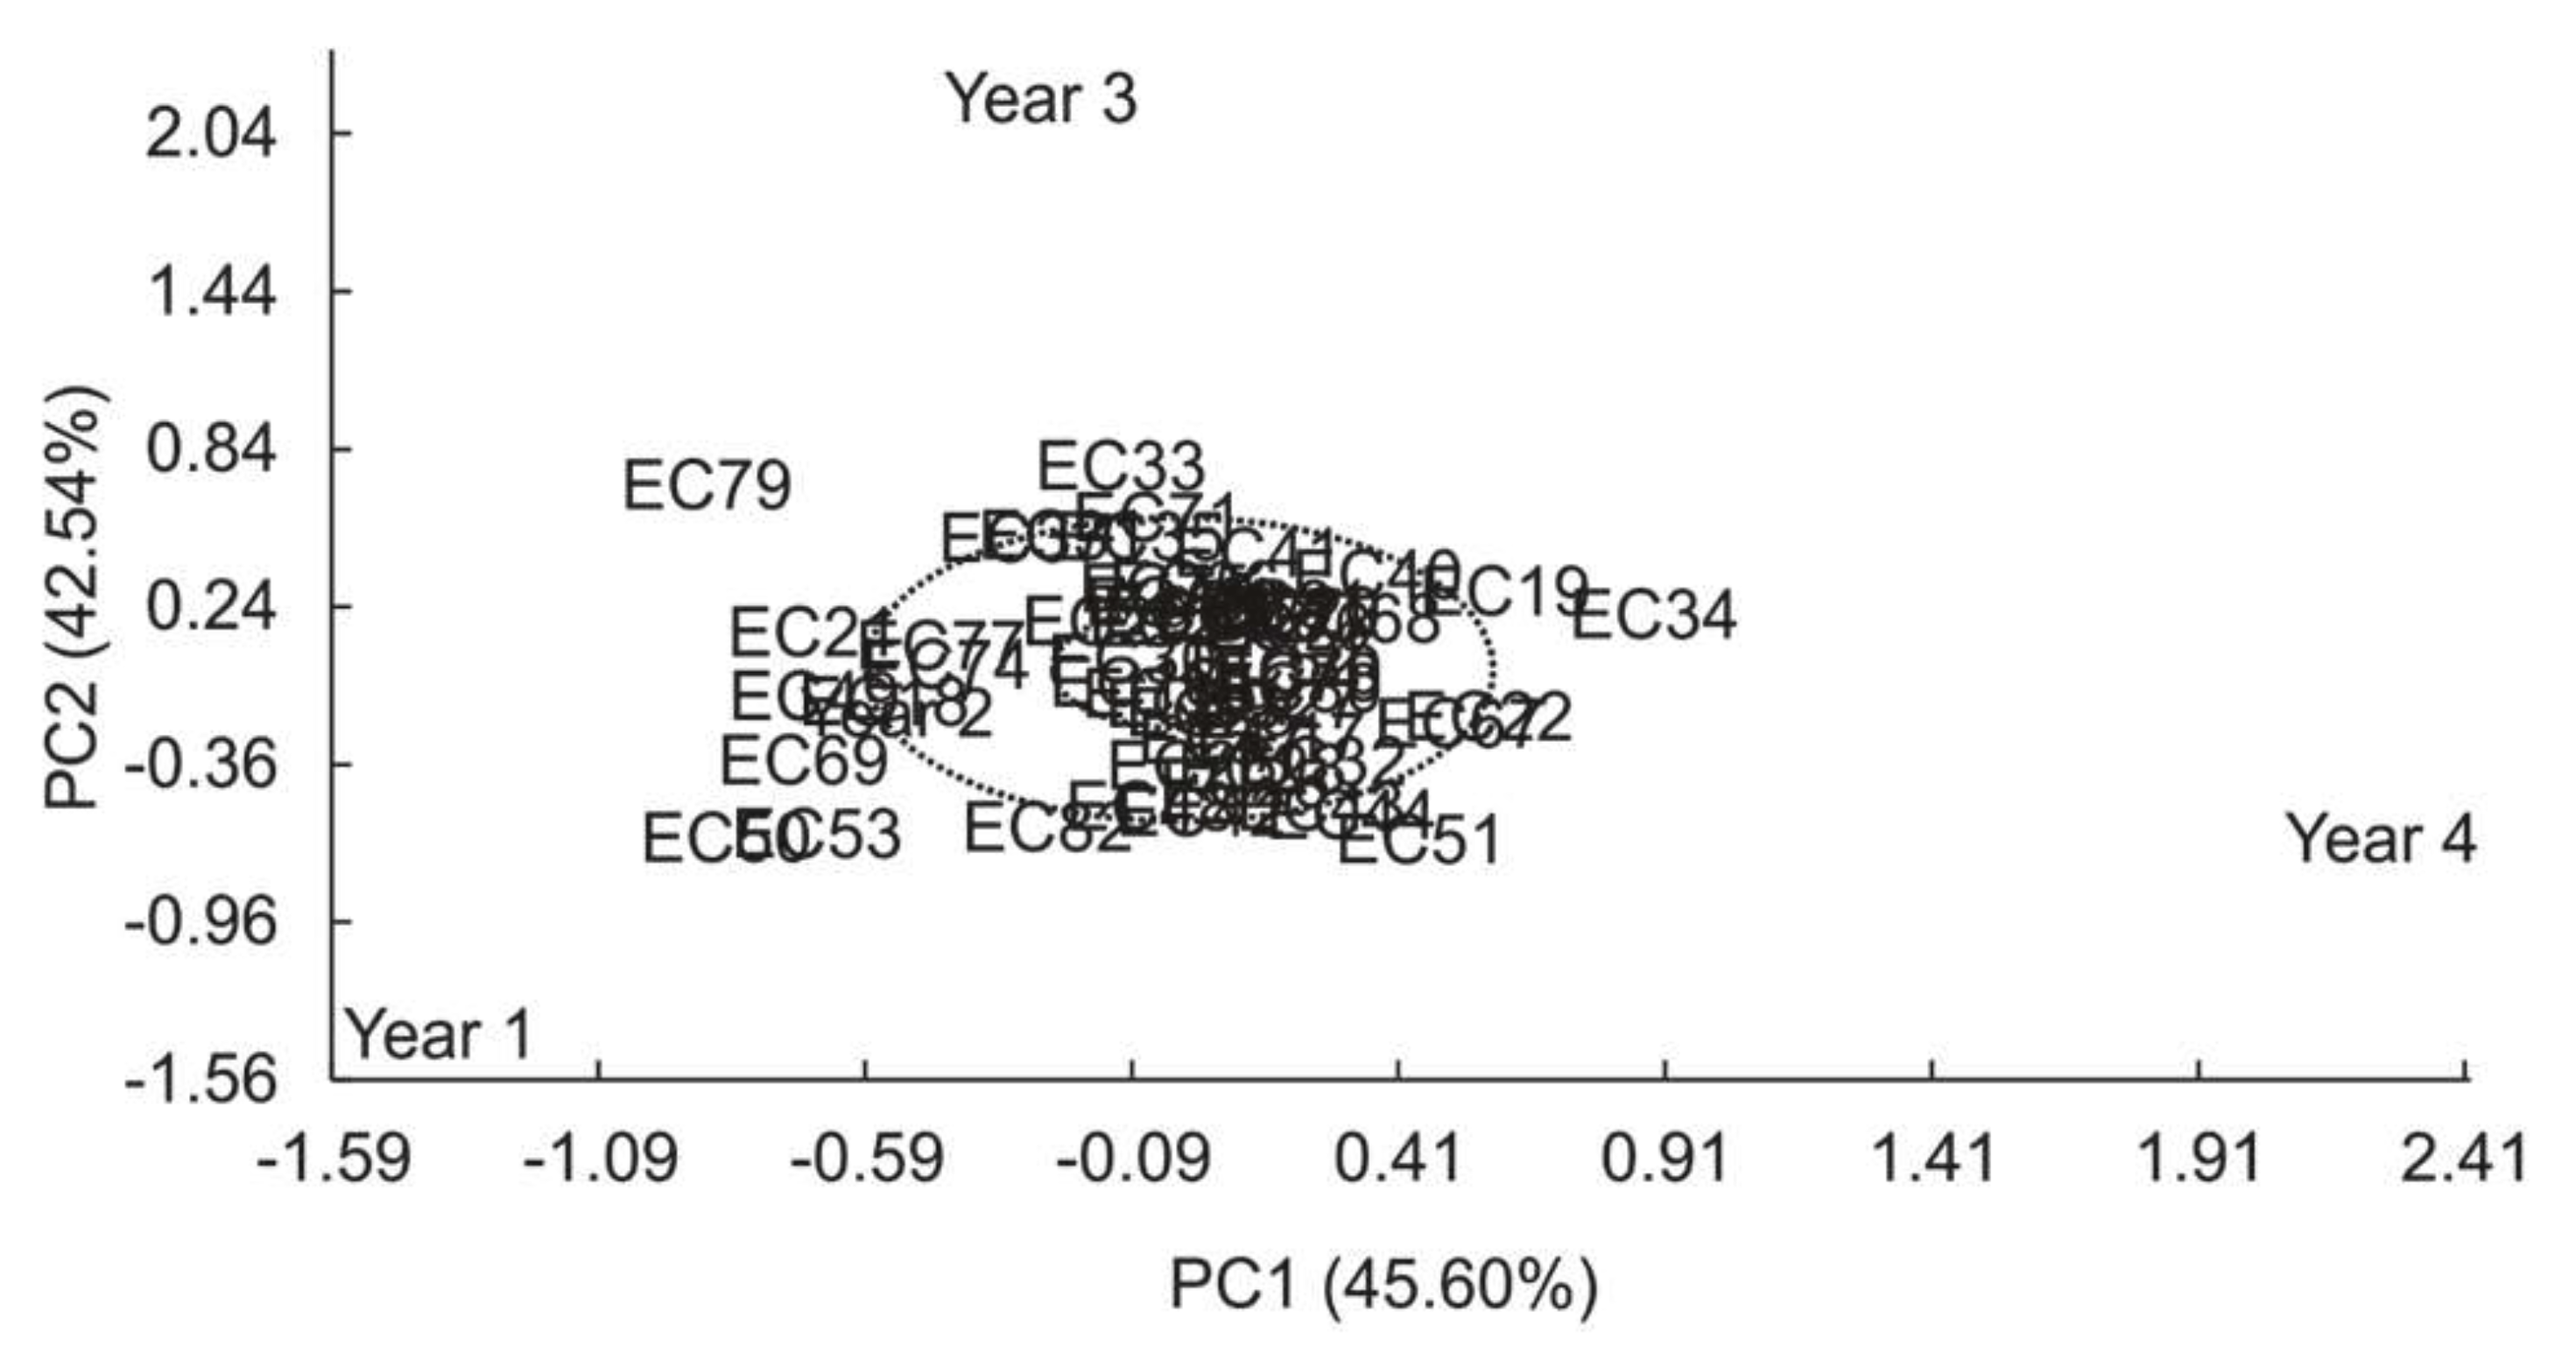
The total phenolic compounds ranged from 7.028 to 9.424 g 100 g-1 in the 55 genotypes (Table 6). First component describes 45.60% of variability observed in genotype-environment interaction.
In Figure 5, the influence of genotype on the composition of total phenolic compounds is clear in the distribution of progenies along the horizontal axis and demonstrates the importance of improving this characteristic in leaf biomass of yerba mate in future cultivars.
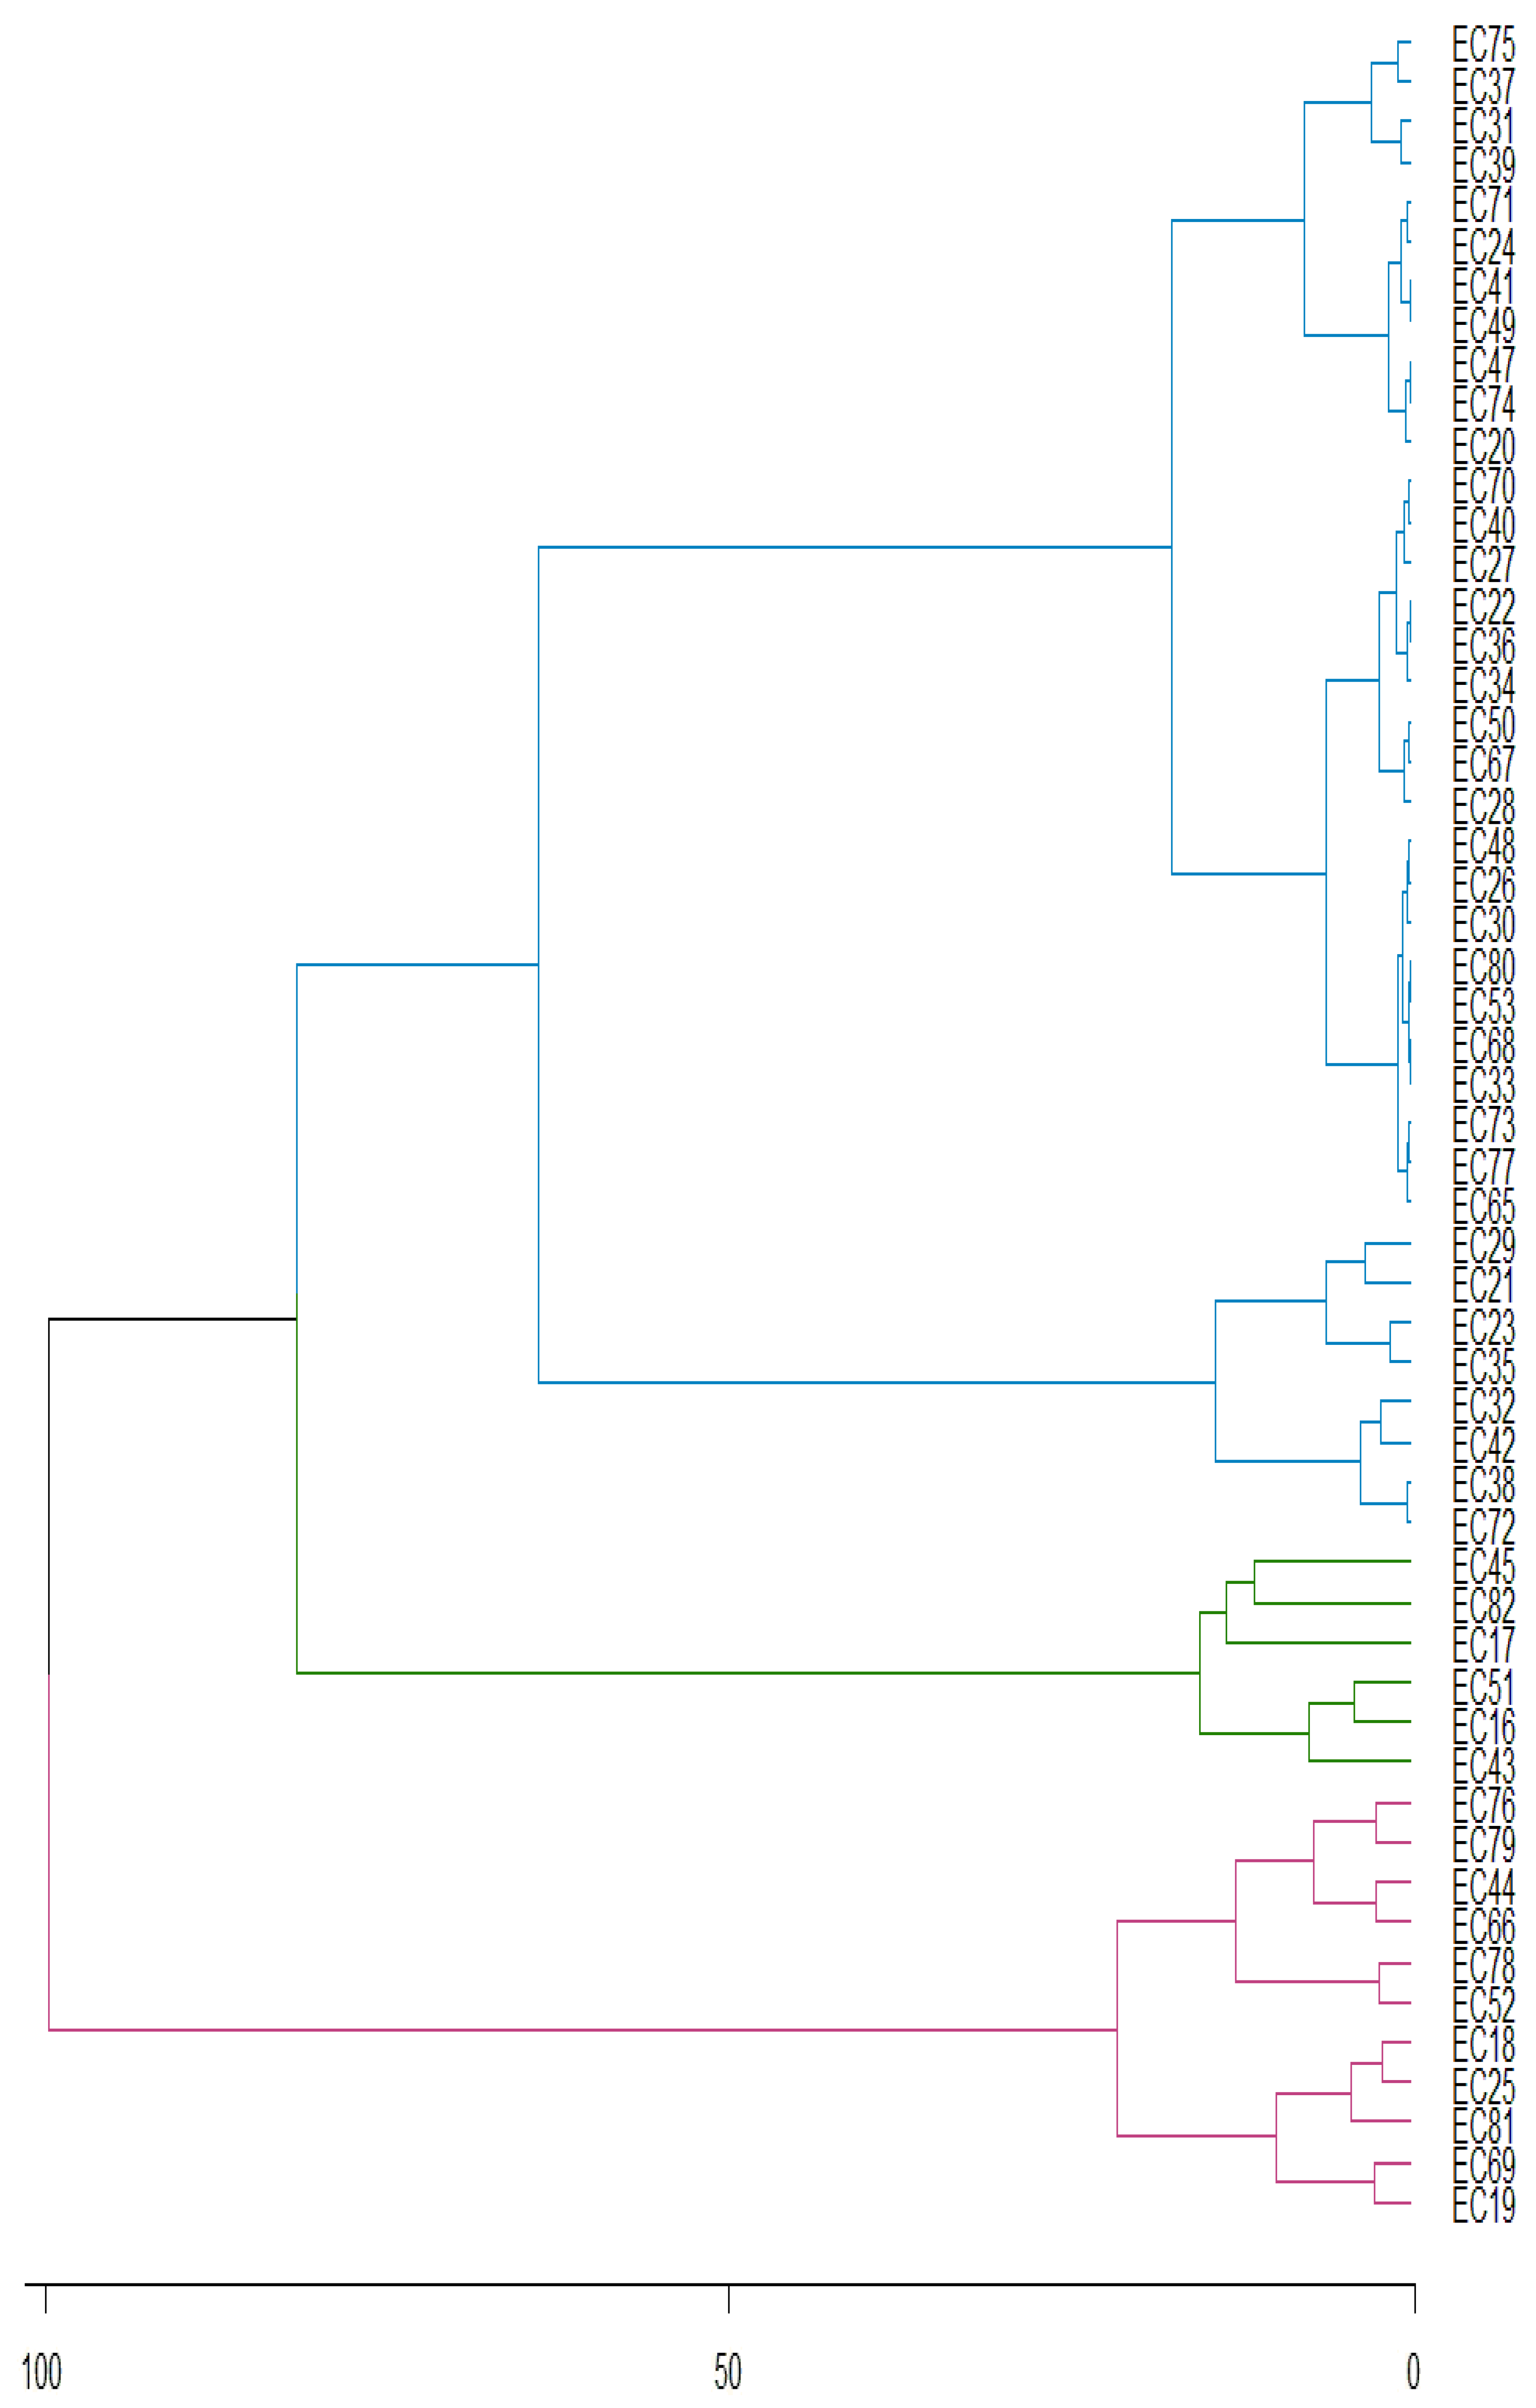
Principal component analysis for total phenolic compounds concentration shows that first two components describe 88.13% of total variance. The Figure 6 shows the stability of genotypes, with 32.7% of genotypes stable at 1% probability of error (represented in blue), while 36.4% of genotypes are stable at 5% (represented in green) and 30.9% of genotypes are not stable (represented in red).

3.4. Proteins

Wide genetic variability was found in protein composition for yerba mate genotypes, with strong genetic influence and an increase in proteins of up to 59.49% among progenies (Table 7).
Table 7. Variance analysis associated with the breakdown of interaction effect (GxA) for proteins concentration on yerba mate genotypes (EC) tested across four consecutive years.
Variation sources GL SQ F (Pr>F)
Model 56 776.84
Genotype (G) (53) (354.64) 2.68 (<0.0001)
Year (A) (3) (422.20) 56.31 (<0.0001)
High Variance (%)
Axes Value Explained Cumulative
GxA 159 397.41
1   195.96  49.31    49.31 IPCA1 (55) (195.96) 3.04(<0.0001)
2   132.31  33.29    82.60 IPCA2 (53) (132.31) 1.23 (0.1491)
3   69.14  17.40    100.00 IPCA3 (51) (69.14) 1.06 (0.3731)
Mean Error 290 402.90
Adjusted Total 215 1174.25
GL: liberty levels; SQ: sum of the square; Pr>F: probability estimate by F-test (Fischer-Snedecor).
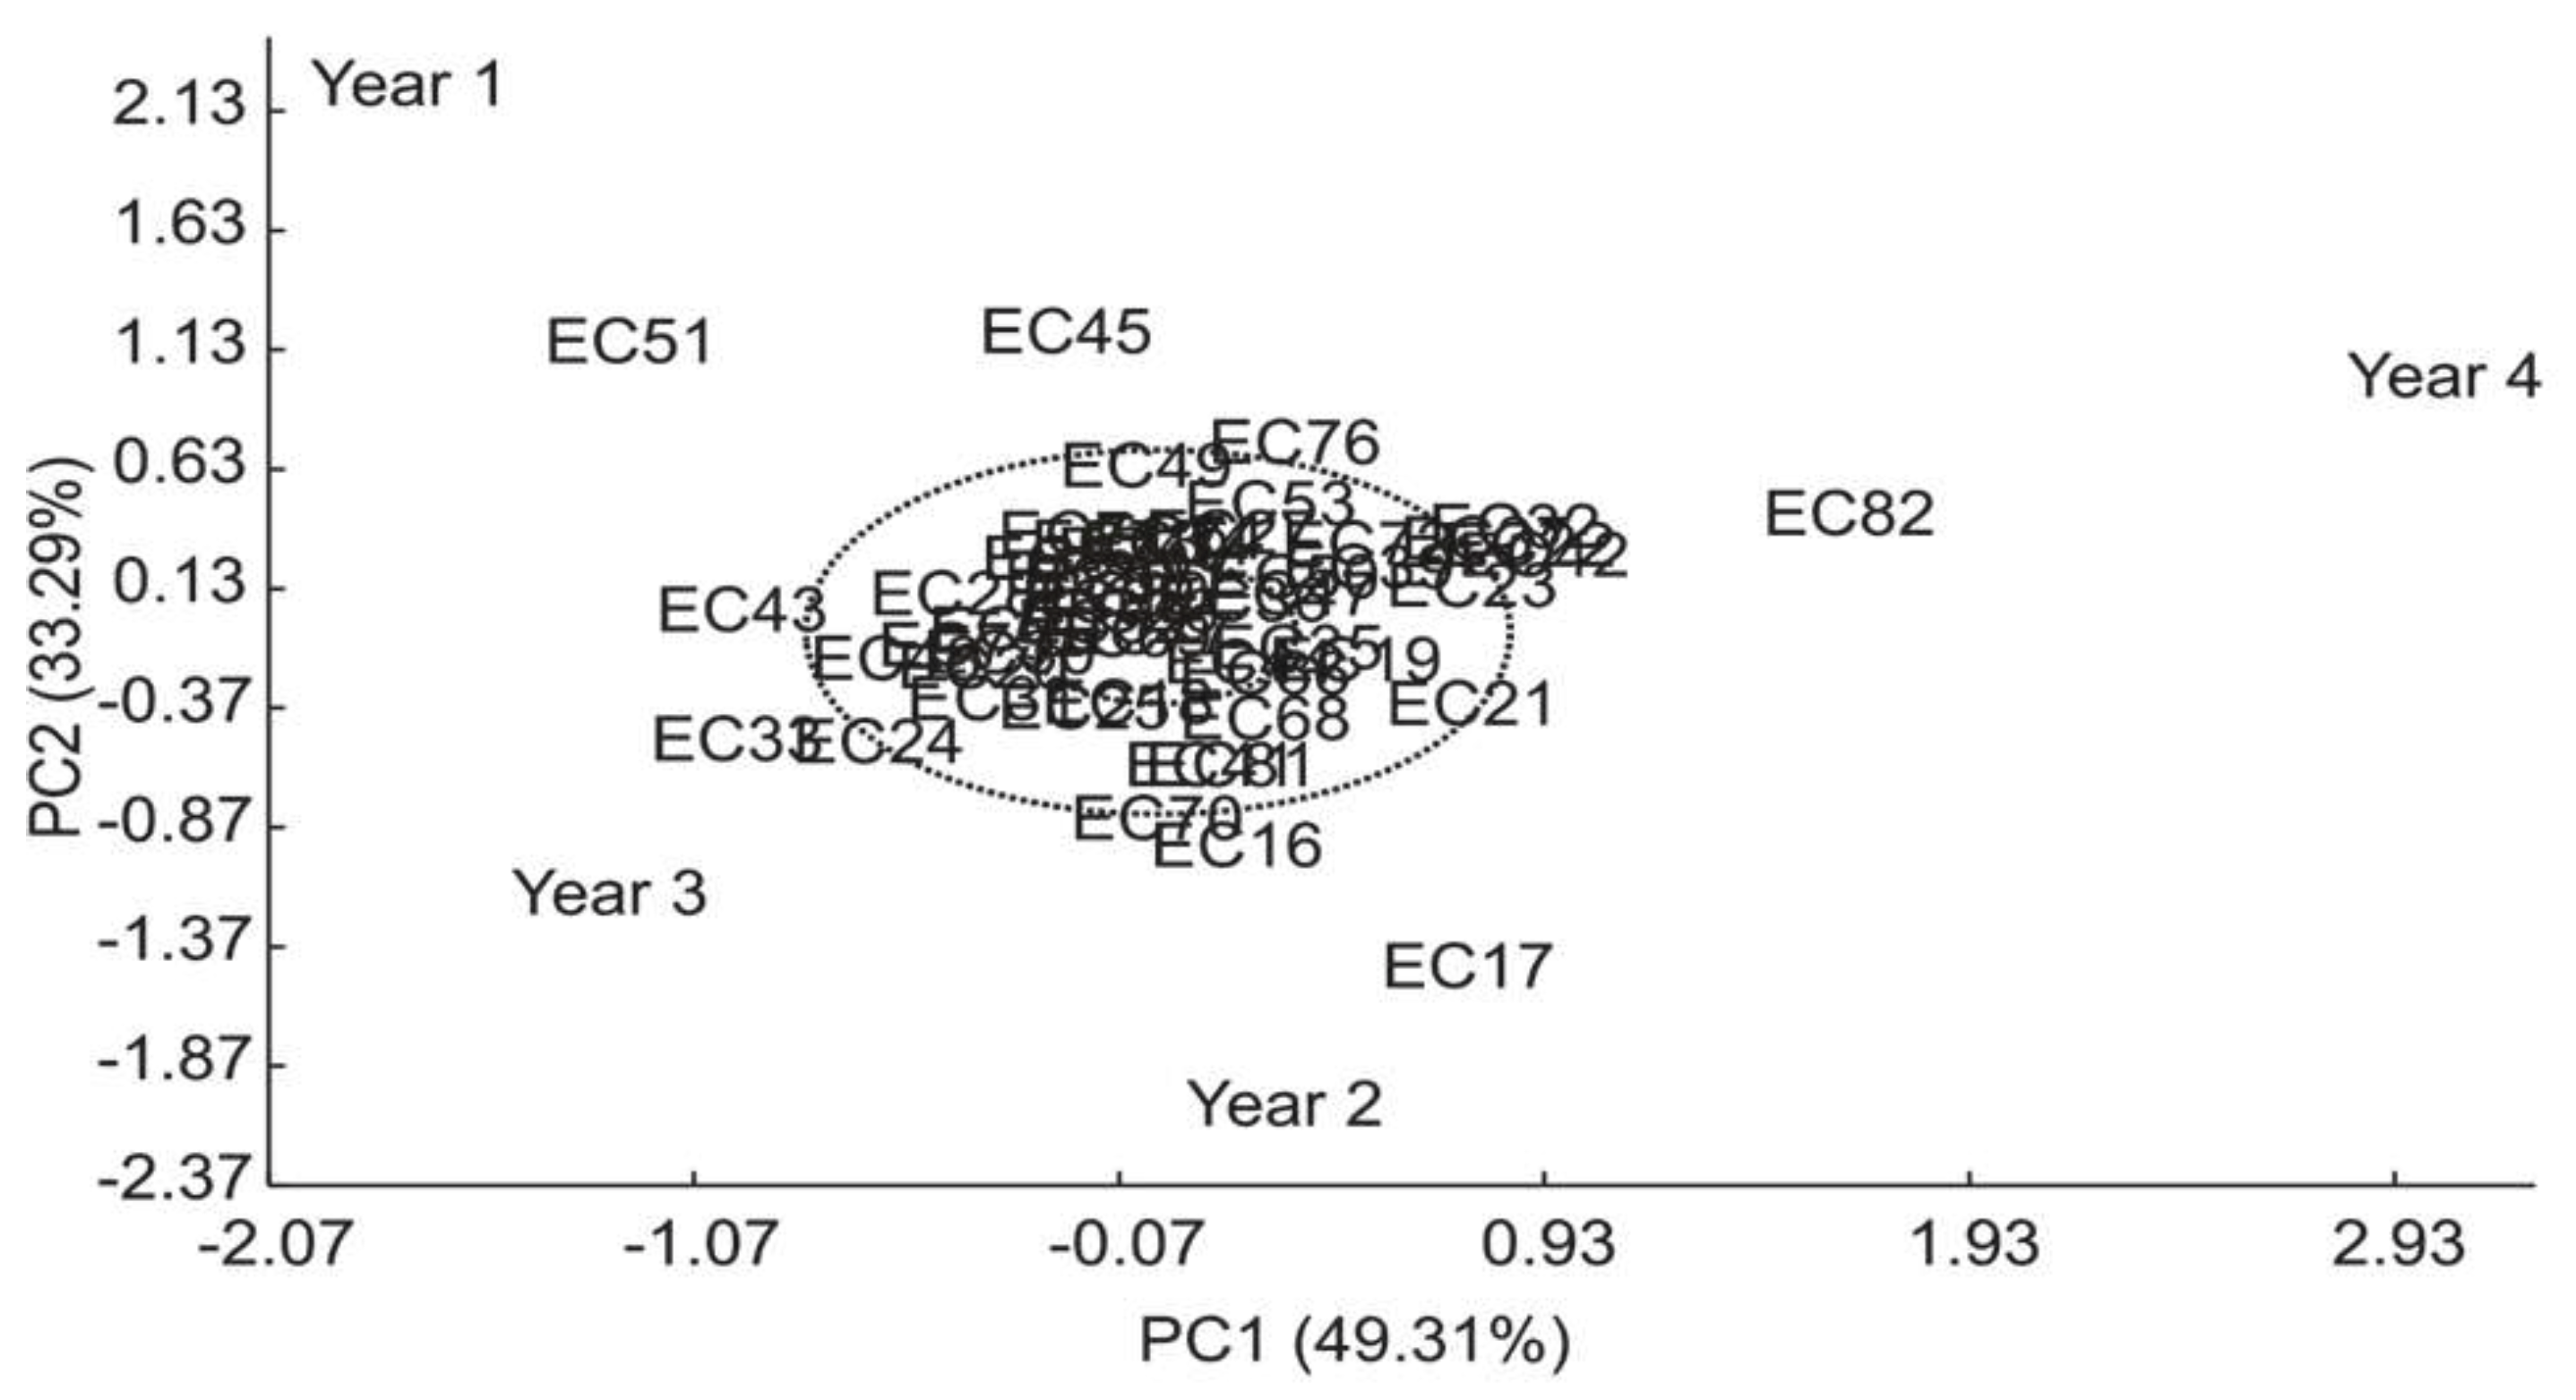
Principal component analysis for distribution of total protein concentrations showed a variation from 10.39 to 16.58 g 100 g-1 in the 54 analyzed genotypes (Table 8).
First component describes 49.31% of the variability observed in genotype-environment interaction (Figure 7).
Results show that 31.5% of genotypes were stable at 1% probability of error (represented in blue) and 42.6% were stable at 5% (represented in green), while 25.9% of genotypes were not stable (represented in red) (Figure 8).

4. Discussion

We confirm the wide genetic variability for caffeine concentration in yerba mate. Sixteen genotypes (EC19, EC22, EC30, EC16, EC44, EC82, EC67, EC17, EC81, EC50, EC18, EC78, EC51, EC29, EC52 and EC76) presented average caffeine concentrations below 0.1 g 100 g-1 and, therefore can be considered decaffeinated according to Anvisa's RDC No. 277 [24]. All other 38 genotypes were characterized as caffeinated, with caffeine concentrations ranging from 0.121 to 2.385 g 100 g-1. Following the classification defined for yerba mate [25], caffeine concentration can be very low or absent (< 0.1%), low (0.1 - 1.0%), medium (1.0 - 1.6%) or high (>1.6%). Such information made it possible to observe a wide distribution of the studied genotypes where four designated ranges could be found, representing 29.63% (very low), 24.07% (low), 27.78% (medium) and 18.52% (high) (Figure 1).
Caffeine is naturally present in several products and is one of the most consumed food ingredients in the world due to its presence in teas, guarana and coffee [26]. Caffeine content in teas varies greatly depending on the species, edaphoclimatic conditions of its cultivation and phenological stage of leaves [26,27]), which can influence the product quality, making it bitter and altering flavor of the final product [3,28].
Although caffeine presence in yerba mate is well known [1,7,18,29,30], the high variability among genetic materials (0.01 to 2.96 g 100 g-1) are still dubious [18,31] and the lack of knowledge about its stability is clear. When these characteristics are standardized and evaluated successively over several production cycles, more reliable analyses can be established to support the emergence of new yerba mate cultivars with different caffeine concentrations, for different uses.
Over time, high complexity between samples and processing protocols has led yerba mate to be characterized as a biomass with lower levels of caffeine when compared to Camellia sinensis, even though it presents the highest transfer percentages during infusion (80.9 to 85.2%) [32]. Results of PCA from caffeine levels identified in this study confirm the broad potential for developing different products with low (or decaffeinated), medium and high caffeine concentrations from yerba mate biomass (Figure 1). The great dependence of genotype on caffeine concentrations verified in our study is a result of high genetic heritability (h2) for caffeine content, verified also on studies conducted on yerba mate, (h2 from 0.60 to 0.83) [29,33,34].
Lower theobromine concentrations in yerba mate plants have constantly been reported [2], ranging from 0.01 to 0.95 g 100 g-1 [18] and 0.002 and 0.503 g 100 g-1 [27]. In Camelia sinensis plants, inversely proportional relationships between caffeine and theobromine have frequently been identified [28,35]. According to results observed herein, there was a negative correlation between both compounds; however, it was too low to draw any conclusions. Such information is based on caffeine biosynthesis, which involves a series of reactions and can culminate in the conversion of theobromine into caffeine [8,36].
The presence of polyphenols in yerba mate is well known [2,13] and has aroused interest in its antioxidant concentrations, which help protect body tissues against oxidative stress events such as cellular aging and degenerative diseases (cancer, cardiovascular diseases, inflammation, etc.) [2]. Its concentration in plant tissues is determined by several factors, including genetic [29,31] and environmental [37] variability, processing forms [38], in addition to the time between harvesting and processing plant material [27].
Given the health benefits provided by yerba mate, especially its concentration of phenolic compounds, the importance of research that can provide these compounds for human consumption is evident [39]. In extracts and commercial products, concentration of phenolic compounds is high and highly dependent on factors related to cultivation and processing [14,15,16], and is sometimes higher in yerba mate than in products such as green tea and red wine [40]. The presence of these compounds could be preponderant for nutritional and sensory improvement, as well as significantly increase the shelf life of industrialized products [41]. However, this characteristic fails to represent the genetic potential of yerba mate in supplying antioxidants. In our study, the amplitude of phenolic compounds distribution in yerba mate was clarified, generating new perspectives for standardized leaf biomass production with wide industrial application.
Principal component analysis for total phenolic compounds concentration agrees with the conclusion of a study conducted by Sturion and collaborators [42], that shows that total polyphenol content has low genetic control. On the other hand, the stability found for total phenolic compounds concentration in 63.64% of the evaluated genotypes over four consecutive years represents significant evolution and technical and scientific foundation in the search for clonal materials. The availability of genetic materials with high concentrations of total phenolic compounds could favor the consumption and absorption of antioxidants, without increasing the consumption volume of yerba mate products by population [43]. The known variability between products made from commercial biomass (leaves and thin branches) of yerba mate is attributed to biomass characteristics and its processing, inversely proportional to increased proportion of branches/leaves, reduction of the surface area of leaf biomass and highly sensitive to variation in the raw material production and processing [16].
Our results for total protein concentration are higher than those found for industrially processed yerba mate leaves. For example, 7.97±0.17 g 100 g-1 from 15-year-old [44] and 10.06±0.12 g 100 g-1 for 80-year-old [45] plants, both native from shaded environment, and 9.52±0.42 g 100 g-1 from leaves of 12-year-old planted trees [45]. The wide genetic variability found in its concentration and its good stability over different years (around 75%) in out studied genotypes, also helps yerba mate producers do develop new cultivars with different protein concentrations, for different uses.
For the first time, this study addresses the composition of main bioactive compounds in selected Ilex paraguariensis genotypes and their stability over four consecutive years. The results suggest that variation in chemical composition is strongly influenced by genotype and has high stability through four successive harvests.

5. Conclusions

Our results indicate large variations between different selected Ilex paraguariensis genotypes regarding caffeine, theobromine, total phenolic compounds and proteins concentrations. The genetic materials are individually stable for concentration of those bioactive compounds, establishing a huge potential for innovation with the species.

Author Contributions

Study planning, selection and collection of genetic material for analysis and scientific writing, D.C.D.B, C.V.H., C.A.S. and I.W.; Methodology, C.V.H., A.C.M, R.I. and M.V.L.; Investigation, D.C.D.B, C.V.H., A.C.M, R.I. and M.V.L.; Writing – Original Draft, C.A.S.; Writing –Review & Editing, D.C.D.B, C.A.S., C.V.H., A.C.M, R.I. and M.V.L., I.W. and O.J.L.; Resources, D.C.D.B, C.V.H., C.A.S. and I.W.; Data analysis, O.J.L.; Supervision, C.V.H., I.W. and M.V.L.

Funding

The authors did not receive support from any organization for the submitted work.

Data Availability Statement

All data generated or analyzed during this study are included in this published article. The datasets generated during and/or analyzed during the current study are not publicly available due reason why data are not public, but are available from the corresponding author on reasonable request.

Acknowledgments

To LAMEAA-UTFPR for the chromatographic analysis and Bitumirim Ind. e Com. de Erva-Mate Ltda for the availability of plant material.

Conflicts of Interest

The authors declare that they have no known competing financial interests or personal relationships that could have appeared to influence the work reported in this paper.

Ethics approval

This study is exempt from ethical approval as it does not directly or indirectly investigate human beings.

Consent for publication

This study is exempt from consent for publication as it does not directly or indirectly investigate human beings.

References

  1. Heck CI, de Mejia EG (2007) Yerba mate tea (Ilex paraguariensis): A comprehensive review on chemistry, health implications, and technological considerations. J Food Sci 72(9):138-51. [CrossRef]
  2. Gan RY, Zhang D, Wang M, Corke H (2018) Health benefits of bioactive compounds from the genus ilex, a source of traditional caffeinated beverages. Nutrients 10(11):1682. [CrossRef]
  3. De Godoy RCB, Chambers E, Yang G (2020) Development of a preliminary sensory lexicon for mate tea. J Sens Stud 35(3). [CrossRef]
  4. Cardozo Junior EL, Morand C (2016a) Interest of mate (Ilex paraguariensis A. St.-Hil.) as a new natural functional food to preserve human cardiovascular health - A review. J Funct Foods 21:440–454. [CrossRef]
  5. Wendling I, Sturion JA, Stuepp CA, et al (2018) Early selection and classification of yerba mate progenies. Pesq agropec bras 53(03). [CrossRef]
  6. Sturion JA, De Resende MDV (2010) Melhoramento genético da erva-mate, 1a. Embrapa Florestas, Colombo.
  7. Anesini C, Turner S, Cogoi L, Filip R (2012) Study of the participation of caffeine and polyphenols on the overall antioxidant activity of mate (Ilex paraguariensis). LWT - Food Sci. Technol 45:299–304. [CrossRef]
  8. Debat HJ, Grabiele M, Aguilera PM et al (2014) Exploring the genes of yerba mate (Ilex paraguariensis A. St.-Hil.) by NGS and de novo transcriptome assembly. PLOS ONE 9(10): e109835. [CrossRef]
  9. González Arbeláez LF, Fantinelli JC, Ciocci Pardo A et al (2016) Effect of an Ilex paraguariensis (yerba mate) extract on infarct size in isolated rat hearts: the mechanisms involved. Food & Function 7:816–824. [CrossRef]
  10. De Lima GG, Ruiz HZ, Matos M et al (2019) Prediction of yerba mate caffeine content using near infrared spectroscopy. Spectrosc Lett 52:282–287. [CrossRef]
  11. Poswal FS, Russell G, Mackonochie M et al (2019) Herbal Teas and their Health Benefits: A Scoping Review. Plant Foods Hum Nutr 74(3):266-276. [CrossRef]
  12. Oellig C, Schunck J, Schwack W (2018) Determination of caffeine, theobromine and theophylline in Mate beer and Mate soft drinks by high-performance thin-layer chromatography. J Chromatogr A 1533:208–212. [CrossRef]
  13. Gullón B, Eibes G, Moreira MT et al (2018) Yerba mate waste: A sustainable resource of antioxidant compounds. Ind Crop Prod 113:398–405. [CrossRef]
  14. Butiuk AP, Martos MA, Adachi O, Hours RA (2016) Study of the chlorogenic acid content in yerba mate (Ilex paraguariensis St. Hil.): Effect of plant fraction, processing step and harvesting season. J Appl Res Med Aromat Plants 3:27–33. [CrossRef]
  15. Gil M, Wianowska D (2017) Chlorogenic acids – their properties, occurrence and analysis. Annales Universitatis Mariae Curie-Sklodowska, sectio AA – Chemia 72:61. [CrossRef]
  16. Kaltbach P, Ballert S, Kabrodt K, Schellenberg I (2020) New HPTLC methods for analysis of major bioactive compounds in mate (Ilex paraguariensis) tea. J Food Compos Anal 92:103568. [CrossRef]
  17. Duarte MM, Gabira MM. Tomasi JC, Amano E, Nogueira AC, Wendling I. Bioactive compounds and leaf anatomy of yerba mate morphotypes. Pesquisa Agropecuária Brasileira, v.57, e02441, 2022.
  18. Helm CV, Ruiz HZ, Hansel FA et al (2015) Efeito do solvente na extração de teobromina e cafeína em progênies de erva-mate. Embrapa Florestas. https://www.embrapa.br/busca-de-publicacoes/-/publicacao/1038782/efeito-do-solvente-na-extracao-de-teobromina-e-cafeina-em-progenies-de-erva-mate. Accessed. 26 May.
  19. Mandel J (1971) American Society for Quality A New Analysis of Variance Model for Non-Additive Data A New Analysis of Variance Model for Non-additive Data. Technometrics 13(1):1-18.
  20. Gabriel KR (1971) Biometrika Trust The Biplot Graphic Display of Matrices with Application to Principal Component Analysis. Biometrika 58(3):453–467.
  21. Durte, J.B.; Vencovsky, R. Interação genótipo x ambiente: uma introdução a análise “AMMI”. Ribeirão Preto: Sociedade Brasileira de Genética, 199. 60p. (Série Monograficas, 9).
  22. Kassambara, A. Practical Guide to Cluster Analysis in R. 1 ed. USA: STHDA. 2017.
  23. Cornrlius, P.L.; Seyedsadr, M.; Crossa, J. Using the shifted multiplicative model to search for “separability” in crop cultivar trials. Theoretical and Applied Genetics, v.84, n.1-2, p.161-172, 1992.
  24. Brasil (2005) Resolução de Diretoria Colegiada-RDC No. 277, de 22 de Setembro de 2005.
  25. Schuhli GS, Penteado Junior JF, Wendling I (2019) Descritores mínimos em cultivares de espécies florestais: uma contribuição para erva-mate. Embrapa Florestas. http://www.infoteca.cnptia.embrapa.br/infoteca/handle/doc/1117327. Accessed 26 2. 20 May.
  26. Heckman MA, Weil J, de Mejia EG (2010) Caffeine (1, 3, 7-trimethylxanthine) in foods: A comprehensive review on consumption, functionality, safety, and regulatory matters. J Food Sci 75(3):77-87. [CrossRef]
  27. Athayde ML, Coelho GC, Schenkel P (2000) Caffeine and theobromine in epicuticular wax of Ilex paraguariensis A. St.-Hil. Phytochemistry 55(7):853-7. [CrossRef]
  28. Mohanpuria P, Kumar V, Yadav SK (2010) Tea Caffeine Metabolism, Functions, and Reduction Strategies. Food Sci Biotechnol 19:275–287. [CrossRef]
  29. Scherer R, Urfer P, Mayol MR et al (2002) Inheritance studies of caffeine and theobromine content of Mate (Ilex paraguariensis) in Misiones, Argentina. Euphytica 126, 203–210. [CrossRef]
  30. Cardozo Junior EL, Morand C (2016b) Interest of mate (Ilex paraguariensis A. St.-Hil.) as a new natural functional food to preserve human cardiovascular health - A review. J Funct Foods 21:440–454. [CrossRef]
  31. Cardozo EL, Ferrarese-Filho O, Filho LC et al (2007) Methylxanthines and phenolic compounds in mate (Ilex paraguariensis St. Hil.) progenies grown in Brazil. J Food Compos Anal 20:553–558. [CrossRef]
  32. Tfouni SAV, Camara MM, Kamikata K et al (2018) Caffeine in teas: Levels, transference to infusion and estimated intake. Food Sci. Technol 38:661–666. [CrossRef]
  33. Nakamura KL, Cardozo Junior L, Donaduzzi CM, Schuster I (2009) Brazilian Society of Plant Breeding. Printed in Brazil Genetic variation of phytochemical compounds in progenies of Ilex paraguariensis St. Hil. CBAB 9(2). [CrossRef]
  34. Cardozo Junior EL, Maria Donaduzzi C, Ferrarese-Filho O et al (2010) Quantitative genetic analysis of methylxanthines and phenolic compounds in mate progenies. Pesq agropec bras 45 (2). [CrossRef]
  35. Zhu B, Chen LB, Lu M, et al (2019) Caffeine Content and Related Gene Expression: Novel Insight into Caffeine Metabolism in Camellia Plants Containing Low, Normal, and High Caffeine Concentrations. J Agric Food Chem 67:3400–3411. [CrossRef]
  36. Ashihara H, Monteiro AM, Gillies FM et al (1996) Biosynthesis of Caffeine in Leaves of Coffee. Plant Physiol 111(3): 747–753. [CrossRef]
  37. Da Croce DM (2002) Características físico-químicas de extratos de erva-mate (Ilex paraguariensis St. Hil) no estado de Santa Catarina. Ciênc Florest 12 (2). [CrossRef]
  38. Duarte MM, de Cássia Tomasi J, Helm CV et al (2020) Caffeinated and decaffeinated mate tea: Effect of toasting on bioactive compounds and consumer acceptance. Rev Bras Ciênc Agrár 15(3):e8513. [CrossRef]
  39. Gómez-Juaristi M, Martínez-López S, Sarria B et al (2018) Absorption and metabolism of yerba mate phenolic compounds in humans. Food Chemistry 240:1028–1038. [CrossRef]
  40. Gugliucci A, Bastos DHM (2009) Chlorogenic acid protects paraoxonase 1 activity in high density lipoprotein from inactivation caused by physiological concentrations of hypochlorite. Fitoterapia 80:138–142. [CrossRef]
  41. Valerga J, Reta M, Lanari MC (2012) Polyphenol input to the antioxidant activity of yerba mate (Ilex paraguariensis) extracts. Food Sci Technol 45:28–35. [CrossRef]
  42. Sturion JA, Correa G, Resende MDV et al (2004) Controle genético dos teores de polifenóis totais, taninos e cafeína em progênies de erva-mate (Ilex paraguariensis St. Hil.) cultivadas em três classes de solos. Boletim de Pesquisa e Desenvolvimento (Embrapa Florestas). https://www.embrapa.br/busca-de-publicacoes/-/publicacao/287300/controle-genetico-dos-teores-de-polifenois-totais-taninos-e-cafeina-em-progenies-de-erva-mate-ilex-paraguariensis-st-hil-cultivadas-em-tres-classes-de-solos. 26 May.
  43. Da Silveira TFF, Meinhart AD, de Souza TCL et al (2016) Phenolic compounds from yerba mate based beverages - A multivariate optimization. Food Chemistry 190:1159–1167. [CrossRef]
  44. Berté KAS, Beux MR, Spada PKWDS et al (2011) Chemical composition and antioxidant activity of yerba-mate (Ilex paraguariensis A.St.-Hil., Aquifoliaceae) extract as obtained by spray drying. J Agric Food Chem 59:5523–5527. [CrossRef]
  45. Frizon C, Perussello C, Sturion J, Hoffmann-Ribani R (2018) Novel Beverages of Yerba-Mate and Soy: Bioactive Compounds and Functional Properties. Beverages 4:21. [CrossRef]
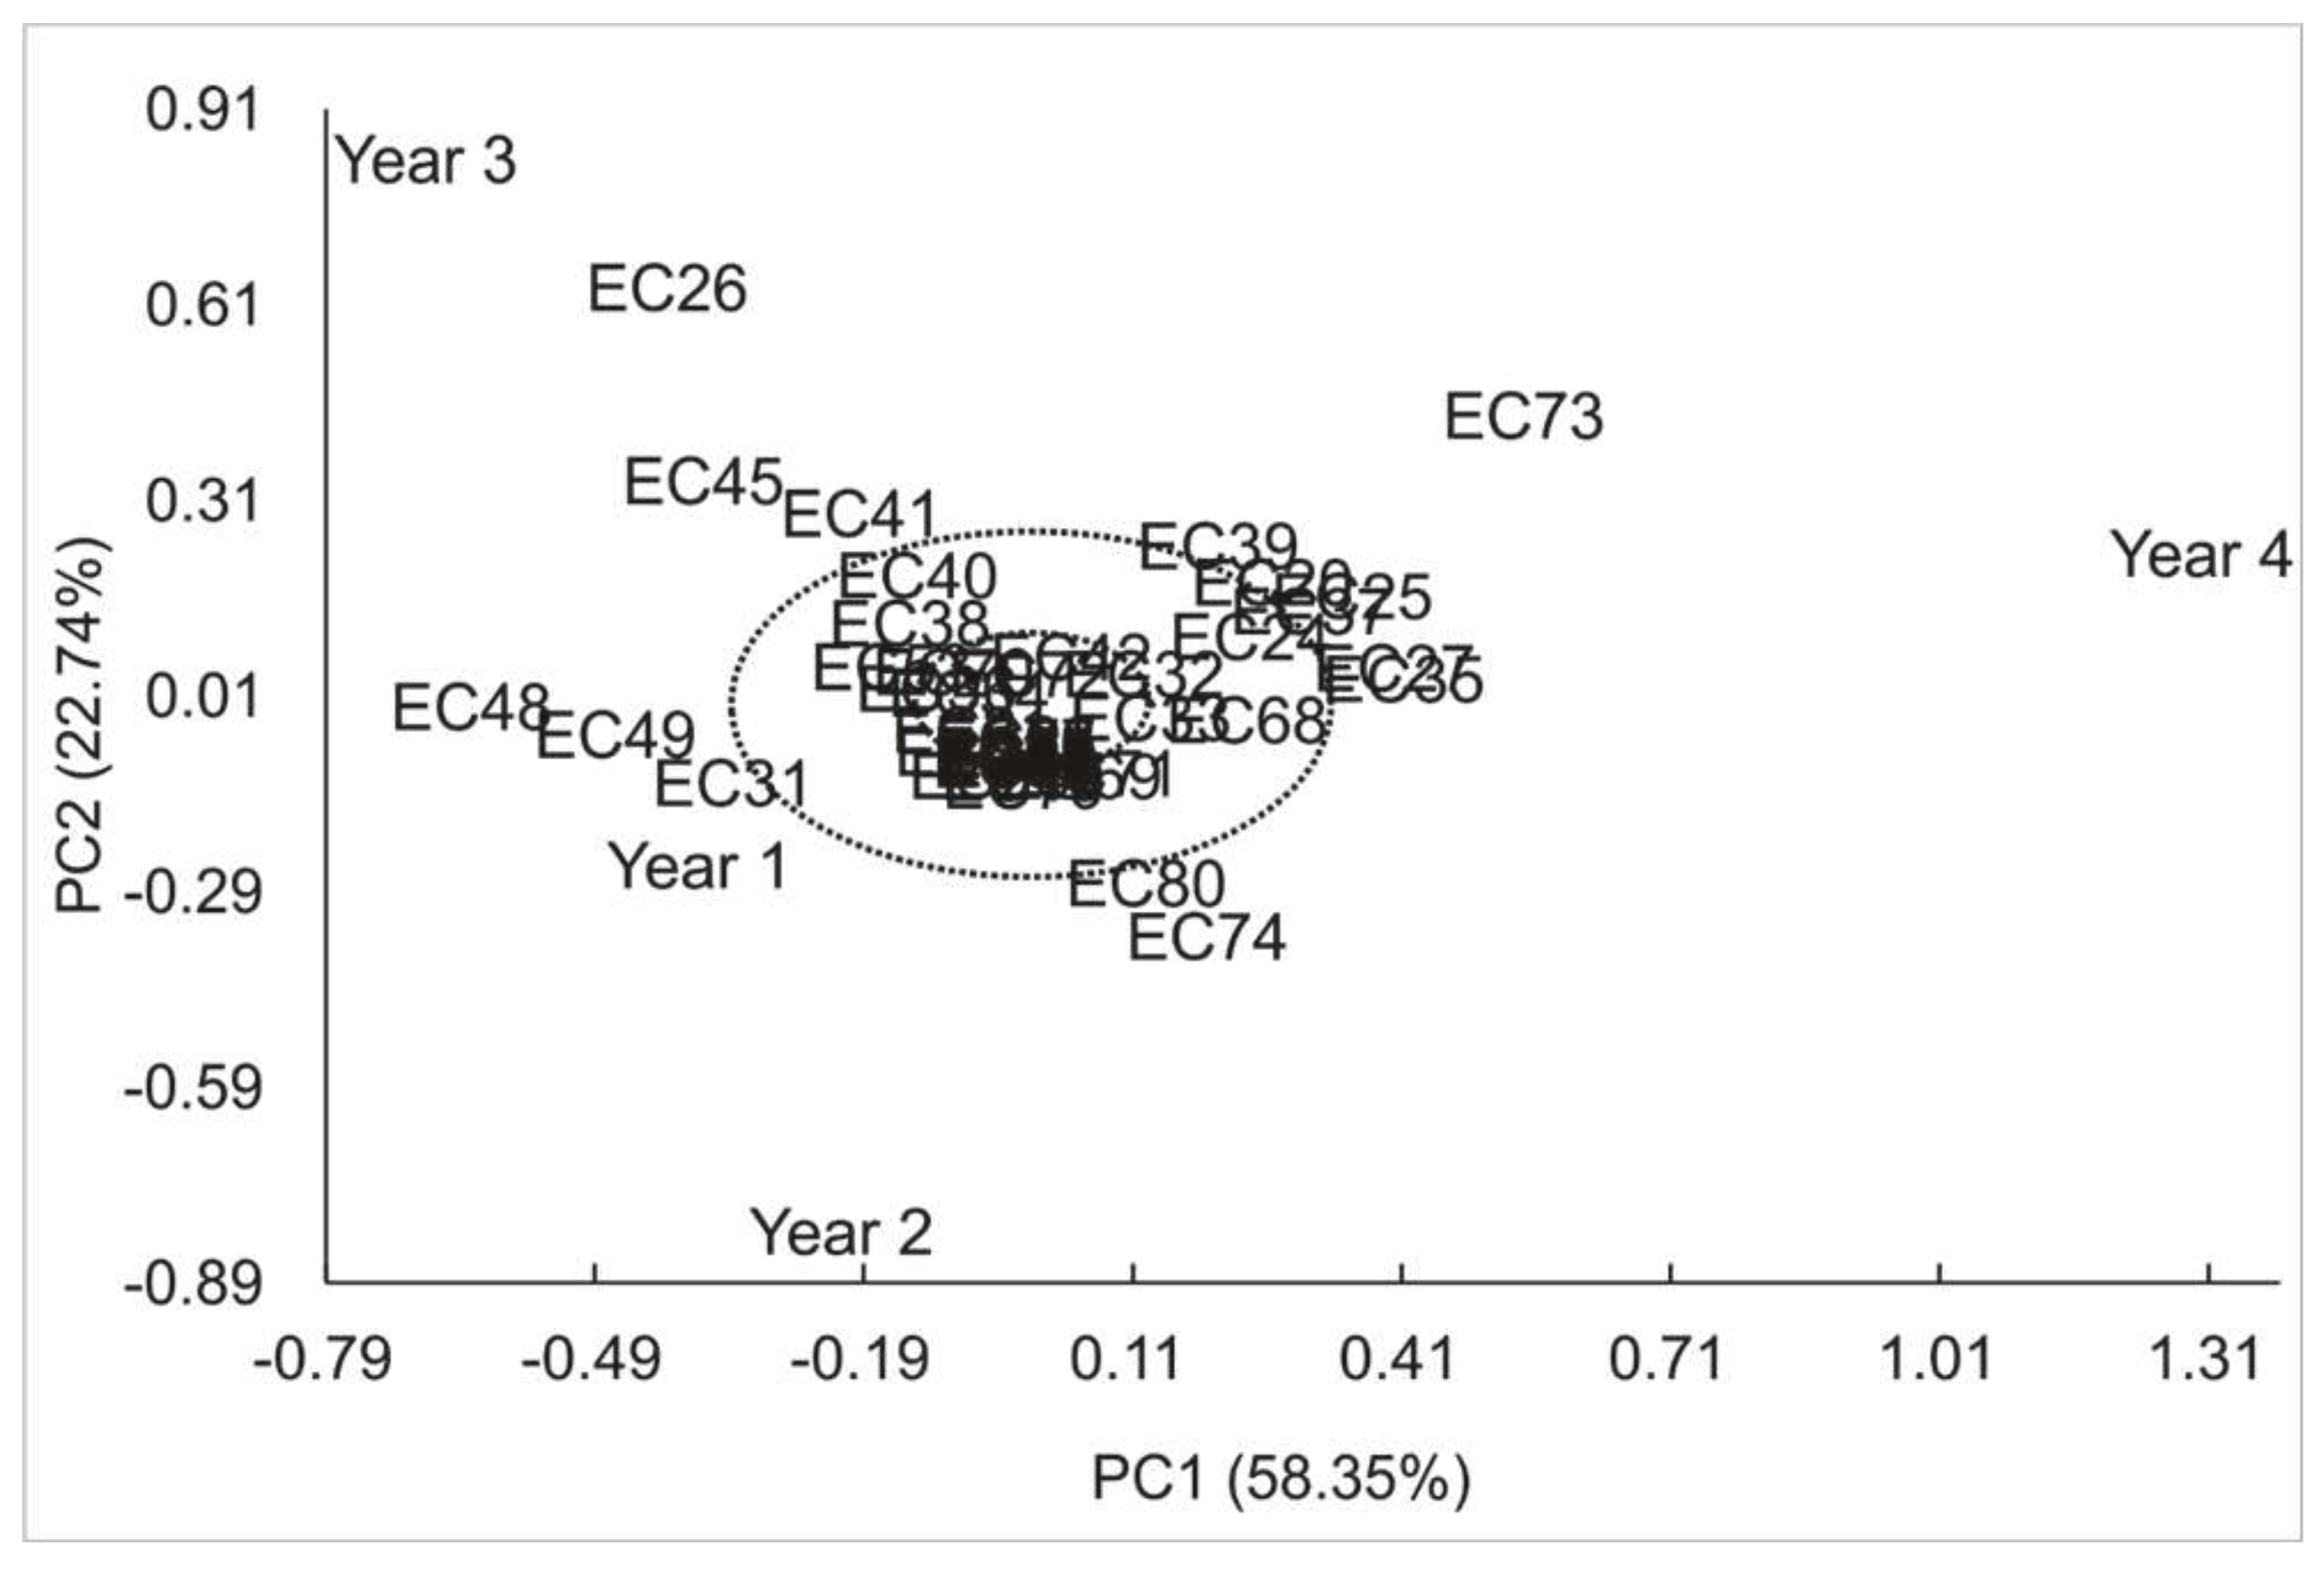
Figure 1. PCA of genotype-environment ratio of the yerba mate genotypes (EC) for caffeine concentration according to PC1 and PC2.
Preprints 88127 g001
Figure 2. Genotypic stability clustering using Ward's Minimum Variance Method of genotype-environment ratio of yerba mate genotypes (EC) for caffeine concentration according to PC1 and PC2.
Preprints 88127 g002
Figure 3. PCA of the first component for theobromine concentration in yerba mate genotypes (EC) in 2015, 2016, 2017 and 2018.
Preprints 88127 g003
Figure 4. PCA of genotype-environment relationships of the yerba mate genotypes (EC) for theobromine concentration according to PC1 and PC2.
Preprints 88127 g004
Figure 5. PCA of the first component for total phenolic compounds concentration in yerba mate genotypes (EC) in 2015, 2016, 2017 and 2018.
Preprints 88127 g005
Figure 6. PCA of genotype-environment relationship of the yerba mate genotypes (EC) for total phenolic compounds concentration according to PC1 and PC2.
Preprints 88127 g006
Figure 7. PCA of the first component for total protein concentration in yerba mate genotypes (EC) in 2015, 2016, 2017 and 2018.
Preprints 88127 g007
Figure 8. PCA of the genotype-environment ratio of the yerba mate genotypes (EC) for total protein concentration according to PC1 and PC2.
Preprints 88127 g008
Table 2. Mean genotypic values and analysis of parameter estimates (μ + g) the mean interaction GxE (μ + g + ge) for caffeine concentration of yerba mate genotypes (EC) tested across four consecutive years.
Genotypes Means Chi- Pr > ChiSq Genotypes Means Chi- Pr > ChiSq
Square Square
EC16 0.0396 0.17 0.6780 EC44 0.0413 0.05 0.8203
EC17 0.0542 0.79 0.3752 EC16 0.0396 0.17 0.6780
EC18 0.0674 2.71 0.0996 EC44 0.0413 0.79 0.3752
EC19 0.0348 1.32 0.2501 EC45 2.3290 30.50 <.0001
EC20 0.5961 27.19 <.0001 EC47 0.1208 11.35 0.0008
EC21 0.4373 25.61 <.0001 EC48 1.7543 30.13 <.0001
EC22 0.0374 0.43 0.5128 EC49 2.2004 30.44 <.0001
EC23 0.3752 24.52 <.0001 EC50 0.0605 1.70 0.1925
EC24 1.0741 29.17 <.0001 EC51 0.0839 5.47 0.0193
EC25 1.5091 29.88 <.0001 EC52 0.0889 6.80 0.0091
EC26 1.5221 29.90 <.0001 EC53 2.3579 30.52 <.0001
EC27 1.5769 29.96 <.0001 EC65 0.3324 23.33 <.0001
EC28 1.0096 27.96 <.0001 EC66 0.4116 25.15 <.0001
EC29 0.0850 5.89 0.0152 EC67 0.0479 0.15 0.7018
EC30 0.0374 0.38 0.5362 EC68 0.7601 28.15 <.0001
EC31 1.1940 29.42 <.0001 EC69 0.8194 28.29 <.0001
EC32 0.8286 28.44 <.0001 EC70 1.5931 29.98 <.0001
EC33 1.0823 29.19 <.0001 EC71 2.1910 30.45 <.0001
EC34 1.1340 29.30 <.0001 EC72 1.2243 29.47 <.0001
EC35 0.2751 22.21 <.0001 EC73 1.6523 30.04 <.0001
EC36 1.1766 29.38 <.0001 EC74 1.1718 29.01 <.0001
EC37 1.9442 30.28 <.0001 EC76 0.0906 7.09 0.0078
EC38 1.6107 29.99 <.0001 EC77 0.6200 27.19 <.0001
EC39 0.7686 28.19 <.0001 EC78 0.0799 5.00 0.0253
EC40 1.7908 30.16 <.0001 EC79 2.3846 30.51 <.0001
EC41 1.4447 29.80 <.0001 EC80 0.7048 27.29 <.0001
EC42 1.1004 29.23 <.0001 EC81 0.0576 1.18 0.2770
EC43 1.3957 29.74 <.0001 EC82 0.0438 2.80 0.0946
Table 4. Mean genotypic values and analysis of parameter estimates (μ + g) the mean interaction GxE (μ + g + ge) for theobromine concentration in yerba mate genotypes (EC) tested across four consecutive years.
Genotypes Means Chi- Pr > ChiSq Genotypes Means Chi- Pr > ChiSq
Square Square
EC16 0.3026 3.01 0.0829 EC44 0.4760 5.52 0.0188
EC17 0.2586 2.41 0.1204 EC45 0.0161 0.26 0.6073
EC18 0.4678 5.00 0.0253 EC47 0.0627 0.48 0.4885
EC19 0.3431 3.62 0.0570 EC48 0.0076 2.37 0.1240
EC20 0.0447 5.73 0.0167 EC49 0.0898 1.44 0.2300
EC21 0.0862 0.13 0.7216 EC50 0.0543 0.35 0.5519
EC22 0.0294 0.66 0.4177 EC51 0.1211 4.58 0.0323
EC23 0.0688 5.76 0.0164 EC52 0.6187 6.47 0.0110
EC24 0.1058 6.02 0.0141 EC53 0.0173 0.00 0.9627
EC25 0.3101 0.02 0.8859 EC65 0.0237 1.81 0.1786
EC26 0.0200 1.61 0.2045 EC66 0.5809 3.59 0.0582
EC27 0.0303 0.09 0.7673 EC67 0.0045 4.99 0.0255
EC28 0.0112 3.38 0.0661 EC68 0.1182 8.03 0.0046
EC29 0.0373 2.14 0.1431 EC69 0.2487 1.92 0.1657
EC30 0.0004 7.20 0.0073 EC70 0.0162 6.18 0.0129
EC31 1.7719 5.65 0.0174 EC71 0.1529 5.22 0.0224
EC32 0.0493 6.62 0.0101 EC72 0.0796 2.19 0.1390
EC33 0.0081 4.61 0.0317 EC73 0.0581 0.47 0.4911
EC34 0.0739 0.00 1.0000 EC74 0.1612 1.15 0.2838
EC35 0.0199 7.56 0.0060 EC75 0.4280 0.01 0.9351
EC36 0.0230 3.14 0.0766 EC76 0.3440 5.87 0.0154
EC37 0.5567 6.63 0.0101 EC77 0.0090 3.85 0.0499
EC38 0.0997 0.81 0.3695 EC78 0.5312 5.58 0.0181
EC39 0.1649 1.28 0.2572 EC79 0.5640 0.29 0.5904
EC40 0.0709 0.24 0.6236 EC80 0.1005 3.04 0.0814
EC41 0.9768 5.01 0.0251 EC81 0.2100 1.31 0.2528
EC42 0.1173 6.80 0.0091 EC82 0.1230 4.58 0.0323
EC43 0.0602 0.88 0.3491
Table 6. Mean genotypic values and analysis of parameter estimates (μ + g) the mean interaction GxE (μ + g + ge) for total phenolic compounds in yerba mate genotypes (EC) tested across four consecutive years.
Genotypes Means Chi- Pr > ChiSq Genotypes Means Chi- Pr > ChiSq
Square Square
EC16 9.0128 0.00 0.9479 EC44 8.1318 0.46 0.4999
EC17 8.1033 1.05 0.3049 EC45 8.6207 0.04 0.8496
EC18 7.5834 2.91 0.0882 EC47 8.1529 0.41 0.5245
EC19 9.2024 1.33 0.2481 EC48 8.2046 0.29 0.5871
EC20 8.6407 0.28 0.5950 EC49 8.5733 0.01 0.9140
EC21 7.5239 3.31 0.0687 EC50 8.6158 0.03 0.8563
EC22 8.7405 0.16 0.6936 EC51 8.3449 0.09 0.7704
EC23 8.7693 0.20 0.6580 EC52 8.8932 0.08 0.7752
EC24 9.1320 0.41 0.5245 EC53 8.5883 0.02 0.8935
EC25 8.4304 0.26 0.6081 EC65 8.2999 0.00 0.9828
EC26 8.0816 0.59 0.4435 EC66 8.2536 0.16 0.6896
EC27 8.2580 0.55 0.4582 EC67 8.7437 0.22 0.6425
EC28 8.1072 1.07 0.3010 EC68 8.7821 1.85 0.1739
EC29 7.8740 1.32 0.2498 EC69 7.7633 2.43 0.1194
EC30 8.0060 0.82 0.3653 EC70 7.4366 0.68 0.4084
EC31 8.0287 0.75 0.3879 EC71 9.0001 0.00 0.9637
EC32 8.2664 0.19 0.6659 EC72 8.7127 0.01 0.9114
EC33 8.7675 0.19 0.6603 EC73 8.6298 3.58 0.0586
EC34 9.4237 2.27 0.1323 EC74 7.4875 0.00 0.9658
EC35 8.6304 0.04 0.8365 EC75 8.2633 0.02 0.8873
EC36 8.4143 0.03 0.8656 EC76 8.3533 2.67 0.1023
EC37 8.5419 0.00 0.9572 EC77 7.6202 0.25 0.6157
EC38 8.3793 0.05 0.8172 EC78 8.1388 1.79 0.1806
EC39 8.4205 0.03 0.8742 EC79 7.7742 0.87 0.3509
EC40 8.3520 0.08 0.7800 EC80 7.8665 2.45 0.1177
EC41 7.9771 0.92 0.3377 EC81 7.0278 0.66 0.4170
EC42 7.4232 4.07 0.0436 EC82 8.9908 0.00 0.9828
EC43 7.5776 2.50 0.1138
Table 8. Mean genotypic values and analysis of parameter estimates (μ + g) the mean interaction GxE (μ + g + ge) for total protein concentration in yerba mate genotypes (EC) tested across four consecutive years.
Genotypes Means Chi- Pr > ChiSq Genotypes Means Chi- Pr > ChiSq
Square Square
EC16 13.3475 0.03 0.8544 EC43 14.7075 2.78 0.0952
EC17 10.3950 8.91 0.0028 EC44 12.1425 1.05 0.3046
EC18 14.0125 0.65 0.4209 EC45 16.2075 6.97 0.0083
EC19 11.6125 2.54 0.1108 EC47 11.3775 3.44 0.0638
EC20 12.9750 0.24 0.6277 EC48 13.8200 0.39 0.5298
EC21 12.8350 0.10 0.7508 EC49 15.2000 3.38 0.0662
EC22 11.7525 2.08 0.1492 EC50 11.1350 4.52 0.0335
EC23 11.3125 3.71 0.0541 EC51 14.4250 1.38 0.2402
EC24 13.0875 0.55 0.4578 EC52 13.5150 0.41 0.5238
EC25 12.8925 0.01 0.9131 EC53 16.5800 8.54 0.0035
EC26 14.0875 0.76 0.3827 EC65 12.7725 0.34 0.5608
EC27 14.6025 1.77 0.1836 EC66 12.6300 0.27 0.6005
EC28 12.5550 0.34 0.5599 EC67 11.6725 1.24 0.2663
EC29 13.7550 0.74 0.3882 EC68 14.1300 0.83 0.3621
EC30 12.6575 0.47 0.4944 EC69 14.1000 0.78 0.3766
EC31 14.5175 1.58 0.2092 EC70 12.9625 0.02 0.8908
EC32 13.8325 0.41 0.5223 EC71 13.9100 0.51 0.4770
EC33 13.3525 0.04 0.8507 EC72 13.7300 0.30 0.5859
EC34 12.7325 0.05 0.8258 EC73 16.0675 4.76 0.0290
EC35 14.3075 1.15 0.2844 EC74 14.0200 0.27 0.6009
EC36 14.2100 0.97 0.3255 EC76 13.0775 0.01 0.9378
EC37 14.2125 0.97 0.3244 EC77 12.7725 0.09 0.7675
EC38 14.7925 2.23 0.1352 EC78 13.3575 0.04 0.8469
EC39 13.5625 0.15 0.6981 EC79 12.6975 0.01 0.9114
EC40 15.4900 4.31 0.0380 EC80 12.5275 0.67 0.4140
EC41 13.0575 0.01 0.9222 EC81 11.5050 2.93 0.0868
EC42 14.3575 1.24 0.2649 EC82 13.1575 0.24 0.6277
Disclaimer/Publisher’s Note: The statements, opinions and data contained in all publications are solely those of the individual author(s) and contributor(s) and not of MDPI and/or the editor(s). MDPI and/or the editor(s) disclaim responsibility for any injury to people or property resulting from any ideas, methods, instructions or products referred to in the content.
Copyright: This open access article is published under a Creative Commons CC BY 4.0 license, which permit the free download, distribution, and reuse, provided that the author and preprint are cited in any reuse.
Prerpints.org logo

Preprints.org is a free preprint server supported by MDPI in Basel, Switzerland.

Subscribe

© 2024 MDPI (Basel, Switzerland) unless otherwise stated