Preprint
Article

Experimental and Statistical Analysis of the Effect of Heat Treatment on Surface Roughness and Mechanical Properties of Thin-Walled Samples Obtained by Selective Laser Melting from the Material AlSi10Mg

Altmetrics

Downloads

81

Views

78

Comments

0

A peer-reviewed article of this preprint also exists.

Submitted:

18 October 2023

Posted:

19 October 2023

You are already at the latest version

Alerts
Abstract
Statistical analysis of mechanical properties of thin-walled samples (~500 microns) obtained by selective laser melting from AlSi10Mg material and subjected to heat treatment for 1 hour at temperatures from 260 °C to 440 °C (step of aging temperature change 30 °C) has shown that the maximum strain hardening in the stretching diagram section from yield strength to tensile strength is achieved at the heat treatment temperature equal to 290 °C. At carrying out of correlation analysis statistically significant positive correlation between deformation corresponding to yield strength and the sum of heights of the largest protrusions and depths of the largest depressions of the surface roughness profile within the basic length of the sample (Rz) and the full height of the surface roughness profile (Rmax) was established. It was found that the reason for the correlation is the presence of cohesive states between the extreme values of the surface roughness profile that persist along the entire length of the specimen.
Keywords: 
Subject: Chemistry and Materials Science  -   Materials Science and Technology

1. Introduction

One of the main directions of development of modern industrial technologies is the creation of high-quality products with low production costs. Reduction of production costs can be achieved by reducing to the minimum possible time of creation of the final product - "from idea to finished product" with simultaneous preservation of high quality of manufacturing. Among the technologies actively introduced in the production process, additive manufacturing technologies fall under these requirements.
ISO/ASTM 52900:2015 classifies the technologies used in additive manufacturing and considers the type of raw materials, deposition techniques and methods of melting or curing the material [1]. The most common technologies of additive manufacturing are SLA and FDM printing [2,3,4,5,6], these technologies use thermoplastics and polymer resins as the main materials, which limits the scope of application of products made by these technologies. Technologies that allow manufacturing products from metal, such as selective laser melting (SLM) technology [7,8,9,10,11,12,13,14,15], have a wider industrial potential. Powders of metals and alloys of various compositions are used as a starting material to produce final products using selective laser melting technology. In the presented work, samples made by SLM technology from light alloy AlSi10Mg were studied.
AlSi10Mg has good mechanical strength, corrosion resistance [16,17,18,19] and allows to manufacture products using SLM technology of complex geometric shape [20]. Kamarudin, K., et al [20] note that during the manufacture of complex-shaped products (molds), inhomogeneity of surface roughness and deviation of actual dimensions from the design dimensions are observed, which is attributed to the influence of local heat transfer. Studies [21,22] show that the effect of local heat transfer affects the microstructure of the bulk product and, consequently, the mechanical properties. In addition, the change in mechanical properties of the final product depends on the tilt angle of the product during printing. Changing the tilt angle from 35.5° to 90° leads to an increase in mechanical properties by 12% (as the angle increases), while the surface roughness decreases [21].
Increase of mechanical properties at manufacturing of specimens by SLM technology from AlSi10Mg material is achieved due to hardening. The main mechanism of hardening is precipitate hardening, which contributes more than hardening of Si solid solution in α-Al matrix [22]. Clarification of the mechanisms of mechanical property enhancement of AlSi10Mg samples obtained by selective laser melting shows that precipitate strengthening is achieved due to a very thin Al-Si eutectic structure between α-Al dendrites and the formation of a microstructure oriented transversely to the direction of load application, and the anisotropy of properties becomes minimal when the scanning speed is optimized [23,24,25]. Additional sources of improvement of mechanical properties of the samples are changes in the gas atmosphere in which selective laser melting is performed, changes in surface roughness and porosity, as well as thermal post-treatment of parts manufactured by SLM printing technology from AlSi10Mg. When argon was replaced by nitrogen in the working chamber of the SLM 3D printer, the achievement of the strength limit of ~350 MPa was recorded [25].
The influence of porosity and surface roughness of the samples obtained by SLM printing technology from AlSi10Mg has received a great deal of attention [26,27,28,29,30,31,32,33,34,35,36,37,38,39,40,41,42,43,44]. The focus of the works is related to the optimization of technological parameters to reduce surface roughness and porosity and, consequently, to increase hardness, impact toughness and fatigue strength by reducing the surface roughness of samples obtained by SLM printing technology from AlSi10Mg. In particular, the critical point of energy density, which gives the minimum pore fraction for AlSi10Mg and is about 60 J/m3 [37] and exposure time of 140-160 μs [38], was shown to exist. In addition to the optimization of technological parameters, the influence of different surface post-treatment methods on the mechanical properties of samples has been investigated [42,43]. It is noted in [42] that strong vibration hardening had the greatest effect on the improvement of fatigue life, followed by laser hardening and shot peening.
However, the works do not analyze the changes in tensile mechanical properties as a function of surface roughness on thin-walled samples, where the contribution of the surface to the tensile strength may be significant.
The influence of thermal post-treatment on the mechanical properties of samples produced by SLM technology is under active study [45] and requires detailed elaboration. In the works [30,46] the application of standard heat treatment T6 is considered, and it is shown that the average surface roughness of samples obtained by SLM technology from AlSi10Mg material decreased after heat treatment at 540 °C for 2 h. However, after artificial aging at 155 °C for 12 h and initially at 530 °C for 2 h, the surface roughness increased [30]. The lack of significant hardening of the material under the standard T6 heat treatment regime is also confirmed [46]. In [47], the occurrence of anisotropy of mechanical properties arising in horizontally annealed samples during heat treatment carried out at 270 °C for 1.5 h was demonstrated, and a decrease in properties compared to non-annealed samples was observed, indicating the need for further search for an optimal heat treatment regime.
Thus, the purpose of the presented work is to determine the effect of heat treatment at temperatures from 260 °C to 440 °C for 1 hour on the tensile mechanical properties and surface roughness of thin-walled samples (~500 μm) manufactured by SLM technology from AlSi10Mg.

2. Materials and Methods

2.1. Physical and mechanical properties

The microstructure and chemical composition of the studied materials were analyzed using a Phenom ProX scanning electron microscope (Holland) equipped with an adapter for elemental analysis by energy dispersive spectroscopy. X-ray diffraction (XRD) analysis was used to determine the phase composition of the samples. X-ray diffractograms were obtained on a PANalytical Empyrean X-ray diffractometer with CuKa radiation. The phase composition was analyzed using PANalytical High Score Plus software, software [48] and ICCD PDF-2 and COD databases [49]. The surface roughness of the samples was measured using a HOMMEL-ETAMIC T8000 profilograph (JENOPTIK (Hommel-Etamic), Jena, Germany). Mechanical tensile tests were performed on an INSTRON 5989 electromechanical testing machine (Instron, Norwood, MA, USA) at a speed of 2mm/min. Statistical analysis of the experimental results was performed using software (Rstudio 2023.06.1 Posit Software, PBC, GNU license) written in R language.

2.2. Production of samples

AlSi10Mg powder served as a starting material for the fabrication of samples by selective laser melting. The size of the powders ranged from 30 µm to 75 µm. Figure 1 shows a micrograph of the starting material and the size distribution of the powder particles.
The average chemical composition of the initial AlSi10Mg powder is presented in Table 1.
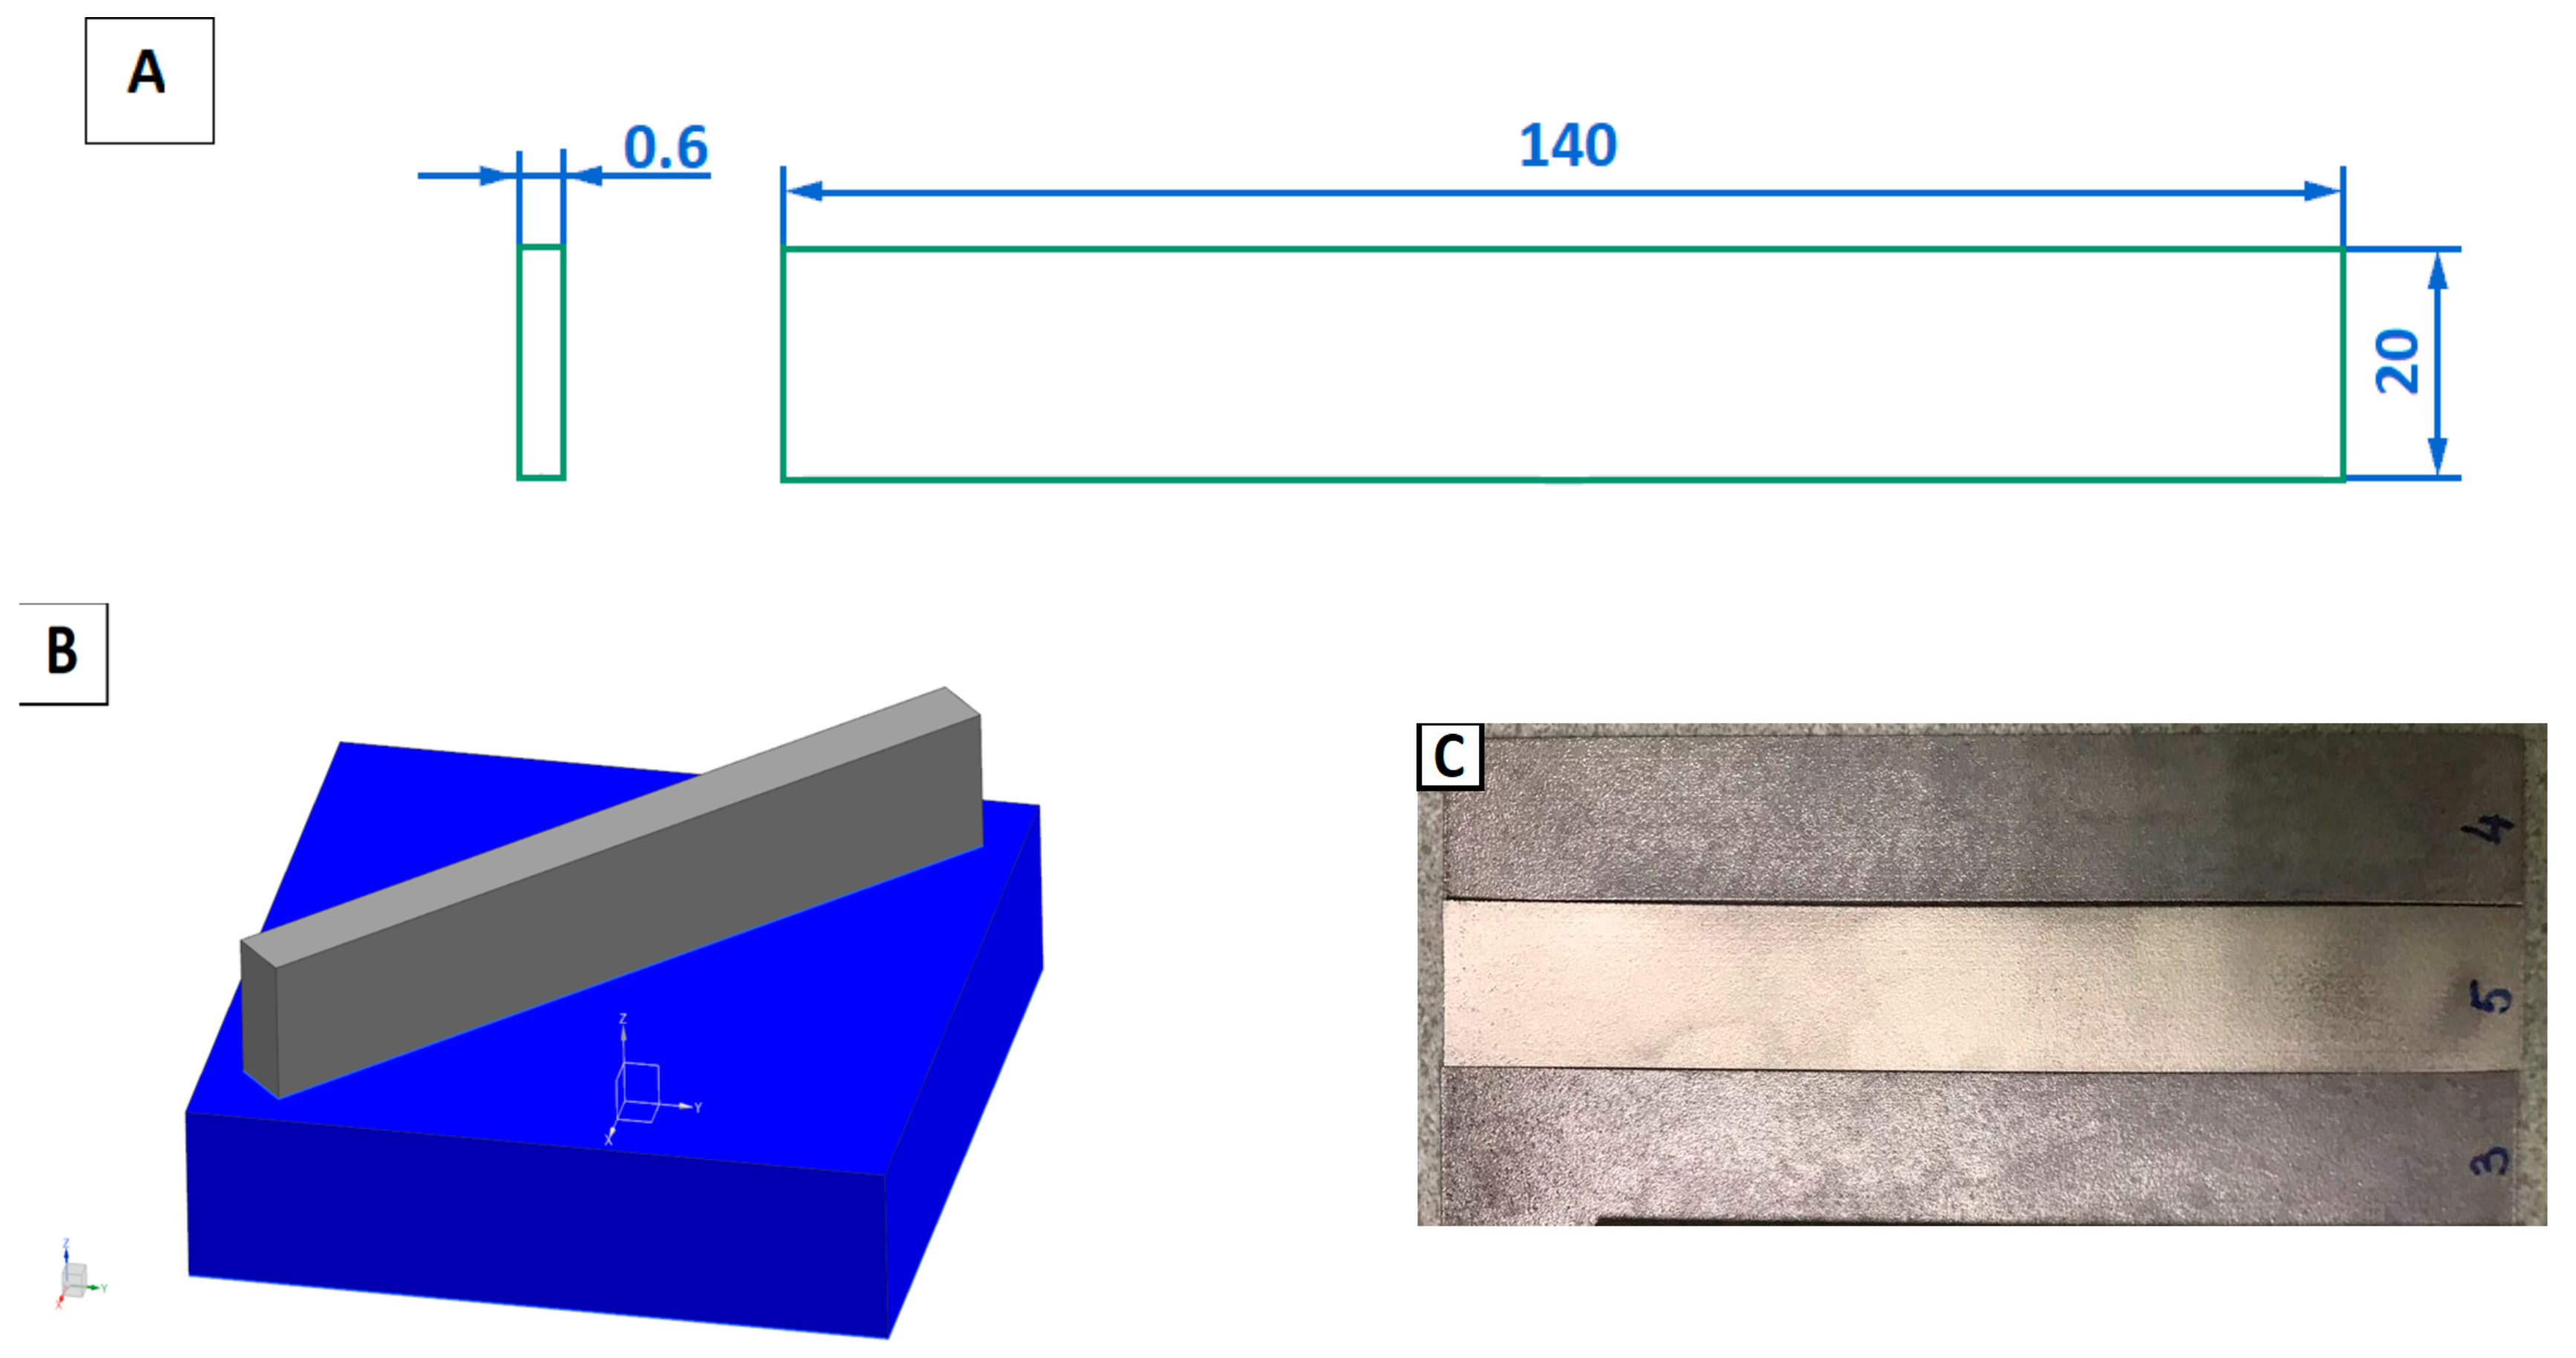
Printing was carried out on a Farsoon FS121M SLM selective laser melting machine (Farsoon Technologies, Hunan, China) with a pre-installed laser with a maximum power of 500W. The main printing modes were layer thickness 30 µm, laser power P = 340 W, hatching distance - 0.15 mm, laser travel speed - 1500 mm/sec. Figure 2 shows a schematic drawing of the sample and its location on the table during fabrication by selective laser melting.

3. Results and discussions

3.1. Surface roughness of samples manufactured by selective laser melting technology from AlSi10Mg material.

48 samples made by selective laser melting technology from AlSi10Mg material were subjected to surface roughness study.
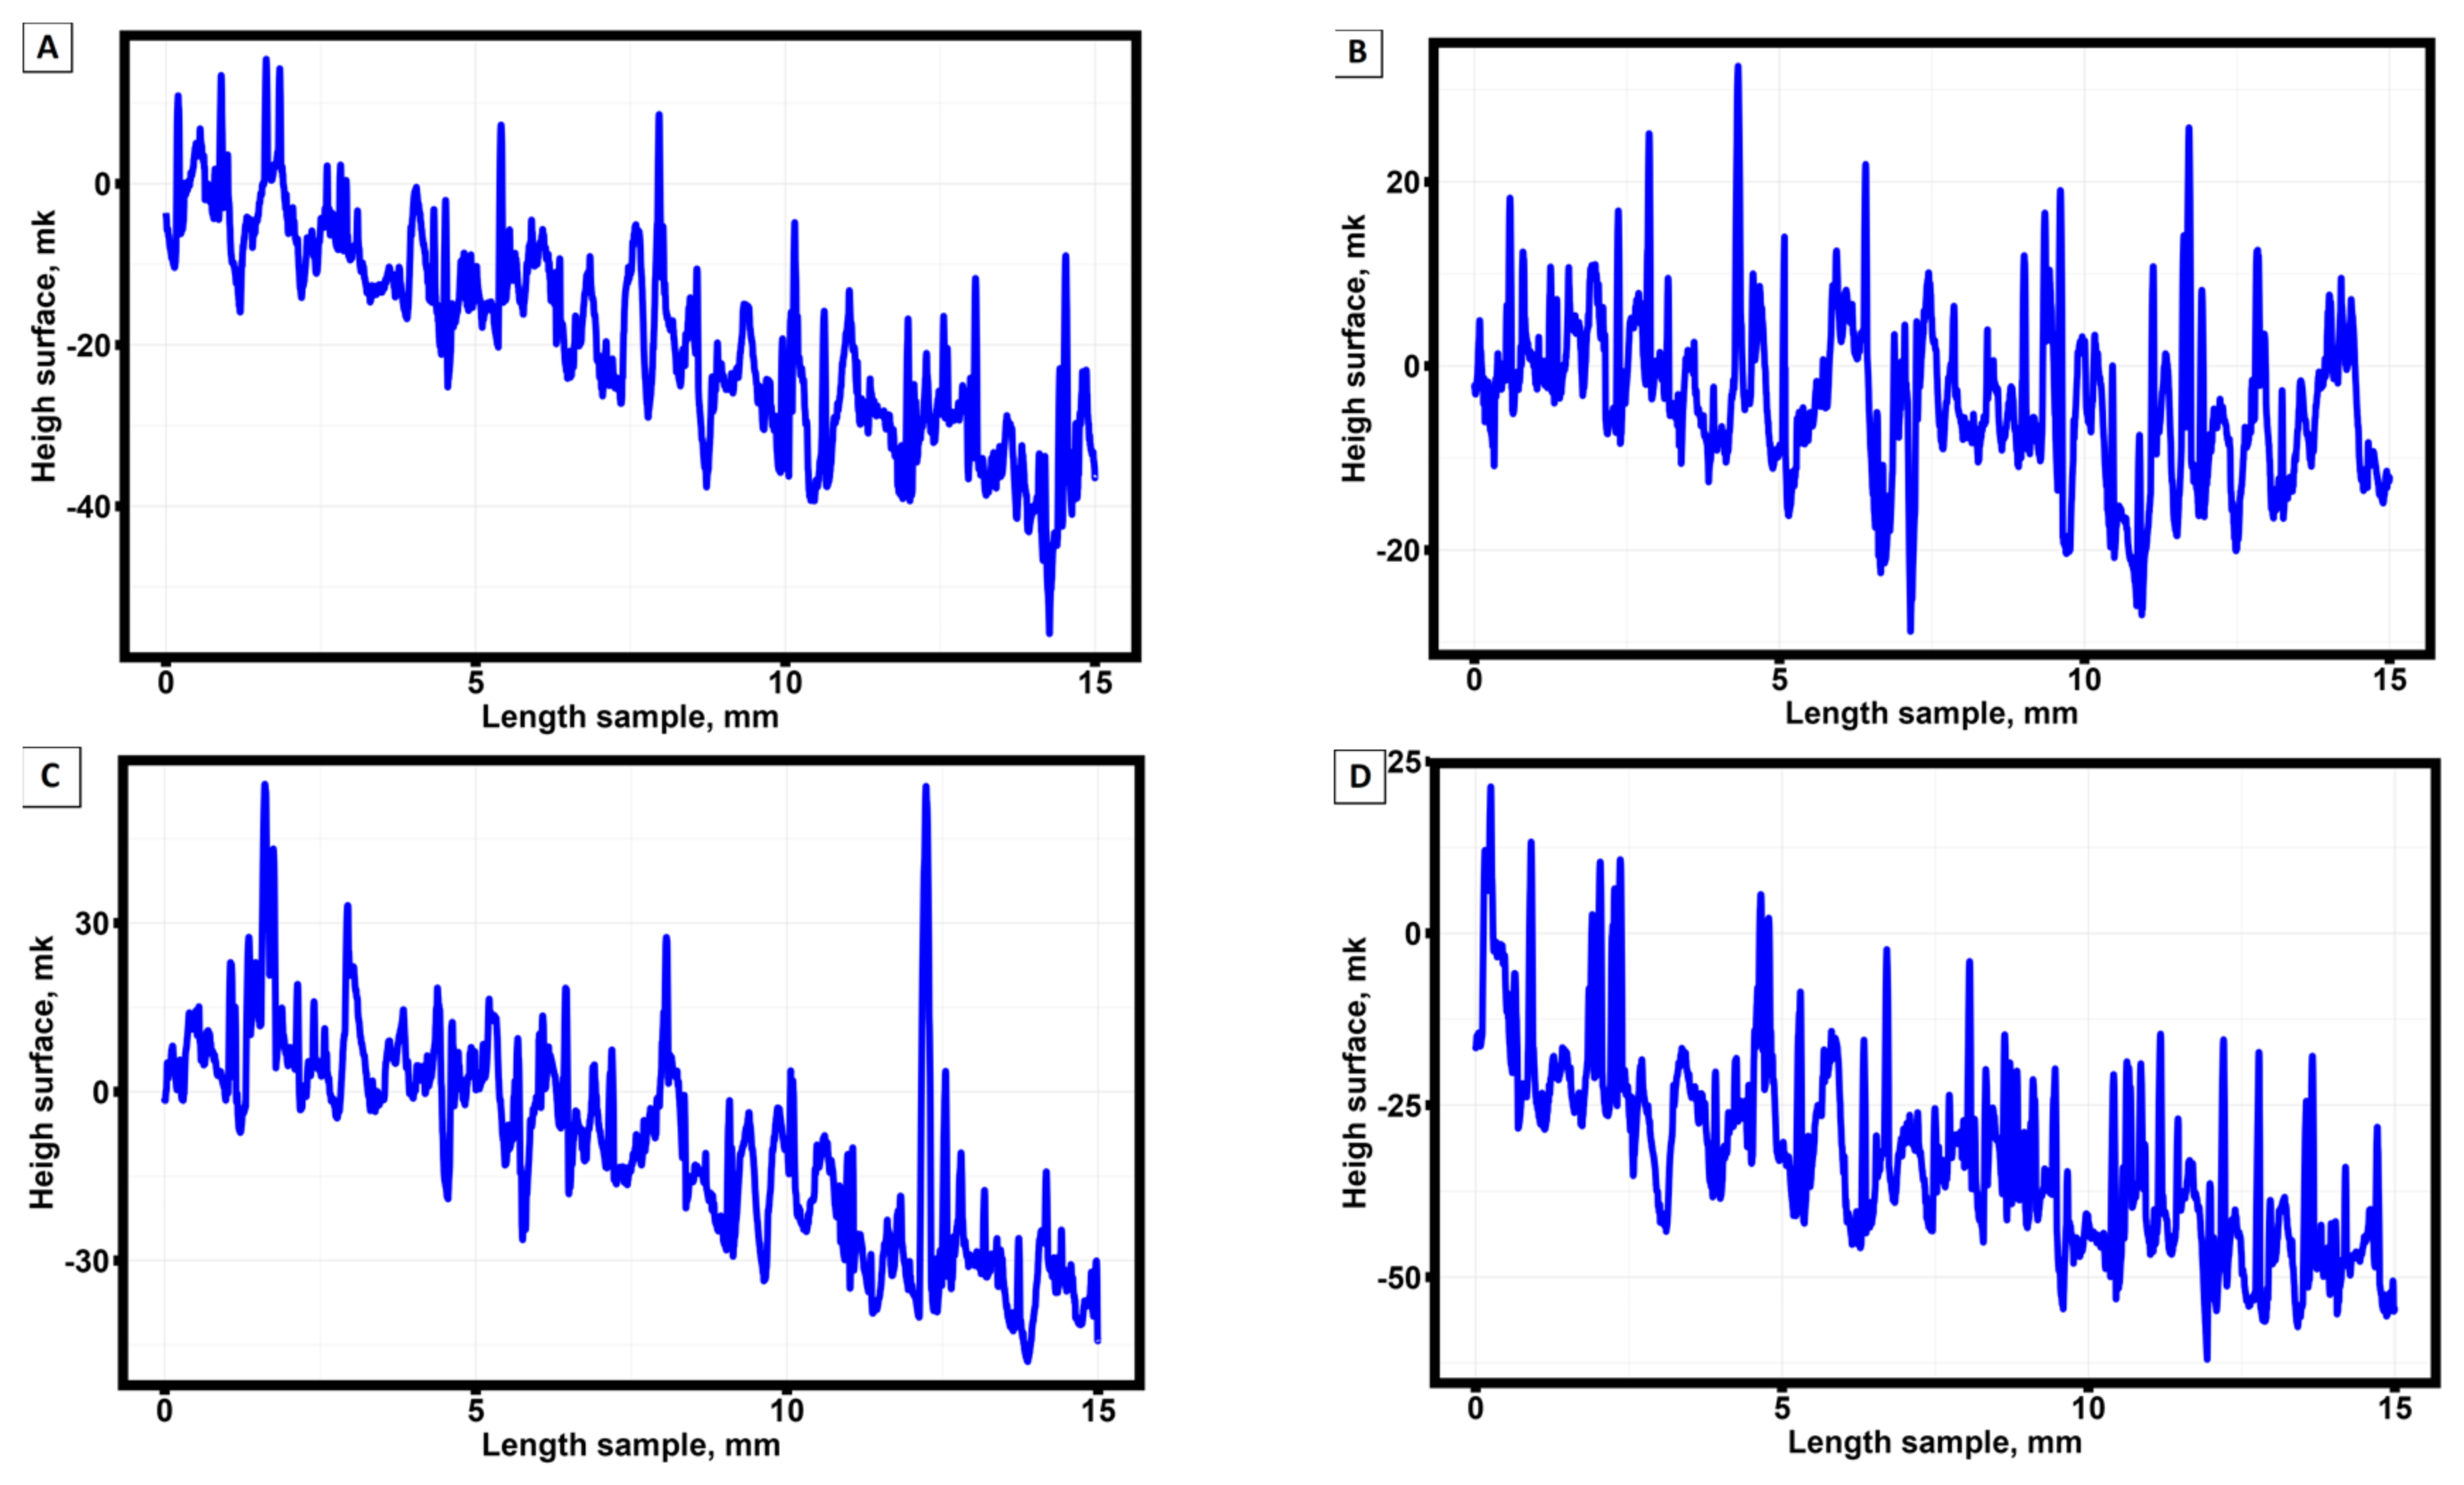
Figure 3 shows the results of surface roughness profile measurements for the samples that were not annealed after fabrication by selective laser melting technology. Similar roughness diagrams were obtained for the other 42 samples.
The analysis of the autocorrelation functions of the surface profile shows that there is a regularity in the variation of the surface profile height depending on the sample length, which has the character of a stationary series [50].
Table 2 presents the arithmetic mean values of the absolute values of profile deviations within the base length (Ra), the sum of the height of the largest profile protrusion and the depth of the largest profile depression within the base length of the sample (Rz) and the total profile height (Rmax) of all samples.
Table 3 presents the basic statistical analysis of the surface roughness parameters presented in Table 2.
The analysis of basic statistical characteristics shows that the arithmetic mean of absolute values of profile deviations within the basic length (Ra) does not have a wide scatter for different samples. At the same time, the greatest profile height, the sum of the height of the greatest profile protrusion and the depth of the greatest profile depression within the basic length of the sample (Rz) has rather high fluctuations of values from sample to sample, the same behavior is observed for the total profile height (Rmax).

3.2. Mechanical test results for groups of specimens manufactured by selective laser melting technology from AlSi10Mg material, pre-treated at different temperatures.

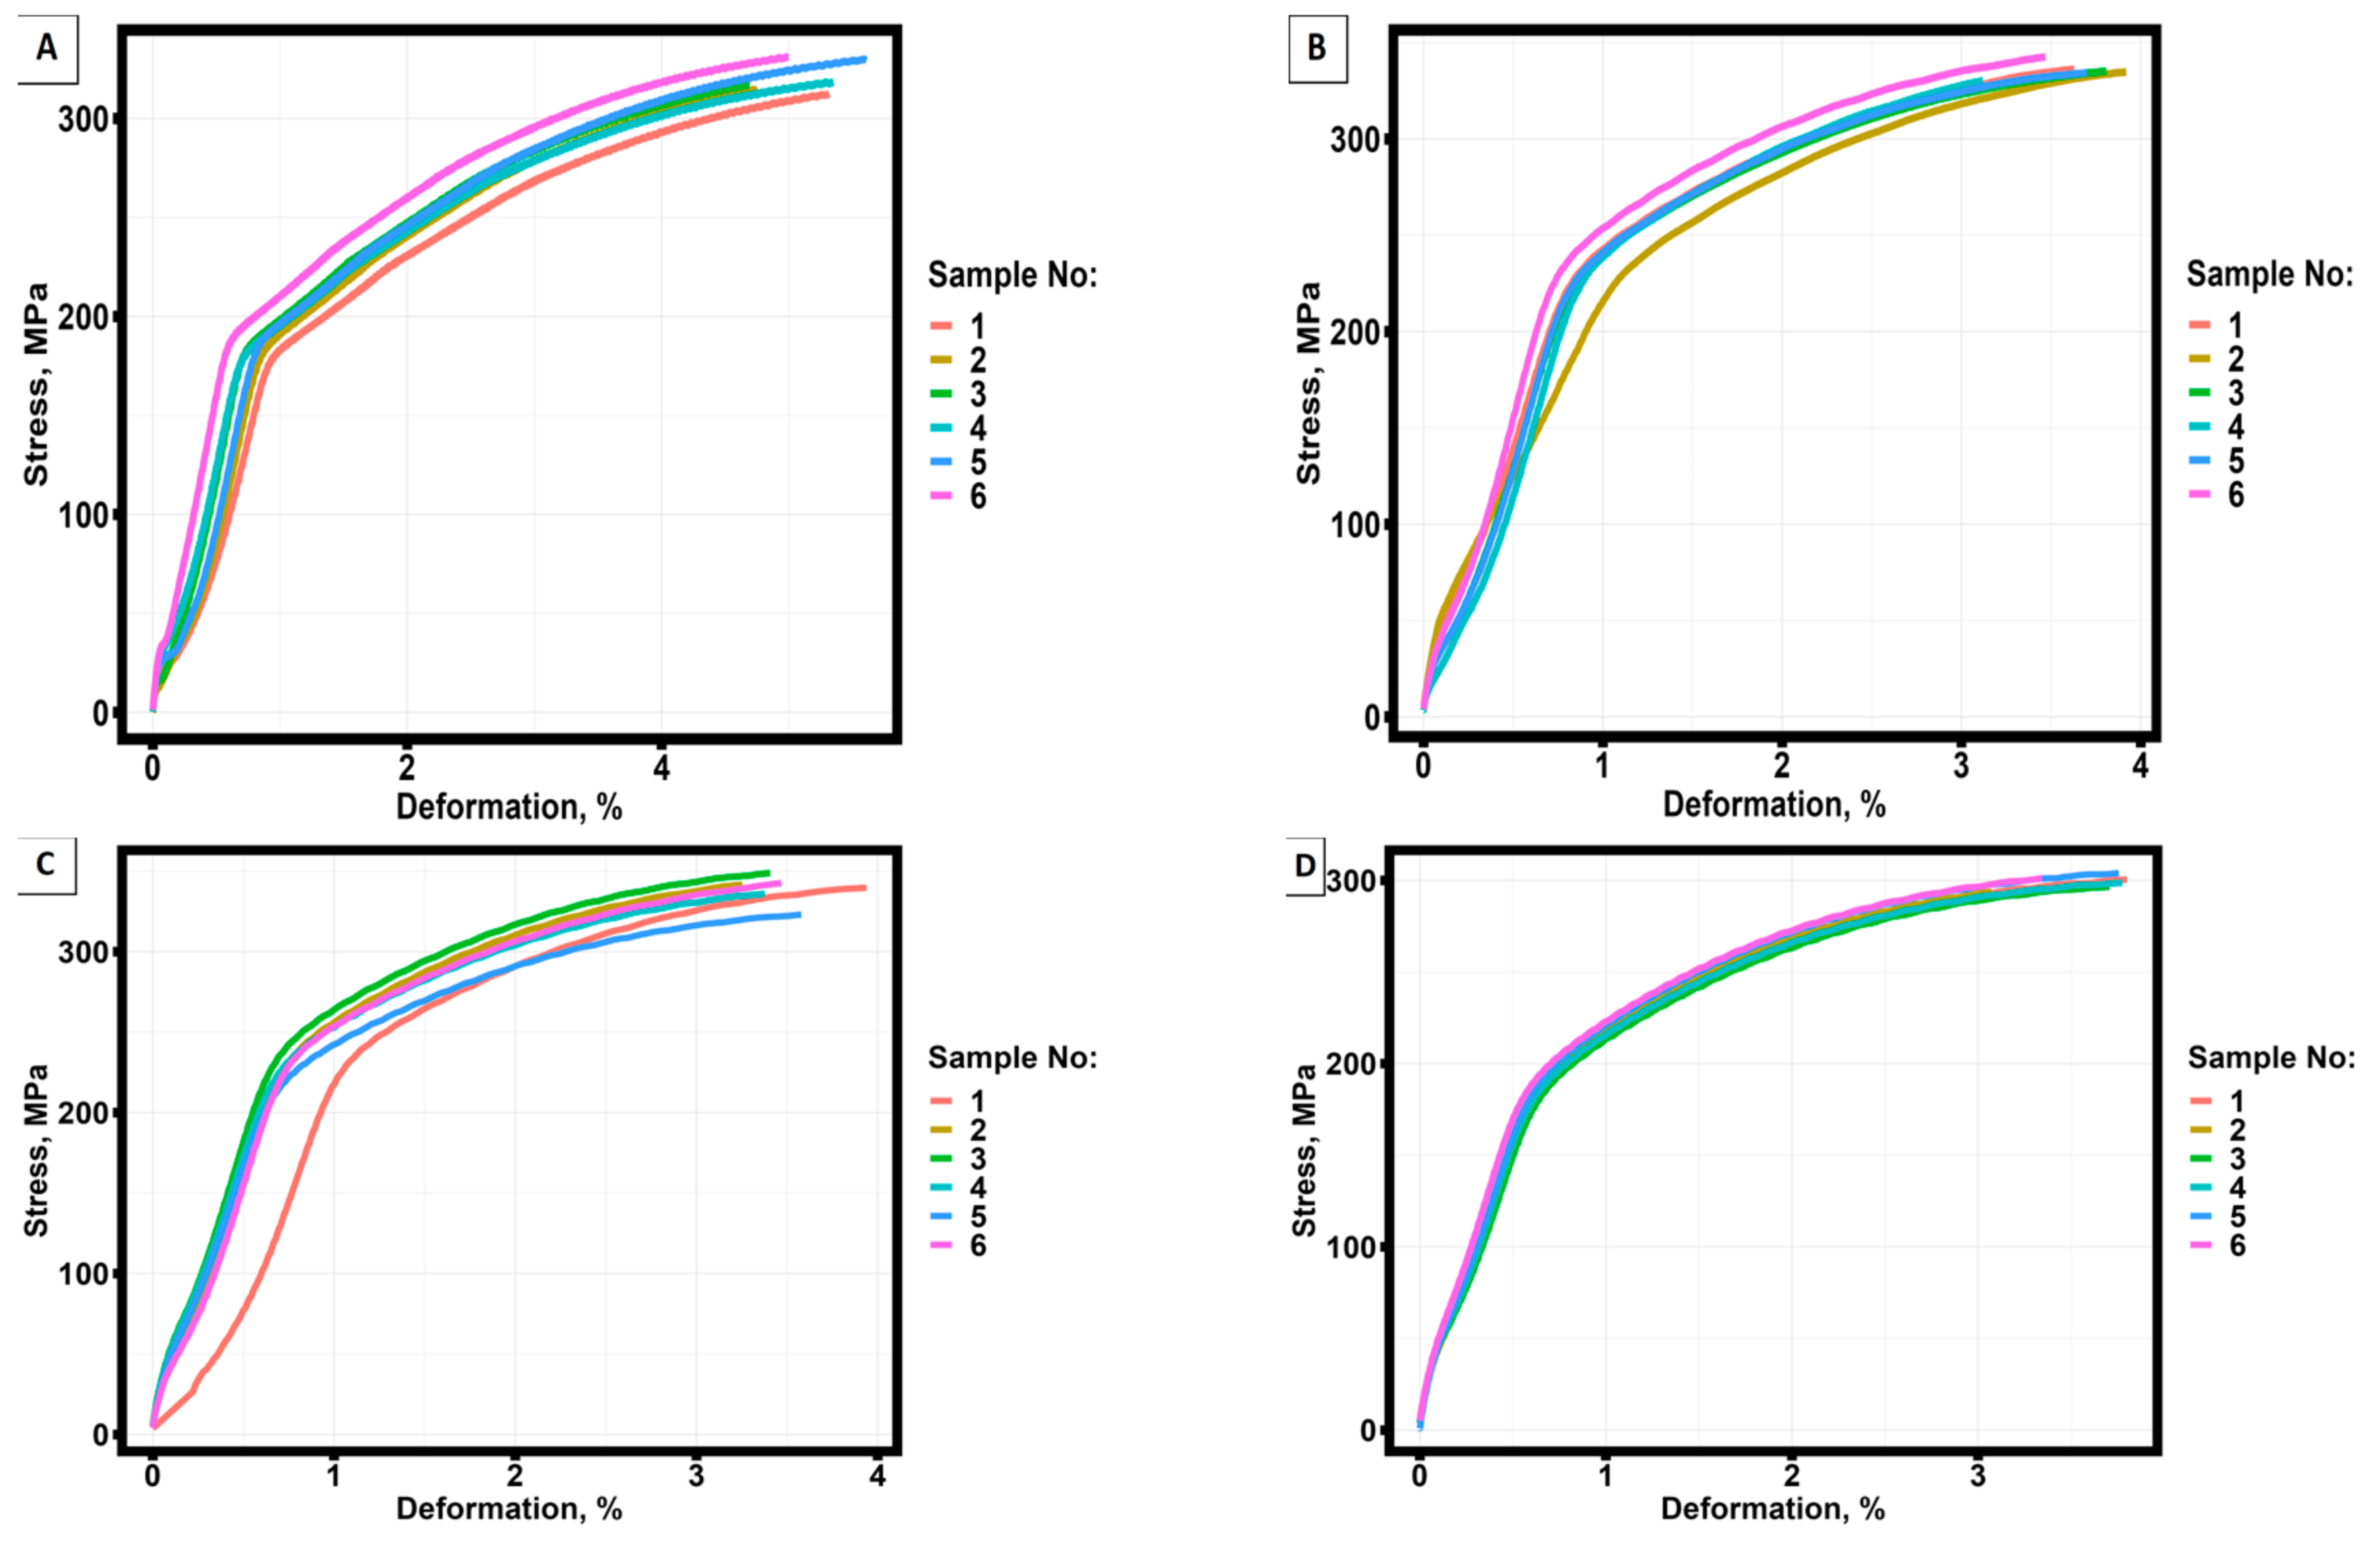
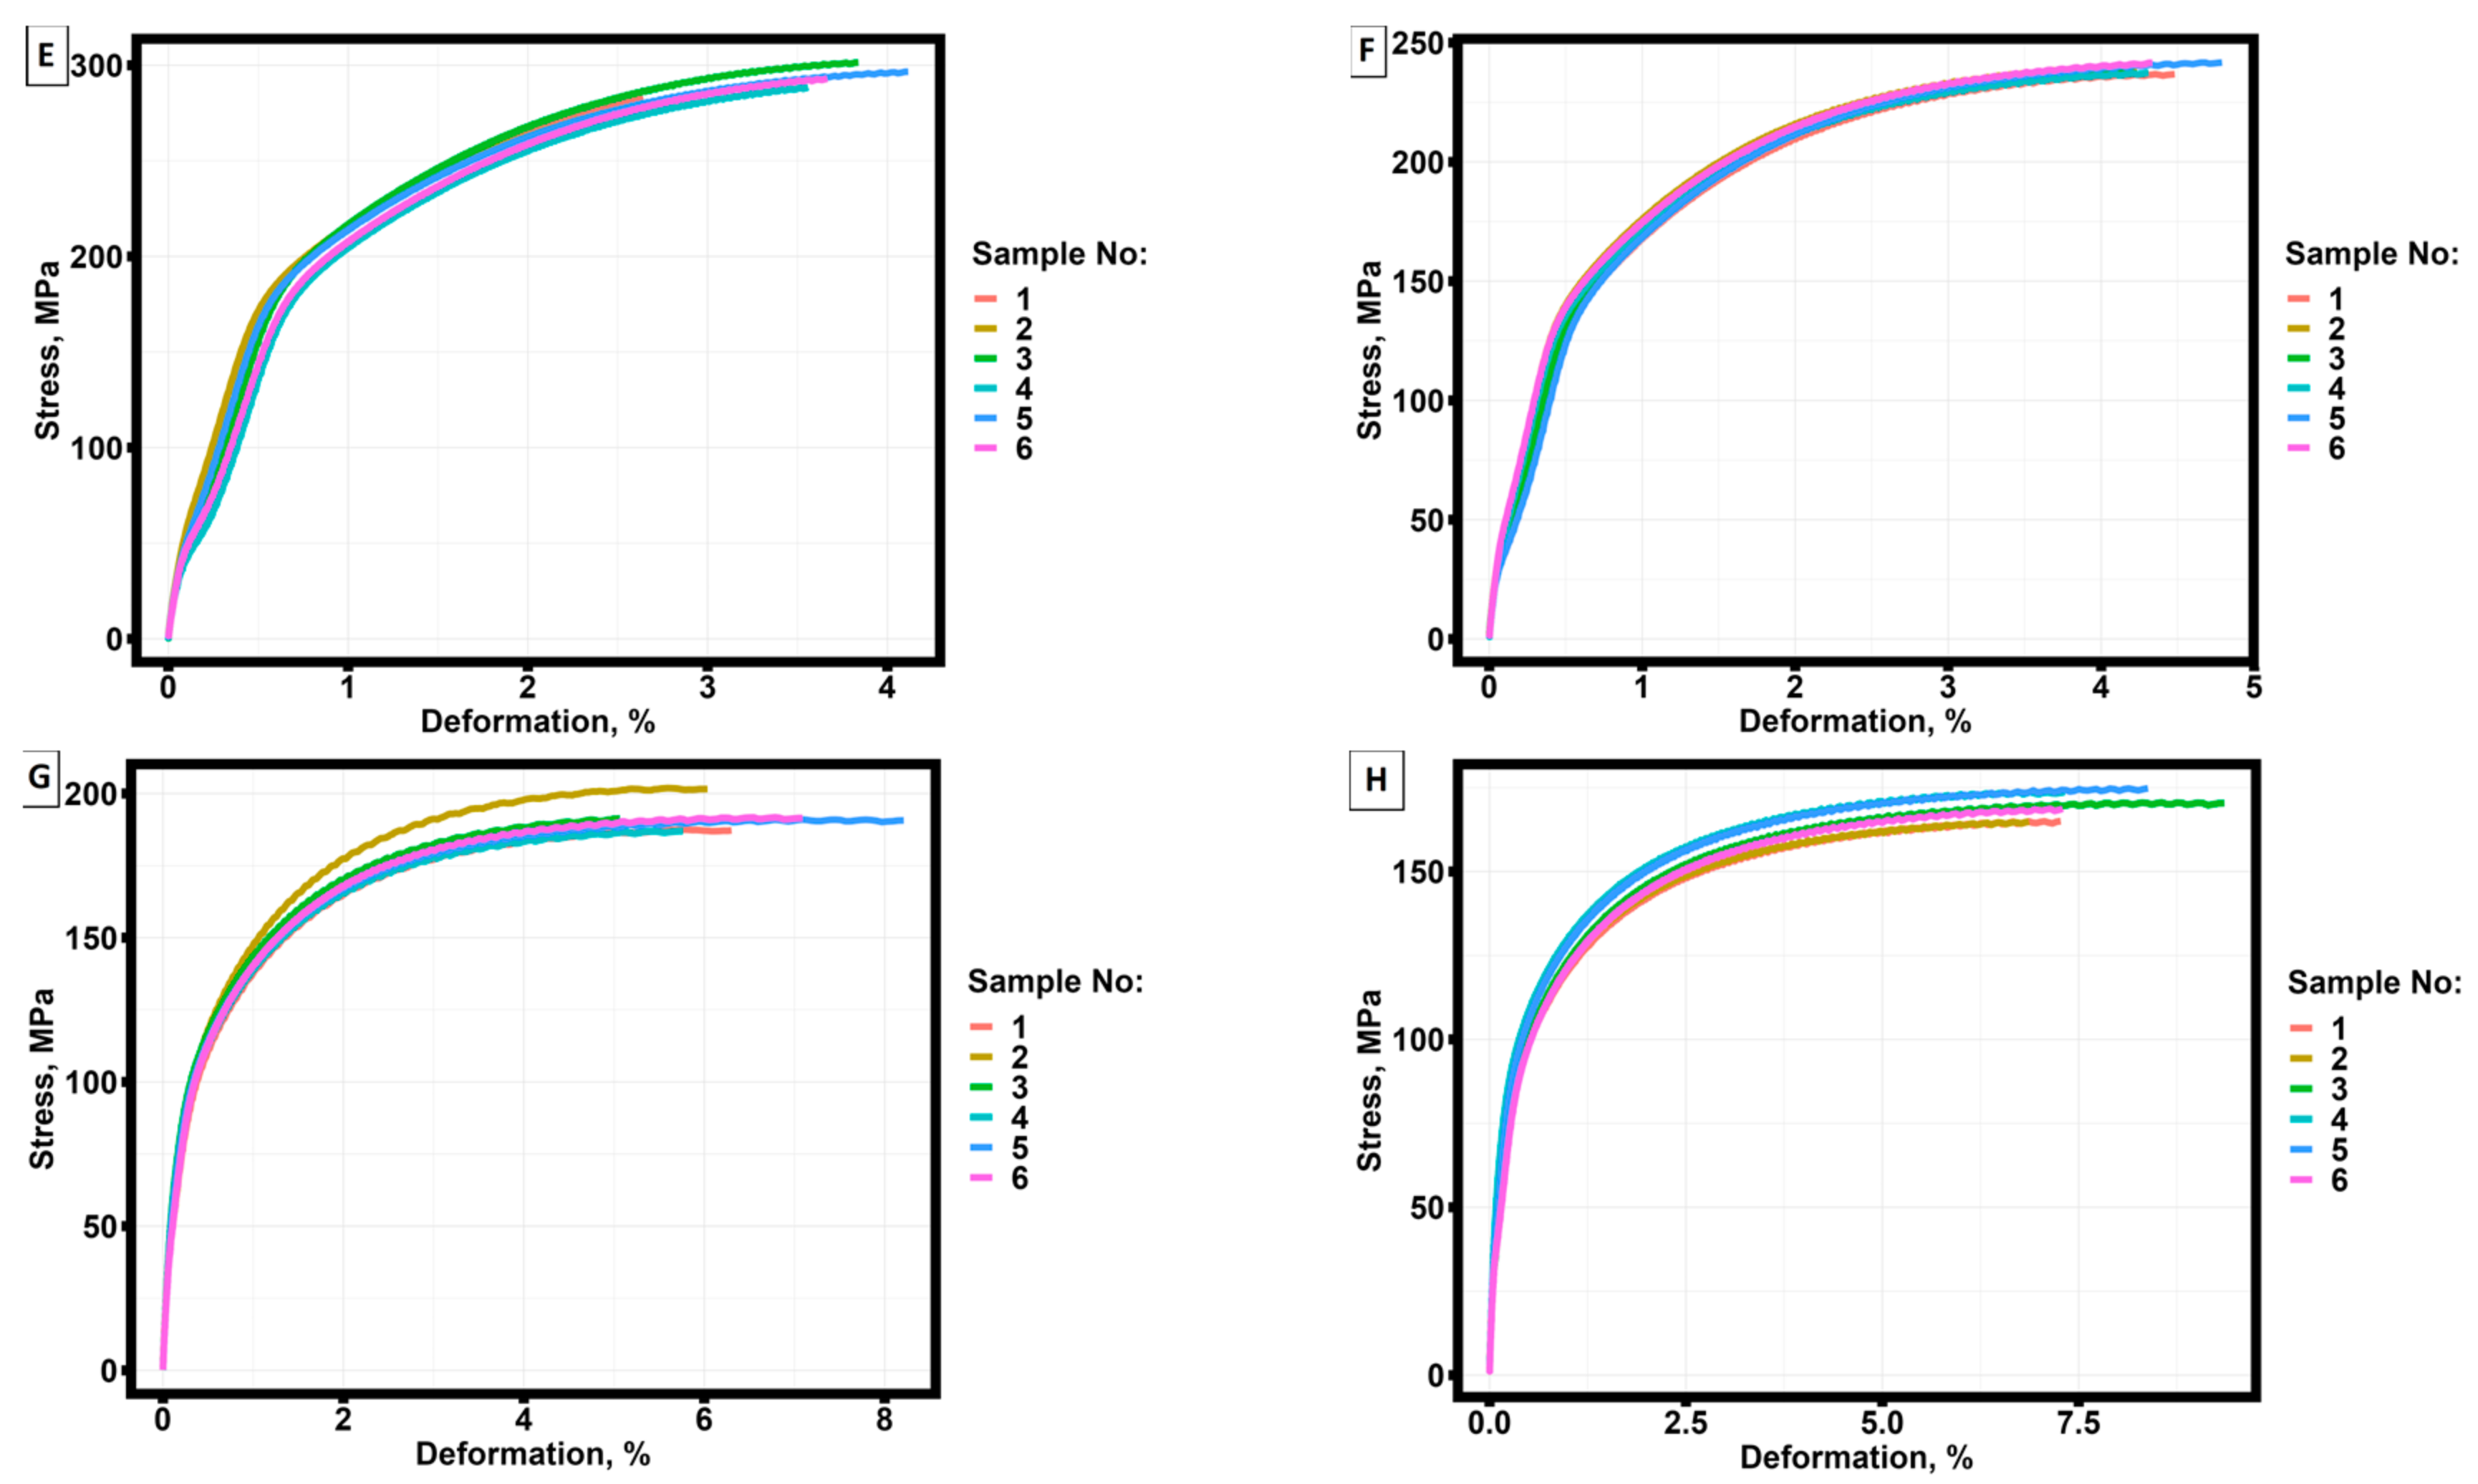
48 specimens were subjected to tensile tests. 42 of them were pre-annealed at different temperatures. Figure 4 shows the tensile diagrams of samples that did not undergo pre-annealing and samples that underwent pre-annealing at temperatures from 260 to 440 °C.
Table 4 presents the main mechanical properties of 48 tested samples.
Table 5 presents the basic statistical analysis of mechanical parameters presented in Table 4.
Preliminary analysis of the results of the basic statistical analysis shows that the maximum value of tensile strength and yield strength is achieved at annealing temperatures of 260 °C and 290 °C, while the maximum ductility is achieved at annealing temperature of 440 °C.

3.3. Statistical analysis of the results.

The choice of the criterion for checking the experimental results for belonging to the normal distribution is made based on calculations of the average statistical power depending on the number of tested samples. The average power of the criteria is calculated using the Monte Carlo method with the number of iterations equal to 100000. During the calculations, a simple distribution was introduced into the criterion, the parameters of which were calculated by the maximum likelihood method. The Cauchy, exponential, Gumbel, log-normal, logistic, normal and Weibull distributions were considered as simple distributions. The distribution parameters were iteratively recalculated depending on the number of tested samples.
Four criteria were selected for the study:
  • From parametric criteria:
  • Shapiro-Wilk criteria [51];
  • D’Agostino criteria [52];
  • From nonparametric:
  • Kolmogorov-Smirnov criteria [53];
  • Anderson-Darling criteria [54];
Anderson-Darling criterion and D’Agostino criterion have limitations on the minimum number of studies, the number of studies must be greater than or equal to 7.
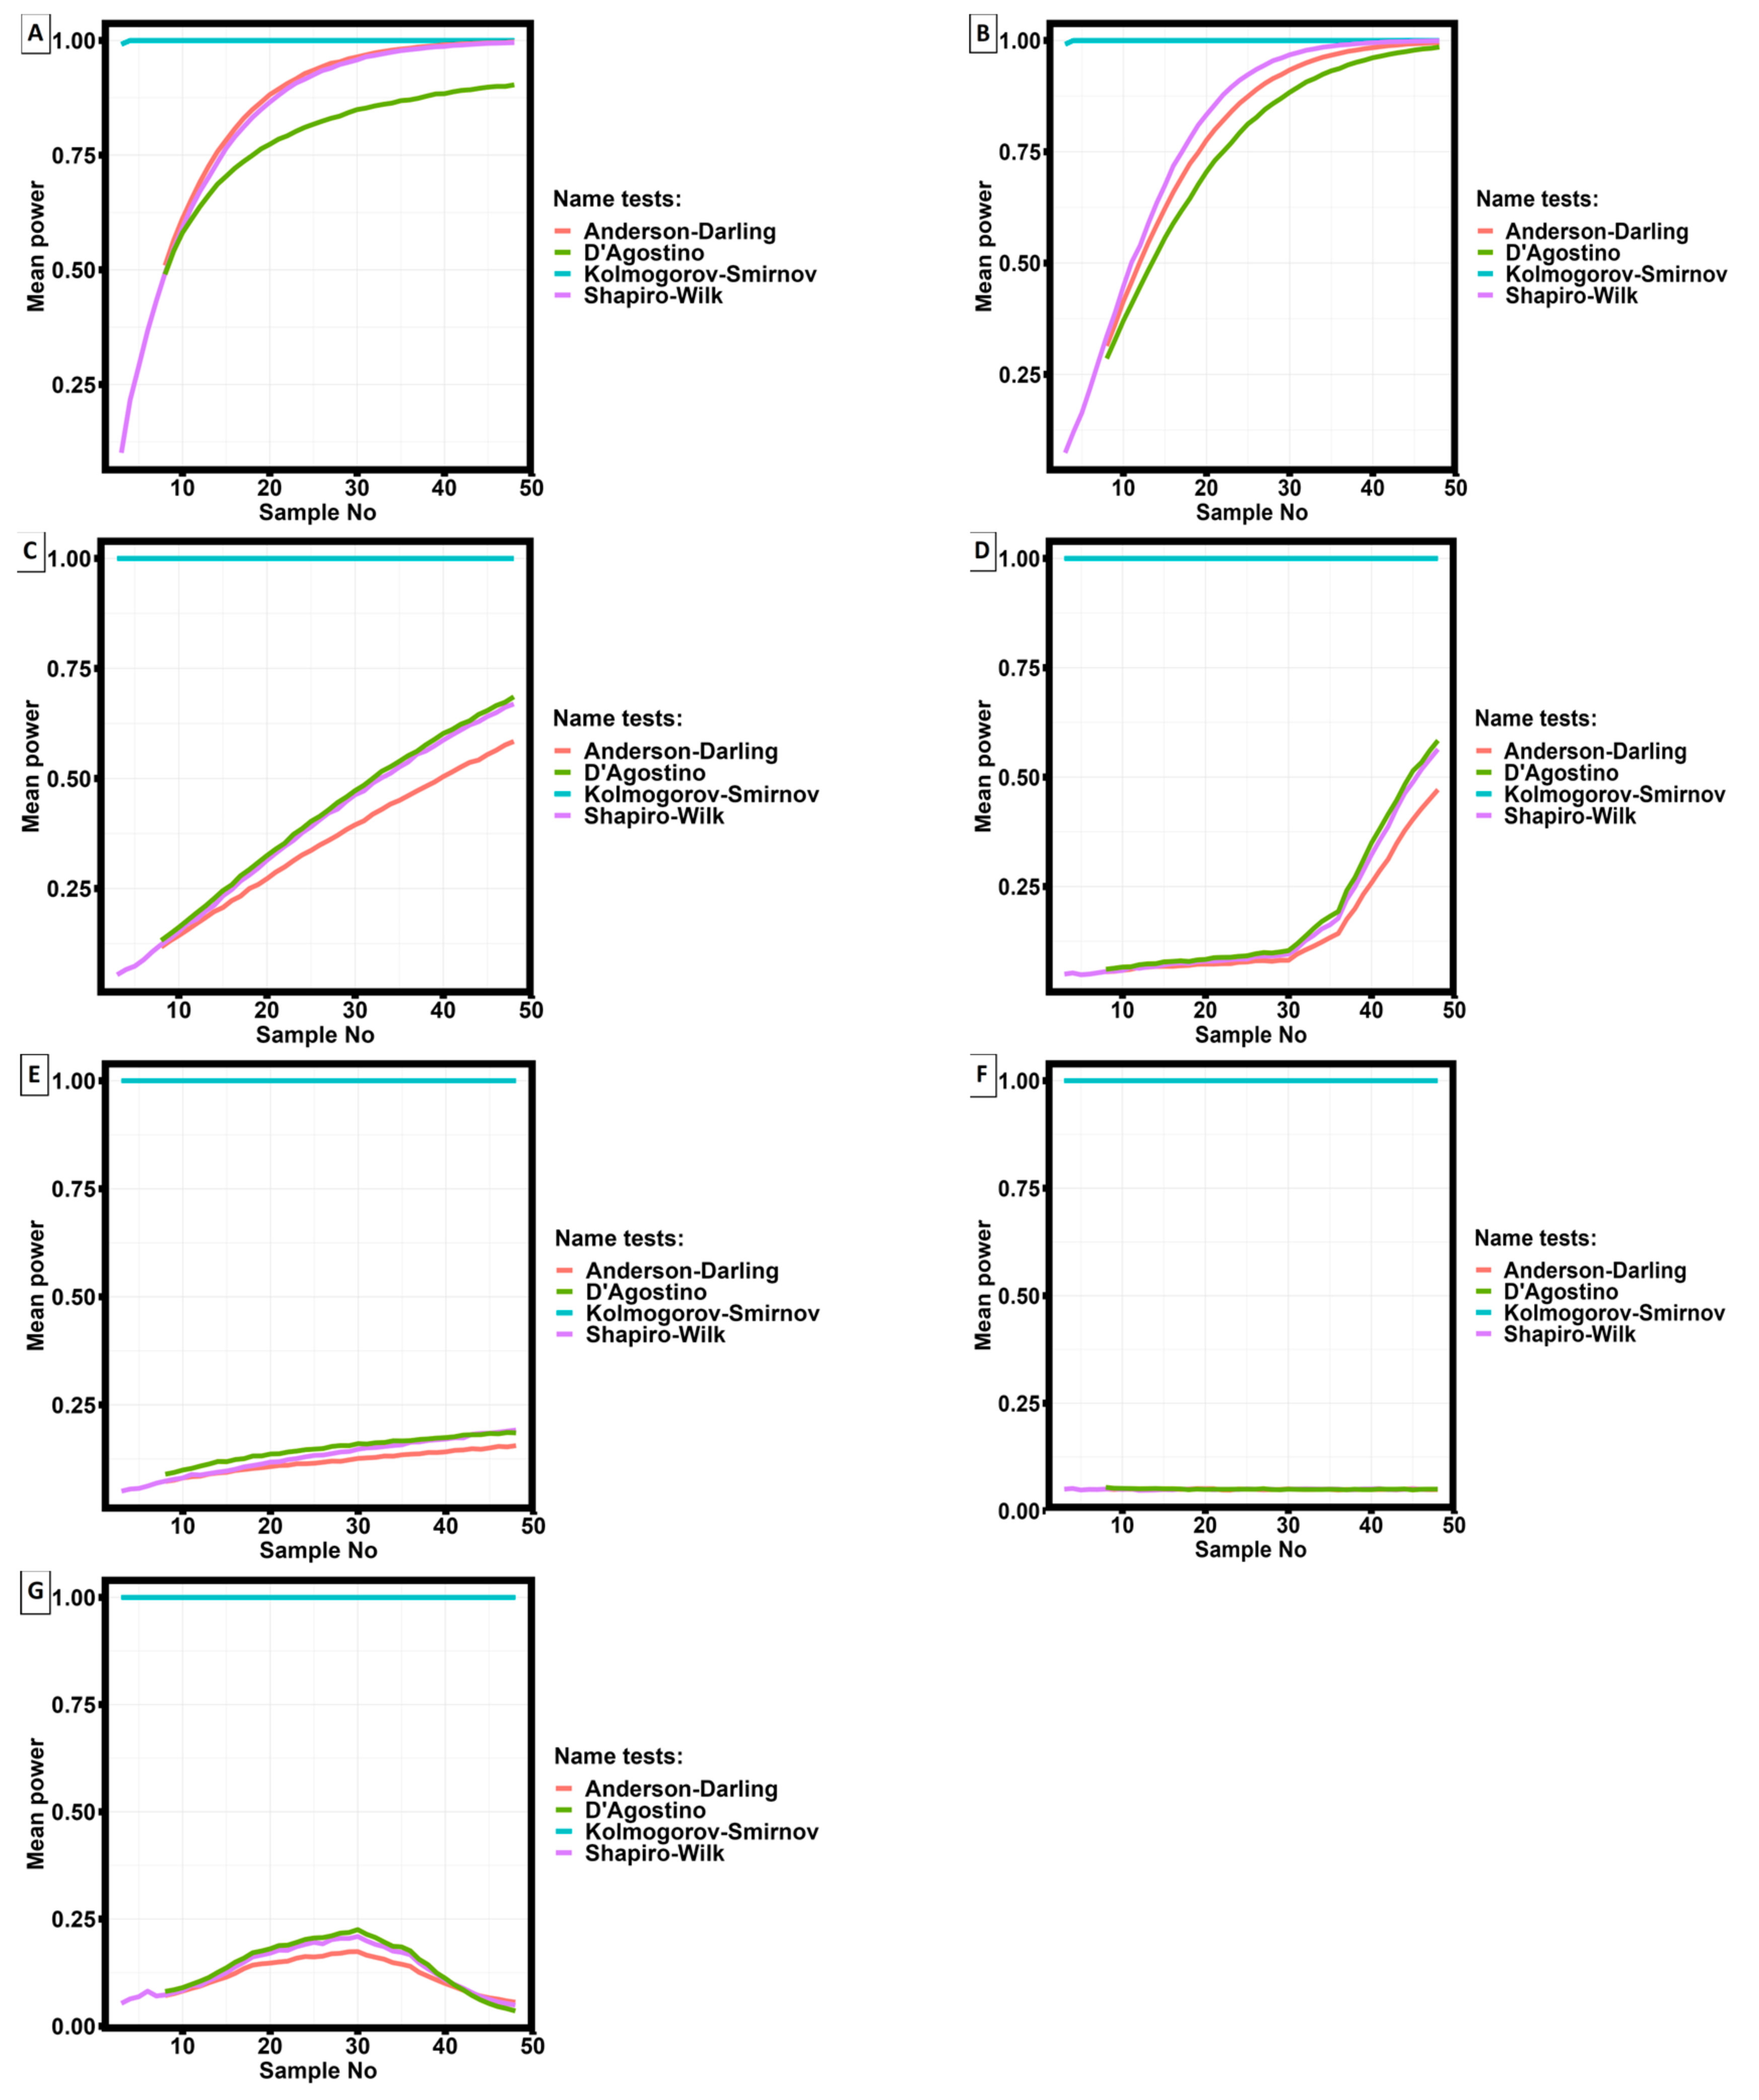
Figure 5 shows the results of calculating the average power of the statistical criterion depending on the number of trials.
Analysis of the results of calculations of the average statistical power of the four statistical criteria shows that the maximum power is possessed by the Kolmogorov-Smirnov criterion. The exception is the case when the measurement results obey the Cauchy distribution and the exponential distribution, when the number of trials is more than 40, the statistical power of the Anderson-Darling and Shapiro-Wilk criteria is almost equal to the power of the Kolmogorov-Smirnov criterion, and when the number of trials is more than 50, the power of the D’Agostino criterion approaches 1. For other distribution types, the statistical power of the Kolmogorov-Smirnov criterion is maximal.
To determine the theoretical distribution closest to the data, two information criteria were applied: Akaike and Bayesian. The results of applying the Akaike and Bayesian criteria are presented in Table 6.
Thus, the dependence of the average statistical power of the criterion on the number of studies is reflected in Figure 5g and the lowest probability of making an error of the second kind when analyzing the experimental results presented in this paper occurs when using the Kolmogorov-Smirnov criterion.
Considering the results of modeling given in [55,56], the Kolmogorov-Smirnov criterion is the most applicable for data analysis in the problems of materials science, as it has the highest power and does not depend on the type of data distribution (in those cases when the closest type of data distribution are Weibull and Logistic distributions [56]).
Using the Kolmogorov-Smirnov criterion, the data in Table 2 and Table 4 were tested for belonging to a normal distribution. Table 7 presents the results of the analysis.
Analysis of the results of applying the Kolmogorov-Smirnov test to surface roughness measurements and tensile test results show that the experimental values obtained do not belong to the normal distribution and further statistical analysis should be carried out using non-parametric statistical criteria.
Of practical interest are the correlations between surface roughness parameters and mechanical properties, the change in mechanical properties of samples made by selective laser melting technology and annealing temperature, as well as the behavior of surface roughness as a function of sample length. At the first stage of the analysis, point diagrams of dependence of mechanical properties on surface roughness parameters were plotted.
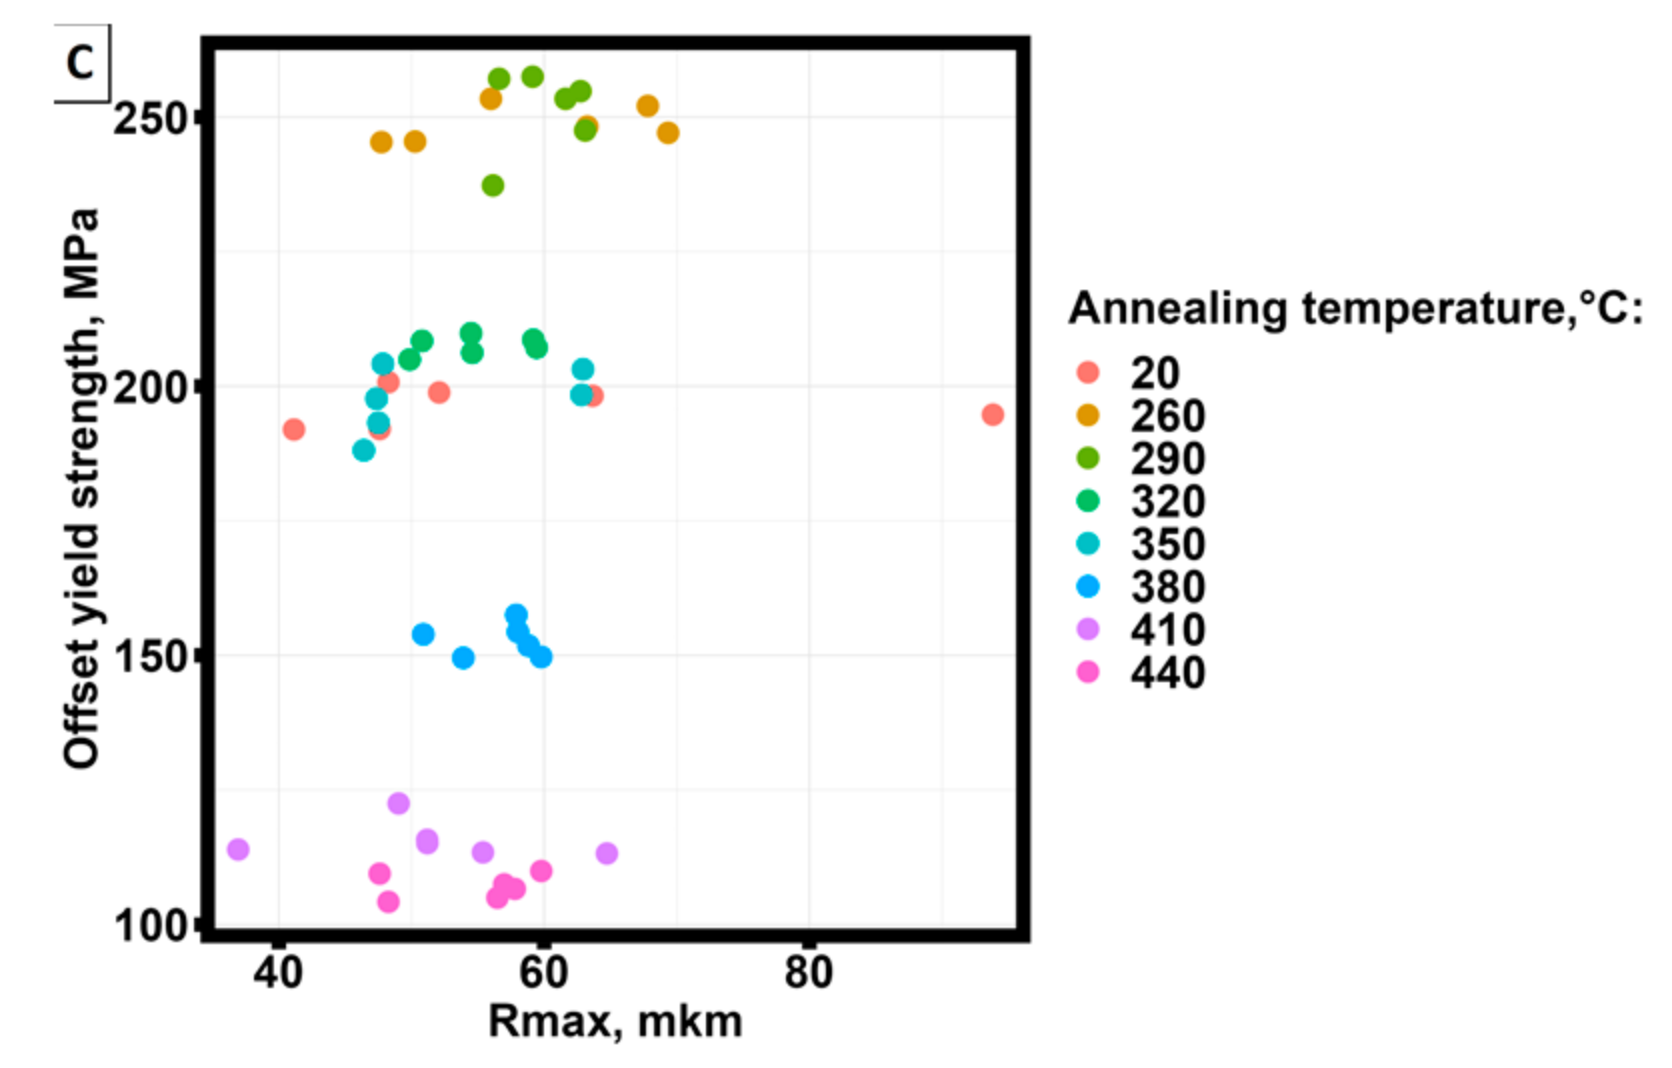
Figure 6 shows an example of yield strength dependence on surface roughness parameters.
Analysis of the graphs (Figure 6) shows that the yield strength of samples made by selective laser melting technology from AlSi10Mg material practically does not change depending on the main parameters of surface roughness and has a clearly expressed division of data into groups depending on the annealing temperature.
Behavior of the strength limit, strain corresponding to the yield strength and strain corresponding to the strength limit depending on the main parameters characterizing the surface roughness did not show clearly expressed dependencies and stratification into groups.
The differences in the mechanical properties of the samples depending on the annealing temperature were analyzed using the Kruskal-Wallis criterion [57], the results of which are presented in Table 8.
The results of applying the Kruskal-Wallis criterion show that statistically significant differences are observed in the mechanical properties of samples obtained by selective laser melting technology annealed at different temperatures. No statistically significant differences were found in surface roughness parameters. Comparison of the test results (Table 8) with Figure 6 shows that mechanical properties do not have significant differences at all annealing temperatures.
To test pairwise differences between mechanical properties depending on annealing temperature, the Mann-Whitney test was applied [58]. The results of the test are presented in Table 9.
The results of applying the Mann-Whitney criterion show that statistically significant differences are observed at almost all combinations of annealing temperatures, and all considered mechanical properties, except for aging temperatures 260 ° C and 290 ° C differences in all mechanical properties are not statistically significant. Except for yield strength, the same situation is observed at aging temperatures 320 °C and 350 °C, strength, strain corresponding to yield strength and strain corresponding to tensile strength have no statistically significant differences.
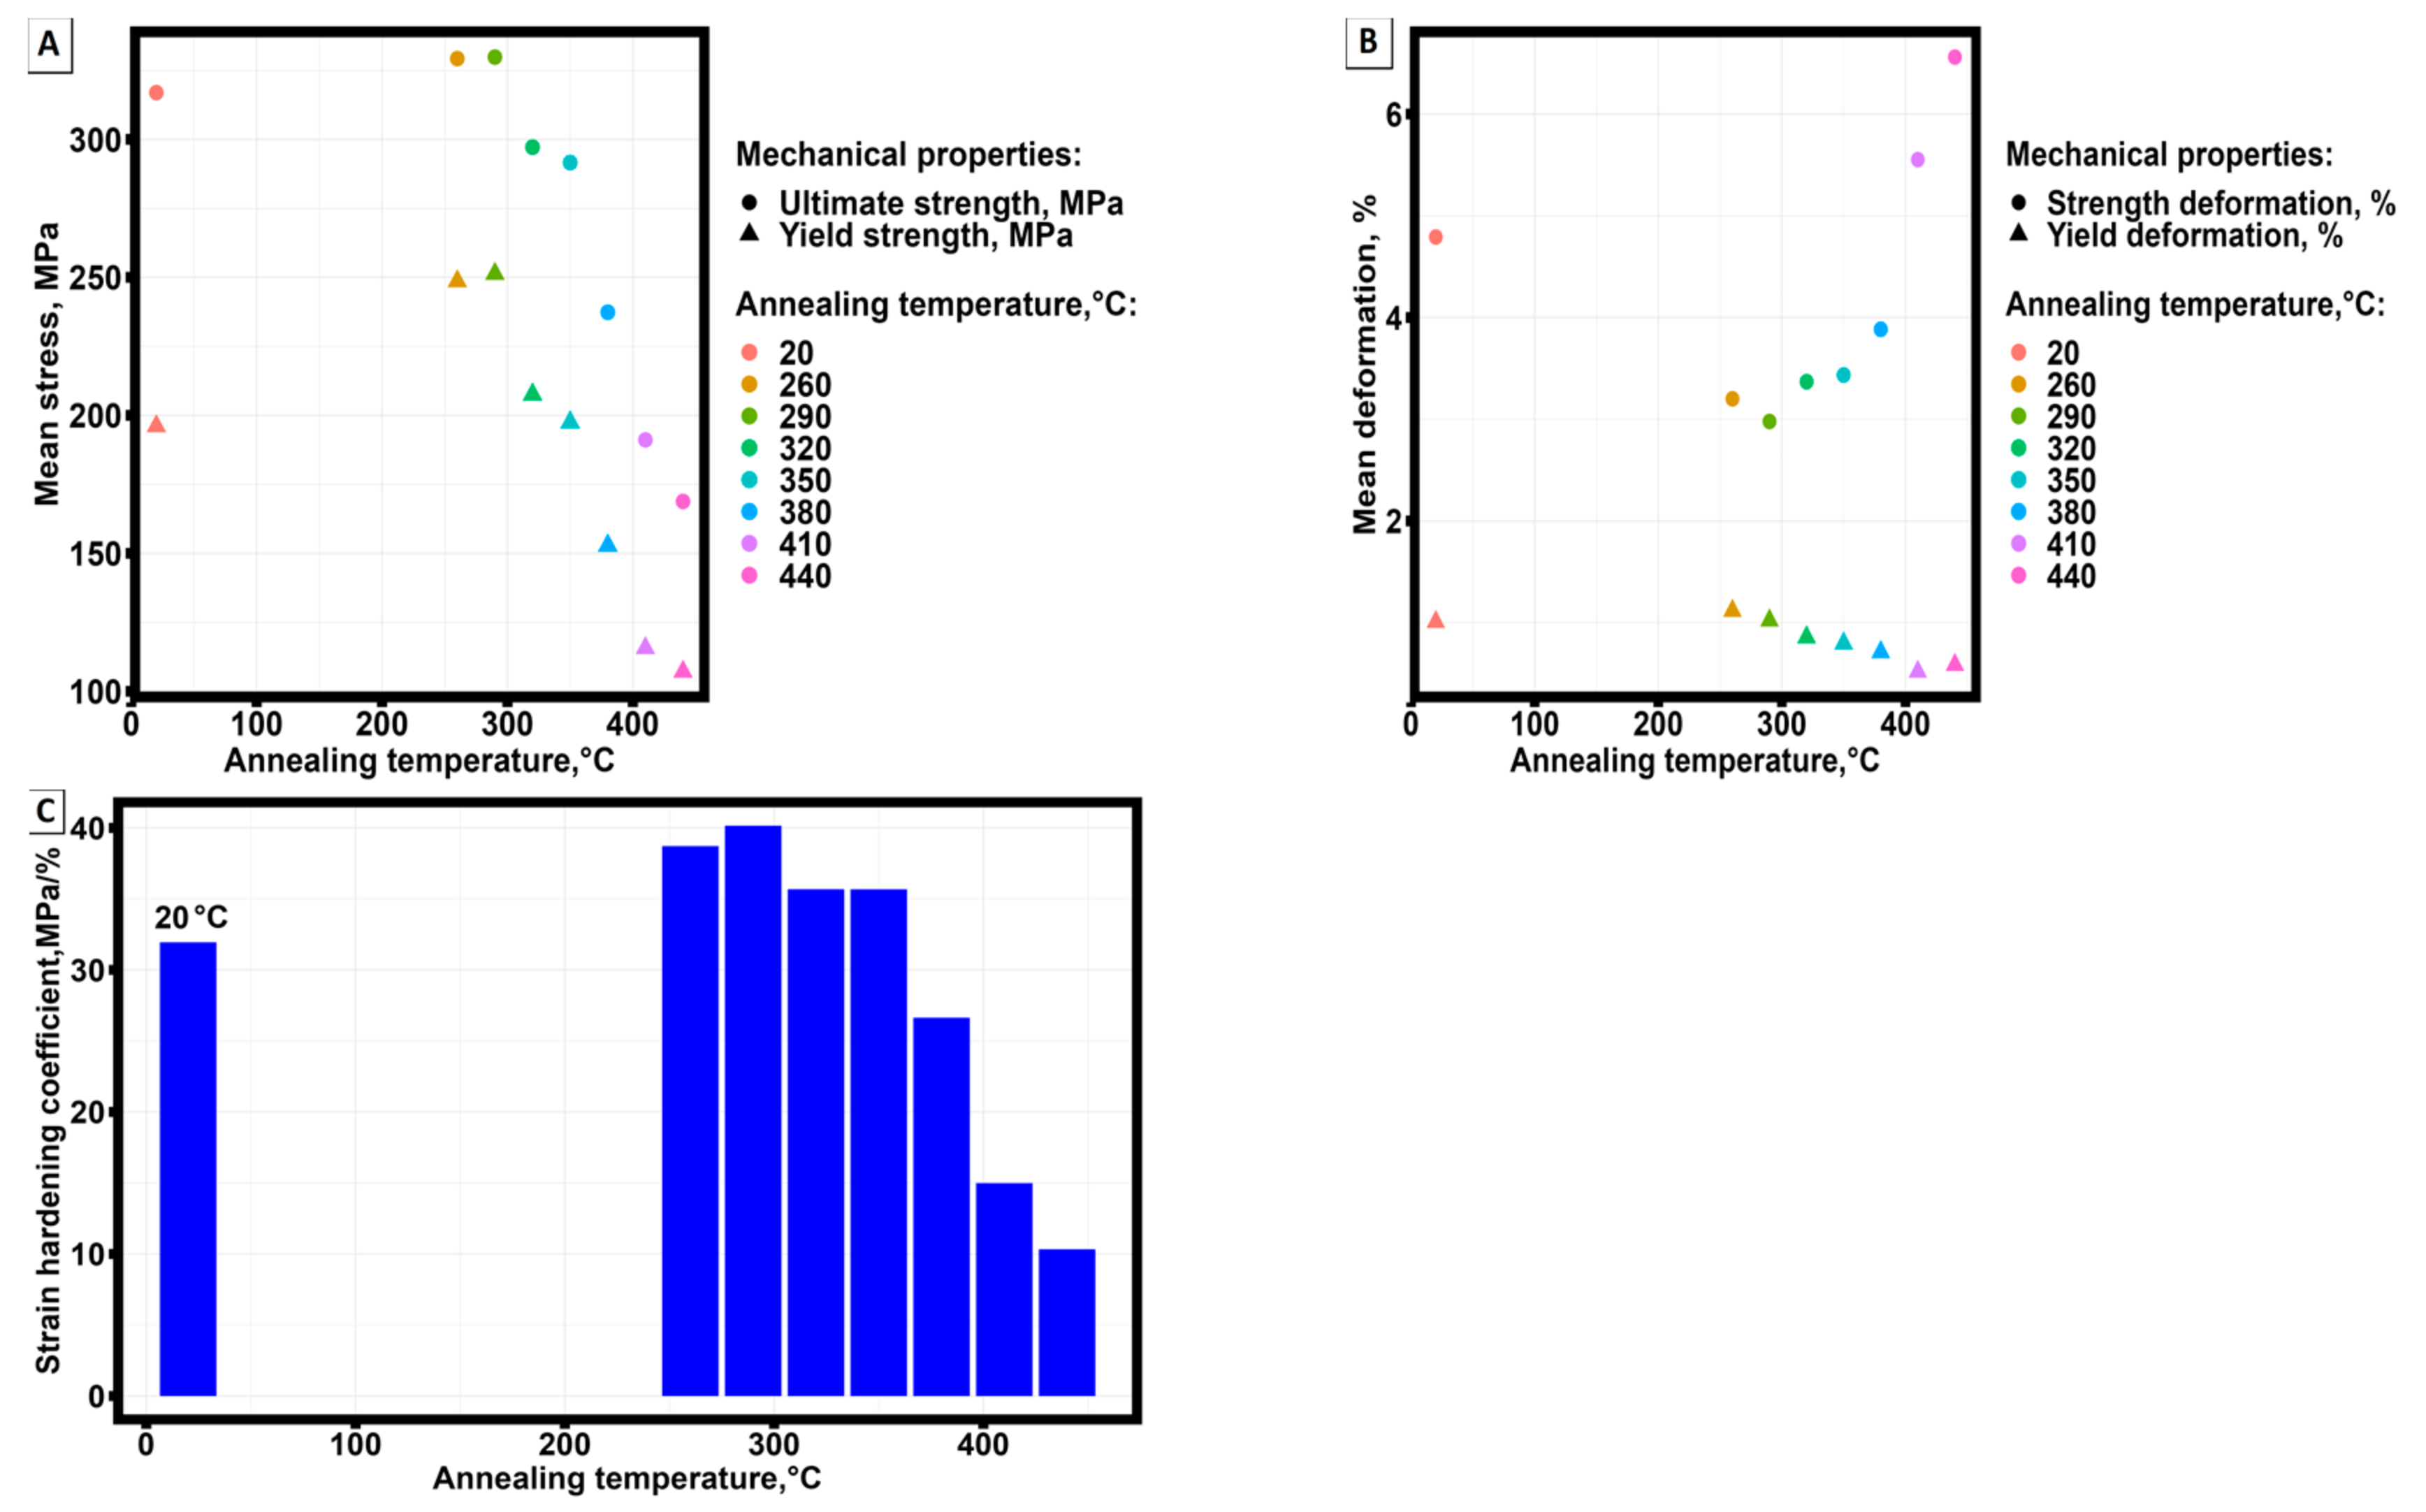
Figure 7 shows the change in the average values of yield strength and tensile strength as a function of annealing temperature, strain corresponding to the tensile strength and yield strength and the change in the strain hardening coefficient ( θ = d σ d ε ) [53] in the section of the tensile diagram from yield strength to tensile strength as a function of annealing temperature.
At increase of aging temperature there is a decrease in strength properties and increase in plasticity of samples obtained by selective laser melting technology from AlSi10Mg material (Figure 7a,b).
It follows from the presented dependences (Figure 7c) that the maximum strain hardening is achieved at the aging temperature equal to 290 °C. Considering the results of the analysis given in Table 9, the maximum strain hardening achieved is not statistically significantly different from the strain hardening achieved at 260 °C.
To reveal not clearly expressed dependencies, correlation analysis of mechanical properties of samples obtained by selective laser melting technology from AlSi10Mg material and basic parameters describing surface roughness was applied. Considering the results of analyzing the distributions of the studied quantities (Table 6 and Table 7, the distribution is different from normal), the correlation analysis by Kendall was applied.
Table 10 shows the Kendall correlation coefficients, the calculated level of statistical significance and the coefficient of determination, the strength of the correlation was interpreted using the Evans scale. The level of statistical significance was assumed to be 0.05.
The results of correlation analysis of mechanical properties of samples manufactured by selective laser melting technology from AlSi10Mg material and basic parameters of surface roughness show the presence of weak statistically significant correlation between the strain corresponding to the yield strength and the sum of the height of the largest profile protrusion and the depth of the largest profile depression within the basic length of the sample (Rz) and between the strain corresponding to the yield strength and the full height of the profile (Rmax), in other cases statistically significant correlation between the strain corresponding to the yield strength and the full height of the profile (Rmax).
Figure 8 shows scatter diagrams of the dependences of the strain corresponding to the yield strength as a function of Rz and Rmax and regression models describing the established dependences.
Table 11 presents the results of constructing the dependence of the strain corresponding to the yield strength on the surface roughness parameters.
The obtained correlations and regression equations describe a statistically significant relationship between the experimentally obtained data, but do not provide an answer to the causes of the found relationship.
To establish the reasons for the correlation relationship, the sum of the heights of the largest protrusions and depths of the largest depressions of the surface roughness profile within the base length of the sample (Rz) and the total height of the surface roughness profile (Rmax) were analyzed.
Rz is calculated by the equation:
R z = i = 1 5 y p m i + i = 1 5 | y v m i | 5
where y p m i – height of the i-th protrusion of the surface roughness profile; y v m i – depth of the i-th depression of the surface roughness profile.
Rmax, respectively:
R m a x = | y m a x y m i n |
where y m a x – maximum height of roughness profile; y m i n – maximum depth of surface roughness profile.
The analysis of the values included in equations (1) and (2) shows that the main variables have extreme character and their behavior should be analyzed by means of extreme value analysis [60]. However, it should be taken into account that the correlation is observed with the value characterizing the sample as a whole and the analysis should be performed based on the influence of extreme values on each other.
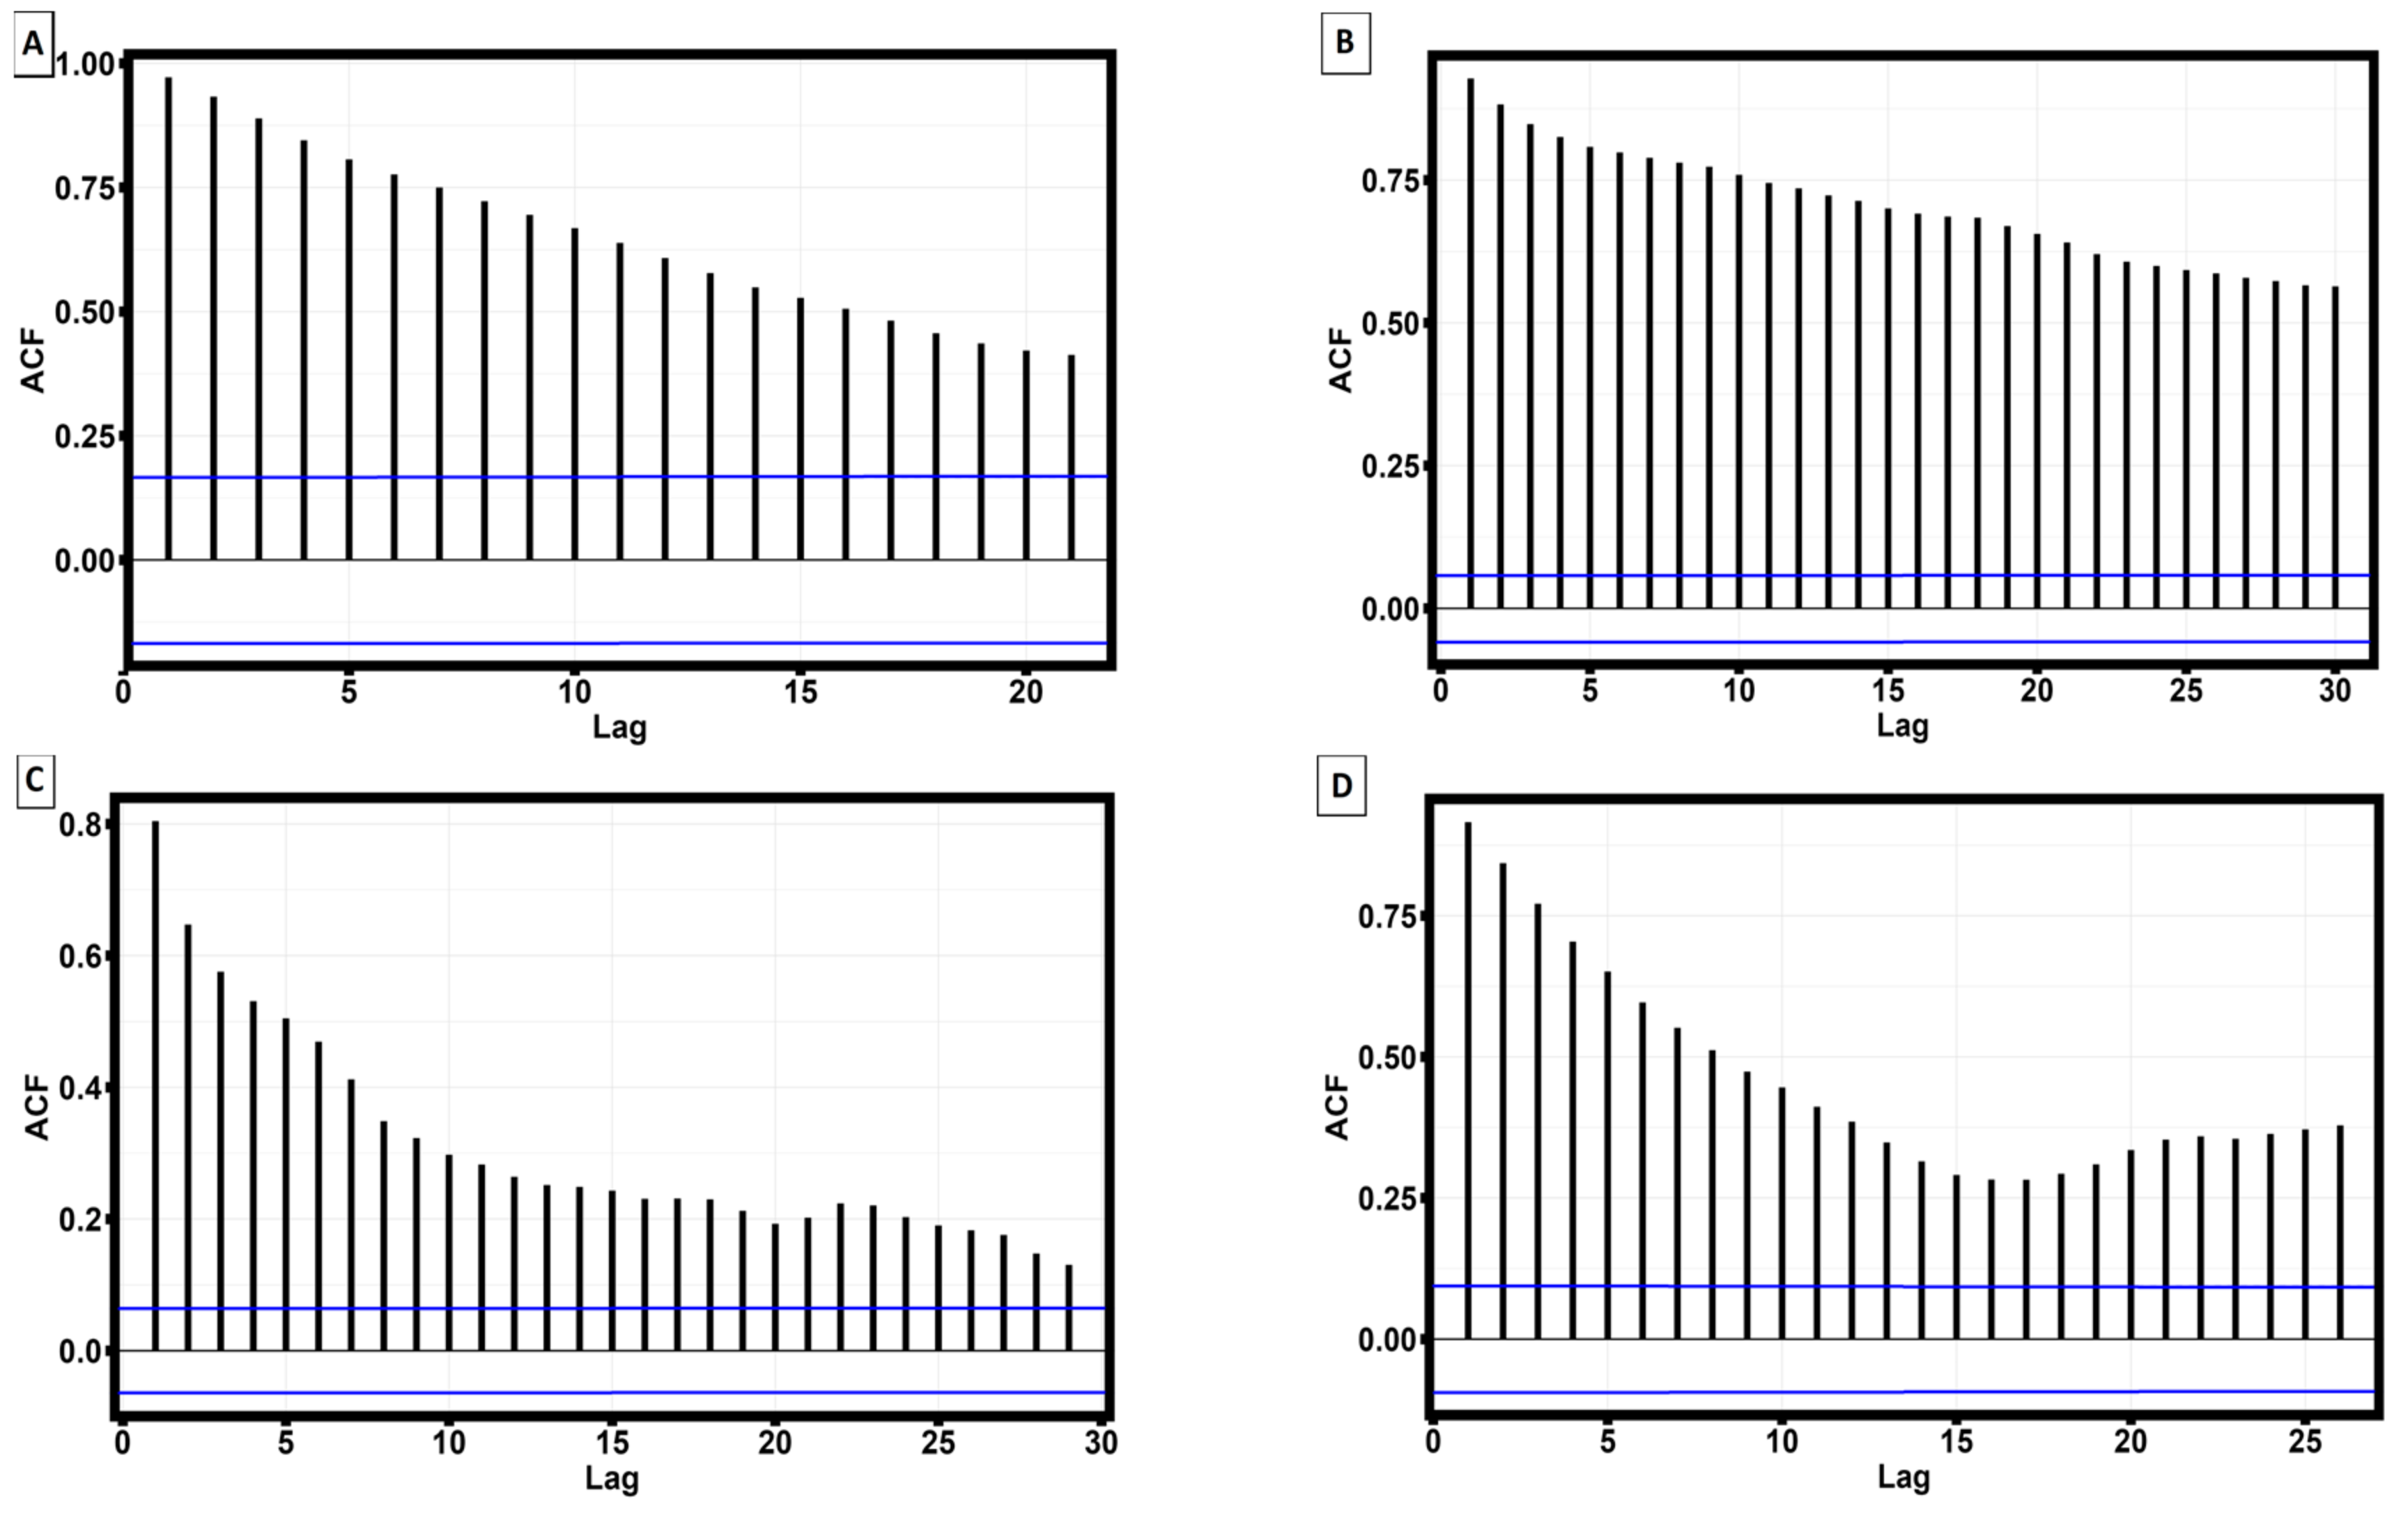
For these purposes, the autocorrelation function of the extreme values of the surface roughness profile was analyzed. As a result of the analysis it was found that statistically significant autocorrelation of maxima and minima is observed only for two samples - sample No. 3, aged at 380 °C and sample No. 4 aged at 440 °C. Figure 9 shows the graphs of autocorrelation functions of maxima and minima for these samples.
Removal of sample No. 3 aged at 380 °C and sample No. 4 aged at 440 °C from the total sample leads to the fact that the correlation between the strain corresponding to the yield strength and roughness parameters Rz and Rmax becomes statistically insignificant. Thus, the positive influence of surface roughness on the strain corresponding to the yield strength occurs when the maxima and minima of the surface roughness profile have a significant statistical correlation along the entire length of the sample.

4. Conclusions

As a result of statistical analysis of changes in mechanical properties and surface roughness depending on heat treatment, it was found that:
1. Maximum strain hardening of thin-walled samples made by selective laser melting technology from AlSi10Mg is achieved during heat treatment for 1 hour at 290 °C.
2. The mechanical properties of AlSi10Mg samples are not statistically significantly different at 260 °C and 290 °C.
3. At heat treatment of samples in the temperature range from 290 °С to 440 °С within one hour there are no statistically significant changes in surface roughness.
4. The correlation between the deformation corresponding to the yield strength and the sum of heights of the largest protrusions and depths of the largest depressions of the surface roughness profile within the basic length of the sample (Rz) and the full height of the surface roughness profile (Rmax) has been established.
5. The reason for the correlation is the stationary behavior of the maxima and minima of the surface roughness profile along the entire length of the specimens.
Summarizing the results of the studies, we can conclude that low-temperature heat treatment regimes, carried out within 1 hour, allow to achieve strain hardening of thin-walled AlSi10Mg samples. Considering the previously conducted studies it is necessary to continue the search for heat treatment modes and parameters of manufacturing samples by SLM method to obtain surface roughness, positively affecting the mechanical properties.

Author Contributions

Conceptualization, N.N., P.P.; methodology, N.N., P.P., O.K.; software, N.N., O.Y., O.K.; validation, N.N., O.K.; formal analysis, P.P., N.N., I.I.; investigation, R.K., I.I.; resources, N.N., O.Y.; data curation, N.K., O.Y., O.K; writing—original draft preparation, N.N., P.P..; writing—review and editing, N.N., P.P.; visualization, P.P., N.K., O.Y..; supervision, S.N.G., N.K.; project administration, S.N.G., P.P.; funding acquisition, P.P., N.K., O.Y. All authors have read and agreed to the published version of the manuscript.

Funding

This work was supported by the Ministry of Health of the Russian Federation under project 056-00041-23-00.

Data Availability Statement

Not applicable.

Acknowledgments

This work was carried on the equipment of the Collective Use Center of MSTU “STANKIN” (project No. 075-15-2021-695).

Conflicts of Interest

The authors declare no conflict of interest.

References

  1. International Organization for Standardization. ISO/ASTM 52900:2015 [ASTM F2792] Additive Manufacturing-General Principles-Terminology; ISO: Geneva, Switzerland, 2015. [Google Scholar]
  2. Ian Gibson, David Rosen, Brent Stucker. Additive Manufacturing Tecnologies. 3D Printing, Rapid Prototyping and Direct Digital Manufacturing//Springer, 2015 – P.P.
  3. Sandeep Rauta, Vijaykumar S. Jattib, Nitin K. Khedkarc, T.P.Singhd. Investigation of the effect of built orientation on mechanical properties and total cost of FDM parts // Procedia materials science 6 (2014) 1625-1630. 2014.
  4. Ludmila Novakova - Marcincinova, Jozef Novak - Marcincin. Verification of mechanical Properties of ABS materials used in FDM rapid prototyping technology// Proceedings in manufacturing systems/vol. 8. ISS. 2. 2013. 87-92.
  5. P. Dudek. FDM 3D printing technology in manufacturing composite elements. Archives of metallurgy and materials// vol. 58. 2013/ ISS.4/dol.: 10. [CrossRef]
  6. Borgue, R. 3D printing: the dawn of a new era in manufacturing? / R. Borgue // Assembly Automation. 2013. Vol. 33. ¹4. P. 307-311.
  7. S.A.M. Tofail, E.P. S.A.M. Tofail, E.P. Koumoulos, A. Bandyopadhyay, S. Bose, L. O'Donoghue, C. Charitidis, Additive manufacturing: scientific and technological challenges, market uptake and opportunities, Mater. Today 21 (2018) 22e37.
  8. J.M. Lee, S.L. J.M. Lee, S.L. Sing, M.M. Zhou, W.Y. Yeong, 3D bioprinting processes: a perspective on classification and terminology, Int. J. Bioprint. 4 (2) (2018) 151.
  9. J. Haubrich, J. J. Haubrich, J. Gussone, P. Barriobero-Vila, P. Kürnsteiner, E.A. Jagle, D. Raabe, € N. Schell, G. Requena, The role of lattice defects, element partitioning and intrinsic heat effects on the microstructure in selective laser melted Ti-6Al-4V, Acta Mater. 167 (2019) 136e148.
  10. T. DebRoy, H.L. T. DebRoy, H.L. Wei, J.S. Zuback, T. Mukherjee, J.W. Elmer, J.O. Milewski, A.M. Beese, A. Wilson-Heid, A. De, W. Zhang, Additive manufacturing of metallic componentseprocess, structure and properties, Prog. Mater. Sci. 92 (2018) 112e224.
  11. Khmyrov, R.S.; Grigoriev, S.N.; Okunkova, A.A.; Gusarov, A.V. On the possibility of selective laser melting of quartz glass. Phys. Procedia. 2014, 56, 345. [Google Scholar] [CrossRef]
  12. Khmyrov, R.S.; Protasov, C.E.; Grigoriev, S.N.; Gusarov, A.V. Crack-free selective laser melting of silica glass: single beads and monolayers on the substrate of the same material. Int. J. Adv. Manuf. Technol. 2016, 85, 1461–69 (Publons 43). [Google Scholar] [CrossRef]
  13. Protasov, C.E.; Khmyrov, R.S.; Grigoriev, S.N.; Gusarov, A.V. Selective laser melting of fused silica: Interdependent heat transfer and powder consolidation. Int. J. Heat Mass Transf. 2017, 104, 665–674. [Google Scholar] [CrossRef]
  14. Grigoriev, S.N.; Volosova, M.A.; Peretyagin, P.Y.; Seleznev, A.E.; Okunkova, A.A.; Smirnov, A. The Effect of TiC Additive on Mechanical and Electrical Properties of Al2O3 Ceramic. Appl. Sci. 2018, 8, 2385. [Google Scholar] [CrossRef]
  15. Gusarov, A.V.; Grigoriev, S.N.; Volosova, M.A.; Melnik, Y.A.; Laskin, A.; Kotoban, D.V.; Okunkova, A.A. On productivity of laser additive manufacturing. J. Mater. Process. Technol. 2018, 261, 213. [Google Scholar] [CrossRef]
  16. H. Asgari, A. H. Asgari, A. Odeshi, K. Hosseinkhani, M. Mohammadi, On dynamic mechanical behavior of additively manufactured AlSi10Mg_200C, Mater. Lett. 211 (2018) 187e190.
  17. Y. Chen, J.X. Y. Chen, J.X. Zhang, X.H. Gu, N.W. Dai, P. Qin, L.C. Zhang, Distinction of corrosion resistance of selective laser melted Al-12Si alloy on different planes, J. Alloys Compd. 747 (2018) 648-658.
  18. Leon, Avi, and Eli Aghion. "Effect of surface roughness on corrosion fatigue performance of AlSi10Mg alloy produced by Selective Laser Melting (SLM)." Materials Characterization 131 (2017): 188-194. [CrossRef]
  19. Rosenthal, Idan, Adin Stern, and Nachum Frage. "Microstructure and mechanical properties of AlSi10Mg parts produced by the laser beam additive manufacturing (AM) technology." Metallography, Microstructure, and Analysis 3 (2014): 448-453. [CrossRef]
  20. Kamarudin, K. , et al. "Dimensional accuracy and surface roughness analysis for AlSi10Mg produced by selective laser melting (SLM)." MATEC Web of Conferences. Vol. 78. EDP Sciences, 2016. [CrossRef]
  21. Zhichao Dong, Yabo Liu, Weijie Li, Jun Liang, Orientation dependency for microstructure, geometric accuracy and mechanical properties of selective laser melting AlSi10Mg lattices //Journal of Alloys and Compounds, 791 (2019): 490-500, ISSN 0925-8388. 4. [CrossRef]
  22. Mertens, Anne, et al. "Microstructure and properties of SLM AlSi10Mg: understanding the influence of the local thermal history." Procedia Manufacturing 47 (2020): 1089-1095. [CrossRef]
  23. Kempen, Karolien, et al. "Mechanical properties of AlSi10Mg produced by selective laser melting." Physics Procedia 39 (2012): 439-446. [CrossRef]
  24. Jing, C. H. E. N. Jing, C. H. E. N., et al. "Microstructure, porosity and mechanical properties of selective laser melted AlSi10Mg." Chinese Journal of Aeronautics 33.7 (2020): 2043-2054. [CrossRef]
  25. Rakesh, Ch Srinivasa, et al. "Effect of build atmosphere on the mechanical properties of AlSi10Mg produced by selective laser melting." Materials Today: Proceedings 5.9 (2018): 17231-17238. [CrossRef]
  26. Praneeth, Jammula, Sriram Venkatesh, and L. Sivarama Krishna. "Process parameters influence on mechanical properties of AlSi10Mg by SLM." Materials Today: Proceedings (2023). [CrossRef]
  27. Aboulkhair, Nesma T., et al. "Reducing porosity in AlSi10Mg parts processed by selective laser melting." Additive manufacturing 1 (2014): 77-86. [CrossRef]
  28. Limbasiya, Nandita, et al. "A comprehensive review on the effect of process parameters and post-process treatments on microstructure and mechanical properties of selective laser melting of AlSi10Mg." Journal of Materials Research and Technology (2022). [CrossRef]
  29. Maleki, Erfan, Sara Bagherifard, and Mario Guagliano. "Correlation of residual stress, hardness and surface roughness with crack initiation and fatigue strength of surface treated additive manufactured AlSi10Mg: Experimental and machine learning approaches." Journal of Materials Research and Technology 24 (2023): 3265-3283. [CrossRef]
  30. Majeed, Arfan, et al. "Surface quality improvement by parameters analysis, optimization and heat treatment of AlSi10Mg parts manufactured by SLM additive manufacturing." International Journal of Lightweight Materials and Manufacture 2.4 (2019): 288-295. [CrossRef]
  31. Wei, Pei, et al. "The AlSi10Mg samples produced by selective laser melting: single track, densification, microstructure and mechanical behavior." Applied surface science 408 (2017): 38-50. [CrossRef]
  32. Ammar, H. R., A. M. Samuel, and F. H. Samuel. "Porosity and the fatigue behavior of hypoeutectic and hypereutectic aluminum–silicon casting alloys." International journal of Fatigue 30.6 (2008): 1024-1035. [CrossRef]
  33. Yu, Wenhui, et al. "Influence of re-melting on surface roughness and porosity of AlSi10Mg parts fabricated by selective laser melting." Journal of Alloys and Compounds 792 (2019): 574-581. [CrossRef]
  34. Yang, Tao, et al. "Effect of processing parameters on overhanging surface roughness during laser powder bed fusion of AlSi10Mg." Journal of Manufacturing Processes 61 (2021): 440-453. [CrossRef]
  35. Boschetto, Alberto, Luana Bottini, and Francesco Veniali. "Roughness modeling of AlSi10Mg parts fabricated by selective laser melting." Journal of Materials Processing Technology 241 (2017): 154-163. [CrossRef]
  36. Yang, Tao, et al. "The influence of process parameters on vertical surface roughness of the AlSi10Mg parts fabricated by selective laser melting." Journal of Materials Processing Technology 266 (2019): 26-36. [CrossRef]
  37. Read, Noriko, et al. "Selective laser melting of AlSi10Mg alloy: Process optimisation and mechanical properties development." Materials & Design (1980-2015) 65 (2015): 417-424. [CrossRef]
  38. Wang, Lin-zhi, Sen Wang, and Jiao-jiao Wu. "Experimental investigation on densification behavior and surface roughness of AlSi10Mg powders produced by selective laser melting." Optics & Laser Technology 96 (2017): 88-96. [CrossRef]
  39. Han, Xuesong, et al. "Investigation on selective laser melting AlSi10Mg cellular lattice strut: Molten pool morphology, surface roughness and dimensional accuracy." Materials 11.3 (2018): 392. [CrossRef]
  40. Li, Bao-Qiang, et al. "Research on surface roughness of AlSi10Mg parts fabricated by laser powder bed fusion." Metals 8.7 (2018): 524. [CrossRef]
  41. Zyguła, Krystian, et al. "Mechanical properties and microstructure of AlSi10Mg alloy obtained by casting and SLM technique." World Scientific News 104 (2018): 456-466.
  42. Maleki, Erfan, Sara Bagherifard, and Mario Guagliano. "Correlation of residual stress, hardness and surface roughness with crack initiation and fatigue strength of surface treated additive manufactured AlSi10Mg: Experimental and machine learning approaches." Journal of Materials Research and Technology 24 (2023): 3265-3283. [CrossRef]
  43. Schneller, Wolfgang, et al. "Effect of post treatment on the microstructure, surface roughness and residual stress regarding the fatigue strength of selectively laser melted AlSi10Mg structures." Journal of Manufacturing and Materials Processing 3.4 (2019): 89. [CrossRef]
  44. Yadroitsev, I.; Bertrand, Ph.; Antonenkova, G.; Grigoriev, S.; Smurov, I. Use of track/layer morphology to develop functional parts by selectivelaser melting. J. Laser Appl. 2013, 25, 052003 (Publons 55). [Google Scholar] [CrossRef]
  45. Trevisan, Francesco, et al. "On the selective laser melting (SLM) of the AlSi10Mg alloy: process, microstructure, and mechanical properties." Materials 10.1 (2017): 76. [CrossRef]
  46. Aboulkhair, Nesma T., et al. "The microstructure and mechanical properties of selectively laser melted AlSi10Mg: The effect of a conventional T6-like heat treatment." Materials Science and Engineering: A 667 (2016): 139-146. [CrossRef]
  47. Patakham, U., et al. "MPB characteristics and Si morphologies on mechanical properties and fracture behavior of SLM AlSi10Mg." Materials Science and Engineering: A 821 (2021): 141602. [CrossRef]
  48. E.V. Shelekhov, T.A. Sviridova. Programs for X-rayanalysis of polycrystals, Metal Sci. Heat Treat. 42 (2000)309–313. 2000. [Google Scholar]
  49. S. Grazulis, D.S. Grazulis, D. Chateigner. Crystallography open database an open-accesscollection of crystal structures, J. Appl. Cryst. 2009; 42 (2009), 726–729. [Google Scholar]
  50. Kashyap, Anil, ed. Dynamic stochastic models from empirical data. Academic Press, 1976.
  51. Shapiro, S.S.; Wilk, M.B. An analysis of variance test for normality. Biom. Trust 1965, 52, 591–611. [Google Scholar] [CrossRef]
  52. D'Agostino, Ralph B.; Pearson, E. S. (1973). "Tests for Departure from Normality. Empirical Results for the Distributions of b2 and √b1". Biometrika. 60 (3): 613–622.
  53. Kolmogorov, A.N. Sulla determinazione empirica di une legge di distribuzione. G. Ist. Ital. Attuari 1933, 4, 83–91. [Google Scholar]
  54. W. Anderson, On the Distribution of the Two-Sample Cramer-von Mises Criterion// Ann. Math. Statist. 33(3): 1148-1159 (September, 1962).
  55. Smirnov, A.; Nikitin, N.; Peretyagin, P.; Khmyrov, R.; Kuznetsova, E.; Solis Pinargote, N.W. Experimental and Statistical Modeling for Effect of Nozzle Diameter, Filling Pattern, and Layer Height of FDM-Printed Ceramic–Polymer Green Body on Biaxial Flexural Strength of Sintered Alumina Ceramic. J. Compos. Sci. 2023, 7, 381. [Google Scholar] [CrossRef]
  56. Skorodumov, S.V.; Neganov, D.A.; Studenov, E.P.; Poshibaev, P.V.; Nikitin, N.Y. Statistical analysis of mechanical test results for samples of pipes from trunk oil pipelines after long-term operation. Industr. Lab. Diagn. Mater. 2022, 88, 82–91. [Google Scholar] [CrossRef]
  57. Kruskal, W.H.; Wallis, W.A. Use of ranks in one-criterion variance analysis. J. Am. Stat. Assoc. 1952, 47, 583–621. [Google Scholar] [CrossRef]
  58. Mann, Henry B., and Donald R. Whitney. "On a test of whether one of two random variables is stochastically larger than the other." The annals of mathematical statistics (1947): 50-60.
  59. Bannykh, I.O. , Sevostyanov M.A., Prutskov M.E. Investigation of heat treatment effect on mechanical properties and structure of high-nitrogen austenitic steel 02Kh20AG10N4MFB. Russian Metallurgy (Metally) volume 4(2016), pp. 39-44.
  60. Benstock, Daniel, and Frederic Cegla. "Extreme value analysis (EVA) of inspection data and its uncertainties." Ndt & E international 87 (2017): 68-77.
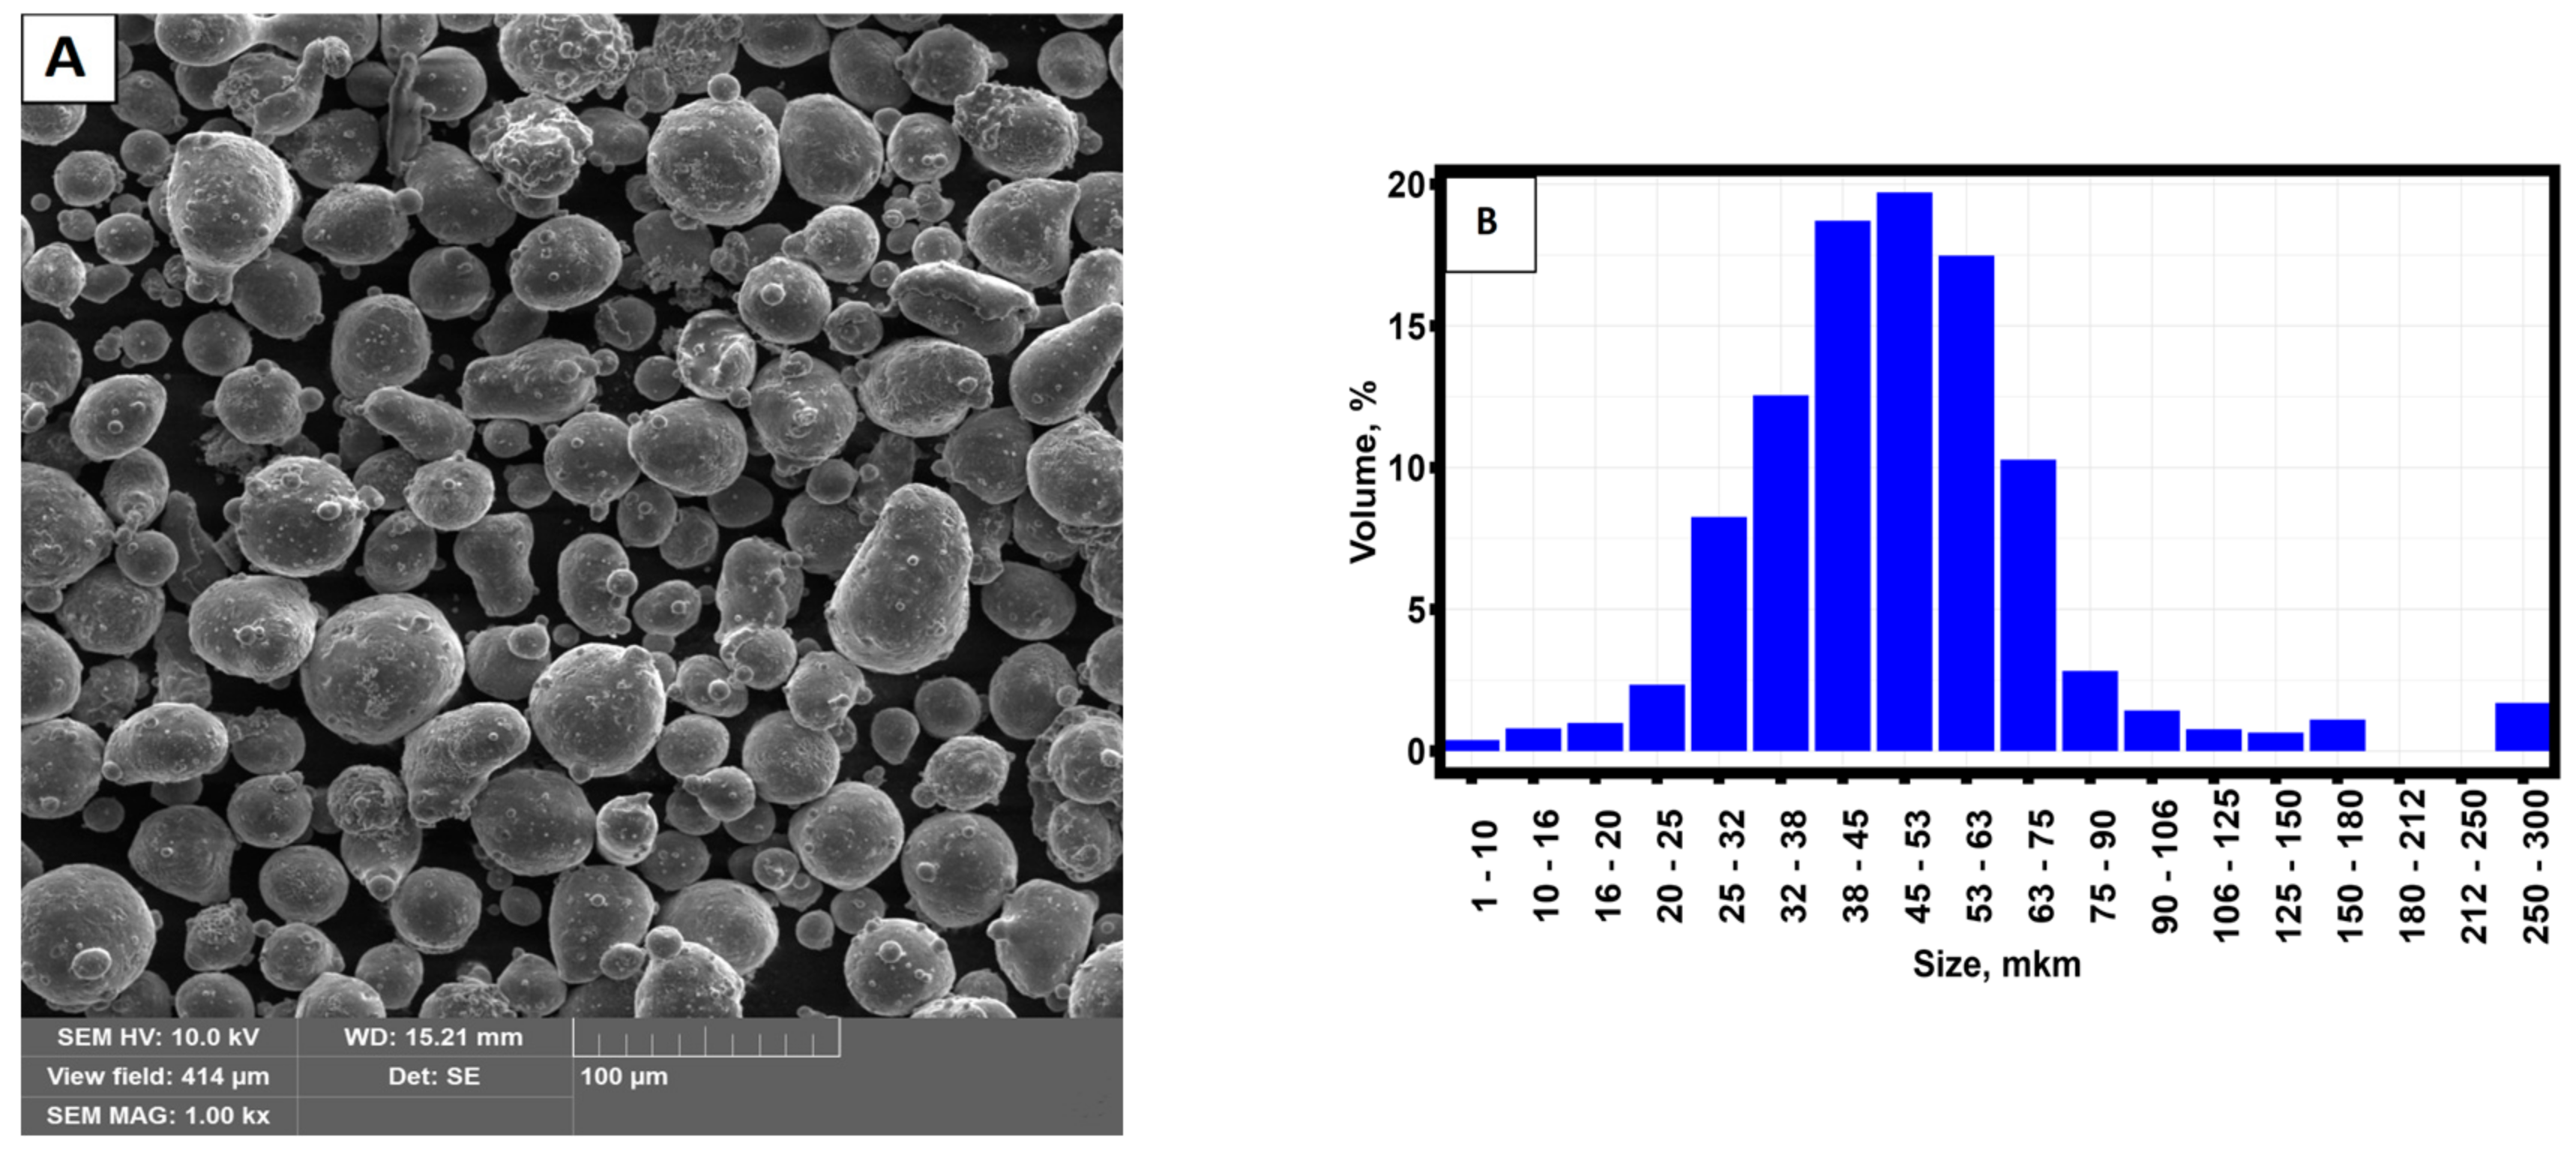
Figure 1. (A) SEM image of the initial AlSi10Mg powder. (B) Particle size distribution.
Preprints 88150 g001
Figure 2. Schematic parameters of the sample made by selective laser melting method (A), its location on the table during printing (B) and samples made by selective laser melting method (C).
Preprints 88150 g002
Figure 3. Surface profile for six unannealed samples. (A) sample No 1; (B) sample No 2; (C) sample No 3; (D) sample No 4; (E) sample No 5; (F) sample No 6.
Preprints 88150 g003aPreprints 88150 g003b
Figure 4. Tensile diagrams of thin-walled samples obtained by selective laser melting technology from AlSi10Mg material with different annealing temperatures. a) without annealing; b) annealing at 260 °C; c) annealing at 290 °C; d) annealing at 320 °C; e) annealing at 350 °C; f) annealing at 380 °C; g) annealing at 410 °C; h) annealing at 440 °C.
Preprints 88150 g004aPreprints 88150 g004b
Figure 5. Dependence of the average power of a statistical criterion as a function of the number of trials for four statistical criteria and seven different distributions. (A) Cauchy distribution; (B) exponential distribution; (C) Gumbel distribution; (D) log-normal distribution; (E) logistic distribution; (F) Normal distribution; (G) Weibull distribution.
Preprints 88150 g005
Figure 6. Dependence of yield strength on surface roughness parameters at different annealing temperatures of samples. (a) from Ra; (b) from Rz; (c) from Rmax.
Preprints 88150 g006aPreprints 88150 g006b
Figure 7. Dependence of average values of strength and yield strengths (A), strains corresponding to strength and yield strength (B) and strain hardening on aging temperature of samples (C) obtained by selective laser melting technology from AlSi10Mg material.
Preprints 88150 g007
Figure 8. Dependence of strain corresponding to yield strength on (A) Rz, (B) Rmax and regression models describing the dependence of correlated values.
Preprints 88150 g008
Figure 9. Autocorrelation functions of minima and maxima of the surface roughness profile. a) ACF minima of sample No 4 aging at 440 °C; b) ACF maxima of sample No 4 aging at 440 °C; c) ACF minima of sample No 3 aging at 380 °C; d) ACF minima of sample No 3 aging at 380 °C.
Preprints 88150 g009
Table 1. Average chemical composition of AlSi10Mg powder.
Elements Al Si Mg O
Composition (wt %) 88.1850 9.9550 0.3275 1.5325
Table 2. Surface roughness of samples produced by selective laser melting technology from AlSi10Mg.
No samples Annealing temperature, °С Ra, µm Rz, µm Rmax, µm
1 20 4,208 33,040 41,141
2 20 5,996 49,628 63,651
3 20 7,340 54,939 93,837
4 20 6,569 44,376 47,602
5 20 4,939 44,248 52,086
6 20 5,773 42,879 48,261
1 260 6,578 40,366 47,733
2 260 5,568 46,201 50,272
3 260 7,009 53,217 69,349
4 260 6,175 57,088 67,814
5 260 5,188 41,231 63,253
6 260 6,616 42,818 55,988
1 290 6,227 43,522 56,607
2 290 4,890 43,501 62,743
3 290 6,042 48,215 59,128
4 290 5,632 43,301 63,093
5 290 5,307 38,282 56,144
6 290 6,106 47,990 61,618
1 320 5,258 45,442 59,432
2 320 5,509 40,011 50,797
3 320 5,137 40,503 49,863
4 320 5,704 47,719 54,580
5 320 6,063 45,255 54,490
6 320 4,721 41,693 59,186
1 350 4,949 33,899 47,363
2 350 4,340 38,783 46,409
3 350 5,909 39,543 47,841
4 350 7,470 48,722 62,929
5 350 5,351 43,755 47,505
6 350 6,051 45,896 62,821
1 380 5,147 44,567 58,023
2 380 5,685 45,664 58,818
3 380 5,858 41,558 50,893
4 380 5,859 44,367 53,910
5 380 5,977 46,287 57,900
6 380 6,354 42,925 59,778
1 410 4,659 33,058 36,935
2 410 5,223 38,778 49,032
3 410 6,045 44,076 51,182
4 410 4,886 39,830 64,734
5 410 6,471 43,348 55,387
6 410 5,874 44,498 51,197
1 440 5,773 42,879 48,261
2 440 5,245 38,904 56,476
3 440 5,261 44,417 56,988
4 440 5,688 38,412 47,601
5 440 7,698 50,192 59,783
6 440 5,668 39,901 57,787
Table 3. Basic statistical analysis of the results of surface roughness measurements of 48 samples manufactured by selective laser melting technology from AlSi10Mg.
Statistical parameter Annealing temperature, °С Ra, µm Rz, µm Rmax, µm
Mean value, µm 20 5.804 44.852 57.763
Median, µm 5.885 44.312 50.174
Standard deviation, µm 1.121 7.329 19.173
Maximum value, µm 7.34 54.939 93.837
Minimum value, µm 4.208 33.04 41.141
Mean value, µm 260 6.189 46.820 59.068
Median, µm 6.377 44.510 59.621
Standard deviation, µm 0.692 6.865 9.111
Maximum value, µm 7.009 57.088 69.349
Minimum value, µm 5.188 40.366 47.733
Mean value, µm 290 5.701 44.135 59.889
Median, µm 5.837 43.511 60.373
Standard deviation, µm 0.524 3.667 3.059
Maximum value, µm 6.227 48.215 63.093
Minimum value, µm 4.89 38.282 56.144
Mean value, µm 320 5.399 43.437 54.725
Median, µm 5.384 43.474 54.535
Standard deviation, µm 0.468 3.132 4.030
Maximum value, µm 6.063 47.719 59.432
Minimum value, µm 4.721 40.011 49.863
Mean value, µm 350 5.678 41.766 52.478
Median, µm 5.63 41.649 47.673
Standard deviation, µm 1.080 5.388 8.068
Maximum value, µm 7.47 48.722 62.929
Minimum value, µm 4.34 33.899 46.409
Mean value, µm 380 5.813 44.228 56.554
Median, µm 5.859 44.467 57.962
Standard deviation, µm 0.396 1.747 3.421
Maximum value, µm 6.354 46.287 59.778
Minimum value, µm 5.147 41.558 50.893
Mean value, µm 410 5.526 40.598 51.411
Median, µm 5.549 41.589 51.190
Standard deviation, µm 0.712 4.373 9.040
Maximum value, µm 6.471 44.498 64.734
Minimum value, µm 4.659 33.058 36.935
Mean value, µm 440 5.889 42.451 54.483
Median, µm 5.678 41.39 56.732
Standard deviation, µm 0.915 4.458 5.202
Maximum value, µm 7.698 50.192 59.783
Minimum value, µm 5.245 38.412 47.601
Table 4. Basic mechanical properties of samples obtained by selective laser melting from AlSi10Mg material.
No samples Annealing temperature, °С σ0.2, MPa σU, MPa ε0.2,% εU,%
1 20 191.948 308.964 1.173 4.998
2 20 198.216 310.750 1.129 4.478
3 20 194.706 313.314 0.936 4.406
4 20 192.044 314.810 0.928 4.988
5 20 198.825 326.616 1.057 5.222
6 20 200.728 327.219 0.824 4.653
1 260 245.334 328.600 1.036 3.136
2 260 245.452 334.828 1.308 3.919
3 260 247.062 328.213 1.095 3.261
4 260 252.070 321.049 1.169 2.735
5 260 248.233 327.996 1.095 3.170
6 260 253.389 334.916 0.996 2.981
1 290 257.103 333.964 1.383 3.406
2 290 254.805 334.178 0.986 2.791
3 290 257.494 341.998 0.912 2.903
4 290 247.495 328.838 0.922 2.879
5 290 237.288 316.883 0.931 3.025
6 290 253.389 322.998 0.996 2.862
1 320 207.151 294.796 0.869 3.175
2 320 208.406 293.716 0.868 3.074
3 320 204.945 296.520 0.888 3.706
4 320 206.205 298.721 0.862 3.776
5 320 209.819 298.073 0.845 3.136
6 320 208.615 301.139 0.805 3.343
1 350 197.684 283.684 0.749 2.640
2 350 188.093 288.349 0.631 3.194
3 350 204.146 301.434 0.831 3.839
4 350 203.145 288.471 0.975 3.559
5 350 193.197 294.468 0.715 3.710
6 350 198.387 293.003 0.875 3.666
1 380 154.363 235.000 0.789 3.926
2 380 151.798 238.317 0.632 3.744
3 380 153.899 236.487 0.743 3.759
4 380 149.531 235.273 0.647 3.821
5 380 157.501 239.803 0.829 4.186
6 380 149.708 239.161 0.618 3.865
1 410 113.933 186.648 0.543 5.369
2 410 122.491 201.566 0.563 5.230
3 410 115.744 190.155 0.479 4.499
4 410 113.202 186.602 0.504 5.130
5 410 113.399 190.513 0.486 6.981
6 410 115.118 191.084 0.534 6.101
1 440 104.216 164.398 0.600 6.432
2 440 104.979 164.362 0.567 6.293
3 440 107.472 169.422 0.632 7.125
4 440 109.452 173.549 0.516 6.747
5 440 109.941 173.112 0.562 6.346
6 440 106.627 167.986 0.635 6.415
Table 5. Basic statistical analysis of tensile test results of 48 specimens fabricated by selective laser melting technology from AlSi10Mg.
Statistical parameter Annealing temperature, °С σ0.2, MPa σU, MPa ε0.2,% εU,%
Mean value 20 196.078 316.946 1.008 4.791
Median 196.461 314.062 0.996 4.821
Standard deviation 3.713 7.986 0.134 0.326
Maximum value 200.728 327.219 1.173 5.222
Minimum value 191.948 308.964 0.824 4.406
Mean value 260 248.590 329.267 1.117 3.200
Median 247.648 328.407 1.095 3.153
Standard deviation 3.407 5.168 0.111 0.397
Maximum value 253.389 334.916 1.308 3.919
Minimum value 245.333 321.049 0.996 2.735
Mean value 290 251.262 329.810 1.021 2.978
Median 254.097 331.401 0.958 2.891
Standard deviation 7.739 8.937 0.181 0.223
Maximum value 257.494 341.998 1.383 3.406
Minimum value 237.288 316.883 0.911 2.791
Mean value 320 207.524 297.161 0.856 3.368
Median 207.779 297.297 0.865 3.259
Standard deviation 1.776 2.719 0.029 0.303
Maximum value 209.819 301.139 0.888 3.776
Minimum value 204.945 293.716 0.805 3.074
Mean value 350 197.442 291.568 0.796 3.434
Median 198.035 290.737 0.790 3.612
Standard deviation 6.064 6.163 0.123 0.447
Maximum value 204.146 301.434 0.975 3.839
Minimum value 188.093 283.684 0.631 2.640
Mean value 380 152.800 237.340 0.710 3.884
Median 152.849 237.402 0.695 3.843
Standard deviation 3.066 2.040 0.090 0.163
Maximum value 157.501 239.803 0.829 4.186
Minimum value 149.531 235 0.618 3.744
Mean value 410 115.648 191.095 0.518 5.552
Median 114.525 190.334 0.519 5.300
Standard deviation 3.496 5.492 0.034 0.868
Maximum value 122.491 201.566 0.563 6.981
Minimum value 113.202 186.602 0.479 4.499
Mean value 440 107.115 168.805 0.585 6.560
Median 107.050 168.704 0.584 6.424
Standard deviation 2.314 4.032 0.046 0.319
Maximum value 109.941 173.549 0.635 7.125
Minimum value 104.216 164.362 0.516 6.293
Table 6. Closest distribution types according to the minimum of Akaike and Bayesian criteria.
Physical parameter Closest type of distribution
σ0.2 [MPa] Weibull
σU [MPa] Weibull
ε0.2,% Weibull
εU,% Weibull
Ra, µm Log-normal
Rz, µm Logistical
Rmax, µm Logistical
Table 7. Results of testing whether the data in Table 2 and Table 4 belong to a normal distribution.
Kolmogorov - Smirnov statistics σ0.2, MPa σU, MPa ε0.2,% εU,% Ra, µm Rz, µm Rmax, µm
D 1 1 0.68409 0.99585 0.99999 1 1
p-value < 2.2✕ 10-16 8,9✕ 10-16 < 2.2✕ 10-16 8,9✕ 10-16 < 2.2✕ 10-16 < 2.2✕ 10-16 < 2.2✕ 10-16
Table 8. Results of applying the Kruskal-Wallis criterion to the data given in Table 2 and Table 4 in the study of the influence of annealing temperature on mechanical properties and surface roughness characteristics.
Investigated quantity Statistical significance level by Kruskal-Wallis test
σ0,2 [MPa] 1.18✕10-7
σU [MPa] 1.44✕10-7
ε0,2,% 9.89✕10-7
εU,% 9.95✕10-7
Ra, µm 0.72
Rz, µm 0.67
Rmax, µm 0.43
Table 9. Results of the analysis of statistical differences in groups of samples aged at different temperatures.
Annealing temperature pairs Results of applying the Mann-Whitney criterion for mechanical properties of samples
σ0.2, MPa σU, MPa ε0.2,% εU,%
20 – 260 0.002165 0.008658 0.3095 0.002165
20 – 290 0.002165 0.02597 0.8182 0.002165
20 – 350 0.6991 0.002165 0.04113 0.002165
260 – 290 0.1994 0.9372 0.07765 0.3095
260 – 320 0.002165 0.002165 0.002165 0.3939
260 – 350 0.002165 0.002165 0.002165 0.3939
290 – 350 0.002165 0.002165 0.01515 0.09307
320 – 350 0.002165 0.09307 0.3939 0.5887
350 – 380 0.002165 0.002165 0.2403 0.01515
Table 10. Results of Kendall correlation analysis between the main mechanical properties and surface roughness parameters of the samples obtained by selective laser melting technology from AlSi10Mg material.
Pairs examined for correlation Kendall correlation coefficient Statistical significance level Determination coefficient, %
σ0.2 – Ra 0.2822 0.3282 --
σU – Ra 0.1073171 0.2822 --
ε0,2,% - Ra 0.1259982 0.2069 --
εU, % - Ra 0.09760426 0.3282 --
σ0.2 – Rz 0.1774623 0.07545 --
σU – Rz 0.1676275 0.09298 --
ε0,2,% - Rz 0.2342502 0.01894 5.5
εU, % - Rz -0.06829269 0.4937 --
σ0.2 – Rmax 0.1792369 0.07257 --
σU – Rmax 0.1268293 0.2037 --
ε0.2,% - Rmax 0.2040816 0.04091 4.2
εU, % - Rmax -0.1764967 0.07693 --
Table 11. Equations describing a weak correlation between the strain corresponding to yield strength and surface roughness parameters.
Correlation values Equations Standard deviation
ε0,2 Rz ε 0,2 = 0.0406 + 0.0178 R z 0.1812
Rmax ε 0,2 = 0.0033 + 0.1090 R m a x 2 0.2347
Disclaimer/Publisher’s Note: The statements, opinions and data contained in all publications are solely those of the individual author(s) and contributor(s) and not of MDPI and/or the editor(s). MDPI and/or the editor(s) disclaim responsibility for any injury to people or property resulting from any ideas, methods, instructions or products referred to in the content.
Copyright: This open access article is published under a Creative Commons CC BY 4.0 license, which permit the free download, distribution, and reuse, provided that the author and preprint are cited in any reuse.
Prerpints.org logo

Preprints.org is a free preprint server supported by MDPI in Basel, Switzerland.

Subscribe

© 2024 MDPI (Basel, Switzerland) unless otherwise stated