Submitted:
19 October 2023
Posted:
20 October 2023
You are already at the latest version
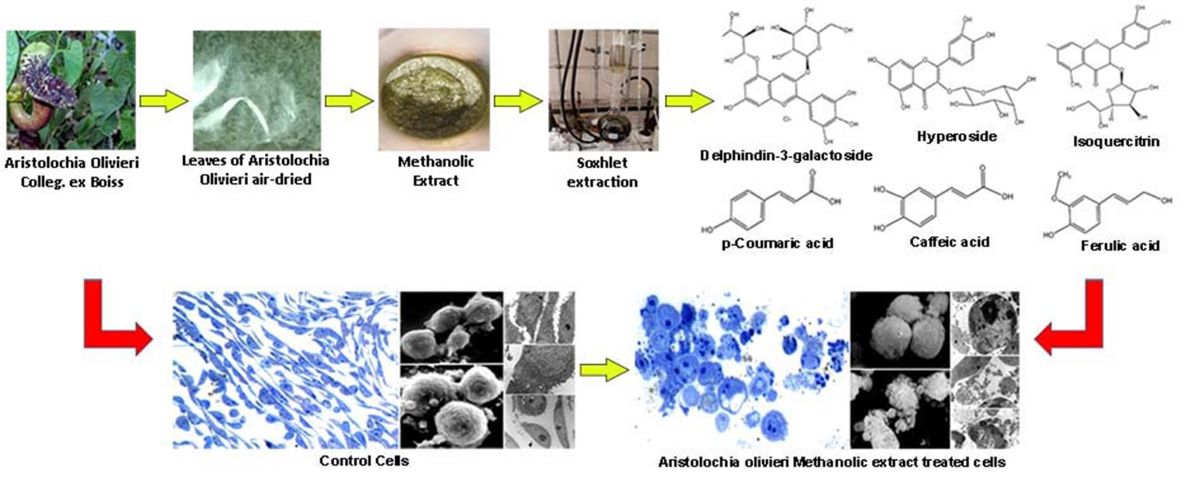
Abstract
Keywords:
1. Introduction
2. Material and Methods
2.1. Plant Material
2.2. Preparation of Extract
2.3. Reagents and Standards
2.4. Analytical Characterization of AOME
2.5. HPLC-ESI-MS/MS
2.6. Cell Culture and Treatments
2.7. Trypan Blue Dye Exclusion Assay
2.8. Cell Proliferation Assay
2.9. SEM
2.10. TEM
2.11. Antibacterial Activity
3. Results
3.1. AOME Chemical Characterization.
3.2. Antibacterial Activity
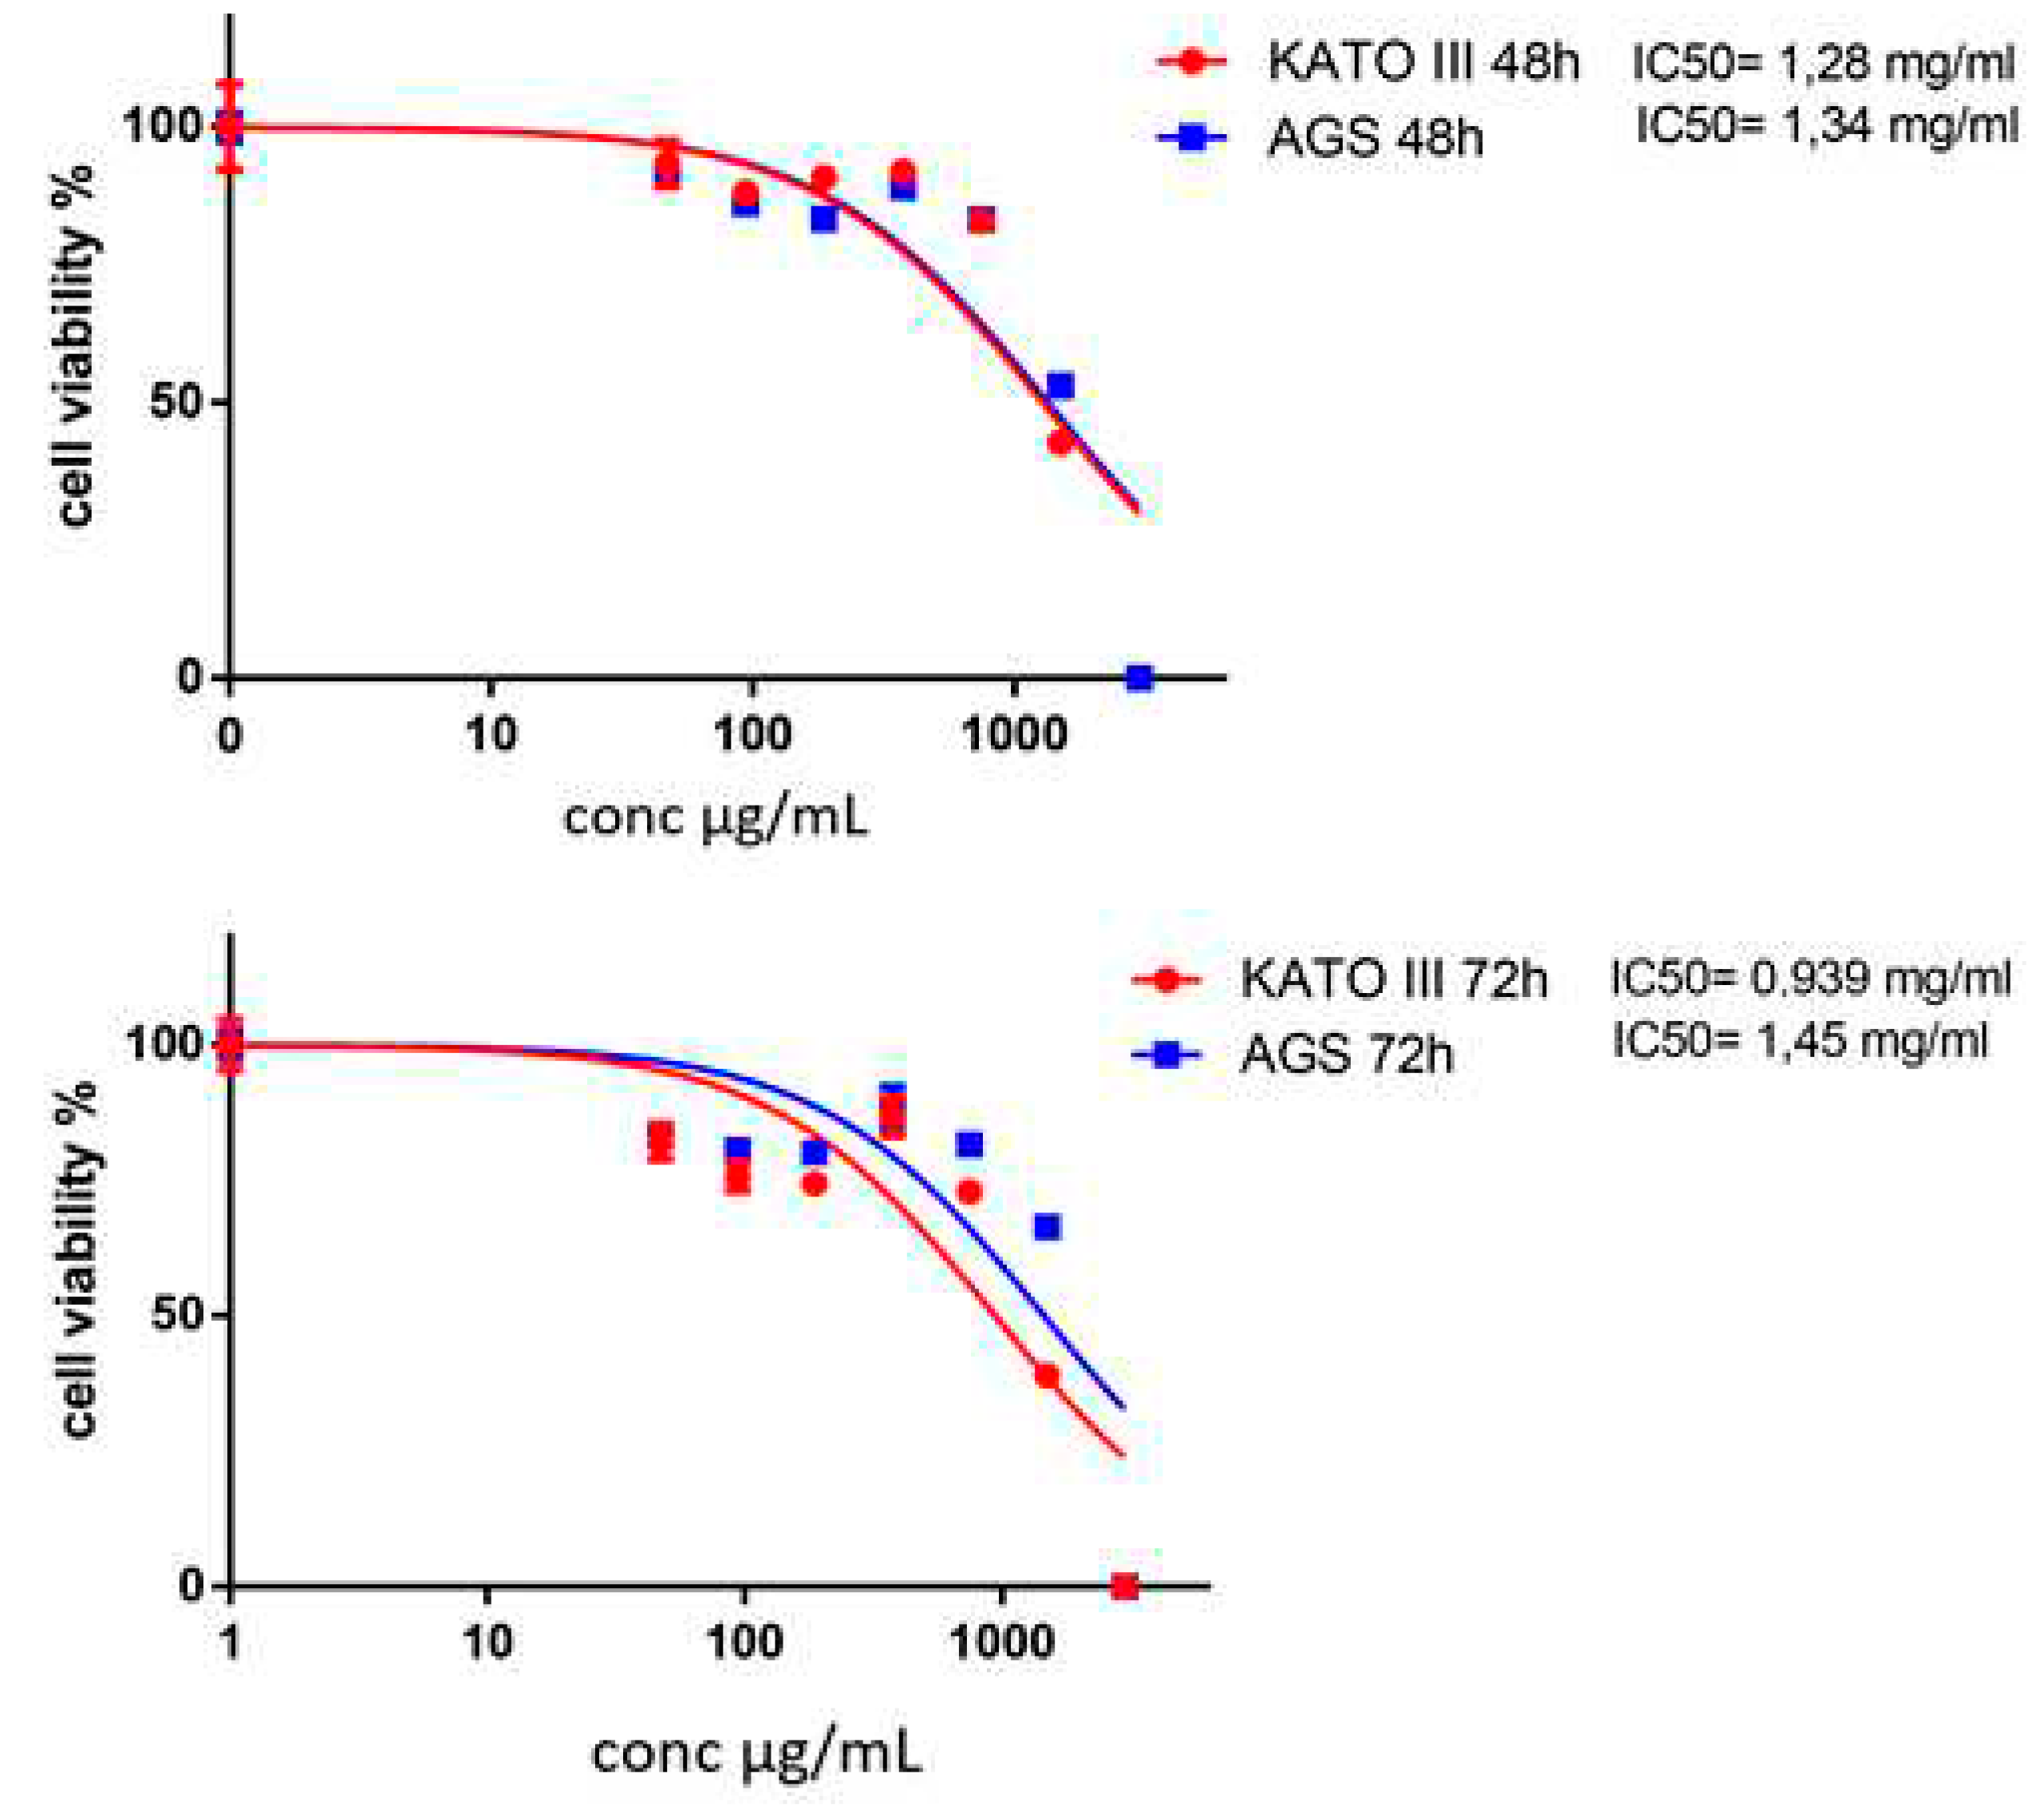
3.3. The Antineoplastic Properties
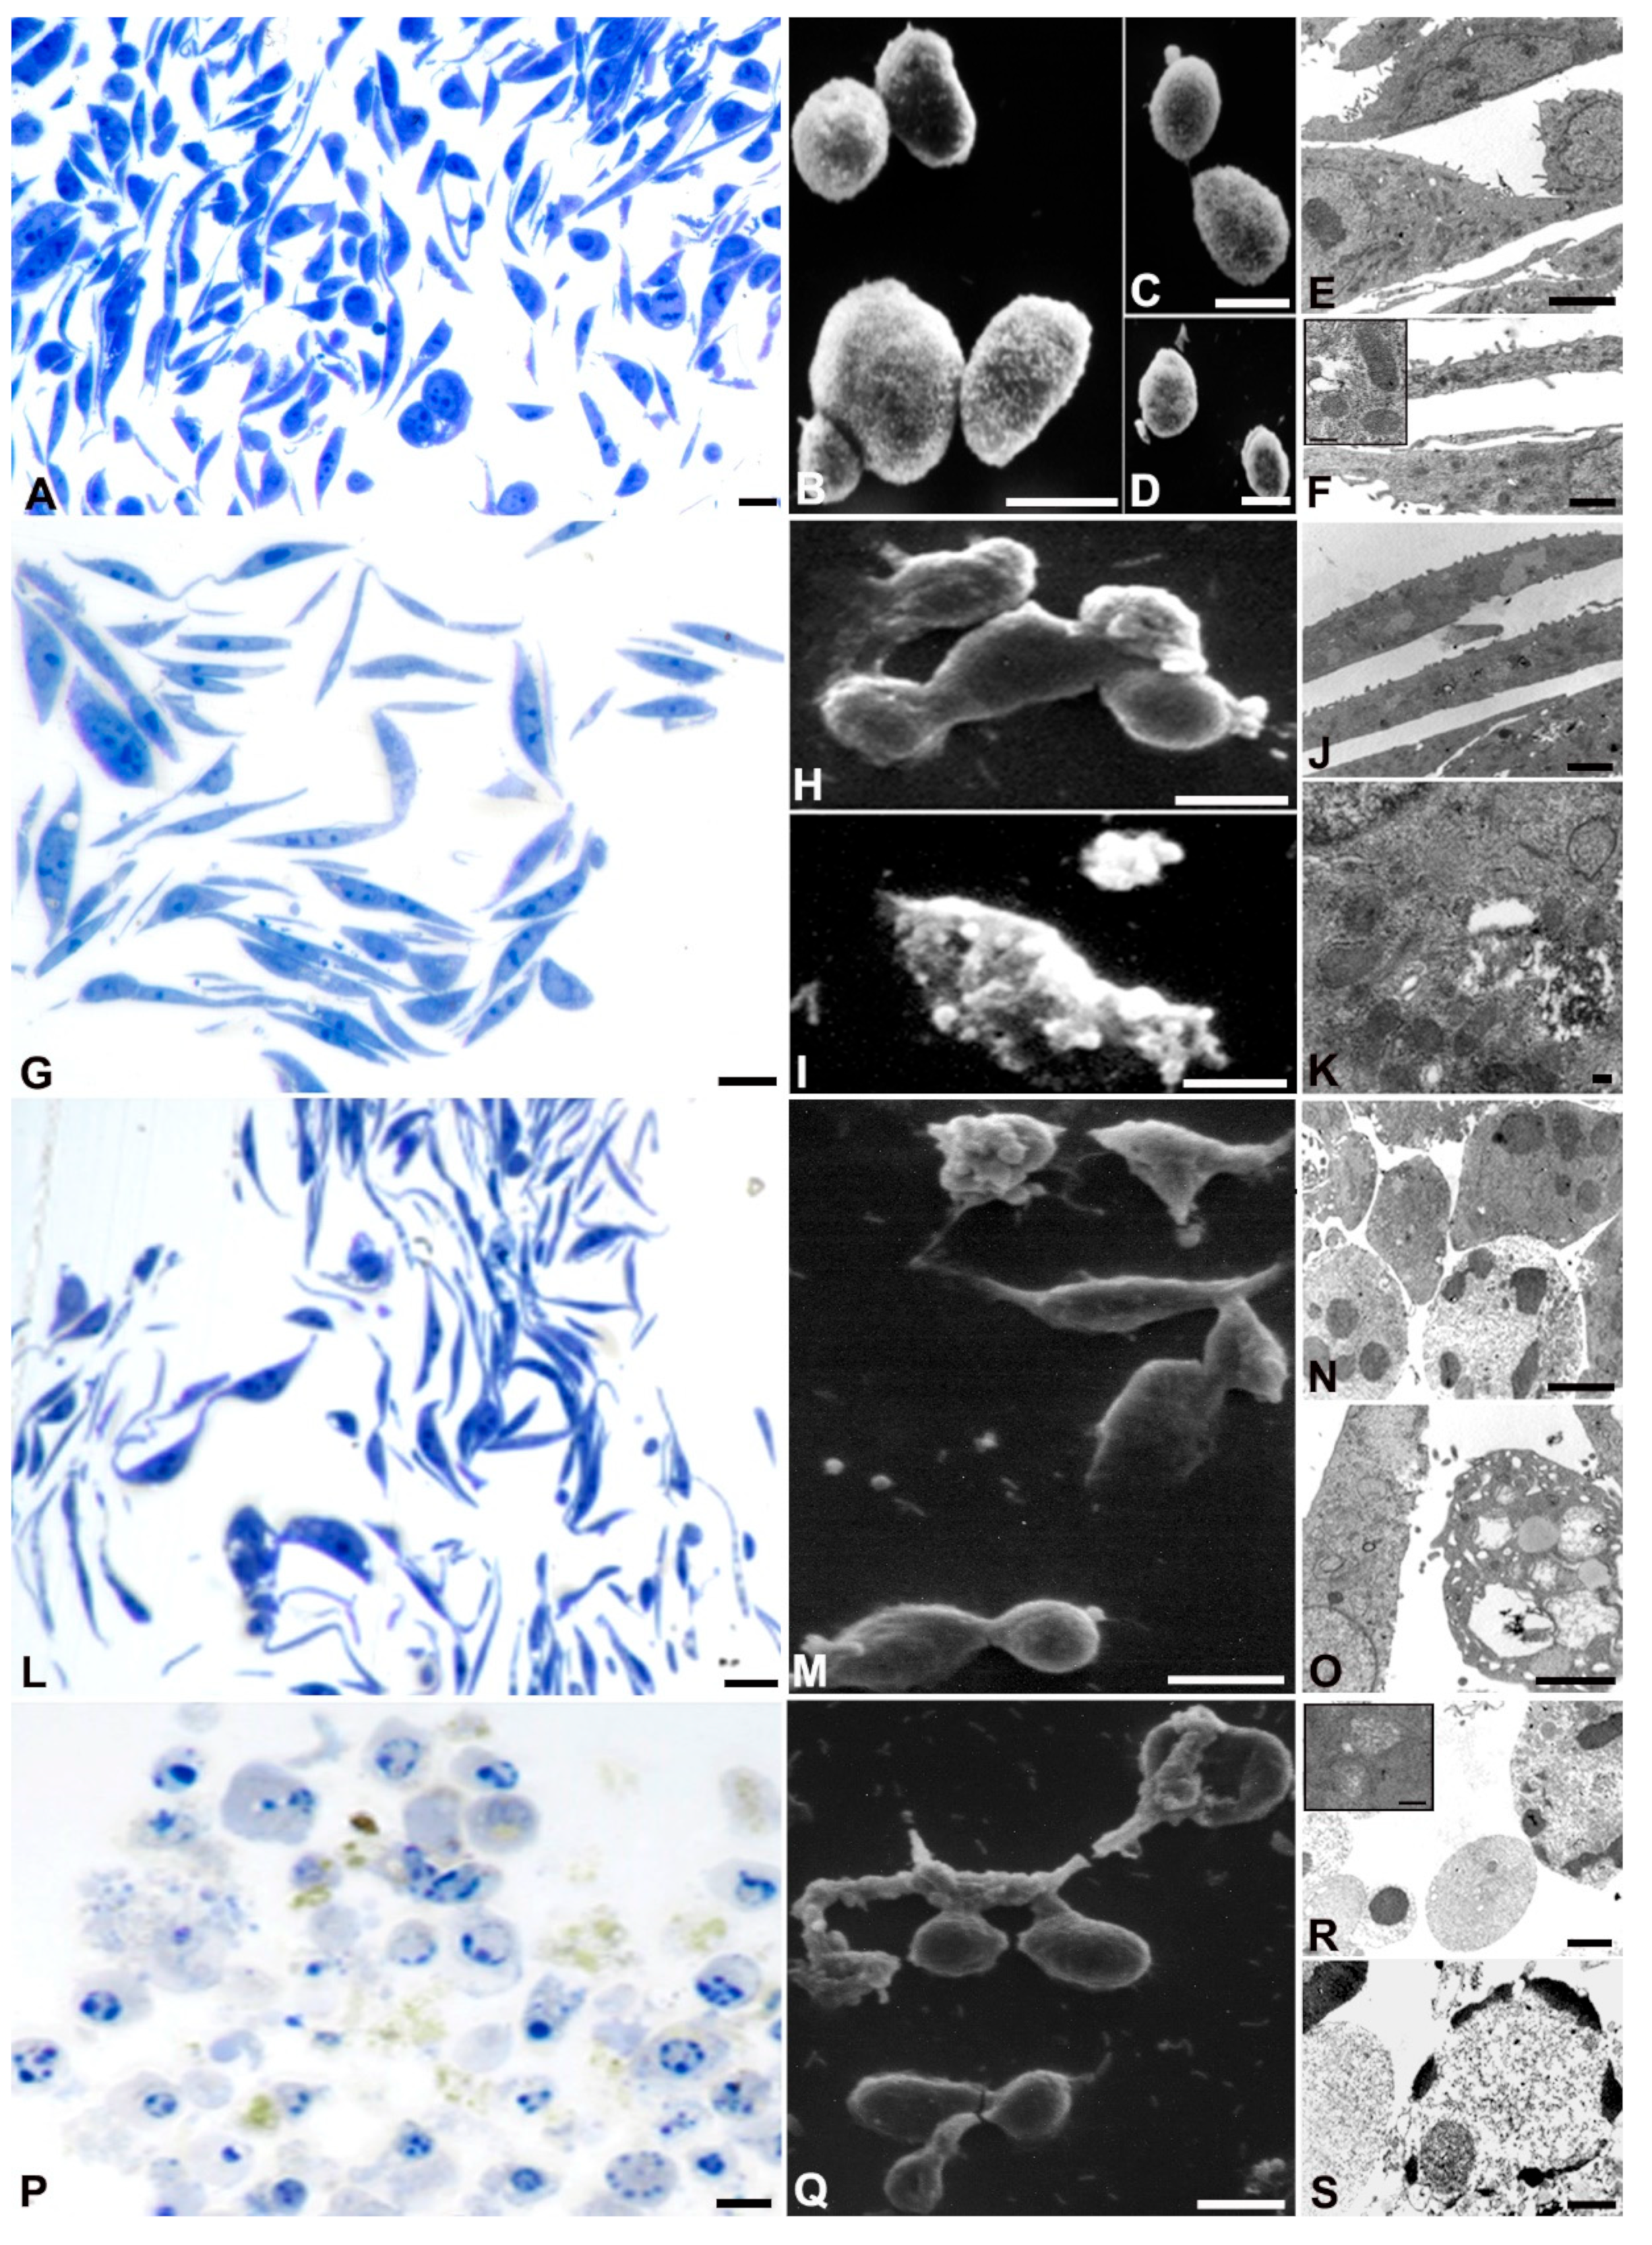
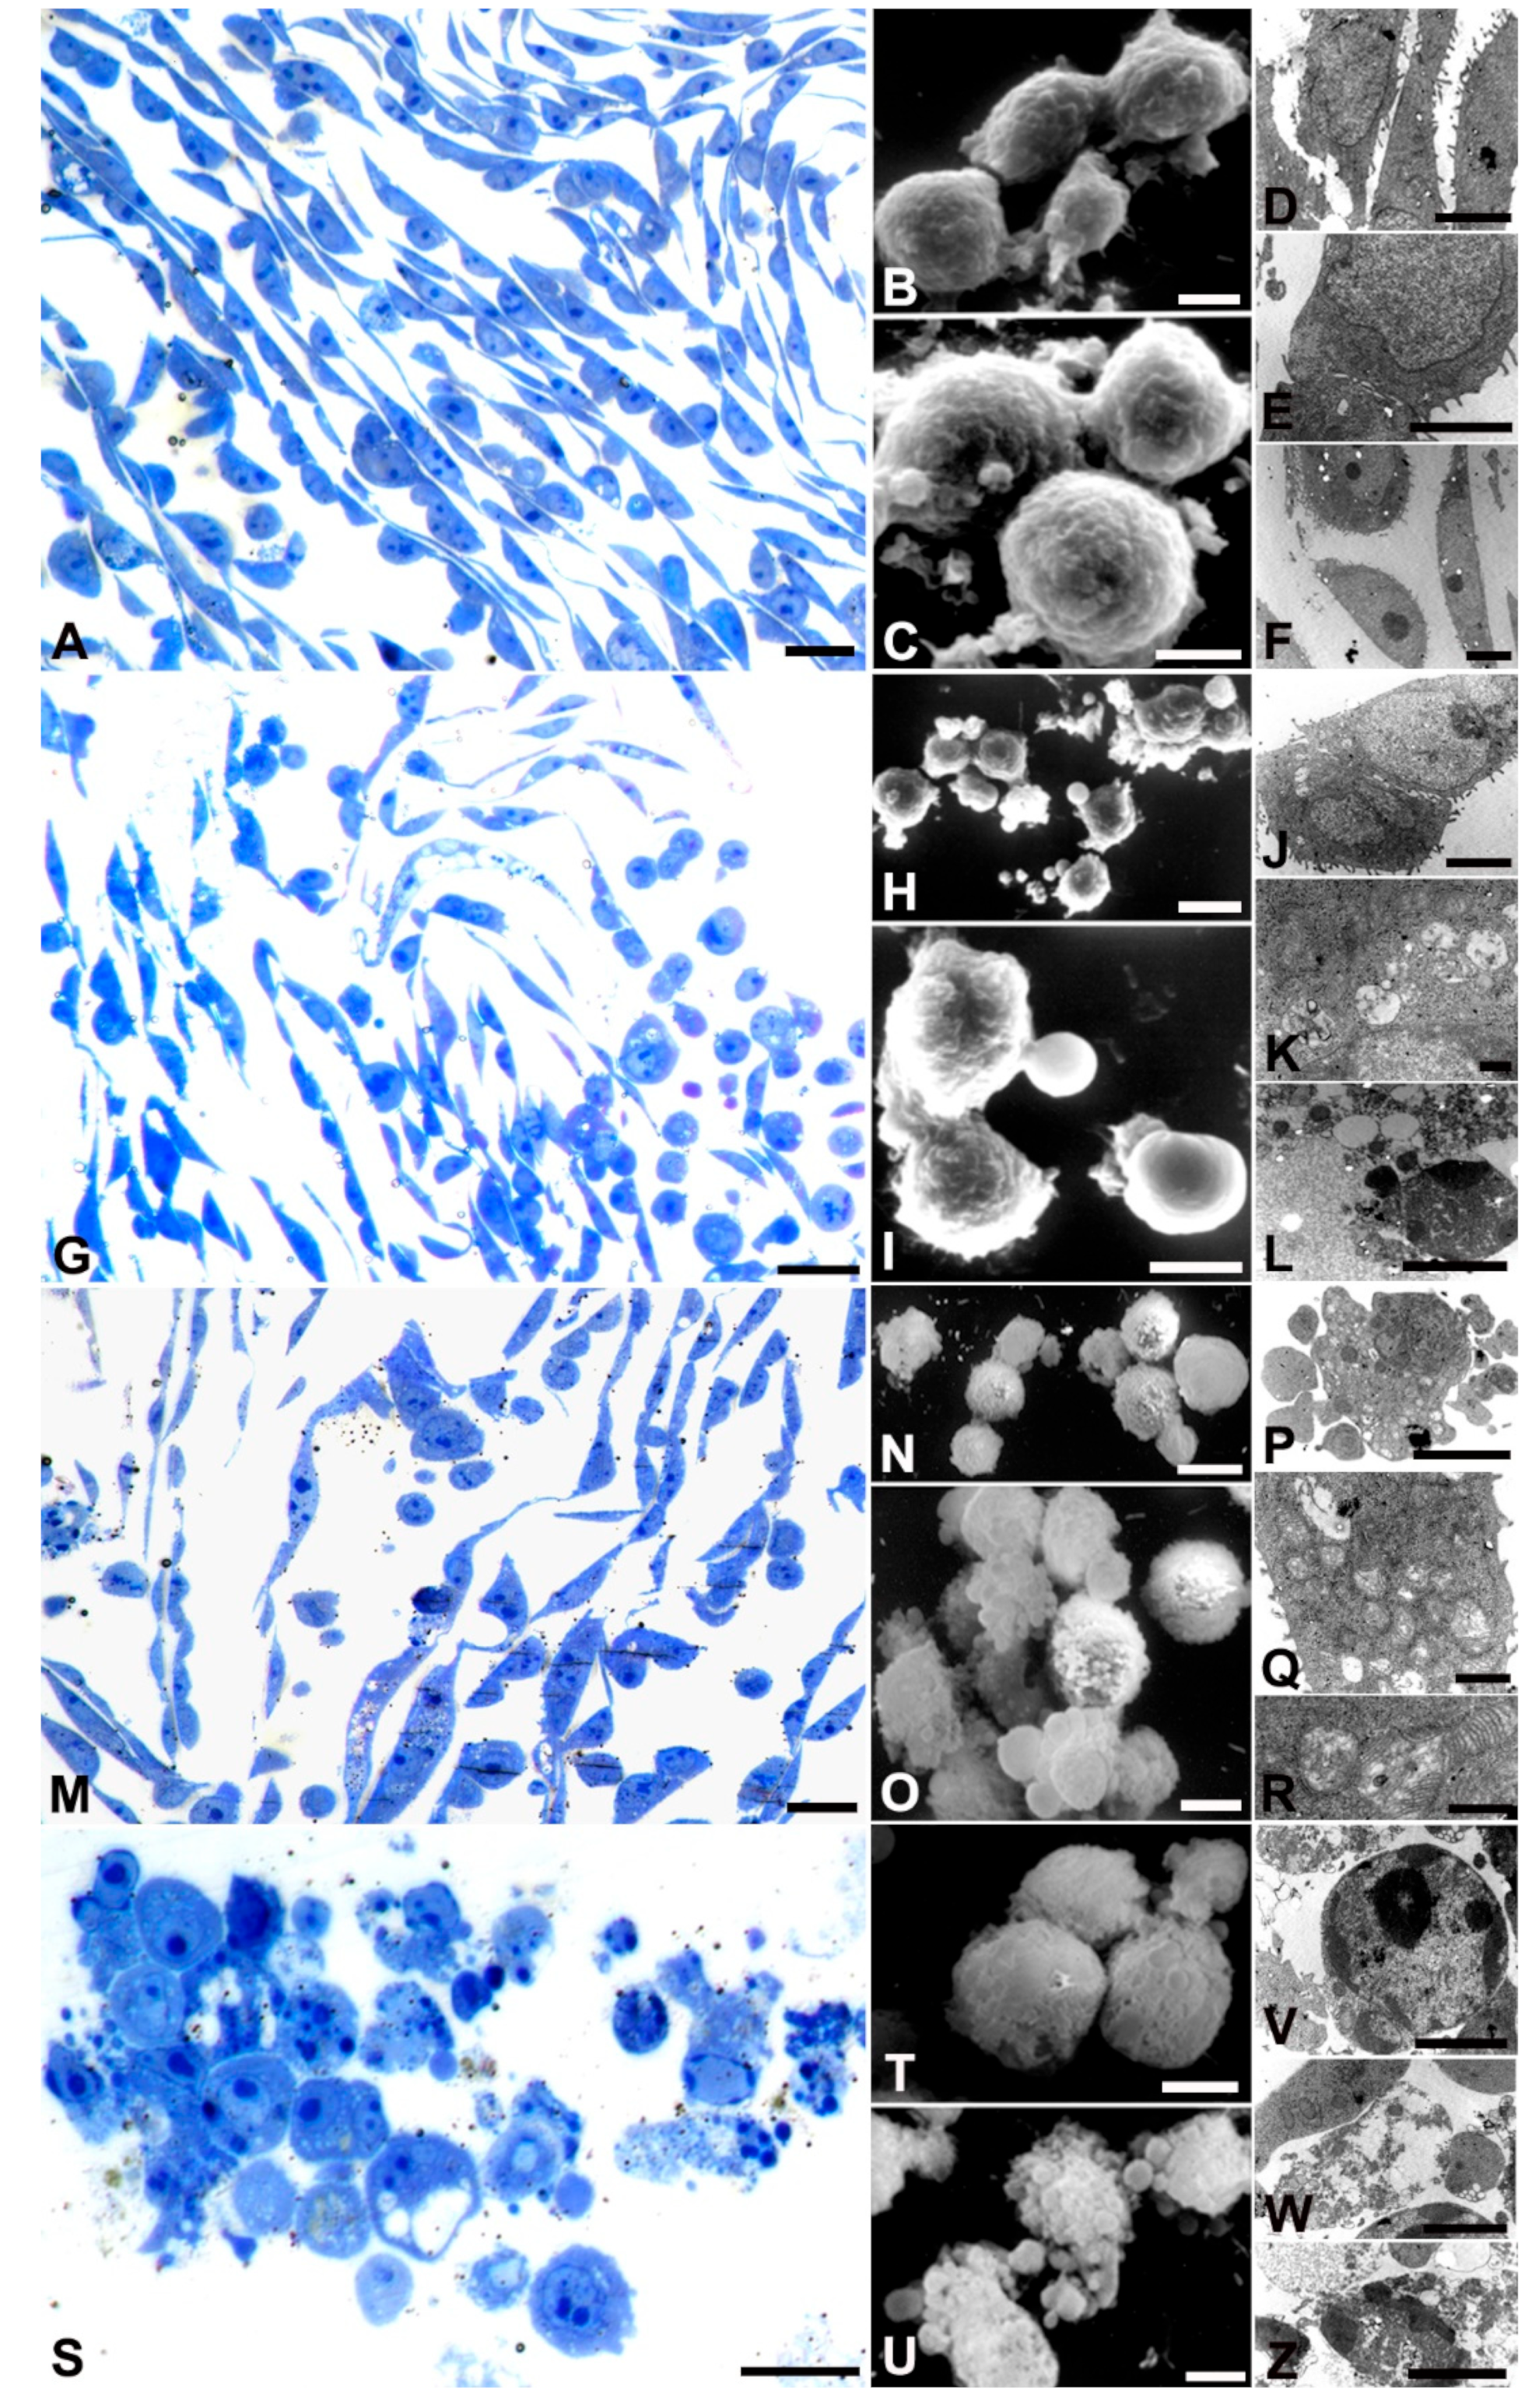
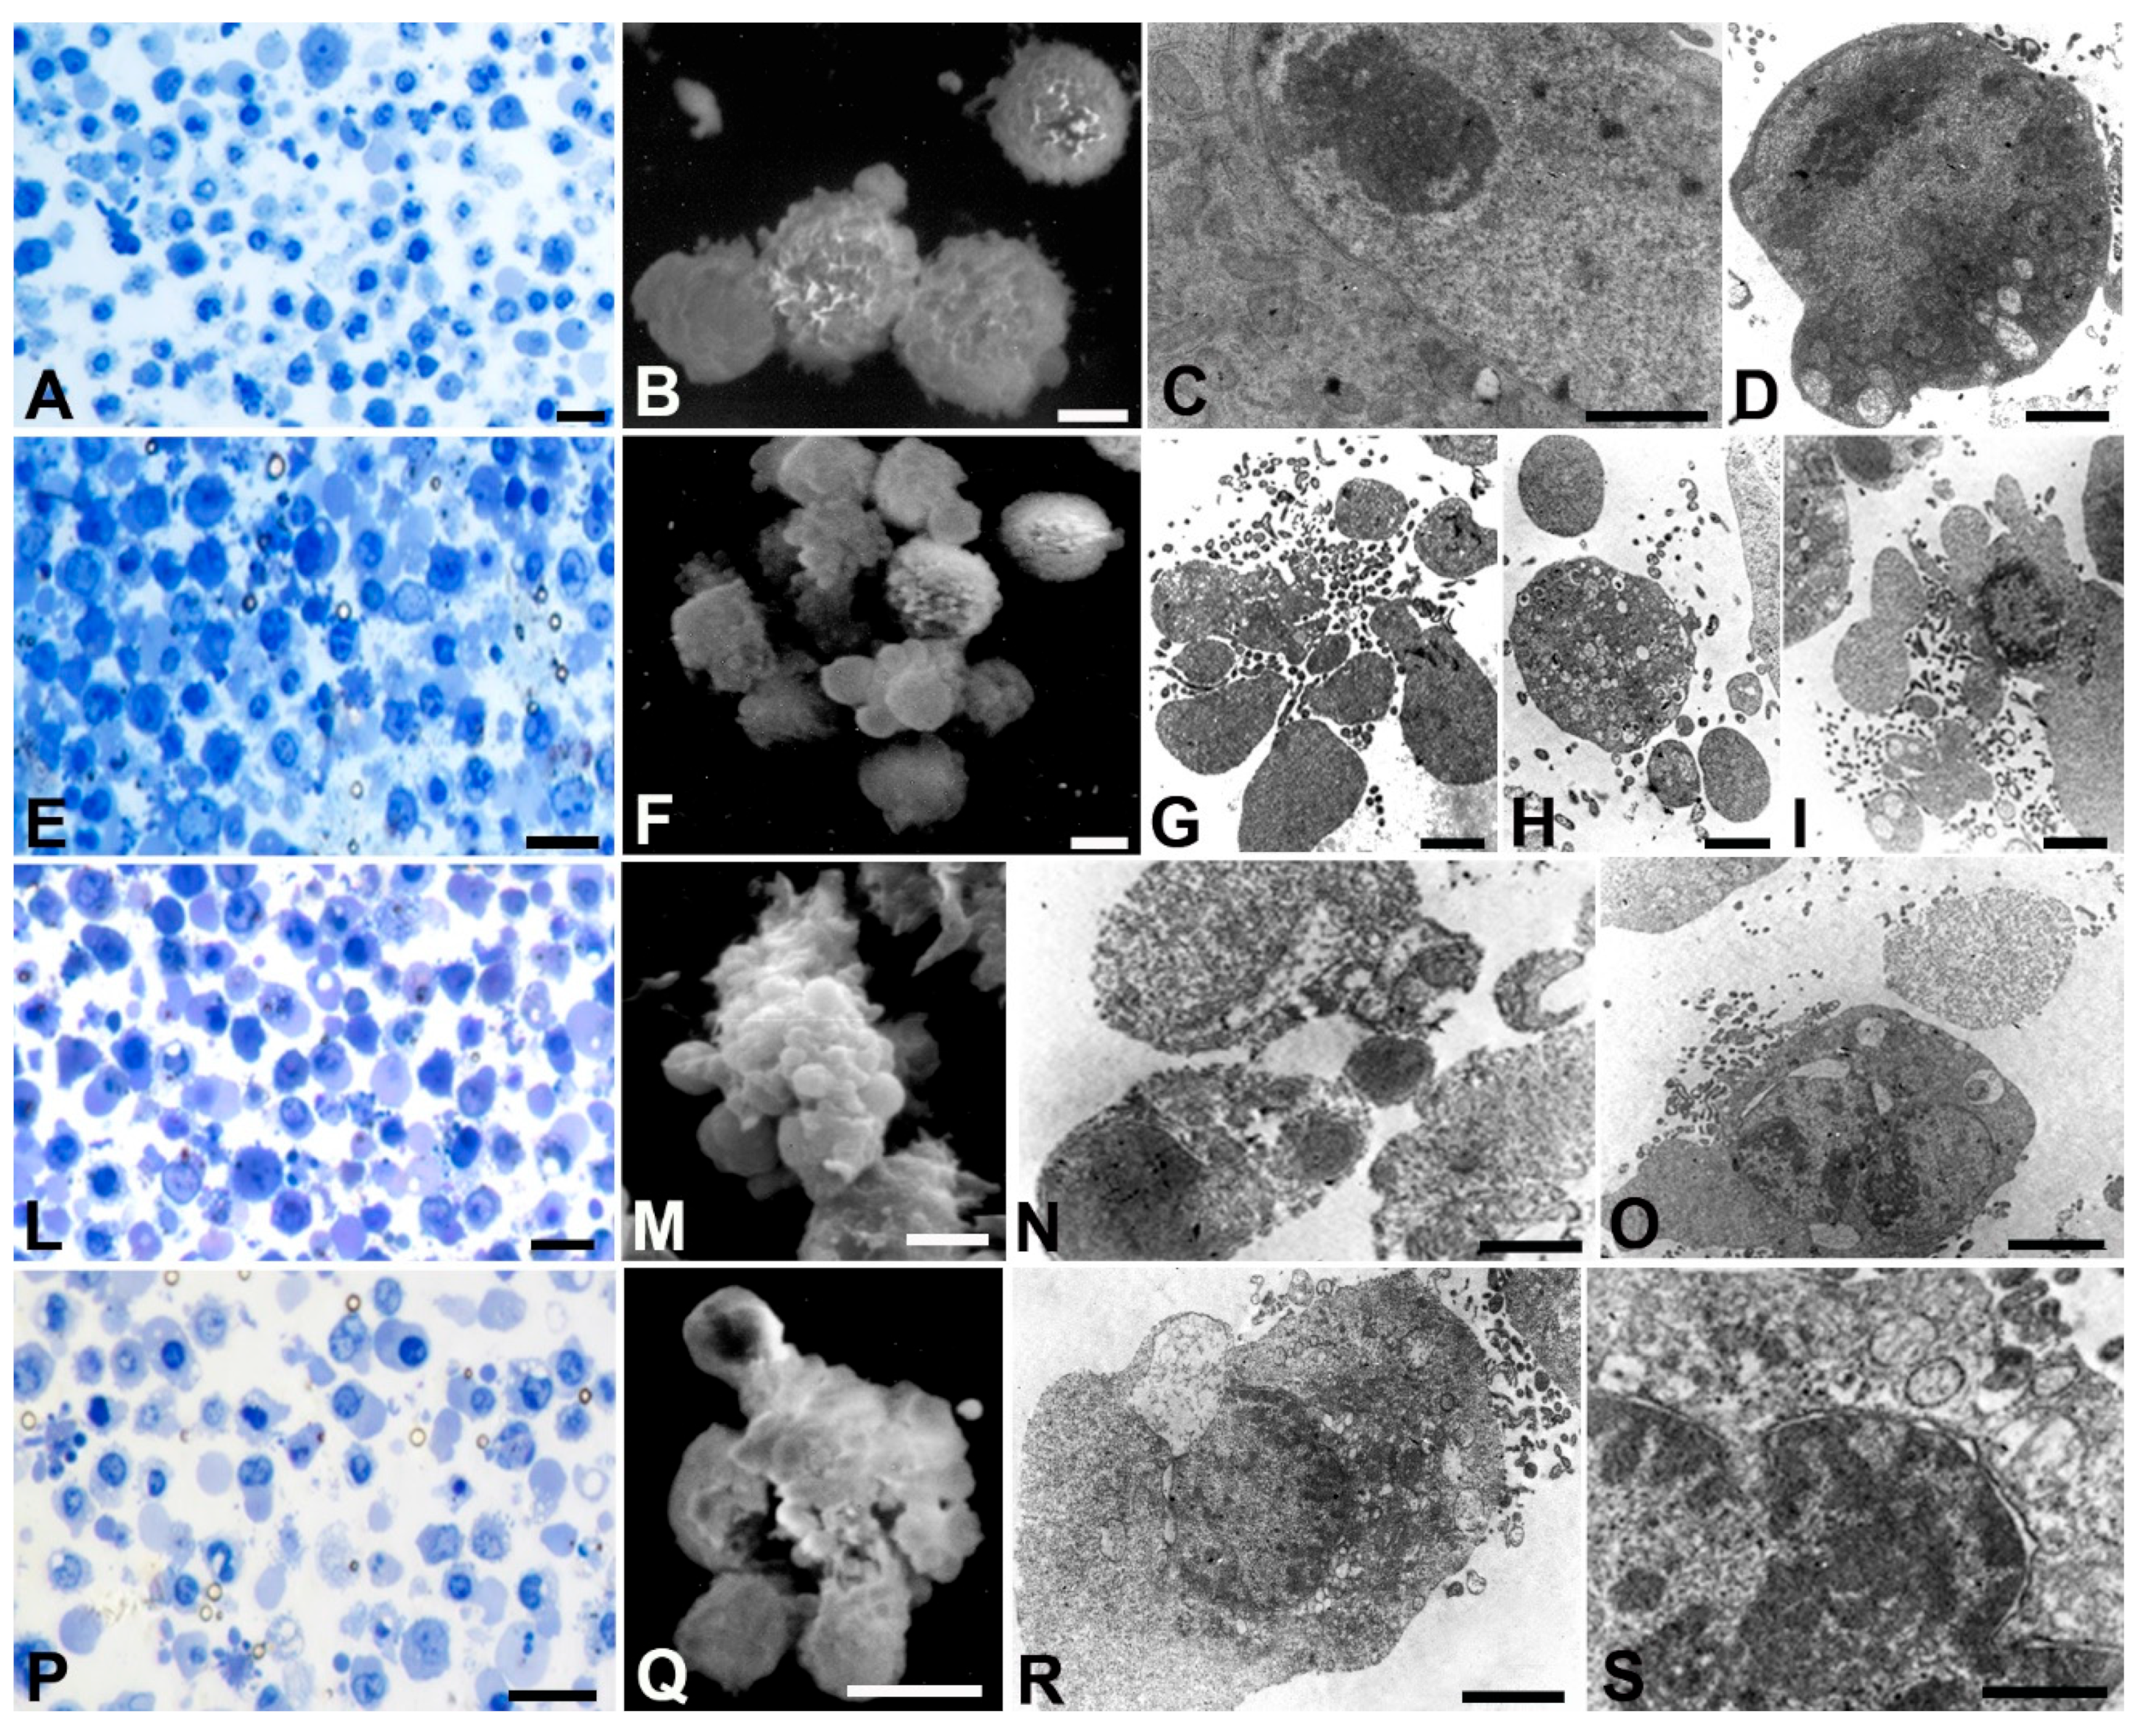
3.4. Ultrastructural Analyses
4. Discussion
Author Contributions
Data Availability Statement
Acknowledgments
Conflicts of Interest
Abbreviations
References
- Nagtegaal, I. D.; Odze, R. D.; Klimstra, D.; Paradis, V.; Rugge, M.; Schirmacher, P.; Washington, K. M.; Carneiro, F.; Cree, I. A. WHO Classification of Tumours Editorial Board. The 2019 WHO classification of tumours of the digestive system. Histopathology. 2020, 76, 182–188. [Google Scholar] [CrossRef]
- Sung, H.; Ferlay, J.; Siegel, R.L.; Laversanne, M.; Soerjomataram, I.; Jemal, A.; Bray, F. Global Cancer Statistics 2020: GLOBOCAN Estimates of Incidence and Mortality Worldwide for 36 Cancers in 185 Countries. CA Cancer J. Clin. 2021, 71, 209–249. [Google Scholar] [CrossRef] [PubMed]
- Donida, B. M.; Tomasello, G.; Ghidini, M.; Buffoli, F.; Grassi, M.; Liguigli, W.; Maglietta, G.; Pergola, L.; Ratti, M. , Sabadini, G.; Toppo, L.; Ungari, M.; Passalacqua, R. Epidemiological, clinical and pathological characteristics of gastric neoplasms in the province of Cremona: the experience of the first population-based specialized gastric cancer registry in Italy. BMC cancer. 2019, 19, 212. [Google Scholar] [CrossRef]
- Cavatorta, O.; Scida, S.; Miraglia, C.; Barchi, A.; Nouvenne, A.; Leandro, G.; Meschi, T.; De' Angelis, G. L.; Di Mario, F. Epidemiology of gastric cancer and risk factors. Acta bio-medica: Atenei Parmensis. 2018, 89, 82–87. [Google Scholar] [PubMed]
- Yang, L.; Ying, X.; Liu, S.; Lyu, G.; Xu, Z.; Zhang, X.; Li, H.; Li, Q.; Wang, N.; Ji, J. Gastric cancer: Epidemiology, risk factors and prevention strategies. Chinese journal of cancer research = Chung-kuo yen cheng yen chiu, 2020, 32, 695–704. [Google Scholar] [CrossRef]
- Farinati, F.; Cardin, R.; Cassaro, M.; Bortolami, M.; Nitti, D.; Tieppo, C.; Zaninotto, G.; Rugge, M. Helicobacter pylori, inflammation, oxidative damage and gastric cancer: a morphological, biological and molecular pathway. European journal of cancer prevention: the official journal of the European Cancer Prevention Organisation (ECP), 2008, 17, 195–200. [Google Scholar] [CrossRef]
- Wagner, A. D.; Syn, N. L.; Moehler, M.; Grothe, W.; Yong, W. P.; Tai, B. C.; Ho, J.; Unverzagt, S. Chemotherapy for advanced gastric cancer. Cochrane Database Syst. Rev. 2017, 8, CD004064. [Google Scholar] [CrossRef]
- Chiaino, E.; Micucci, M.; Cosconati, S.; Novellino, E.; Budriesi, R.; Chiarini, A.; Frosini, M. Olive Leaves and Hibiscus Flowers Extracts-Based Preparation Protect Brain from Oxidative Stress-Induced Injury. Antioxidants (Basel, Switzerland), 2020, 9, 806. [Google Scholar] [CrossRef]
- Lin, H.H.; Huang, H.P.; Huang, C.C.; Chen, J.H.; Wang, CJ. Hibiscus polyphenol-rich extract induces apoptosis in human gastric carcinoma cells via p53 phosphorylation and p38 MAPK/FasL cascade pathway. Mol. Carcinog. 2005, 43, 86–99. [Google Scholar] [CrossRef]
- Micucci, M.; Malaguti, M. , Toschi, T. G., Di Lecce, G., Aldini, R., Angeletti, A., Chiarini, A., Budriesi, R., Hrelia, S., 2015, Cardiac and Vascular Synergic Protective Effect of Olea europea L. Leaves and Hibiscus sabdariffa L. Flower Extracts. Oxidative Med. Cell. Longev. 2015, 318125. [Google Scholar]
- Chiaino, E. , Micucci, M.; Durante, M.; Budriesi, R.; Gotti, R.; Marzetti, C.; Chiarini, A.; Frosini, M., Apoptotic-Induced Effects of Acacia Catechu Willd. Extract in Human Colon Cancer Cells. Int. J. Mol. Sci. 2020, 21, 2102. [Google Scholar] [CrossRef] [PubMed]
- Sheng, L.; Yang, Y.; Zhang, Y.; Li, N. Chemical constituents of Patrinia heterophylla Bunge and selective cytotoxicity against six human tumor cells. J Ethnopharmacol. 2019, 236, 129–135. [Google Scholar] [CrossRef] [PubMed]
- Li, M. , Zheng, Y.; Zhao, J., Liu, M., Shu, X., Li, Q., Wang, Y, Eds.; Zhou, Y. Polyphenol Mechanisms against Gastric Cancer and Their Interactions with Gut Microbiota: A Review. Current oncology 2022. (Toronto, Ont.) 29, 5247–5261. [Google Scholar]
- Fagundes, M.A.; Silva, A.R.C.; Fernandes, G.A.; Curado, M.P. Dietary Polyphenol Intake and Gastric Cancer: A Systematic Review and Meta-Analysis. Cancers (Basel). 2022, 14, 5878. [Google Scholar] [CrossRef] [PubMed]
- Mustafa, A. M.; Angeloni, S.; Abouelenein, D.; Acquaticci, L.; Xiao, J.; Sagratini, G.; Maggi, F.; Vittori, S.; Caprioli, G. A new HPLC-MS/MS method for the simultaneous determination of 36 polyphenols in blueberry, strawberry and their commercial products and determination of antioxidant activity. Food chemistry. 2022, 367, 130743. [Google Scholar] [CrossRef] [PubMed]
- Tedaldi, G.; Molinari, C.; São José, C. , Barbosa-Matos, R.; André, A.; Danesi, R.; Arcangeli, V.; Ravegnani, M.; Saragoni, L.; Morgagni, P.; Rebuzzi, F.; Canale, M.; Pignatta, S.; Ferracci, E.; Martinelli, G.; Ranzani, G.N.; Oliveira, C.<; Calistri, D.; Ulivi, P. 2021. Genetic and Epigenetic Alterations of CDH1 Regulatory Regions in Hereditary and Sporadic Gastric Cancer. Pharmaceuticals (Basel). 2021, 14, 457. [Google Scholar]
- Salucci, S.; Bavelloni, A. ; Stella,; A. B; Fabbri, F.; Vannini, I.; Piazzi, M.; Volkava, K.; Scotlandi, K.K Martinelli, G.; Faenza, I.; Blalock, W.; 2023. The Cytotoxic Effect of Curcumin in Rhabdomyosarcoma Is Associated with the Modulation of AMPK, AKT/mTOR, STAT, and p53 Signaling. (2023). Nutrients 2023, 15, 740. [Google Scholar]
- Battistelli, M.; Salucci, S.; Guescini, M.; Curzi, D., Stocchi. Skeletal Muscle Cell Behavior After Physical Agent Treatments. Curr. Pharm. Des. 2015, 21, 3665–3672. [Google Scholar] [CrossRef]
- Clinical and Laboratory Standards Institute. Methods for Dilution Antimicrobial Susceptibility Tests for Bacteria That Grow Aerobically, 2018. 11th ed.; M07; Clinical and Laboratory Standards Institute: Wayne, PA, USA.
- Maltese, W.A.; Overmeyer, J.H. Methuosis: nonapoptotic cell death associated with vacuolization of macropinosome and endosome compartments. Am. J. Pathol. 2014, 184, 1630–42. [Google Scholar] [CrossRef] [PubMed]
- Kma, L.; Baruah, T.J. , . The interplay of ROS and the PI3K/Akt pathway in autophagy regulation. Biotechnol. Appl. Biochem 2021, 69, 248–264. [Google Scholar] [CrossRef]
- Karagoz, L.; Şenturk, M.; Sagir, T.; Karagoz, Y.; Batmax, O.S.; Burban URAS, F., 2023. Investigation of Caffeic Acid Effect on Human Cancer Cell Line and Some Enzymes, Eastern Anatolian. Journal of Science Volume IX, Issue I, 33-42.
- Ghavami, G.; Muhammadnejad, S.; Amanpour, S.; Sardari, S. Bioactivity Screening of Mulberry Leaf Extracts and two Related Flavonoids in Combination with Cisplatin on Human Gastric Adenocarcinoma Cells. Iranian journal of pharmaceutical research: IJPR, 2020, 19, 371–382. [Google Scholar]
- Shang, H. S., Lu, H. F., Lee, C. H., Chiang, H. S., Chu, Y. L., Chen, A., Lin, Y. F., Chung, J. G., 2018. Quercetin induced cell apoptosis and altered gene expression in AGS human gastric cancer cells. Environmental toxicology 33, 1168–1181.
- Zheng, L. C.; Yang, M. D.; Kuo, C. L.; Lin, C. H.; Fan, M. J.; Chou, Y. C. , Lu H. F.; Huang, W. W.; Peng, S. F. Chung, J. G. Norcantharidin-induced Apoptosis of AGS Human Gastric Cancer Cells Through Reactive Oxygen Species Production, and Caspase- and Mitochondria -dependent Signaling Pathways. Anticancer research. 2012, 36, 6031–6042. [Google Scholar] [CrossRef] [PubMed]
- Cheshomi, H.; Bahrami, A. R; Rafatpanah, H.; Matin, M. M. The effects of ellagic acid and other pomegranate (Punica granatum L.) derivatives on human gastric cancer AGS cells. Human & experimental toxicology. 2022, 41, 9603271211064534. [Google Scholar]
- Radziejewska, I.; Supruniuk, K.; Tomczyk, M.; Izdebska, W.; Borzym-Kluczyk, M.; Bielawska, A.; Bielawski, K.; Galicka, A. 2022. p-Coumaric acid, Kaempferol, Astragalin and Tiliroside Influence the Expression of Glycoforms in AGS Gastric Cancer Cells. International journal of molecular sciences. 2022, 23, 8602. [Google Scholar] [CrossRef] [PubMed]
- Tsai, C. L.; Chiu, Y. M.; Ho, T. Y; Hsieh, C. T.; Shieh, D. C.; Lee, Y. J.; Tsay, G. J., Wu. Gallic Acid Induces Apoptosis in Human Gastric Adenocarcinoma Cells. Anticancer research. 2018, 38, 2057–2067. [Google Scholar]

| No. | Compounds | Concentration mg kg-1 |
|---|---|---|
| 1 | Gallic acid | 17.07 |
| 2 | Neochlorogenic acid | 14.49 |
| 3 | Delphindin-3-galactoside | 19.85 |
| 4 | (+)-Catechin | n.d. |
| 5 | Procyanidin B2 | n.d. |
| 6 | Chlorogenic acid | 44.52 |
| 7 | p-Hydroxybenzoic acid | 725.76 |
| 8 | (-)-Epicatechin | n.d. |
| 9 | Cyanidin-3-glucoside | n.d. |
| 10 | Petunidin-3-glucoside | n.d. |
| 11 | 3-Hydroxybenzoic acid | 1160,66 |
| 12 | Caffeic acid | 9867,16 |
| 13 | Vanillic acid | n.d. |
| 14 | Resveratrol | n.d. |
| 15 | Pelargonidin-3-glucoside | n.d. |
| 16 | Pelagonidin-3-rutinoside | n.d. |
| 17 | Malvidin-3-galactoside | n.d. |
| 18 | Syringic acid | n.d. |
| 19 | Procyanidin A2 | n.d. |
| 20 | p-Coumaric acid | 9976.83 |
| 21 | Ferulic acid | 2696.19 |
| 22 | 3,5-Dicaffeoylquinic acid | n.d. |
| 23 | Rutin | 483.97 |
| 24 | Hyperoside | 2540.33 |
| 25 | Isoquercitrin | 986.27 |
| 26 | Delphindin-3,5-diglucoside | 867.66 |
| 27 | Phloridzin | 2.64 |
| 28 | Quercitrin | n.d. |
| 29 | Myricetin | n.d. |
| 30 | Naringin | n.d. |
| 31 | Kaempferol-3-glucoside | 342.52 |
| 32 | Hesperidin | n.d. |
| 33 | Ellagic acid | 428.46 |
| 34 | trans-cinnamic acid | 603.99 |
| 35 | Quercetin | 90.59 |
| 36 | Phloretin | n.d. |
| 37 | Kaempferol | 81.17 |
| 38 | Isorhamnetin | 5.73 |
| Total content | 30956.87 | |
Disclaimer/Publisher’s Note: The statements, opinions and data contained in all publications are solely those of the individual author(s) and contributor(s) and not of MDPI and/or the editor(s). MDPI and/or the editor(s) disclaim responsibility for any injury to people or property resulting from any ideas, methods, instructions or products referred to in the content. |
© 2023 by the authors. Licensee MDPI, Basel, Switzerland. This article is an open access article distributed under the terms and conditions of the Creative Commons Attribution (CC BY) license (http://creativecommons.org/licenses/by/4.0/).


