1. Introduction
Ischemic stroke (IS) secondary to stenosis or occlusion of cerebral blood-supplying arteries is an essential risk factor for disability and death in the elderly, at the meantime, the age of onset of ischemic stroke has been gradually decreasing at a younger age currently [
1,
2]. The existing therapy for it is mainly intravenous recombinant tissue plasminogen activator (rt-PA), but this still has restrictions like poor safety [
3]. Therefore, new strategies for the treatment of IS are yet to be pioneered.
Gut microbiota belongs to a series of symbiotic microorganisms located in the gastrointestinal tract of the body. There is a two-way communication channel between the nervous system and the gut, often referred to as the brain-gut axis [
4]. Increasing studies have found that the processes of neurological diseases are accompanied by the regulation of gut microbiota, including in neurodegenerative diseases ranging from Parkinson’s disease (PD) [
5]. and Alzheimer’s disease (AD) [
6]. The gut microbiota and the nervous system regulate the homeostasis of the host through direct or indirect signaling. For example, Butyrate, a metabolite of the gut microbiota, directly mediates the gut-brain axis in AD model mice to reduce microglia-associated neuroinflammation [
7]. Similarly, several research have found that the gut microbiota engaged ischemic stroke outcomes. For example, intestinal symbiotic dysregulation exacerbates IS damage by regulating effector T-cells [
8]. Fecal microbial transplantation was reported improves cognitive impairment in IS mice [
9]. However, the specific regulatory mechanisms of gut microbiota involvement in ischemic stroke remain to be determined.
Butyric acid, as a short-chain fatty acid (SCFAs), is a lipid produced by the gut microbiota through the fermentation of dietary fibers [
10]. Increasingly evidences illustrated that gut microbiota with its SCFAs metabolites (especially butyric acid) seem to be crucial signaling molecules for the crucial of the brain-gut axis. A study showed that butyrate administration improved neurotoxicity and had anti-inflammatory effects in mice on a high-fat diet [
11]. Meanwhile, Butyrate administration is proved to exert beneficial effects by reducing neuronal mitochondrial damage and oxidative stress in a mouse model of epilepsy [
12]. Remarkably, a study identified a therapeutic role for transplantation of butyric acid-rich fecal flora in a rat model of IS [
13]. Recent studies have found that the amount of butyrate-producing gut bacteria and the concentration of butyrate are strongly correlated with stroke outcomes [
14,
15]. However, mechanism of gut microbiota metabolite butyrate as a target for therapy of IS needs to be further explored.
Berberine (BBR) is extracted from Coptis, a traditional Chinese medicine, and can also be synthesized artificially [
16]. By now, the benefits of berberine in a multitude of neurological disorders have been discussed. For example, BBR targets the NLRP3 inflammasome to alleviate Parkinson’s related pathologies in mice model [
17]. And berberine targeting mitochondrial autophagy alleviates Alzheimer ‘s-like pathology in mice [
18]. Moreover, although our previous studies have proved that berberine has a neuroprotective effect in IS [
19,
20,
21], berberine cannot be absorbed into the circulation in large quantities because of its low solubility and large molecular weight, it may remain in the intestines and interact with the gut microbiota [
22]. Berberine has been reported to play a prominent role in diabetes and hyperlipidemia by regulating the abundance of gut microbiota and its metabolite production [
23,
24]. However, whether berberine exerts neuroprotective effects in IS by influencing the production of gut microbiota-related metabolites is unclear.
Herein, we aimed to employed 16S rRNA gene sequencing coupled with fecal microbial transplantation to elucidate the regulation of berberine on the gut microbiota and their metabolite butyrate in MCAO/R mice. This research suggested that berberine-mediated neuroprotection may dependent on the gut microbiota-related butyrate metabolism. This study also provides an experimental basis for the clinical use of berberine in the therapy of ischemic stroke.
2. Materials and Methods
2.1. Animals and Administration
C57BL/6J mice (8-10 weeks, male, 25-30g) were obtained from Model Animal Research Center of Nanjing University (Nanjing, China), meanwhile, all animal experiments and procedures were approved by the Ethics Committee of Nanjing First Hospital (Approval Number of Ethics Committee: DWSY-23063367). Mice were placed in a suitable environment (including suitable temperature and humidity control and water and food supply). All protocols during animal study were conducted in accordance with the ethical standards of Nanjing First Hospital.
For administration of sodium butyrate, different concentrations of sodium butyrate (Aladdin Inc., Shanghai, China) dissolved in normal saline were administered to mice by gavage for 14 consecutive days. For administration of Heptanoyl-CoA, Heptanoyl-CoA (Sigma-Aldrich, Oakville, Canada) dissolved in normal saline, and the dose was 0.4 mg/kg and administered rectally [
25,
26].
2.2. Fecal Microbial Transplantation (FMT)
Firstly, mice were given berberine (purity 98%, BP1108, Sigma, USA) solution 20 mg/kg (dissolved in 0.5% CMC-Na) or normal saline only for 14 consecutive days. The feces were collected, immediately suspended with sterile PBS, and the dissolved feces were centrifuged at 1000 g (4 °C) for 3 min. The collected suspension was filtered by a 70um sterile filter and stored in a refrigerator at -80 °C. Mice pretreated with antibiotics metronidazole (1g/L, Aladdin, Shanghai, China), vancomycin (0.5 g/L, Aladdin, Shanghai, China), ciprofloxacin (0.2 g/L, Aladdin, Shanghai, China) and neomycin (1 g/L, Aladdin, Shanghai, China) dissolved in the drinking water for 14 days were given the fecal suspension by intragastric administration. Each mouse was given 200 ml of fecal suspension per day and the MCAO/R model was constructed after 7 days of continuous intragastric administration [
27,
28,
29].
2.3. Animal Model of MCAO/R
The method of Longa et al. was used for the MCAO/R operation and some improvements were made [
30]. The mice were anesthetized with isoflurane (Abbott Park, USA). The procedure of setting up is as follows: a median incision in the neck, a blunt separation of the neck muscles, and the exposure of the right common carotid artery, the outer carotid artery, and the inner carotid artery under an operating microscope; Ligate ECA opposite End and cut the proximal end, insert a silicon-coated monofilament (Cinontech, China) into the ECA along the ICA into the beginning of the middle cerebral artery, at this time there is a certain. After 60 minutes of ischemia, the thread plug was removed to restore blood perfusion.
2.4. Neurological Score Determination
Neurological impairment score 24 hours after MCAO/R was performed. The scoring method is based on the five-point scale (0-4) described by Longa et al. The higher the neurological deficit score, the more severe the motor injury.
2.5. TTC Staining
The brain tissue was frozen at -20 °C for 20 minutes, and coronal sections were made with a thickness of 2 mm, and the prepared brain tissue was added in 0.5% TTC (Sigma-Aldrich, USA), it was strictly sealed in a 37 °C constant temperature water bath, dyed for 30 minutes away from light, and turned the brain sheet every 10 minutes to make it evenly contact with the dye. TTC stains can stain normal brain tissue reddish-brown and cause ischemic infarction to appear pale. They were placed neatly on a black background and photographed. The percentage of infarct volume in the whole brain volume was calculated using imageJ analysis software (Image-Pro plus, USA).
2.6. Hematoxylin and Eosin Staining
The brains of MCAO/R mice were embedded in paraffin after cardiac perfusion and brain extraction. The experimental steps of HE staining are as follows: Put the slices into xylene I 20min- xylene II 20min- anhydrous ethanol I 5min- anhydrous ethanol II 5min-75% alcohol for 5min, and wash them in tap water; slice into the hematoxylin dye solution (#G1001-100ML, Servicebio, China) for 3-5min, wash with tap water, differentiate the solution, wash with tap water, return the blue solution to blue, rinse with running water; the sections were dehydrated with 85% gradient alcohol and 95% gradient alcohol for 5min respectively, and then stained with eosin solution (#G1004-100ML, Servicebio, China) for 5min; The slices were successively placed into anhydrous ethanol I 5min - anhydrous ethanol II 5min - anhydrous ethanol III 5min - dimethyl I 5min - xylene II 5min transparent neutral gum. The morphological changes were observed under photographed with an Olympus microscope (Olympus™, Tokyo, Japan).
2.7. Nissl Staining
The brain tissue of MCAO/R model mice was sliced and sealed with paraffin after cardiac perfusion and observed under the photographed with an Olympus microscope (Olympus™, Tokyo, Japan) after Nissl staining (#G1036-100ML, Servicebio, China).
2.8. Pyrosequencing Using 16S rDNA Amplicon
Firstly, the total genomic DNA was extracted by CTAB/SDS method. After quantifying DNA by 1% agarose gel, the sequence was amplified by a series of primers.16S rRNA genes were amplified used the specific primer. PCR products purified by GeneJET gel extraction kit (Thermo Scientific, USA) were selected before sequencing. The library was then prepared and sequenced using the Illumina TruSeq DNA PCR-Free Library Preparation Kit (Illumina, USA) as recommended by the manufacturer. Library quality was assessed using the Qubit@2.0 fluorometer (Thermo Scientific, USA) and the Agilent Bioanalyzer 2100 system. Finally, the library was sequenced on Illumina NovaSeq PE250 (Illumina, USA) platform. Alpha-diversity, beta-diversity, and bacterial community composition were analyzed using the QIIME tool. Linear discriminant analysis (LDA) effect size (LEfSe) was performed with an LDA score >2.0.
2.9. Butyrate Quantification
Fecal samples were taken for colon contents, blood samples were centrifuged through cardiac puncture blood at 4 ° C, 3000 rpm and plasma were taken. The brain samples were homogenized in a homogenizer with PBS after brain extraction, and all samples were immediately frozen on dry ice. The sample was dissolved in ddH2O and mixed with 2-methylbutyric acid. After centrifugation at 12,000 rpm for 20 min, the supernatant was derived using an isopropanol-pyridine solution and a platelet cytotoxic factor solution, and then extracted and analyzed using N-hexane. The sample was analysed using the Agilent 7890A/5975C gas chromatography-mass spectrometry system. The specific method is: nitrogen is used as the carrier gas and the flow rate is controlled to 1 mL/min. Set the column temperature starting temperature to 100 °C and maintain 0. 5 minutes. Then, the temperature is raised to 180 °C at a rate of 8 °C/min for 1 min, then the temperature is raised to 200 °C at a speed of 10 °C/min for 5 min. The temperature of the detector is controlled to 240 °C, the temperature of the inlet is set to 200 °C, and the sample volume is 1 μL. The detection time of each specimen was 5 minutes.
2.10. Butyryl-CoA Acetate CoA Transferase (BUT) Assay
Butyryl-CoA Acetate CoA transferase (BUT) activity was determined with reference to relevant literature [
31]. The activity of Butyryl-CoA: acetateCoA transferase (BUT) was determined by detecting the formation of acetyl-coA using acetic acid and butykievase as substrates. AcetylCoA concentration was determined using the AcetylCoA assay kit (Jiancheng Bioengineering Institute, China) according to the manufacturer’s instructions.
2.11. Western Blot Analysis
Total protein quantity was assessed with the BCA protein assay kit (Key GEN Biotech, China). The protein samples were separated electrophoretically and transferred to PVDF membranes (Millipore, USA). After that, membranes were blocked by 5% fat-free milk.Then they were incubated overnight at 4 °C with anti-NLRP3 (1:1000; #15101, Cell Signaling Technology, USA), anti-SYP (1:1000, ab52636, Abcam, UK), anti-PSD95 (1:5000, #ab2723, Abcam, UK), anti-β-actin (1:1000; #4970, Cell Signaling Technology, USA), anti-GFAP (1:1000, ab68428, Abcam, UK), anti-Iba-1 (1:1000, #ab178846, Abcam, UK). Next, the membranes were incubated at room temperature for 2h with appropriate secondary antibodies. Immune complexes were assessed with ECL kit (Thermo Fisher Scientific), the results were quantified by ImageJ.
2.12. Real-Time Reverse Transcription-Quantitative PCR (RT-qPCR) for mRNA Expression
Twenty-four hours after MCAO/R, the mice were anesthetized with isoflurane and brain tissue was dissected. Total RNA of brain was extracted by an RNA extraction kit and reverse transcribed into cDNA using a commercial kit (TAKARA, Japan). Real-time PCR was performed using an ABI 7500 sequence detection system (Applied Biosystems, Foster City, CA) mixed with SYBR Green 2 × PCR master Mix (TAKARA, Japan), cDNA template, Forward and reverse primers. 35 cycles: 95°C for 15 s, 60°C for 60 s. The following primers were used: IL-1β: forward CACCTCTCAAGCAGAGCACAG, reverse GGGTTGCATGGTGAAGTCAAC; IL-6: forward GCTACCAAACTGGATATAATCAGGA, reverse CCAGGTAGCTATGGTACTCCAGAA; TNF-α: forward GACCCTCACACTCAGATCATCTTCT, reverse CCTCCACTTGGTGGTTTGCT. β-actin:forward TGAGCTGCGTTTTACACCCT, reverse GCCTTCACCGTTCCAGTTTT. The data was analyzed using the ABI 7500 sequence detection system software. The quantity of TNF-α, IL-1β, and IL-6 mRNA was normalized to that of β-actin using the comparative (2-△△Ct) method.
2.13. ELISA
The brain homogenates were centrifuged at 12,000 rpm for 10 min. The IL-1β (MLB00C, R&D Systems, Inc. USA), IL-6 (M6000B, R&D Systems, Inc. USA) and TNF-α (MTA00B, R&D Systems, Inc., USA) levels were determined using a corresponding ELISA kit.
2.14. Immunofluorescence
The hearts of the mice were perfused and the brains were sliced open and then embedded in paraffin. After the dewaxing and rehydration of the conventional paraffin section, the anti-priming was performed by an elevated water bath. Place the slices on a dyeing rack, place them in a little enameling jar filled with 10 mm ·L-1 lemon-sodium lemon-buffer (pH 6.0), and place the enameling jar in a large boiling cup filled with a certain amount of fresh water. The electric furnace is heated and boiled, starting from the temperature of the porcelain cylinder reaches 92 ~ 98°C for 15min, and then the end is removed from the electric furnace and slowly cooled to room temperature. The distilled water was washed for 2 x and the PBST was then immersed for 5 min; it was fixed with 4% polymethylaldehyde for 10 min. Wash with TBST for 2×5 min; the non-specific reaction sites were closed after incubation with 10% BSA at room temperature for 1 h. Add anti-GFAP (1:400, ab4648, Abcam, UK) or anti-Iba-1 (1:400, #ab178846, Abcam, UK) incubated overnight at 4°C; wash with PBST for 3×10 min. The goat anti-rabbit IgG H&L (Alexa Fluor® 488) (1:200, ab150113, Abcam, UK) or goat anti-rabbit IgG H&L (Alexa Fluor® 594) (1:200, ab150080, Abcam, UK) was added and incubated at 37°C for 1 h. Wash with PBST for 3×10 min; After washed, samples were stained with DAPI (Sigma, USA) for 15 min. Samples were observed and photographed with a laser scanning confocal microscope (Zeiss, Oberkochen, Germany).
2.15. Statistical Analyses
All data were expressed as mean ± standard deviation (SD). Graghpad prism 8 (GraphPad Software, Inc., La Jolla, USA) was utilized used for following statistical analysis of experimental results. Unpaired t-test was used for comparison between two groups and one-way ANOVA was used for comparison between multiple groups. When P < 0.05, considering significant differences.
4. Discussion
The brain and gut are connected by neural networks, and there is a two-way interaction, forming a complex gut-brain axis. In particular, the gut microbiome affects this gut-brain two-way communication during process of ischemic stroke. Ischemic stroke could modify the composition of the gut microbiome. In contrast, gut microbiota can modulate stroke outcomes and play a role in its development. It has been demonstrated that the diversity of intestinal flora is decreased in mice model of ischemic stroke [
32]. At the same time, several clinical trials of stroke patients have shown that the gut is dysfunctional after stroke, with a reduced abundance of beneficial bacteria (SCFAs-producing bacteria) and an increased abundance of opportunistic pathogens [
33,
34]. These suggest that intestinal dysbiosis affects the prognosis of IS. In addition, the imbalance of intestinal ecology can further aggravate the brain injury after ischemic stroke. For example, in the mice model of stroke, intestinal dysbiosis increases the number of pro-inflammatory lymphocytes and exacerbates brain damage [
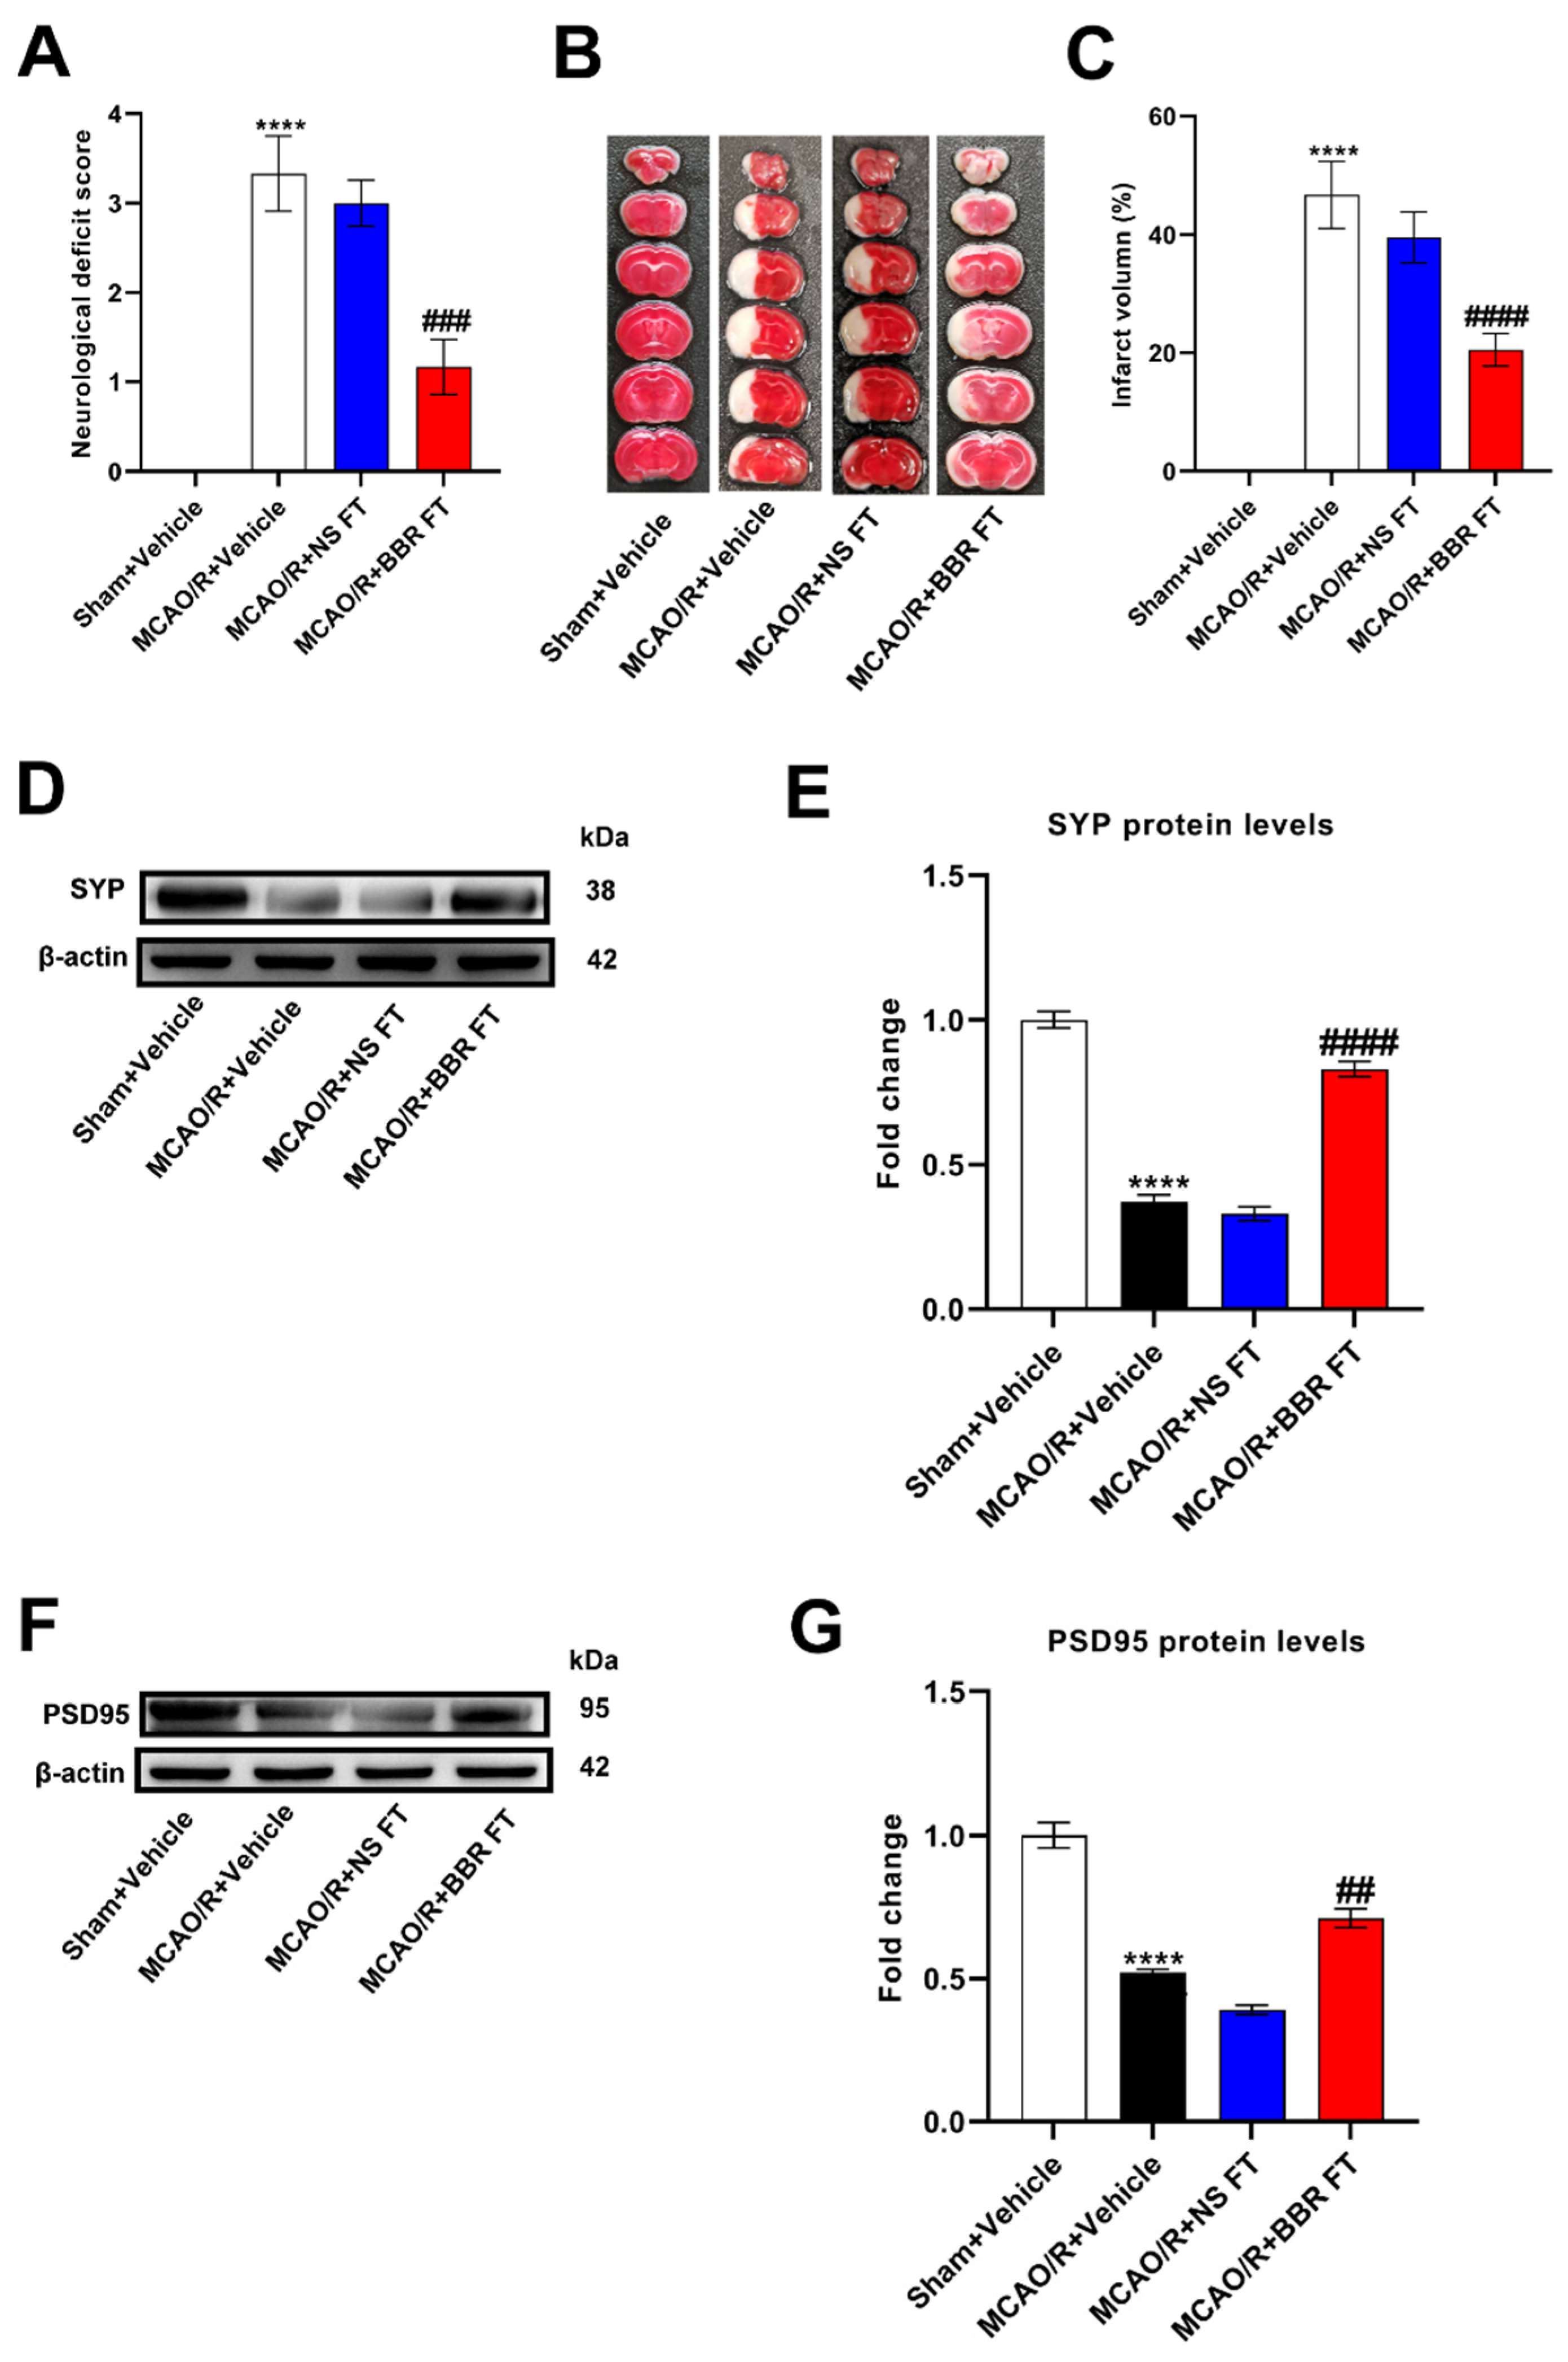
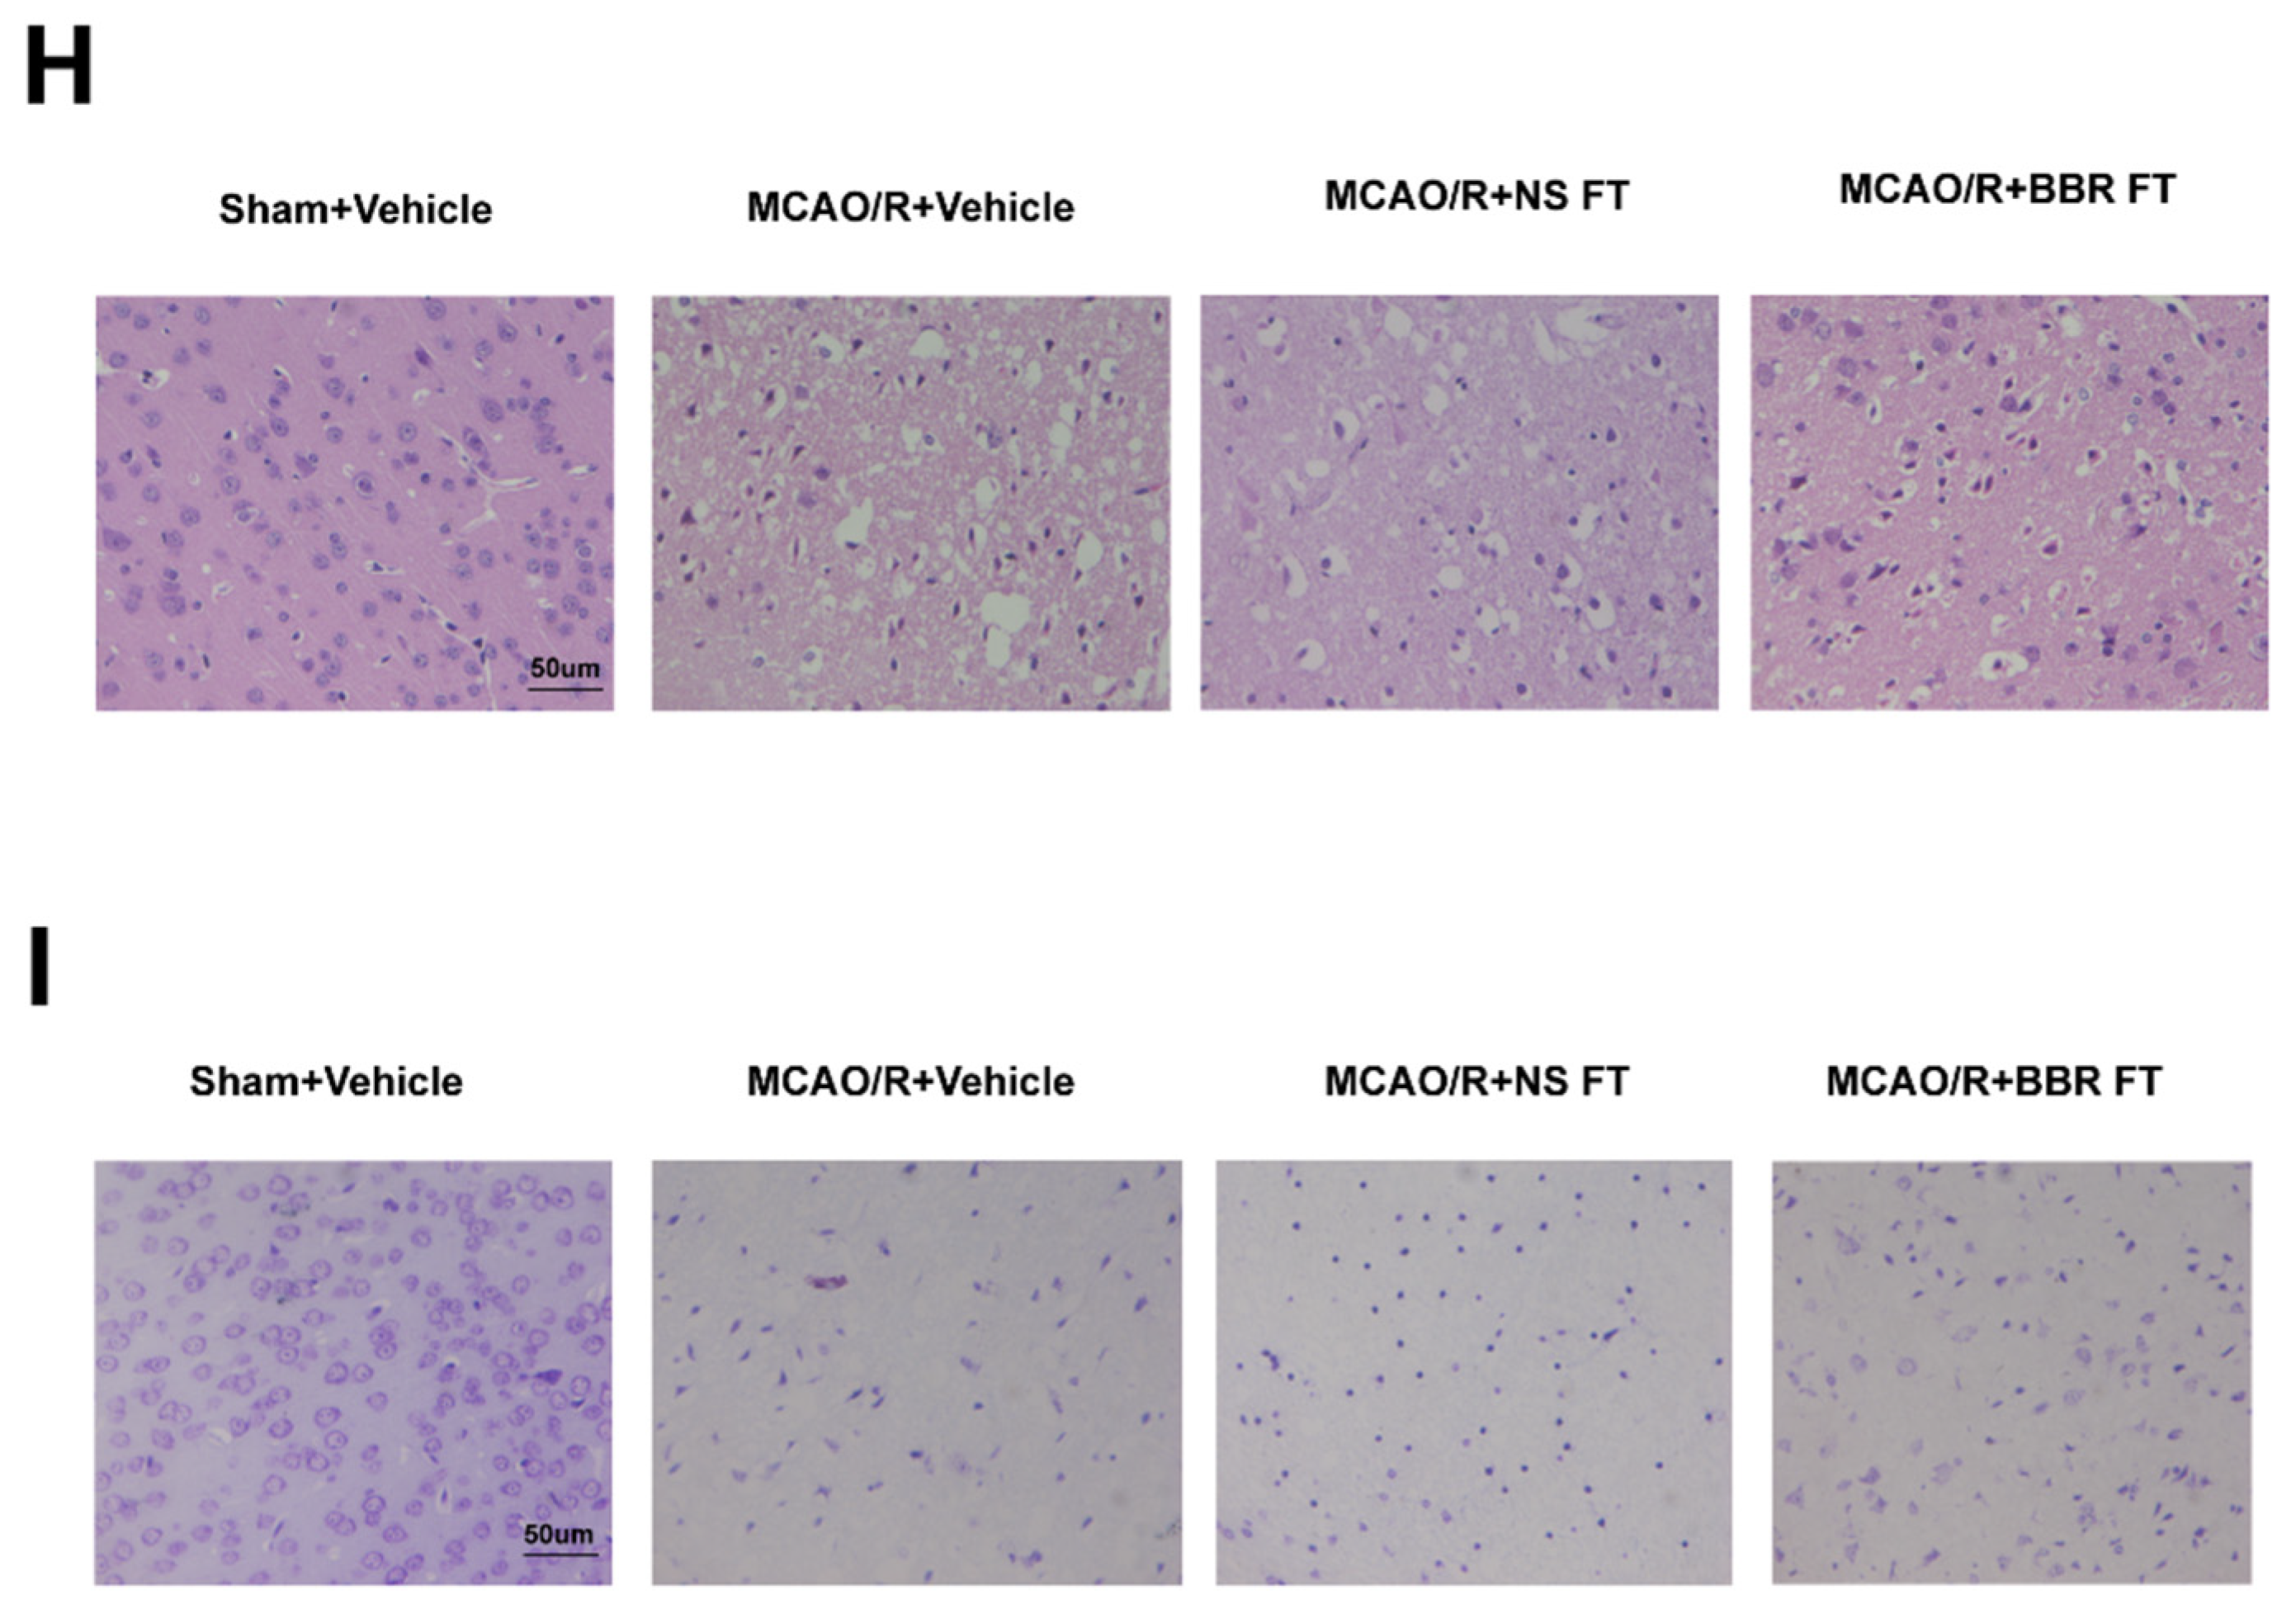
35]. Thus, similarly, this study demonstrated through fecal microbiota transplantation that the intestinal microbiota of BBR pretreated mice significantly improved stroke outcomes in MCAO/R mice.
Berberine, an alkaloid derived from coptis, has received much attention from researchers in recent years. However, berberine has poor bioavailability and can be enriched in the gut, with the ability to regulate gut flora and gut metabolites [
36]. One of these studies showed that oral administration of berberine in mice modulated the gut microbiome and increased the number of dopamine-producing bacteria, resulting in increased dopamine production and thus improved Parkinson’s disease [
37]. Another of these studies showed that berberine treatment increased Akkermansia in the intestine and ameliorated atherosclerosis in mice induced by elevated-fat diet [
38]. In this study, we found that BBR could modulate the gut microbiota of MCAO/R mice, increasing the abundance of butyric acid-producing bacteria, including Lachnoclostridium, Clostridioides, Escherichia-Shigella, Bacteroides, Akkermansia, Klebsiella, reducing F/B ratio, indicating that berberine had an inhibitory effect on harmful bacteria and a relative up-regulation effect on beneficial bacteria, and ultimately improve the stroke outcome in mice.
Butyric acid is a common metabolite of intestinal probiotics and belongs to SCFAs [
39]. Numerous studies have shown that butyrate has the functions of alleviating oxidative stress, improving inflammatory response, stimulating gastrointestinal development and enhancing immunity [
40,
41]. It is worth mentioning that recent studies have also described that berberine acts as a gut microbiome regulator to regulate butyrate production, including in diseases such as arthritis [
42] and colon cancer [
43]. Recently, butyrate has also been found to have a certain effect on IS, such as reducing ischemia reperfusion injury by reducing neuronal apoptosis and inflammation or promoting angiogenesis in animal models after MCAO [
44,
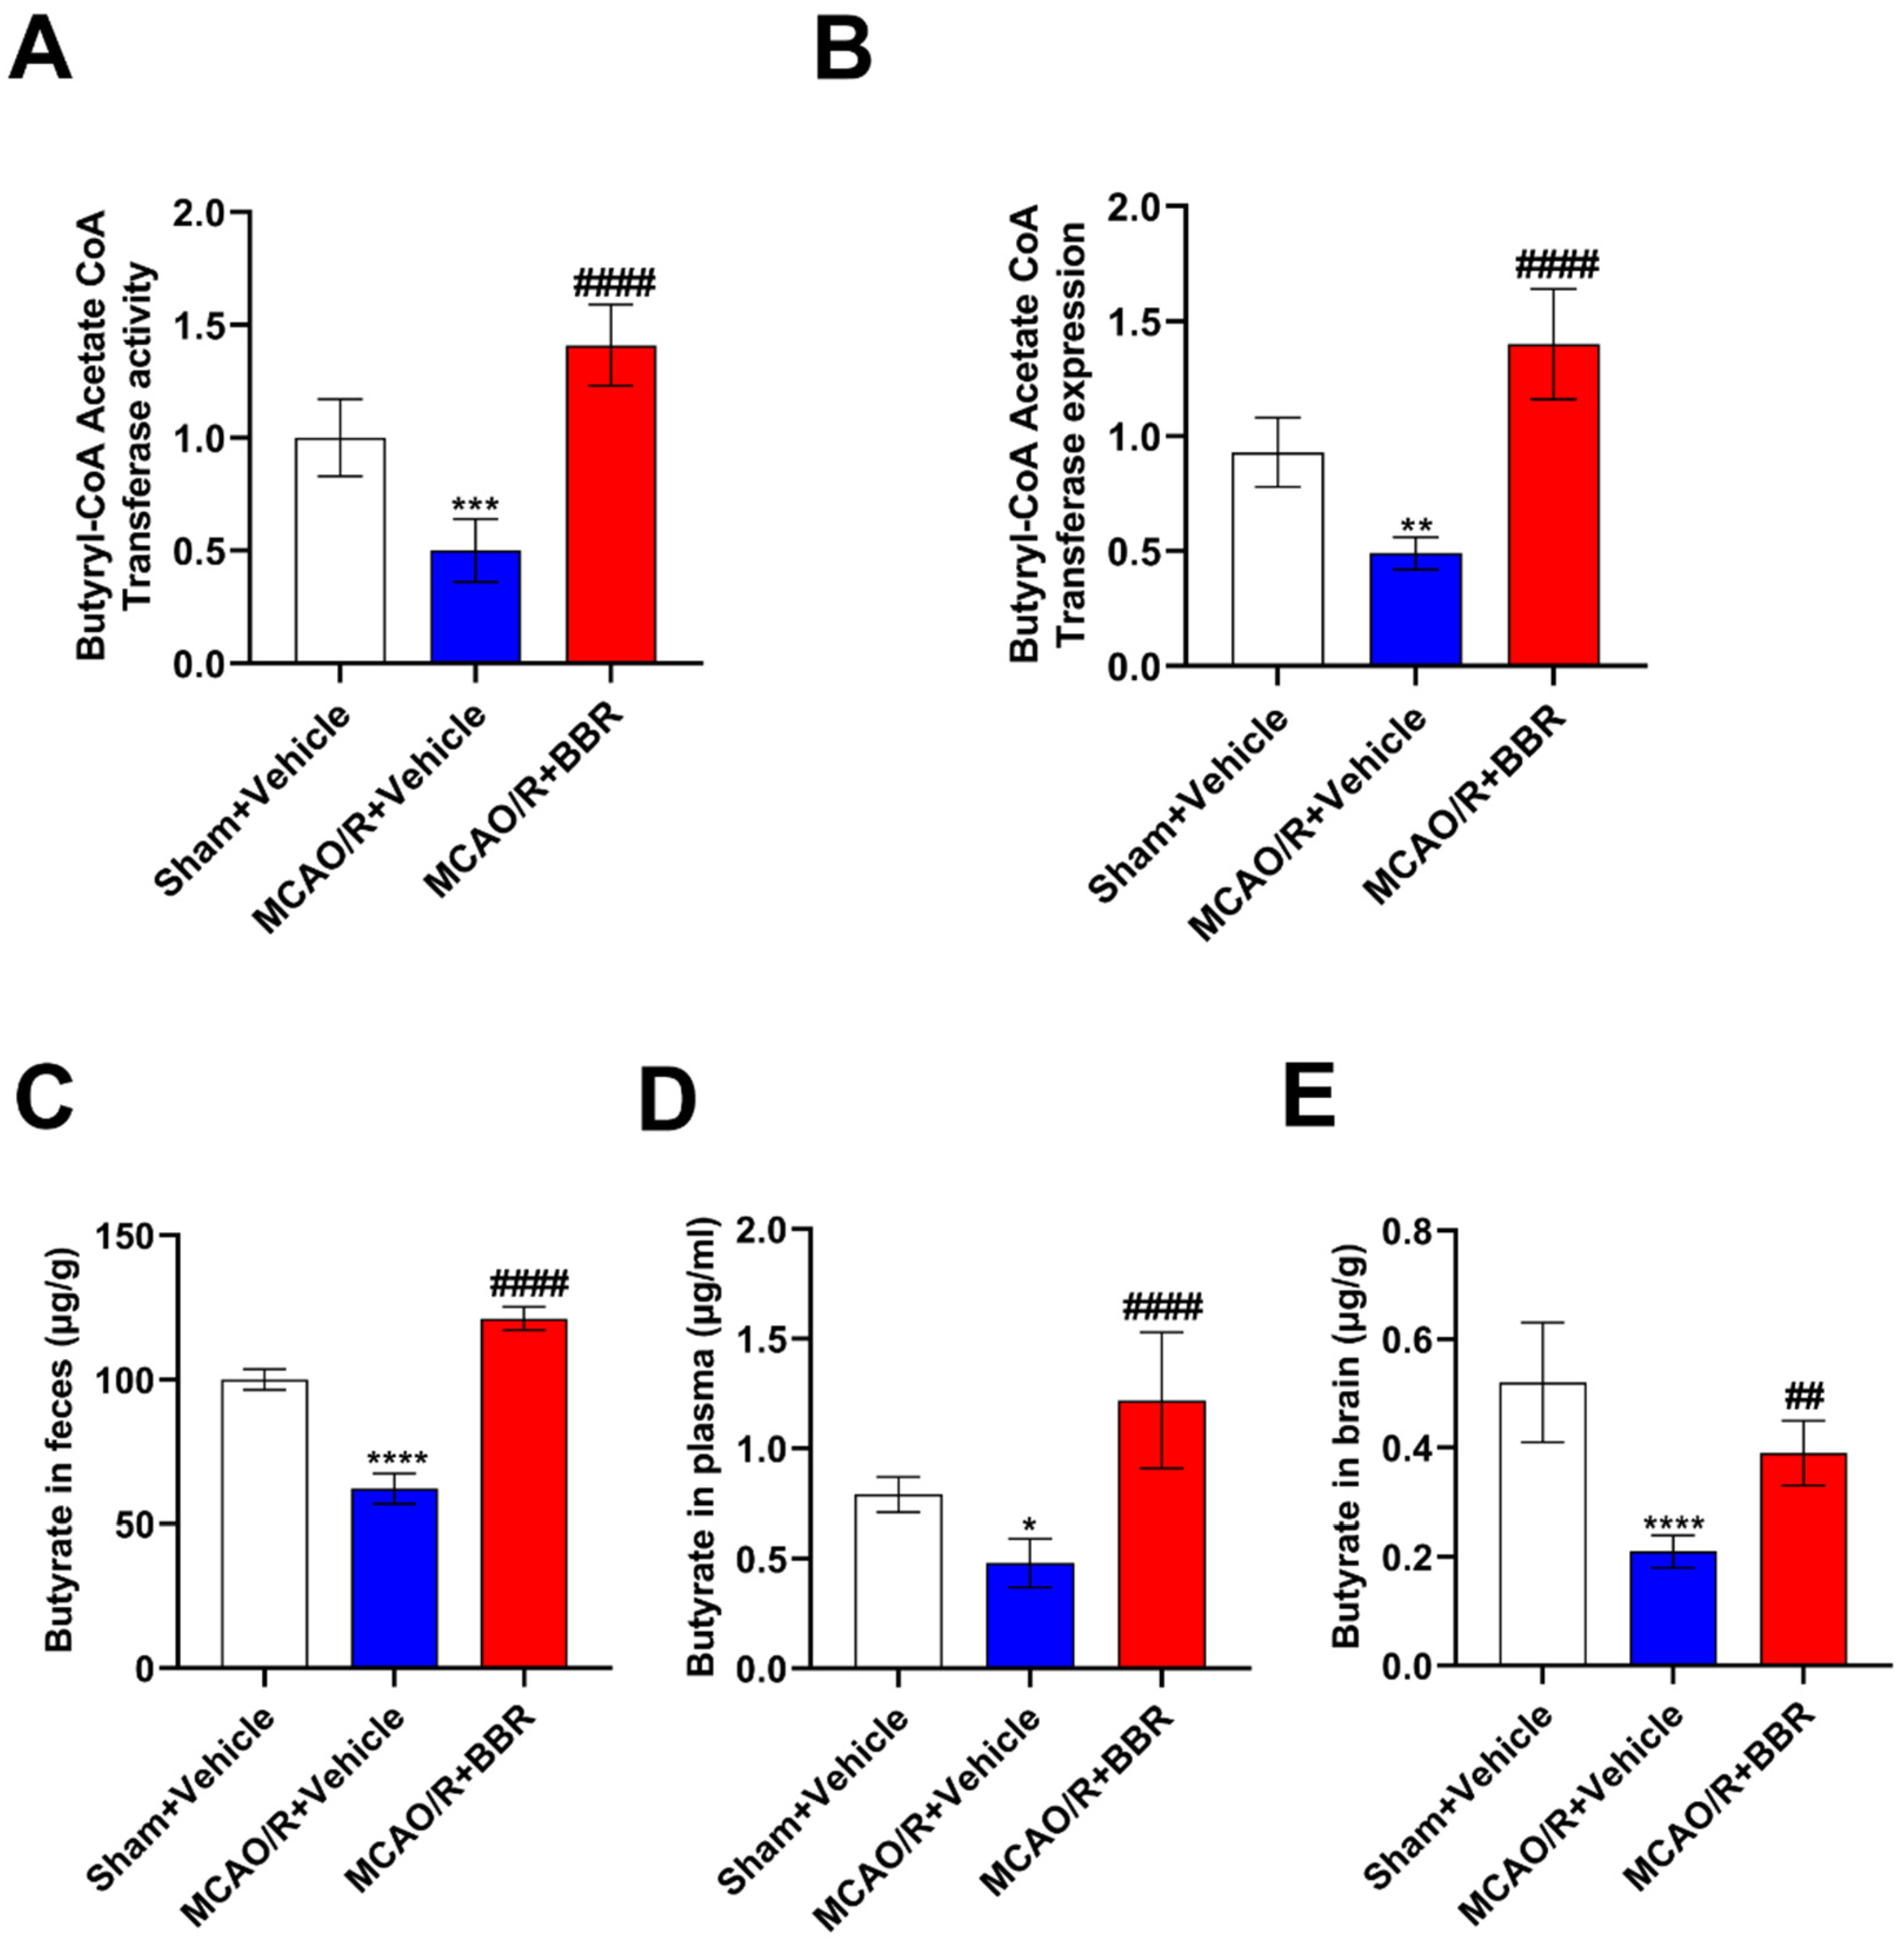
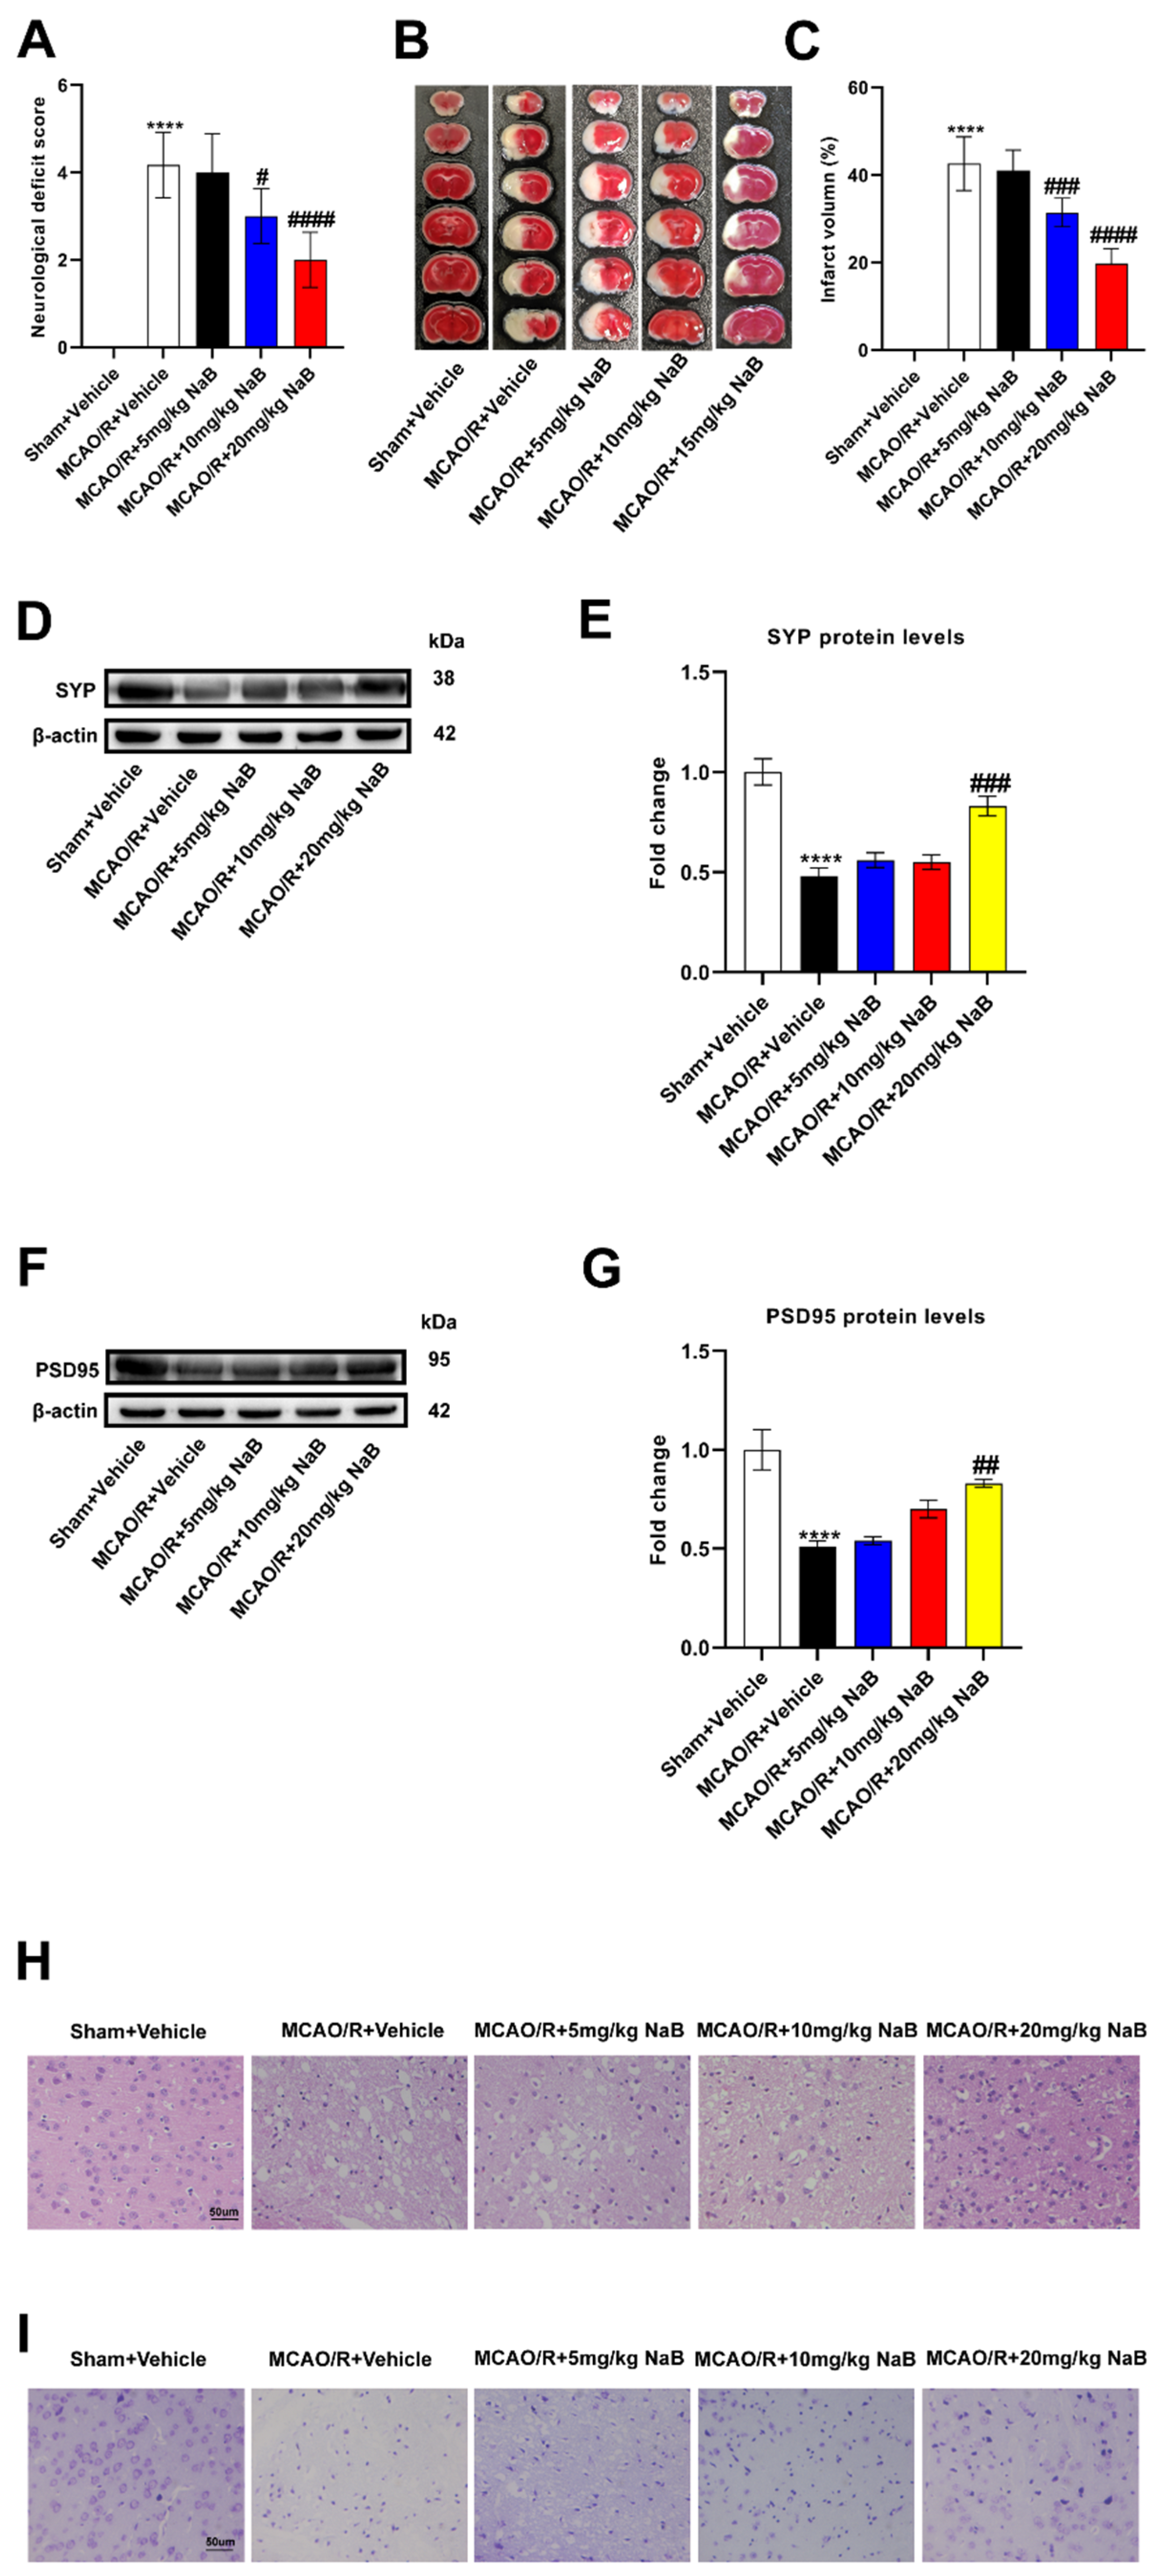
45]. Our results show that berberine is able to promote the biosynthesis of butyrate by modulating the gut microbiome of MCAO/R mice, and that butyrate is also able to alleviate stroke in MCAO/R mice.
The development of ischemic stroke is often accompanied by a persistent neuroinflammatory response. As early as the acute phase of ischemic stroke, microglia in the brain are rapidly activated, while astrocytes also increase in life and become reactive astrocytes [
46,
47]. The two types of glia migrate to the site of ischemic injury to further release a series of pro-inflammatory cytokines (TNF-α, IL-1β, and IL-6), degrade the extracellular matrix, and further destroy the blood-brain barrier [
48]. Neuroinflammatory response is closely related to the changes in infarct volume induced by ischemic stroke [
49]. Blocking proinflammatory activation of glial cells is an effective method to improve ischemic stroke. A study has revealed that butyrate improves alcohol-induced central nervous injury by reducing abnormal activation of microglia and neuroinflammatory responses [
50]. At the same time, butyrate has also been shown to play a protective role in reducing the production of inflammatory mediators in vitro models of neuronal injury [
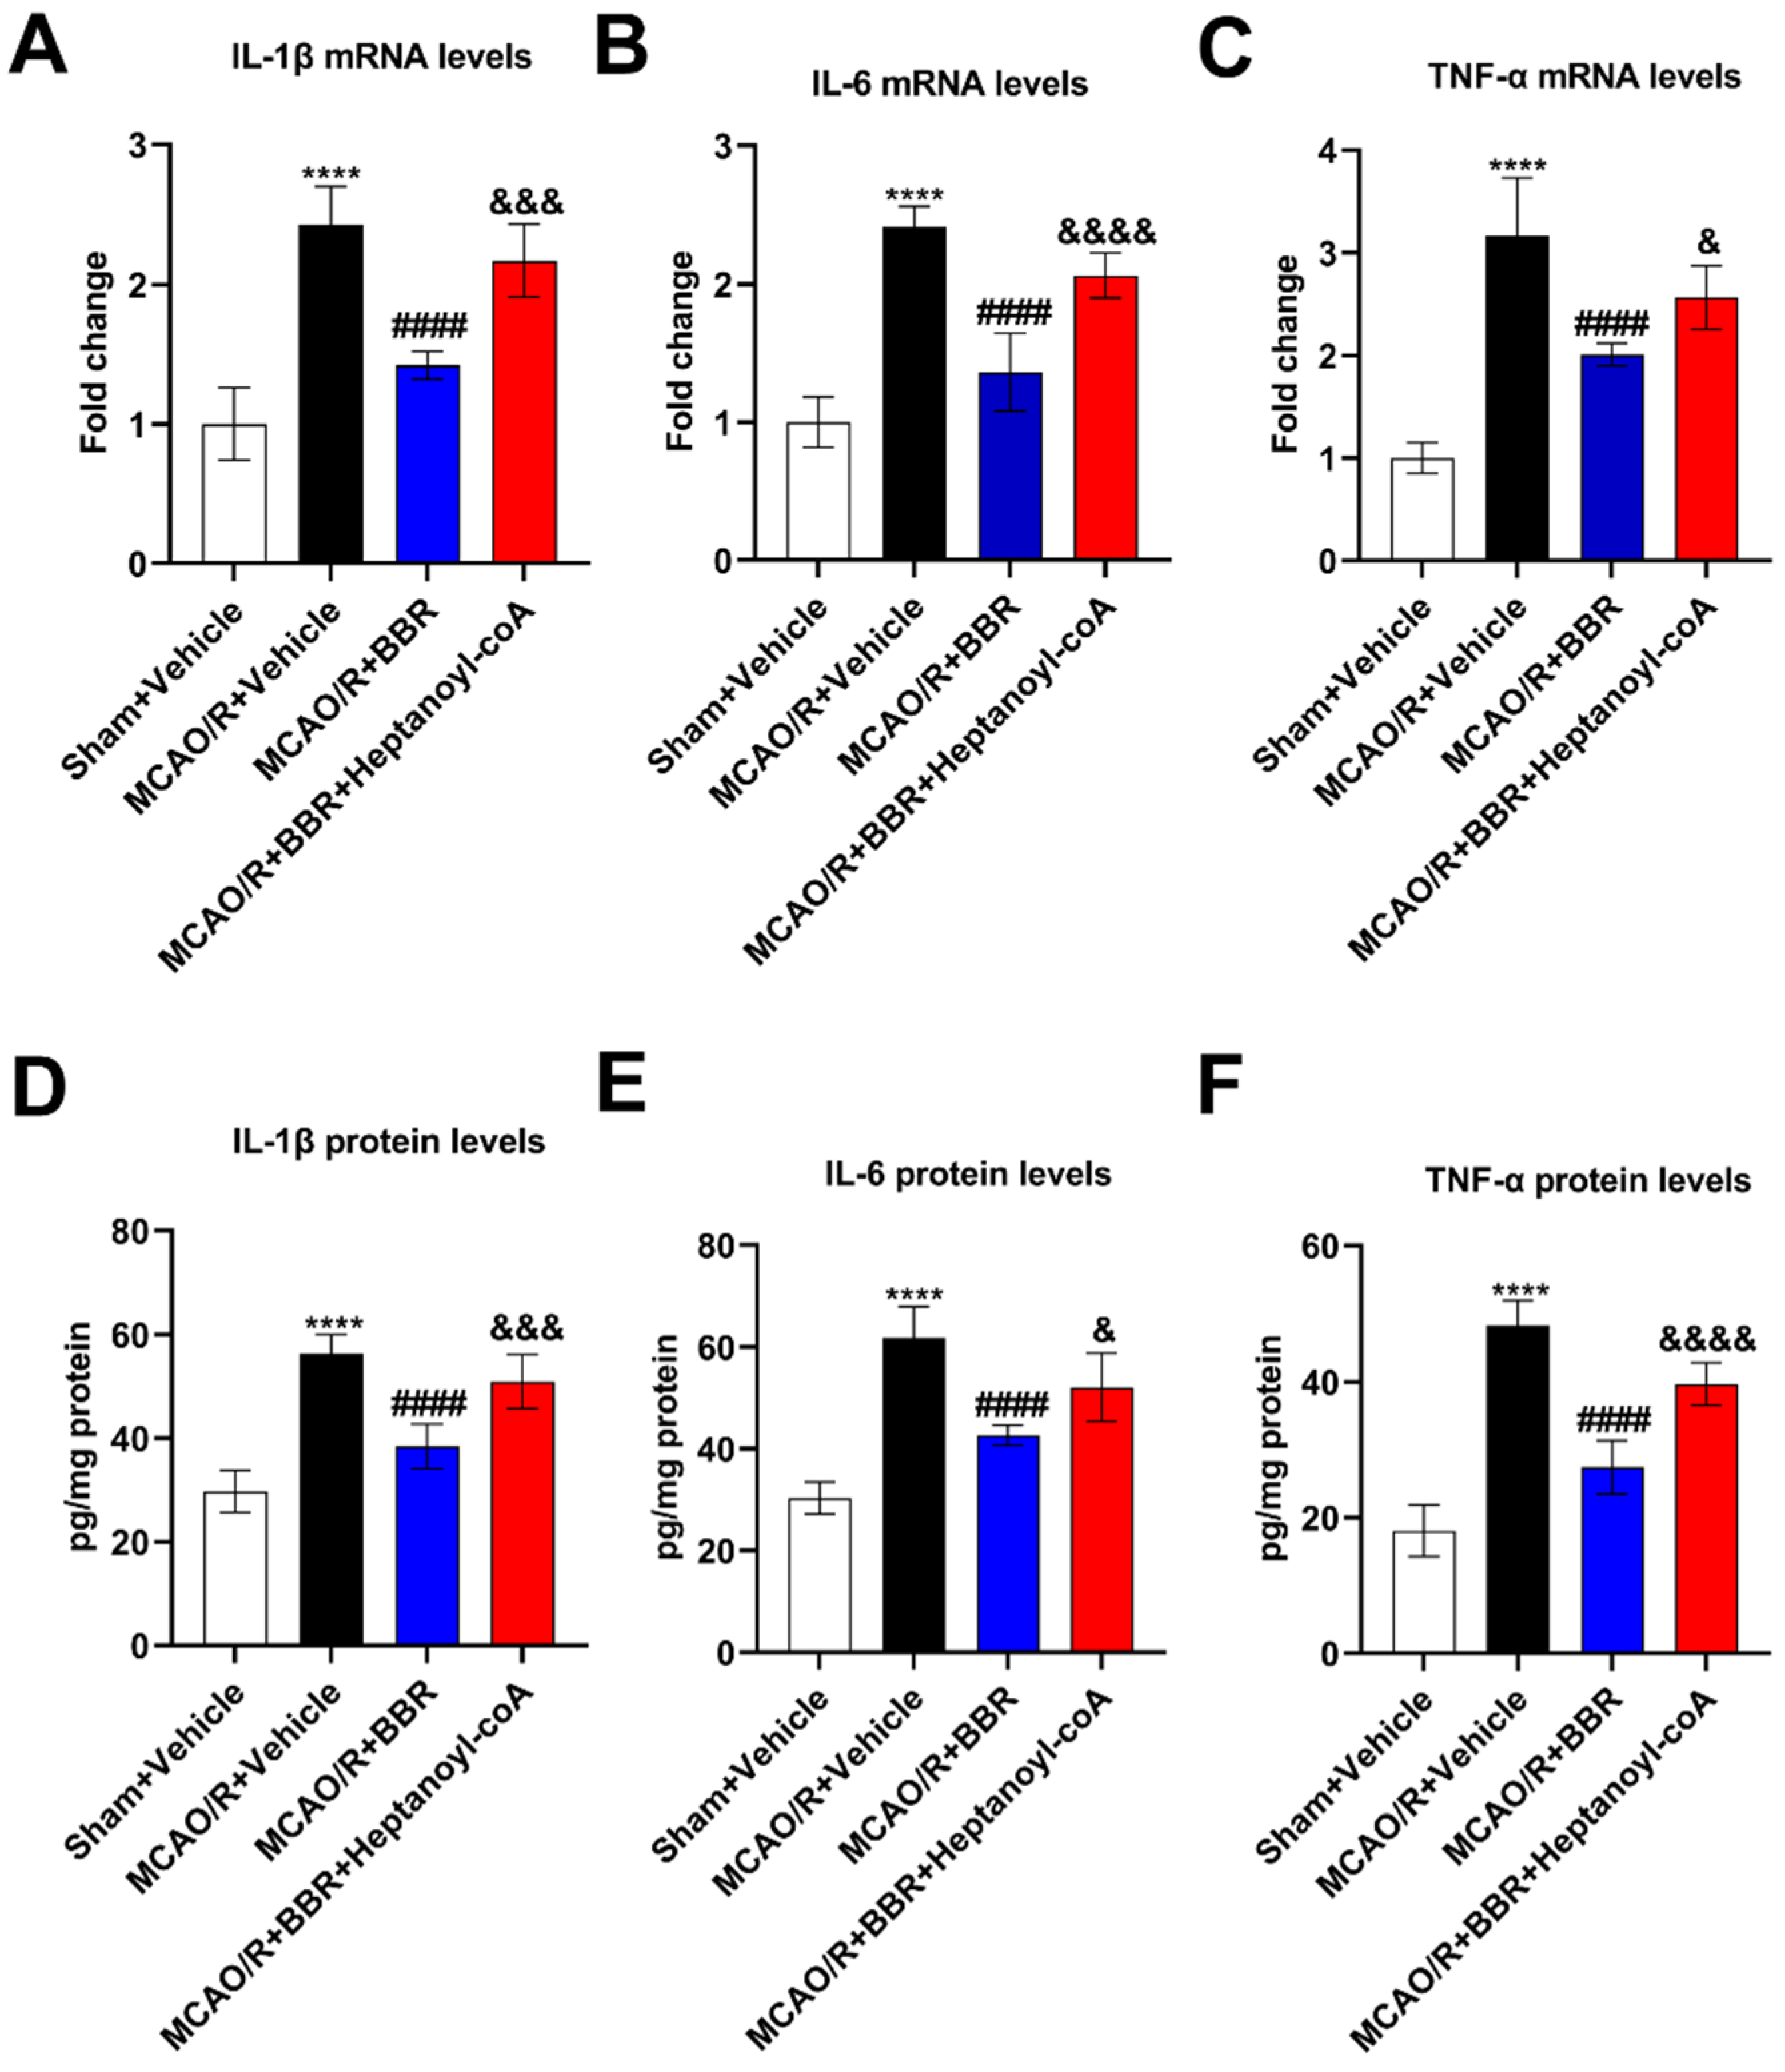
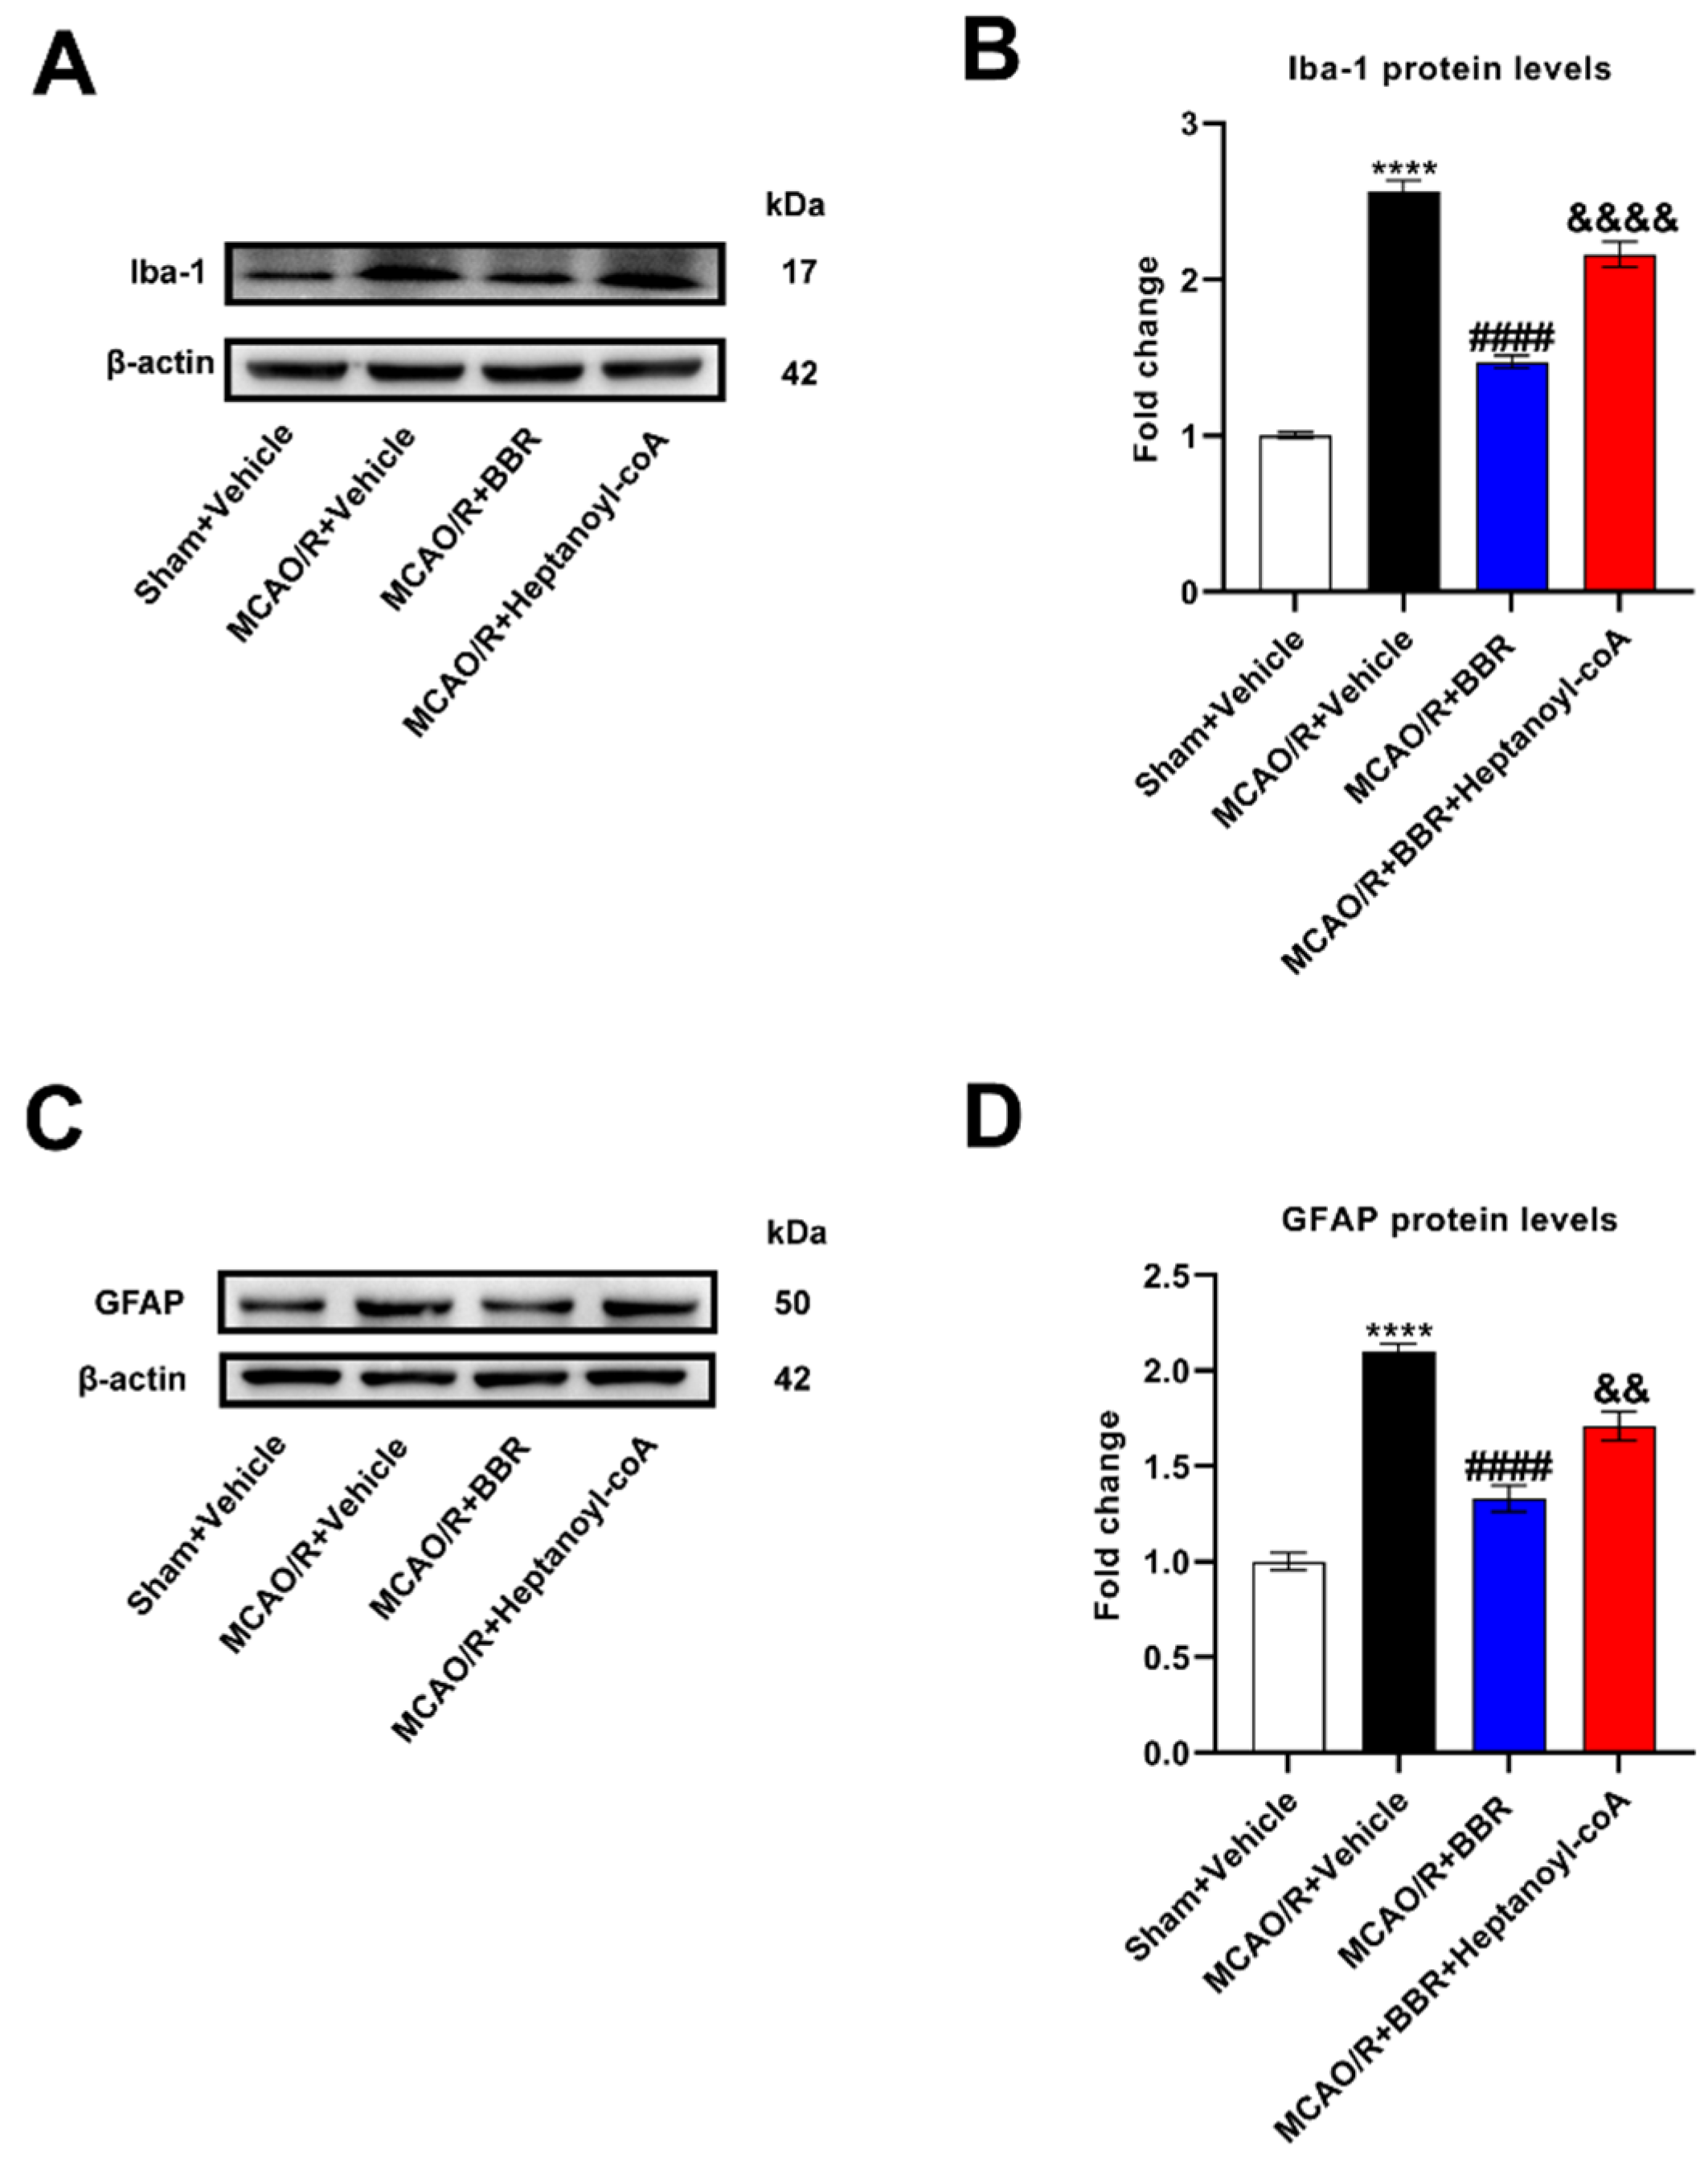
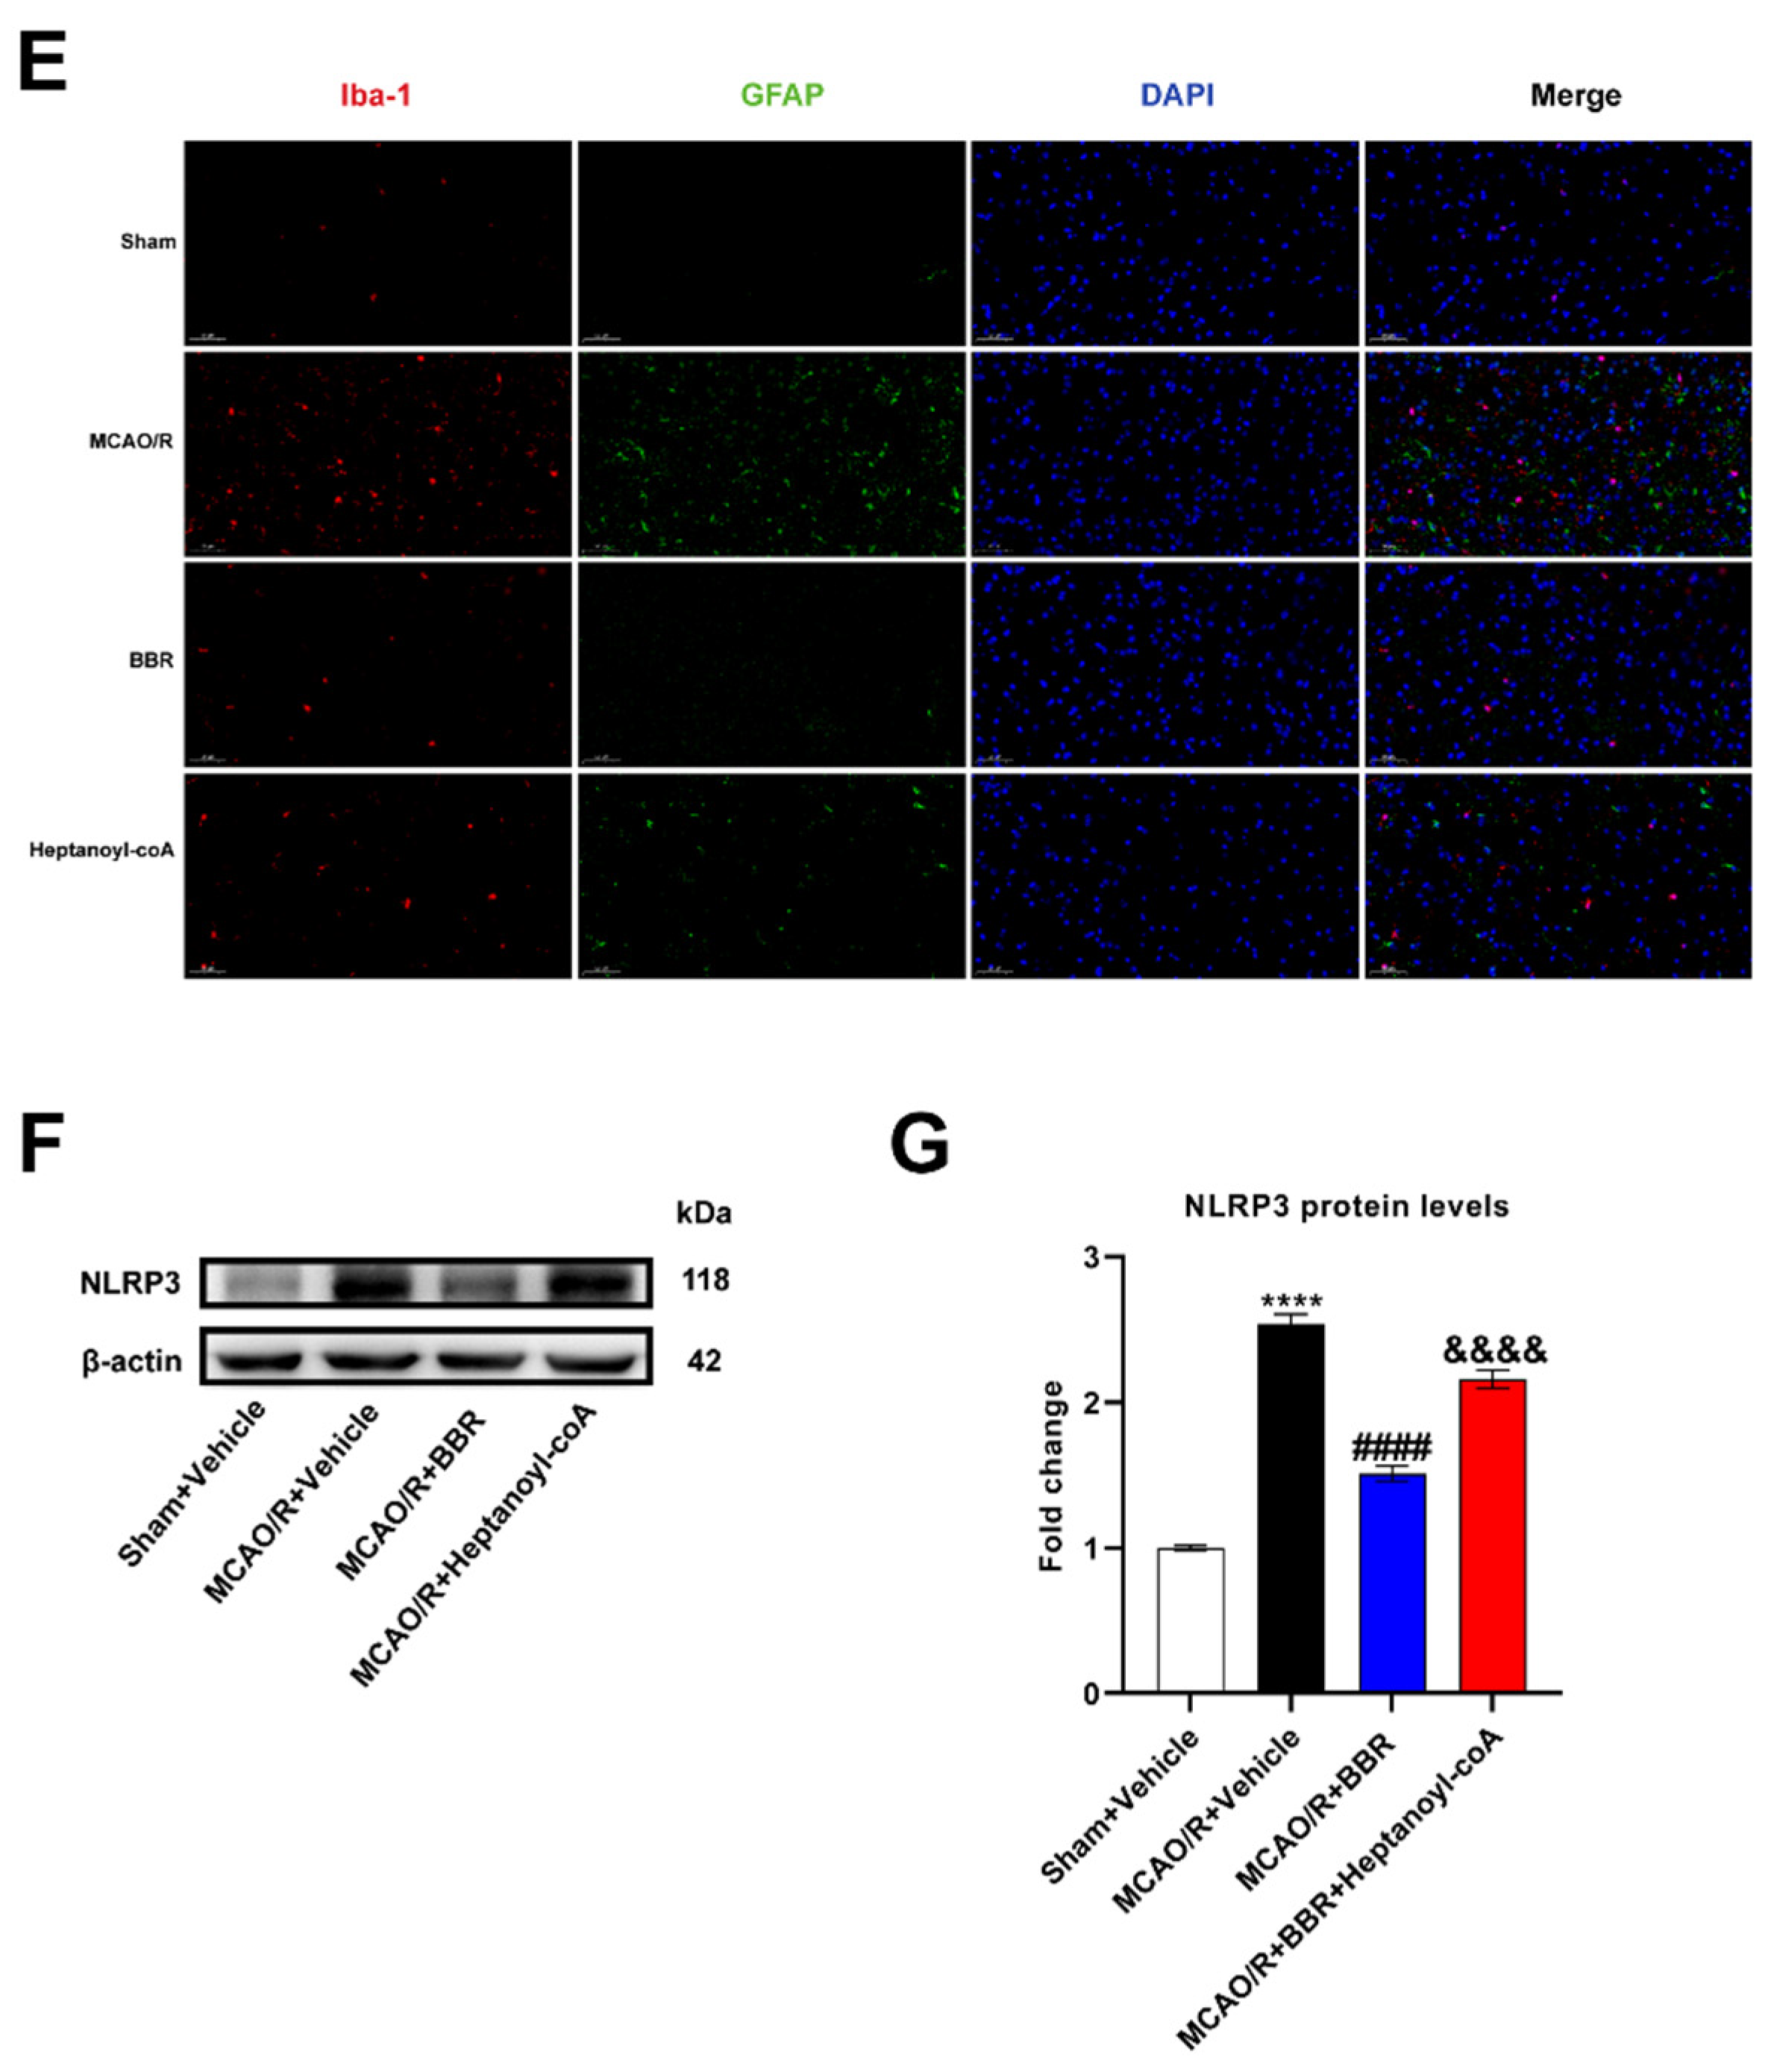
51]. Our findings proved that in MCAO/R mice, berberine can promote the biosynthesis of butyrate, which inhibits the abnormal activation and migration of microglia and astrocytes and reduces the release of pro-inflammatory cytokines, which also reduces the persistent neuroinflammatory response after ischemic stroke.
Figure 1.
BBR improves stroke outcomes by regulating gut microbiota. (A) Neurological deficit scores evaluated 24 h after reperfusion in MCAO mice (n=18). (B) The infarct volume assessed 24 h after reperfusion in MCAO mice by TTC staining (n=6). (C) Infarction volume as a percentage of the Sham value (n=6). (D-E) The expression of SYP in mice brain was detected by western blot assay. β-actin was used as an internal control (n=6). (F-G) The expression of PSD95 in mice brain was detected by western blot assay. β-actin was used as an internal control (n=6). (H) Representative images of ischemic brain tissue with hematoxylin and eosin staining (n=6). (I) Representative images of ischemic brain tissue with Nissl staining (n=6). Scale bar, 50 µm. Magnification of the microphotograph, × 400. Results were shown as mean ± SD. **** P <0.0001 versus the Sham+Vehicle group; ## P <0.01, ### P <0.001, #### P <0.0001 versus the MCAO/R+Vehicle group.
Figure 2.
BBR administration increases the abundance of butyric-producing bacteria in mice. (A-B) Alpha diversity is expressed through the shannon diversity index (n=10). (C) The β-diversity analysis (PCoA) of gut microbiota was conducted (n=10). (D) The relative abundance of bacteria in genus level and the sample similarity of microbota in each sample were calculated and the heatmap clustering analysis was conducted (n=10). (E-F) Significantly discriminative taxa among the various groups determined using linear discriminant analysis effect size (LDA effect size) and the taxonomic cladogram was shown (n=10). Results were shown as mean ± SD. *P <0.05, **P <0.01, ***P <0.001 versus the NS group.
Figure 3.
BBR administration increases the content of butyric acid in MCAO/R mice. (A-B) The activity and expression of butyryl-CoA:acetate-CoA transferase were determined (n=6). (C-E) The content of butyric acid in feces, plasma and brain of mice was determined by GC-MS (n=6). Results were shown as mean ± SD. *P <0.05, **P <0.01, ***P <0.001, ****P <0.0001 versus the Sham+Vehicle group; ## P <0.01, #### P <0.0001 versus the MCAO/R+Vehicle group.
Figure 4.
Butyric acid plays a protective role in the brain of MCAO/R mice. (A) Neurological deficit scores evaluated 24 h after reperfusion in MCAO mice (n=18). (B) The infarct volume assessed 24 h after reperfusion in MCAO mice by TTC staining (n=6). (C) Infarction volume as a percentage of the sham value (n=6). (D-E) The expression of SYP in mice brain was detected by western blot assay. β-actin was used as an internal control (n=6). (F-G) The expression of PSD95 in mice brain was detected by western blot assay. β-actin was used as an internal control (n=6). (H) Representative images of ischemic brain tissue with hematoxylin and eosin staining (n=6). (I) Representative images of ischemic brain tissue with Nissl staining (n=6). Scale bar, 50 µm. Magnification of the microphotograph, × 400. Results were shown as mean ± SD. **** P <0.0001 versus the Sham+Vehicle group; # P <0.05, ## P <0.01, ### P <0.001, #### P <0.0001 versus the MCAO/R+Vehicle group.
Figure 5.
BBR plays a protective role in the brain of MCAO mice by promoting butyric acid biosynthesis. (A) Neurological deficit scores evaluated 24 h after reperfusion in MCAO mice (n=18). (B) The infarct volume assessed 24 h after reperfusion in MCAO mice by TTC staining (n=6). (C) Infarction volume as a percentage of the sham value (n=6). (D-E) The expression of SYP in mice brain was detected by western blot assay. β-actin was used as an internal control (n=6). (F-G) The expression of PSD95 in mice brain was detected by western blot assay. β-actin was used as an internal control (n=6). (H) Representative images of ischemic brain tissue with hematoxylin and eosin staining (n=6). (I) Representative images of ischemic brain tissue with Nissl staining (n=6). Scale bar, 50 µm. Magnification of the microphotograph, × 400. Results were shown as mean ± SD. **** P <0.0001 versus the Sham+Vehicle group; ## P <0.01, #### P <0.0001 versus the MCAO/R+Vehicle group; & P <0.05,&&& P <0.001, &&&& P <0.0001 versus the MCAO/R+BBR group.
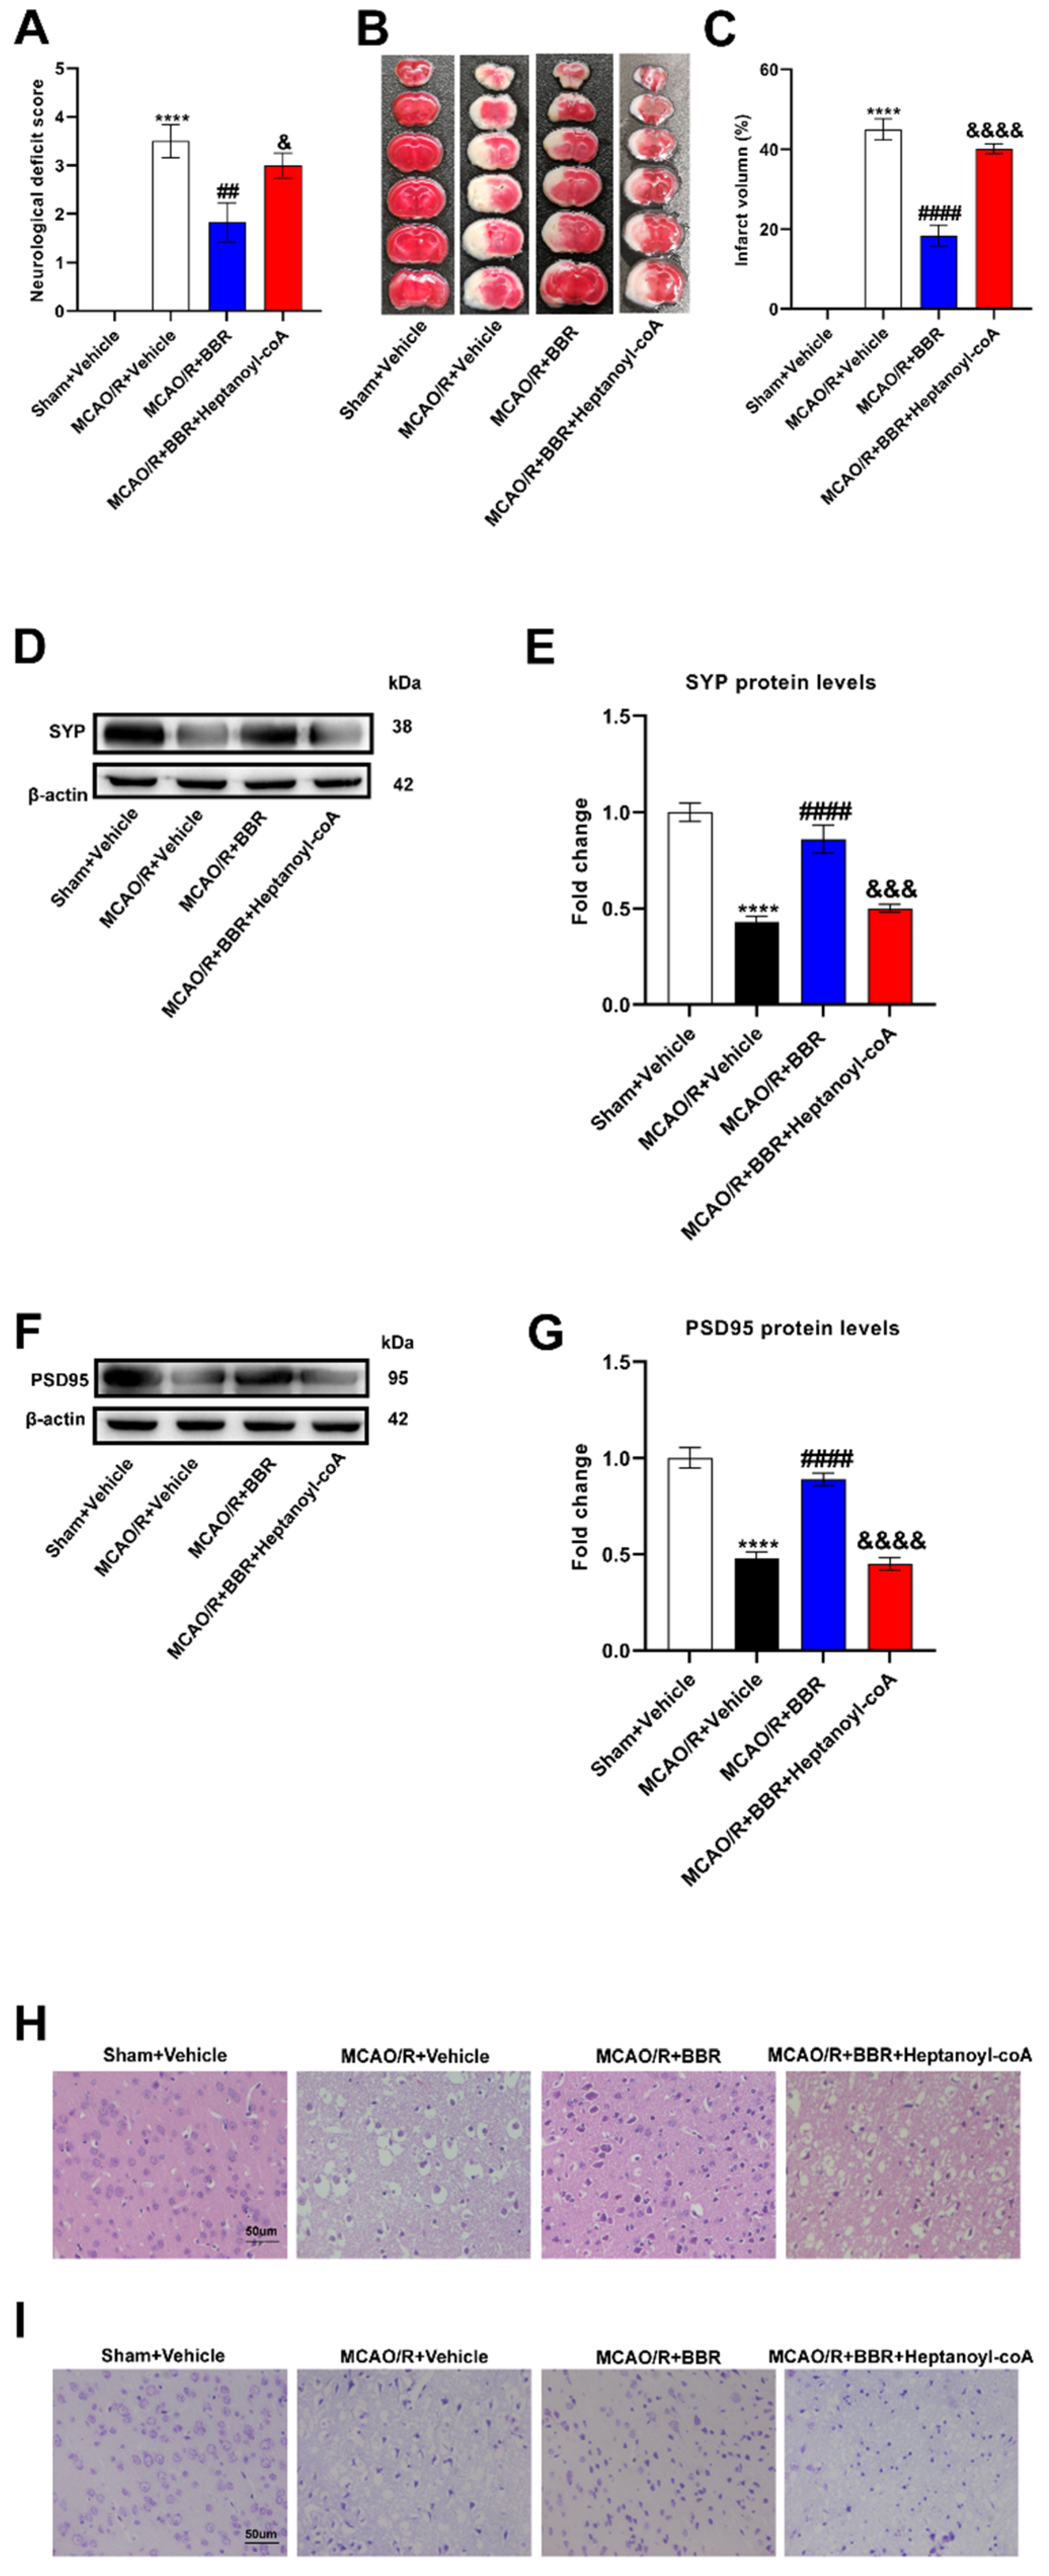
Figure 6.
BBR inhibits the level of inflammatory cytokines in the brain of MCAO mice by promoting the biosynthesis of butyric acid. (A-C) The levels of IL-1β, IL-6, TNF-α mRNA in the mice brain were detected by qRT-PCR (n=6). (D-F) The levels of IL-1β, IL-6 and TNF-α in the mice brain were detected by ELISA (n=6). Results were shown as mean ± SD. ****P <0.0001 versus the Sham+Vehicle group; ####P <0.0001 versus the MCAO/R+Vehicle group; &P <0.05, &&&P <0.001, &&&&P <0.0001 versus the MCAO/R+BBR group.
Figure 7.
BBR inhibits the activation of glial cells and the expression of NLRP3 by promoting butyric acid synthesis. (A-B) The expression of Iba1 in MCAO/R mice brain was detected by western blot assay. β-actin was used as an internal control (n=6). (C-D) The expression of GFAP in MCAO/R mice brain was detected by western blot assay. β-actin was used as an internal control (n=6). (E) Representative images of immunofluorescence staining for GFAP (green) and Iba1(red) in ischemic brain tissue of the mice groups (scale bars: 50 μm) (n=6). (F-G) The expression of NLRP3 in MCAO/R mice brain was detected by western blot assay. β-actin was used as an internal control (n=6). Results were shown as mean ± SD. ****P <0.01 versus the Sham+Vehicle group; #### P <0.0001 versus MCAO/R+Vehicle group; &&P <0.01, &&&&P <0.0001 versus the MCAO/R+BBR group.
