1. Introduction
During the last decade the development and utilization of cutting-edge technologies, such as IoT and AI, has fueled an exponential growth in different domains [1-3]. The insights of a recent survey indicate that most of the emerging technologies and trends are three to eight years away from reaching widespread adoption but are the ones that pose significant impact during the next years [
4]. Although many of these technologies are still in their infancy, still organizations and businesses that adopt and embrace them early, will be able to gain significant advantages against their competitors. Some of these technologies, such as Edge Artificial Intelligence (AI), Human-centered AI, Synthetic Data, and Intelligent Applications, can significantly impact the healthcare sector, among other domains. The integrations and utilization of these technologies can enhance the provisioning of remote diagnostics, as well as of early diagnosis and pre-diagnosis of critical diseases [
5]. The high demand for remote patient monitoring and personalized healthcare has vastly improved the health analytics techniques and their implementation in healthcare systems. Emphasis on health analytics is also supported by the increasing utilization of wearables and the Internet of Medical Things (IoMT) that provide easy access to a large pool of health-related data. It should be noted that wearable devices are projected to grow at a 9.1% CAGR and IoMT at 23.70% between 2023 and 2032 [
6].
However, the healthcare domain faces various challenges related to the diversity and variety of data, the huge volume, and the distribution of data, thus there is an ever-increasing demand from healthcare organizations to implement and utilize new solutions and data-centric applications that can help gain actionable insights from their data [
7]. Data have long been a critical asset for medical organizations, hospitals, governments, and other stakeholders in the healthcare domain. The massive investments by the healthcare industry into new technologies and the rapid growth in the usage of cloud computing, mobile computing, medical devices, IoMT, and AI are some of the key factors that promote the need for enhanced and state-of-the-art health analytics solutions [
8]. In this respect, health analytic solutions are increasing focusing on exploiting value from primary data (coming from established data sources such as lab results, genomics, and family history), or secondary data (coming from Internet of Medical Things (IoMT) devices that automatically measure and monitor in real-time various medical parameters in the human body). The integration of primary and secondary data has revealed the potentials for greater insights for healthcare and health related decision making [
9]. Even if, for collecting prospective and retrospective clinical data, there already exists a plethora of methods and techniques for automatically capturing such data in batches [
10], this is not the case for the ingestion of streaming data which has come under the attention of research and development during the last five (5) years [11-12]. As a result, current healthcare and assisted living solutions need to be enhanced to support the processing of primary and secondary data, since citizens have increasing access to their personal IoMT devices that can monitor their individual parameters (e.g., heart rate, sleeping condition) and track their daily activities (e.g., distance walked, calories burned). In addition to collecting data, these devices are also capable of offering personalized recommendations to enhance lifestyle, optimize personal activities within living environments, and proactively prevent the onset of health-related issues [
13].
However, to effectively work with primary and secondary data, there are still challenges with regards to standardised discovery and interoperability of different types of devices/data, as well as security and privacy of data to be used in existing healthcare platforms. Existing IoMT devices most of the times are surrounded by high levels of heterogeneity, since they have diverse capabilities, functionalities, and characteristics. In such cases, it becomes essential to offer abstractions of these devices to both the platforms and the end-users and develop tools to handle the lack of interoperability among them [
14]. Hence, another challenge that emerges is related to addressing the heterogeneity of different IoMT devices, along with the difficulty of healthcare systems/platforms to effectively communicate and interact with these devices. In that direction, there is an even growing demand to develop methodologies and procedures for the standardised integration, processing, and analysis of heterogeneous data driven from divergent data sources and devices in the modern Healthcare Information Systems (HIS). Such improvements can lead to enhanced diagnostics and care strategies, as well as to the extraction and utilization of actionable value and knowledge from available data in the healthcare domain.
Timely diagnosis is very important when it comes to the critical diseases, such as cancer, and especially to pancreatic cancer that is uncurable and usually lacks clear symptoms at its early stages [
15]. Understanding the underlying causes or risk factors can help to identify individuals at high risk of developing pancreatic cancer. From there, specific measures (preventions and interventions) can be introduced to reduce the risks e.g. by working on modifiable risk factors that relate to lifestyle, behaviors, and social interactions (e.g., reduction in smoking, alcohol, obesity, red meat consumption, and increasing intake of vegetables, increasing fruit and regular physical exercise) [
16]. Early detection allows for more effective planning and the implementation of appropriate interventions and possible treatments to improve Quality of Life (QoL) of the affected individuals [
17].
Early identification of modifiable risk factors of pancreatic cancer relies on healthcare professionals (HCPs) to possess sufficient knowledge, age-appropriate care programs and community-based approaches towards specialized, multidisciplinary services both in terms of prevention and interventions on diverse cancer related factors. However, a significant gap still remains between the delivery of stratified healthcare, because current approaches often take a one-size-fits-all approach [
18]. Personalization implies a level of precision that seeks to treat the patient as opposed to the disease, taking into account as an example comorbidities, genetic predisposition and environmental factors. Lack of integrated data (e.g., lifestyle data, Patient-Reported Outcome Measures (PROMs), Patient Reported Experience Measures (PREMs), and genomic data) from patients that would allow clinicians to make personalized decisions as part of their clinical decisions limits the effectiveness of prevention strategies. Lack of integrated health data also hampers the potential of patient centric interactions between HCPs, healthcare authorities, patients, and caregivers, as well the potentials of advanced technologies, such as AI, for accurate risk prediction, prevention, and intervention [
19].
Considering all these challenges, by effectively gathering, standardizing, and analyzing both primary and secondary data, collective community knowledge and personalized health insights could be extracted. The latter is facilitated by the collection, integration, and analysis of information from different sources concerning individuals for the provision of actionable insights at the point of care. To address gaps and requirements in individualized or personalized healthcare, this article introduces a digital platform that aims to integrate heterogeneous data sources to realize Holistic Health Records (HHRs) that can provide complete integrated data views. To effectively construct the HHRs, the platform develops various data management techniques that cover the complete data lifecycle, from the collection of the heterogeneous data until its aggregation, processing, and harmonization. The data in the HHRs are analyzed using advance AI techniques embedded in adaptive learning models that are used to provide decision support to HCPs in the form of early risk predictions as well as personalized prevention measures. To this end, the digital platform enables the management of integrated and harmonized data in the HHR format, and its analysis and exploitation by AI-based algorithms. The platform also provides advanced decision support functionalities to enable healthcare experts to provide added-value care services to cancer patients for improved Quality of Life (QoL).
The digital platform introduced in this article, called iHelp, has been evaluated through diverse real-world scenarios that provide different datasets, ranging from hospital-retrieved data to data from wearables, questionnaires, and mobile applications proving its wider applicability and overall efficiency. The platform is developed in the context of the EU-funded project iHelp (hence the name iHelp platform) that seeks to deliver a novel personalized-healthcare framework and digital platform that can enable the collection, integration, and management of primary and secondary health-related data [
20]. In addition to the emphasis on data, the platform provides advanced AI-based learning, decision support and monitoring systems to help with early identification and mitigation of pancreatic cancer related risks.
The remainder of the paper is structured as follows.
Section 2 describes the overall architecture of the proposed mechanism, depicting all of its incorporated components and the integration approach among them to achieve improved healthcare data integration and analysis.
Section 3 evaluates the reference implementation of the mechanism against a real-world healthcare scenario, whereas
Section 4 discusses the effectiveness of the current research work and its overall contribution, as well outlines any future work. Finally,
Section 5 concludes this article.
2. Materials and Methods
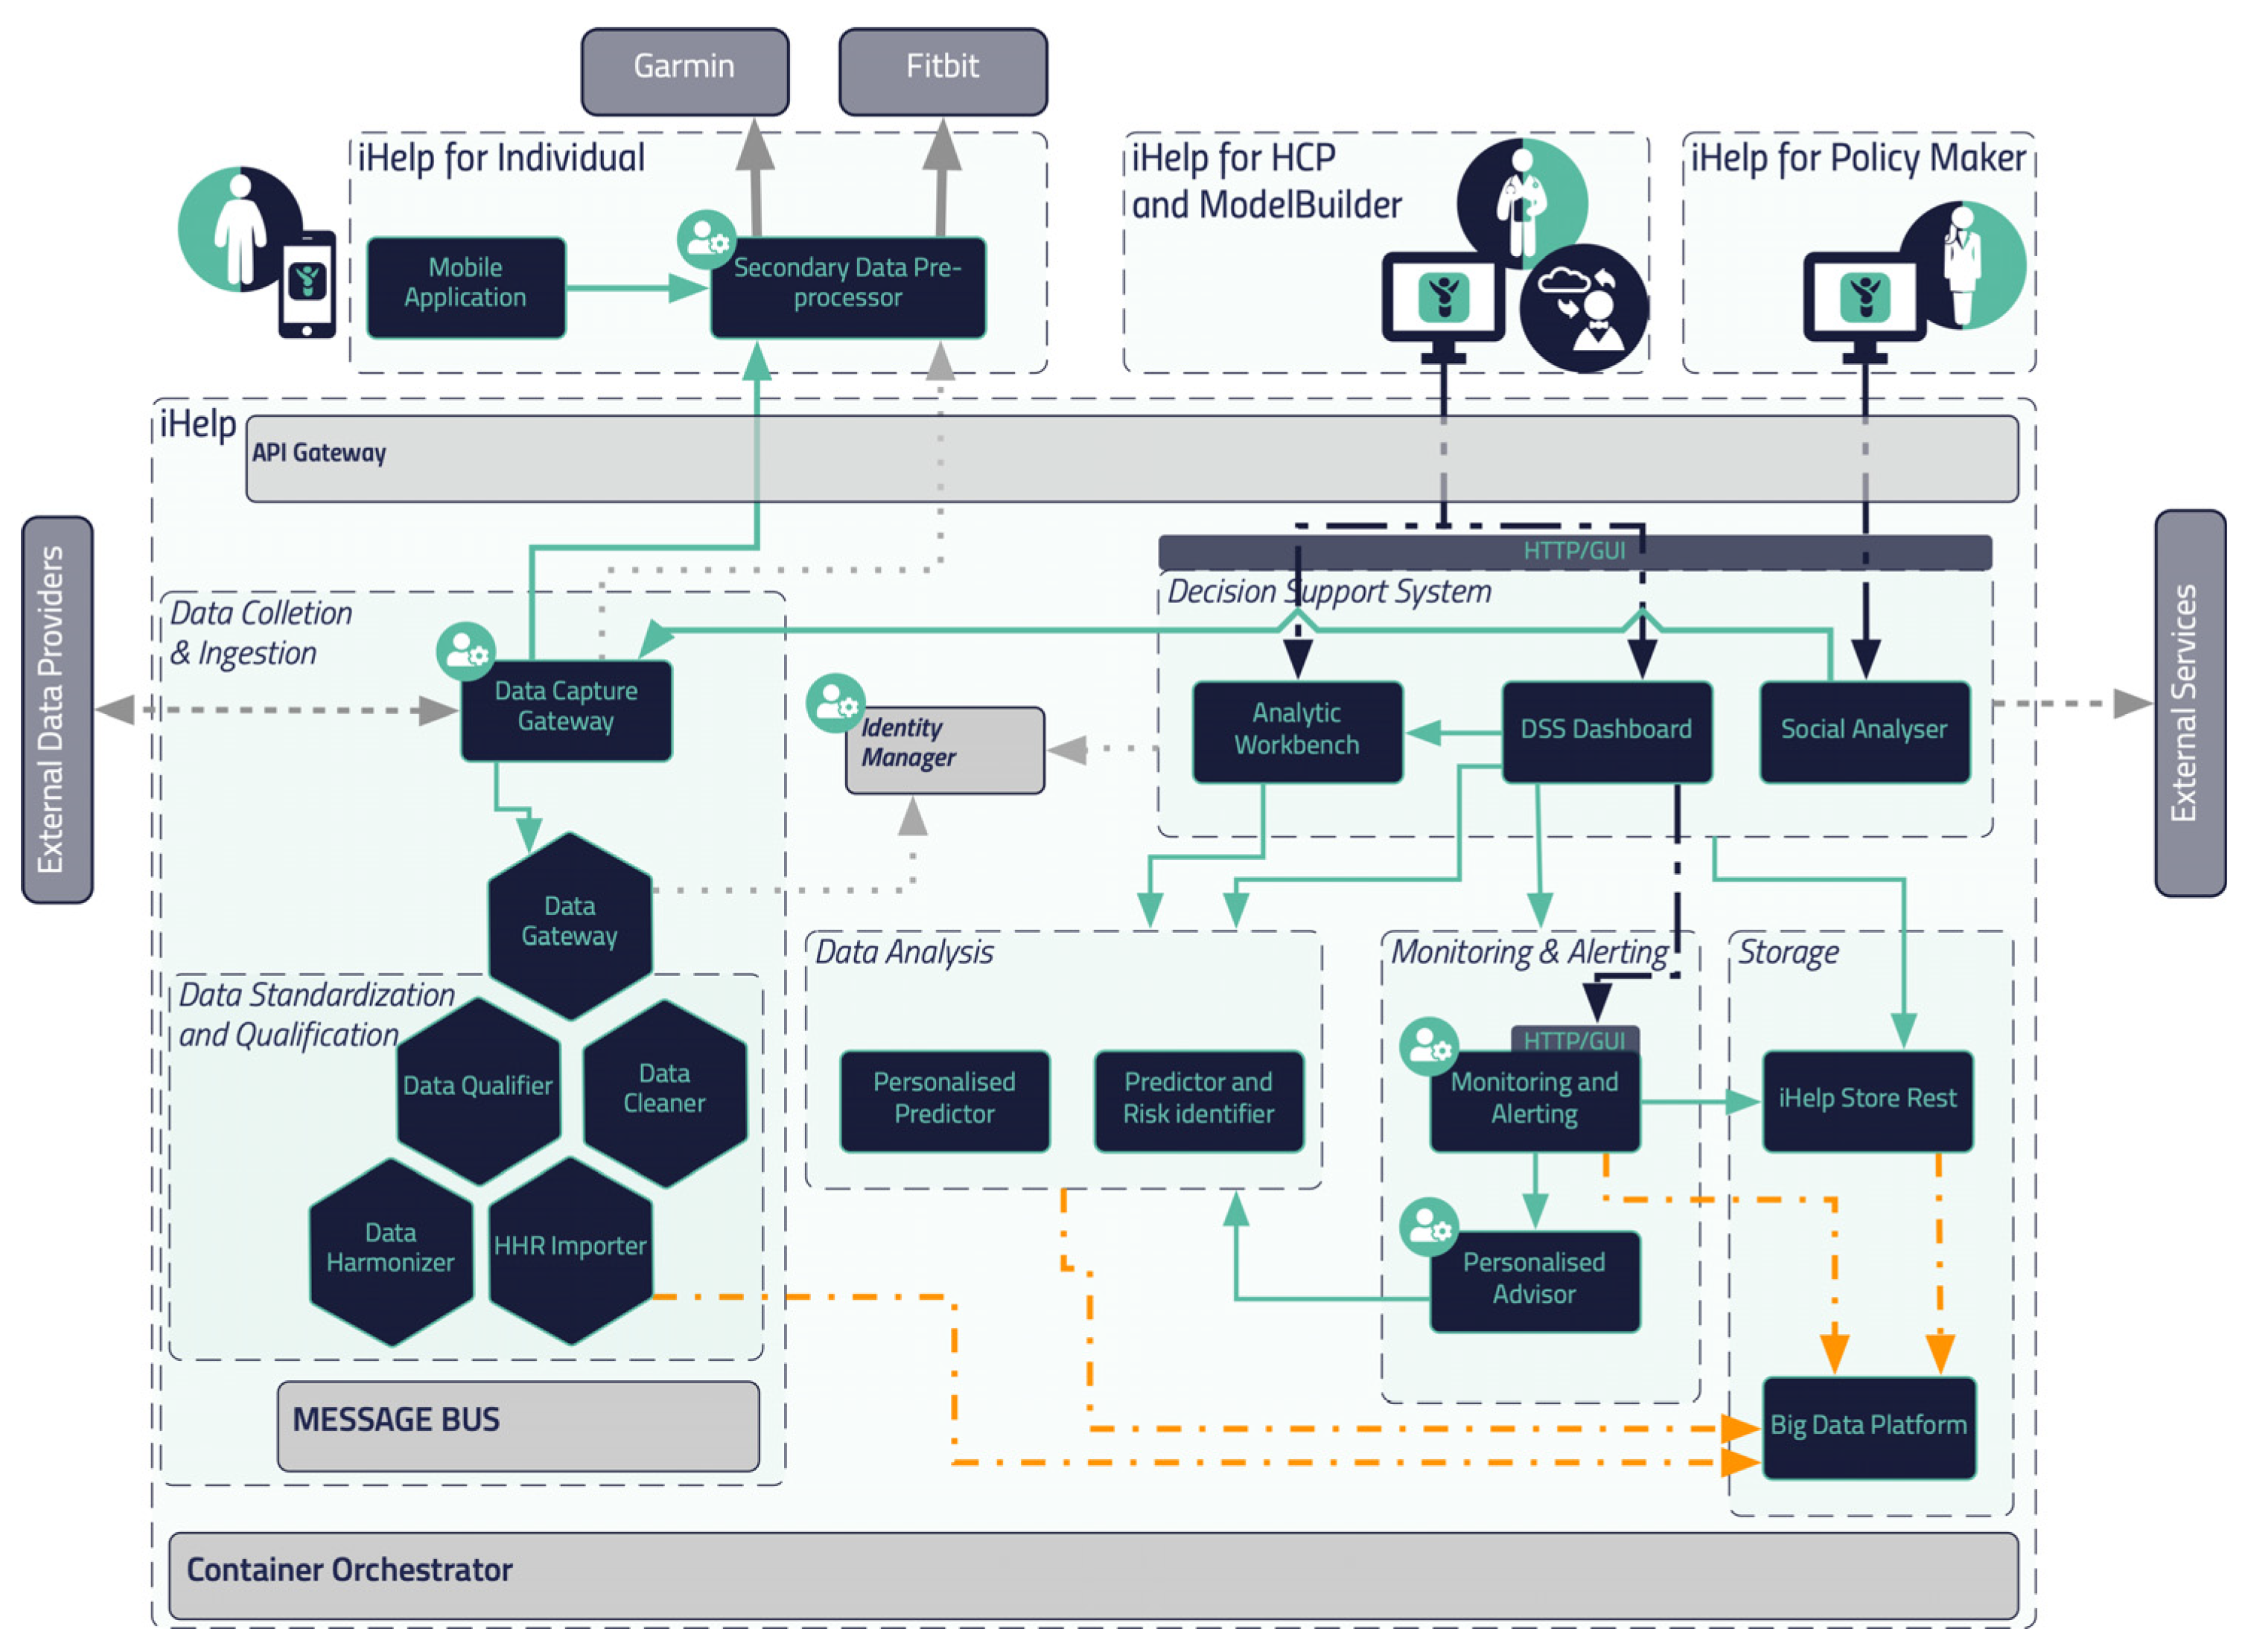
The flowchart and reference architecture of the iHelp platform is depicted in
Figure 1. More specifically, the platform consists of 5 different building blocks or sub mechanisms: (i)
Data Collection & Ingestion, (ii)
Data Standardization and Qualification, (iii)
Data Analysis, (iv)
Monitoring and Alerting and (v)
Decision Support System. The integration of these different building blocks results on an end-to-end integration and exploitation of the raw data though this novel and holistic platform. It should be noted that the secondary data referred to in this article (and used within the iHelp platform) correspond to the data collected from Garmin wearable device, whereas the primary or batch data correspond to the historical personal data of the individuals.
2.1. Referecence Architecture
In this section, a blueprint of the proposed platform is presented, along with the internal process that takes place for its seamless interaction and integration with either secondary data sources (i.e., wearable devices) or primary data sources (i.e., hospital systems and databases), as depicted in
Figure 1. As described previously five (5) different building blocks and phases are incorporated in the iHelp platform. It is characterized as a reference architecture since it is presented at a high-level, abstract, logical form, which provides a blueprint for the implementation of different functionalities such as the AI-based healthcare analytics. In more detail, the platform initially consists of the sub mechanisms of
Data Collection and Ingestion, through which it may connect to heterogeneous data sources and gather their data, and of the
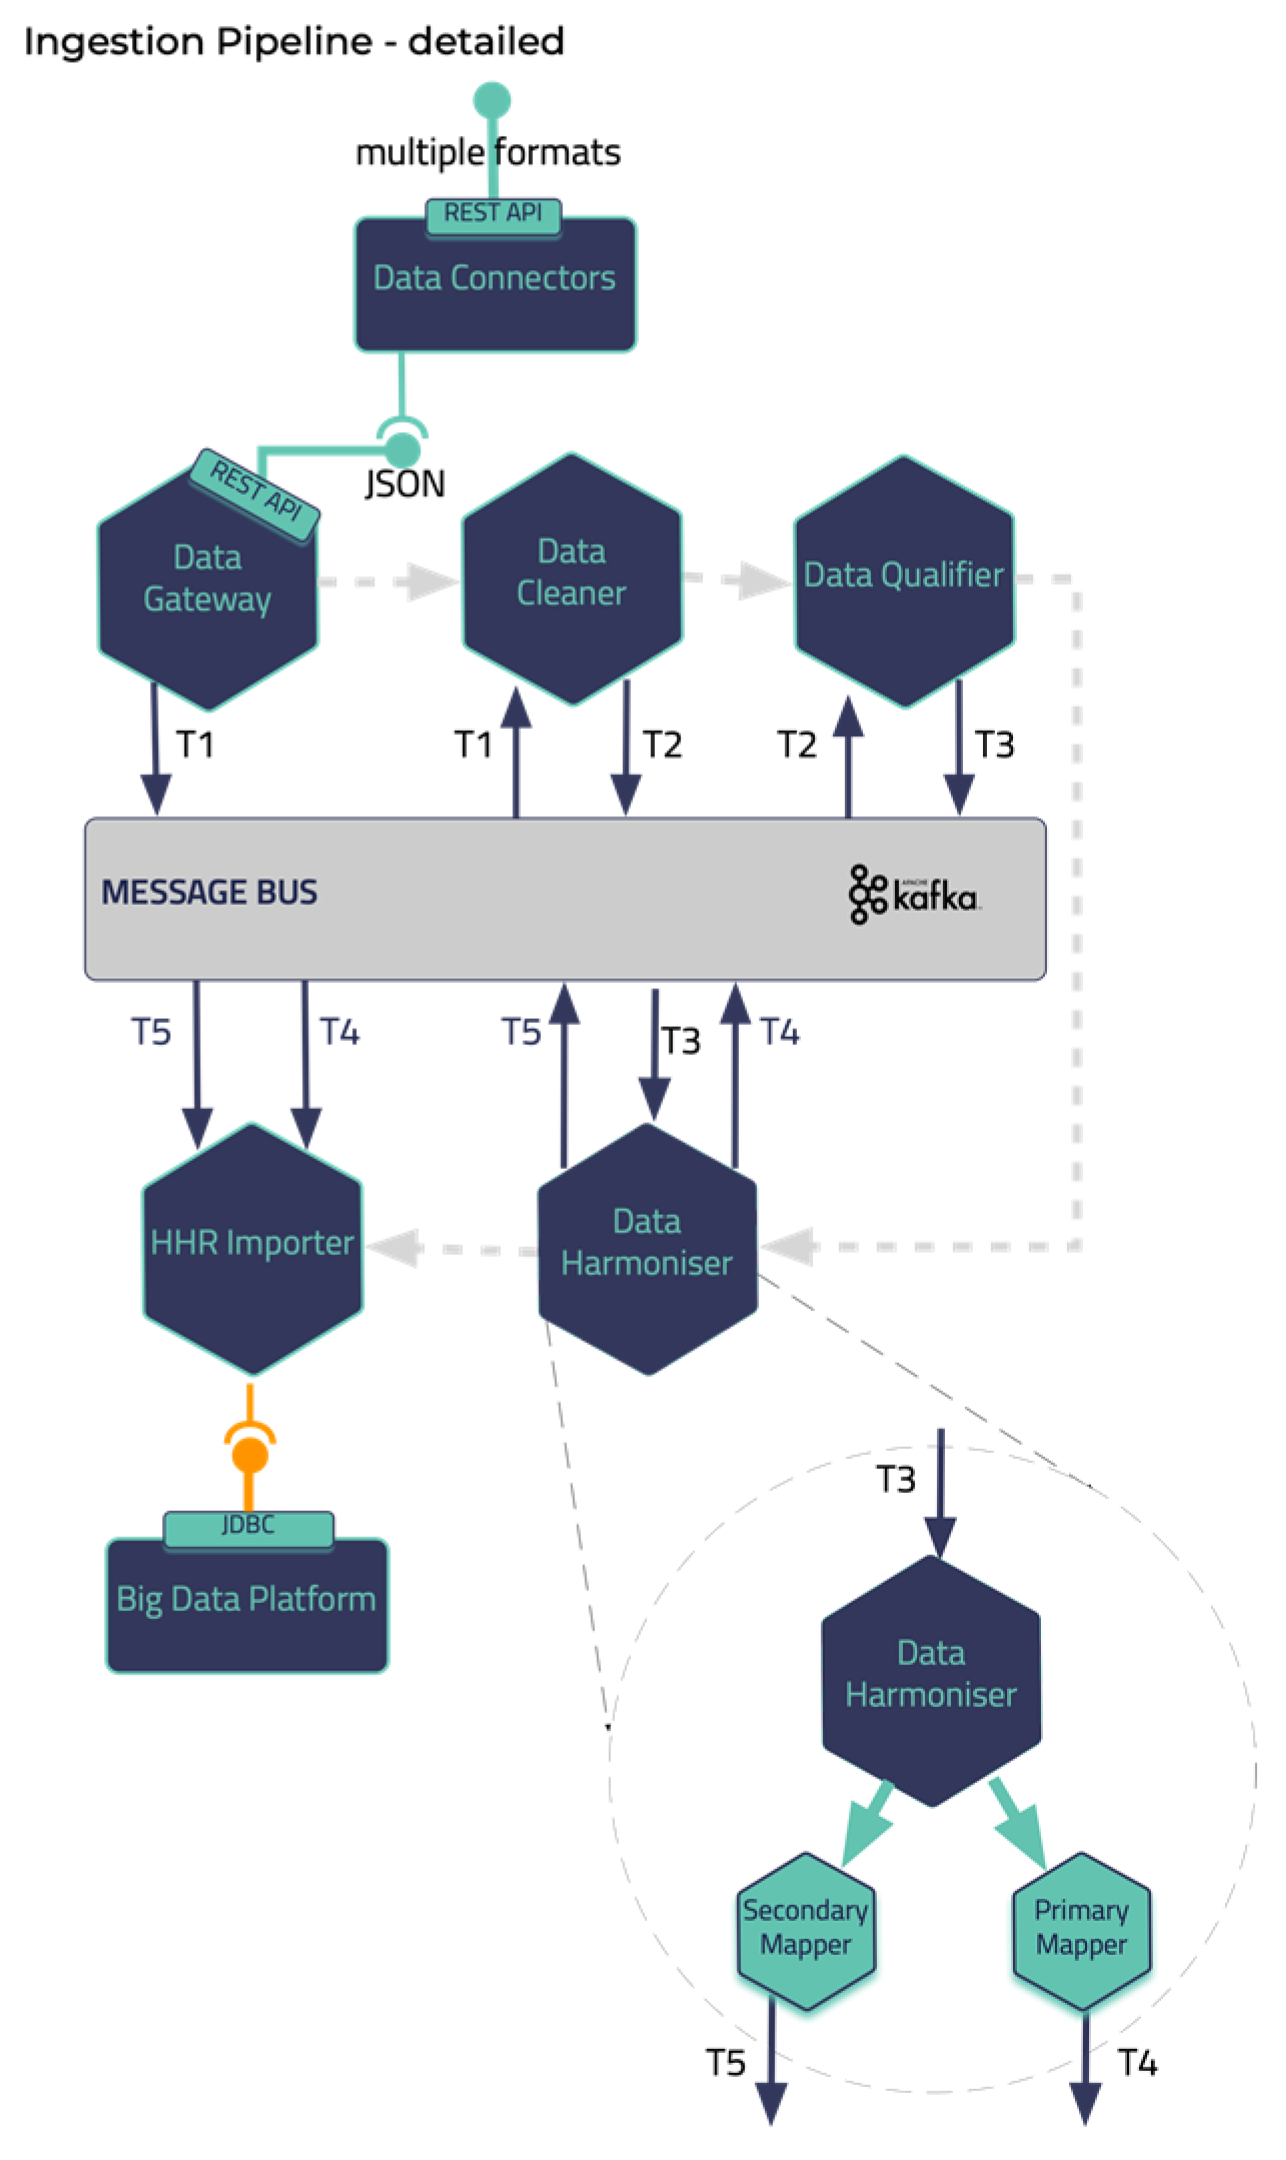
Data Standardization and Qualification that can process and harmonize the external healthcare data it receives and store them in its internal datastore. These two building blocks represent the end-to-end Data Ingestion Pipeline of the iHelp platform, as depicted in the
Figure 2. Other software components in the Pipeline are the Data Capture Gateway, Data Cleaner, Data Qualifier, Data Harmonizer, and HHR Importer that consume data from one and produce them to the other by utilizing the capabilities of the Kafka message bus that is further described in the next sub section.
The iHelp platform also integrates sophisticated techniques and AI algorithms for performing the Data Analysis (sub mechanism) so that HCPs are able to glean invaluable insights from the integrated patient data, enhancing their ability to tailor treatment plans and preventions. Concurrently, the utilization of Monitoring and Alerting components diligently oversees patient conditions and system performance, rapidly notifying HCPs of any irregularities or critical occurrences. Finally, the implementation of a Decision Support System empowers HCPs with intelligent recommendations and data-based support, assisting them in making informed decisions that prioritize patient well-being. The latter also acts as the frontend of the iHelp platform by visualizing the insights derived from the Data Analysis and Monitoring and Alerting sub mechanisms. Together, these interconnected sub mechanisms create a powerful synergy, enabling more efficient and effective healthcare decision making while promoting improved health outcomes for all stakeholders.
2.1. Integration Approach
What concerns the integration of all these different components the open-source Kafka and Kubernetes tools are utilized providing a containerized approach of integrating the iHelp platform. The latter enables the deployment of this platform in different environments and infrastructures showcasing its interoperability and improved adaptability in any deployment environment e.g., in stakeholders’ servers and premises. The manifests that are developed as part of the deployment scripts contain all the needed components and respective installation prerequisites to establish and deploy the platform as a whole. On top of this, it should be noted that the iHelp has already been deployed and evaluated for its functionality and performance in the premises of two different hospitals (in EU) in the context of the iHelp project.
To facilitate seamless and reliable data exchange between different components such as the two first sub mechanisms (i.e.,
Data Collection and Integration, and the
Data Standardization and Qualification), the iHelp platform uses Apache Kafka [
21]. Kafka is a message broker and stream processor that allows to publish, subscribe, archive and process streams of data/records in real time. It is especially designed to manage data streams from multiple sources by distributing them to multiple consumers. In this way, Kafka facilitates the collection and processing of both primary and secondary data that are ingested into the introduced mechanism.
Apart from the use of Kafka as the platform’s message broker mechanism, the Kubernetes platform is utilized [
22] to provide DevOps services. Kubernetes (K8s) is an open-source platform that automates Linux container operations. The integration between K8s and Kafka results on the simplification of the deployment of Kafka brokers as containerized pods, as each Kafka broker can run as a separate pod, ensuring scalability, fault tolerance and availability of the overall approach. On top of this, microservices can be deployed to easily consume and produce data to Kafka topics, allowing for real-time data processing and analysis of the processed data in the context of the project. Finally, K8s eliminates many of the manual processes involved in deploying and scaling containerized applications and allows to manage host clusters running containers easily and efficiently and for enhanced management of the K8s cluster the Rancher tool is utilized.
2.3. Data Collection and Ingestion
Health data can result from clinical tests performed invasively on samples taken from the patients’ bodies, or non-invasively using modern depicting techniques. Such data, obtained in a clinical setting, are of paramount importance and are termed as primary, but certainly does not form the complete spectrum of health data [
23]. Today the importance of environmental factors, diet, and living habits is well-established. The patients’ living habits can be enumerated using data attributes about their lifestyle, obtained in their natural environment, outside the clinical setting. These types of data are termed secondary, since they correspond to health but are not determinists of typical health systems.
The Data Collection and Ingestion building block in the iHelp platform is responsible for the integration, anonymization, and verification of the primary and secondary data. Depending on the data source type that is connected and the corresponding way that must be used for ingesting its data (i.e., streaming collection for unknown sources and batch collection for known sources), this (Data Collection and Ingestion) sub mechanism utilizes different connectors of the Data Capture Gateway as its main interfacing component.
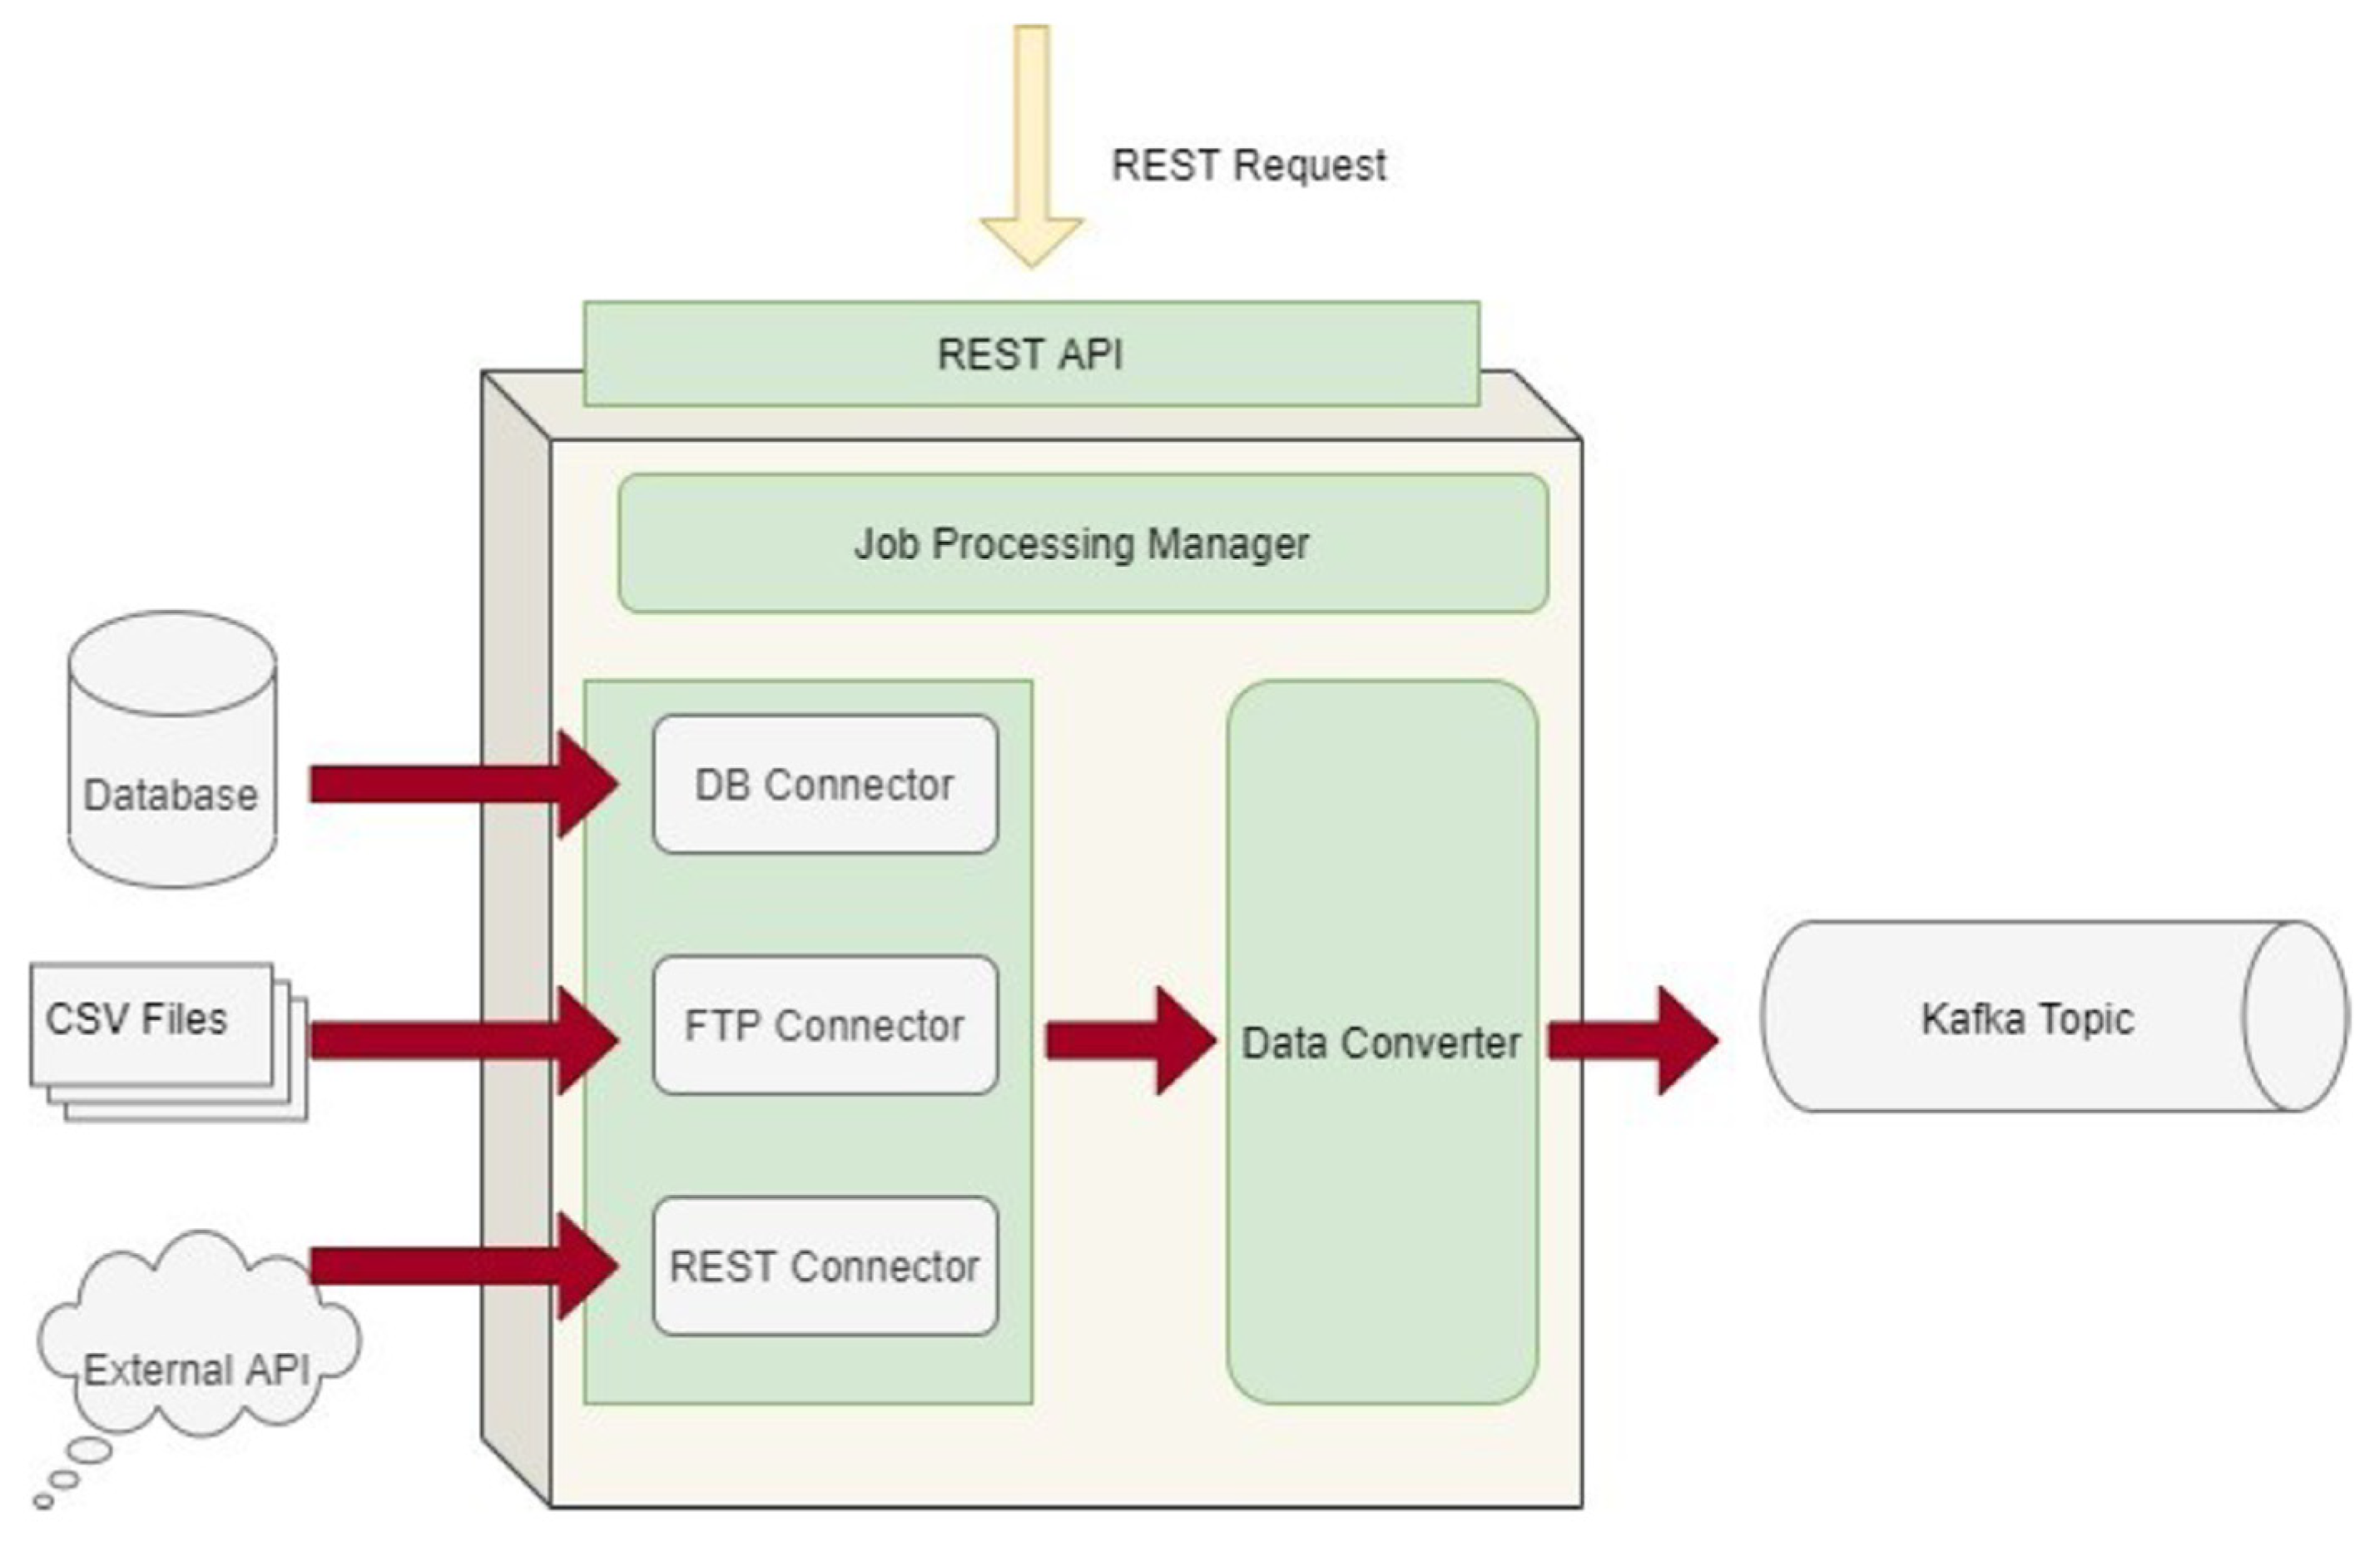
The Data Capture Gateway is the component that can be considered as the interface between the iHelp integrated platform and the external data sources, both primary and secondary, from which it captures the data to be pushed into the established data ingestion pipeline. The Gateway implements a standalone Java process, or a microservice, that take cares of connecting to the various external data sources and sends the data to an intermediate Kafka topic, so that the data can be retrievable from the other functions in the Data Ingestion Pipeline. As such, it also provides REST APIs that are used to initiate data capture activities or schedule them for a later or a periodic execution. The REST APIs of the Gateway are deployed into a servlet container, however they make use of the core functionalities of the Data Ingestion Gateway and therefore, both the REST APIs and the code implementation are inside the single Java process. A high-level overview of the different software elements of this initial design are depicted in
Figure 3.
As the Data Capture Gateway captures data from the supported primary data sources, it forwards them into a common Kafka topic from where it can be used by different components in the data pipeline. As it has been described in the previous sub sections, all software components that are involved in the Data Ingestion Pipeline are interchanging data through Kafka broker.
With regards to the secondary data, they comprise attributes that enumerate different important aspects of the way the patients live their lives. The attributes are grouped in the physiological, psychological, social, and environmental categories [
24].
The physiological attributes are concerned with the human body, its activities, and adverse events. They are mostly measured using activity trackers e.g., steps walked, distance walked, elevation (or floors climbed), energy dissipation, time spent in different activity intensity zones and exercise activities (walking, running, cycling, etc.), as well as their distribution in the day. Attributes related to the functioning of the heart include the continuous measurements of the heart rate variability and the time spent in different heart rate zones, as well as the daily resting heart rate measurement. Sleep related attributes include continuous measurements on the time spent in the different sleep stages (awake in bed, light, REM, deep sleep). Other physiological attributes like Symptoms of interest, weight and nutrition can be self-reported by the participant using widgets on a mobile app or questionnaires.
The psychological attributes refer to the emotions of the patients. They are mostly reported (although audiovisual or text-based emotion detection is possible) and include emotional state self-assessment using questionnaires or standardized reports from professional therapists.
The social attributes can be measured indirectly based on the usage of the mobile phone (diversity, duration, frequency of calls) and social media (diversity, number, frequency of interactions). More direct information can be reported using questionnaires on activities with others or can be obtained in conversation with a digital virtual coach or mobile app.
The environmental attributes include reported environmental indicators for the assessment of the quality of life. Measurements of living environment quality can be obtained by integrating relevant commercial devices (e.g., for air quality analysis), or by integrating with data services that report the Air Quality Index or weather details at the patients’ locations.
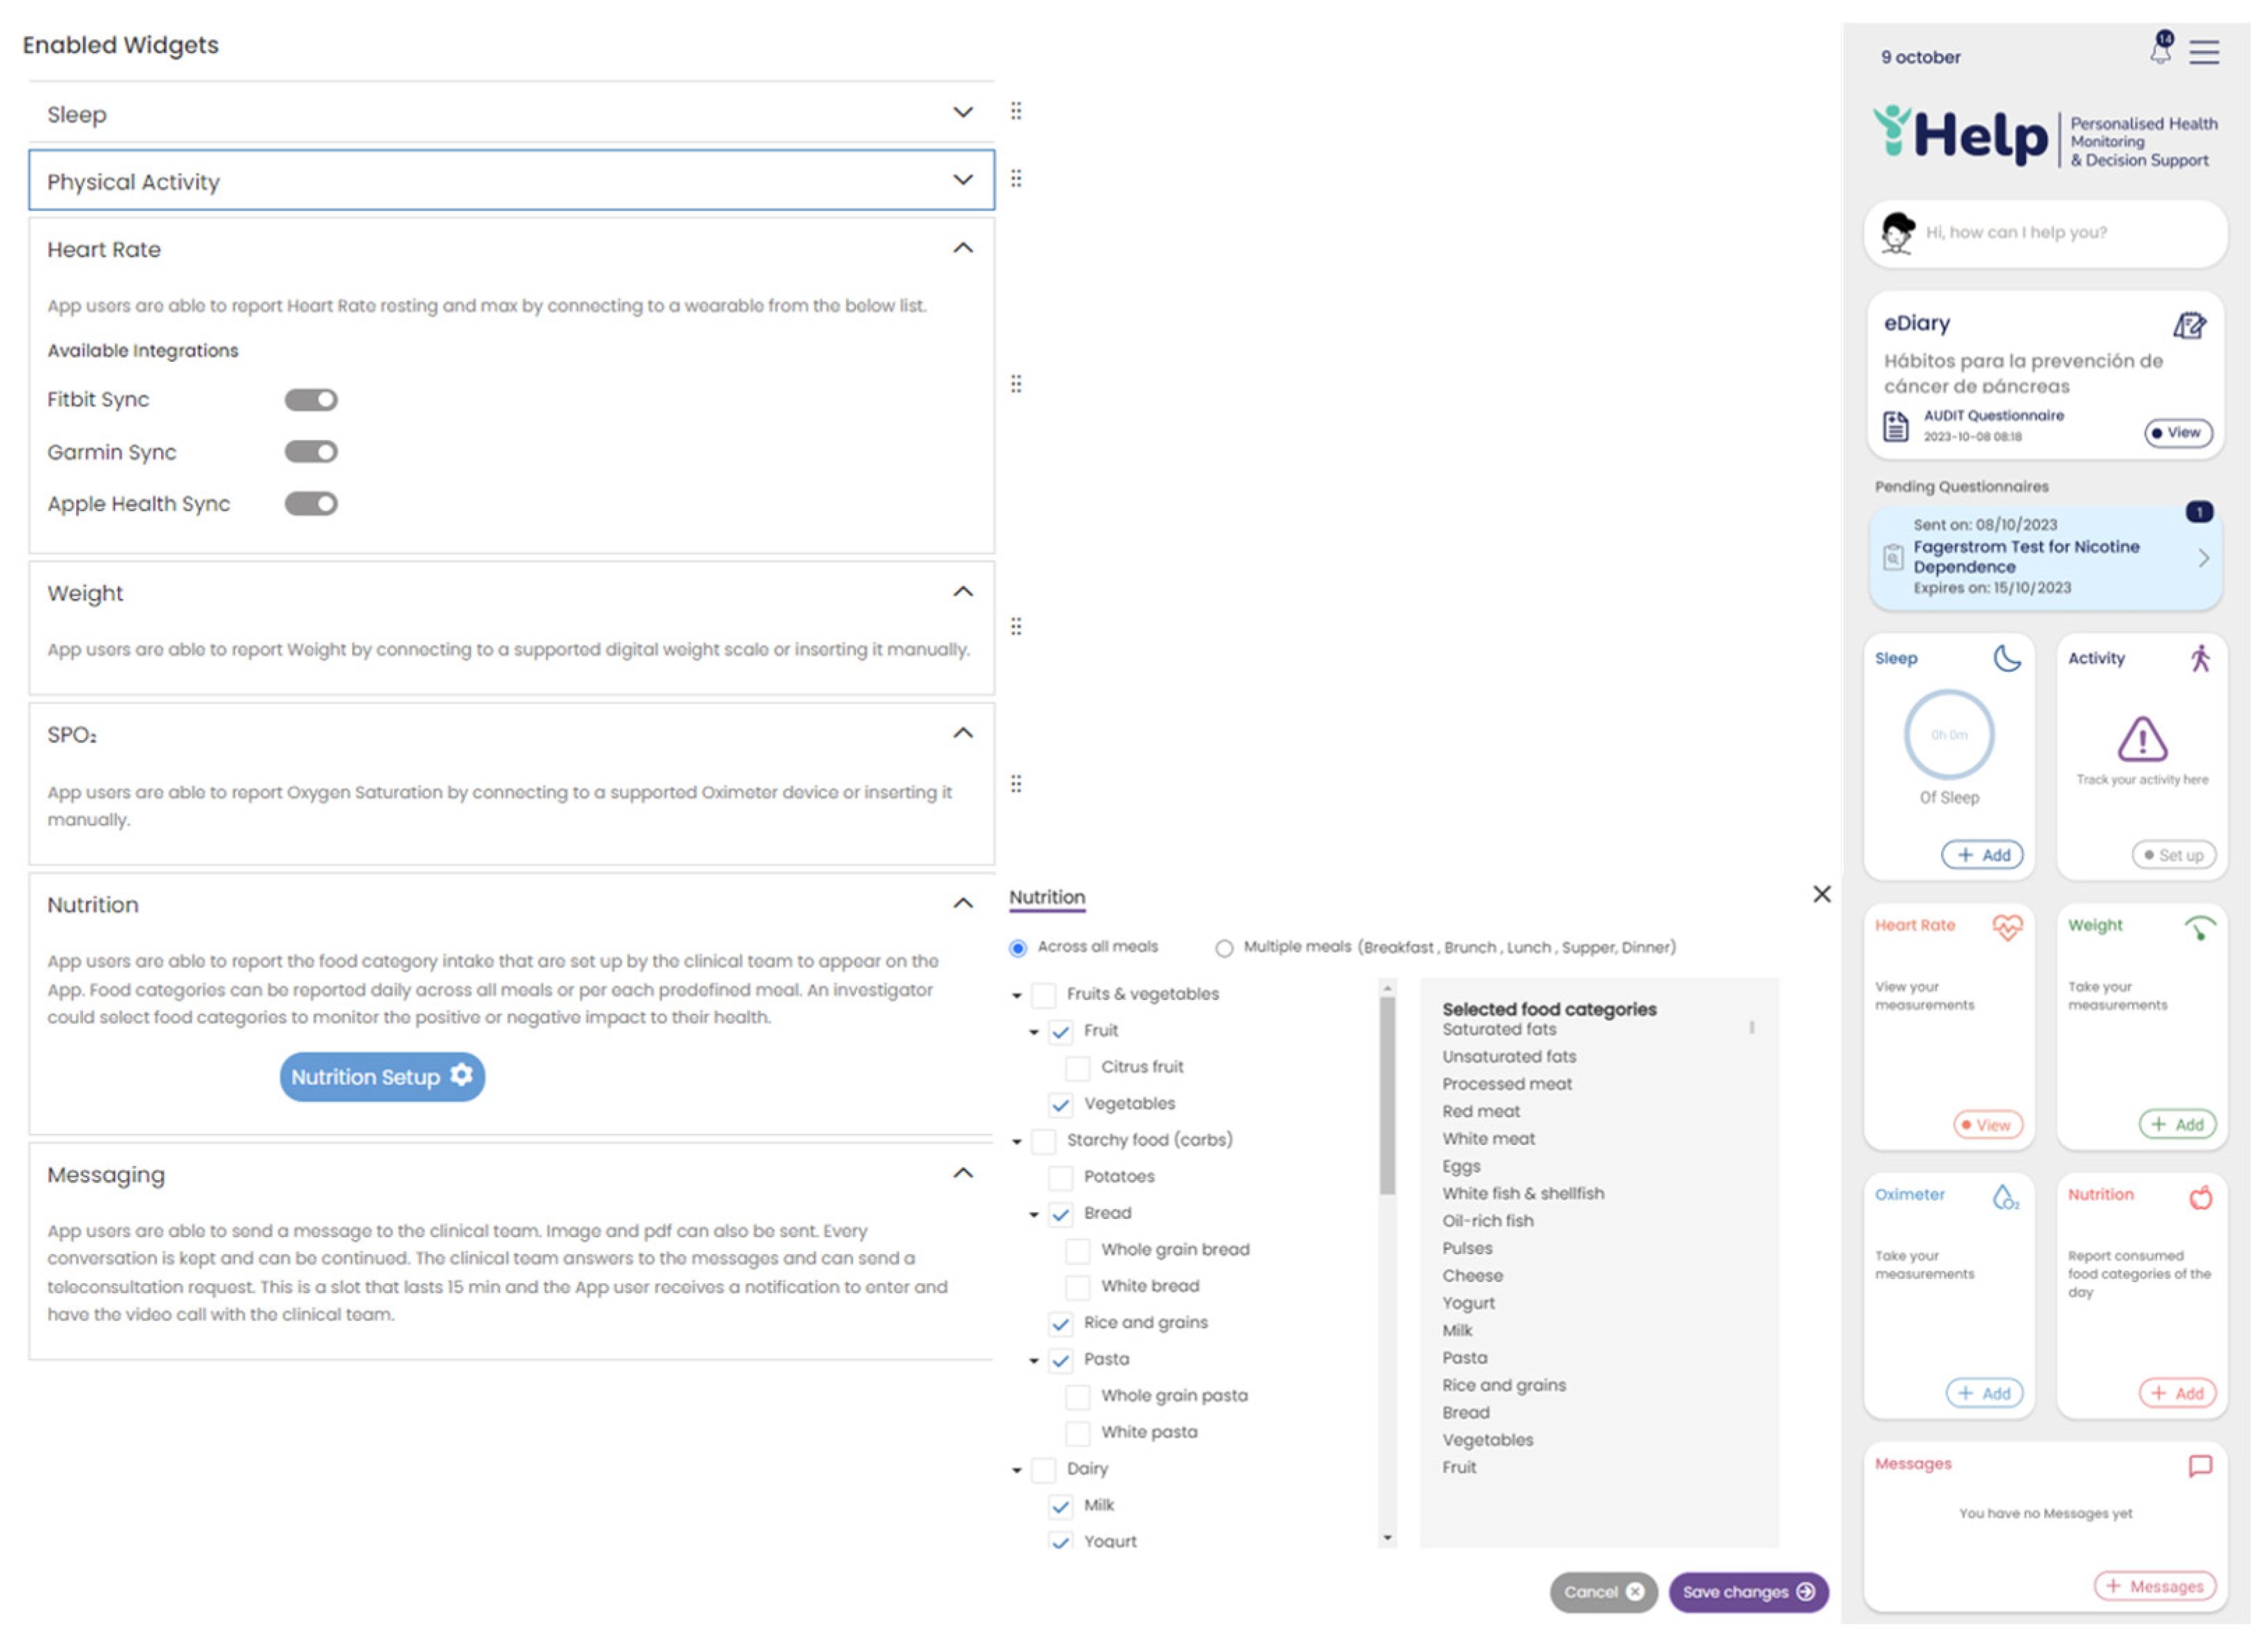
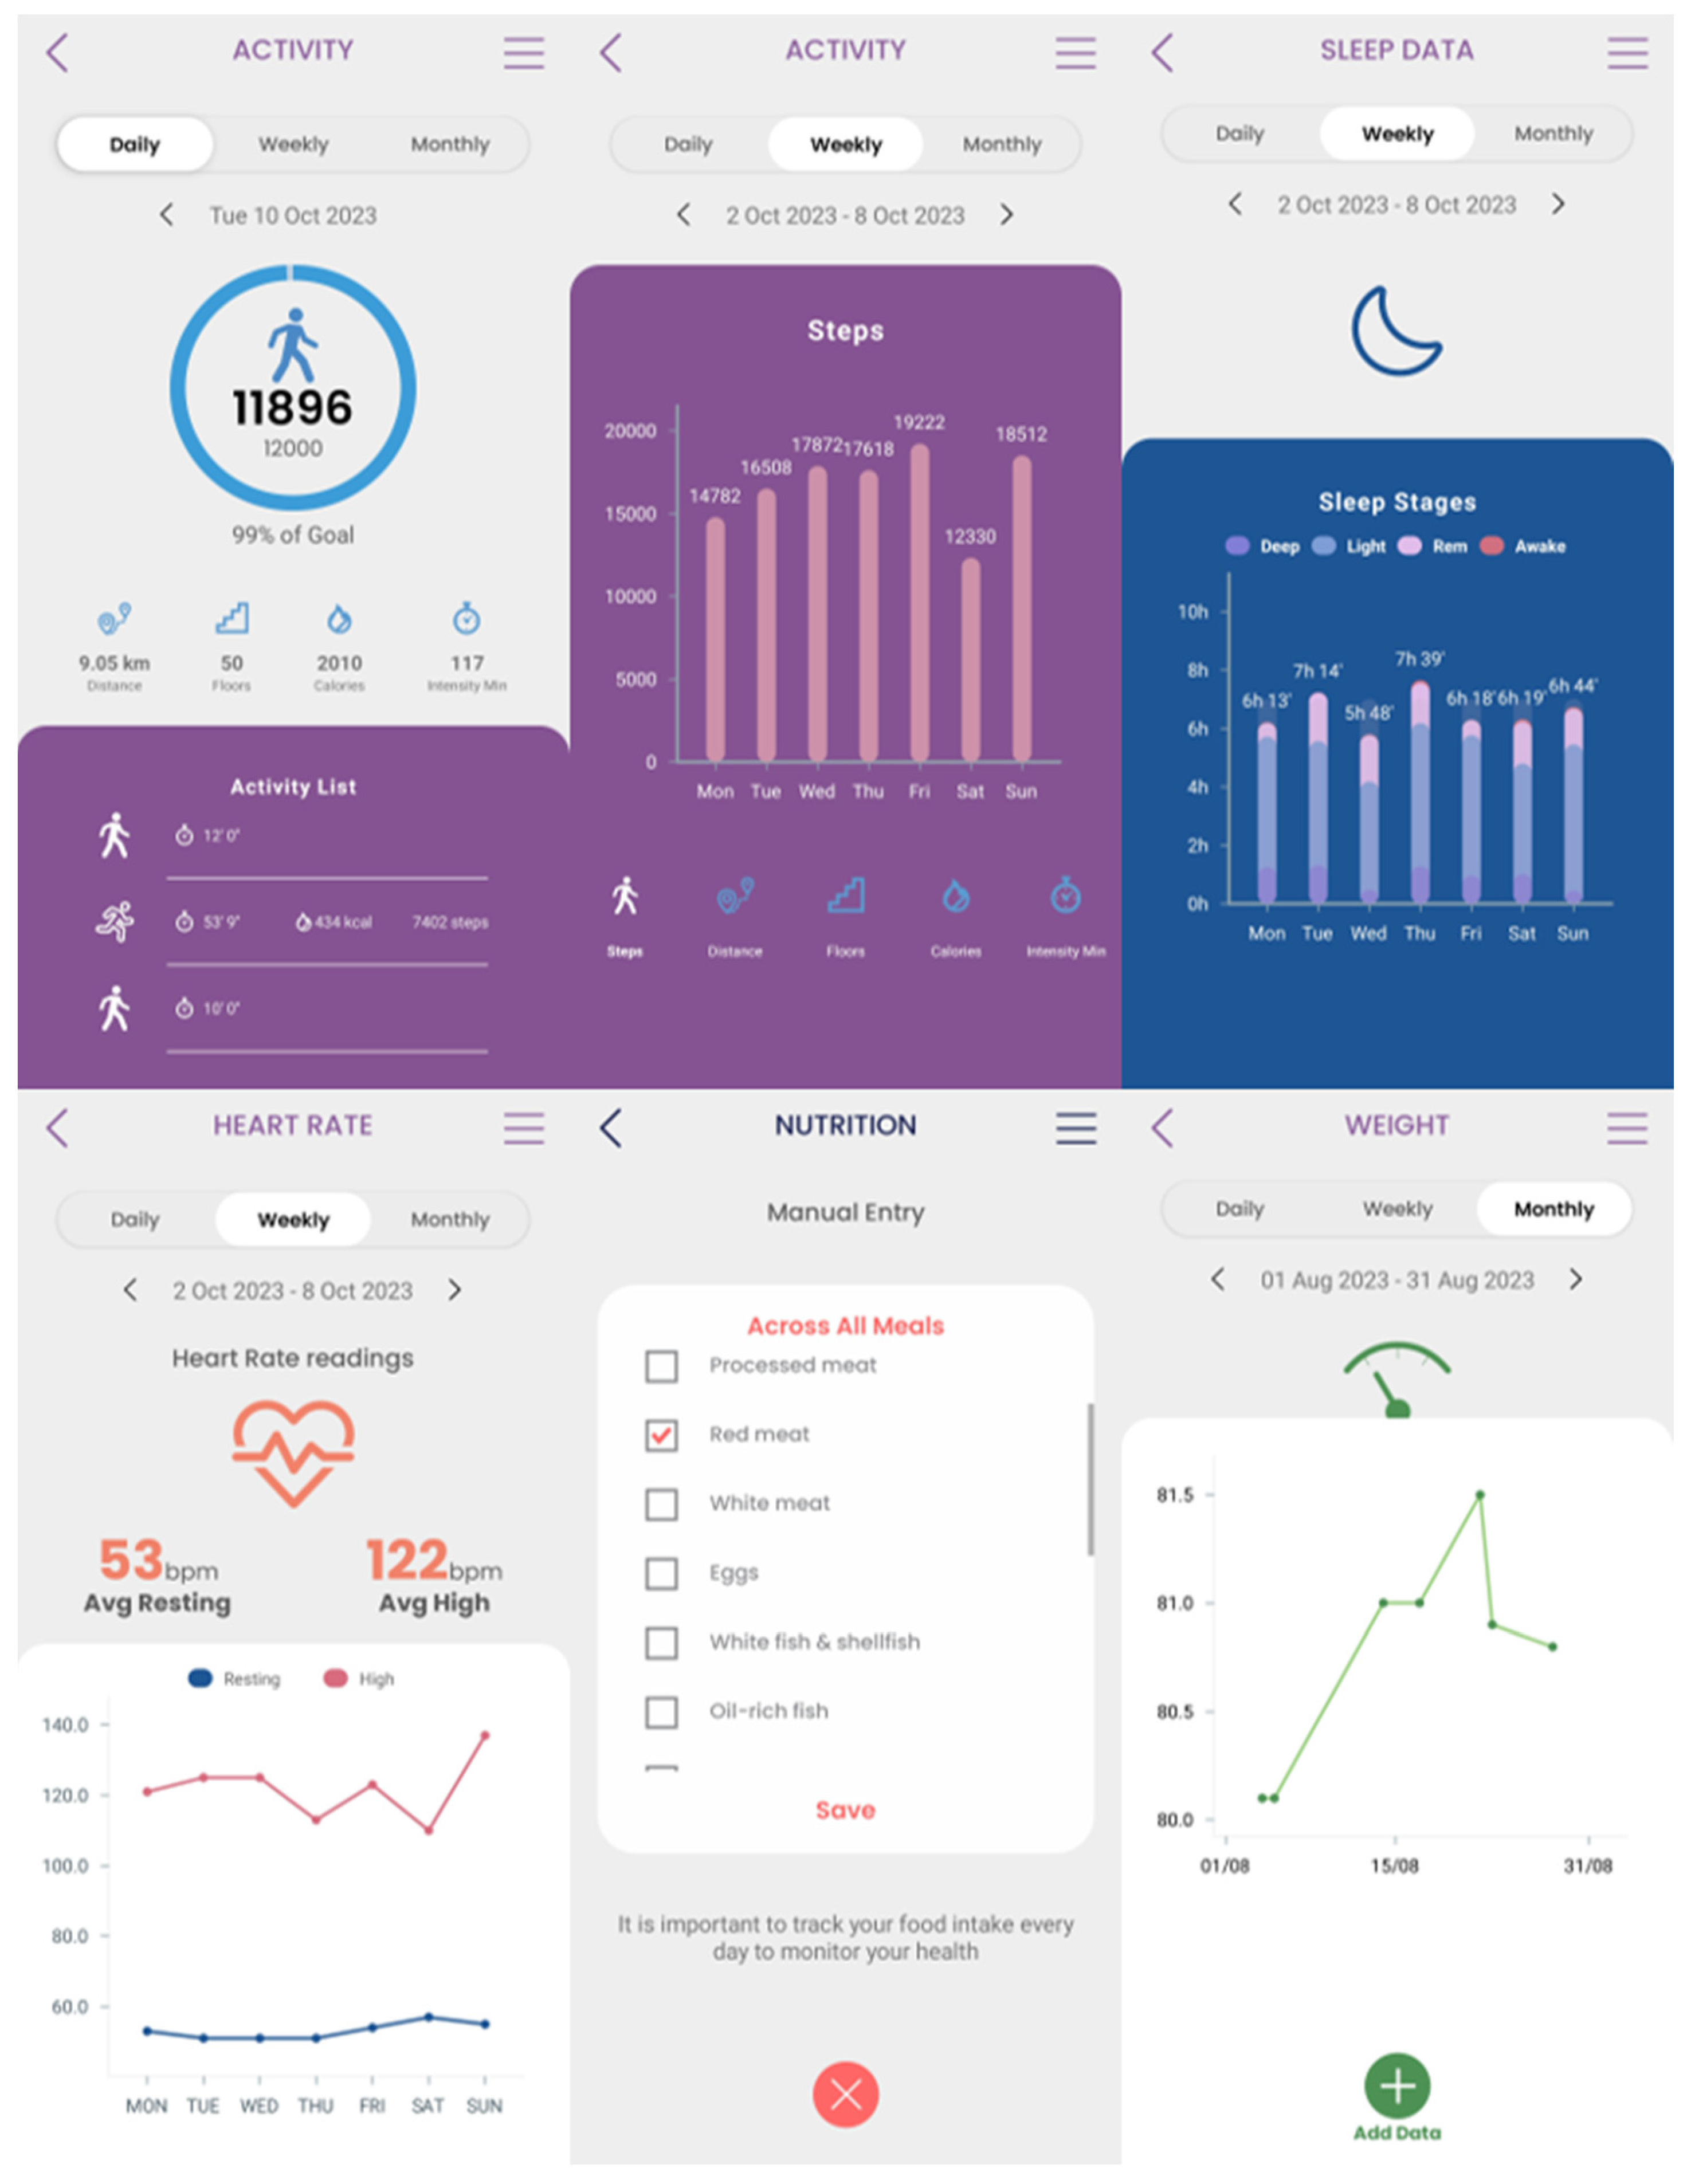
Secondary data collection can be done by the patients at their own everyday setting, using a mobile application. The Healthentia mobile application was selected to be utilized in the context of this research work. This mobile application offers interoperability between different mobile and wearable devices and allows to capture data concerning all the abovementioned health determinants and categories [
25]. Regarding the use of this application, at first, the corresponding portal is used to define the mobile app functionalities and the settings applied for a particular clinical study. This step results into the setup of the main application dashboard, as depicted in
Figure 4. The data that are captured for each specific individual of the study is then transported in the iHelp platform through the secondary data connector of the Data Capture Gateway. From the Gateway, the data are forwarded to the internal Data Ingestion Pipeline for their further processing, cleaning, and transformation to the corresponding HHR data model.
2.4. Conceptual Data Modelling and Specification of HHRs
For addressing interoperability challenges, it is of paramount importance - - to develop adaptable and standardised data structure, which are termed as Holistic Health Records (HHRs). The HHR model is developed using existing models as a guide, with specific focus on the HL7 FHIR standard [
26]. Although the HL7 FHIR standard is still in development and primarily designed to represent clinical data, it incorporates the capability to represent a broader range of data going beyond clinical information e.g., streaming data originating from sensors. In this respect, our HHR model is engineered to be versatile and adaptable to various contexts, thanks to the flexibility offered in the HL7 FHIR standard.
Regarding the construction of the HHR model, the data gathered from the hospitals were initially grouped into medical categories for easier analysis of the concepts such as Pathology, Medication etc. Then every concept was mapped to the most relevant FHIR entity resources. The FHIR entities resources mostly used were Person, Observation, Condition, Procedure, Encounter, MedicationAdministration etc. Any concept not directly mapped to a FHIR element resource was modelled exploiting the standard mechanism provided by the FHIR standard, the Extensions, as an FHIR Extension inside the most relevant FHIR element mentioned thus creating a separate Profile for these elements. Similarly, the not standardized values of the hospital’s data attributes were translated, following the HCP’s knowledge into standard SNOMED concepts [
27]. If an attribute did not have a direct representation in SNOMED, it was included in the iHelp FHIR CodeSystem as a custom element. The representation of the iHelp conceptual model was achieved by using TTL, utilizing the FHIR ontology and the official guidelines in relation to creating FHIR CodeSystems, Extensions etc.
2.5. Data Standardization and Qualification towards HHRs
The deployment of advanced healthcare analytical tools and frameworks not only results in the increased productivity of the healthcare professionals but also overall improved patient management and care. However, the analysis of data is mostly reliant on standardization and qualification of underlying data [
28]. To this end, the proposed pipeline in the iHelp platform addresses these aspects by exploiting three (3) processing phases, the cleaning, the qualification, and the harmonization of the data. These phases are realized through the design and implementation of three (3) integrated subcomponents, i.e., the Data Cleaner, the Data Qualifier, and the Data Harmonizer respectively as depicted in
Figure 2 and initially introduced in [
29].
In deeper detail, as soon as all the needed data are ingested into this pipeline by the Data Collection and Ingestion building block the first two phases of this pipeline are responsible for the cleaning and quality assurance of the collected data. Thus, from the very beginning of the overall processing pipeline, it aims to clean all the collected data and to measure and evaluate the quality of both the connected data sources and their produced data. To successfully achieve that, the optimized pipeline exploits two (2) separate modules, the Data Cleaner subcomponent, and the Data Qualifier subcomponent. Sequentially, in the harmonization phase, the interpretation and transformation of the collected cleaned, and reliable data takes place through the implementation and utilization of the Data Harmonizer. This component incorporates two (2) subcomponents, the Terminology Mapping service, and the Data Mappers to further transform the cleaned and reliable data and to provide interoperable, harmonized, and transformed into the HL7 FHIR standard data. To this end, the proposed pipeline facilitates the standardization and qualification of the heterogeneous primary and secondary data coming from multiple health-related sources and provides data into a unique and globally recognized standard and format as the HL7 FHIR. Finally, the data are then fed into enhanced mappers to further transform them into the Holistic Health Records (HHRs) format. The actual realization of the conceptual HHR model is performed with the assistance of the FHIR mappers. The implementation of them is based on the Java library of HAPI FHIR and expose APIs that the Data Harmonizer component can consume [
30].
2.6. Data Analysis
The Data Analysis building block is where the predictors for analyzing the data (in HHR format) are executed. Two types of predictors have been developed under iHelp : a personalized predictor and a predictor and risk identifier. The first predictor is based on data around specific diseases and specific risks identified for individuals within the integrated (HHR) datasets. With this functionality it has been possible to develop personalized health models that enable the identification of disease(s) and their contributing factors. This predictor has allowed the development of prediction mechanisms for certain risks, based on the analysis of disease-centric trends and patterns.
The second predictor is based on deriving the disease- and risks- related knowledge from the integrated (HHR) data by using AI-based novel anomaly detection algorithms. Given the multitude of data sources hosting and providing patients’ data into the iHelp platform, this predictor has been developed to robustly detect risks based on the analysis a variety of (historic and real-time) data for each patient and by doing so also provide relevant predictions and assessments (correlations, trend, pattern, underlying factors, etc.) on individuals’ health status. These predictors combine facts from streaming data not necessarily related to health (e.g., lifestyle and social interactions), collective knowledge/intelligence and information related to the individual (e.g., from the health records and the stored health status monitoring data). The analysis of these combined facts provides knowledge referring to different types of risks and their evolution in time. Another aspect of this second type of predictor is that it enables to evaluate the impact of different symptoms, decisions, and environmental conditions regarding the same situation-dependent attributes such as lifestyle choices, mobility modes, etc.
2.7. Decision Support System
The Decision Support System (DSS) is the user interface and access point to the iHelp platform and has a two-fold objective. On one hand, it seeks to provide several functionalities that allow HCPs and healthcare stakeholders to make decisions based on improved data analytical outcomes. The DSS provides query building, analytics, and visualization mechanisms that access the HHR integrated data and present the analytic outcomes to the end users in a way that eases the understanding, interpretability and explainability of the analytic models in the iHelp platform. The Explainable Dashboard Hub (EDH) sub-component in the iHelp platform facilitates this approach, as it provides several dashboards that are used to monitor metrics and outcomes of the AI models. The dashboards are designed to offer improved explainability on the analytical models allowing the HCPs to select multiple data analytic models for a wide range of scenarios and view numerous different visualizations and model comparisons. This helps the HCPs to enhance their knowledge and understanding on outcomes of the models and better interpret the final insights of them. On the other hand, the DSS mechanism can also be exploited by more technical users and AI experts e.g., model builders. These users can use the DSS to design different dashboards with the visualization and presentation of the and provide these dashboards to the relevant HCPs. A model builder can use a palette of SQL-like, analytical and visualization operators to create pipelines/workflows of transformations and visualizations over the results of the analytical algorithms. Following this robust approach and integration of different tools the DSS offers a set of generic dashboards that help both, the technical and non-technical users, to extract enhanced and more evidence-based decisions.
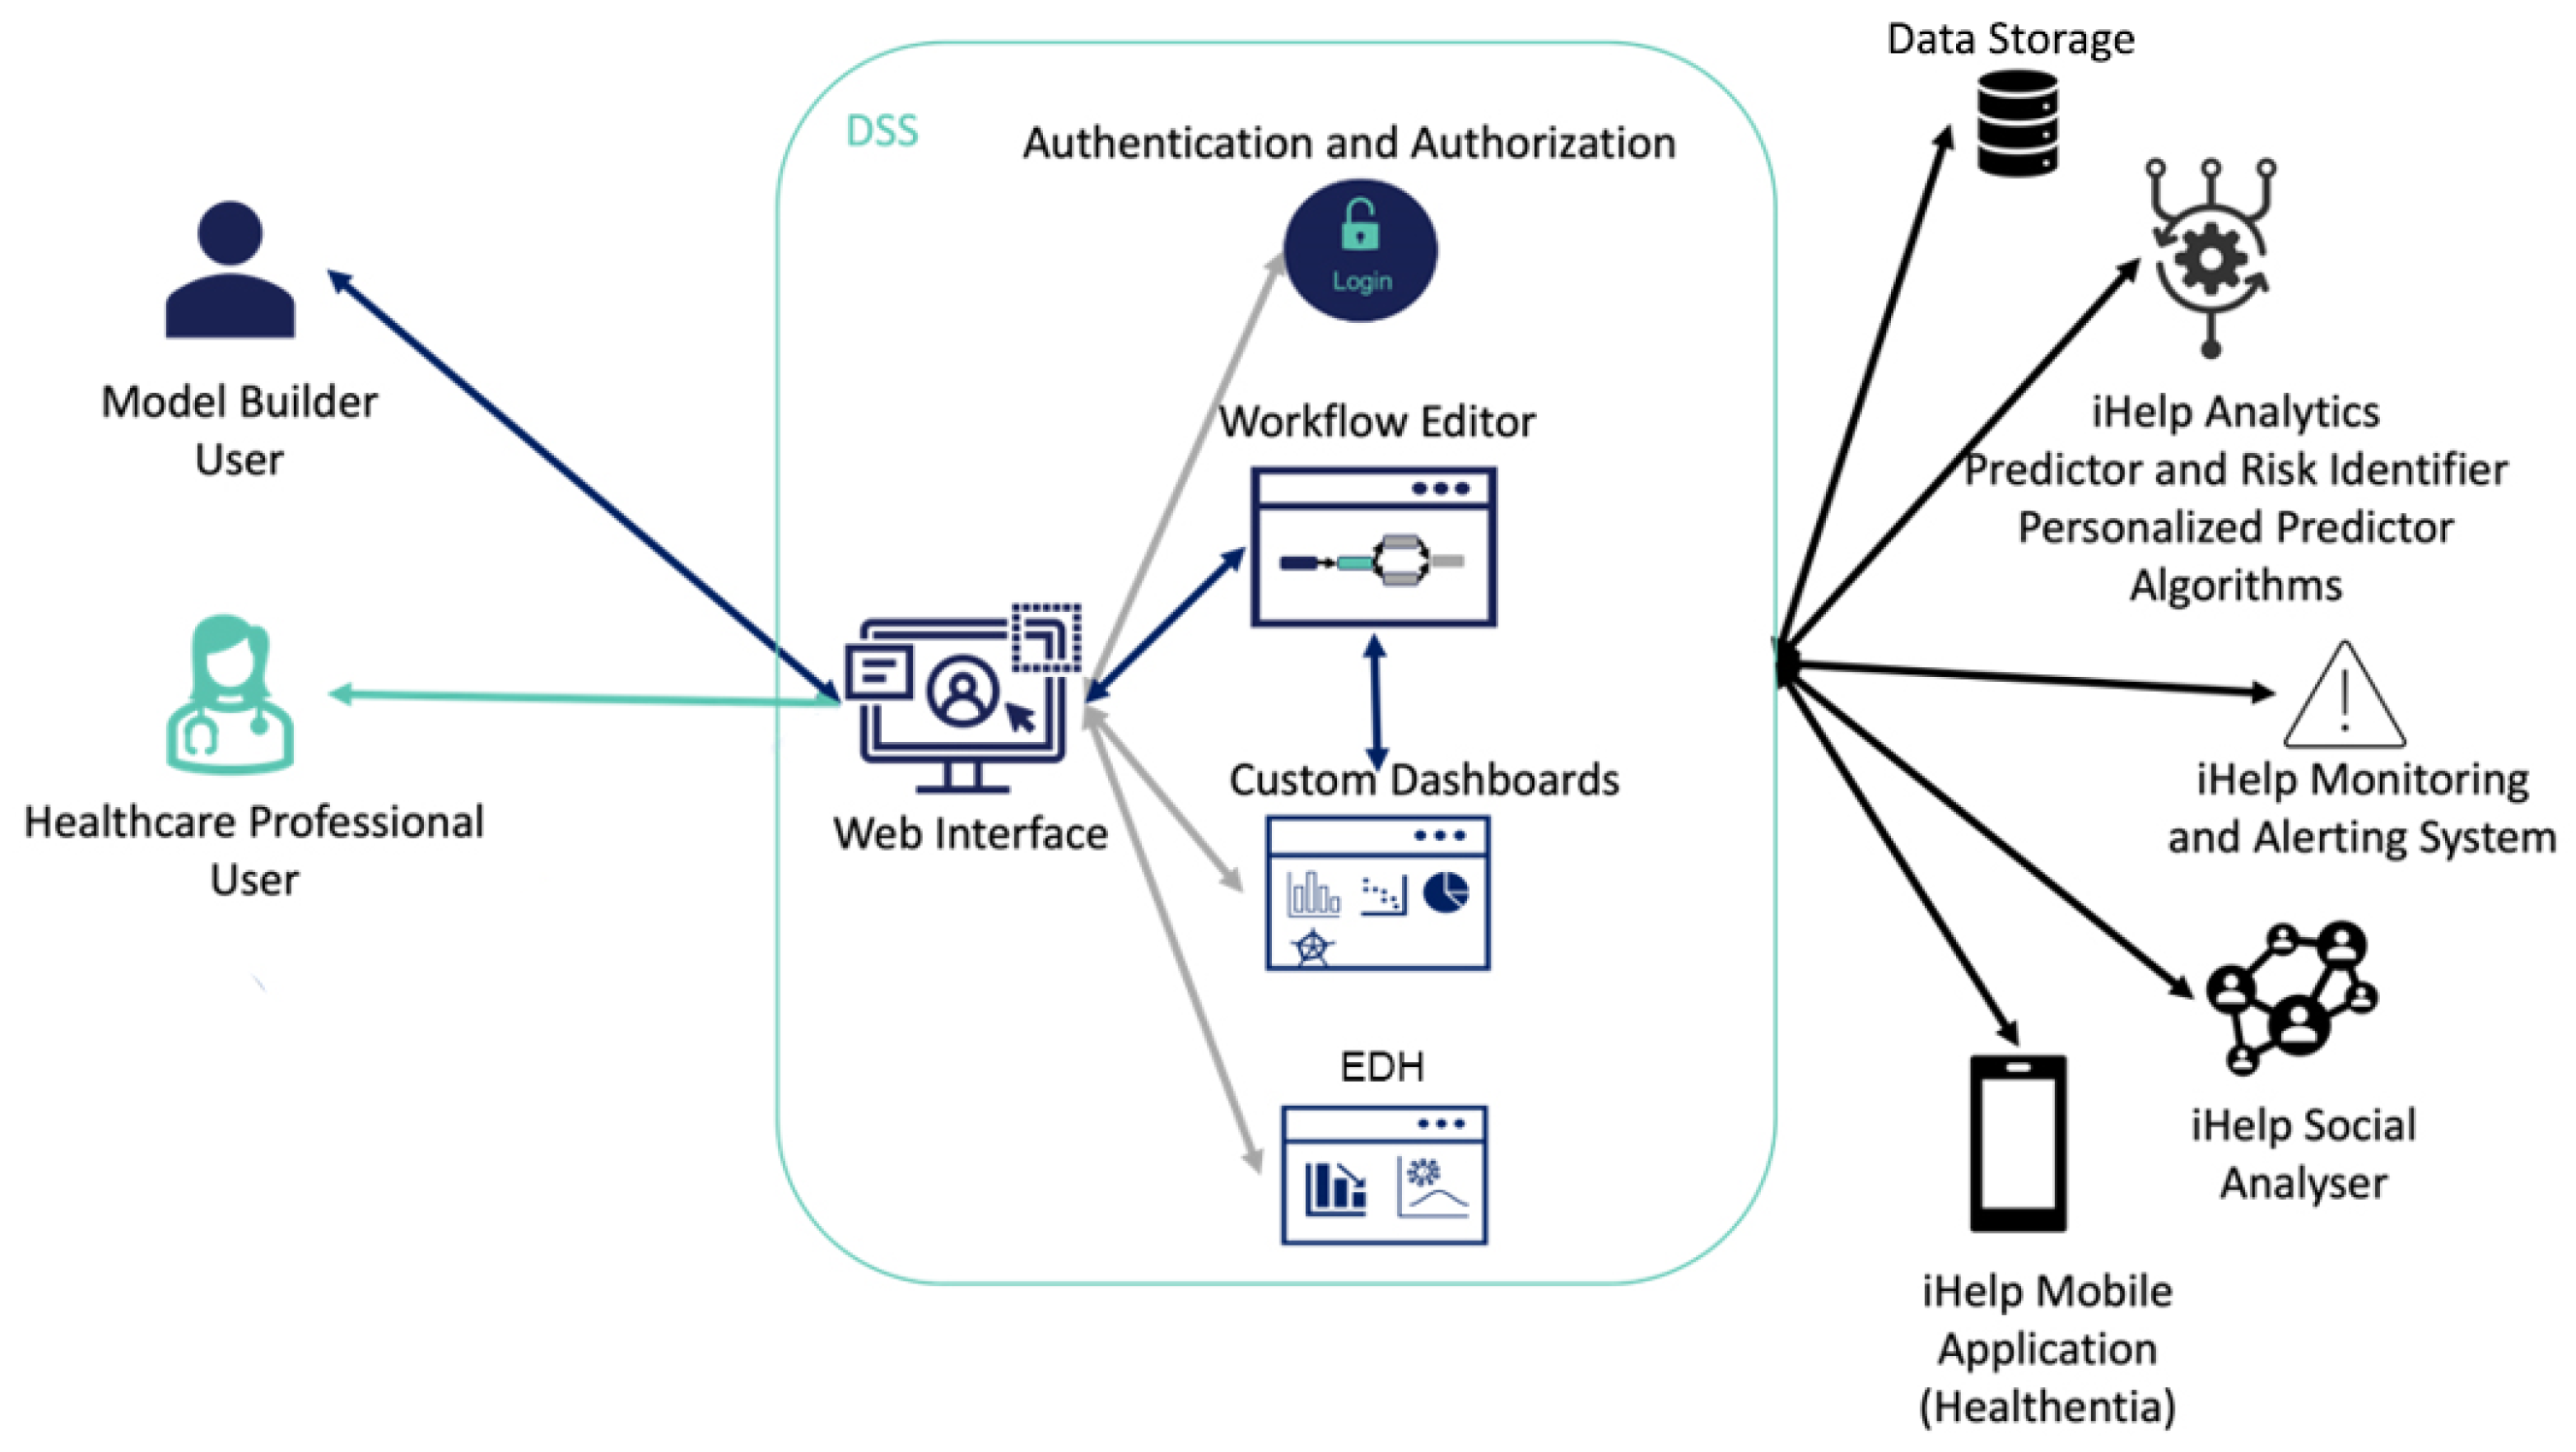
The overall interaction of a model builder and an HCP user with the DSS is presented in
Figure 5. At first, each user must access the DSS through a Login interface and an Authentication and Authorization mechanism for improved security and access monitoring on the visualized data. Based on the privileges of the user, the DSS grants access to its different subcomponents. If the user has a model builder user role, then the DSS grants access to the Workflow Editor, Custom Dashboards or EDH subcomponents. Otherwise, for HCP role users the DSS grants access to the Custom Dashboards or EDH subcomponents. When a user registers in the iHelp platform, he/she is assigned one of the above roles. The model builder user can design the workflows and the custom dashboards that will be further used by the HCPs users. The Query-builder and Workflow interface interact with the iHelp Data Storage reading the data and injecting them into the Analytical models provided by the Analytics Workbench or into the Predictor and Risk Identifier or the Personalized Predictor components. The model builder can create dashboards through the Dashboard interface which will show the results of the models and queries designed in the Workflow interface. On the other hand, the web interface contains a series of generic interfaces that allow the HCP to access patient data, the Monitoring and Alerting system, and interact with the patient by sending messages through the mobile application (the Healthentia mobile app), as well as having access to the custom dashboard implemented by the model builder and the EDH subcomponent interface to analyze the results obtained by the AI models.
2.8. Monitoring and Alerting
Having collected the data (both primary and secondary) about the patients in a holistic and standardized (mapped into HHR) way, the guidance of the patients through early identification of pancreatic cancer is the Monitoring and Alerting mechanism. This mechanism has a two-fold objective, as it aims to optimize decision support for HCPs, while also offering improved personalization of risk mitigation and prevention plans and the fine-tuning of goal settings. To achieve the latter, three (3) different subcomponents are designed and developed: the Data Aggregator, the Data Evaluator, and the Alert Generator that implement the monitoring, evaluating and alerting functionalities respectively. Their development has been based on a Java-based microservice approach and their integration and interexchange of data are based on the utilization of the Apache Kafka tool.
On top of this, the Monitoring and Alerting mechanism offers HCPs an interface to define offline rules, evaluate them online, propose dialogues for their consideration, and make final selections for delivering them to patients. In that context, its main objective is to give HCP the ability to assign mitigation plans and respective recommendations to a specific individual and then to monitor and assess the effect of these recommendations and plans in the QoL of the individual. A mitigation plan is essentially an action plan assigned to a patient and typically the execution of this plan aims to bring concrete health improvements and to lower the risk of developing pancreatic cancer. It is comprised of several rules some of which can be turned off depending on the personalized configuration for the patient. The HCP will assign a goal value to each active rule of the mitigation plan selected for the patient. For example, a goal for a given patient can be to decrease the cigarettes smoked per day or to increase his/her physical activity on weekly basis. Then, the component will monitor and evaluate the progress of the patients by collecting and aggregating secondary data, such as questionaries and behavioral data collected through the Healthentia mobile application, and then comparing them with personalized targets issued by HCPs. To this end, this mechanism, along with its accompanied subcomponents, enables the set of mitigation rules, and facilitates the personalized interactions with the patients. Two of its main subcomponents are the Virtual Coach and the Impact Evaluator that are further detailed below.
2.8.1. Virtual Coach
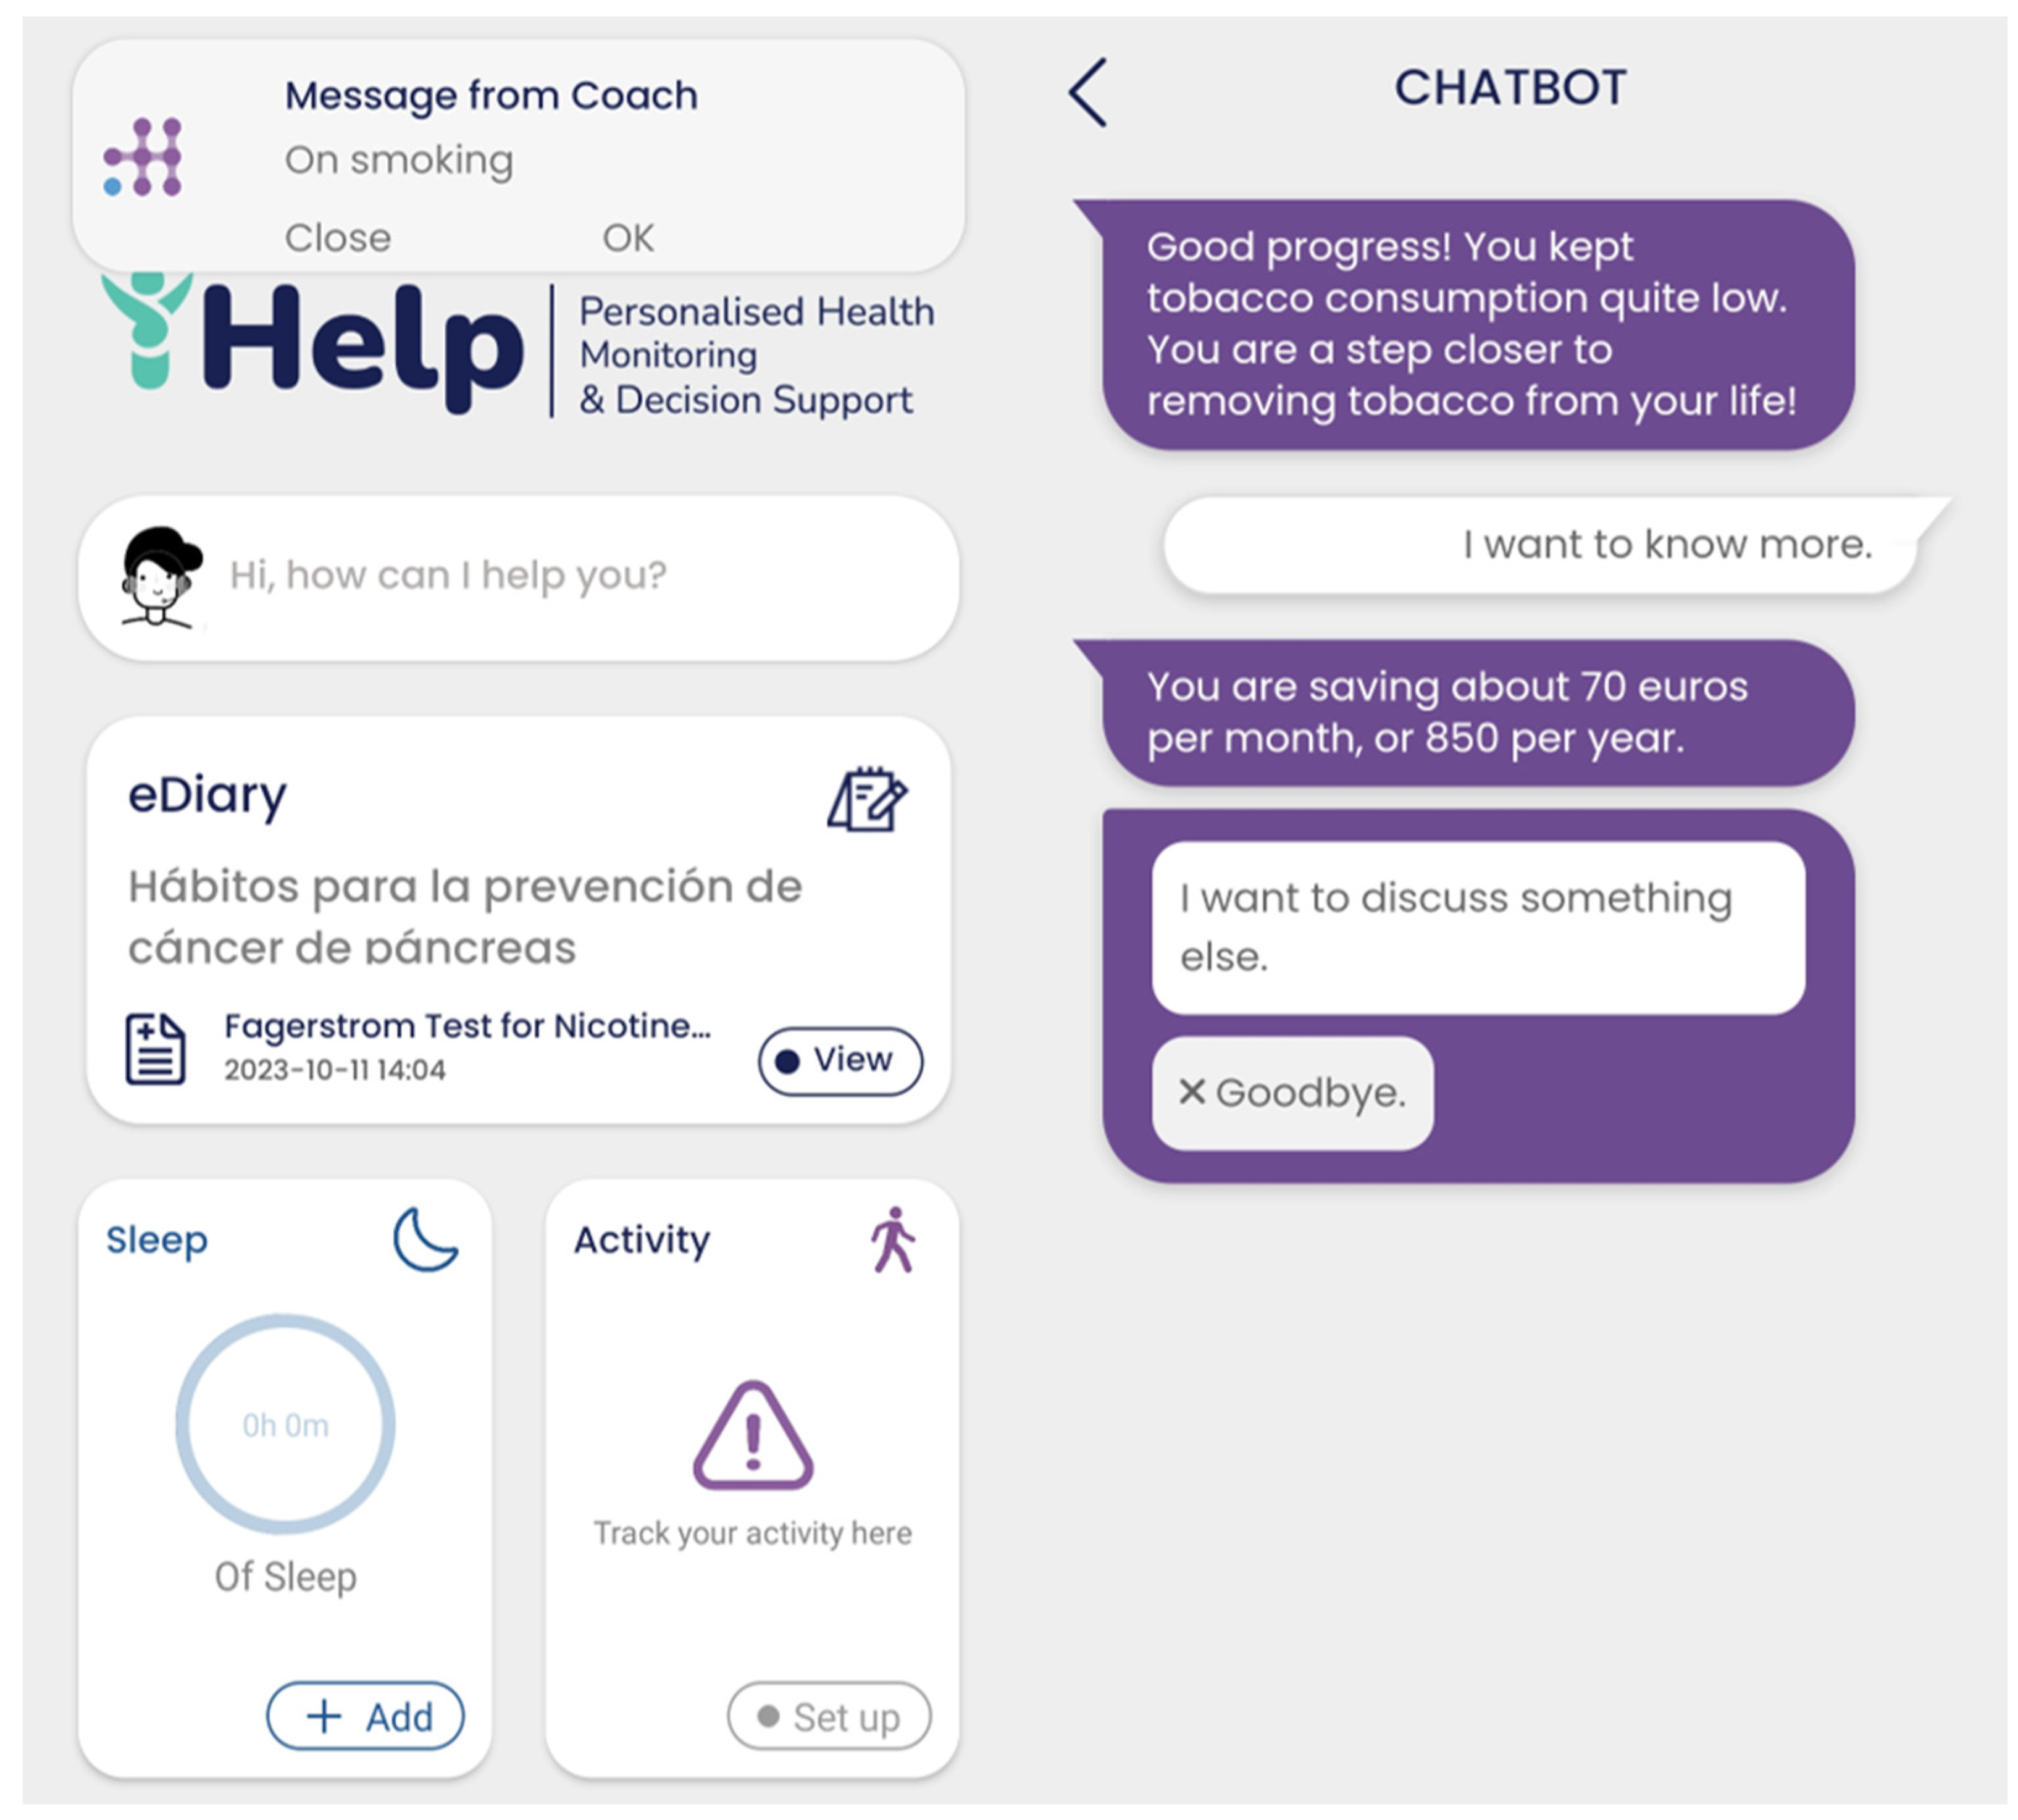
The virtual coach component offers patients the user interface for receiving and interacting with the mobile application and the underlying iHelp platform. This component also runs on the Healthentia mobile application, which is used for secondary data collection. Virtual Coach interacts with the users by sending the notification (e.g., risk alert). Following the notification, the users end up in the virtual coach interface, from where they can start a dialogue with the virtual coach.
Behind the scenes, the virtual coach exposes an endpoint to receive requests for dialogue delivery. In that call, the receiving patient and the intended dialogue are identified. Upon receiving the request, Healthentia (backend platform of the mobile app) pushes a notification to the mobile operating system (Android or iOS) and to the mobile application itself (to be viewed in the notifications page of the mobile app). The patient can tap either on the notification of the operating system, or on the notification at the dedicated application page. Then the web view of the virtual coach is displayed, and the patient can go through the dialogue. After dialogue playback, the patient can see the read notification in the dedicated page, but tapping on it only provides a summary of what it was about.
The structure of the dialogues is implemented via the open-source WOOL platform [
31]. WOOL comprises both a dialogue editor and a playback system. The editor allows dialogue authoring as a graph of interconnected nodes of agent text and possible patient replies to be selected. The playback system provides the web view that is integrated in the mobile phone, serving as the user interface for dialogue playback.
2.8.2. Impact Evaluator
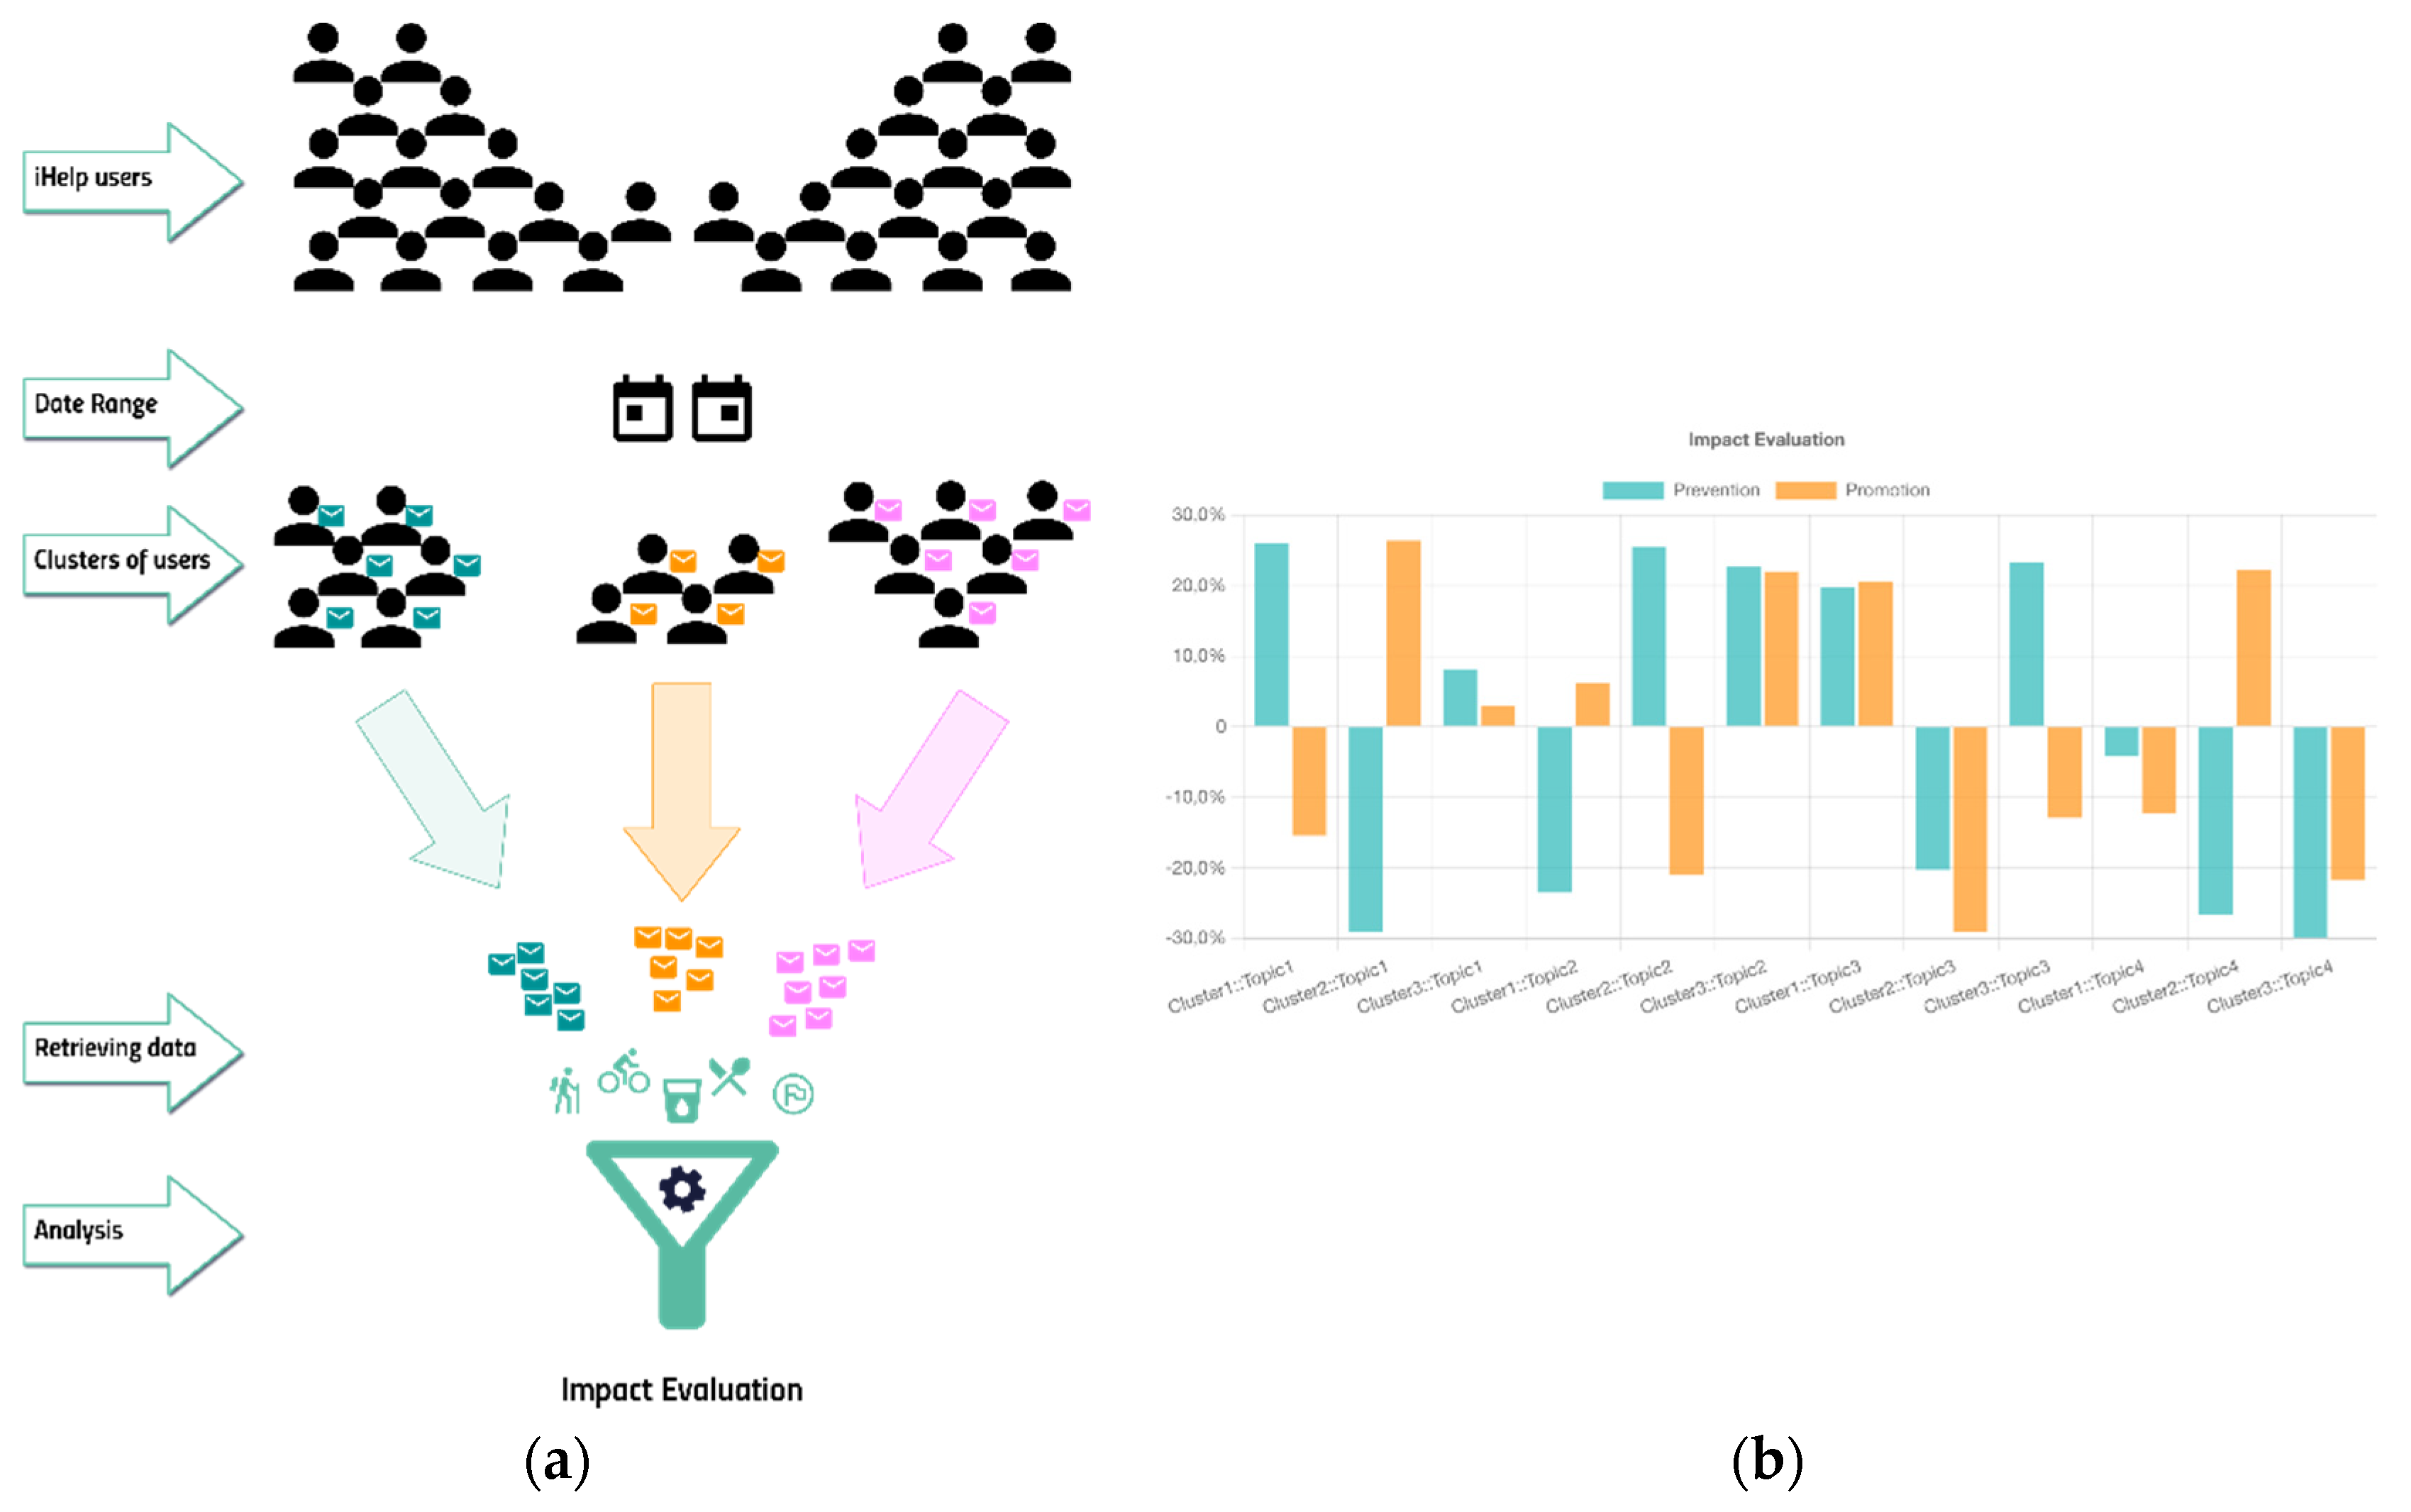
This subcomponent, part of the Monitoring and Alerting component in the iHelp platform, aims to evaluate and highlight the impact of the advice, sent to the citizens/patients, on their behavior. The main goal is to monitor and highlight to the clinicians how and if the specific type of advice changed the lifestyle of the recipients. For doing that, the citizens/patients are clustered using common characteristics (e.g., age, gender, BMI, or risk factors, if available) to compare the advice sent to a similar population. The result of this analysis could contribute to better fine-tune the model for generating the advice and the user to be reached. The input data are collected both from the Monitoring component (the goals and their achievement) and the HHR (sent messages and collected secondary data) using the standard FHIR API.
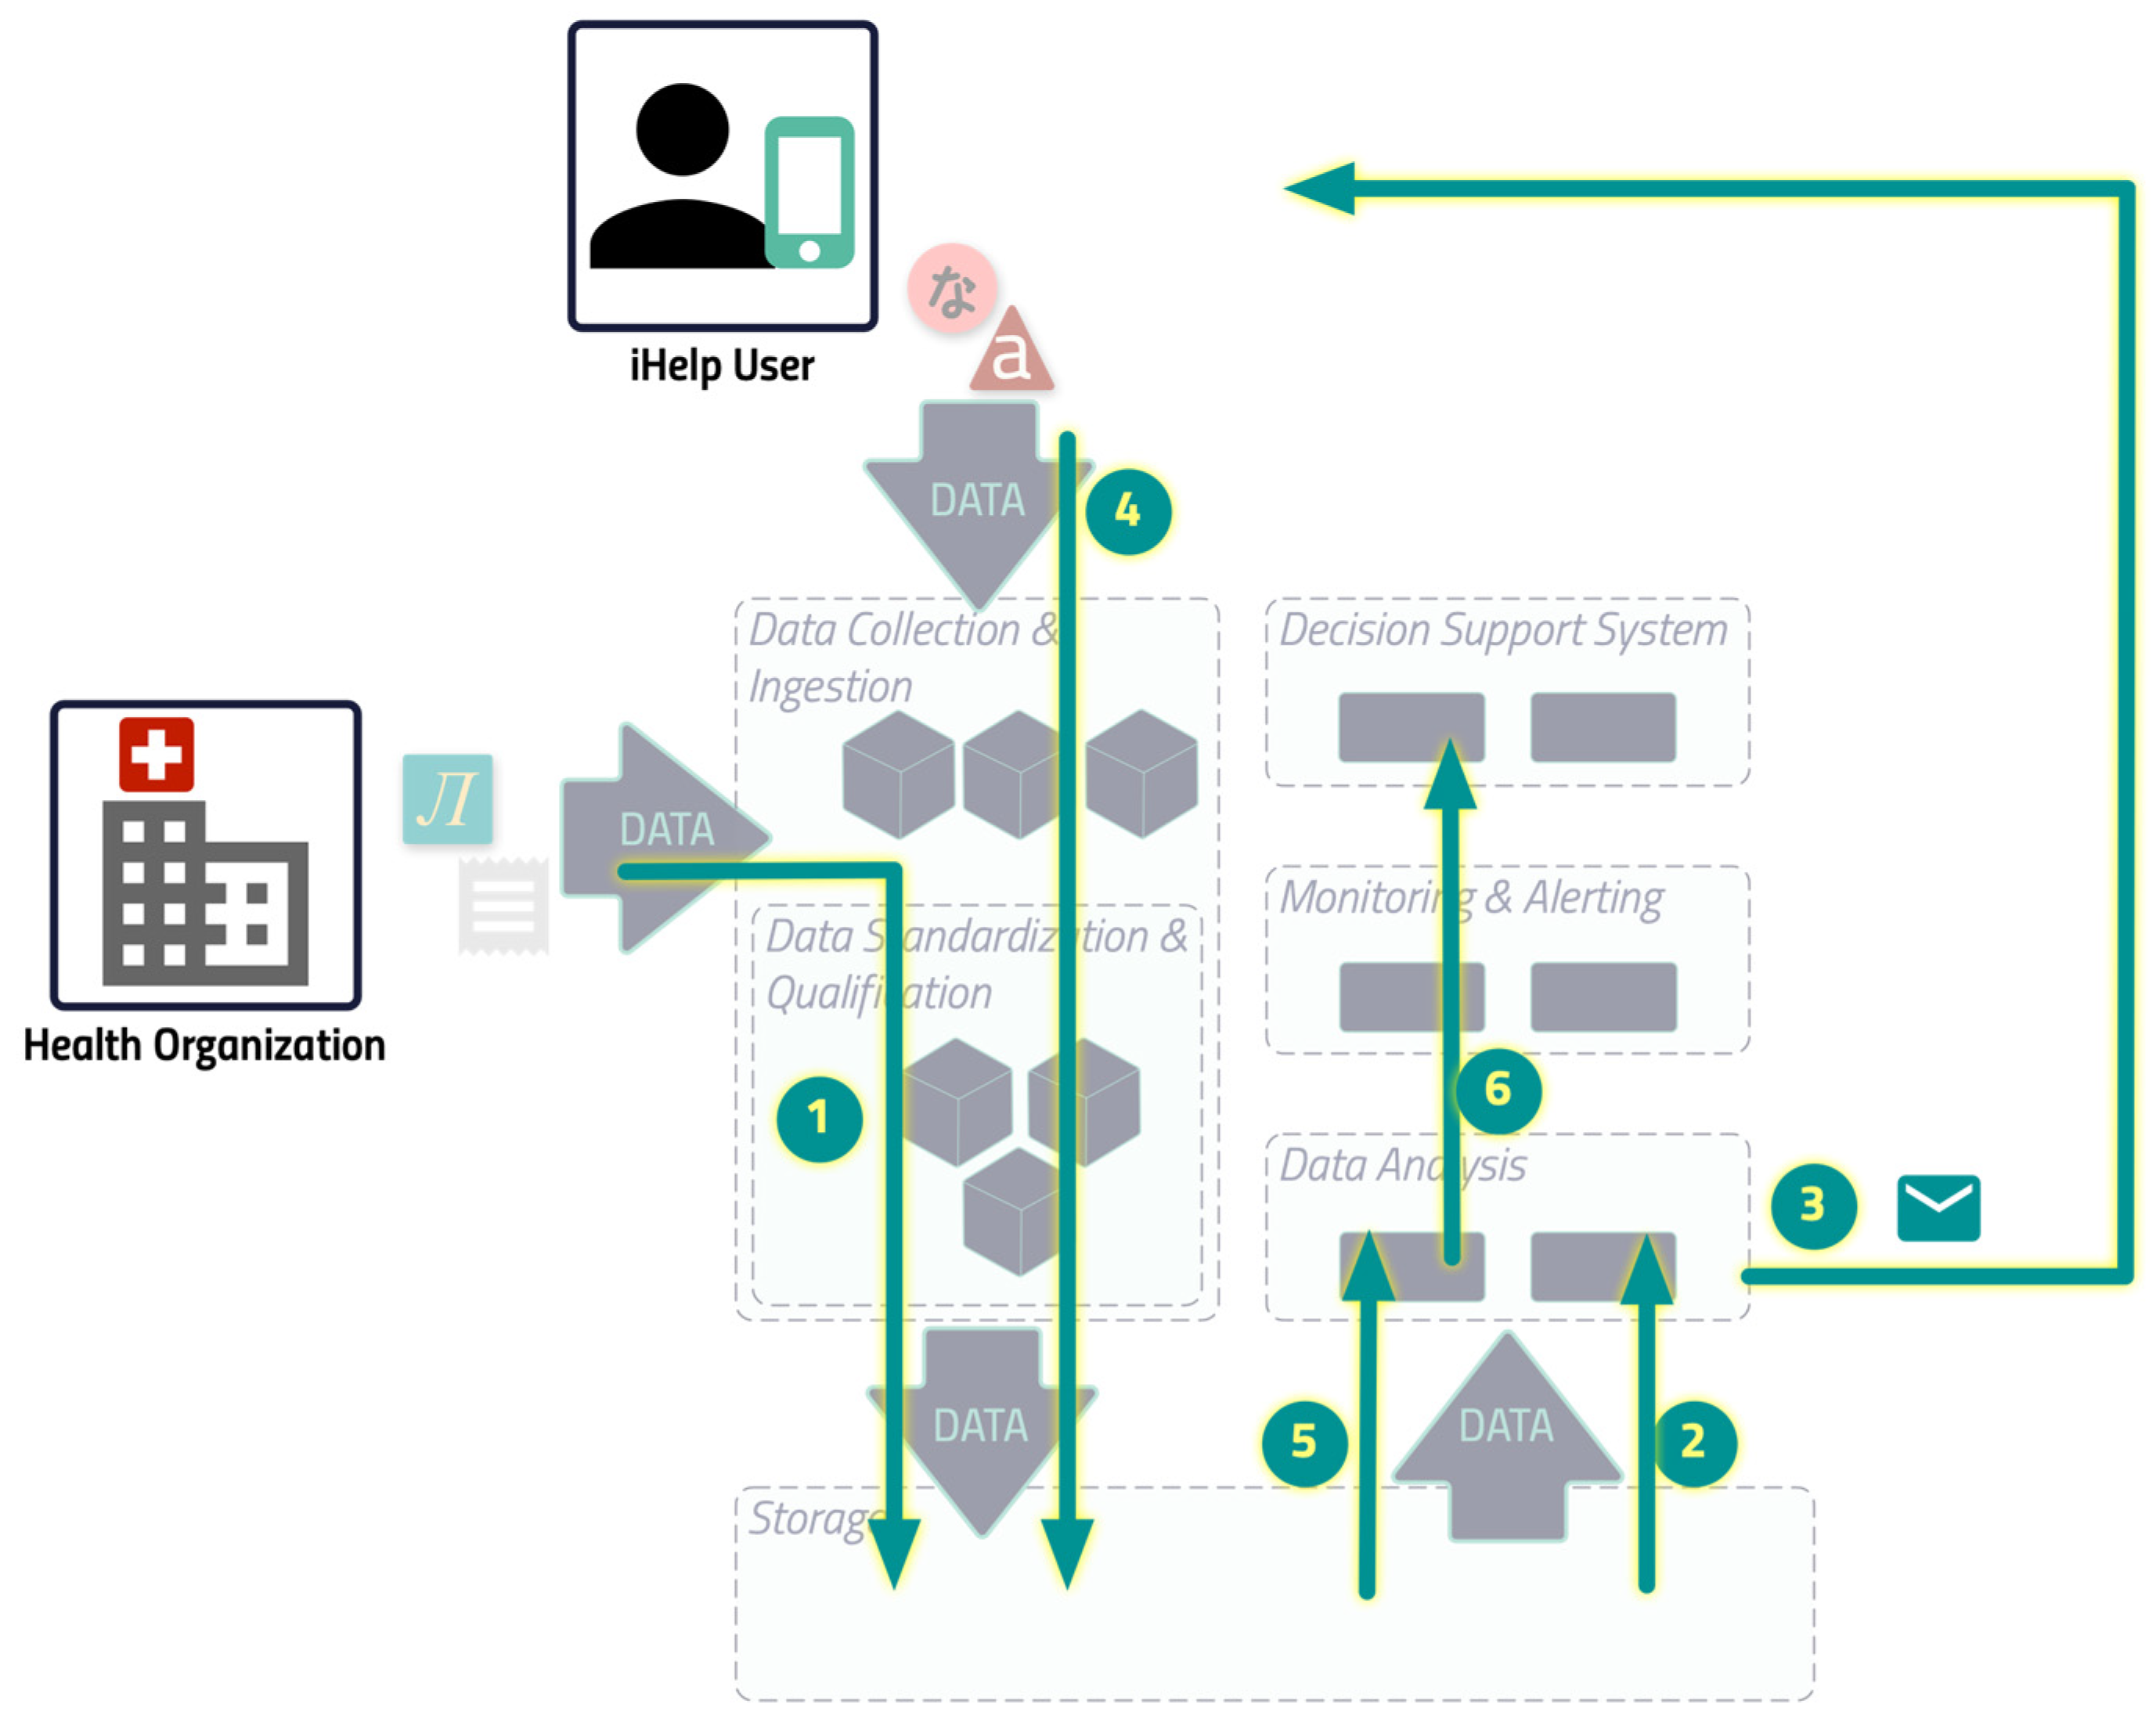
The image in
Figure 6 shows the initial and feedback loop, based on the overall iHelp architecture, which is explained above.
The HCP sets the goals of the individual and configures the iHelp platform to ingest the primary data that the health organization already has on its premises.
The specific component reads the data and triggers the dialogue to send the right content.
The content is delivered to the individual.
The individual, using the mobile app on his/her phone, feeds the platform with the secondary data that are stored inside the iHelp platform. Any other primary data which are produced by other external services of the health organization, like the lab tests, are stored in the iHelp Platform as well (as in step 1).
When the HCP requests the analysis, the Impact Evaluator read all the data needed to elaborate on the result.
The result of the computation is shown to the HCP through the dedicated iHelp platform interface.
It should be noted that Steps 1 to 4 are performed in a loop, while Steps 5 and 6 are performed on demand.
3. Results
In this section, the performance of the core components of the iHelp platform are analyzed together with its potential for bringing more efficient and personalized decisions in the healthcare domain. In deep detail, this article focuses on evaluating the effectiveness of the operation of the different pillars and the final demonstration and visualization of the results to the healthcare professionals. To this end, it should be noted that the evaluated components have been developed in Java SE, AngularJS, ReactJS, and Python programming languages showcasing the generalization and improved integration of the introduced platform with widely used frameworks.
3.1. Use Case Description
To evaluate the Data Collection and Ingestion mechanism, and other components of the iHelp platform, both primary and secondary data from the Hospital de Dénia – Marina Salud (HDM) pilot have been utilized. The HDM use case is focused on predicting the risk of pancreatic cancer. The iHelp platform is used to analyse the impact of changes in the lifestyle and habits over the identified risk factors. The impact of the lifestyle changes will be measured at epigenomic level through the measurement of methylation indexes.
At its initial stage, this pilot obtained patients’ medical records from the hospital’s local Electronical Health Records (EHRs). The data extraction was performed in CSV files and following the Observational Medical Outcomes Partnership (OMOP) Common Data Model (CDM) [
32]. The data input is received by the Data Collection and Ingestion mechanism of the iHelp platform. It should be noted that these data represent patients that are separated into two main groups:
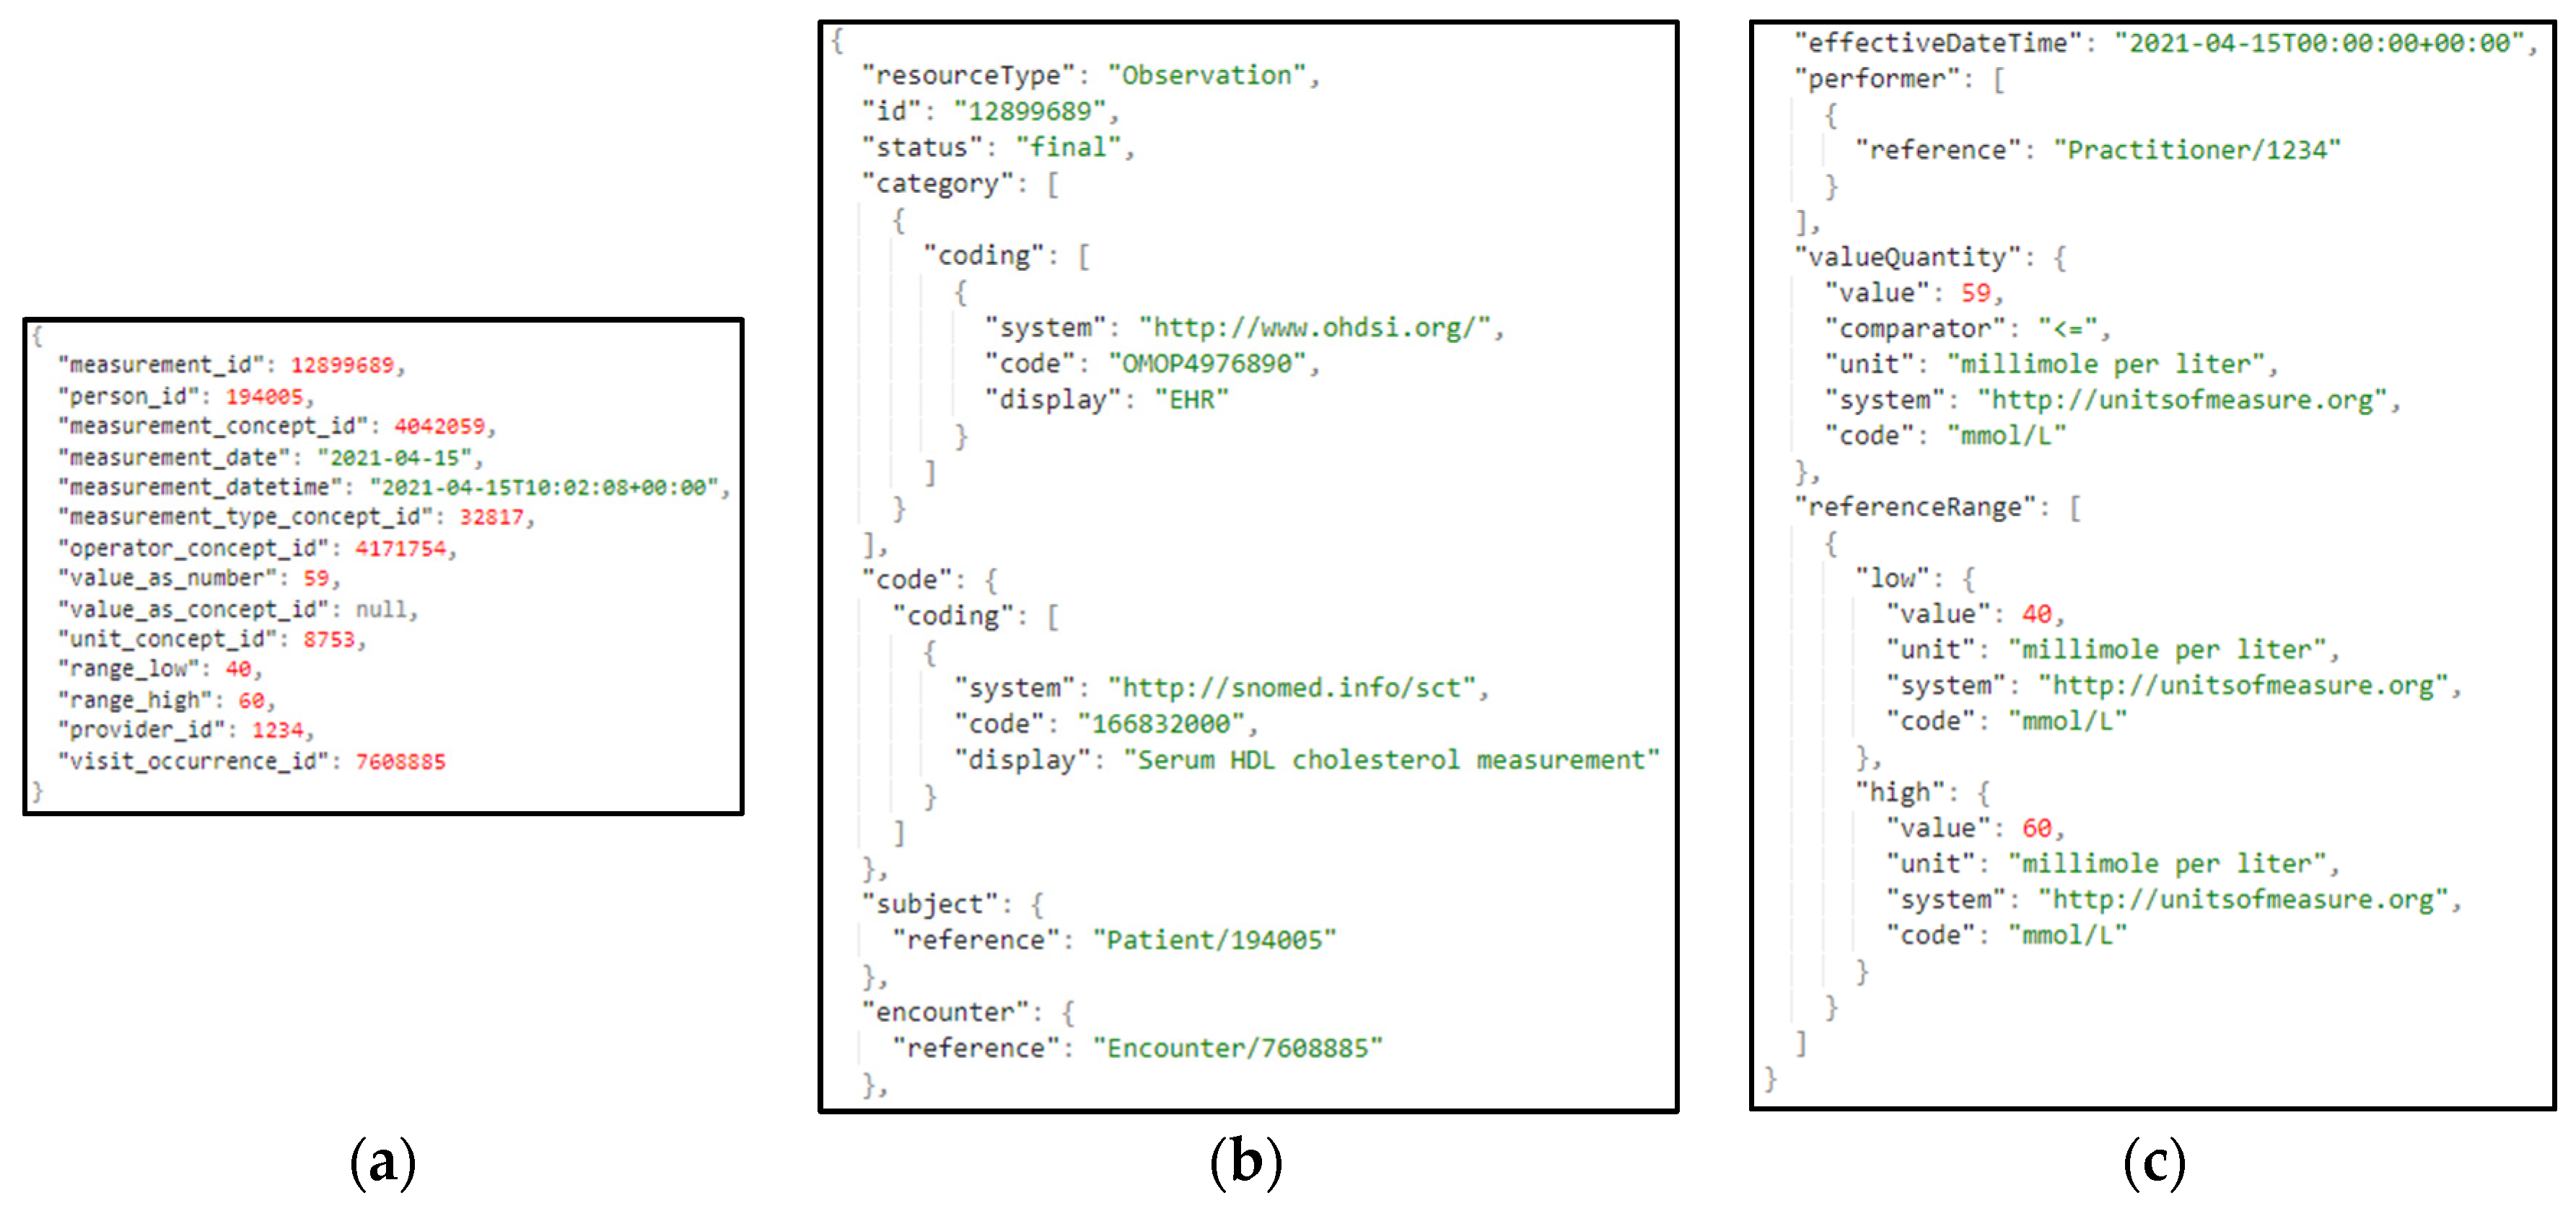
It should be noted that in HDM pilot no bias has been identified in the examined data and the 90K patients represent the full population of the geographic area that is assigned to the hospital. The data that are ingested in the iHelp platform are fully anonymized and the study is performed under the approval of the hospital’s Ethical Committee. Following the OMOP standard, a collection of seven (7) different primary datasets is produced, provided, and examined in the context of this pilot study based on the respective information, as presented in
Table 1. A sample from one these primary datasets related to the different measurements is also depicted in
Figure 7.
3.1. Data Collection and Ingestion
The Data Collection and Ingestion component in the iHelp platform encompasses all tasks associated with collecting, validating, and ingesting both primary and secondary data into the iHelp platform. The primary data are directly captured and ingested by the Data Capture Gateway through the implementation and utilization of different data connectors. Afterwards, the initial validation of the integrity of the data is achieved through the utilization of the Avro Schema that also requires the use of an Avro Schema Registry, which allows to only transmit the number of bytes that concerns the data themselves, thus minimizing the overall size of the data elements, as well the time needed for their ingestion and overall processing [
33]. For instance, the time that is needed for the whole Measurements dataset from its initial capture until its final transformation as HHR standardized data and storage into the platform’s Data Storage is 5minutes and 26seconds. The schema of the dataset is transformed by the Data Capture Gateway in an Avro Schema compatible format that boosts the interoperability and have a well-known standard to be further used by other functions involved in the data ingestion and processing process.
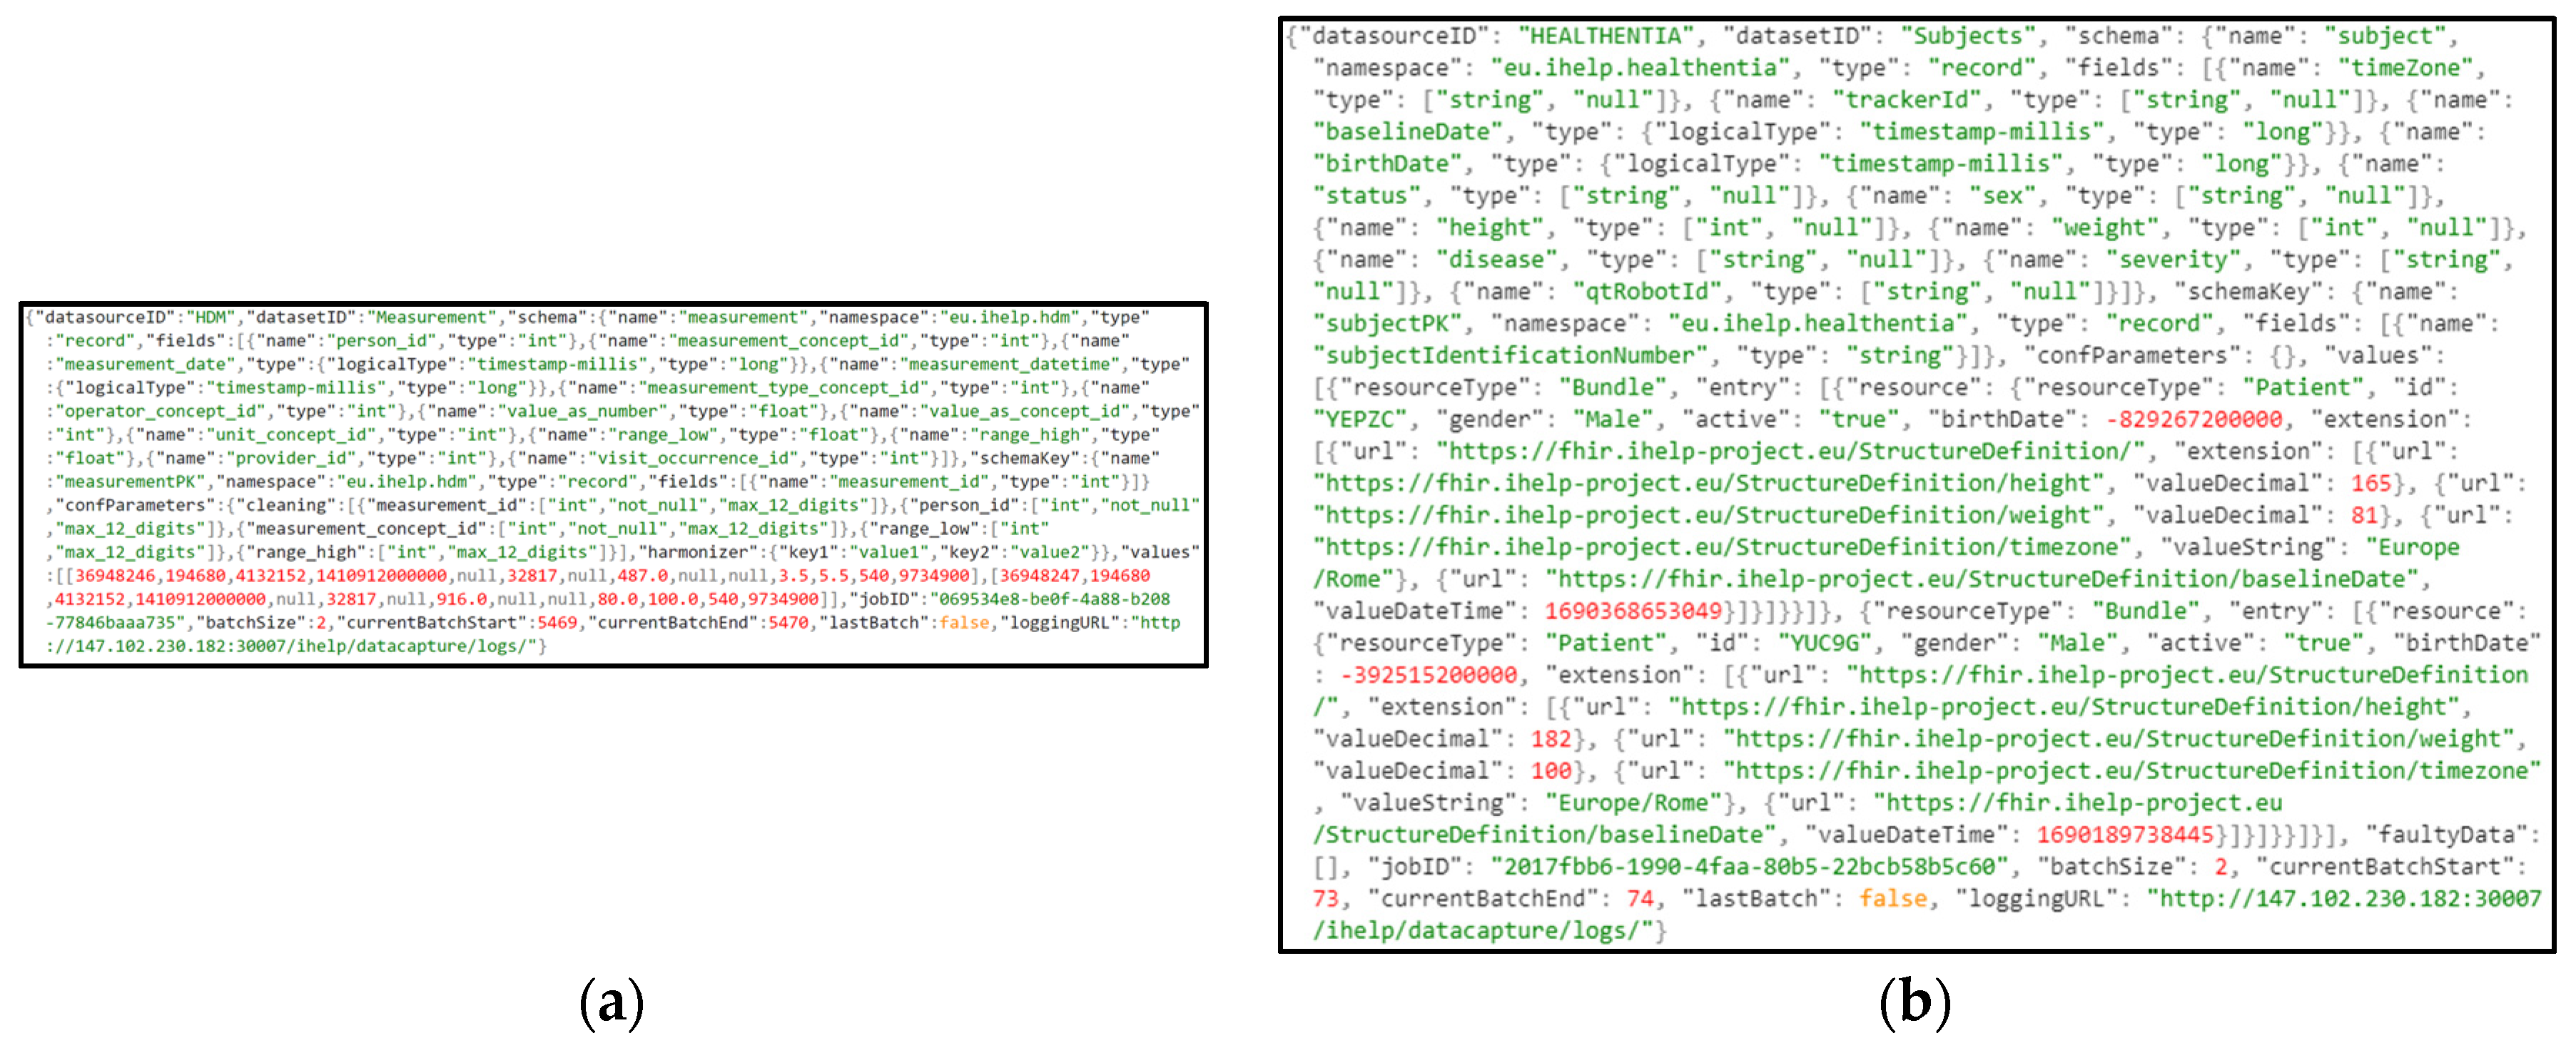
Moreover, the intermediate software components that formulates the Data Ingestion Pipeline are domain and schema agnostic. This means that a flexible ingestion pipeline is established, as each function can consume and produce data from corresponding Kafka topics in a dynamic manner and without any prior knowledge on the data. The respective information is passed to each subcomponent through these messages, enabling all subcomponents to communicate using this common data format. This format is designed to be highly interpretable and in such a way in order to be irrespective of the dataset, schema, and type of data that are contained in these messages. An example of such messages is depicted in
Figure 8, that shows a message with primary data derived from the Measurement dataset with a batch of 2 elements, as well a message of secondary data derived from the Healthentia platform.
The most important attributes of these JSON objects and messages are presented below:
datasourceID: the name of the data provider
datasetID: the name of the dataset
schema: the schema of the value of the tuples, defined in Avro Schema
schemaKey: the schema of the key of the tuples, defined in Avro Schema
batchSize: the number of batch size
currentBatchStart: the index of the first element of the batch in the overall dataset
currentBatchEnd: the index of the last element of the batch in the overall dataset
confParameters: the configuration parameters required by each of the intermediate functions. It includes an array of data parameters packed in JSON format, where each JSON can be interpreted by the corresponding function. These parameters are being passed to each of the intermediate functions and each one of those can retrieve the ones of their interest. For instance, specific cleaning rules have been set by the data provider concerning specific data attributes, as depicted in
Figure 8a. These rules as consumed by the Data Cleaner to perform the necessary cleaning and validation actions on the data.
values: a list of the exploitable data and their different values per each record
These messages are exchanged between different subcomponents of the Data Ingestion Pipeline by utilizing the Kafka message broker, as analyzed before.
However, a slightly different procedure is followed for the collection phase of the secondary data. That data are initially collected using the Healthentia mobile application [
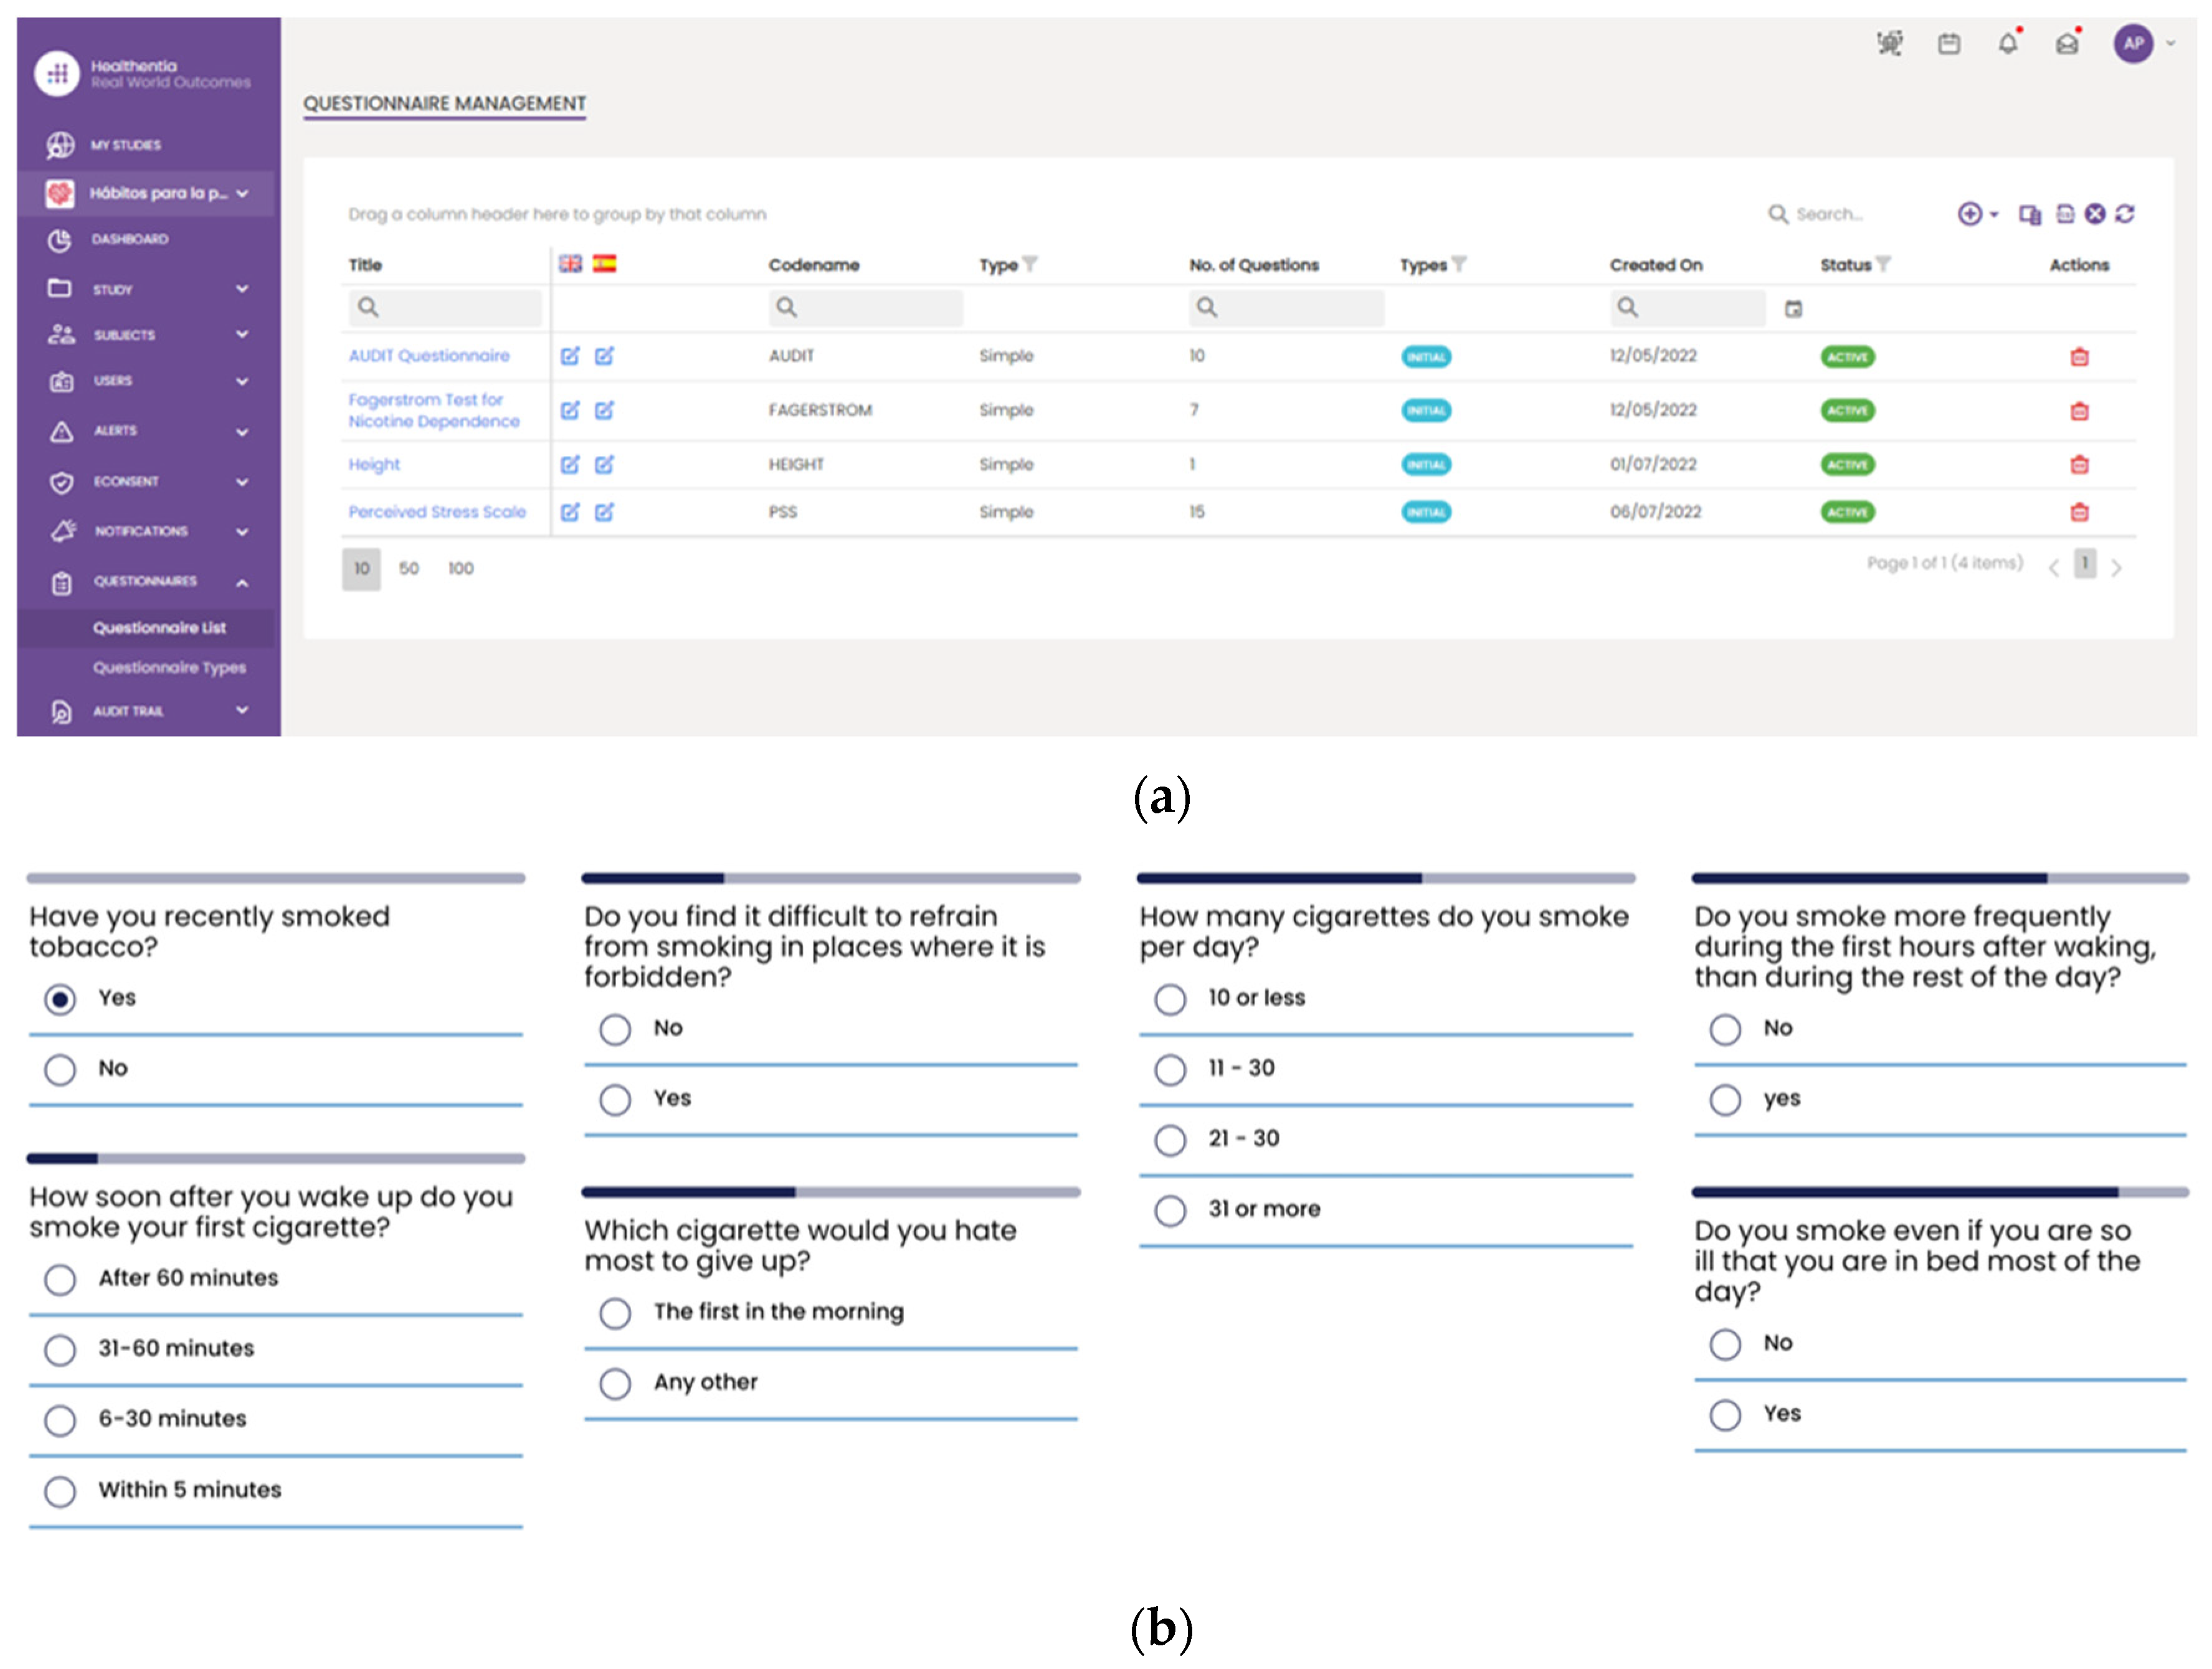
25], rather than directly fetching by the Data Capture Gateway. It is important to be mentioned that the Healthentia mobile application gives access to answers on different questionnaires that are used for self-assessment, while activity trackers collect individuals’ physiological and exercise data. The questionnaires are selected by HCPs and are defined in the Healthentia portal, together with the timing used for pushing them to patients automatically. More specifically,
Figure 9 depicts the questionnaires defined for the HDM study, as well as how such a questionnaire is answered by a patient in the Healthentia mobile app.
The different widgets accessible from the main dashboard of the mobile app (see
Figure 10) give access to data entry functionalities and visualizations of data collected from activity trackers (like physical activity, sleep, and heart info), other devices (like scales) and the nutrition widget, as shown in
Figure 10.
Regarding the information related with the answers, exercises and physiological data, a specific connector has been implemented in the Data Capture Gateway. Depending to the type of dataset it connects to the corresponding REST API provided by Healthentia and receives the respective list of information.
3.2. Data Standardization and Qualification towards HHRs
This sub mechanism is evaluated on real-world primary and secondary data as have been provided in the context of the iHelp project [
20], where clinical data of Pancreatic Cancer patients are analyzed to provide personalized recommendations.
At first, the Data Cleaner component is utilized as an integrated component of the Data Standardization and Qualification mechanism, and its main objective is to deliver the software implementation that provides the assurance that the provided data coming from several heterogeneous data sources are clean and complete, to the extent possible. This component is designed to minimize and filter the non-important data, thus improving the data quality and importance. To address a portion of these challenges, referring mainly to reducing the complexity and facilitating the analysis of large datasets, data cleaning procedures attempt to improve the data quality and to enhance the analytical outcomes, since wrong data can drive an organization to wrong decisions, and poor conclusions. To this end, this component seeks to assure the incoming data’s accuracy, integrity, and quality.
Afterwards, the Data Qualifier component classifies data sources as reliable or non-reliable both during the primary and secondary data injection. A data source is classified as reliable when the datasets received from this source are considered correct by the experts (such as HCPs), otherwise it is considered as non-reliable. To test this feature, this component acquires both the cleaned and faulty data produced by the Data Cleaner component.
With regards to the Data Harmonizer component, initially, it translates the hospital data coming in, into SNOMED concepts and these concepts are fed to the mappers for further analysis. This step is specifically achieved through the implementation of the Ontology-based Domain Terminology Mapping functionality that utilizes the PyMedTermino [
34] and UMLS meta thesaurus [
35] offering a wide collection of terminology services. Coupled with the utilization of the FHIR ontology the Data Harmonizer component provides a set of intelligent services to manage terminology resources and make the data semantically interoperable. In addition, it provides a set of operations on widely used and known medical terminologies used for the coding of medical knowledge, such as LOINC [
36], ICD-10 [
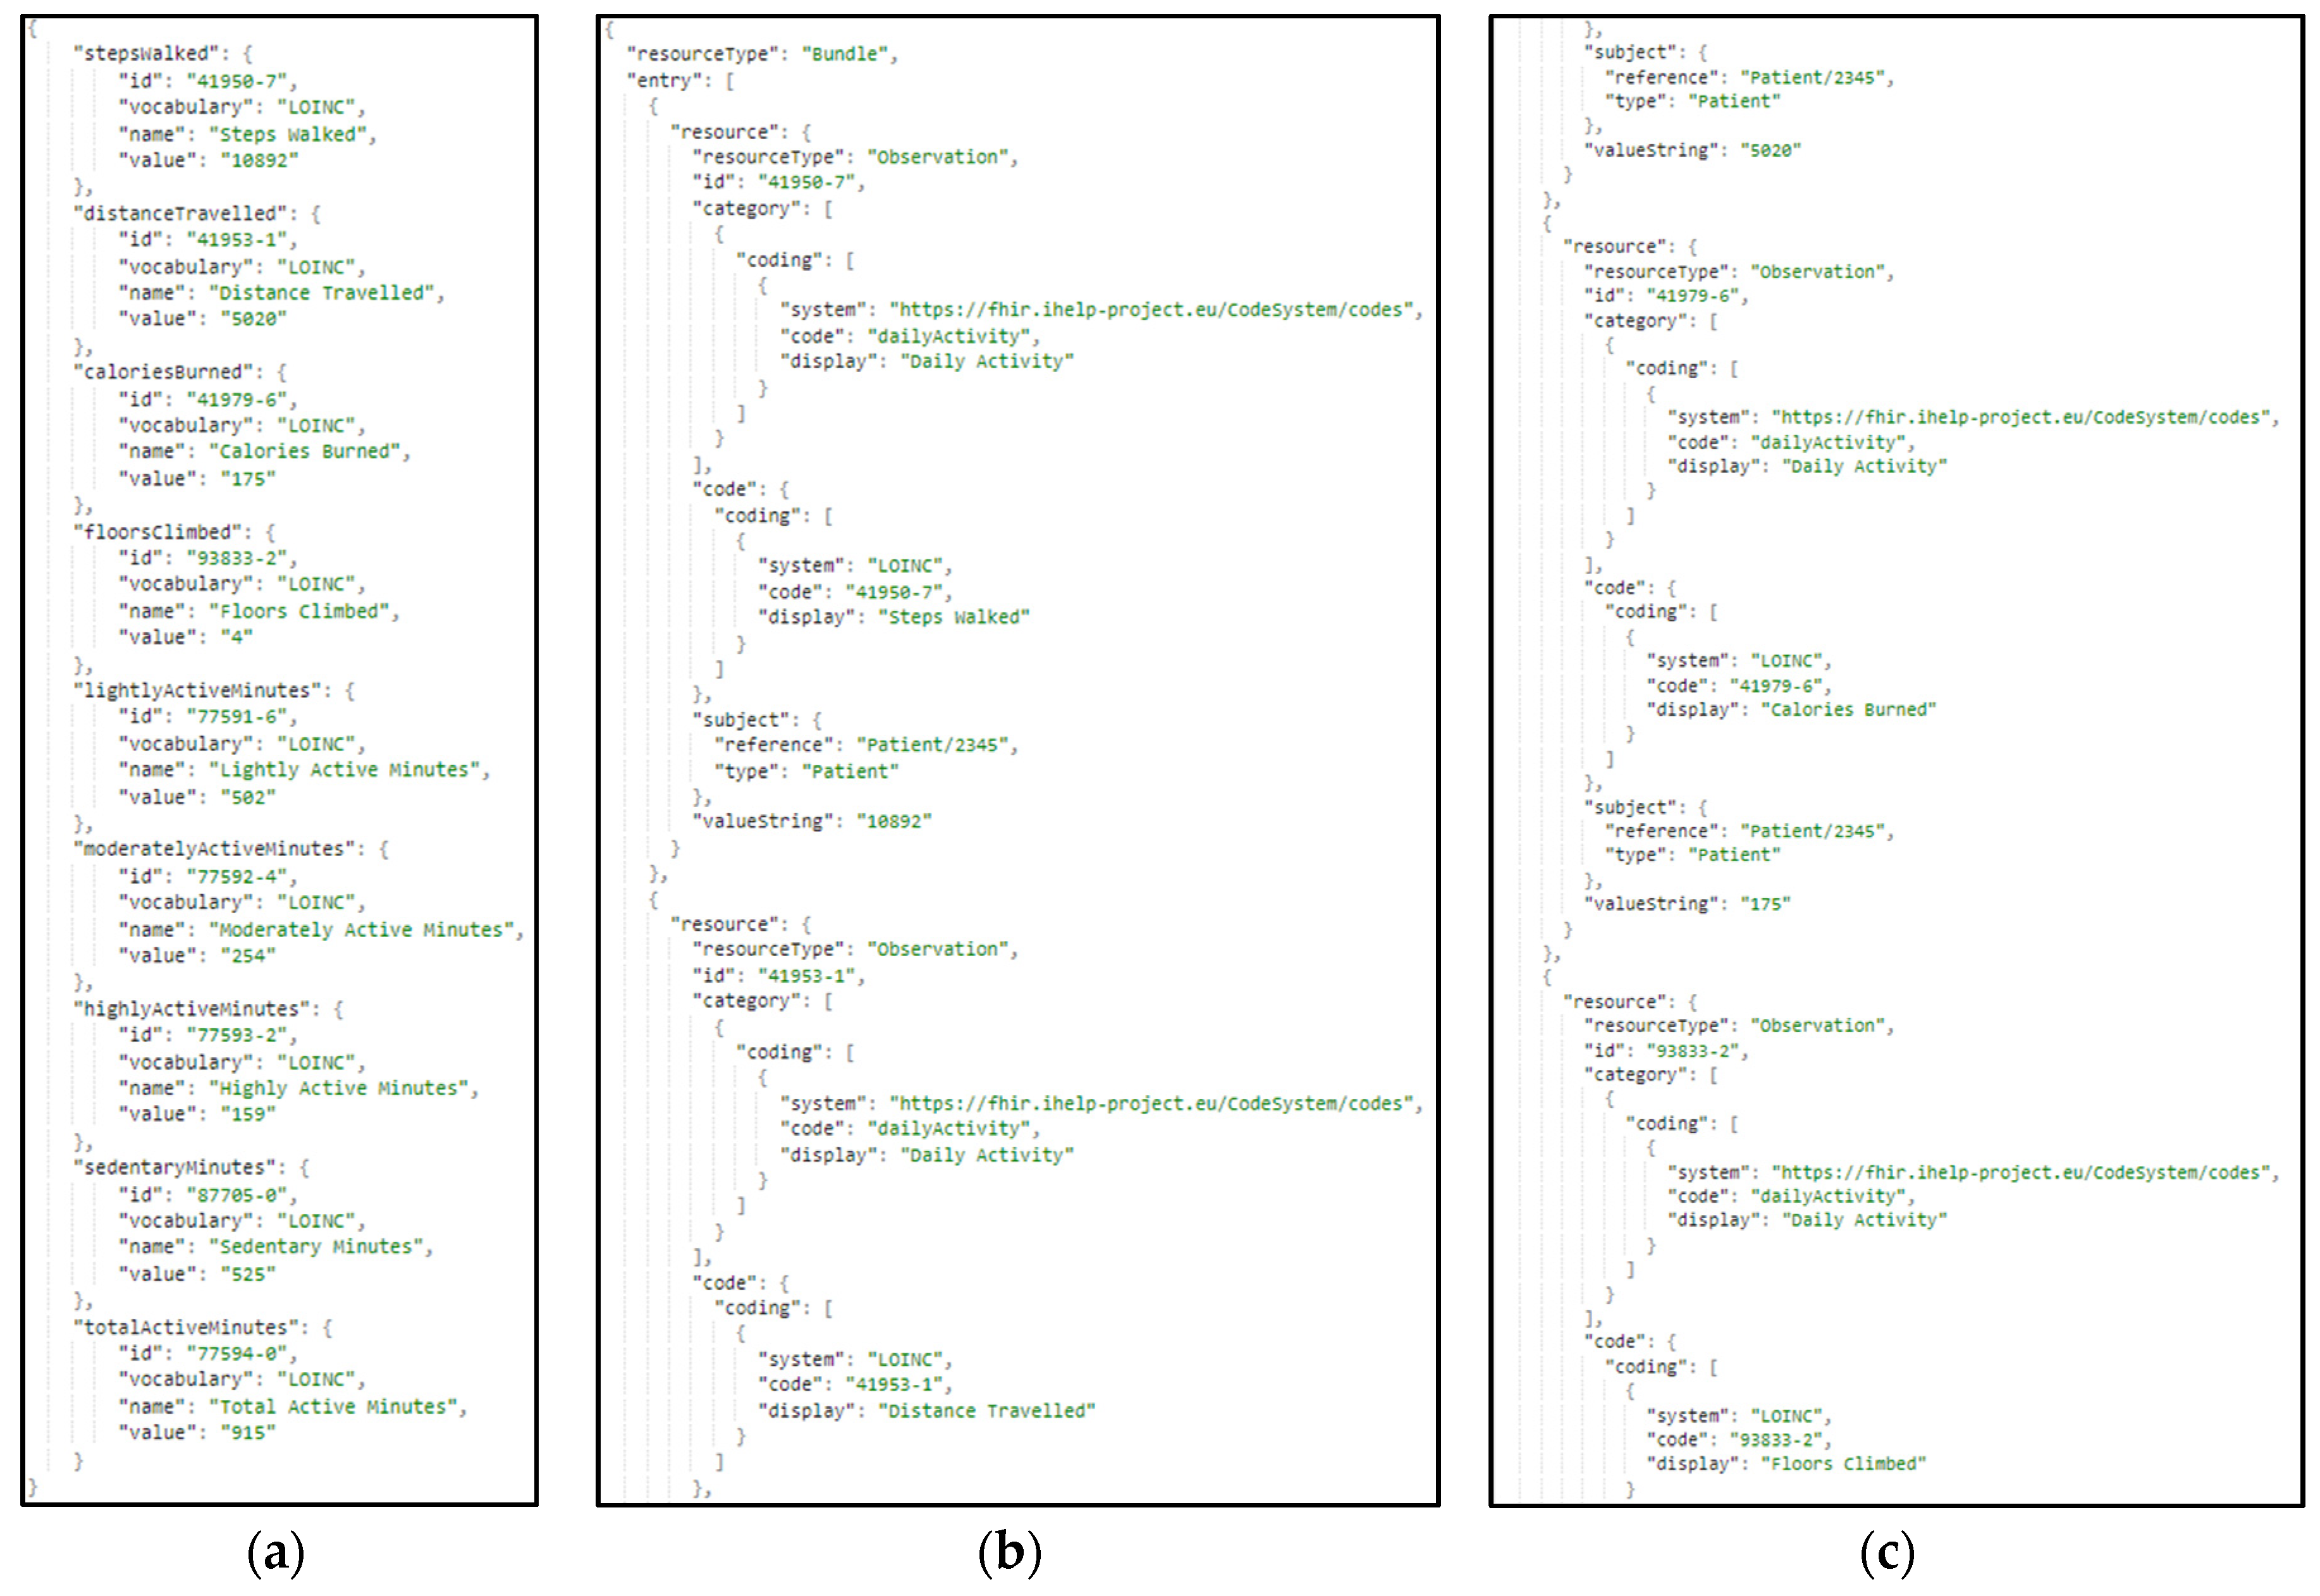
37] and SNOMED, which further enhance the information structures that are provided as outputs from the Data Harmonizer component. In addition, it provides the flexibility to the whole iHelp platform to utilize new releases of terminologies and to provide mappings or translations between different terminologies and standards. The latter is addressed through the extensible searching and querying functionality for specific elements of the well-established terminologies and standards. The mappers receive as input the harmonized and semantic interoperable data and then transform these concepts into the appropriate FHIR elements, grouping the elements as needed. Finally, a FHIR Bundle containing the mapped data is sent back to the Data Harmonizer for fusing the HHR-based modelled data to the platform’s data storage. A sample harmonization of raw primary data to HHR data is depicted in
Figure 11.
The same approach and transformation are followed in the case of the ingestion of secondary data. These data represent lifestyle and behavioral aspects of the patients’ life. These data are gathered through wearable devices, as well answers to questionnaires and nutrition-related information. In
Figure 12, a sample harmonization of raw secondary data to the standardized HHR model is presented.
3.3. Data Analysis
One of the AI models developed within iHelp platform focuses on predicting the risk of developing pancreatic cancer based on lifestyle choices. The AI model is developed using the data acquired from the Hospital de Dénia – Marina Salud (HDM) use case. This model is trained on a collection of datasets provided by HDM that contains data of 200 patients related to blood analysis and other physical tests. It also contains an extra set of parameters containing comorbidities of such patients so the training could incorporate this information making it completer and more accurate, taking into account historic data about alcohol, tobacco, hepatitis, hypertension, diabetes, cholesterol, obesity, pancreas and h pylori for each patient.
Besides adding complexity, all these comorbidities enrich the trained models and increase their rate accuracy, from an initial 70% where no comorbidities were taken into account to a range of 80%-85%.
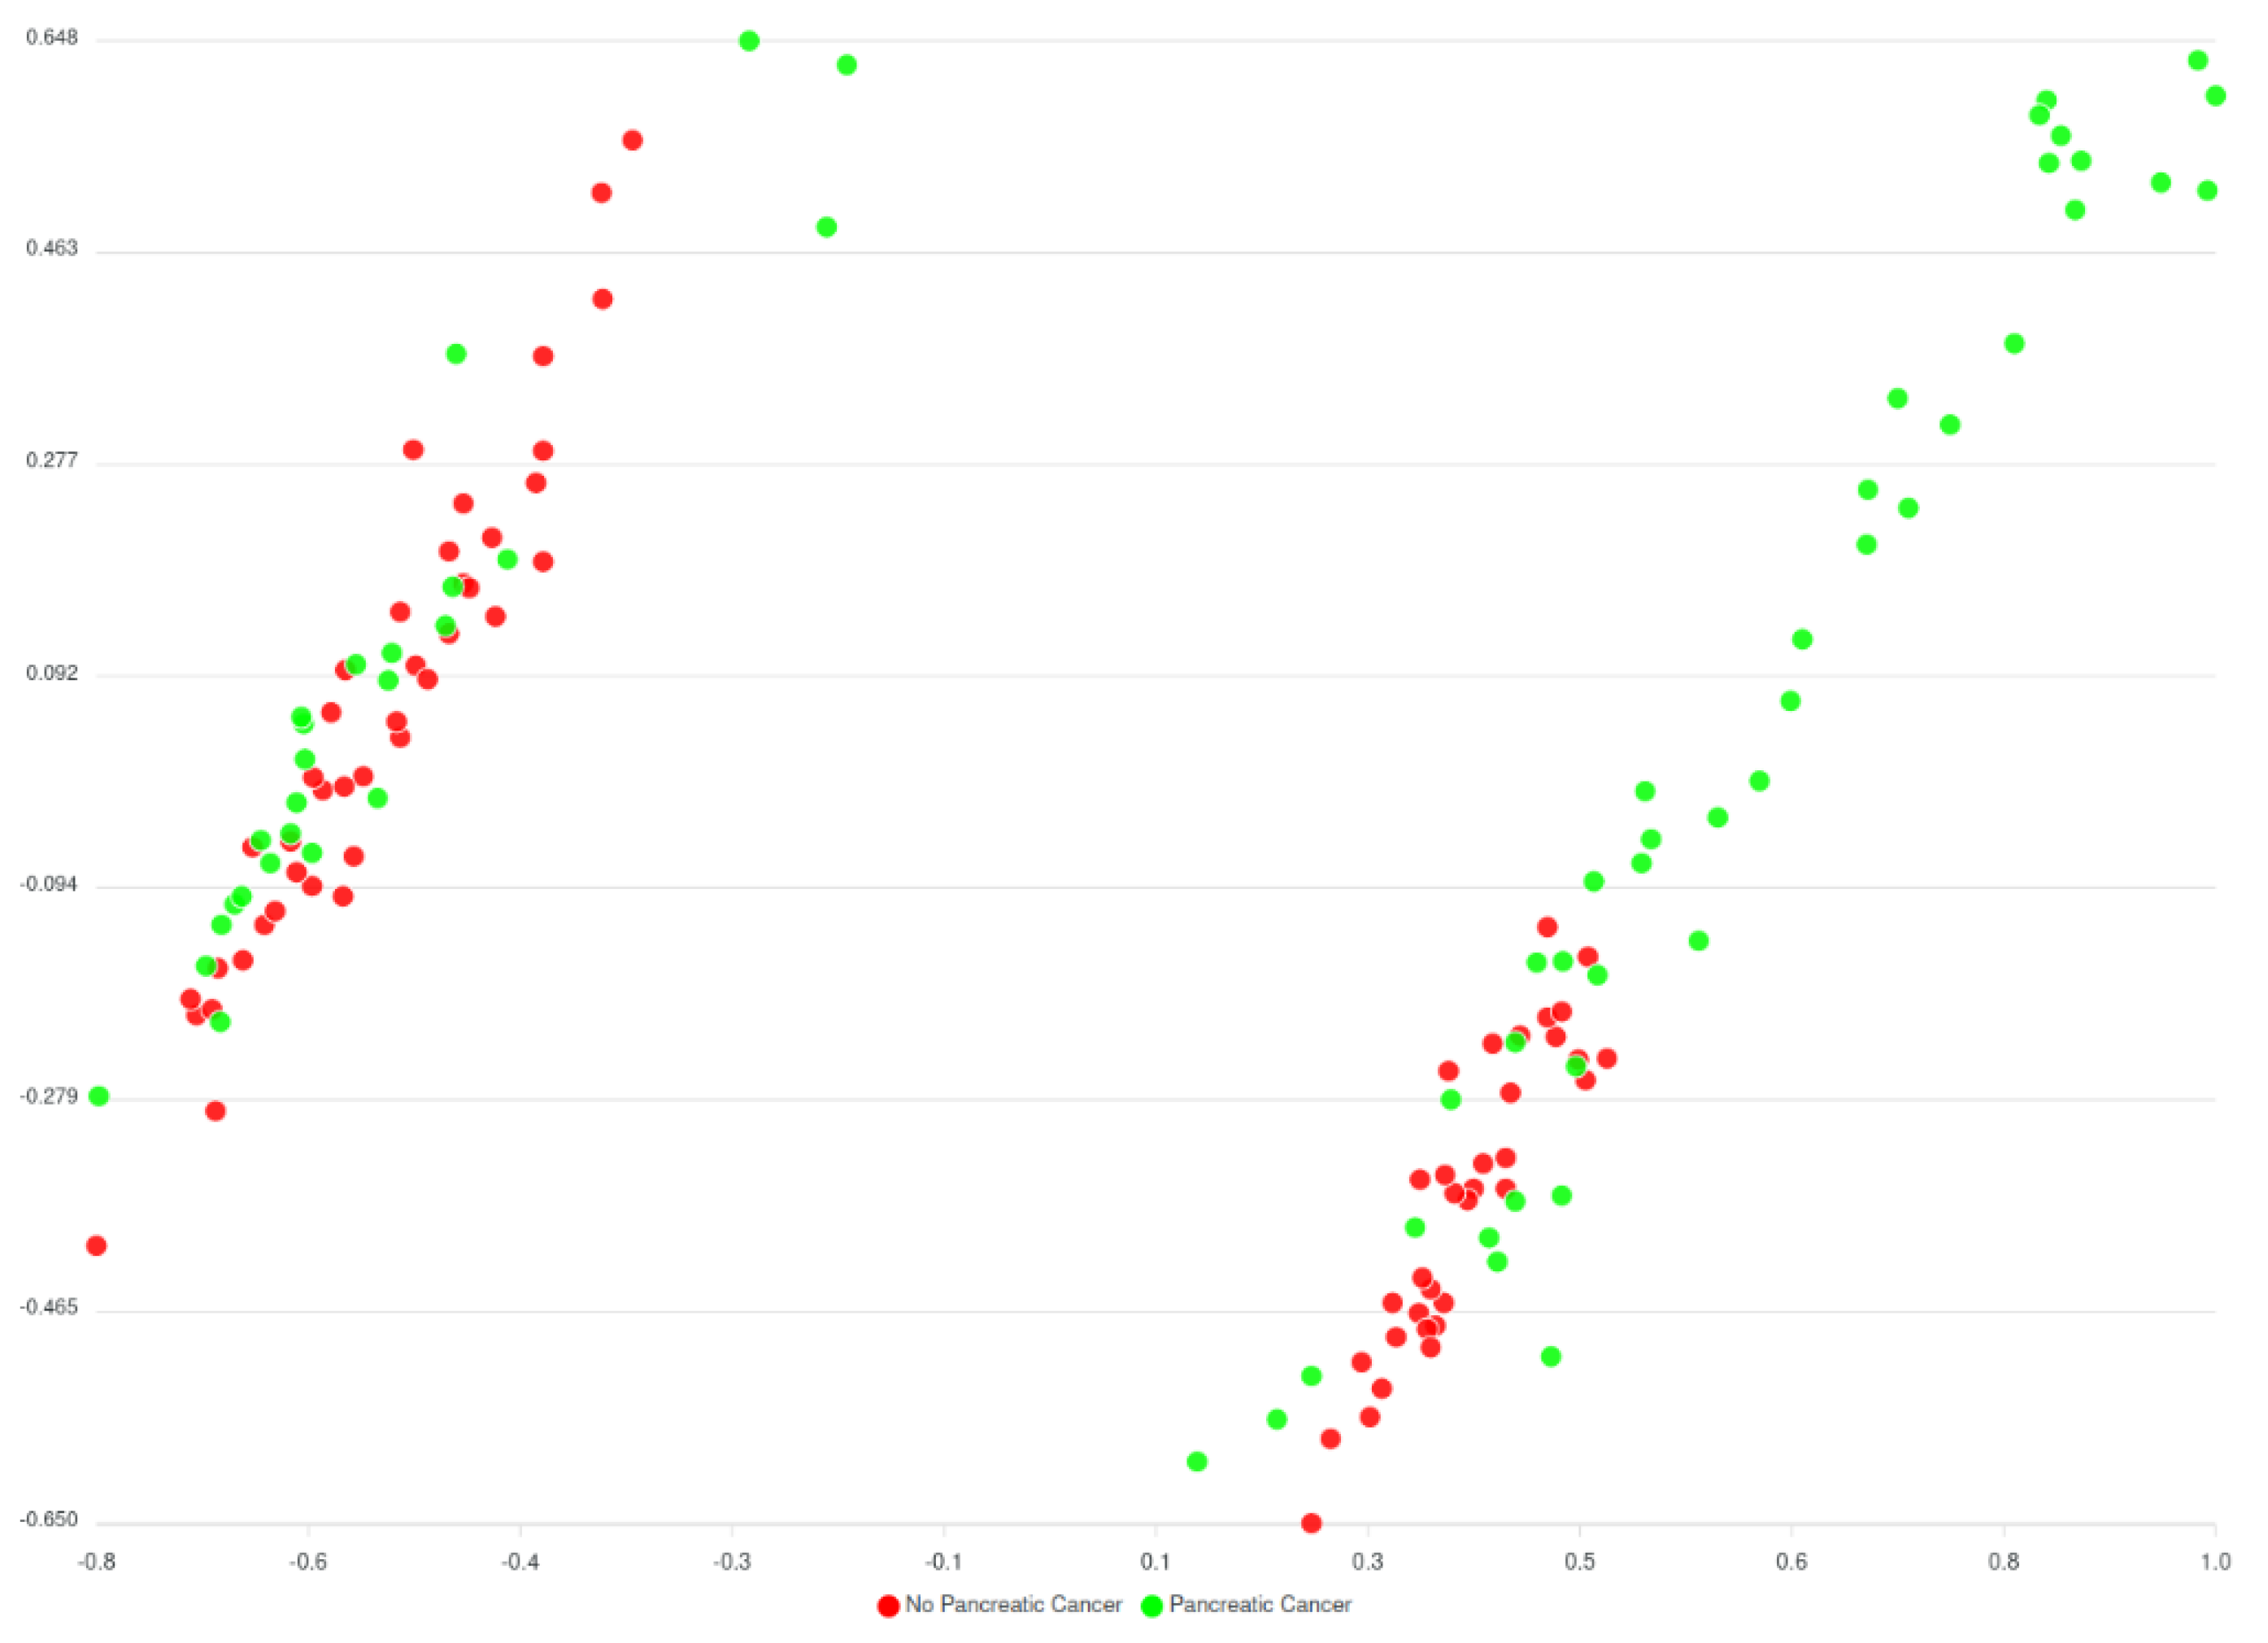
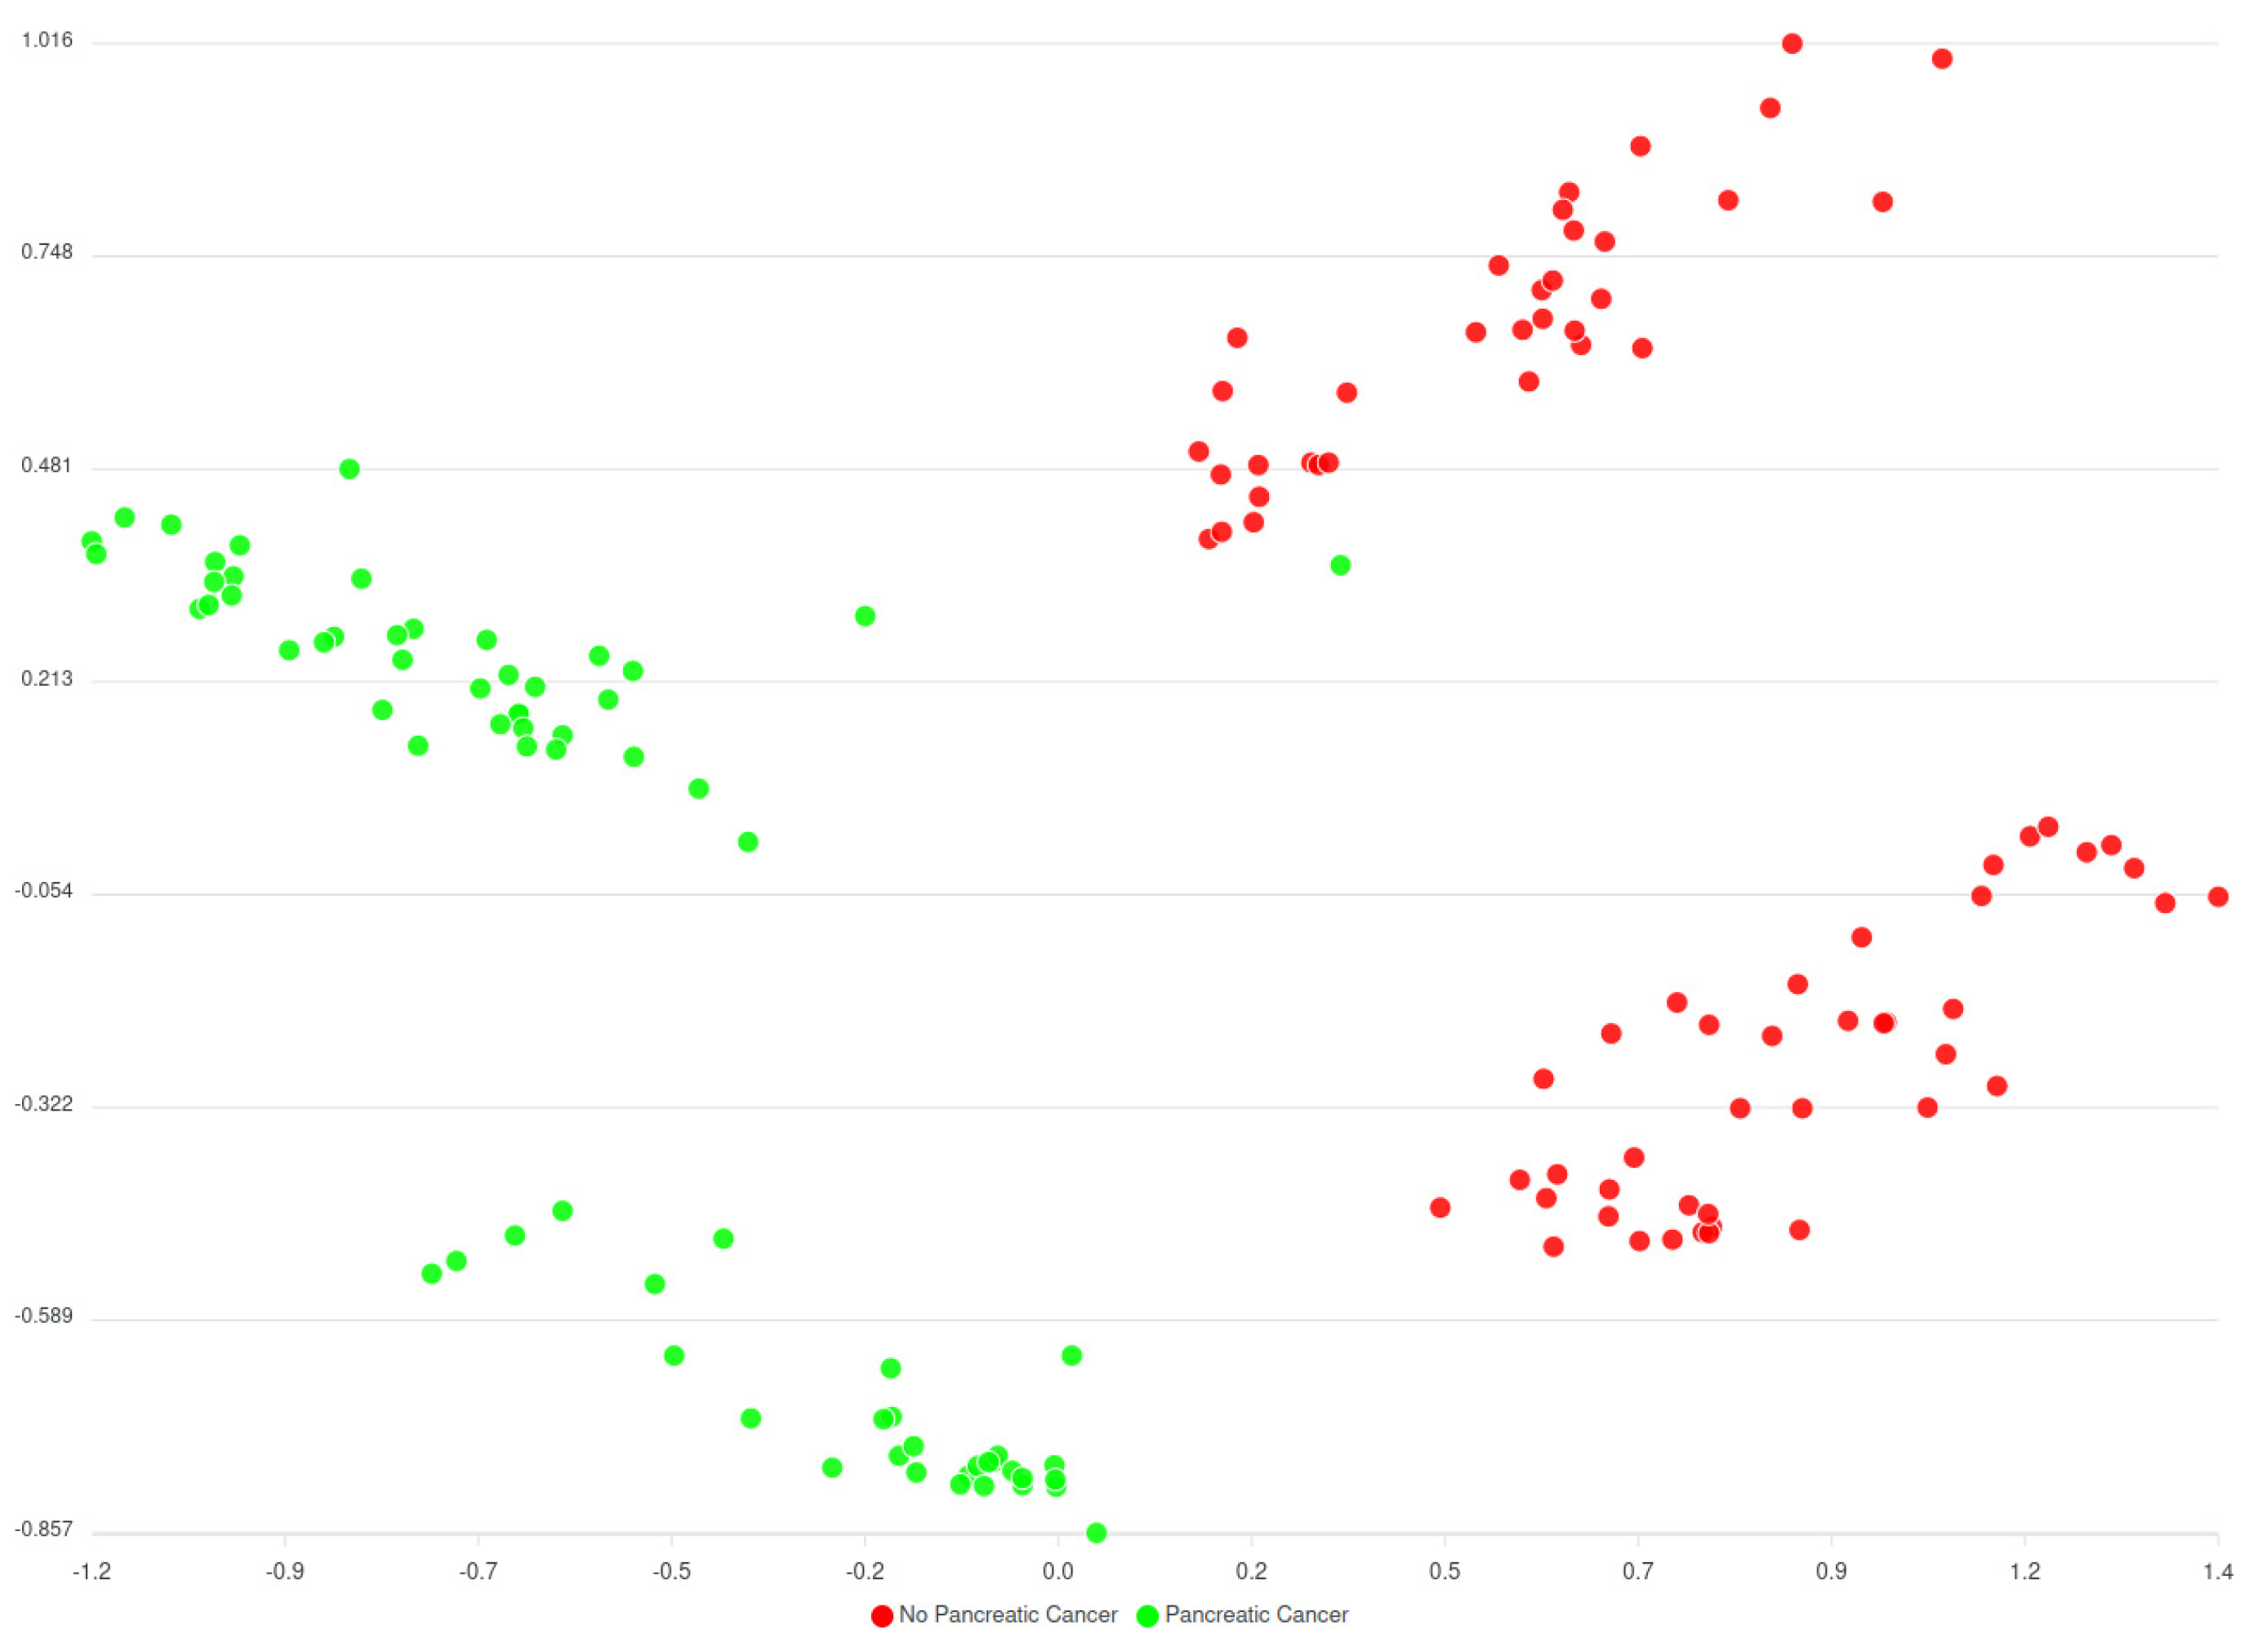
Before the comorbidities were considered, a huge number of different versions of AI models (around 240.000 models) have been trained, to assess every parameter combination requested by the classification algorithm. The best performing model hit the 70% accuracy rate and results are displayed in the
Figure 13 below.
Regarding the model considering comorbidities, a limited number of variations for the parameters have been trained and the results are still limited; however, it appears that the predicted clusters look better in comparison to the models trained without comorbidities as they have far less overlapping between the data and the clusters.
Based on
Figure 13 and
Figure 14 two groups of clusters can be distinguished: the Red group and the Green group. The Red group lists all patients that have not been diagnosed with pancreatic cancer whereas the Green group corresponds to those patients that have been diagnosed. Considering this classification, an initial prediction on likeliness or risk of developing pancreatic cancer of further patients can be regarded. However, as said, this classification (of
Figure 13) does not consider the comorbidities yet, while results from the models that consider comorbidities (of
Figure 14) indicate an enhancement in the overall analysis and risk identification approach; however further finetuning is needed. It should be noted that these are initial results, that were also evaluated by the clinicians of HDM who have reacted positively to these classifications and more actions are planned to be performed.
The comparison of both models is summarized in the following table,
Table 2, by indicating averages and ranges as concerns four different performance metrics.
The Silhouette coefficient indicates the separation between the clusters and the coefficient should be as close as possible to 0,5 (optimal range is between -1 and 1). The closer to 0,5 the better in the sense that the clusters will have fewer overlapping samples. On the other hand, the Adjust Rand Index (ARI) indicates the matching between real labels and the predicted clusters. Again, as optimal range is between -1 and 1, the models considering comorbidities are closer to an average ARI 0,5 meaning that they perform better in matching between real and predicted clusters.
Regarding the second predictor model, this considers the data gathered over 6 months where a subgroup of volunteers has acceded to be part of the experiment. These volunteers have been enrolled to change their daily activities and habits so that an epigenetic analysis could be performed. After a six months period has passed, the HCPs of HDM are now in the position to assess whether these volunteers have their epigenetic markers changed in the right direction to perform the clinical study, which is the purpose of this use case. In other words, see how the changes in lifestyle and habits influence the likeliness of developing pancreatic cancer.
3.4. Decision Support System
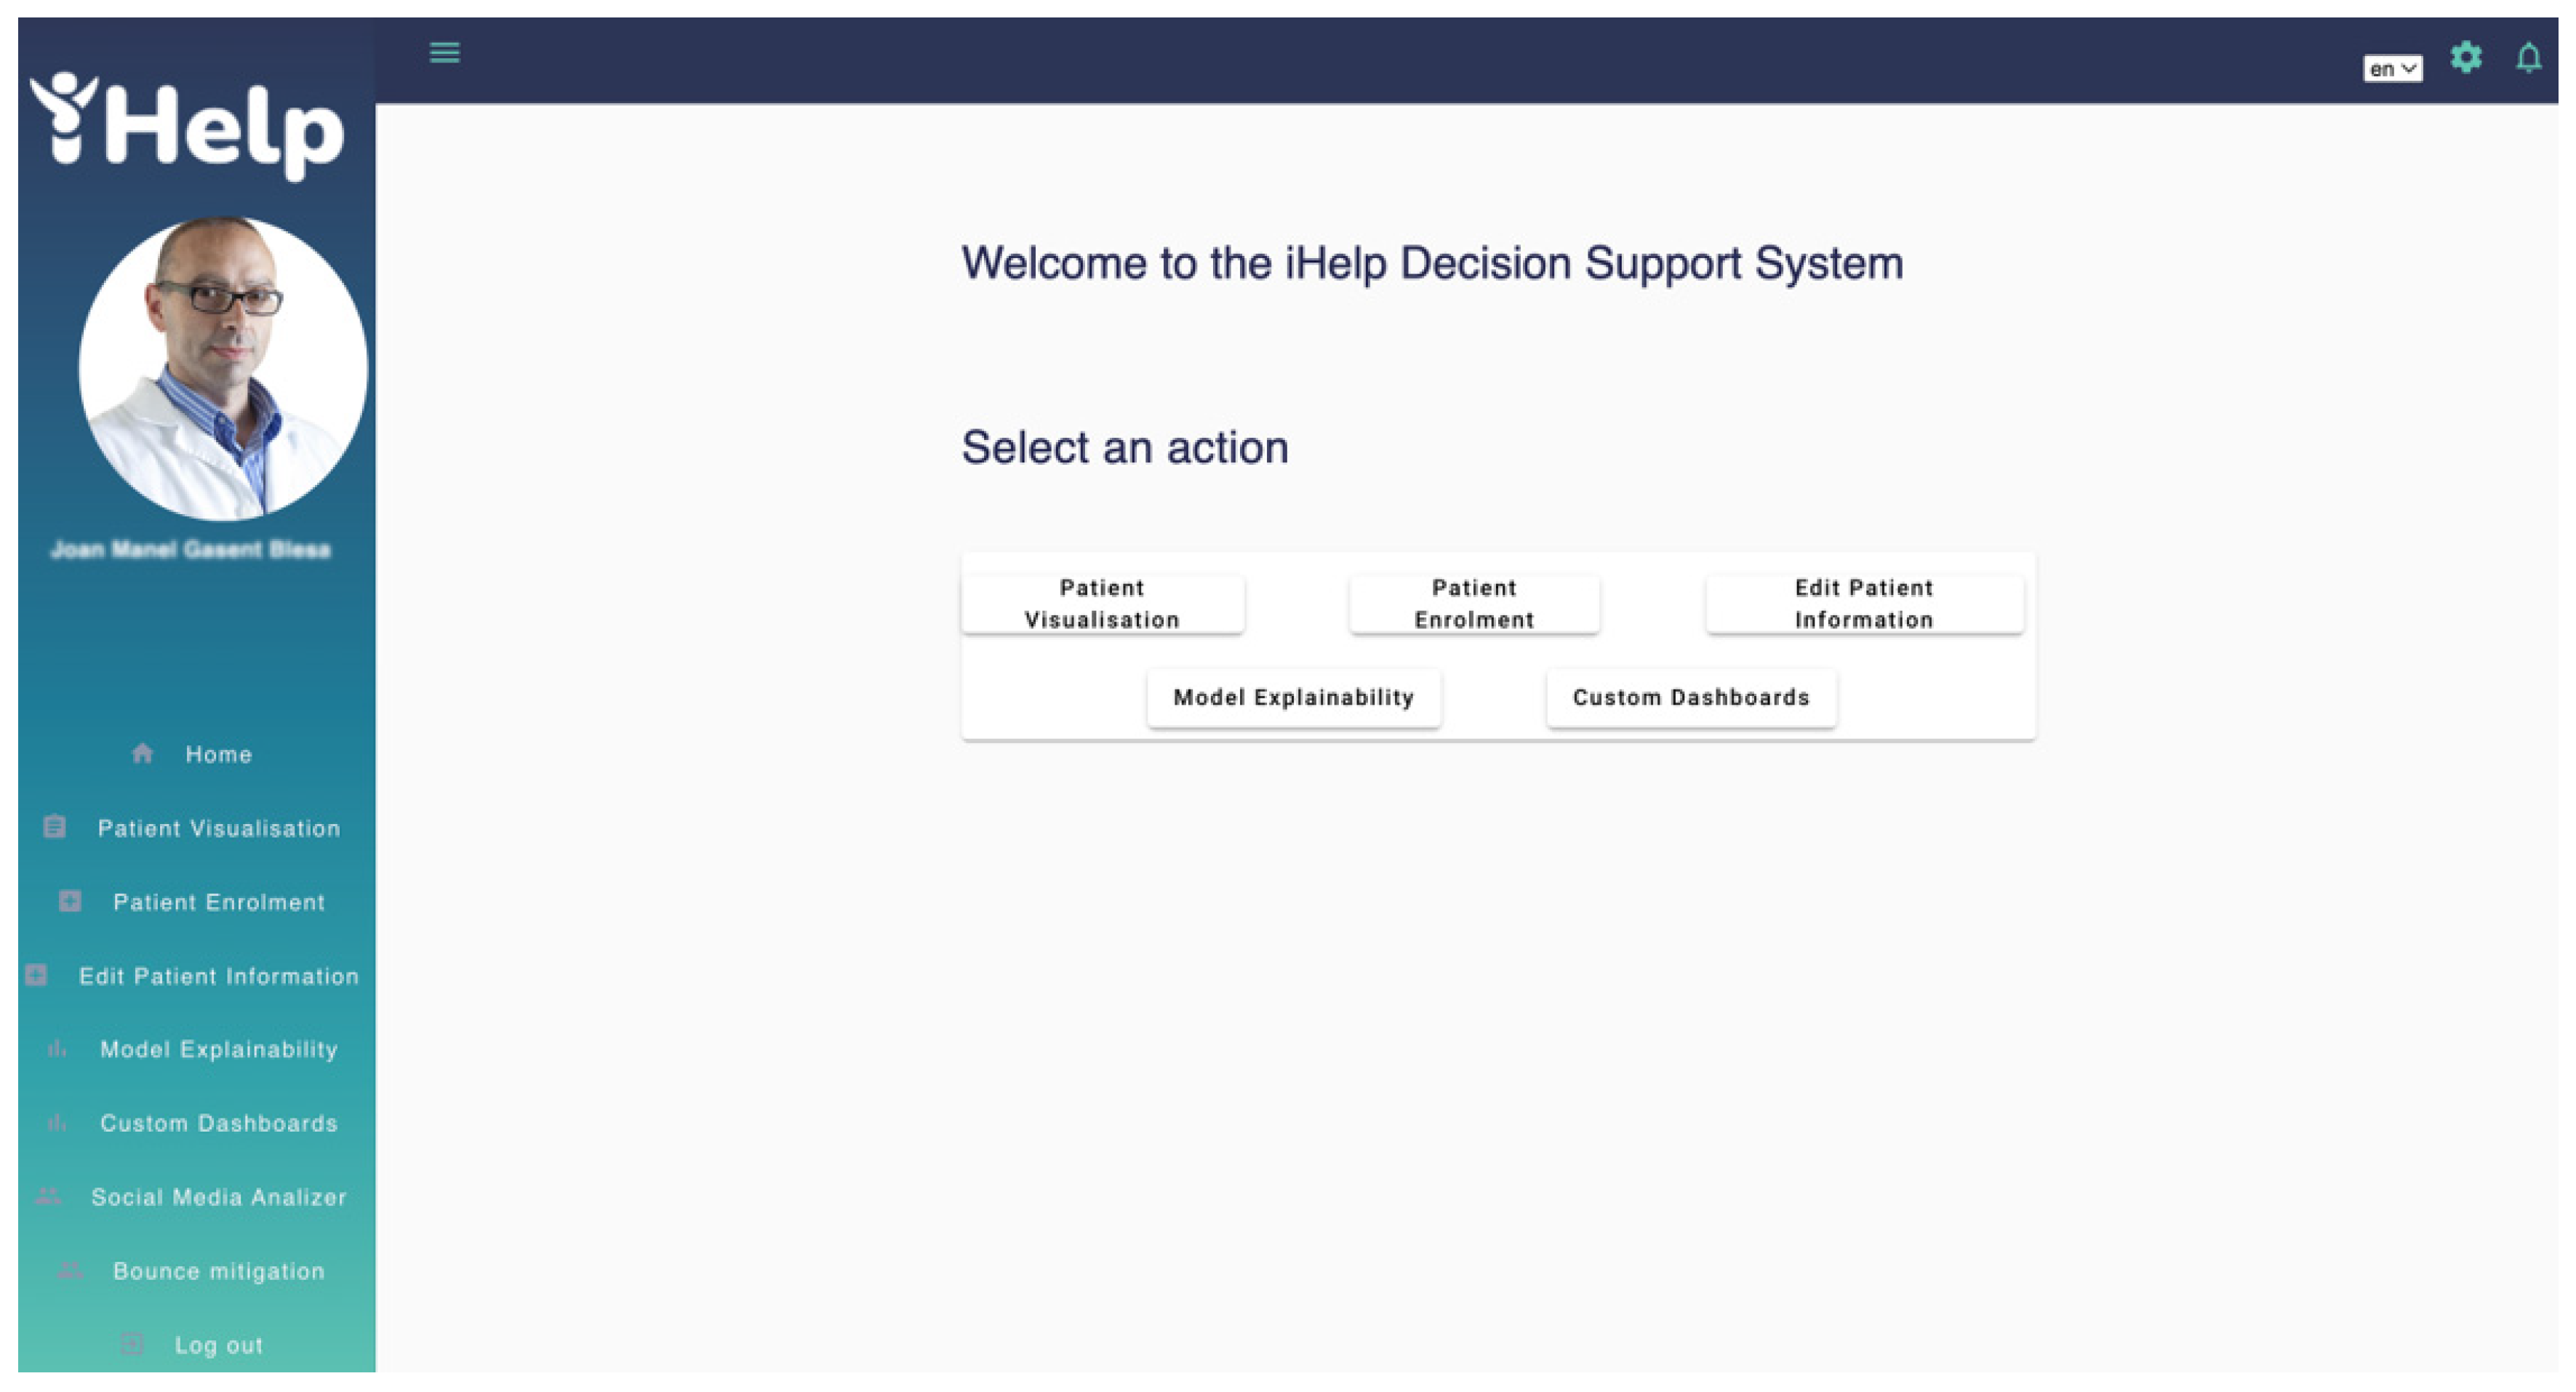
The Decision Support System (DSS) allows the HCP to visualize the primary and secondary data for a particular patient among other functionalities, such us running AI models and reviewing and approval of customized messages generated by the Monitoring and Alerting system. When the HCP accesses the DSS a welcome menu appears with the main functionalities provided to the HCP role,
Patient Visualization,
Patient Enrolment,
Edit Patient Information,
Model Explainability and
Custom Dashboards as shown in
Figure 15. The first time a patient is added to the iHelp platform, the HCP adds the patient’s hospital identifier and the Healthentia platform identifier into the
Patient Enrolment interface to allow the iHelp platform to associate the data provided by the hospital (primary) and data provided by the Healthentia platform (secondary). An iHelp identifier is then generated which will be the patient’s identifier within the iHelp platform.
Whenever the HCP needs to access the historical data of a specific patient, he/she accesses the “Patient Visualization” interface and enters the iHelp identifier. Automatically all information obtained for that patient is collected from the underlying Data storage and displayed in the different charts. In
Figure 16 two drop-down menus are depicted showing the data provided by the hospital (primary) and the data provided by Healthentia (secondary) for the patient with id “ec4a096d-eaa3-4536-91c4-5bc64134a247” respectively. In addition, a set of actions can be accessed from the same interface. The “Risk Identification” button opens an interface that allows the HCP to run AI models for that patient. The “Risk Mitigation” button gives access to web interface of the Monitoring and Alerting system. The “Impact Evaluator” and the “Personalized Recommendation Review” buttons, which give access to the respective actions.
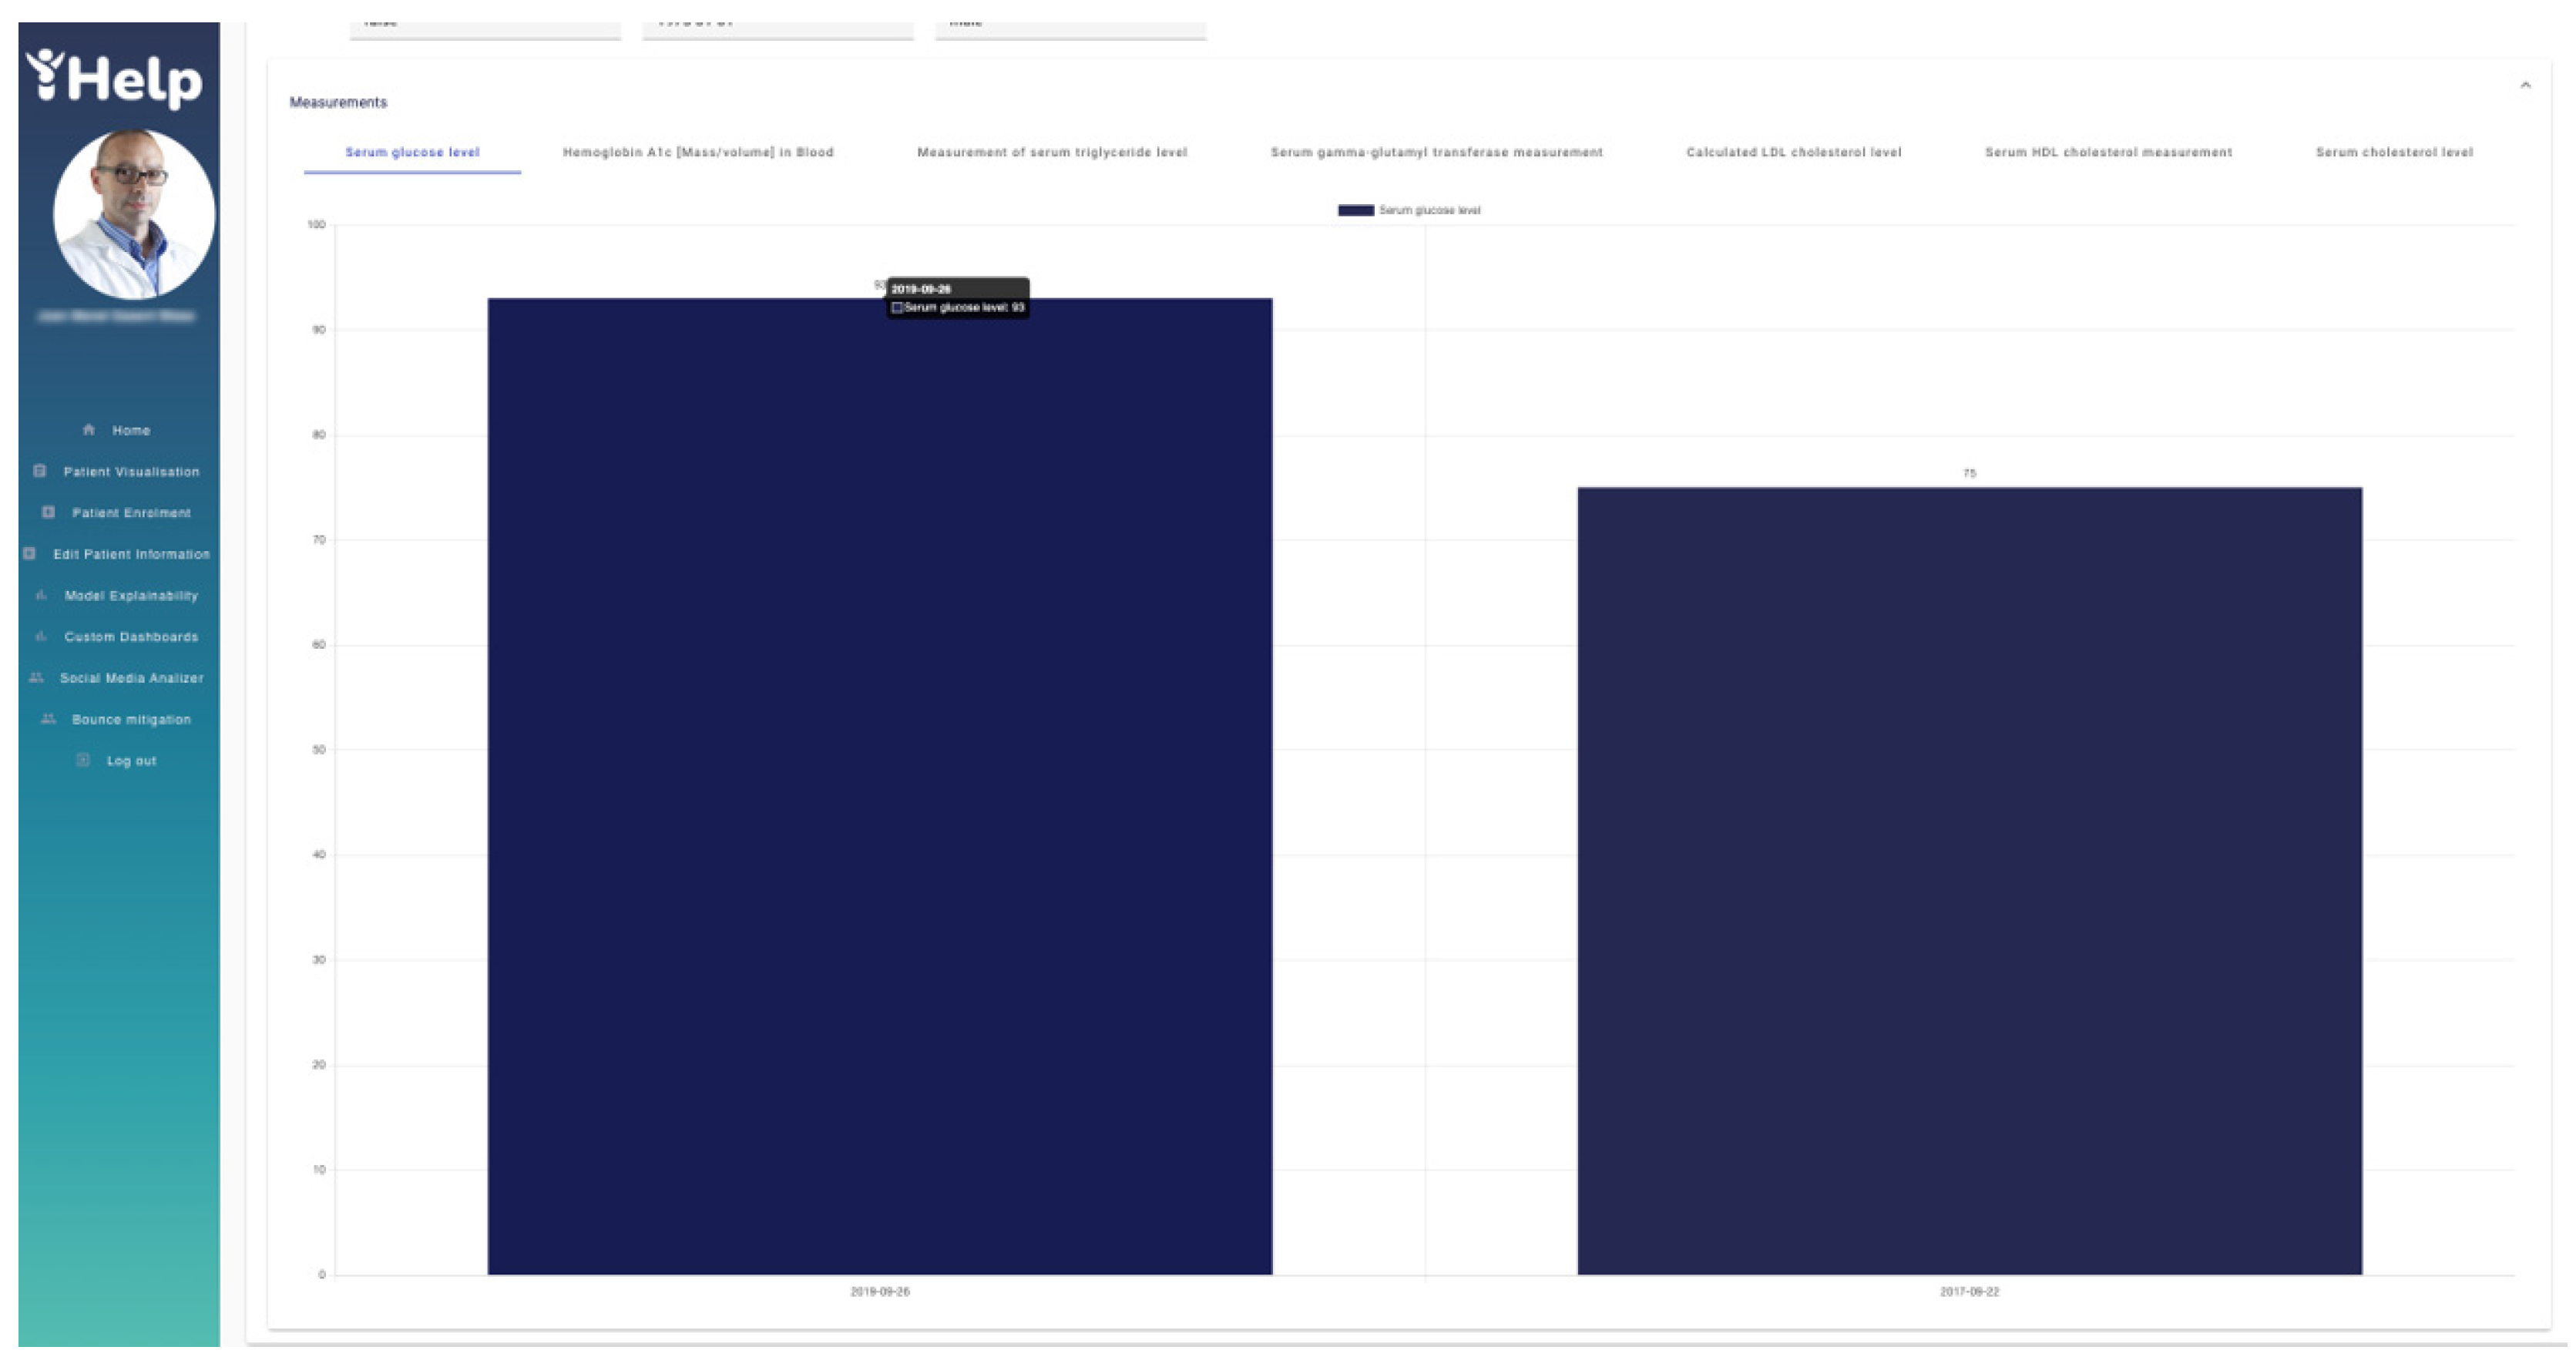
On top of this,
Figure 17 depicts the data provided by the hospital through different graphs. These graphs are navigable and show the real values obtained in each of the patient samples for a better understanding by the HCP. In this case,
Figure 17 shows the “Serum glucose level” of two different tests with values 93 and 75 respectively.
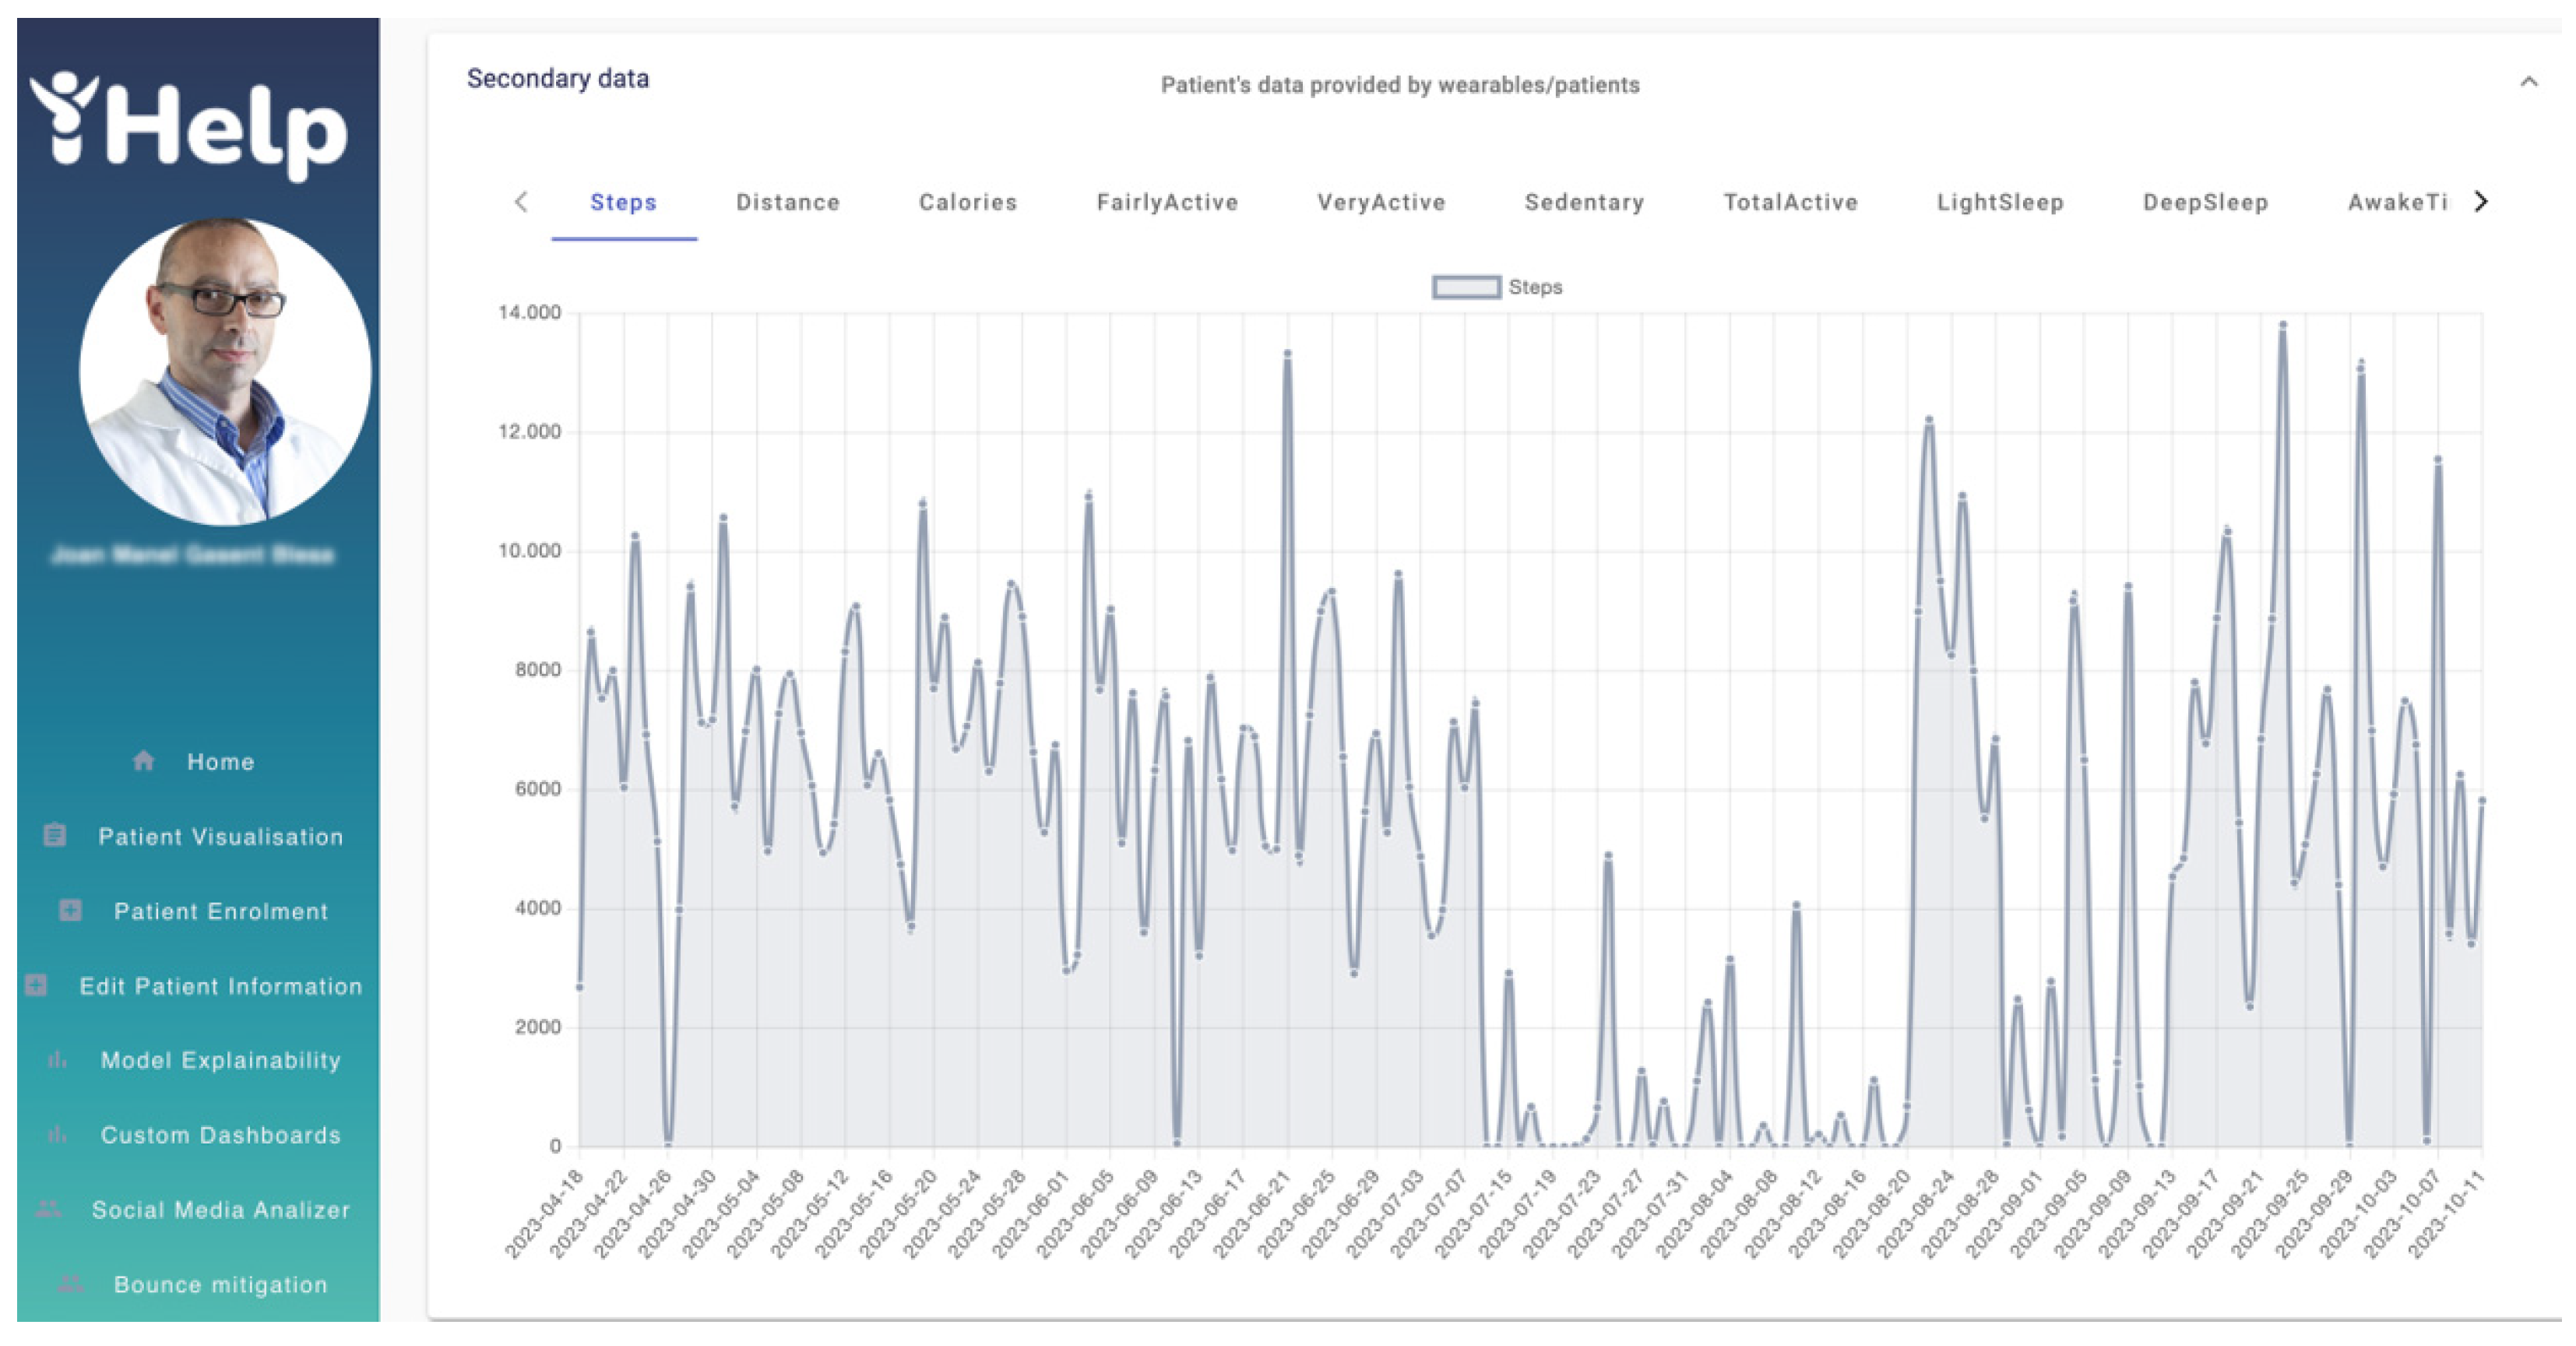
Similarly,
Figure 18 shows in different graphs the data obtained by the patient's wearable, such as the number of daily steps or the distance among others available on the Healthentia platform. For example,
Figure 18 shows the graph of the number of steps from 18
th April 2023 to 11
th October 2023. With graphs like these, the HCP can track and analyze the patient’s physical activity, enhancing the overall monitoring phase, as well as the decision-making process.
The
Risk Identification interface allows the HCP to run models available in the
Model Manager component for that patient.
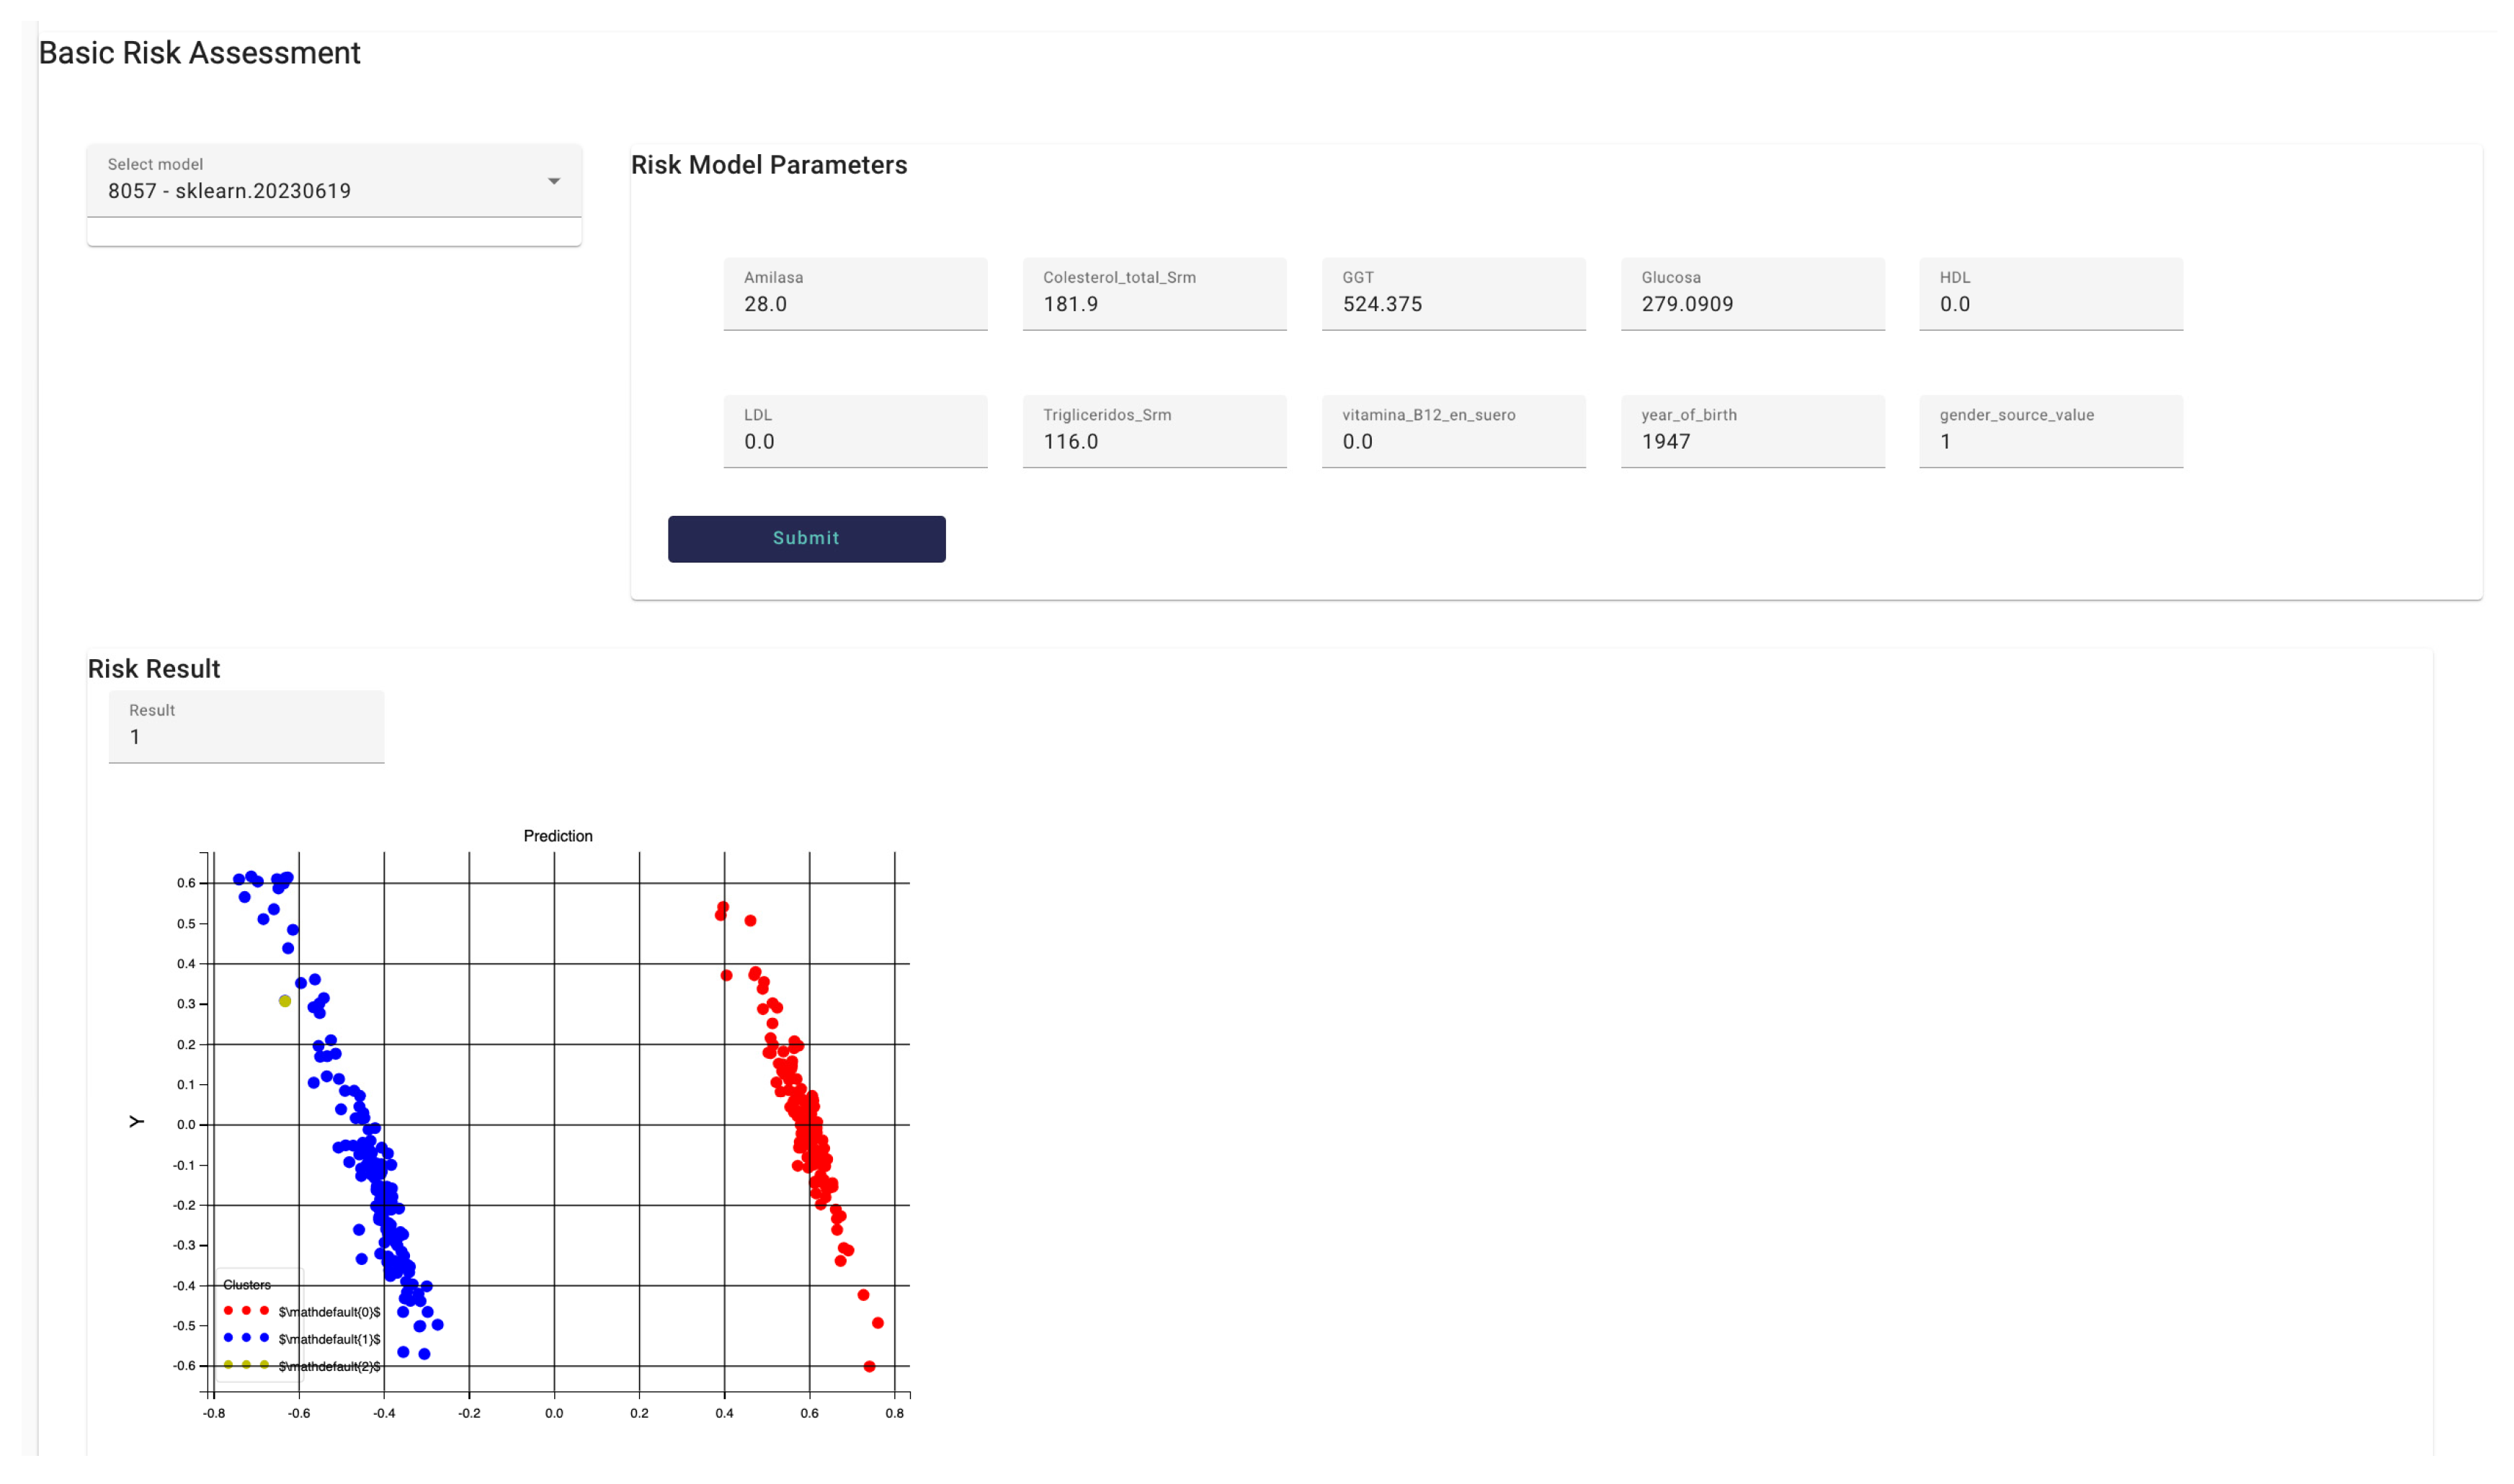
Figure 19 shows the
Risk identification interface, in particular the Basic Risk Assessment interface that allows interaction with models trained and run with data provided by the hospital (primary data). In this case, the model “8057 – sklearn.20230619” has been selected. This model allows to identify whether the patient is at risk to develop Pancreatic cancer or not. Once the HCP selects the model from the available ones, the model parameters are displayed in a form-based panel with all fields automatically filled in with the data obtained for the patient. The HCP can modify the values of the fields accessing the field by typing the desired value. In this example, the model asks for 10 parameters. The HCP then presses the
submit button and the model is run, when the result is available it is represented within the DSS interface. The result is displayed in text and a clustering graph, in this case the patient (yellow point in the graph) may develop pancreatic cancer based on the data provided to the model.
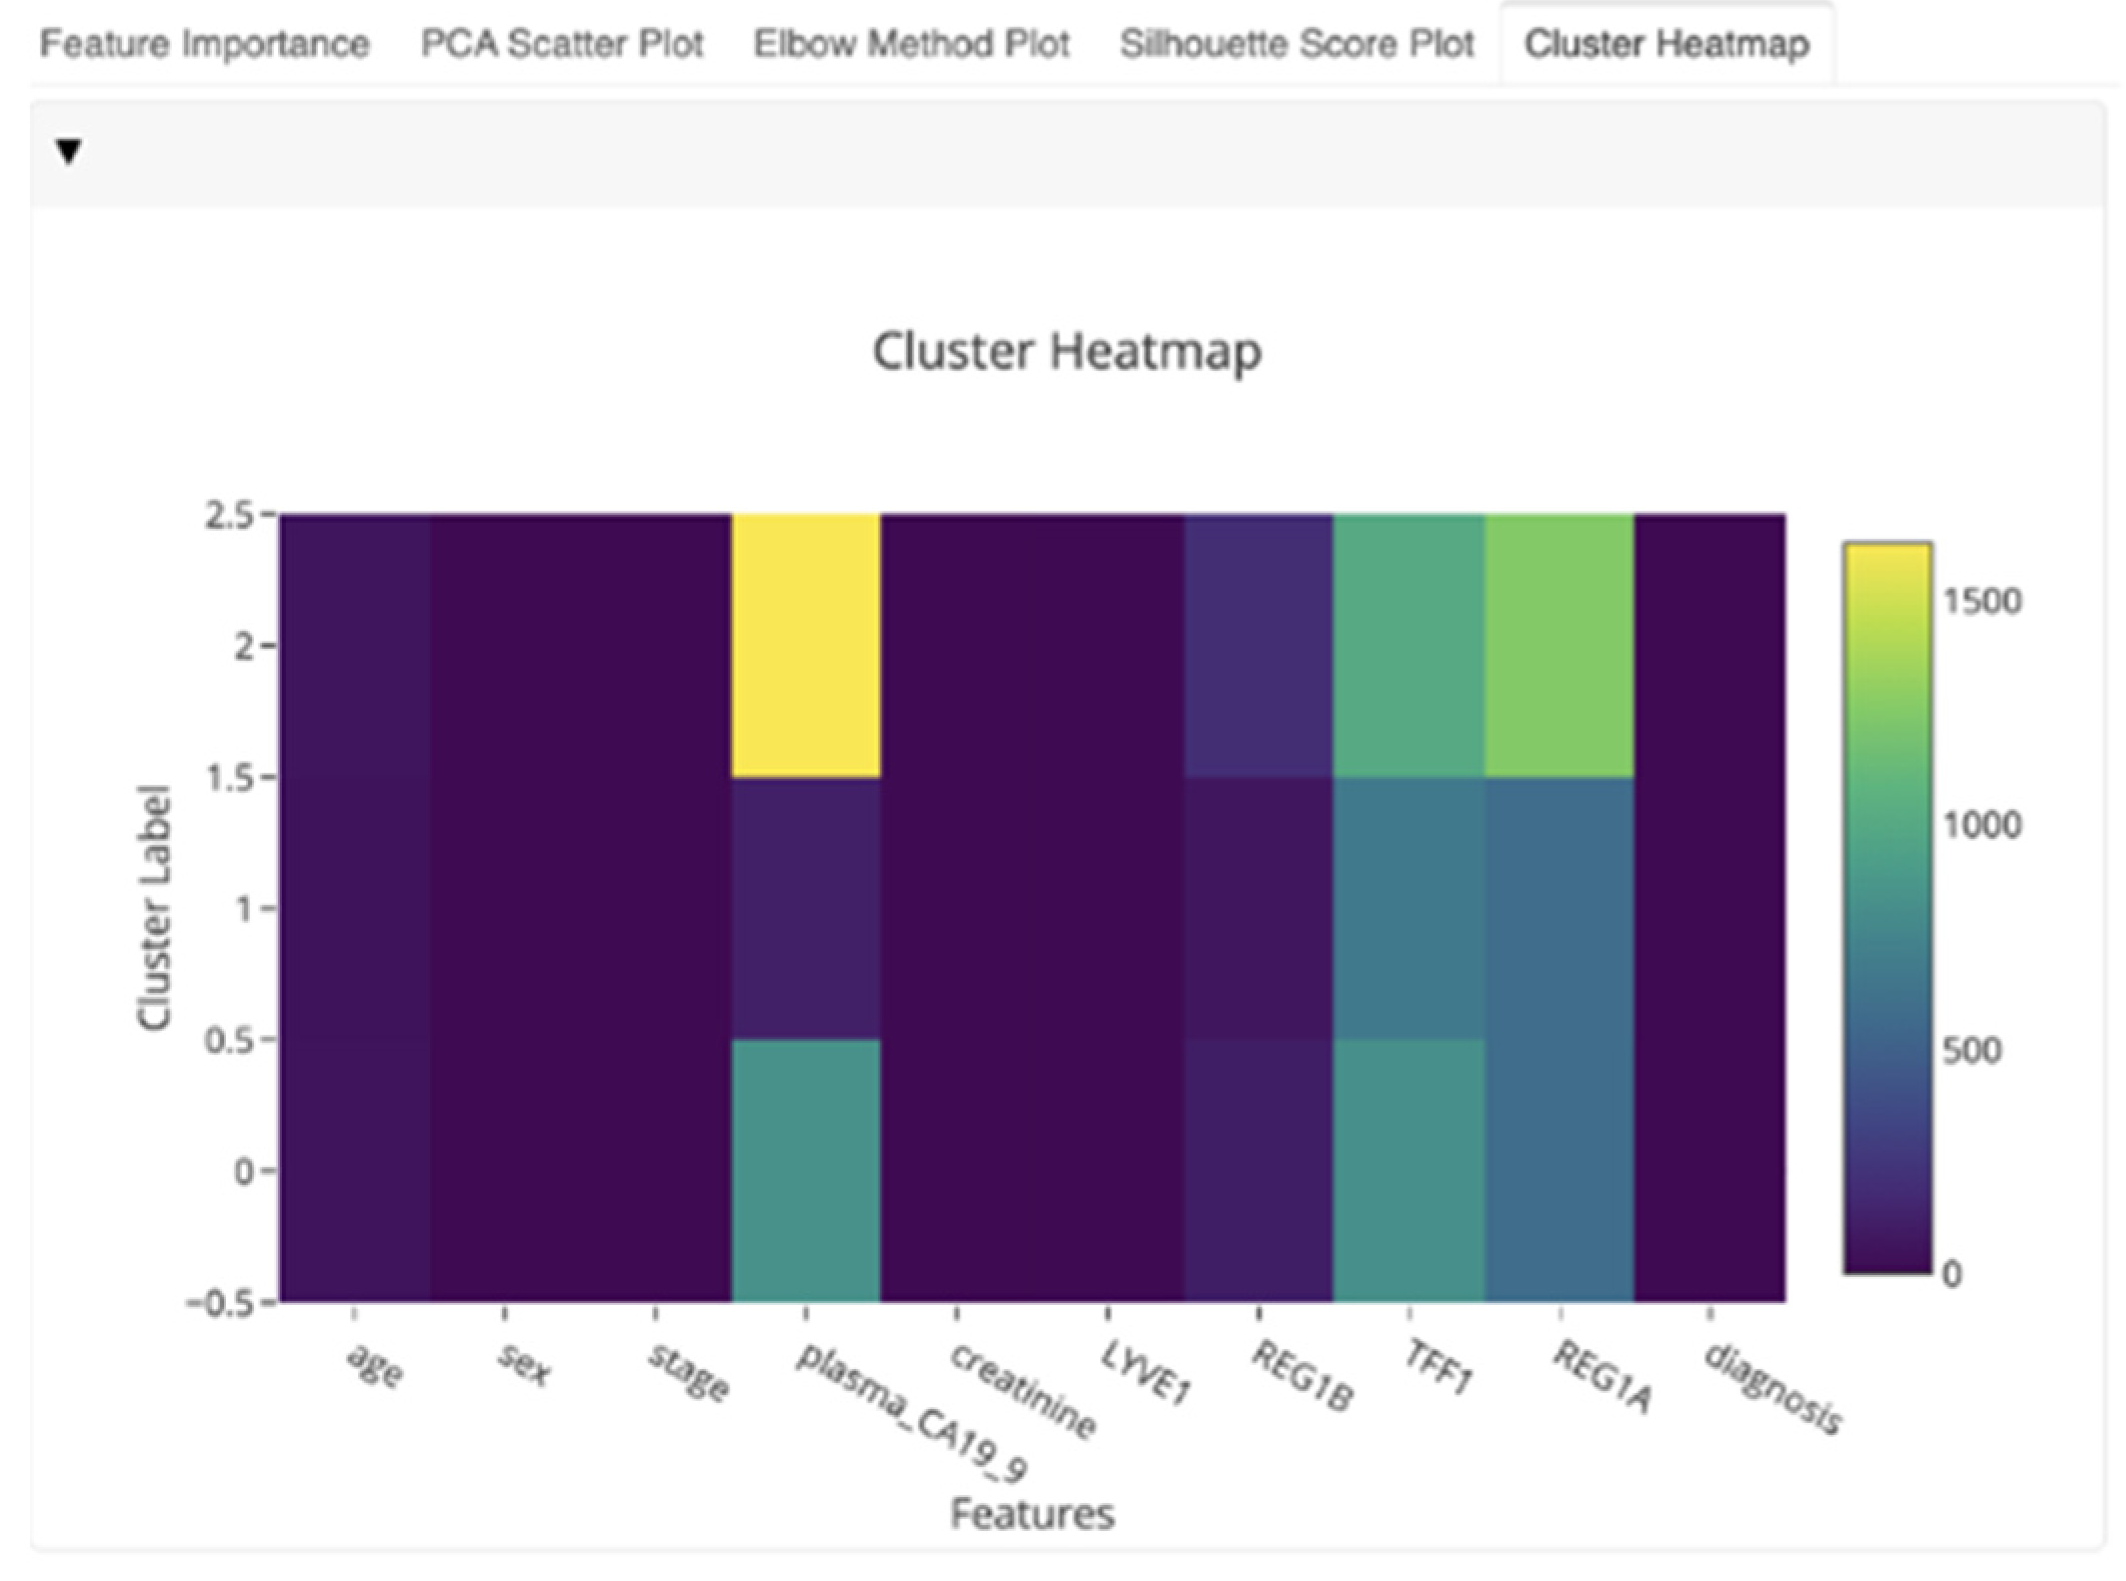
To improve the explainability and interpretability of the models’ outcomes and enhance the knowledge that can be derived for the HCPs, the DSS also utilizes the EDH subcomponent. This component is embedded into the DSS suite and initially presented in
Section 2.7. The EDH is a collection of tools for rapidly creating interactive dashboards with several visualizations for evaluating and presenting the forecasts and processes of the already implemented AI models. This enables HCPs to have an overview of the specific features, allowing them to reach faster conclusions about the most significant factors in pancreatic cancer, based on the comparison of the diagrams. This subcomponent allows any AI model to be essentially “explained” by providing intuitive and interactive visualizations that aim to showcase which features are most relevant to a given prediction and the outcomes of the model. It seeks to explain the predictions of an instance “x” as derived by the models presented in
Section 3.3. The latter is further explained by calculating the contribution of each feature to the predicted cluster, as indicated in
Figure 20.
Finally, the overall functionality of the DSS is complemented by the utilization of a personalized recommendation mechanism and the personalized messages that are automatically generated for this particular patient. In that context,
Figure 21 shows the
Personalized Recommendation Review interface where messages generated by the
Monitoring and Alerting system are listed to be reviewed and approved by the HCP. A table containing the message identifier, the message title, the status and the send/reject actions fields displays the messages. The HCP can decide to send the message to the patient directly through the Healthentia mobile application or reject those messages whose status is
PROPOSED. Messages with other status such as
APPROVED, SENT or
AUTOMATIC are listed for consideration by the HCP, but no action is required for those messages.
3.5. Monitoring and Alerting
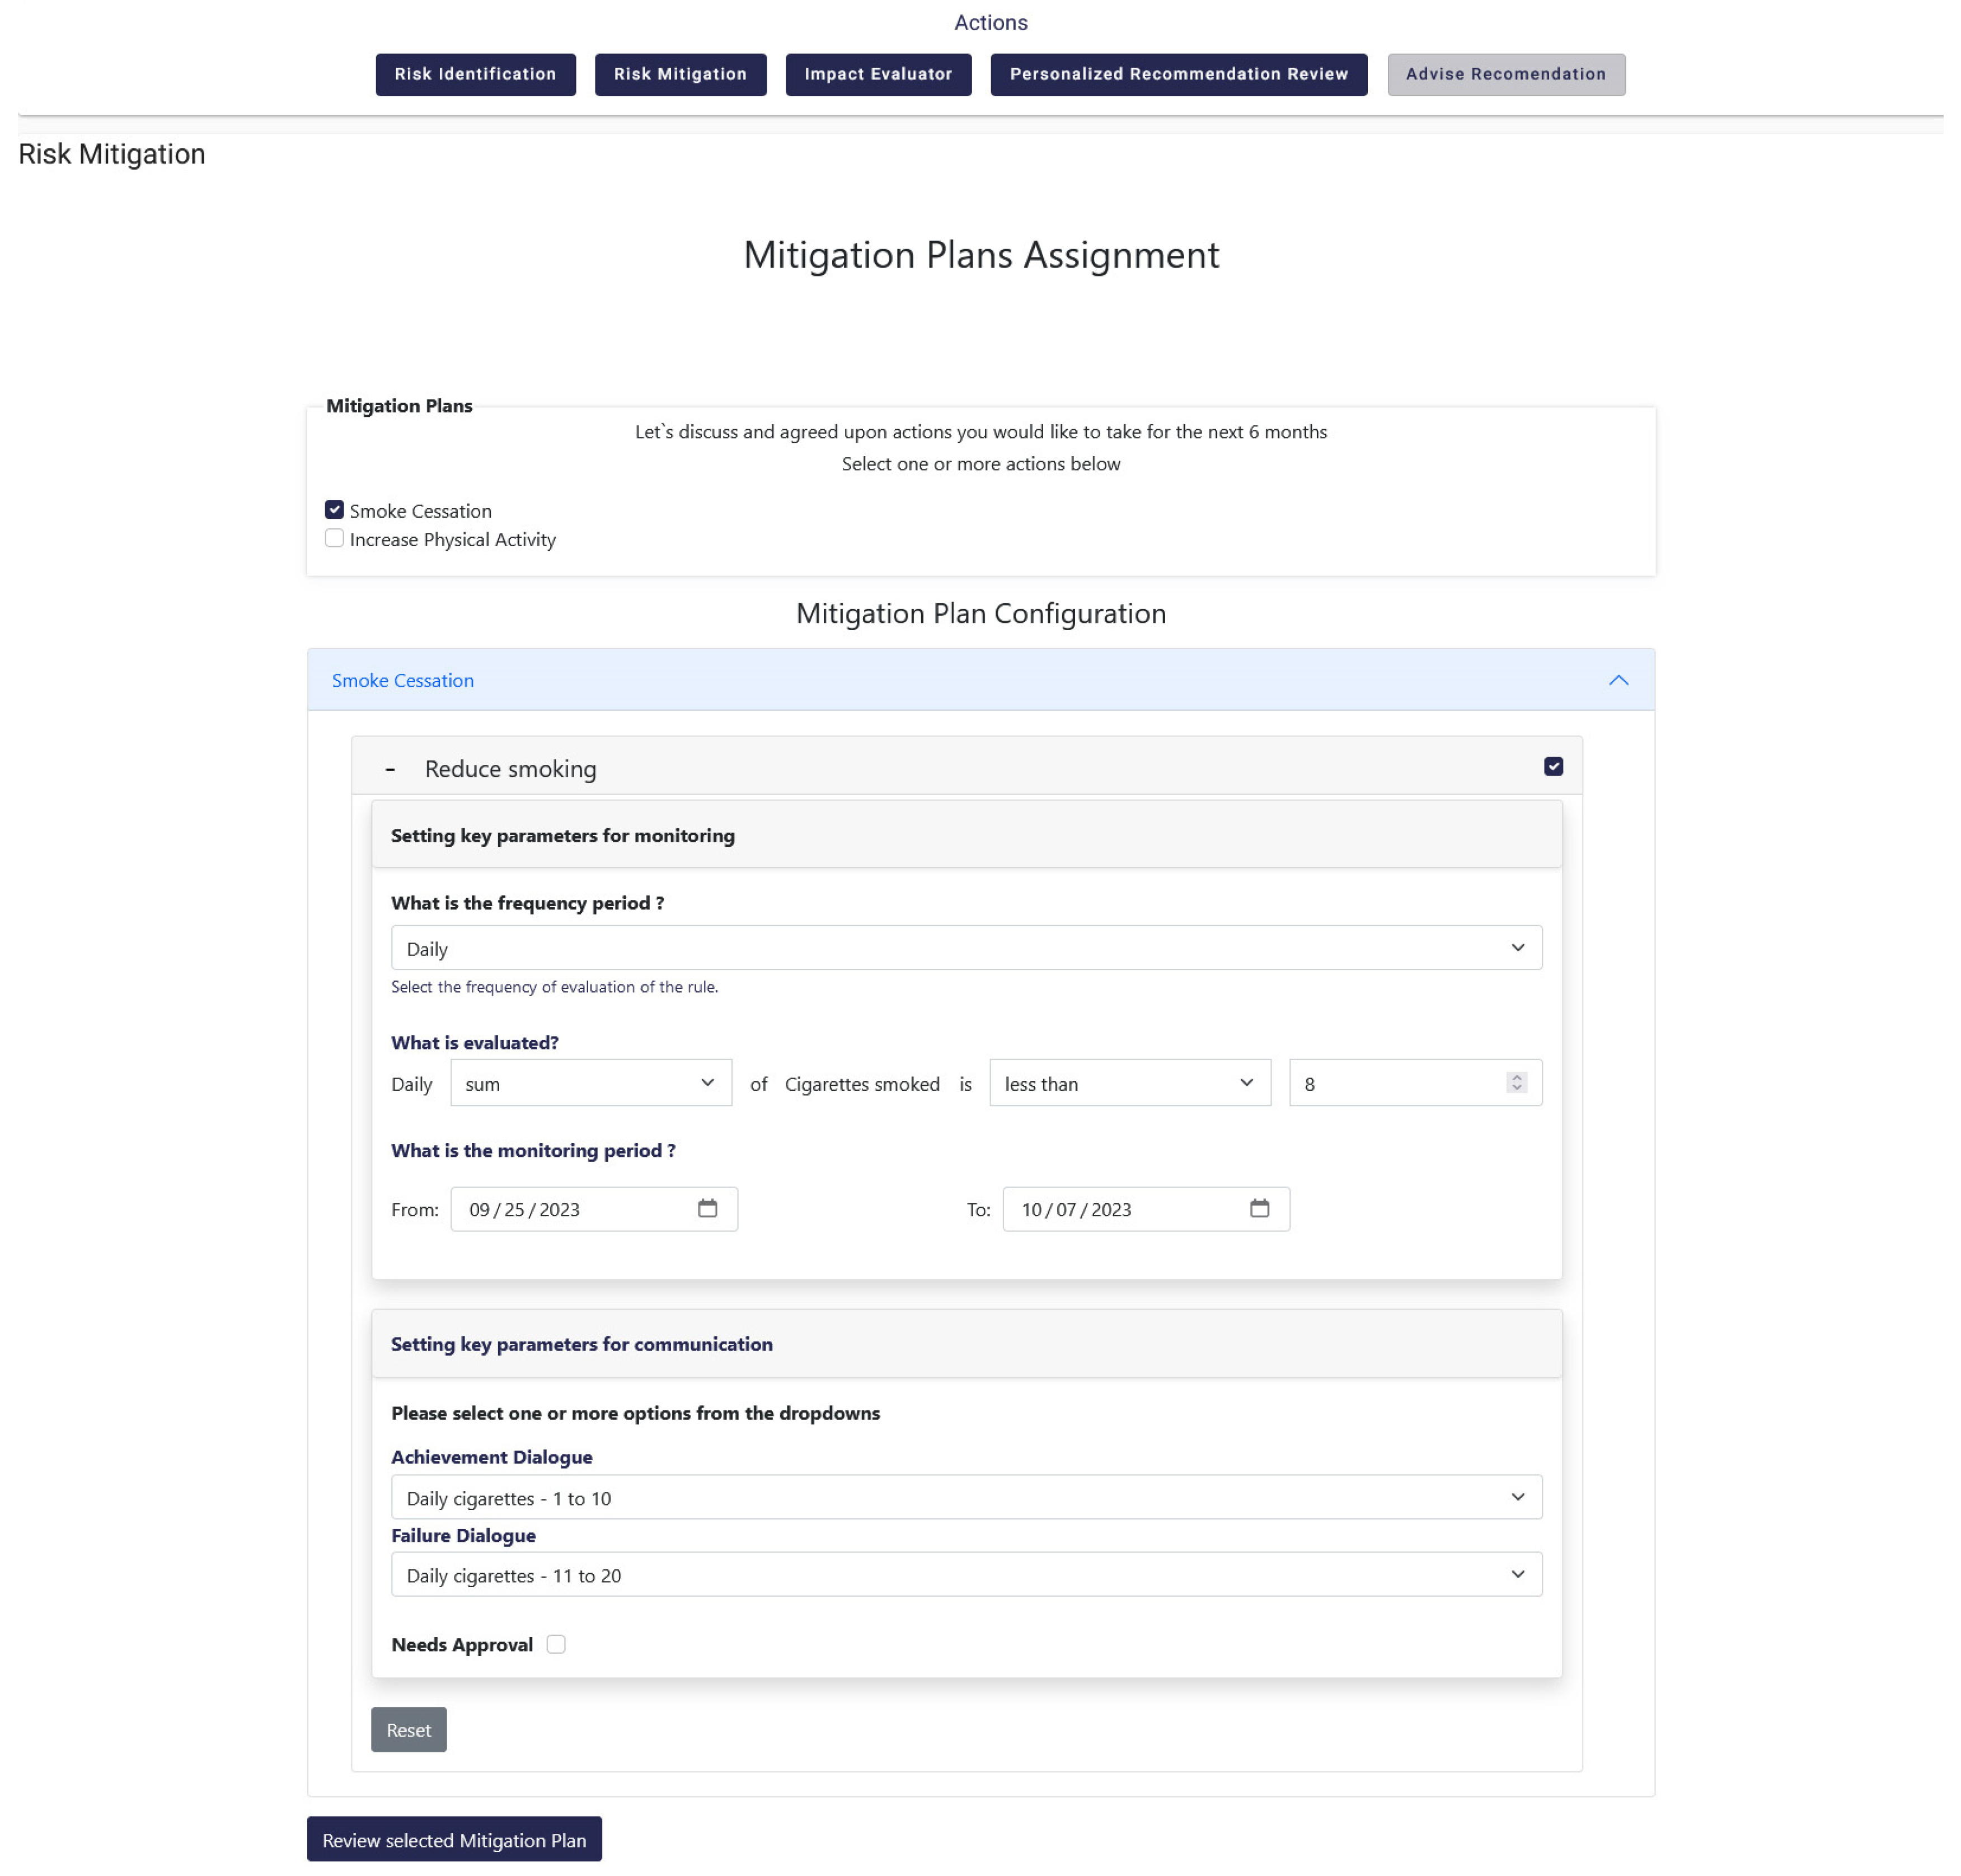
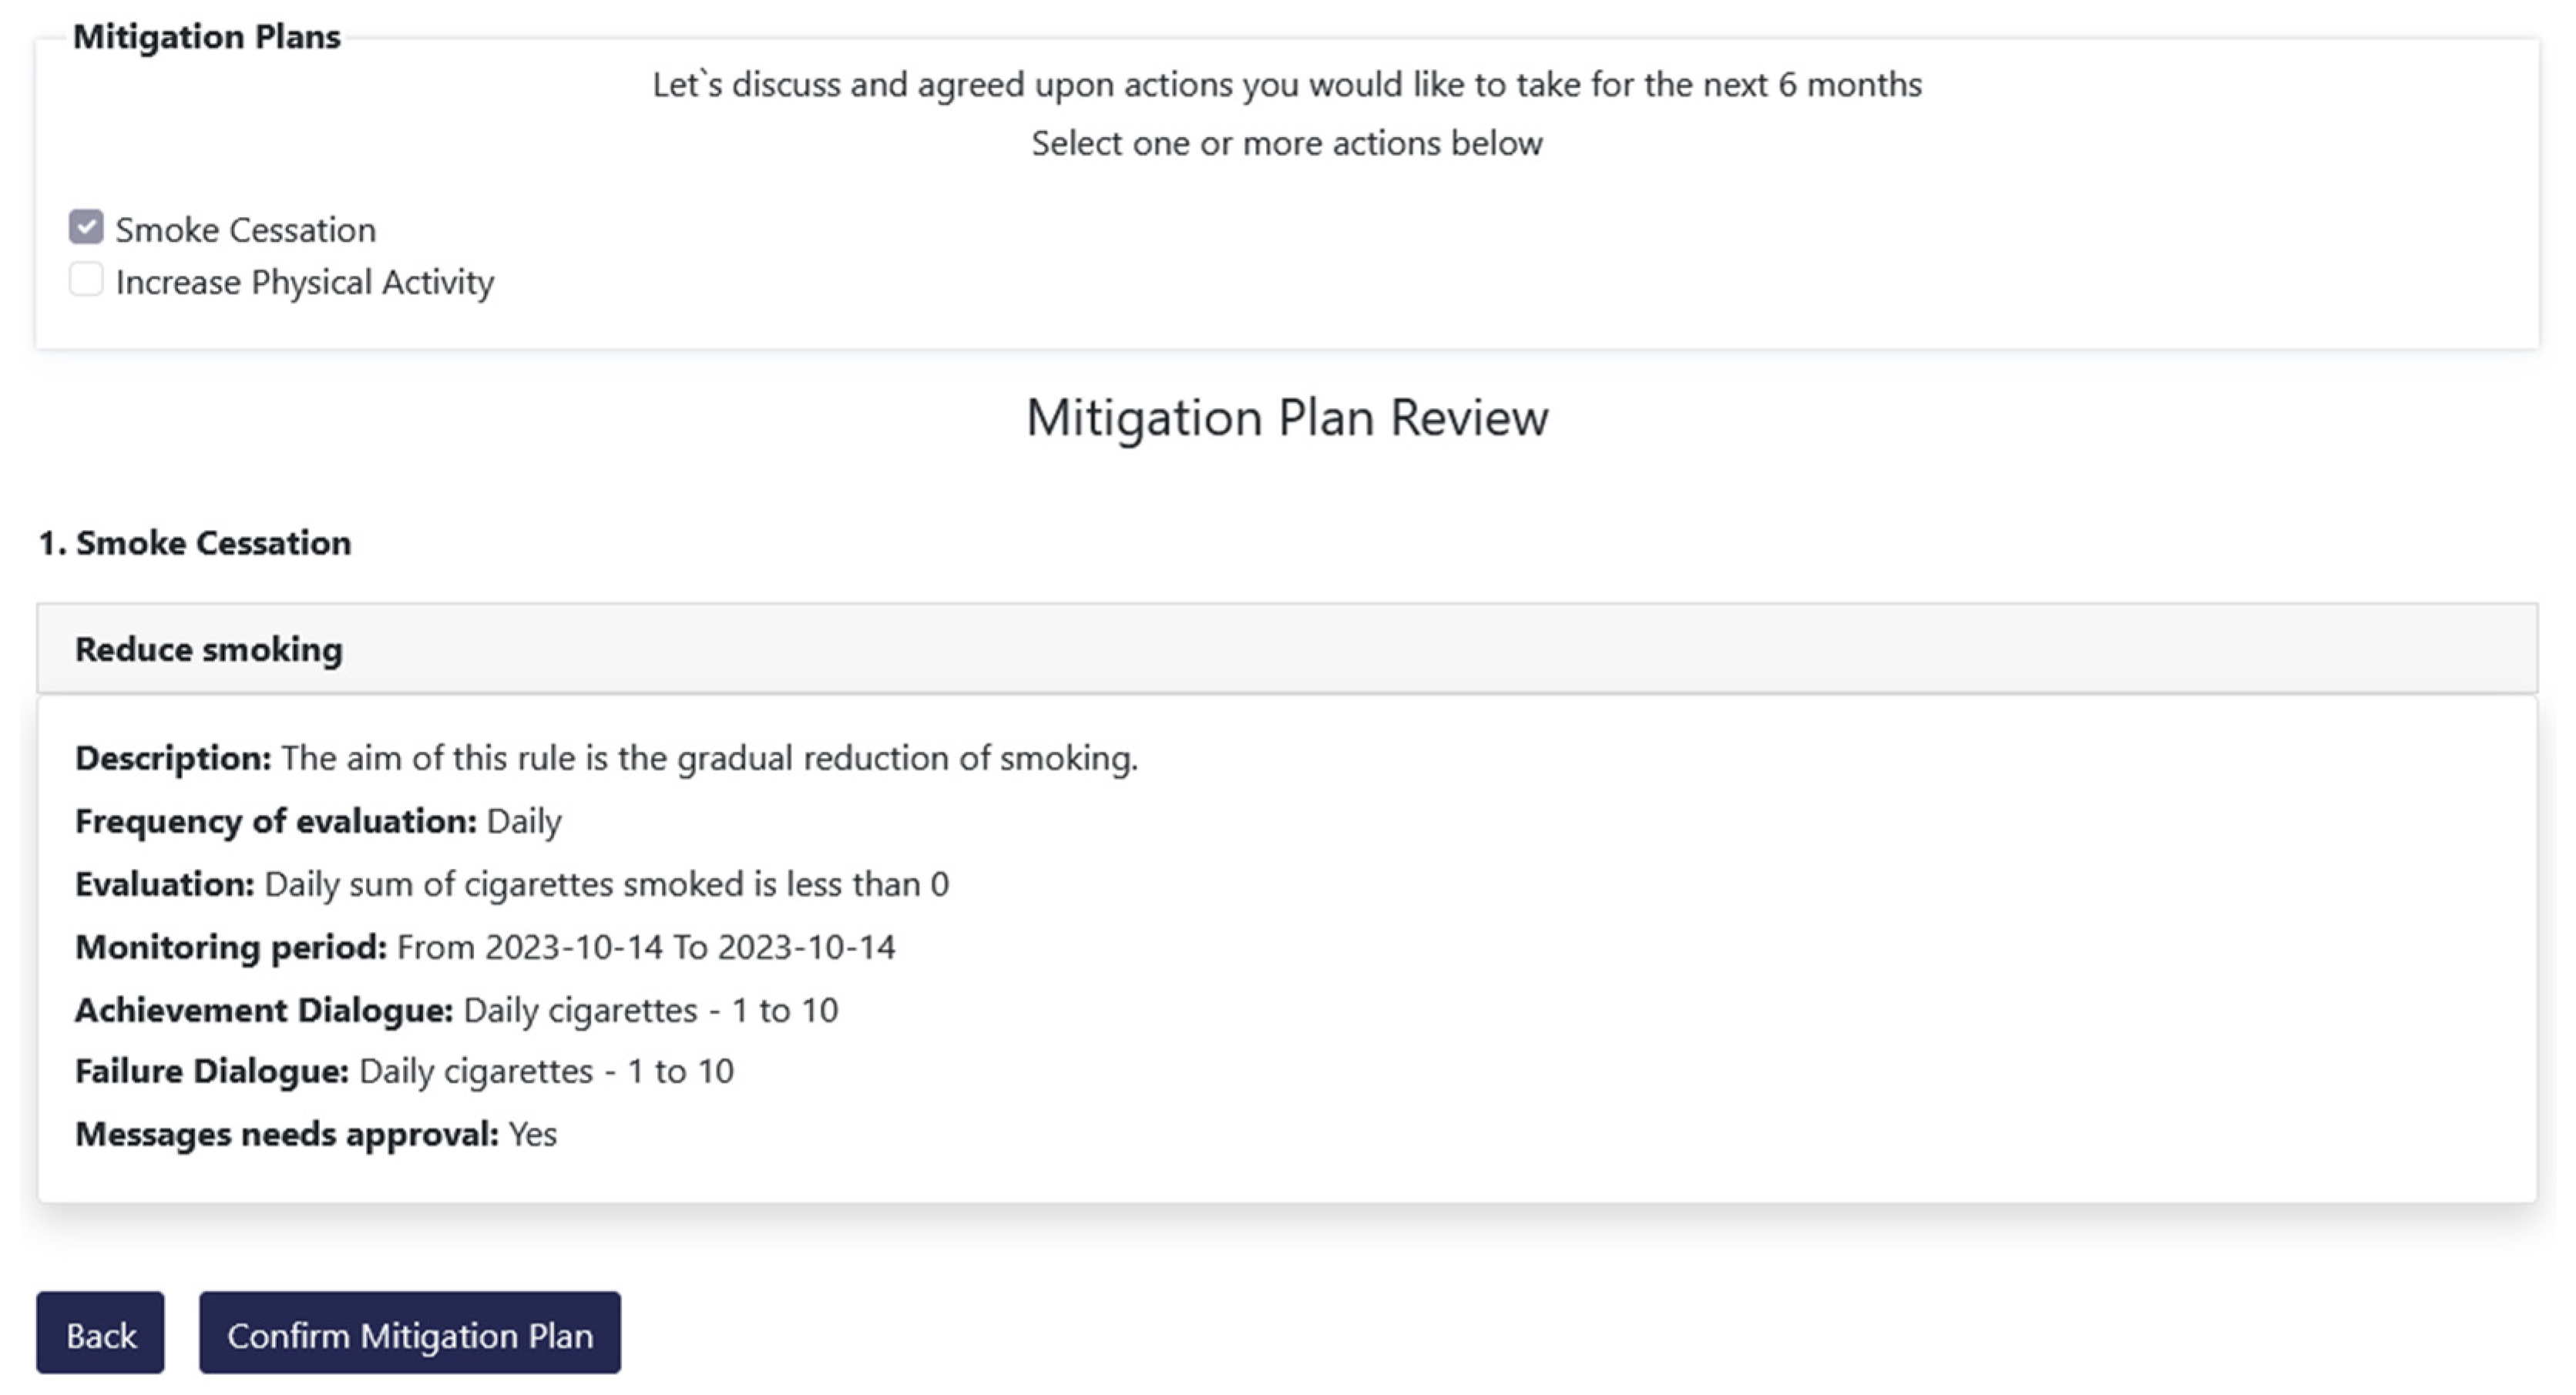
As mentioned in the previous subsections the overall functionality of the Decision Support System is further enhanced through the utilization and integration of the Monitoring and Alerting mechanism. It is used to set rules, get dialogues that fulfill them and actually accept them for delivery to the patients. More specifically, this mechanism exposes an advanced rule-based engine executed on certain configurable time intervals (daily, weekly, or monthly) that perform an assessment of the progress towards reaching individual targets. This functionality is implemented through the Risk Mitigation option that is available in the DSS, which results from the strong integration between the different mechanisms and systems of the iHelp platform. The Risk Mitigation interface provides to the HCP the ability to assign personalized mitigation plans to each patient. Each mitigation plan is comprised of user-specific rules which aim at providing the patient with a concrete goal and upon the achievement of that goal the user is expected to lead a healthier life. Such a goal can be the decrease of smoked cigarettes per day or the increase of weekly sports activity, as depicted in
Figure 22 and
Figure 23.
In its core functionality, the Monitoring and Alerting mechanism evaluates the platform’s integrated health data (i.e., primary, and secondary HHRs) and compares certain target values defined in the personalized recommendation against real values gathered from the users through the mobile application and wearables. The aggregation service collects secondary data for the respective patient, calculates them according to the monitoring period chosen for the respective user and preserve the resulting aggregated data into the database. Then, the evaluator assesses the aggregated values towards the goals set for each rule in the mitigation plans for this particular patient. Finally, the alerting module is activated to distribute evaluation and feedback messages. Different escalation policies and threshold values are considered when distributing the proper message to the recipient (individual or HCP) to achieve best results in risk communication in the context of pancreatic cancer.
The overall functionality of the Monitoring and Alerting mechanism is complemented by its integration with the Virtual Coach subcomponent via corresponding API endpoints. The achievement or failure dialogues initially selected by the HCP for pushing to the patient, as depicted in
Figure 22, are sent to Healthentia, to be delivered through the mobile application’s virtual coach [
38]. More specifically, messages are created by the alerting module and are approved by the HCP. These messages are sent as notifications to the user of the Healthentia application and once they are selected, then they are shown as a first step of a dialogue between the patient and the virtual coach. This interaction can result, depending of course in the user preferences, to requests for more information, further explanations, links to other coaching content, or to visualize data from a specific widget of the application. The resulting notification and dialogue playback are shown in
Figure 24.
As the last piece of the puzzle, the Impact Evaluator has the chance to envisage possible fine tuning in goals definition for the patient, and in the way in which different cluster of users could be more engaged. During the development and experimentation, several parameters were checked to generate significative clusters. In the specific case of the HDM pilot, with few numbers, the main goal was the evaluation of the approach and the configurability of the API. Currently three clustering variables were chosen: the sex, the age (grouped in ranges) and, if present the risk factor, associated to the person. On plausible synthetic data, as depicted in
Figure 25 the subcomponent highlighted that for the Topic1 (e.g., Smoking Cessation) a Cluster1 of people had a positive and healthy behavior after received some Prevention-based messages, but that was not the case for the Promotion-based messages. Completely the opposite behavior was observed in the Cluster2. The Cluster3, for the Topic1 was pretty unaffected. The percentage represented on the ordinate axis, is the delta percentage of the achieved goal between the period before and after receiving the messages.
4. Discussion
According to the architecture of the iHelp platform described in
Section 2 and the experimental results stated in
Section 3, the iHelp platform successfully achieved its main purpose of providing a data integration healthcare framework for exploiting non-homogeneous healthcare data. The utilization of advanced AI analytics and Monitoring and Decision Support techniques enhance the follow-up of the individuals and the provision of improved recommendations to them. The iHelp platform can have a significant impact on the modern digital care pathway, from preventive to follow-up phases. In that context, solutions from the areas of AI, data management, DSS, mobile and wearable health applications conforming with recognized standards are utilized in the iHelp platform. The integration of these advanced solutions results in enhanced and efficient identification of cancer related risks, diagnostics, and prevention strategies, allowing patients or people at risk to better take control of their health based on effective utilization of health-related data. In this way, iHelp platform enables (i) patients’ involvement and engagement in the healthcare process leading to better acceptance and perceptive outcomes (satisfaction, usefulness), and improved QoL; and (ii) personalized information and follow up based on improved trust and timely decision support. On top of that, it should be considered that the healthcare systems domain is constantly evolving, and to keep up with the changes, AI-based learning healthcare models are becoming more and more popular. The iHelp platform is aligned with and will contribute to EU’s strategies and actions, such as Europe's Beating Cancer Plan [
39], through the development and utilization of advanced integrated techniques targeting on a wide range of aspects, ranging from the implementation of causal risk factors analysis, early diagnosis and accurate personalized prediction of pancreatic cancer, to improved QoL through personalized recommendations, and the provision of evidence-based mitigation plans and lifestyle changes to the patients. Building this understanding is part of the EU’s ongoing effort to accelerate learning and innovation in cancer care delivery to ensure that people receive the highest quality, safest, and most up-to-date care.
Among its main advantages, the integrated solutions in the iHelp platform allow HCPs to synchronously monitor the progress of their patients and achieve better coordination of their care responsibilities. In summary, it gives HCPs a more effective approach to administer care through better planning, to better manage decisions and mitigation plans, and to better prepare for providing treatment and recommendations, and better manage the integrated and harmonized health data in the HHR format. In particular, the iHelp platform facilitates well-informed decision-making through the continuous and substantive flow of the health-related data. Through the integration of innovate data management and analytic techniques in the iHelp platform, healthcare professionals can have access to advanced knowledge related to each patient they are treating. The platform contributes to the shift from acute-based to evidence-based care by providing improved access to patient-related information. Through the utilization and improvement of existing evidence-based decision support solutions, the platform supports improved clinical decision making and enhances the health management of the patients care across the whole pathway. The utilization of patients’ integrated data, in the form of HHRs, leads to better identify and understand the key risk factors for developing pancreatic cancer, which are typically difficult to study only through primary data. Based on the availability of HHRs, the analysis and identification of the causal risk factors become easier and more effective, contributing to increased understanding of pancreatic cancer related risks, improved early diagnosis and the provision of enhanced personalized prevention and mitigation plans.
Among its indirect impacts, by effectively gathering data both from individuals' EHRs and PGHDs, as well as personal IoMT devices, collective community knowledge could be extracted, playing a significant dual goal: (i) fusing, collecting, and analyzing information from multiple sources to generate valuable knowledge and actionable insights to the HCPs, and (ii) facilitating the development of personalized and efficient prevention plans and decisions [
40]. The impact of such solutions using community knowledge, which is collective, in the domain of healthcare is apparent, since information sharing has changed their overall approach towards better diagnostics and improved QoL [
41].
The personalized dialogue and coaching system is another impactful innovation of iHelp platform. It breaks the communication barriers between healthcare providers and receives; and facilitates behavioral change in patients and citizens since by empowering them to understand their condition and providing easy to understand directions on how to manage their health. The rule-based dialogue selection system implemented in the Monitoring and Alerting mechanism effectively delivers education and advice on personalized levels, thus impacting everyday life activity of the patient or people at risk of developing cancer. Improved emphasis and understanding of the secondary data can eventually lead to improvements on the clinical condition of the patient, as is shown in the evaluation study (or HDM use-case) of the iHelp platform.
It is worth mentioning that the iHelp platform has been designed and implemented in such a way that it allows several cases of extensibility. The platform’s validation and evaluation is performed in five (5) different use cases and scenarios in the context of the iHelp project. At first, it allows for extensibility in terms of new datasets, since the functionalities of the Data Collection and Integration, and Standardization and Qualification building blocks enable new datasets to be directly ingested into the internal datastore by following a standard path, finally being represented in the platform as HHRs. Apart from this, the platform allows for extensibility in terms of new data sources, as demonstrated through the integration of Healthentia mobile application and wearable devices as new data sources from where data can be gathered and utilized for decision making. As soon as these new data sources are identified, the overall data ingestion flow can be followed as described in the abovementioned extensibility case.
The findings of this paper can be expanded in a variety of ways, for example the EDH subcomponent can be improved by the integration of SHAP (SHapley Additive exPlanations) techniques and a What-If analysis tool can be introduced in the platform that can help HCP in understanding how the models’ behavior varies when characteristics or portions of the data are altered. In our future plans, we aim to implement and improve the EDH component by the utilization of SHAP Explainability techniques that calculate Shapley values based on the coalition game theory and where the feature values of a data instance act as players in a coalition [42-43]. The Shapley values indicate how to fairly distribute the “payoff” and the final prediction among the different examined features. Moreover, a comparison tool for AI models will be also implemented to allow the HCPs to select and compare statistics, diagrams, and outcomes from two different models in an interpretable way. Finally, the Monitoring and Alerting mechanism will be improved by the integration of Incentive Marketing and Bounce Mitigation approaches to further motivate patients in improving their lifestyle choices and keep them engaged with the iHelp platform and mitigate the risk of quitting the platform and its accompanied mobile and web applications.
In this paper, only a specific use case and data from one hospital were examined verifying the functionalities of the platform, which could be considered a potential limitation. Towards this direction, concerning the future research and further updates on the platform, it is among the future plans to evaluate the platform with more use case scenarios and different types of data e.g., from other cancer types. Furthermore, we aim to disseminate the outcomes of the iHelp project, to receive valuable feedback on the platform and its usage scenarios, and to adapt the implemented components to the different needs of the healthcare stakeholders. The latter will facilitate the development of a holistic and multidisciplinary HTA approach considering multiple parameters and standardized metrics and KPIs. It will combine outcomes of Clinical Studies and Randomized Control Trials (RCTs) with Real World Evidence (RWE) from the different use cases and scenarios on which the platform will be utilized and evaluated in the context of the iHelp project [
20].
5. Conclusions
In the realm of healthcare, today's HCPs are presented with remarkable opportunities to gather and manage comprehensive digital health records, drawing from various sources, including individuals’ lifestyle behaviors and habits, EHRs, and medical data repositories. This variety of data pose the potentials to facilitate a shift towards data-driven healthcare practices and AI-driven healthcare analytics and decisions. The integration of AI in the healthcare decision making (e.g., monitoring, real-time decision support) phase is still evolving, with persistent challenges related to the trustworthiness, explainability, as well as development of improved prevention and intervention measures.
This paper has discussed these challenges and presented solutions that can advance the state of AI-based personalized decision support systems. The main contribution of the paper is the introduction of an integrated platform for health-related data processing, AI decision support and personalized monitoring and alerting. The platform has been designed and developed for use by the HCPs, enabling them to make efficient and reliable healthcare decisions by using AI-based analysis of integrated health data. The extensible and user-centric design of the platform ensures a harmonious blend of performance, interpretability, and wide adaptability, making it exploitable for critical decision-making situations in the healthcare domain. Moreover, this paper has introduced an approach to crafting AI-based healthcare recommendations in compliance with relevant regulations. The viability of this approach has been evaluated through heterogeneous healthcare datasets pertaining to individual monitoring and care planning. The suite of algorithms employed in the Monitoring and Alerting System and the Decision Support System (within the iHelp platform), represent a formidable toolkit for HCPs who are interested in utilizing advanced data-centric techniques and AI-based analytics in their healthcare management and decision-making processes.
Author Contributions
Conceptualization, G.M., K.K., S.K., O.P., U.W., and D.K.; methodology, G.M., A.D, S.K., M.P.M., F.M, P.S., and D.K.; software, P.K., F.M, A.P.; validation, G.M., O.P. and S.G.T.; formal analysis, A.A.A., E.K.; investigation, D.L., P.S.; resources, J.R.B.M., S.G.T.; data curation, G.M., P.K., A.P., S.S.; writing—original draft preparation, G.M., K.K., S.S.; writing—review and editing, D.L., U.W.; visualization, A.A.A., E.K., P.S.; supervision, D.K.; project administration, G.M., D.K.; funding acquisition, U.W, D.K.. All authors have read and agreed to the published version of the manuscript.
Funding
The research leading to the results presented in this paper has received funding from the European Union's funded Project iHELP under grant agreement no 101017441.
Institutional Review Board Statement
The study was conducted according to the guidelines of the Declaration of Helsinki and approved by the Research Ethics Committee of the MARINA SALUD SA (Ref: C.P. iHelp, C.I. 22/531-E; 03 October 2022).
Informed Consent Statement
Informed consent was obtained from all subjects involved in the study.
Data Availability Statement
Data sharing is not applicable to this article.
Acknowledgments
The research leading to the results presented in this paper has received funding from the European Union's funded Project iHELP under grant agreement no 101017441.
Conflicts of Interest
The authors declare no conflict of interest.
References
- Javed, A.R.; Shahzad, F.; ur Rehman, S.; Zikria, Y.B.; Razzak, I.; Jalil, Z.; Xu, G. Future smart cities: Requirements, emerging technologies, applications, challenges, and future aspects. Cities, 2022, 129, 103794. [CrossRef]
- Weaver, E.; O’Hagan, C.; Lamprou, D. A. The sustainability of emerging technologies for use in pharmaceutical manufacturing. Expert Opinion on Drug Delivery, 2022, 19(7), 861-872. [CrossRef]
- Junaid, S.B.; Imam, A.A.; Balogun, A.O.; De Silva, L.C.; Surakat, Y.A.; Kumar, G.; Abdulkarim, M.; Shuaibu, A.N.; Garba, A.; Sahalu, Y.; Mohammed, A. Recent advancements in emerging technologies for healthcare management systems: A survey. In Healthcare, 2022, 10(10), p. 1940. MDPI. [CrossRef]
- 4 Emerging technologies you need to know about. (n.d.). Gartner. Available online: https://www.gartner.com/en/articles/4-emerging-technologies-you-need-to-know-about (accessed on 30 September 2023).
- Division, C. S. a. S. (2023). 2023 emerging technologies and scientific innovations: a global public health perspective — preview of horizon scan results. www.who.int. Available online: https://www.who.int/publications/i/item/WHO-SCI-RFH-2023.05 (accessed on 21 September 2023).
- Market.Us. (2023, March 13). Wearable Technology Market Worth Over USD 231 Billion by 2032, At CAGR 14.60%. GlobeNewswire News Room. Available online: https://www.globenewswire.com/en/news-release/2023/03/13/2626170/0/en/Wearable-Technology-Market-Worth-Over-USD-231-Billion-by-2032-At-CAGR-14-60.html#:~:text=It%20is%20projected%20to%20grow,CAGR%2C%20between%202023%20to%202032 (accessed on 21 September 2023).
- Karatas, M.; Eriskin, L.; Deveci, M.; Pamucar, D.; Garg, H. Big Data for Healthcare Industry 4.0: Applications, challenges and future perspectives. Expert Systems with Applications, 2022, 200, p.116912. [CrossRef]
- Mitchell, M.; Kan, L. Digital technology and the future of health systems. Health Systems & Reform, 2019, 5(2), pp.113-120. [CrossRef]
- Mlakar, I.; Šafran, V.; Hari, D.; Rojc, M.; Alankuş, G.; Pérez Luna, R.; Ariöz, U. Multilingual conversational systems to drive the collection of patient-reported outcomes and integration into clinical workflows. Symmetry, 2021, 13(7), p.1187. [CrossRef]
- Dash, S.; Shakyawar, S.K.; Sharma, M.; Kaushik, S. Big data in healthcare: management, analysis and future prospects. Journal of big data, 2019, 6(1), 1-25. [CrossRef]
- Mavrogiorgou, A.; Kiourtis, A.; Manias, G.; Symvoulidis, C.; Kyriazis, D. Batch and Streaming Data Ingestion towards Creating Holistic Health Records. Emerging Science Journal, 2023, 7(2), pp.339-353. [CrossRef]
- Rajabion, L.; Shaltooki, A.A., Taghikhah, M.; Ghasemi, A.; Badfar, A. Healthcare big data processing mechanisms: The role of cloud computing. International Journal of Information Management, 2019, 49, 271-289. [CrossRef]
- Razdan, S.; Sharma, S. Internet of medical things (IoMT): Overview, emerging technologies, and case studies. IETE technical review, 2022, 39(4), pp.775-788. [CrossRef]
- Jaleel, A.; Mahmood, T.; Hassan, M.A.; Bano, G.; Khurshid, S.K. Towards medical data interoperability through collaboration of healthcare devices. IEEE Access, 2020, 8, 132302-132319. [CrossRef]
- Rezayi, S.; Mohammadzadeh, N.; Bouraghi, H.; Saeedi, S.; Mohammadpour, A. Timely diagnosis of acute lymphoblastic leukemia using artificial intelligence-oriented deep learning methods. Computational Intelligence and Neuroscience, 2021. [CrossRef]
- KE, T.M.; Lophatananon, A.; Muir, K.; Nieroda, M.; Manias, G.; Kyriazis, D.; Wajid, U.; Tomson, T. Risk Factors of Pancreatic Cancer: A Literature Review. Cancer Reports and Reviews, 2022. [CrossRef]
- Crosby, D.; Bhatia, S.; Brindle, K.M.; Coussens, L.M.; Dive, C.; Emberton, M.; Esener, S.; Fitzgerald, R.C.; Gambhir, S.S.; Kuhn, P.; Rebbeck, T.R. Early detection of cancer. Science, 2022, 375(6586), p.eaay9040. [CrossRef]
- Johnson, K.B.; Wei, W.Q.; Weeraratne, D.; Frisse, M.E.; Misulis, K.; Rhee, K.; Zhao, J.; Snowdon, J.L. Precision medicine, AI, and the future of personalized health care. Clinical and translational science, 2021, 14(1), pp.86-93. [CrossRef]
- Qureshi, T.A.; Javed, S.; Sarmadi, T.; Pandol, S.J.; Li, D. Artificial intelligence and imaging for risk prediction of pancreatic cancer. Chinese clinical oncology, 2022, 11(1), 1. [CrossRef]
- Manias, G.; Den Akker, H.O.; Azqueta, A.; Burgos, D.; Capocchiano, N.D.; Crespo, B.L.; Dalianis, A.; Damiani, A.; Filipov, K.; Giotis, G.; Kalogerini, M.; et al. iHELP: Personalised Health Monitoring and Decision Support Based on Artificial Intelligence and Holistic Health Records. In 2021 IEEE Symposium on Computers and Communications (ISCC), (September 2021). IEEE. [CrossRef]
- Thein, K.M.M. Apache kafka: Next generation distributed messaging system. International Journal of Scientific Engineering and Technology Research, 2014, 3(47), 9478-9483.
- Luksa, M. Kubernetes in action. Simon and Schuster, 2017.
- Smuck, M.; Odonkor, C.A.; Wilt, J. K.; Schmidt, N.; Swiernik, M.A. The emerging clinical role of wearables: factors for successful implementation in healthcare. NPJ digital medicine, 2021, 4(1), 45. [CrossRef]
- El Khatib, M.; Hamidi, S.; Al Ameeri, I.; Al Zaabi, H.; Al Marqab, R. Digital disruption and big data in healthcare-opportunities and challenges. ClinicoEconomics and Outcomes Research, 2022, pp.563-574. [CrossRef]
- Pnevmatikakis, A.; Kanavos, S.; Matikas, G.; Kostopoulou, K.; Cesario, A.; Kyriazakos, S. Risk assessment for personalized health insurance based on real-world data. Risks, 2021, 9(3), p.46. [CrossRef]
- Bender, D.; Sartipi, K. HL7 FHIR: An Agile and RESTful approach to healthcare information exchange. In Proceedings of the 26th IEEE international symposium on computer-based medical systems (June 2013). [CrossRef]
- Chang, E.; Mostafa, J.; The use of SNOMED CT, 2013-2020: a literature review. Journal of the American Medical Informatics Association, 2021, 28(9), 2017-2026. [CrossRef]
- Feldman, K.; Johnson, R.A.; Chawla, N.V.; The state of data in healthcare: path towards standardization. Journal of Healthcare Informatics Research, 2018, 2, 248-271. [CrossRef]
- Manias, G.; Azqueta-Alzúaz, A.; Damiani, A.; Dhar, E.; Kouremenou, E.; Patino-Martínez, M.; Savino, M.; Shabbir, S.A.; Kyriazis, D. An Enhanced Standardization and Qualification Mechanism for Heterogeneous Healthcare Data. Caring is Sharing–Exploiting the Value in Data for Health and Innovation, 2023, p.153. [CrossRef]
- Sanchez, Y.K.R.; Demurjian, S.A.; Baihan, M.S. A service-based RBAC & MAC approach incorporated into the FHIR standard. Digital Communications and Networks, 2019, 5(4), 214-225. [CrossRef]
- Beinema, T.; op den Akker, H.; Hofs, D.; van Schooten, B. The WOOL Dialogue Platform: Enabling Interdisciplinary User-Friendly Development of Dialogue for Conversational Agents. Open Research Europe, 2022, 2, 7. [CrossRef]
- Ahmadi, N.; Peng, Y.; Wolfien, M.; Zoch, M.; Sedlmayr, M. OMOP CDM can facilitate Data-Driven studies for cancer prediction: A systematic review. International Journal of Molecular Sciences, 2022, 23(19), 11834. [CrossRef]
- Sharma, R.; Atyab, M.; Sharma, R.; Atyab, M. Schema Registry. Cloud-Native Microservices with Apache Pulsar: Build Distributed Messaging Microservices, 2022, pp.81-101.
- Lamy, J.B.; Venot, A.; Duclos, C. PyMedTermino: an open-source generic API for advanced terminology services. In Digital Healthcare Empowering Europeans, 2015, pp. 924-928. IOS Press.
- Chanda, A.K.; Bai, T.; Yang, Z.; Vucetic, S. Improving medical term embeddings using UMLS Metathesaurus. BMC Medical Informatics and Decision Making, 2022, 22(1), 114. [CrossRef]
- Vreeman, D.J.; McDonald, C.J.; Huff, S.M. LOINC®: a universal catalogue of individual clinical observations and uniform representation of enumerated collections. International journal of functional informatics and personalised medicine, 2010, 3(4), 273-291. [CrossRef]
- Hirsch, J.A.; Nicola, G.; McGinty, G.; Liu, R.W.; Barr, R.M.; Chittle, M.D.; Manchikanti, L. ICD-10: history and context. American Journal of Neuroradiology, 2016, 37(4), 596-599. [CrossRef]
- op den Akker, H.; Cabrita, M.; Pnevmatikakis, A. Digital Therapeutics: Virtual Coaching Powered by Artificial Intelligence on Real-World Data. Frontiers in Computer Science, 2021, 3, p.750428. [CrossRef]
- Lawler, M.; Davies, L.; Oberst, S.; Oliver, K.; Eggermont, A.; Schmutz, A.; La Vecchia, C.; Allemani, C.; Lievens, Y.; Naredi, P.; Cufer, T. European Groundshot—addressing Europe's cancer research challenges: a Lancet Oncology Commission. The Lancet Oncology, 2023, 24(1), pp. e11-e56. [CrossRef]
- Dal Mas, F.; Biancuzzi, H.; Massaro, M.; Miceli, L. Adopting a knowledge translation approach in healthcare co-production. A case study. Management Decision, 2020, 58(9), 1841-1862. [CrossRef]
- Nekhlyudov, L.; Mollica, M.A.; Jacobsen, P.B.; Mayer, D.K.; Shulman, L.N.; Geiger, A.M. Developing a quality of cancer survivorship care framework: implications for clinical care, research, and policy. JNCI: Journal of the National Cancer Institute, 2019, 111(11), 1120-1130. IEEE. [CrossRef]
- Marcílio, W.E.; Eler, D.M. From explanations to feature selection: assessing SHAP values as feature selection mechanism. In 2020 33rd SIBGRAPI conference on Graphics, Patterns and Images (SIBGRAPI) (November 2020).
- Moncada-Torres, A.; van Maaren, M.C.; Hendriks, M.P.; Siesling, S.; Geleijnse, G. Explainable machine learning can outperform Cox regression predictions and provide insights in breast cancer survival. Scientific reports, 2021, 11(1), 6968. [CrossRef]
Figure 1.
Overall Architecture.
Figure 1.
Overall Architecture.
Figure 2.
Data Ingestion Pipeline.
Figure 2.
Data Ingestion Pipeline.
Figure 3.
Data Capture Gateway Overview.
Figure 3.
Data Capture Gateway Overview.
Figure 4.
Setting up an iHELP study in Healthentia. Widgets are selected (left) and the nutrition widget is customized to include the food categories of interest (middle), resulting to the main dashboard of the mobile app (right). .
Figure 4.
Setting up an iHELP study in Healthentia. Widgets are selected (left) and the nutrition widget is customized to include the food categories of interest (middle), resulting to the main dashboard of the mobile app (right). .
Figure 5.
Interaction of Different Users with the DSS.
Figure 5.
Interaction of Different Users with the DSS.
Figure 6.
Ingest and evaluation loop.
Figure 6.
Ingest and evaluation loop.
Figure 7.
A sample of the Measurement Dataset.
Figure 7.
A sample of the Measurement Dataset.
Figure 8.
Messages interexchanged between the components of the Data Ingestion pipeline: (a) Message including primary data; (b) Message including secondary data.
Figure 8.
Messages interexchanged between the components of the Data Ingestion pipeline: (a) Message including primary data; (b) Message including secondary data.
Figure 9.
Using questionnaires in the HDM study. (a) List of defined questionnaires at the Healthentia portal; and (b) answering the Fagerstrom questionnaire by a patient in the mobile app.
Figure 9.
Using questionnaires in the HDM study. (a) List of defined questionnaires at the Healthentia portal; and (b) answering the Fagerstrom questionnaire by a patient in the mobile app.
Figure 10.
Entering and visualizing data in the Healthentia mobile app.
Figure 10.
Entering and visualizing data in the Healthentia mobile app.
Figure 11.
Sample transformation of raw primary data to the HHR format via the the iHELP mappers, where: (a) Represents the raw primary data as they collected by the hospital; (b) & (c) Depict the transformed to HHR format data.
Figure 11.
Sample transformation of raw primary data to the HHR format via the the iHELP mappers, where: (a) Represents the raw primary data as they collected by the hospital; (b) & (c) Depict the transformed to HHR format data.
Figure 12.
Sample transformation of secondary data to HHR format. Sample transformation of raw secondary data to the HHR format via the the iHELP mappers, where: (a) Represents the raw secondary data related to the daily activity and as they collected by the individual wearable device; (b) & (c) Depicts the transformed to HHR format daily activity data of the individual mapped to an Observation resource type.
Figure 13.
Classification of patients as per the model trained without considering comorbidities.
Figure 13.
Classification of patients as per the model trained without considering comorbidities.
Figure 14.
Classification of patients as per the model trained without considering comorbidities.
Figure 14.
Classification of patients as per the model trained without considering comorbidities.
Figure 15.
HCP Decision Support System main menu interface.
Figure 15.
HCP Decision Support System main menu interface.
Figure 16.
Patient Visualisation DSS interface.
Figure 16.
Patient Visualisation DSS interface.
Figure 17.
Primary data – DSS Patient Visualisation interface.
Figure 17.
Primary data – DSS Patient Visualisation interface.
Figure 18.
Secondary data – DSS Patient Visualisation interface.
Figure 18.
Secondary data – DSS Patient Visualisation interface.
Figure 19.
Risk Identification - DSS Patient Visualisation interface.
Figure 19.
Risk Identification - DSS Patient Visualisation interface.
Figure 20.
Cluster Heatmap considering feature importance per cluster.
Figure 20.
Cluster Heatmap considering feature importance per cluster.
Figure 21.
Personalized Recommendation Review - DSS Patient visualisation interface.
Figure 21.
Personalized Recommendation Review - DSS Patient visualisation interface.
Figure 22.
Establishment of a Risk Mitigation Plan by the HCP.
Figure 22.
Establishment of a Risk Mitigation Plan by the HCP.
Figure 23.
Risk Mitigation Plan Overview.
Figure 23.
Risk Mitigation Plan Overview.
Figure 24.
Handling dialogues at the Healthentia mobile app. A notification is sent to the patient (left), which leads to the dialogue playback user interface.
Figure 24.
Handling dialogues at the Healthentia mobile app. A notification is sent to the patient (left), which leads to the dialogue playback user interface.
Figure 25.
Clustering and Results. (a) Depicts the user journey and clustering approach of the Impact Evaluator; (b) Showcases an initial example of the final outcome.
Figure 25.
Clustering and Results. (a) Depicts the user journey and clustering approach of the Impact Evaluator; (b) Showcases an initial example of the final outcome.
Table 1.
HDM Datasets Description.
Table 1.
HDM Datasets Description.
| Dataset Name |
No of Records |
No of Attributes |
|
Dataset Size (in MB) |
Dataset Type |
| Measurements |
3.252.920 |
17 |
|
564,1 |
CSV |
| Observations |
339.925 |
14 |
|
55,4 |
CSV |
| Person |
99.019 |
8 |
|
2,8 |
CSV |
| Drug Exposure |
5.411.914 |
13 |
|
779,9 |
CSV |
| Condition |
1.833.512 |
14 |
|
248,5 |
CSV |
| Visit Occurrence |
5.205.819 |
13 |
|
727,5 |
CSV |
| Procedure |
602.351 |
12 |
|
147,5 |
CSV |
Table 2.
Models Comparison and Average Performance Metrics.
Table 2.
Models Comparison and Average Performance Metrics.
| Models |
Silhouette coefficient |
Adjust Rand Index (ARI) |
|
Sensitivity (True Positive Rate) |
Specificity (True Negative Rate) |
| Models without considering comorbidities |
0,49 |
0,01 |
|
65-70% |
30-35% |
| Models considering comorbidities |
0,325 |
0,475 |
|
80-85% |
15-20% |
|
Disclaimer/Publisher’s Note: The statements, opinions and data contained in all publications are solely those of the individual author(s) and contributor(s) and not of MDPI and/or the editor(s). MDPI and/or the editor(s) disclaim responsibility for any injury to people or property resulting from any ideas, methods, instructions or products referred to in the content. |
© 2023 by the authors. Licensee MDPI, Basel, Switzerland. This article is an open access article distributed under the terms and conditions of the Creative Commons Attribution (CC BY) license (http://creativecommons.org/licenses/by/4.0/).
