1. Introduction
Nanoparticles are widespread materials used in many applications. More specifically, [
1,
2,
3,
4] present the usage of nanoparticles in medicine and bioanalysis, and particularly in magnetic resonance imaging, magnetic separation, magnetic drug targeting, magnetic hyperthermia, magnetofection, and other applications. In [
5], nanoparticle applications in environment, electronics, energy harvesting, drugs, and various other fields are discussed. In [
6], recent nanomaterial applications, like the fluorescent biological labels, the drug and gene delivery, the bio detection of pathogens, the detection of proteins, the probing of DNA structure, the tissue engineering and the phagokinetic studies, are summarized. In [
7,
8,
9], the nanoparticles in the process of the catalysis are studied. Although, as the nanoparticles are very promising in many applications the early diagnosis of their condition, it is a vital need, in order to the uninterrupted execution of the process where they serve. Supported ferromagnetic NPs (Fe, Ni, Co) are particularly crucial in catalyzing processes that support the development and convenience of our society. Common examples include the production of ammonia for fertilizers that ensures the nutrition of a continuously expanding population, the production of H2, a crucial future energy carrier but also an important reactant, the decomposition of pollutants from mobile and static sources, and the synthesis of fuel. The primary global problem of our time is the transition to sustainable non-fossil fuels and chemical production, which will help to offset (or, preferably, reverse) the harmful effects of human activity on the climate. Hence, it is necessary to discover more effective methods, quicker decarbonization, and all the aforementioned to progress at non-linear rates, thereby advancing knowledge and technology. Consequently, the industry needs techniques able to provide accurate and cost-effective direct characterization of the catalyst phase at any moment. This real-time knowledge of the catalyst phase will lead to on-time fault diagnosis, as the catalyst loses its magnetic properties partially or totally.
In the international literature many techniques have been proposed for nanoparticle characterization and material protection. More specifically, in [
10], Mössbauer spectra of magnetite samples are investigated in order to be protected by oxidation, using special shells combosed of sillanes and other materials. In [
11], Fe3O4 nanoparticles are investigated and their adsorption capacity is studied. In [
12], both the dynamic and electrokinetic light scattering methods are used to characterize Fe3O4 nanoparticles. In [
2,
3,
4,
5], methods, such as the Transmission Electron Microscopy (TEM), the Scanning Electron Microscopy (SEM) and the Atomic Force Microscopy (AFM), that use microscopic techniques are applied. The main drawbacks of the methods that uses microscopes are that are expensive methods, the sample preparation is time consuming and can give exclusively local information. Other commonly used methods are the Rutherford Backscattering Spectrometry, the X Ray Diffraction, the Atomic Absorption Spectroscopy method, the Dynamic Light Scattering (DLS), the Photon Correlation Spectroscopy (PCS) and the Photon Cross Correlation Spectroscopy (PCCS). The last three methods are characterized by the fact that they cannot be used for opaque media and cannot provide information about the dimensions of the core and the anisotropy constant. In addition, various other magnetic characterization methods exist, like the Superconducting Quantum Interference Device (SQUID) magnetometry [
3], the Vibrating Sample Magnetometer (VSM) analysis [
6,
7], the characterization methods using optically pumped magnetometers [
8], faraday rotation magnetometers [
13] or hall effect magnetometers [
14], the analysis utilizing giant magnetoresistive sensors [
15,
16], the fluxgate magnetorelaxometry [
2,
3,
17,
18,
19], etc. The method based on SQUIDs has the main disadvantages (i) of not being capable to measure the magnetic field’s absolute value, but only its variation, (ii) of being quite susceptible to magnetic disturbances, (iii) the need for cooling, insulation and heavy magnetic shielding, and (iv) they present high dead time zone [
3,
19]. Referring to VSM devices, they are expensive, heavy, with a complicated structure [
6,
20], while the optically pumped magnetometers do not have the ability to provide quick characterization [
21]. Moreover, the faraday rotation based instruments, the hall effect magnetometers and the giant magnetoresistive sensors present high noise during measurement procedure and they cannot measure very low magnetic fields (in the order of nanotesla) [
14,
15,
22]. Among the different types of magnetic sensors, one of the most promising, and with the most advantages, instruments are the fluxgate magnetometers. These sensors have low noise, can utilized in room temperatures, provide characterization with great accuracy, they do not need magnetic shielding or cooling and they are compact and simple constructions [
2,
3,
17,
18,
19]. For all aforementioned reasons, the proposed measurement system, in this article, is based in fluxgate magnetometers.
This article is a feasibility study for a novel magnetic field measurement set up in order to characterize catalytic materials. Its main goal is to explore whether a versatile, low cost and portable characterization technique for working catalysts can be developed. The future goal is to provide in the industry a tool that give the opportunity for in situ magnetic measurements, capable to continuously image the catalyst phase and the propability of catalyst deactivation, avoiding troubles in the production. Thus in the present study, the influences (i) of the nanoparticle number and (ii) of the nearest neighbor distance between nanoparticles are studied. The investigation is performed for materials with either fcc or hcp crystal structures and the corresponding hysteresis loops are exported using the FEM, as the chosen simulation method. These simulated results are then compared to the experimental ones obtained by the application of the fluxgate measurement method.
Authors in previous work had identified the possibility to detect catalyst state and phase by capturing real time its magnetic signature. The novel points in this article are two: At first authors, in this work, aim to point the parameters which have effect on the nanomaterials, providing to chemical engineers details about the structure of the catalysts and thus information related to the production procedure. At second, this article proposes a both spatial and temporal resolution of the magnetic phase of the catalyst, fact very important for the field of chemical reactions. For the above reasons authors believe that this study is useful for chemical engineering scientific community and industry.
2. Materials and Methods
The investigated samples are Co nanoparticles with different crystal anisotropy. More specifically, authors examined one sample (labelled Material 1) with fcc structure and a second sample (labelled Material 2) with hcp structure.
2.1. Simulation Method
Initially, the two Co samples are modelled and meshed using the Gid tool (CAD Software), and then the FEM is applied using the Magpar software [
23,
24]. The FEM is selected because it is one of the more accurate methods for simulating electromagnetic problems, providing detailed results very close to the real conditions, compared to other simulation methods that miss accuracy. Magpar [
24] is a micromagnetic simulation package, which enables the Finite Element Analysis (FEA). As the Magpar contains only some typical simple geometries, if a new geometry should be created, it can be done using another CAD software and mesh generator (like GiD) and by importing from Gid to Magpar the corresponding UCD file. This way, the user can simulate the desired geometry and in order to use FEM, take into account the anisotropy of the material. The two different crystal structures are inserted in the Magpar software, by means of a .KRN file, in which the necessary parameters are set. Specifically, the magneto-crystalline anisotropy constant is considered equal to K = 2.7 x 10
5 J/m
3 and 4.5 x 10
5 J/m
3, for the Material 1 and 2 respectively [
25,
26]. Moreover, in the same file, the saturation magnetization, M
S, is defined equal to 168 emu/gr for the first material and equal to 150 emu/gr for the second material. Finally in both cases the value of the exchange constant does not change, is equal to A = 1.3 x 10
-11 J/m [
25,
26].
2.2. Experimental Method
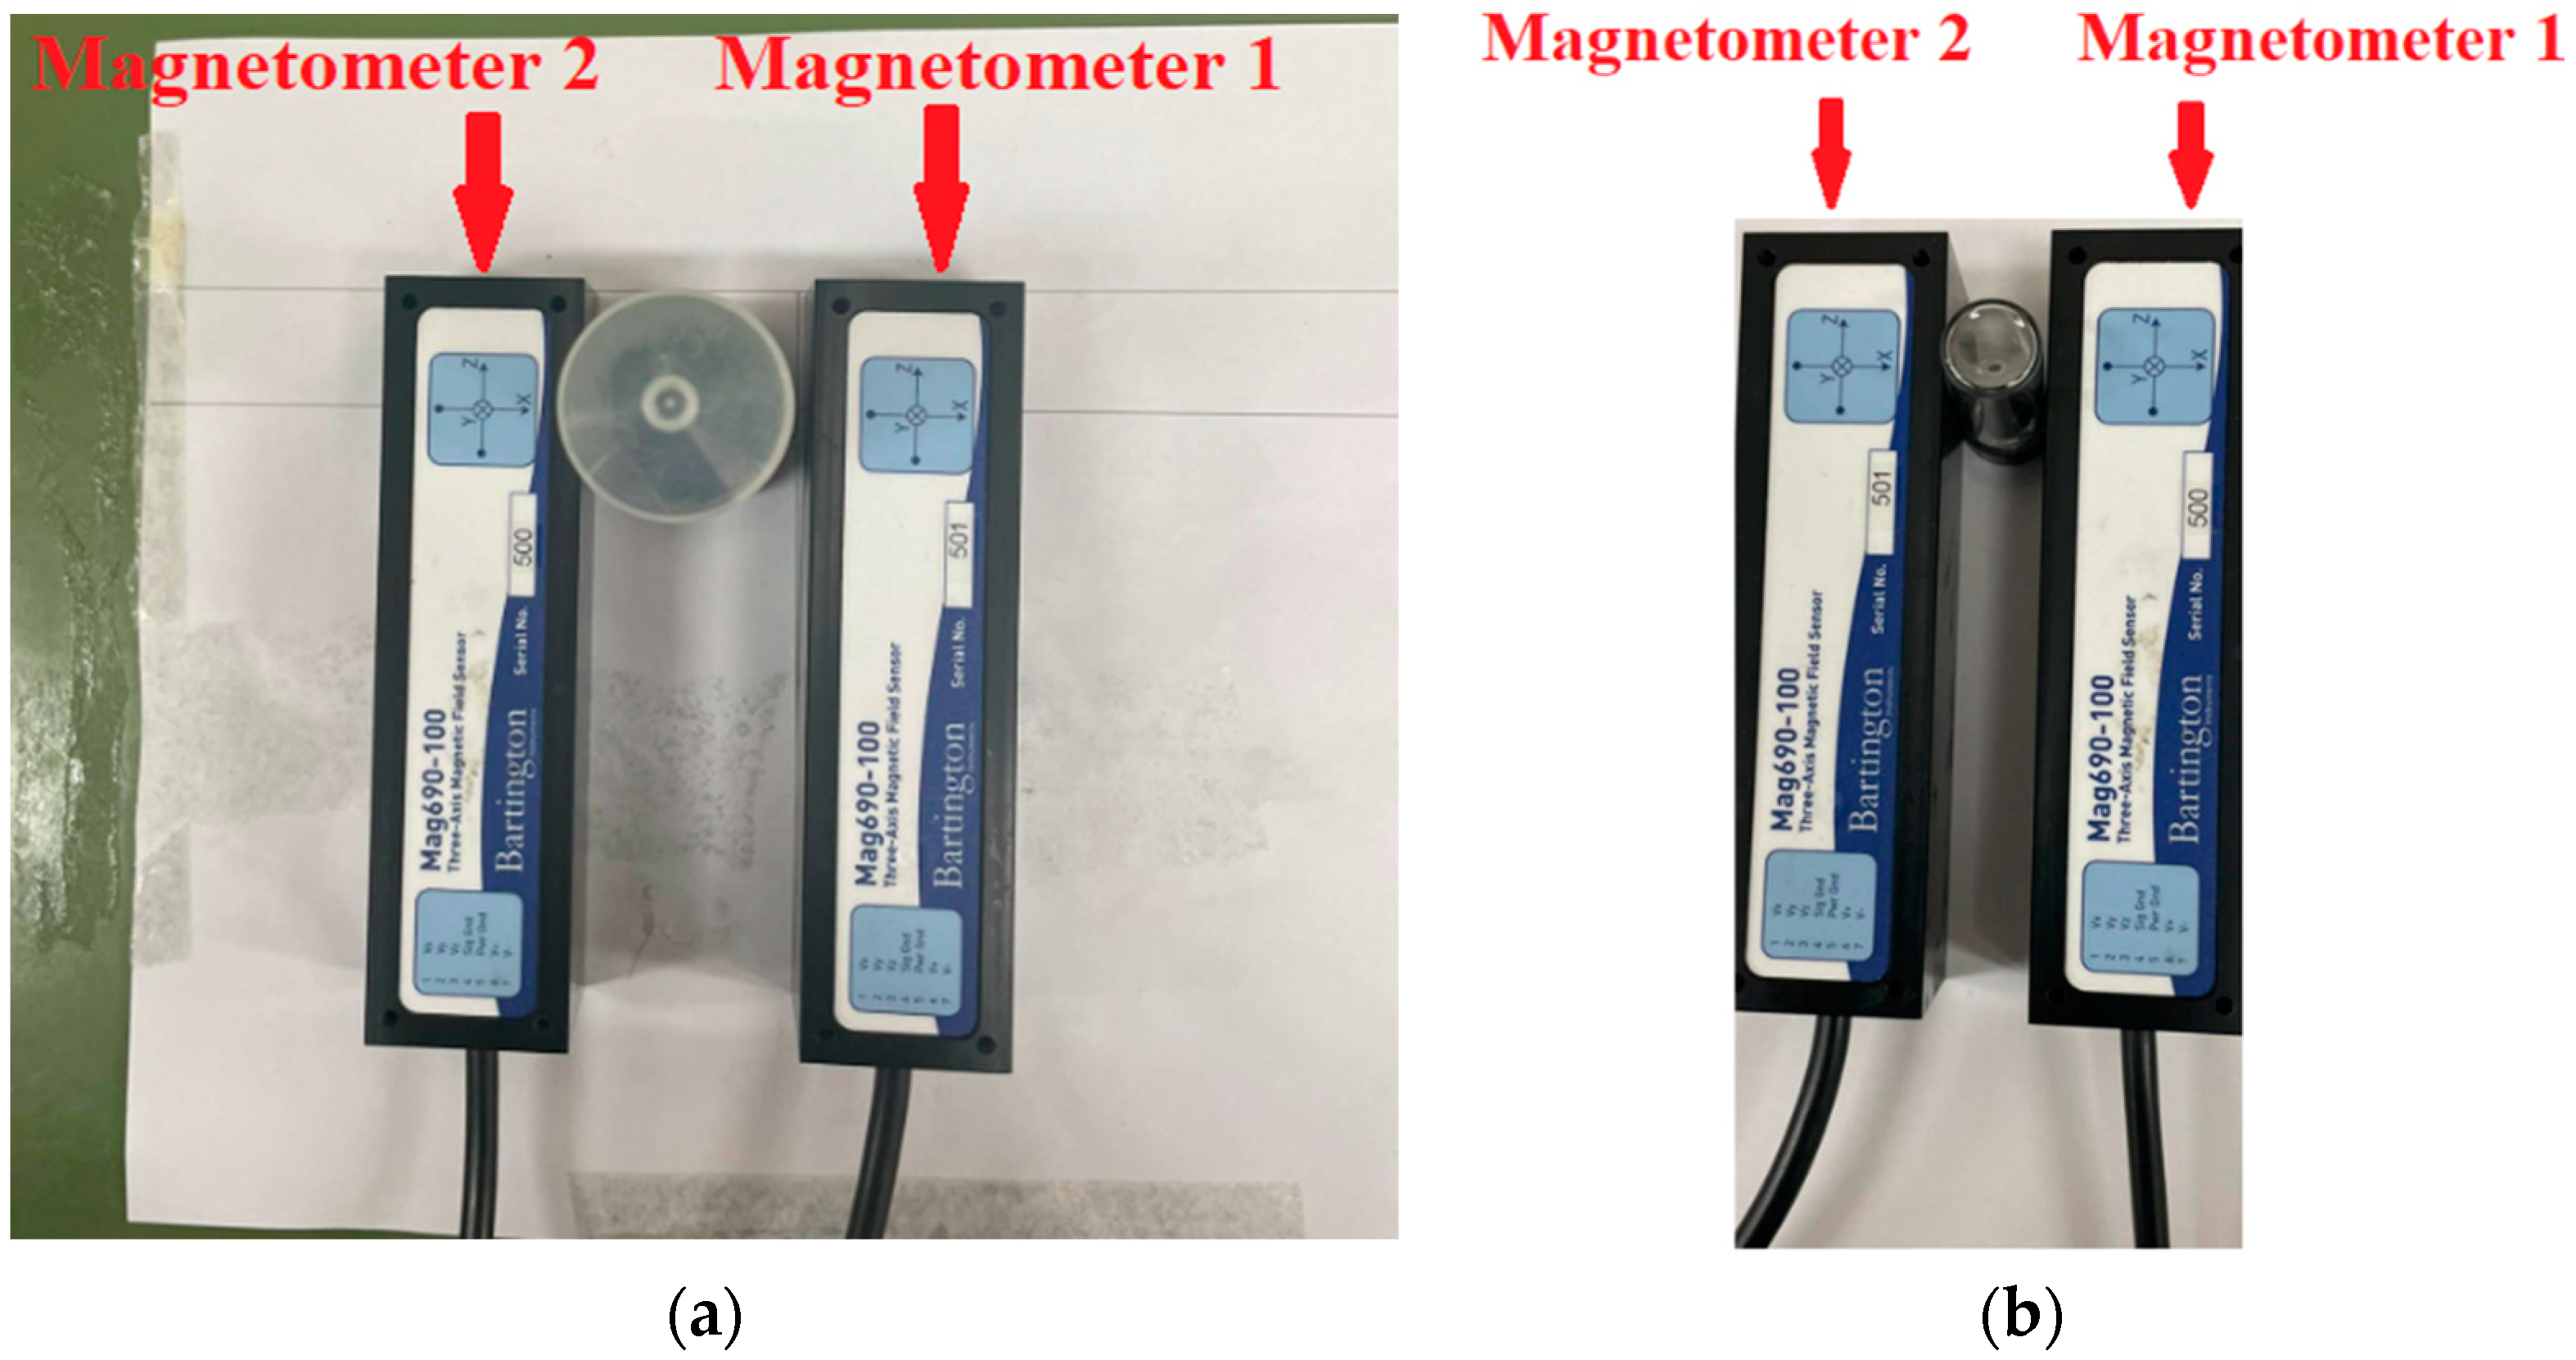
Regarding the experimental procedure, it is based on a fluxgate magnetometer set-up [
3,
18,
19] as depicted in
Figure 1. More specifically,
Figure 1a and Figure 1b show the real set-up in the laboratory for the measurement of the Material 1 and 2, respectively. In order to acquire the magnetization, when the Earth field is enforced in the materials, two measurement sets are conducted. In the first measurement set, only the Earth’s magnetic field is quantified (sample absent), while in the second set the magnetic field is measured in the presence of the catalyst. Then the magnetic field values obtained from the first measurement set, are subtracted from the magnetic field values exported from the second measurement set. This magnetic field result is inserted in a Differential Evolution algorithm (DE), along with the distance of the measurement point (location of the magnetometer) and the material (sample location). The DE algorithm finally yields the magnetization of the materials in the presence of the terrestrial magnetic field.
Figure 1.
The magnetometers with the vial of
(a) Material 1 and
(b) Material 2 in the laboratory [
3].
Figure 1.
The magnetometers with the vial of
(a) Material 1 and
(b) Material 2 in the laboratory [
3].
In the experimental set-up, a pair of Bartington Mag690-1000 triaxial fluxgate magnetometers is used. They are placed along the x-axis symmetrically to the sample, hence their measurements expected to be identical within normal measurement variations. Consequently, Magnetometer 1 can validate the findings of Magnetometer 2. Each Mag690-1000 has ±1000 μT measuring range and 20 pT/ noise floor at 1 Hz. The digitization of the measurements from both Mag690-1000 magnetometers is handled by a National Instruments Data Acquisition (DAQ) System.
3. Results
As it is mentioned previously, the simulations are conducted using the Magpar software and the FEM method, while the experimental procedure is based on fluxgate magnetometer. Firstly, one nanoparticle, is simulated as a sphere with radius 12.6 nm, and the results are compared to the corresponding experimental results. Then the total mass of this nanoparticle is splitted in two nanoparticle spheres and the impact of the nearest neighbor distance is investigated. Four different distances between the nanoparticles are studied. Then the same mass quantity of the simulated is designed with one, two and one hundred nano-spheres in order to examine whether the multitude of the nanoparticles affects the material hysteresis loop. All the aforementioned studies are conducted for both Materials 1 and 2.
3.1. Investigation for one Nanoparticle
In this section, both materials are simulated with one spheric nanoparticle of radius 12.6 nm, using FEM and the corresponding hysteresis loops, are exported. In addition, the magnetization values of both materials from simulations, when the terrestrial magnetic field is enforced, are compared to the corresponding values from the experimental procedure.
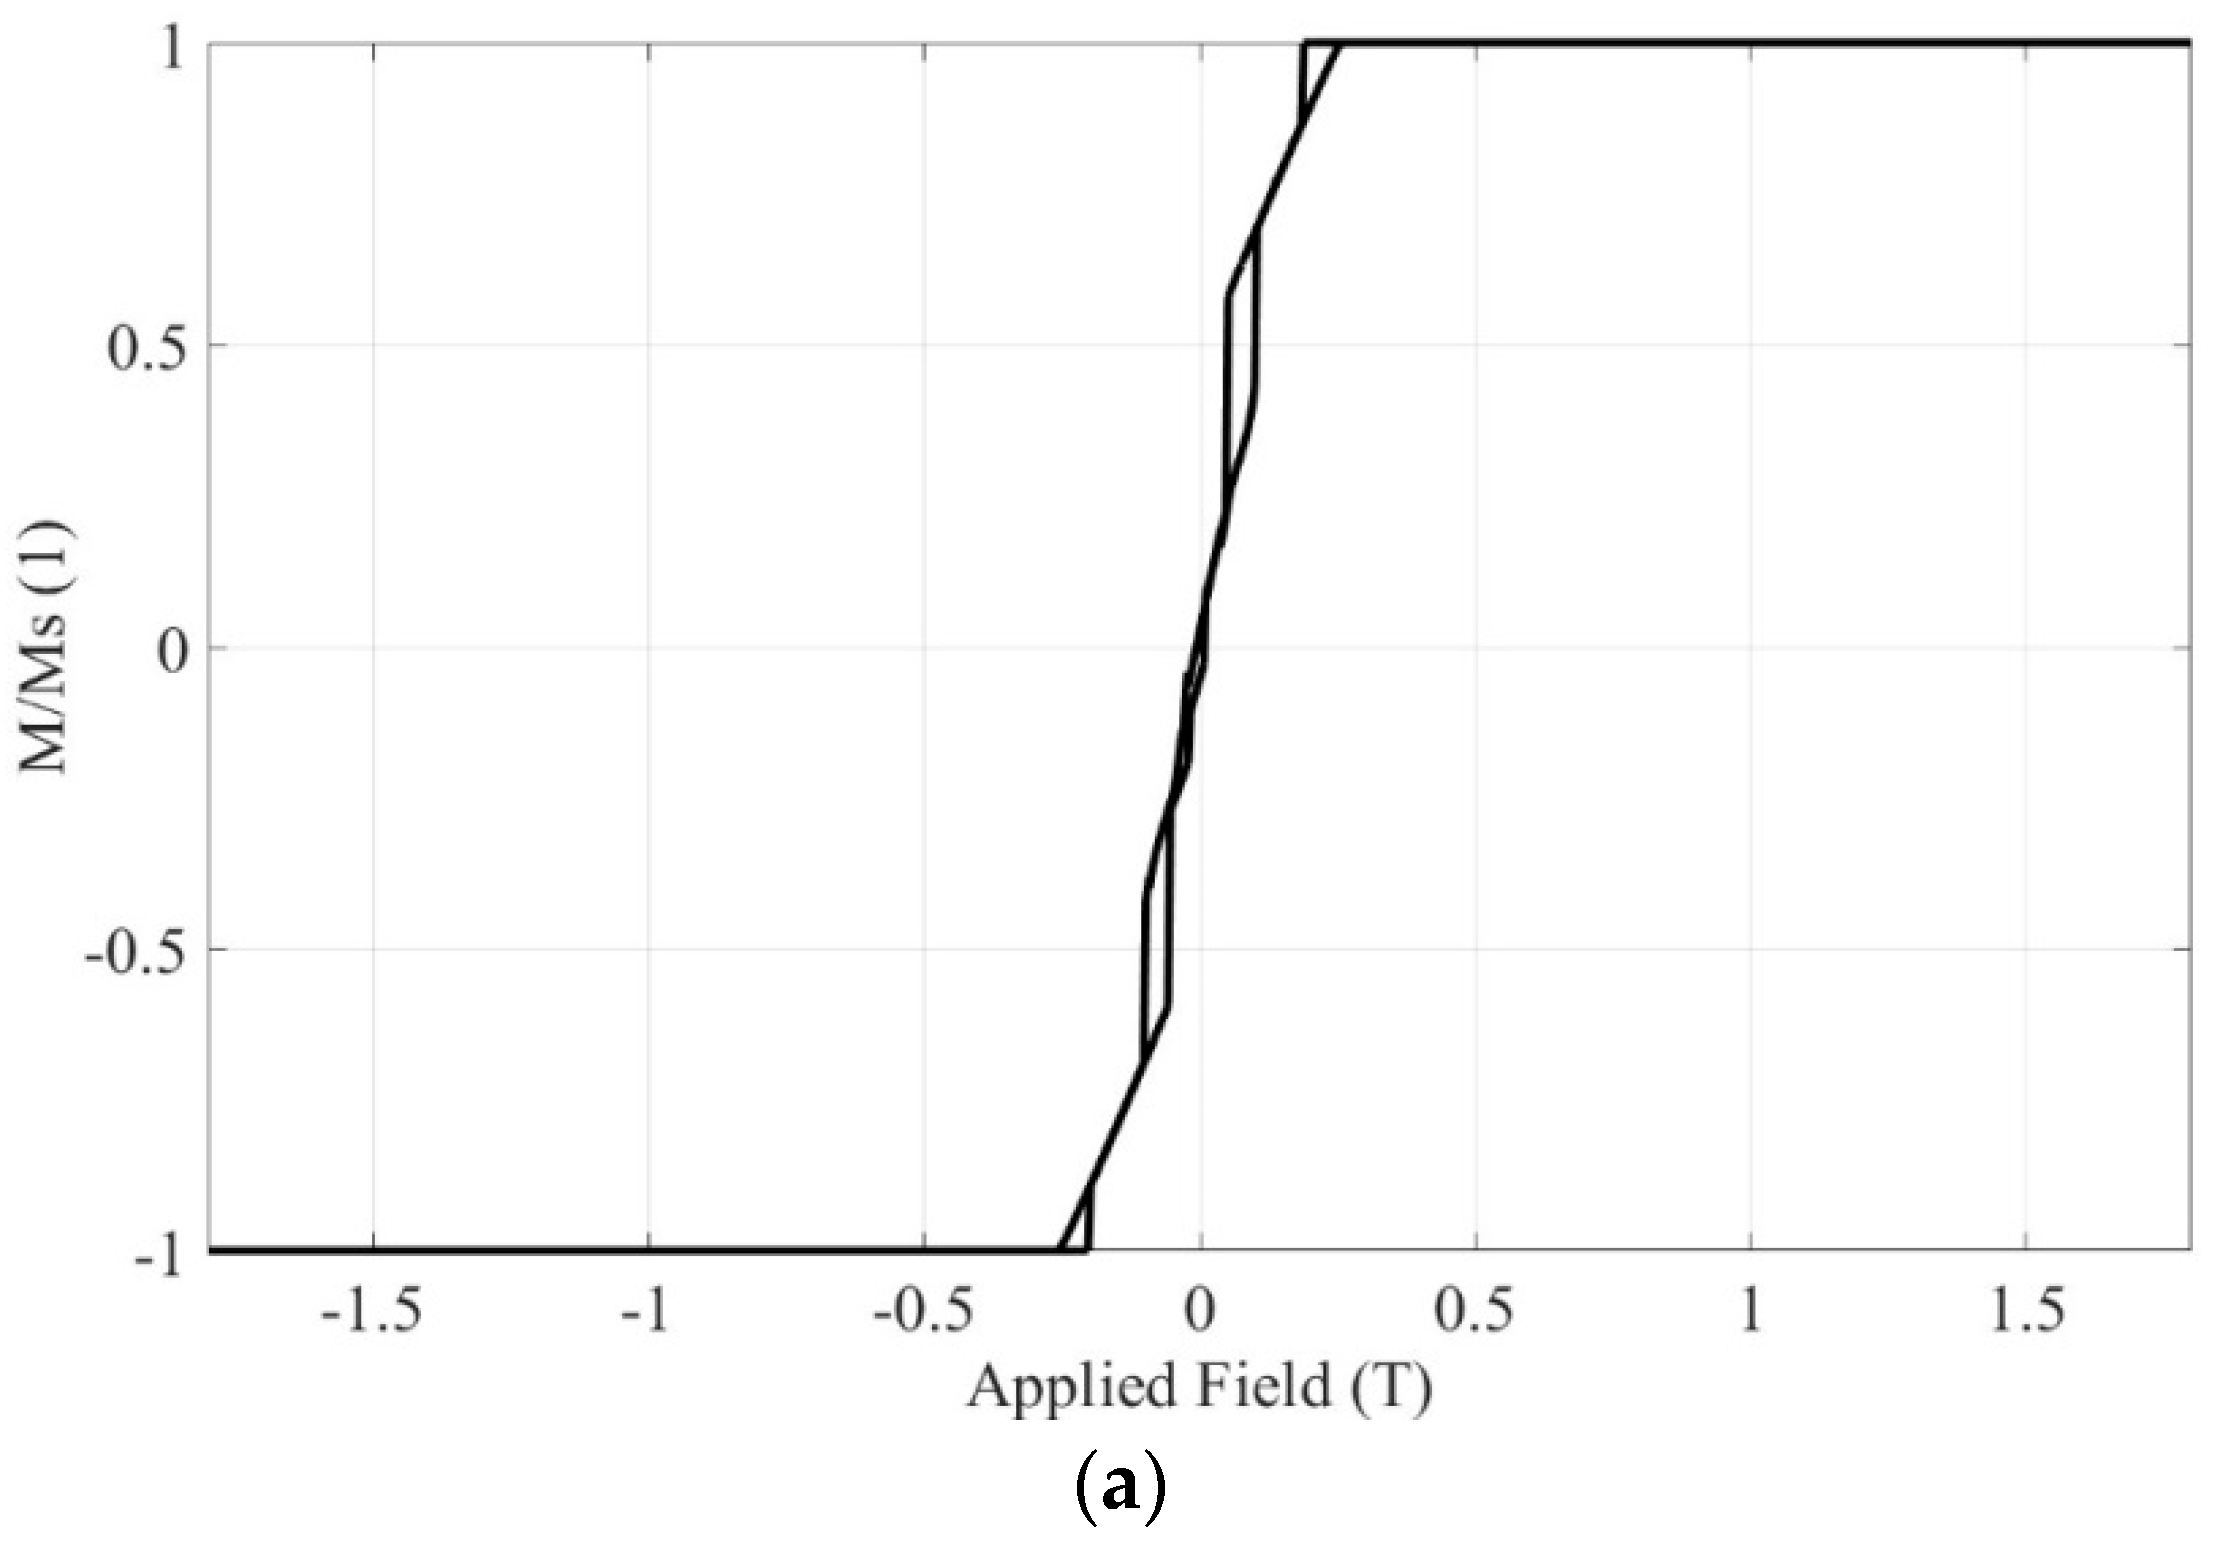
Figure 2a depicts the simulated hysteresis loop when the crystal structure is
fcc, while
Figure 2b focuses in the region of the earth magnetic field.
Figure 2.
In case of one simulated nanoparticle of Material 1, (a) the total hysteresis loop, and (b) the hysteresis loop in the region of the Earth’s magnetic field.
Figure 2.
In case of one simulated nanoparticle of Material 1, (a) the total hysteresis loop, and (b) the hysteresis loop in the region of the Earth’s magnetic field.
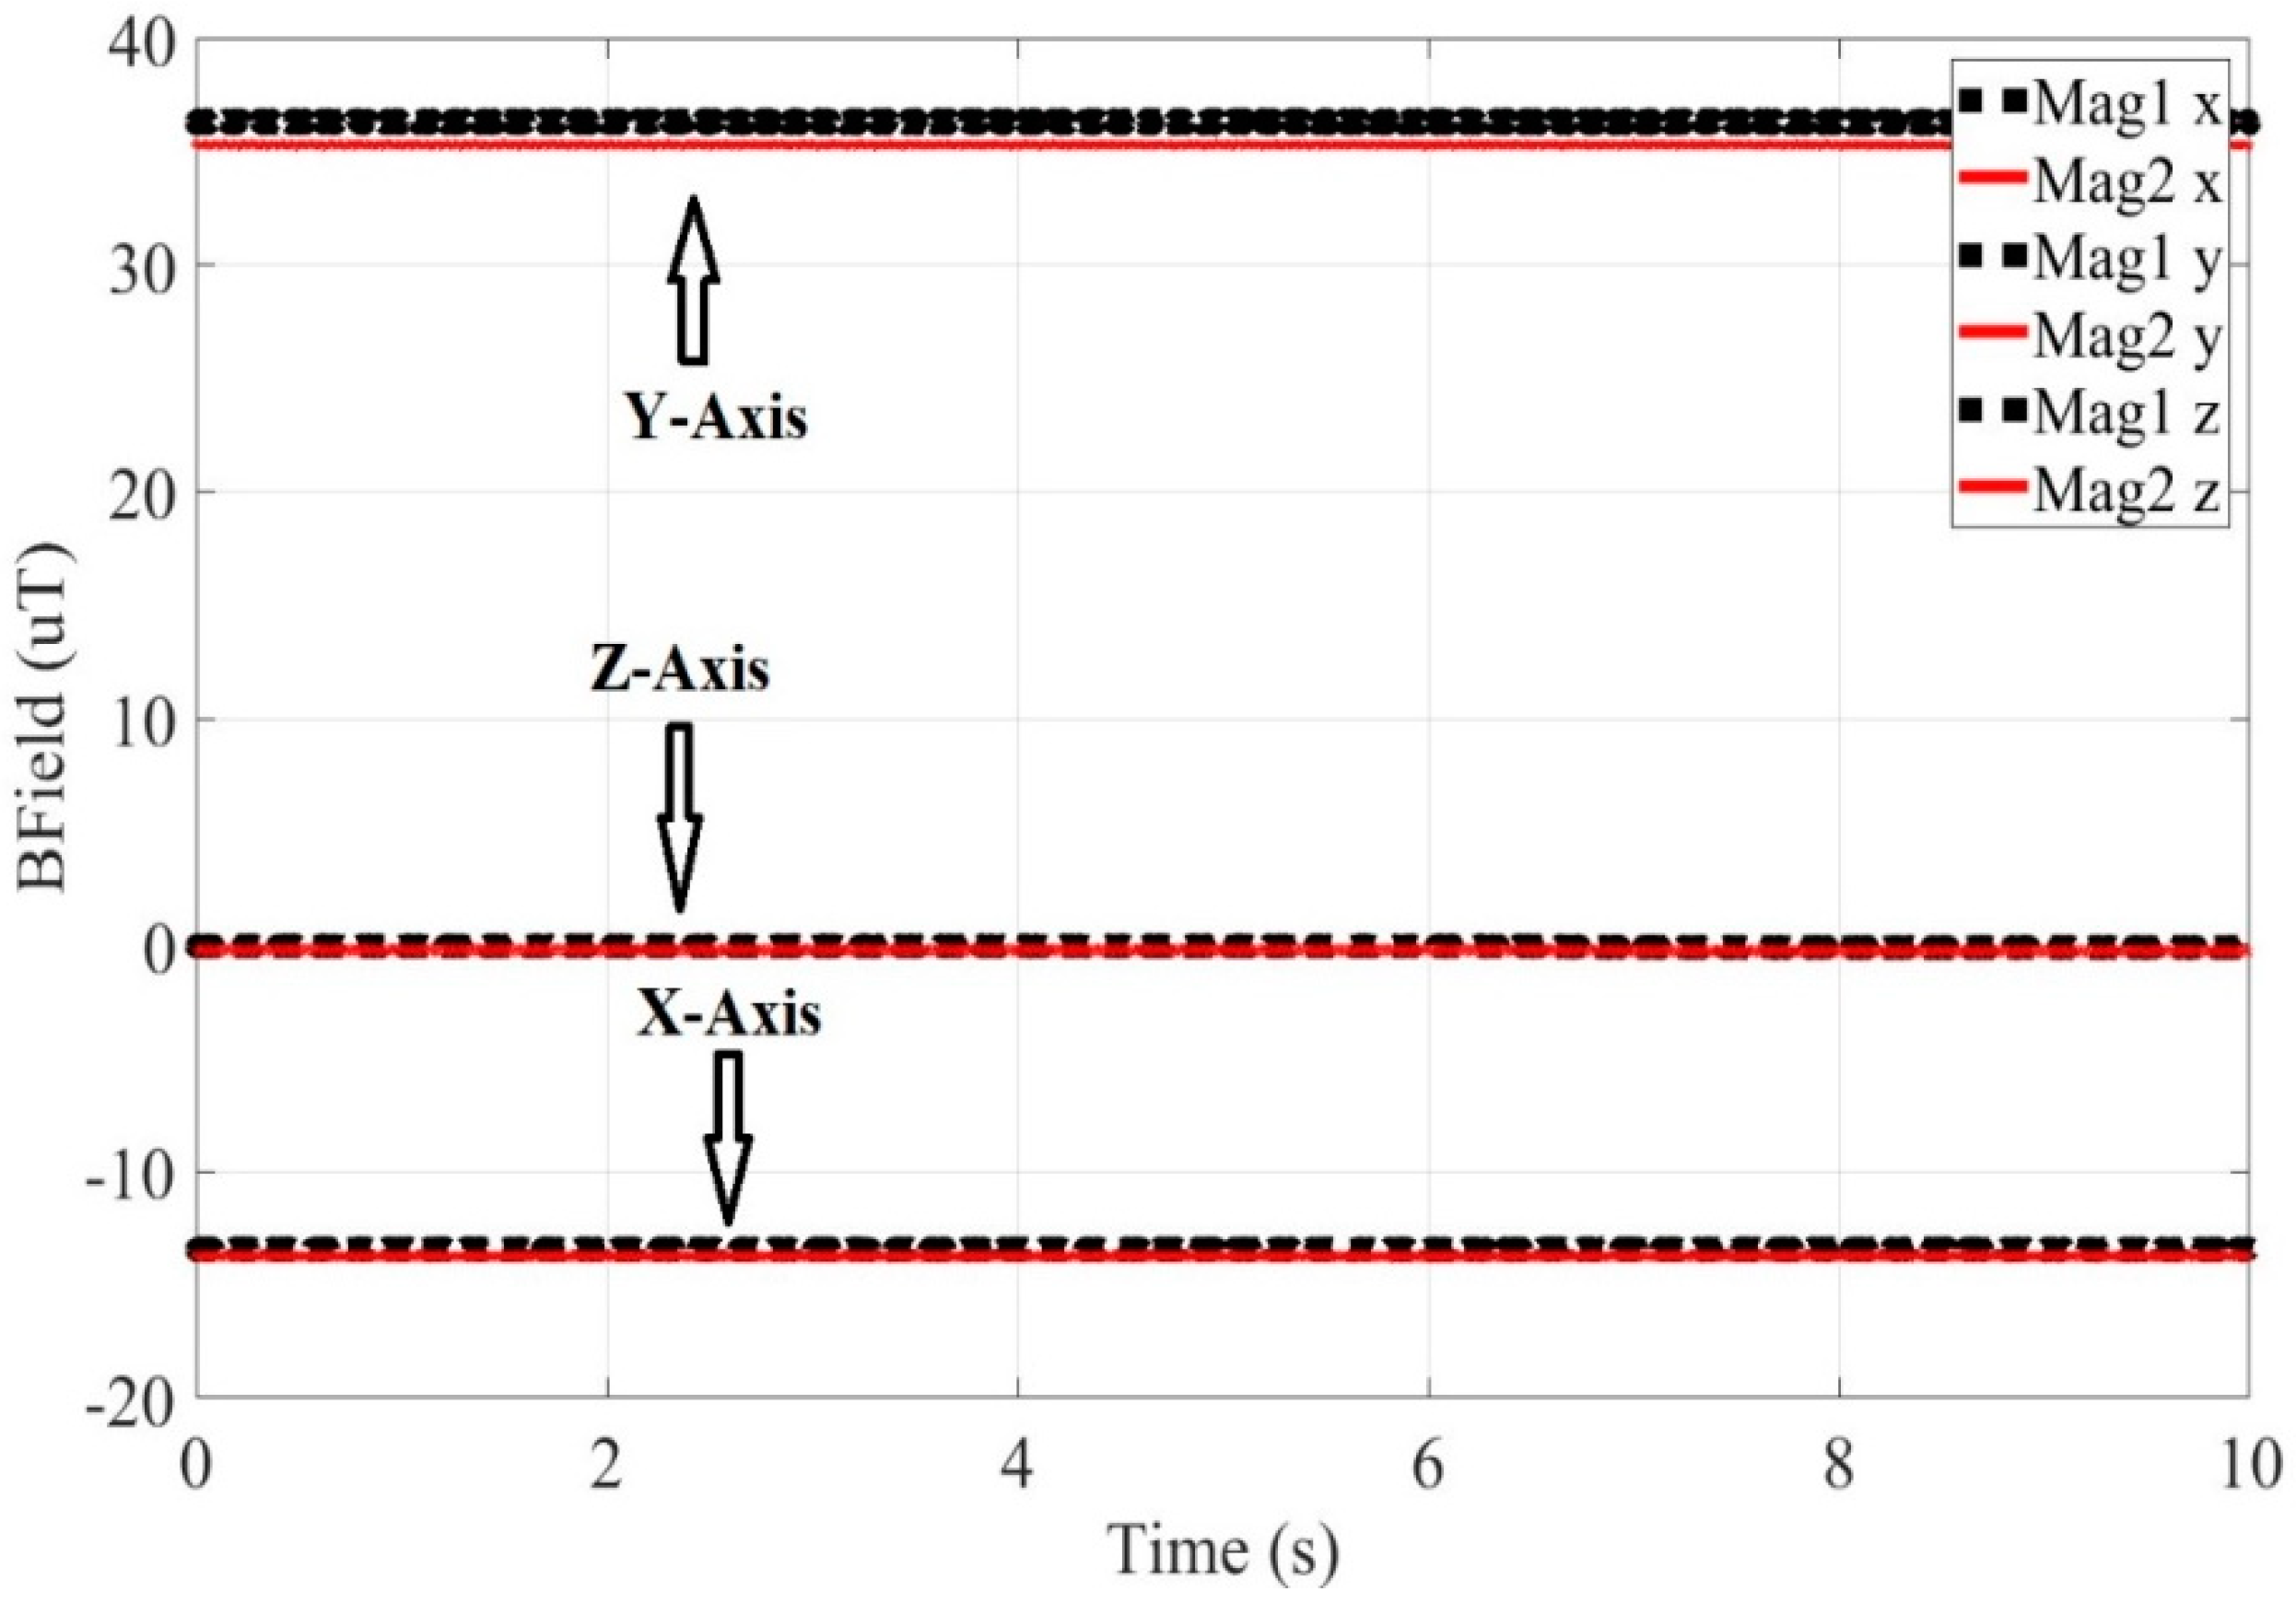
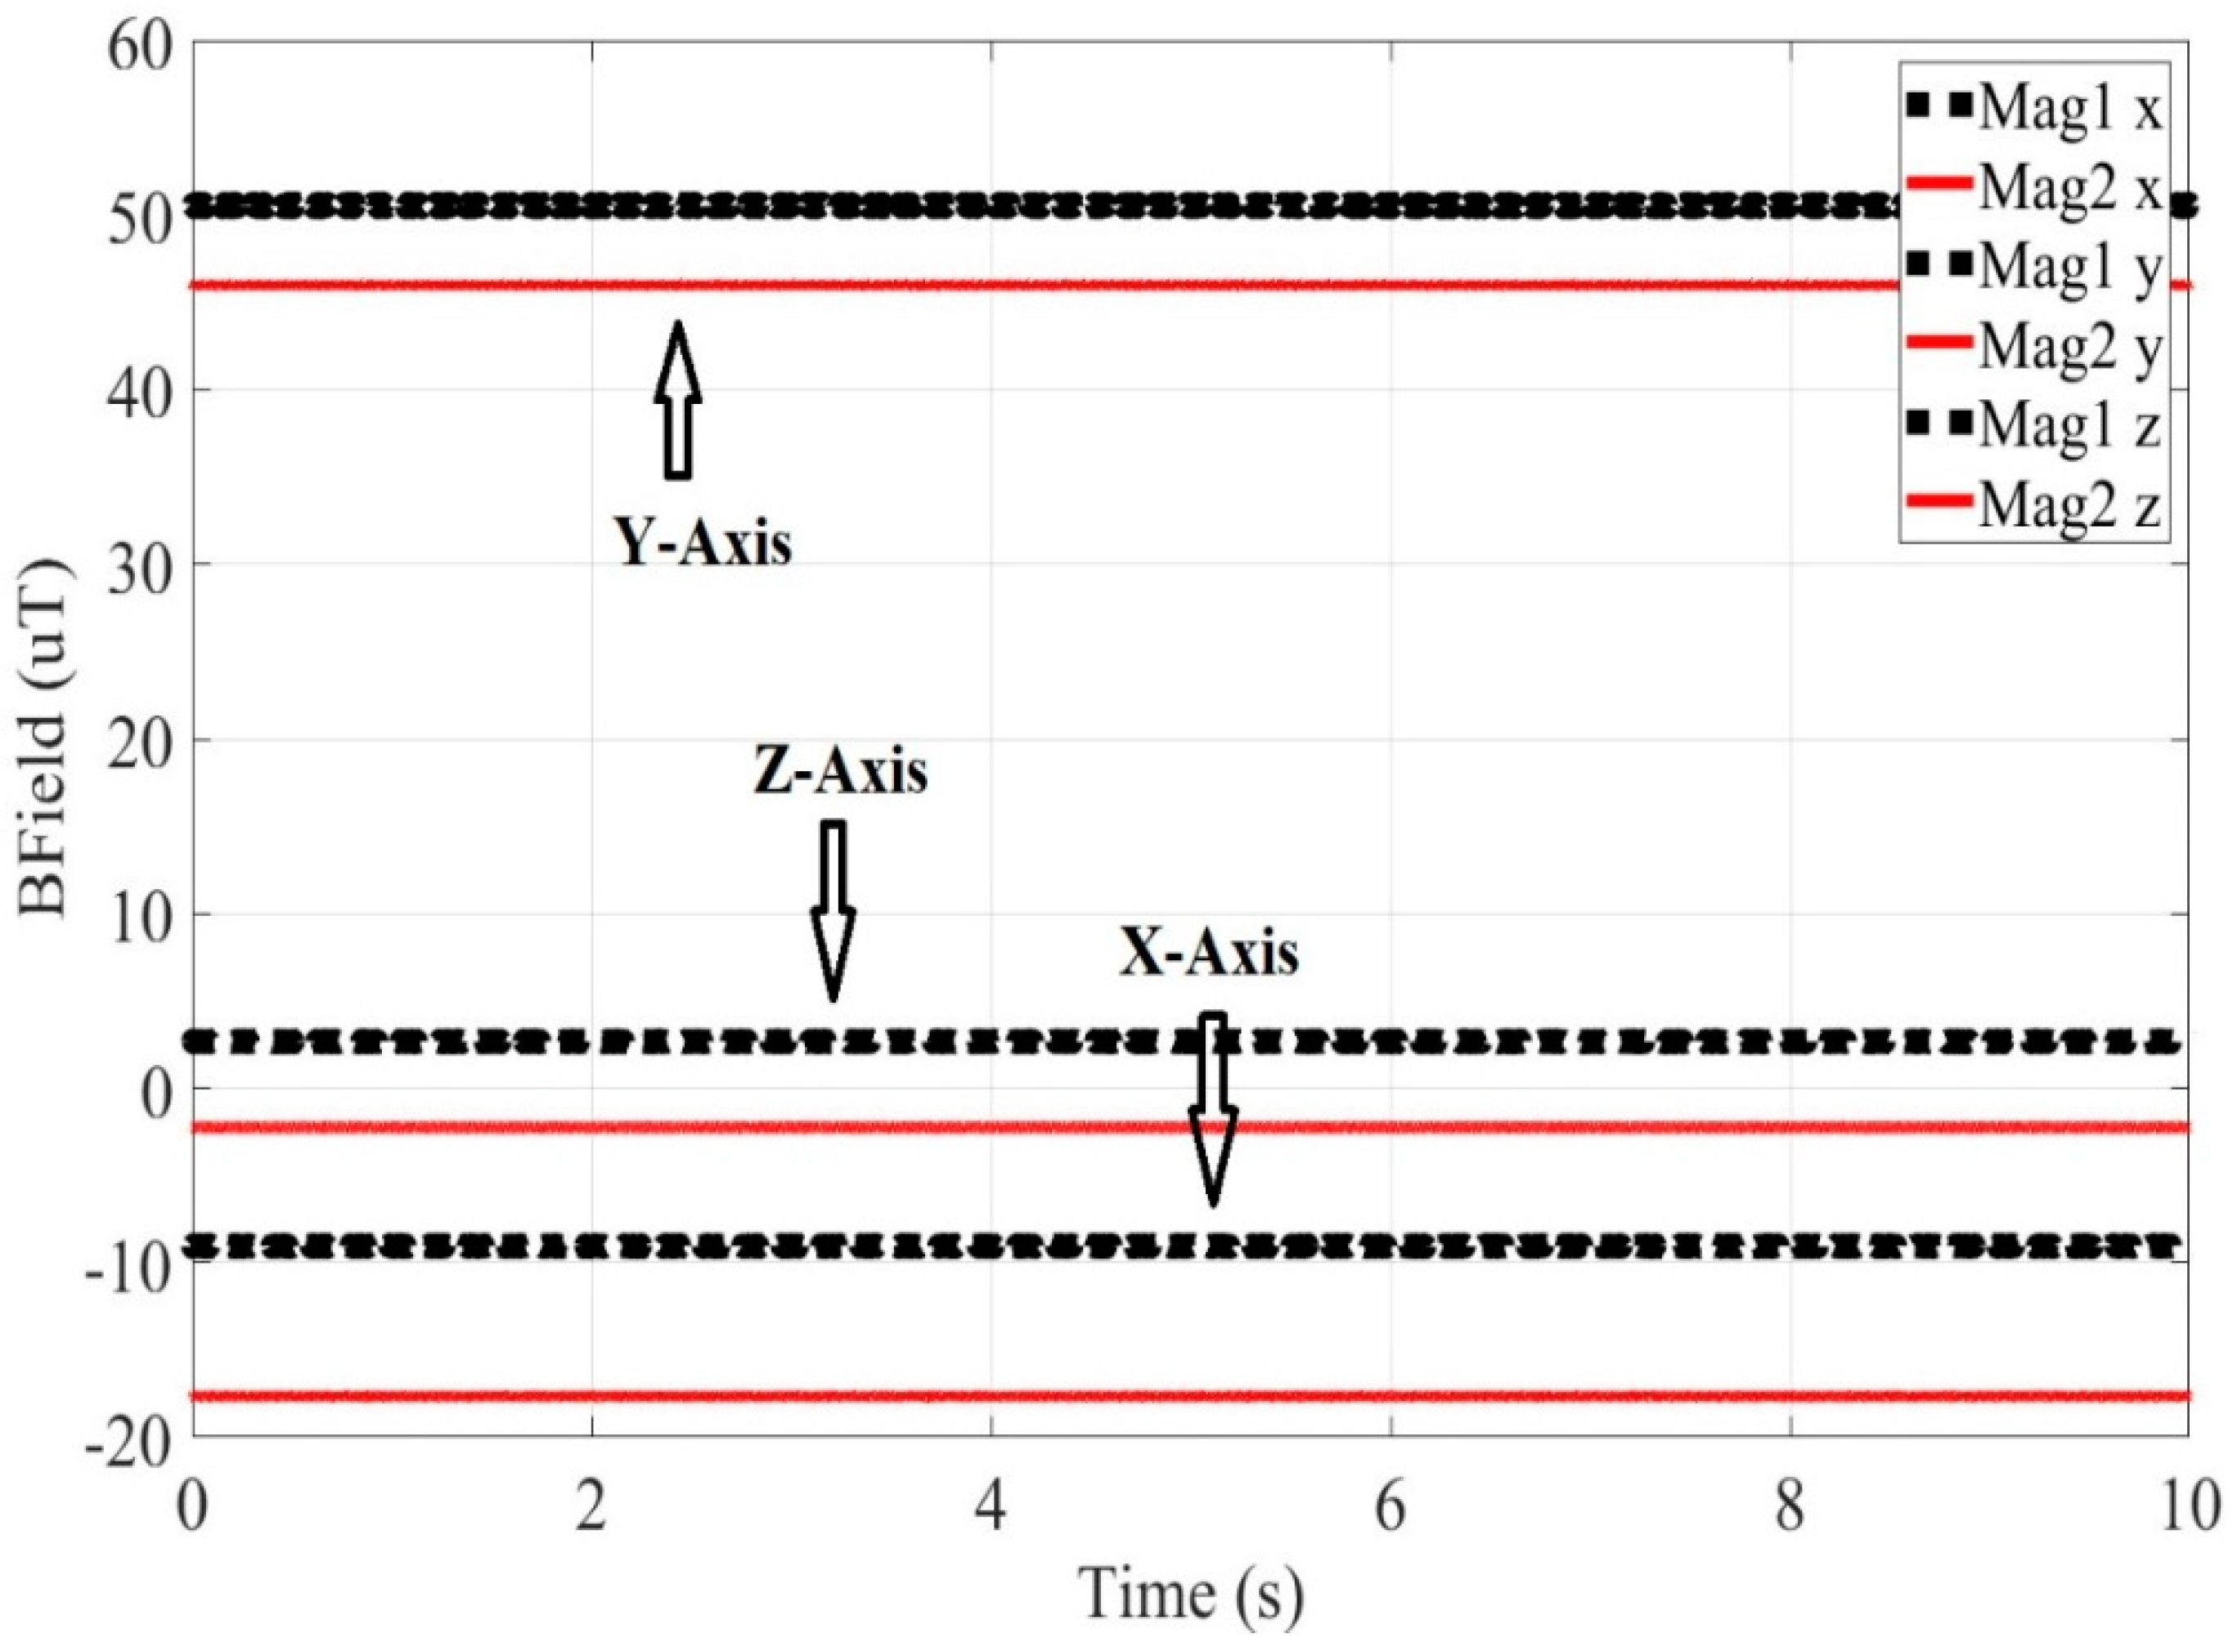
Figure 3 depicts the measured Earth’s magnetic field, in the three axes, versus time, as derived from magnetometers 1 and 2. Similarly,
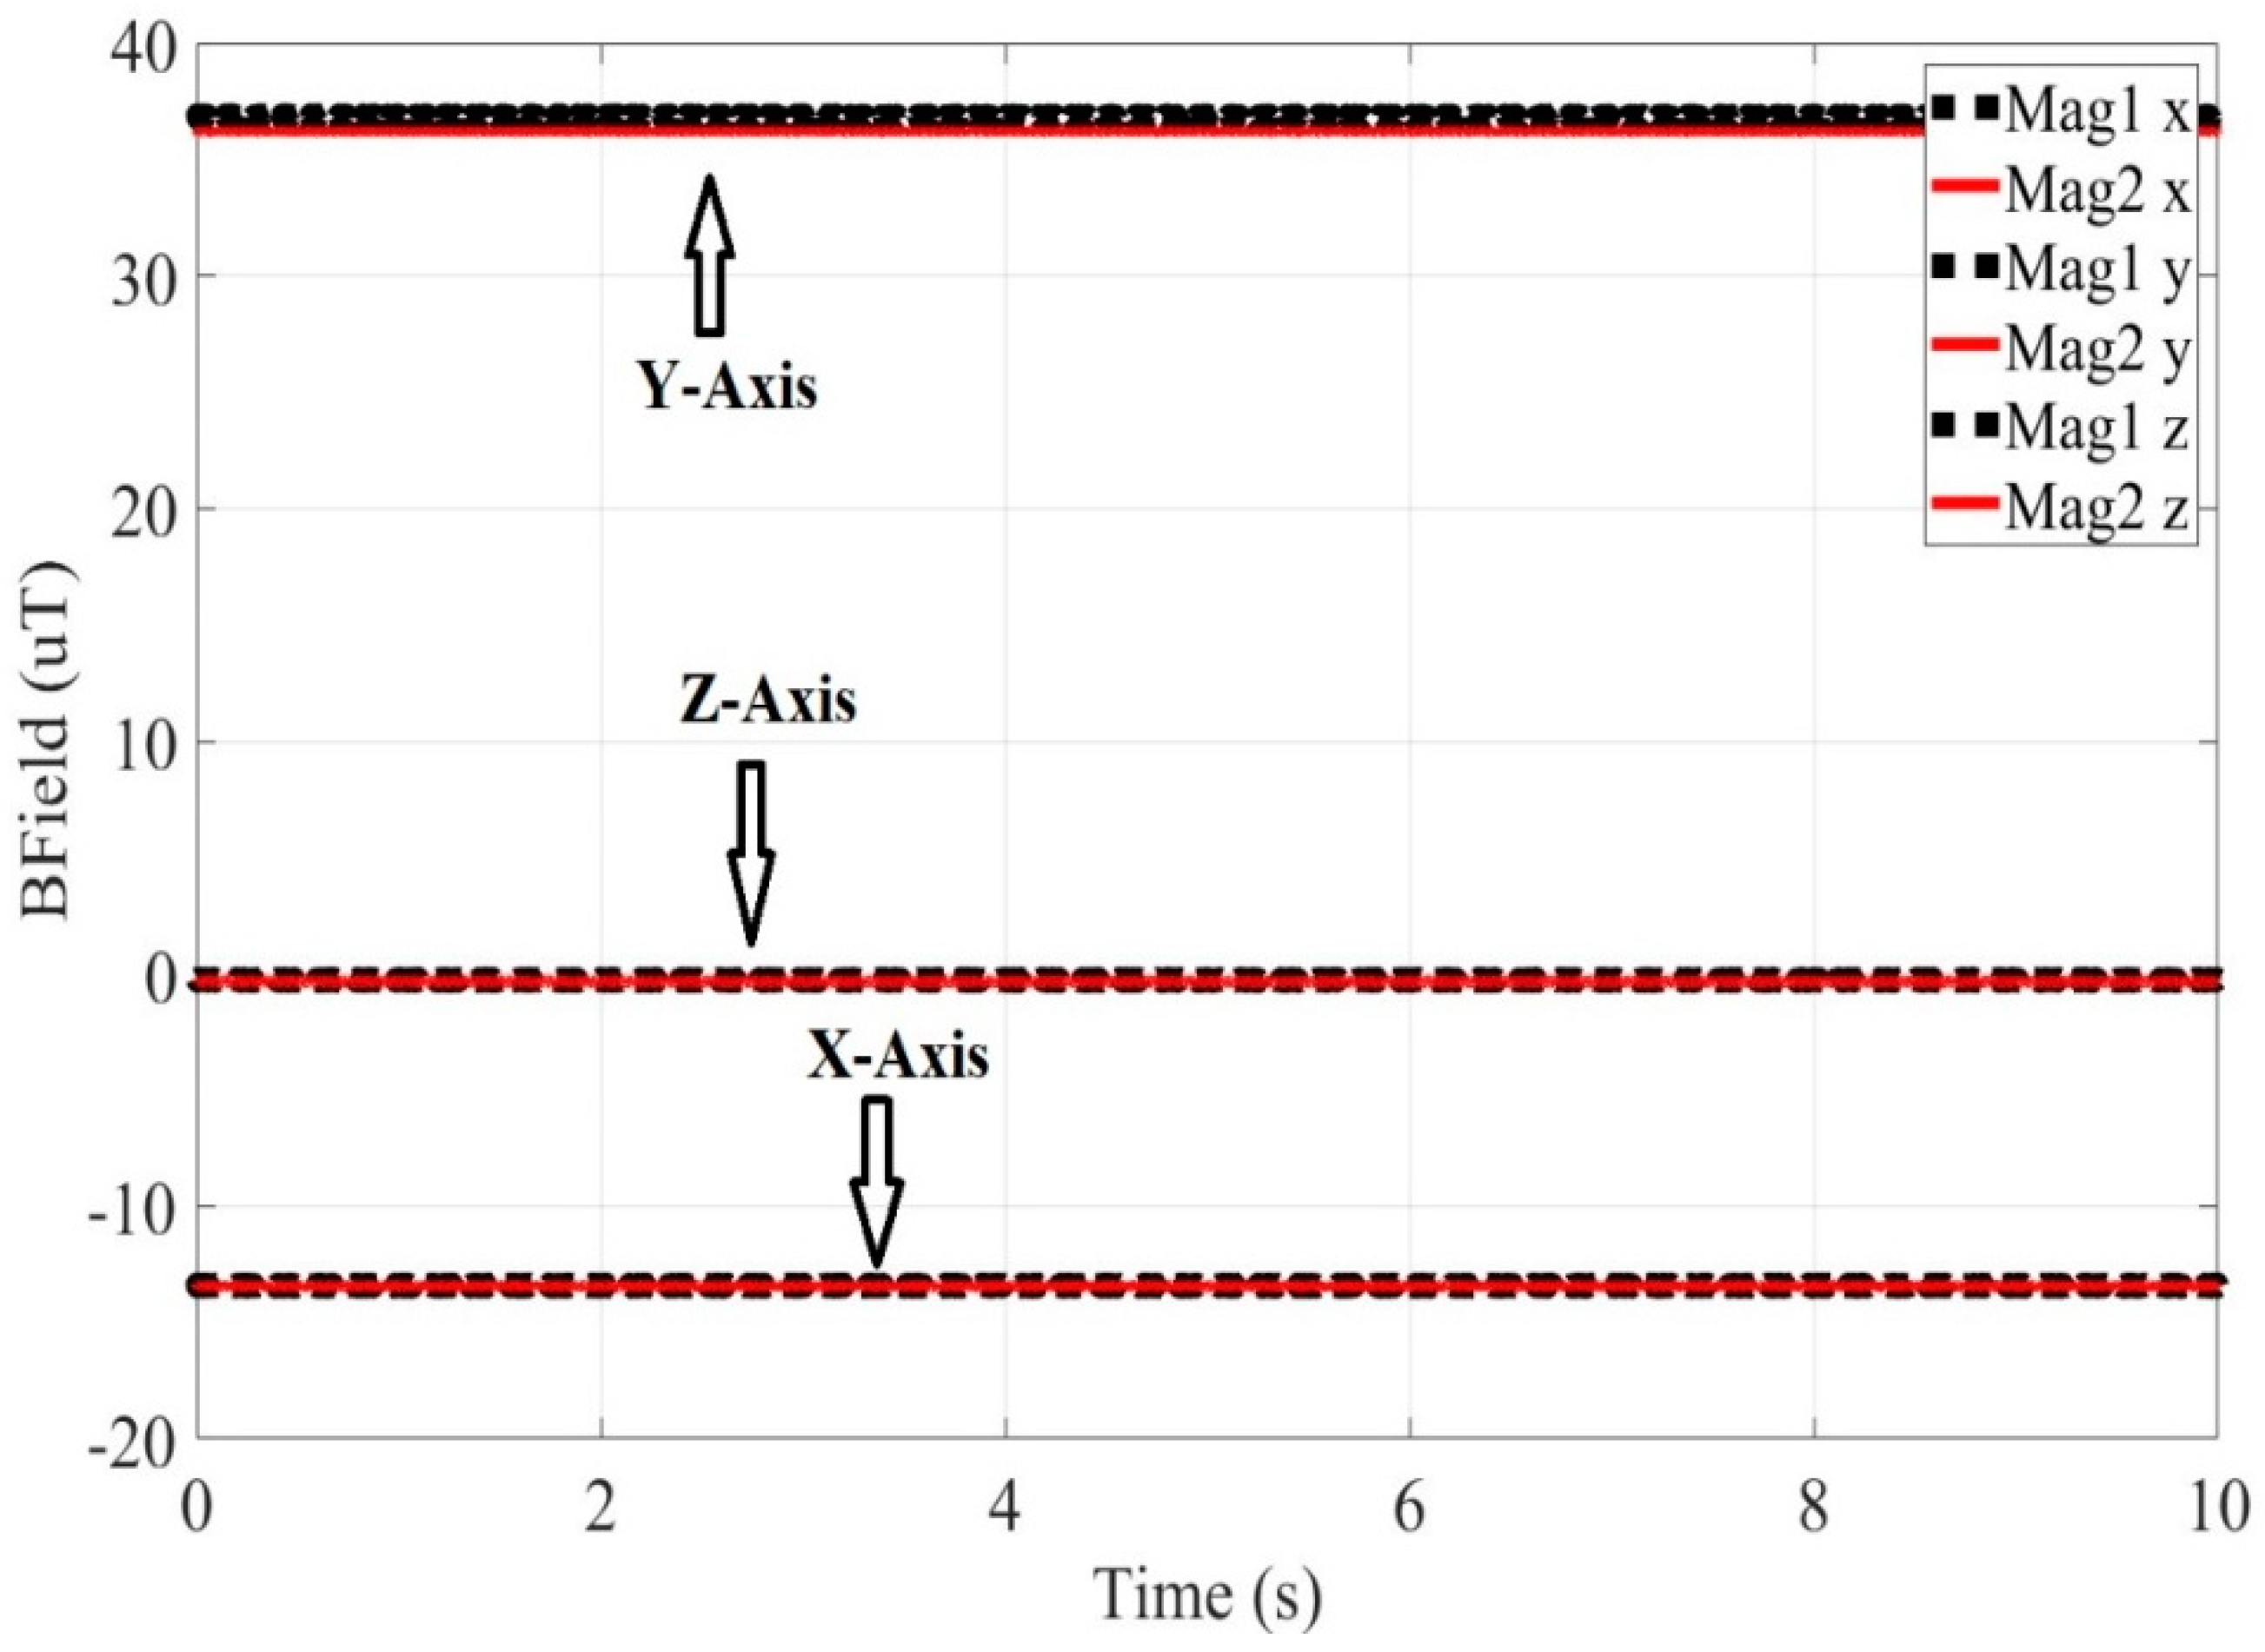
Figure 4 depicts the magnetic field, versus time, in the x-, y-, z- axis, in the case that Material 1 is present during the measurement. In
Figure 3,
Figure 4,
Figure 5 and
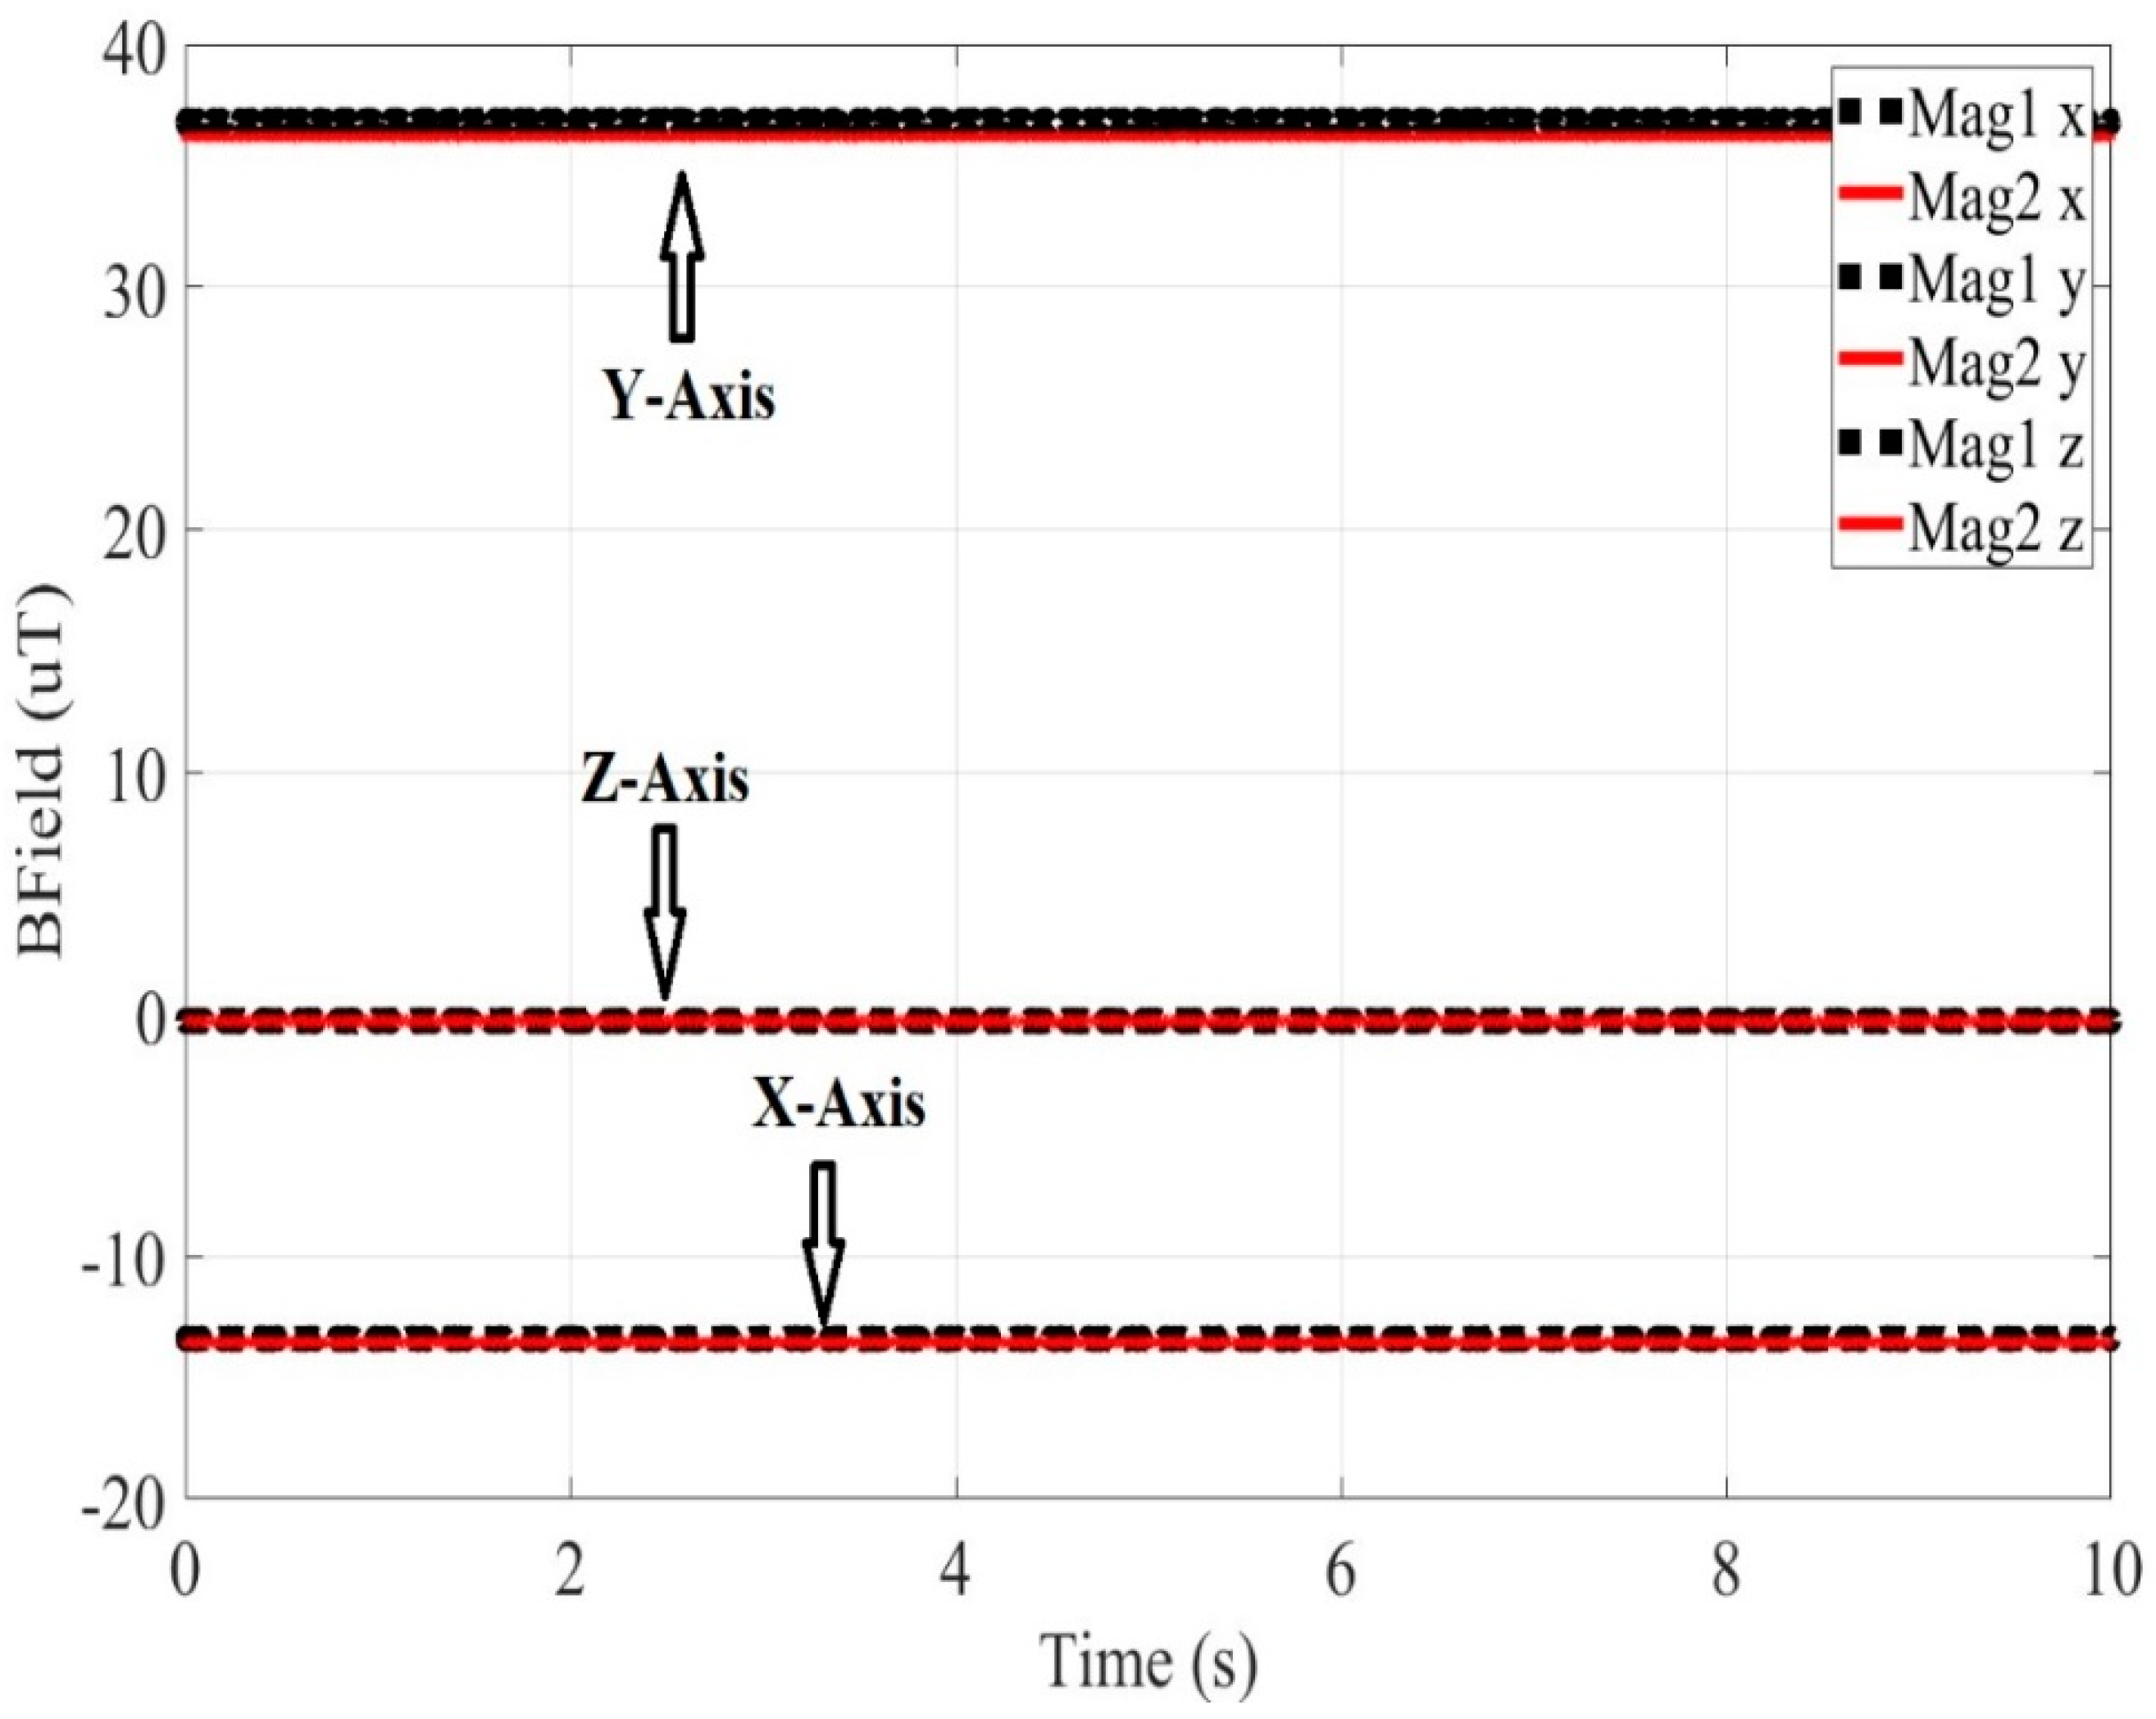
Figure 6, depicting experimental results, the Magnetometer 1 measurements are presented with black dotted line, while the Magnetometer 2 measurements are presented with red solid line. Subtracting the values of the measured magnetic field without a sample present (
Figure 3) from the values of the measured magnetic field with a sample present (
Figure 4), yields a resulting field with values Bx=-3.9083*10
-6 T, By=-2.0046*10
-6 T and Bz=-10.6902*10
-6 T, which is attributed to the measured sample mass. Then using the DE algorithm and taking into account the position of the measurement point of Magnetometer 1 (x=-0.038m, y=0m and z=0.015m), with reference to the sample position, the magnetization arises to approximately 4.4 emu/gr. This experimental value can validate the magnetization value produced by the FEM method. Observing
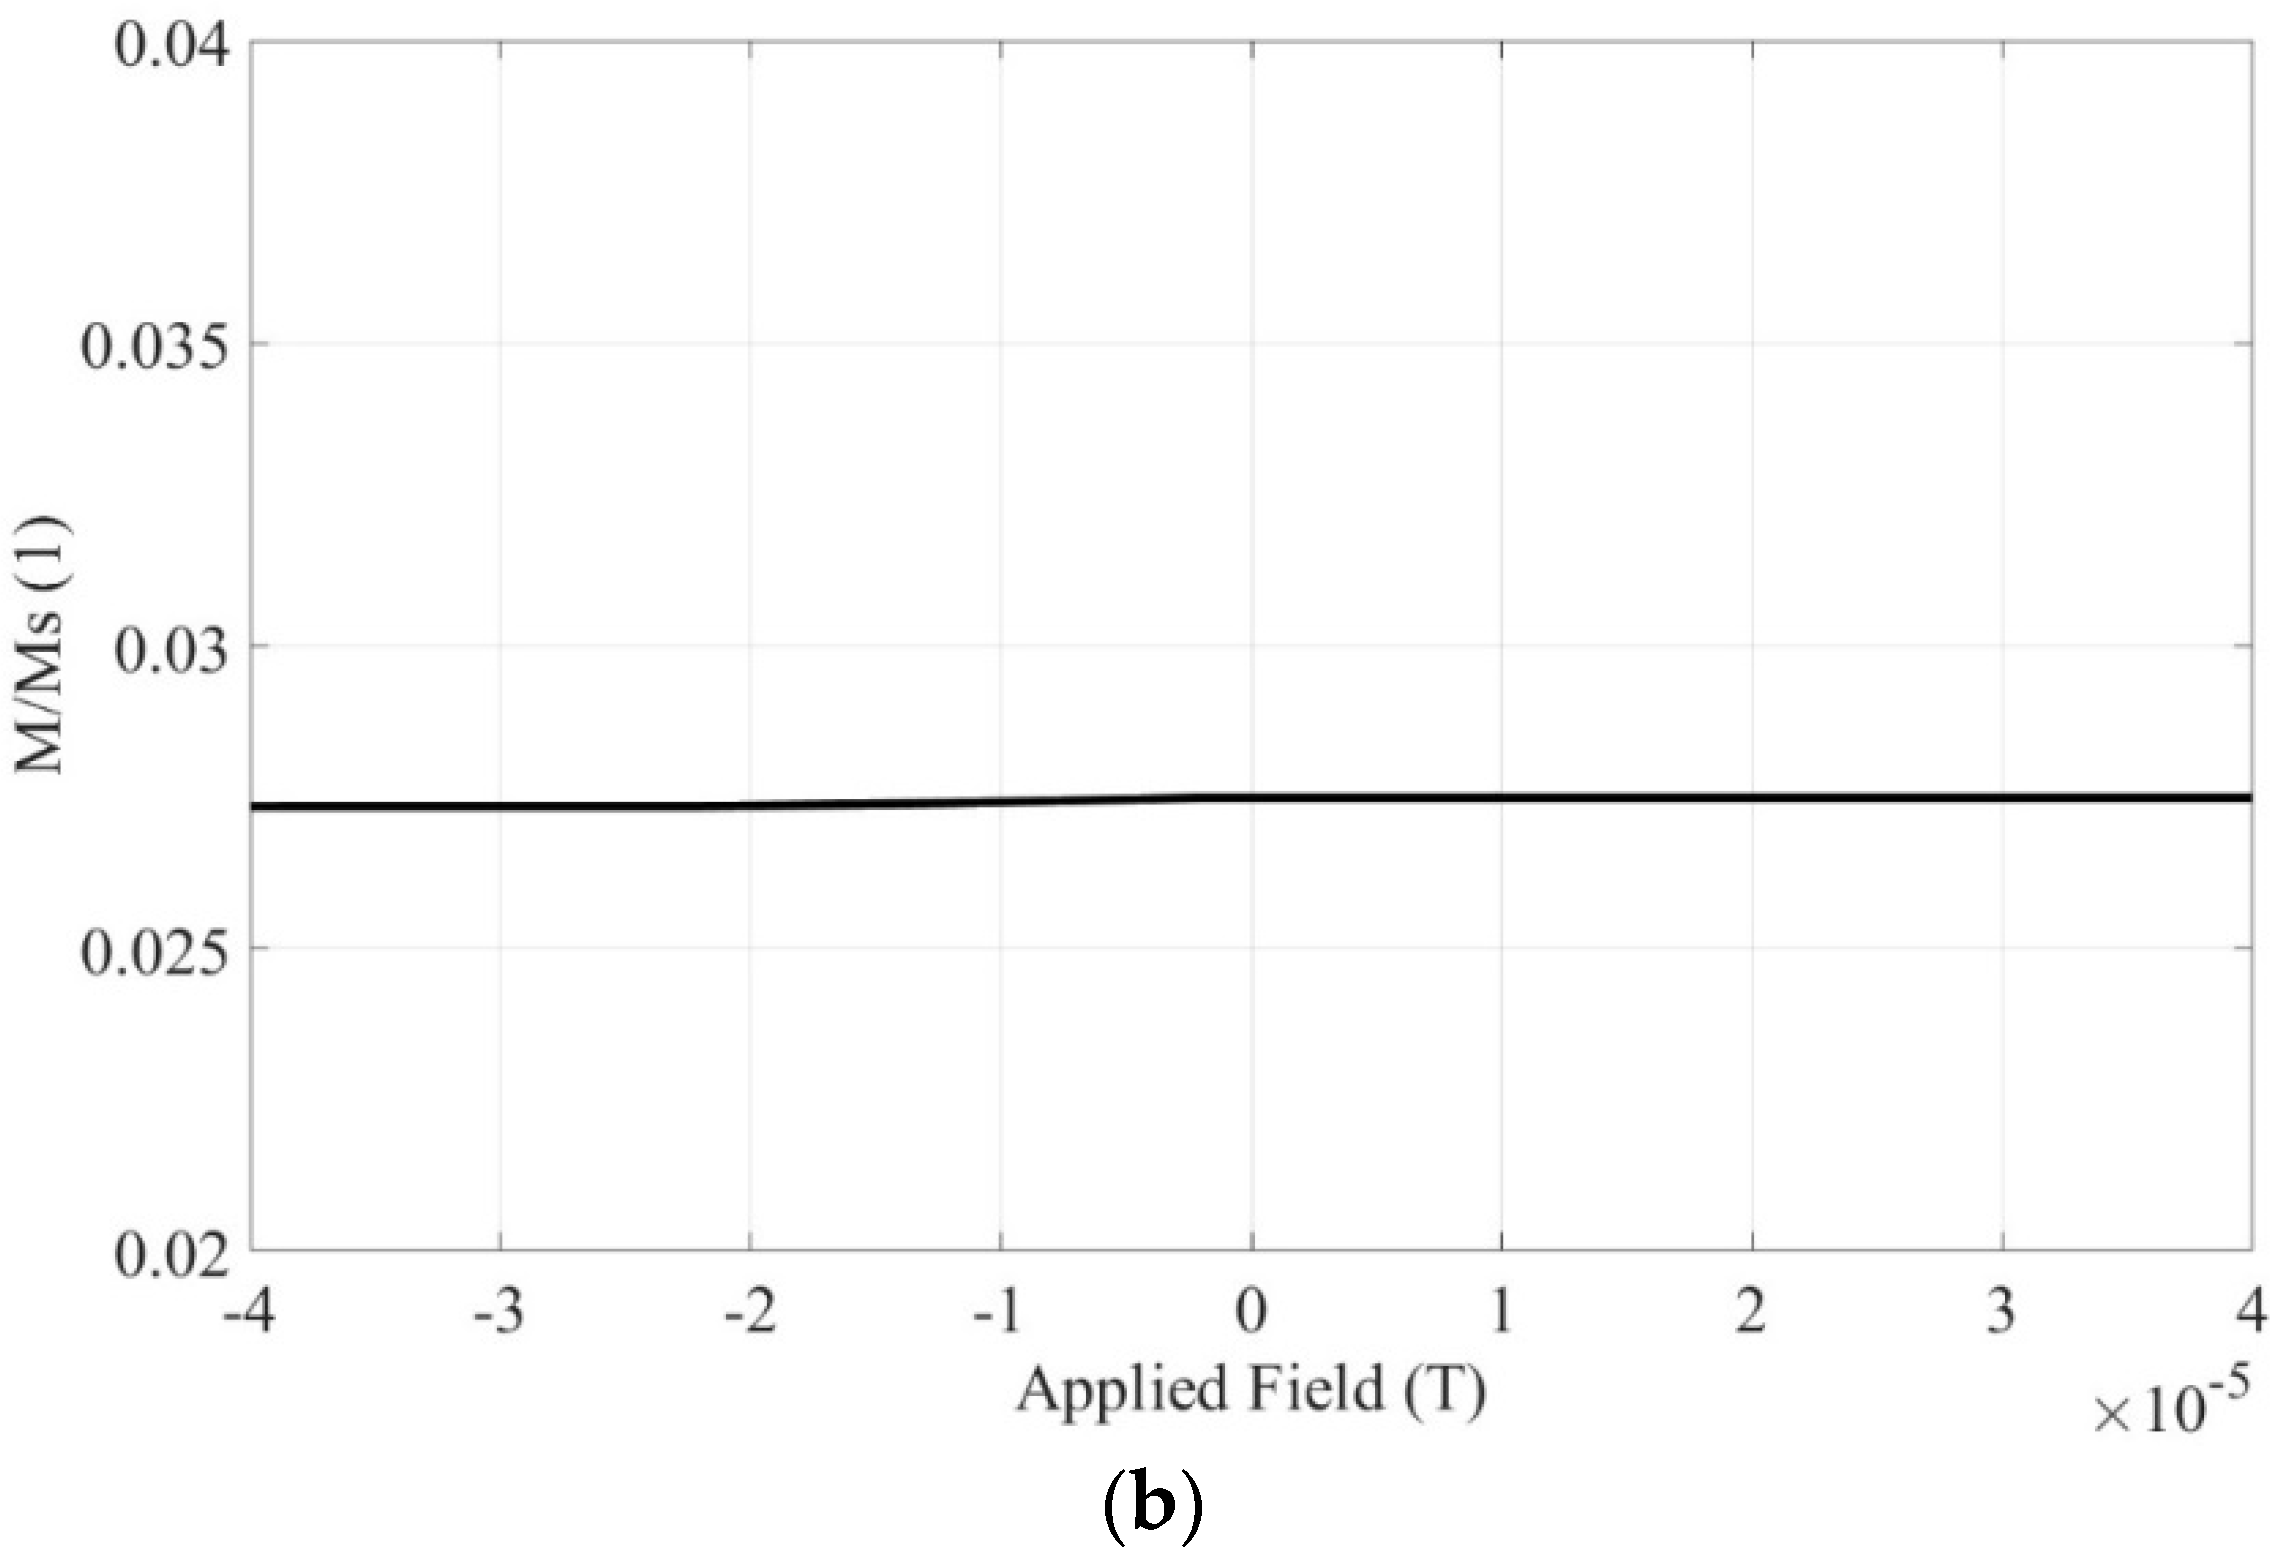
Figure 2b, the magnetization value of Material 1, under the Earth’s magnetic field, is about 0.0275 times the M
S, in other words roughly 4.62 emu/gr. Simulation and measurement results are in good agreement (difference<5%), validating the feasibility of the proposed characterization setup.
Figure 3.
The Earth’s magnetic field versus time, measured on x-, y- and z- axes, when both Mag 1 and Mag 2 magnetometers are used.
Figure 3.
The Earth’s magnetic field versus time, measured on x-, y- and z- axes, when both Mag 1 and Mag 2 magnetometers are used.
Next, the aforementioned investigation is carried out for Material 2.
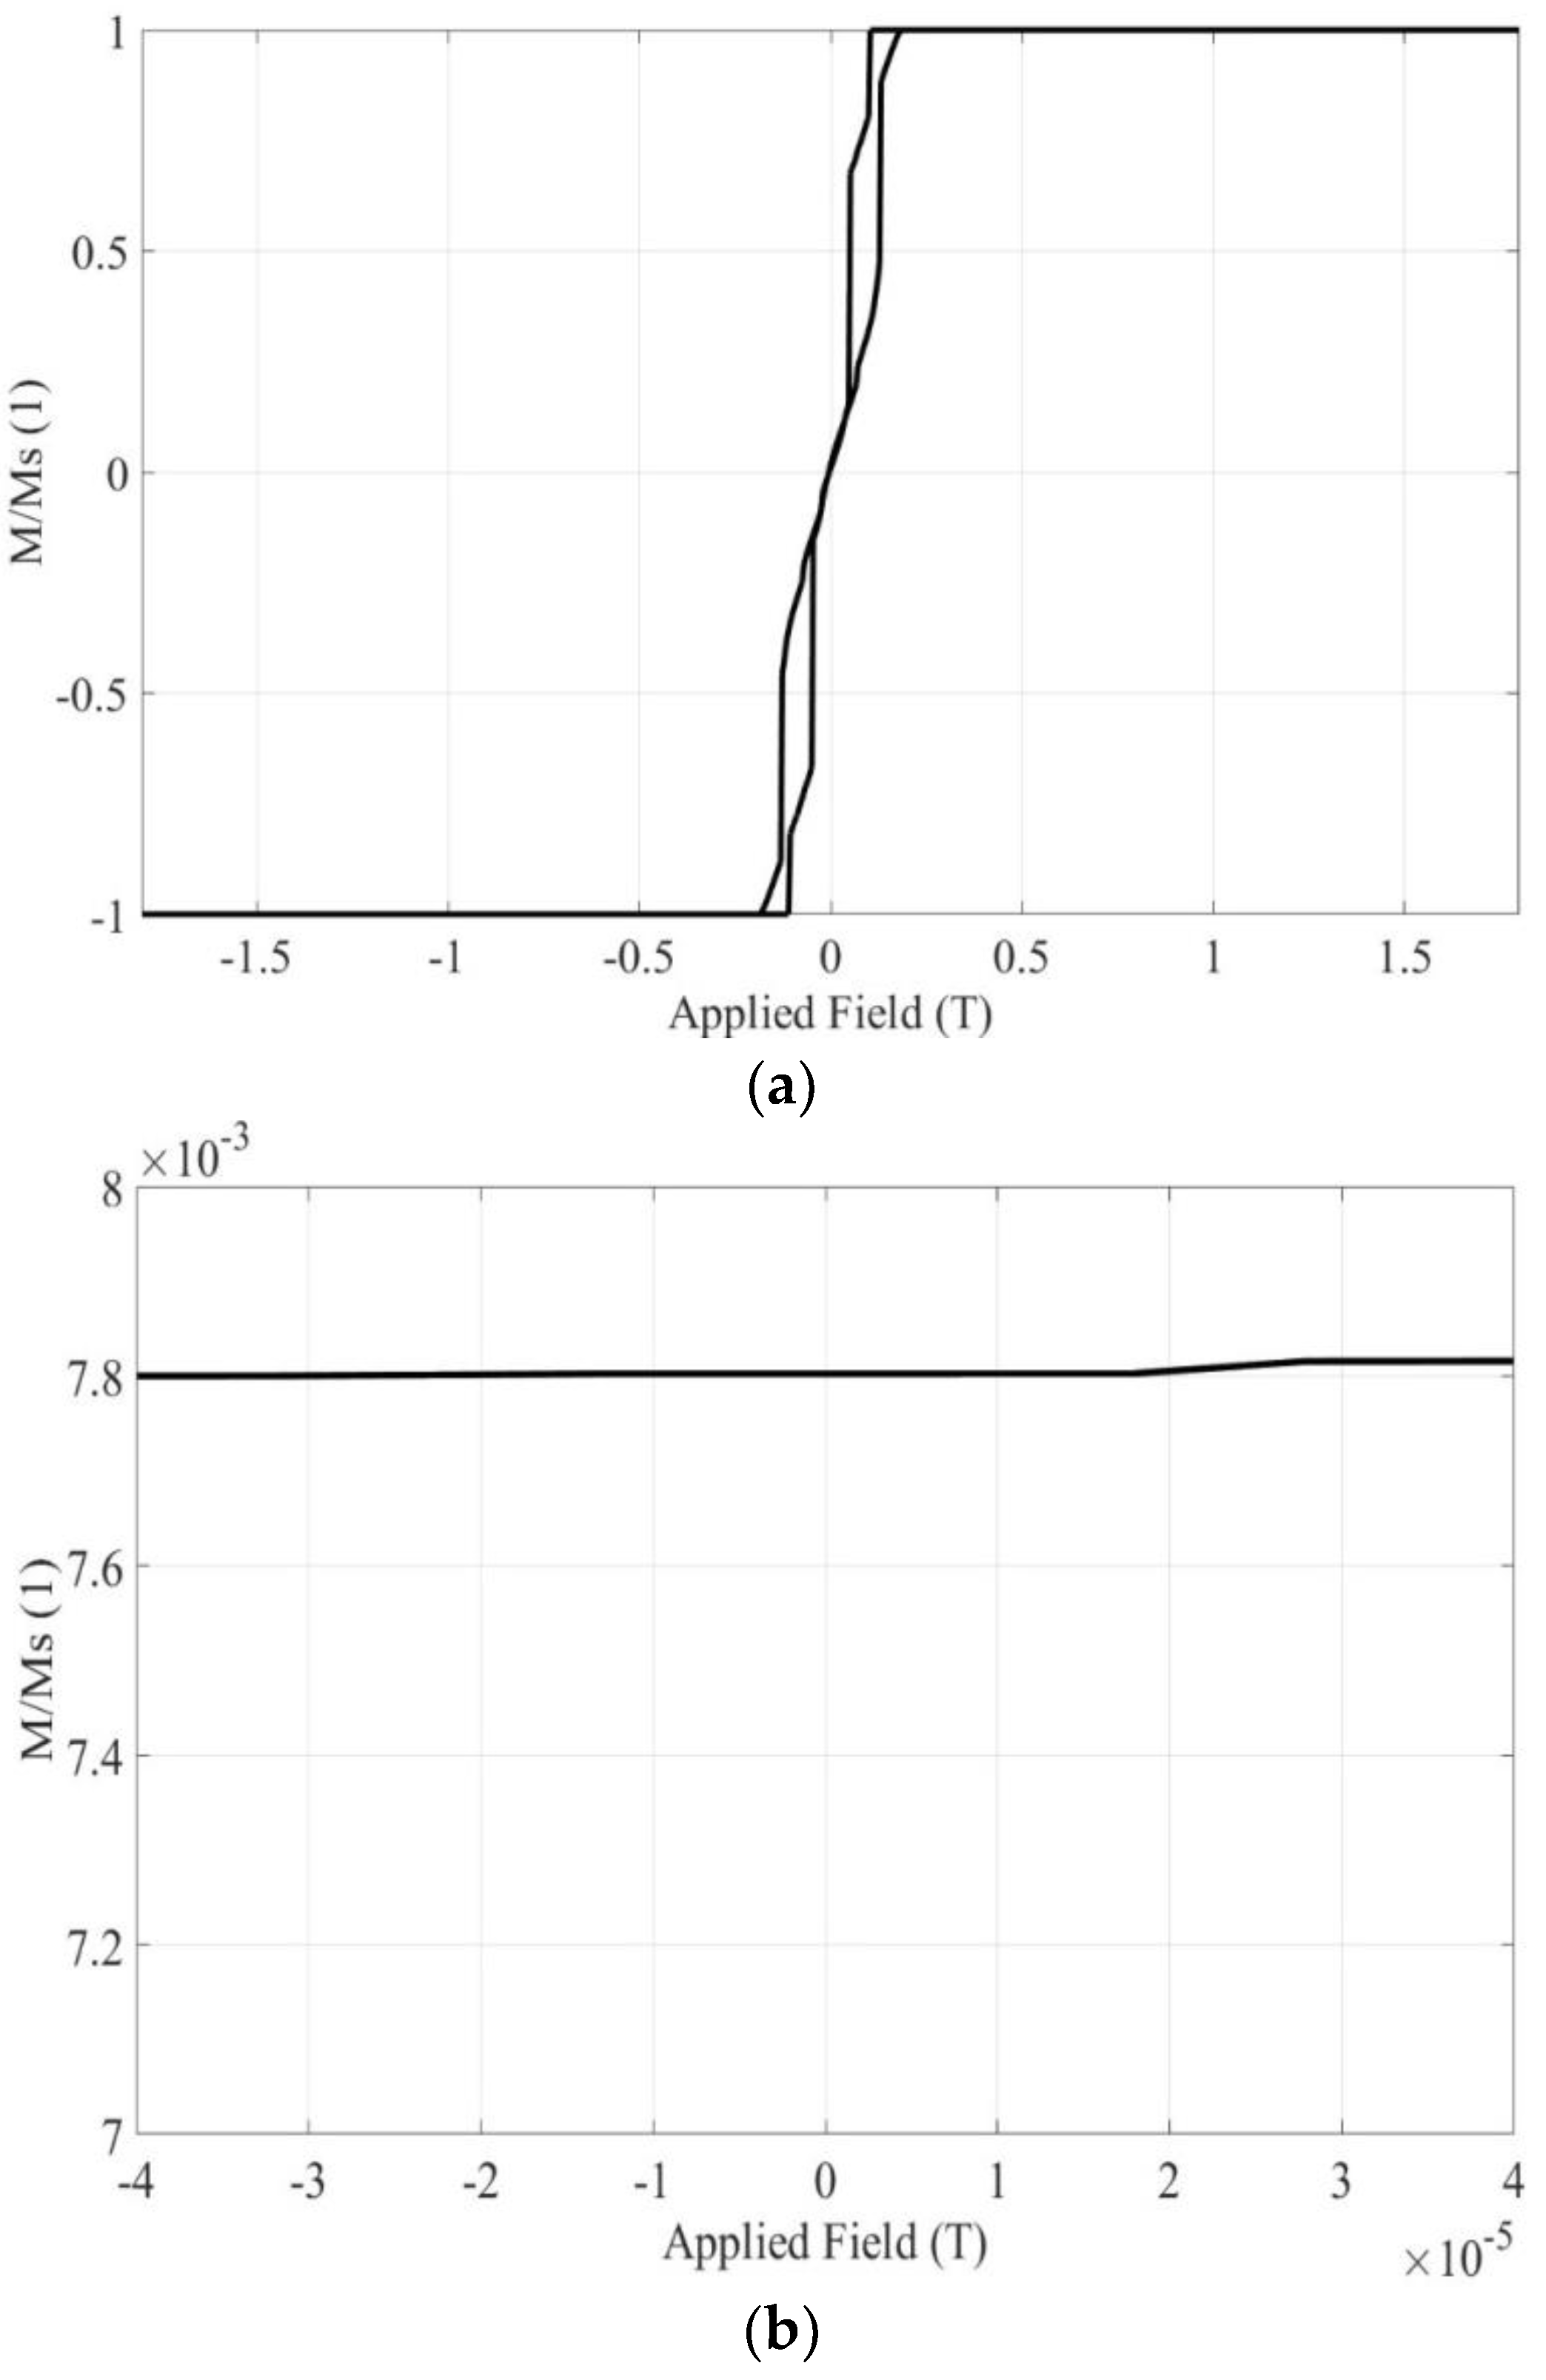
Figure 7a depicts the hysteresis loop of one nanoparticle with radius 12.6 nm, while
Figure 7b focuses in the section of the hysteresis loop near to the terrestrial magnetic field. As it can be seen from
Figure 7b, the magnetization of the material with the
hcp crystal structure, due to the terrestrial magnetic field is about 0.007816 times the saturation magnetization, which equals to 1.1724 emu/gr. The corresponding value, exported from experimental results, can be obtained by subtracting the values of the magnetic field in the absence of the Material 2 sample (
Figure 5), from the values of the magnetic field with the Material 2 sample present (as depicted in
Figure 6). Similarly, to the case of Co with
fcc structure,
Figure 5 and
Figure 6 depict the results of the terrestrial magnetic field and the magnetic field when the Co based material sample with
hcp structure is present in the measurement, respectively. The subtraction yields a field with value B
x=-0.0929*10
-6 T, B
y= 0.0585*10
-6 T and B
z= 0.0284*10
-6 T for the given measurement point position of the Magnetometer 1, with reference to the
hcp sample source, equal to x=-0.0235, y=0m and z=0.015m. The resulting magnetization has a value of 0.95 emu/gr. Consequently, the experimental value of the magnetization is close enough to the simulation value, while the validation of the proposed method with both materials, enhances its reliability.
Figure 4.
The Earth’s magnetic field versus time, in the presence of the fcc material, derived from experiment on x-, y- and z- axes, when Mag 1 and Mag 2 magnetometers are used.
Figure 4.
The Earth’s magnetic field versus time, in the presence of the fcc material, derived from experiment on x-, y- and z- axes, when Mag 1 and Mag 2 magnetometers are used.
Figure 5.
The Earth’s magnetic field experimentally derived on X-, Y- and Z- axes versus time, when both magnetometers Mag 1 and Mag 2 are used.
Figure 5.
The Earth’s magnetic field experimentally derived on X-, Y- and Z- axes versus time, when both magnetometers Mag 1 and Mag 2 are used.
Figure 6.
The Earth’s magnetic field experimentally derived on X-, Y- and Z- axes, in the presence of the hcp material, versus time, when both magnetometers Mag 1 and Mag 2 are used.
Figure 6.
The Earth’s magnetic field experimentally derived on X-, Y- and Z- axes, in the presence of the hcp material, versus time, when both magnetometers Mag 1 and Mag 2 are used.
Figure 7.
In the case of one simulated nanoparticle of Material 2: (a) the total hysteresis loop, and (b) the hysteresis loop in the region of Earth’s magnetic field.
Figure 7.
In the case of one simulated nanoparticle of Material 2: (a) the total hysteresis loop, and (b) the hysteresis loop in the region of Earth’s magnetic field.
3.2. Impact on the Hysteresis Loop due to the nearest neighbor
On this paragraph, the total mass of the nanoparticle, with radius 12.6 nm, is divided equally in two nanoparticles, that each has an equivalent radius 10 nm. The total mass of the nanoparticle is given by equation (1), where S is the Co density, which equals to 8900 kg/m
3, and V the nanoparticle volume computed by Equation (2), for a given nanoparticle radius r. The new radius can be calculated by dividing the total mass (7.4574x10
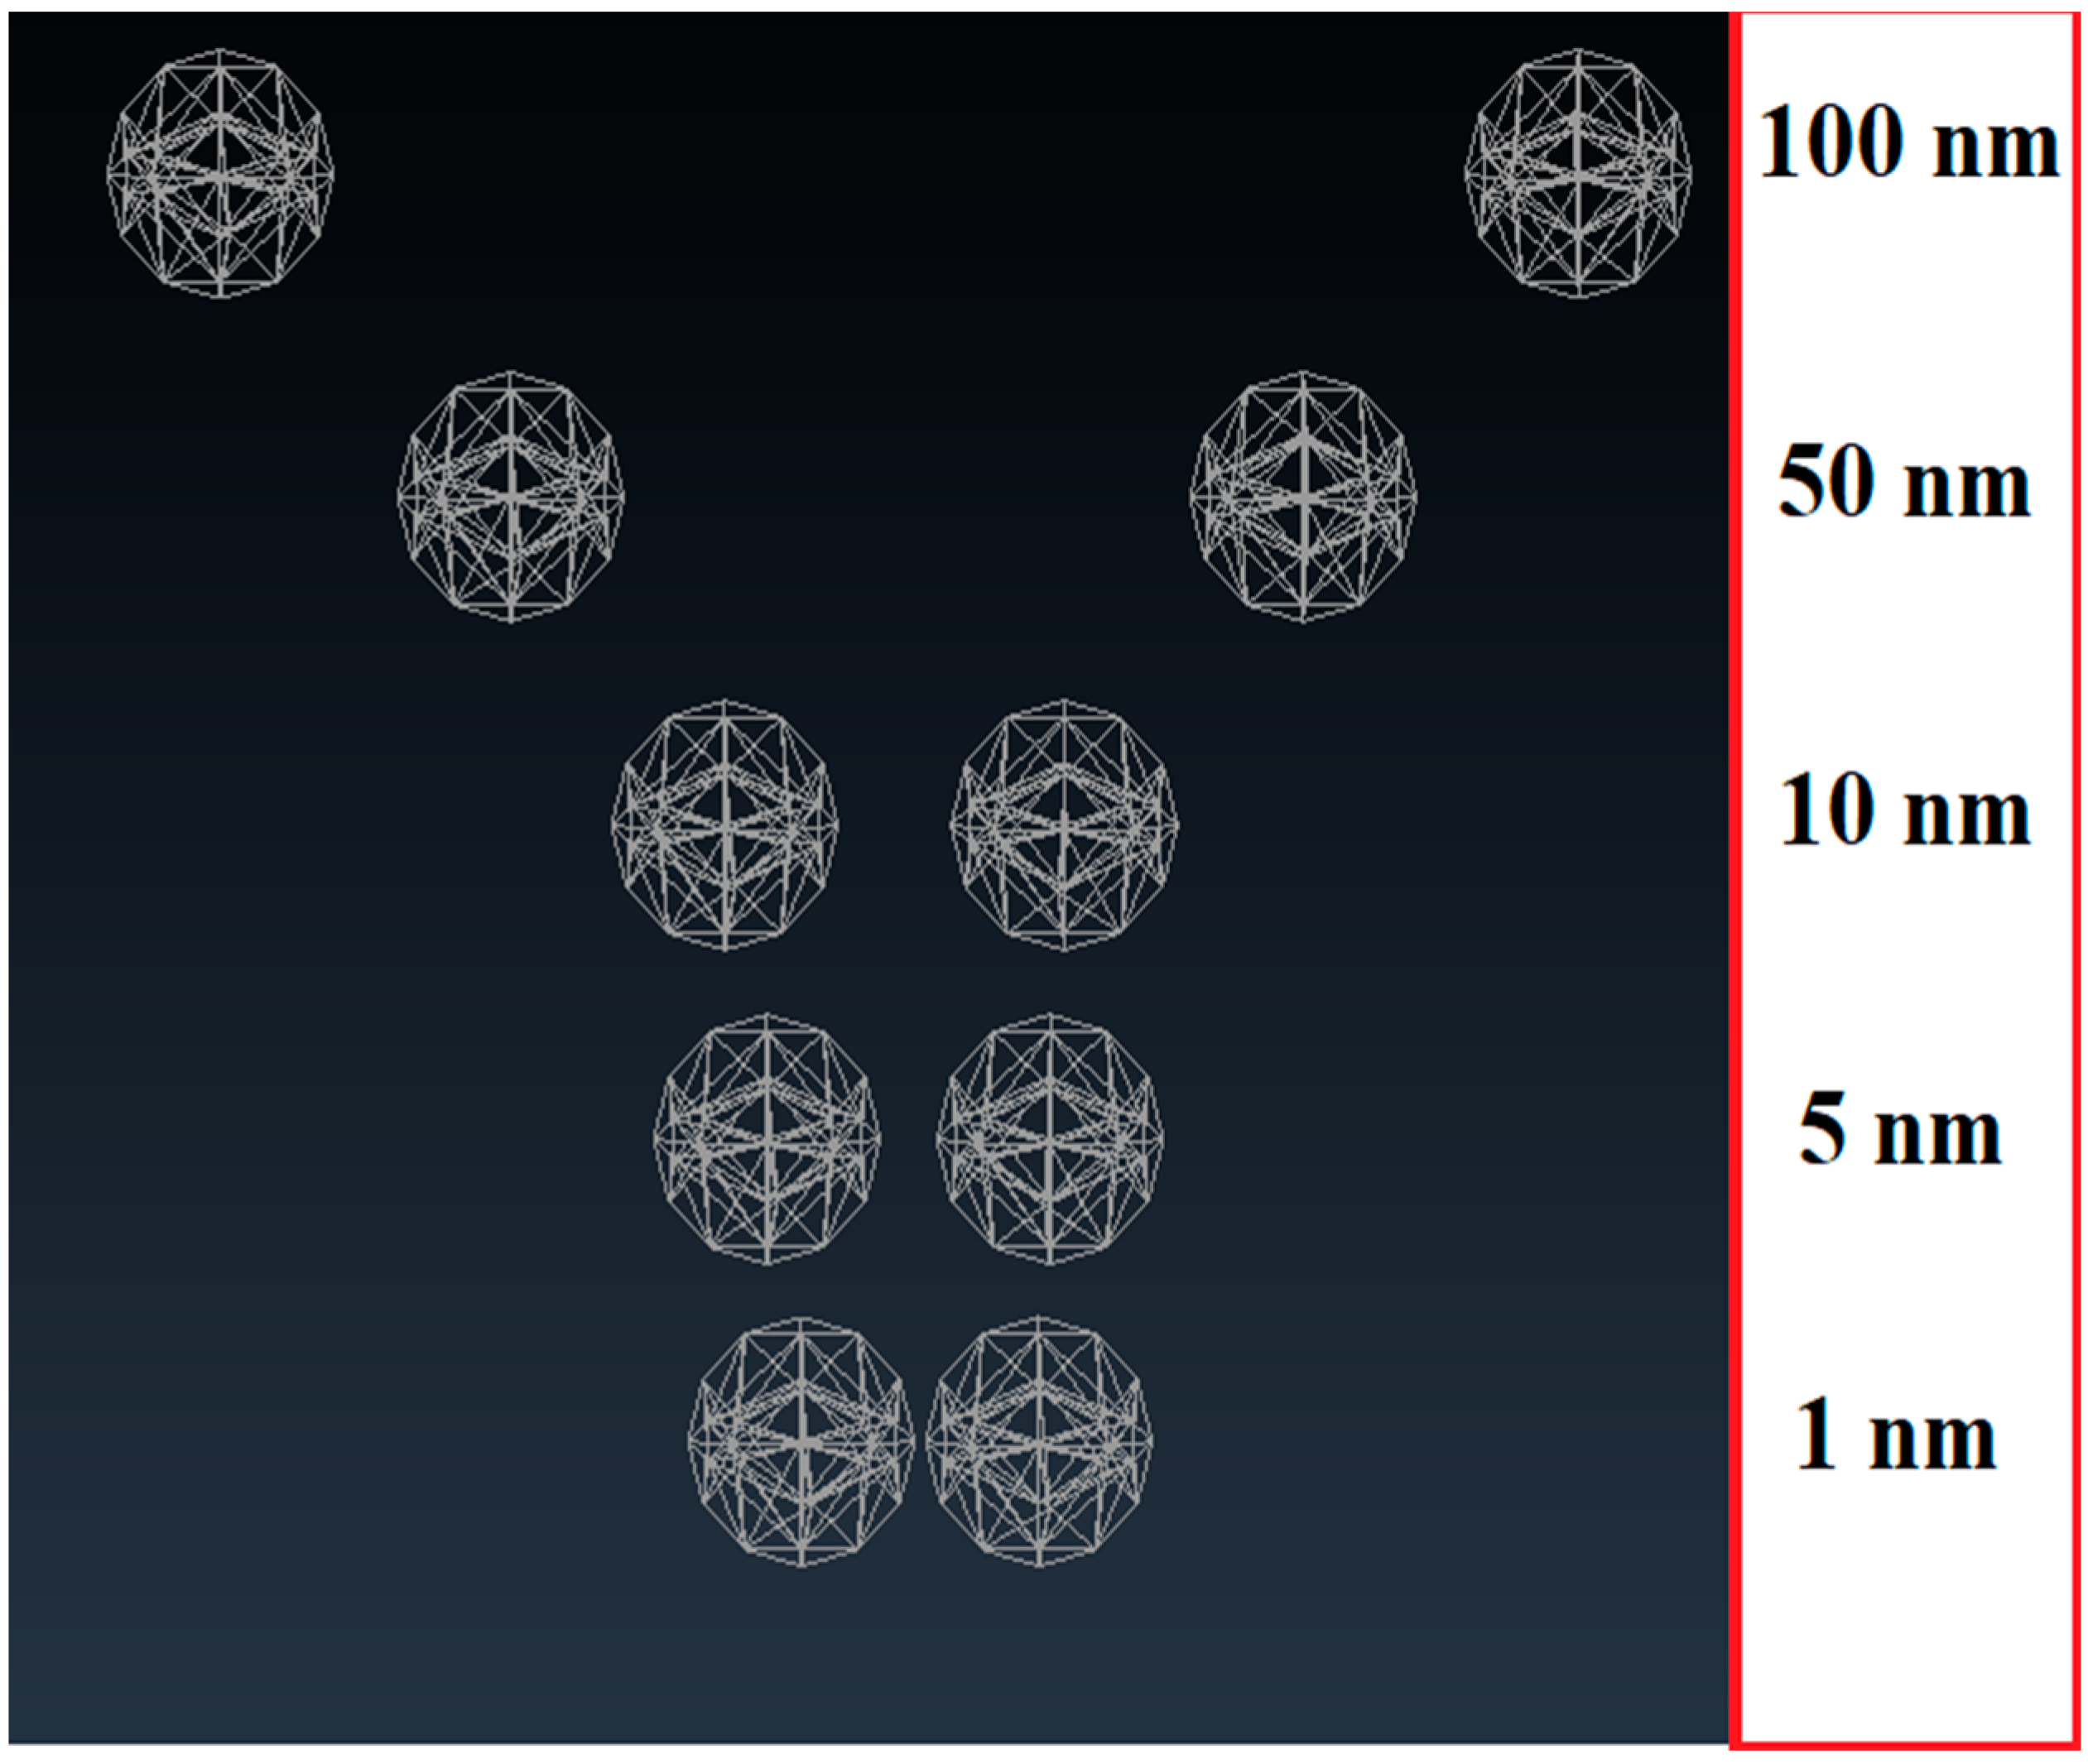
-17 gr) by two, and then applying equations (1) and (2). The two nanoparticles are simulated at different distances between them, in order to investigate the nearest neighbor distance effect. The chosen distance values, for both materials, are 1, 5, 10, 50 and 100 nm, as depicted in
Figure 8.
Figure 8.
FEM models of the simulated nanoparticles with distances of 1, 5, 10, 50 and 100 nm among them.
Figure 8.
FEM models of the simulated nanoparticles with distances of 1, 5, 10, 50 and 100 nm among them.
3.2.1. Material 1
The material with
fcc crystal structure is investigated at first.
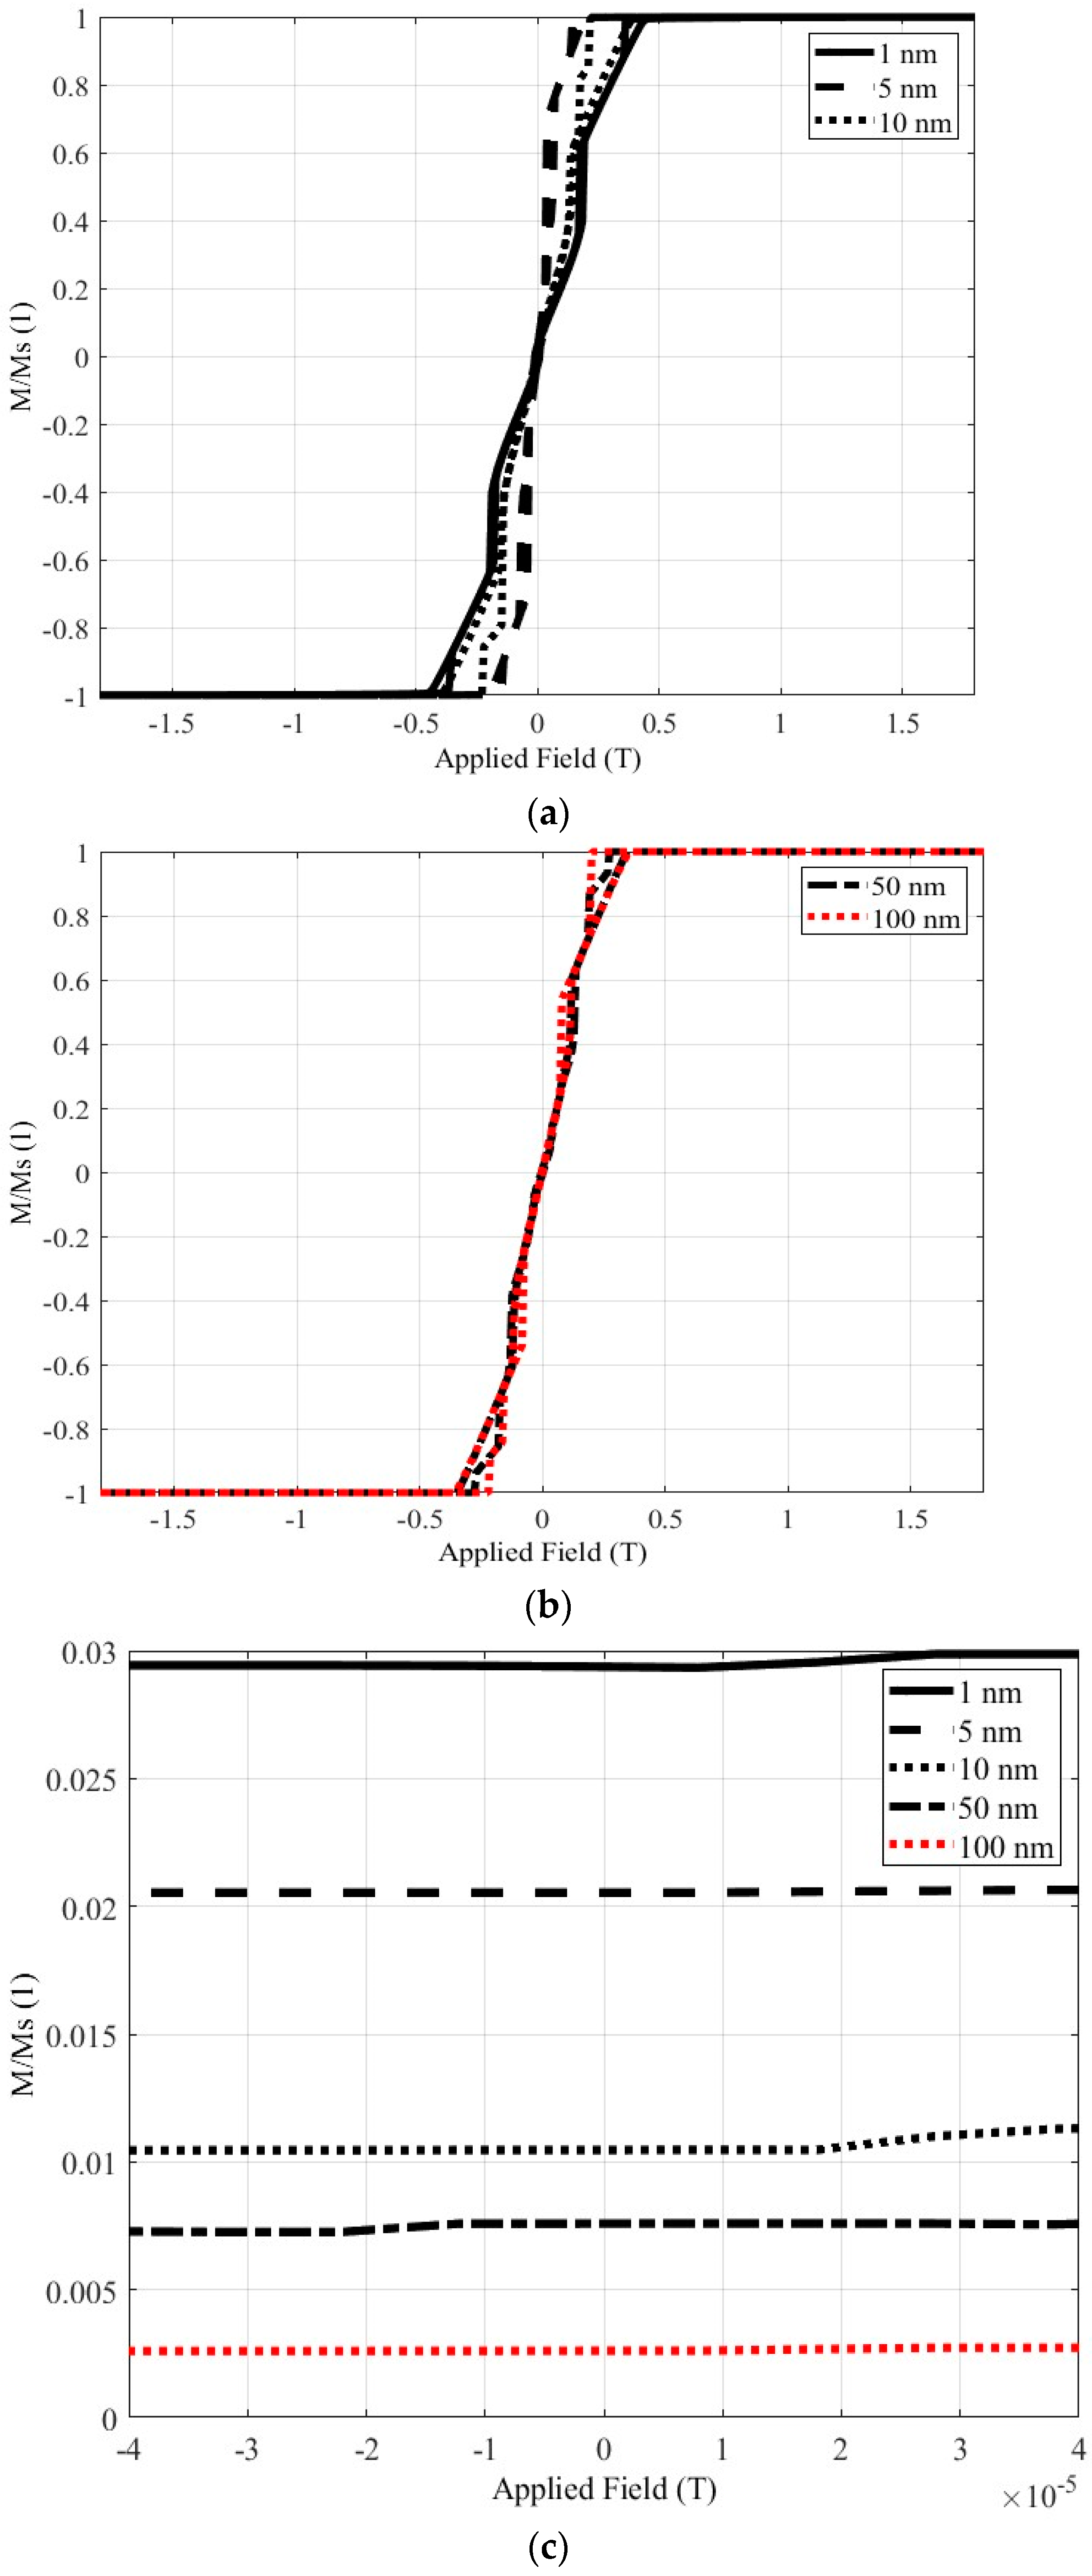
Figure 9a depicts the hysteresis loops of the material, when the two-nanoparticle distance is 1, 5 or 10 nm, while
Figure 9b shows the hysteresis loops of the material, when the two-nanoparticle distance is 50 or 100 nm.
Figure 9c focuses on the hysteresis loop’s section, which is close to the terrestrial magnetic field. In
Figure 9 and
Figure 10, investigating the effect of the distance, the results corresponding to 1, 5, 10, 50, and 100 nm distances between the nanoparticles are depicted with solid black, dashed black, dotted black, dashed-dotted black, and dotted red lines, respectively.
Figure 9c reveals decreasing magnetization values as the nanoparticle distance increases. More specifically, comparing the results for 1 and 100 nm distances, when the distance is a hundredfold, the magnetization decreases more than 10 times. The magnetization values, when the Earth’s magnetic field is applied to Material 1 are also summarized in
Table 1 for all investigated distances. These results are well known in the literature, and they are used to validate the soundness of the simulation approach.
Table 1.
The magnetization values when the Earth’s magnetic field is applied in Material 1.
Table 1.
The magnetization values when the Earth’s magnetic field is applied in Material 1.
| Nanoparticles Distance |
M/MS (1) |
Magnetization (emu/gr) |
| 1 nm |
0.0294 |
4.939 |
| 5 nm |
0.0205 |
3.444 |
| 10 nm |
0.0104 |
1.747 |
| 50 nm |
0.0072 |
1.209 |
| 100 nm |
0.0026 |
0.436 |
Figure 9.
The hysteresis loop of Material 1. (a) The complete loop for nanoparticle distances 1, 5 and 10 nm. (b) The complete loop for nanoparticle distances 50 and 100 nm. (c) The part of the loop focused in the area of the Earth’s magnetic field.
Figure 9.
The hysteresis loop of Material 1. (a) The complete loop for nanoparticle distances 1, 5 and 10 nm. (b) The complete loop for nanoparticle distances 50 and 100 nm. (c) The part of the loop focused in the area of the Earth’s magnetic field.
3.2.2. Material 2
Next, the same study is conducted, for the material with the
hcp crystal structure (Material 2), as it can be seen in
Figure 10.
Figure 10.
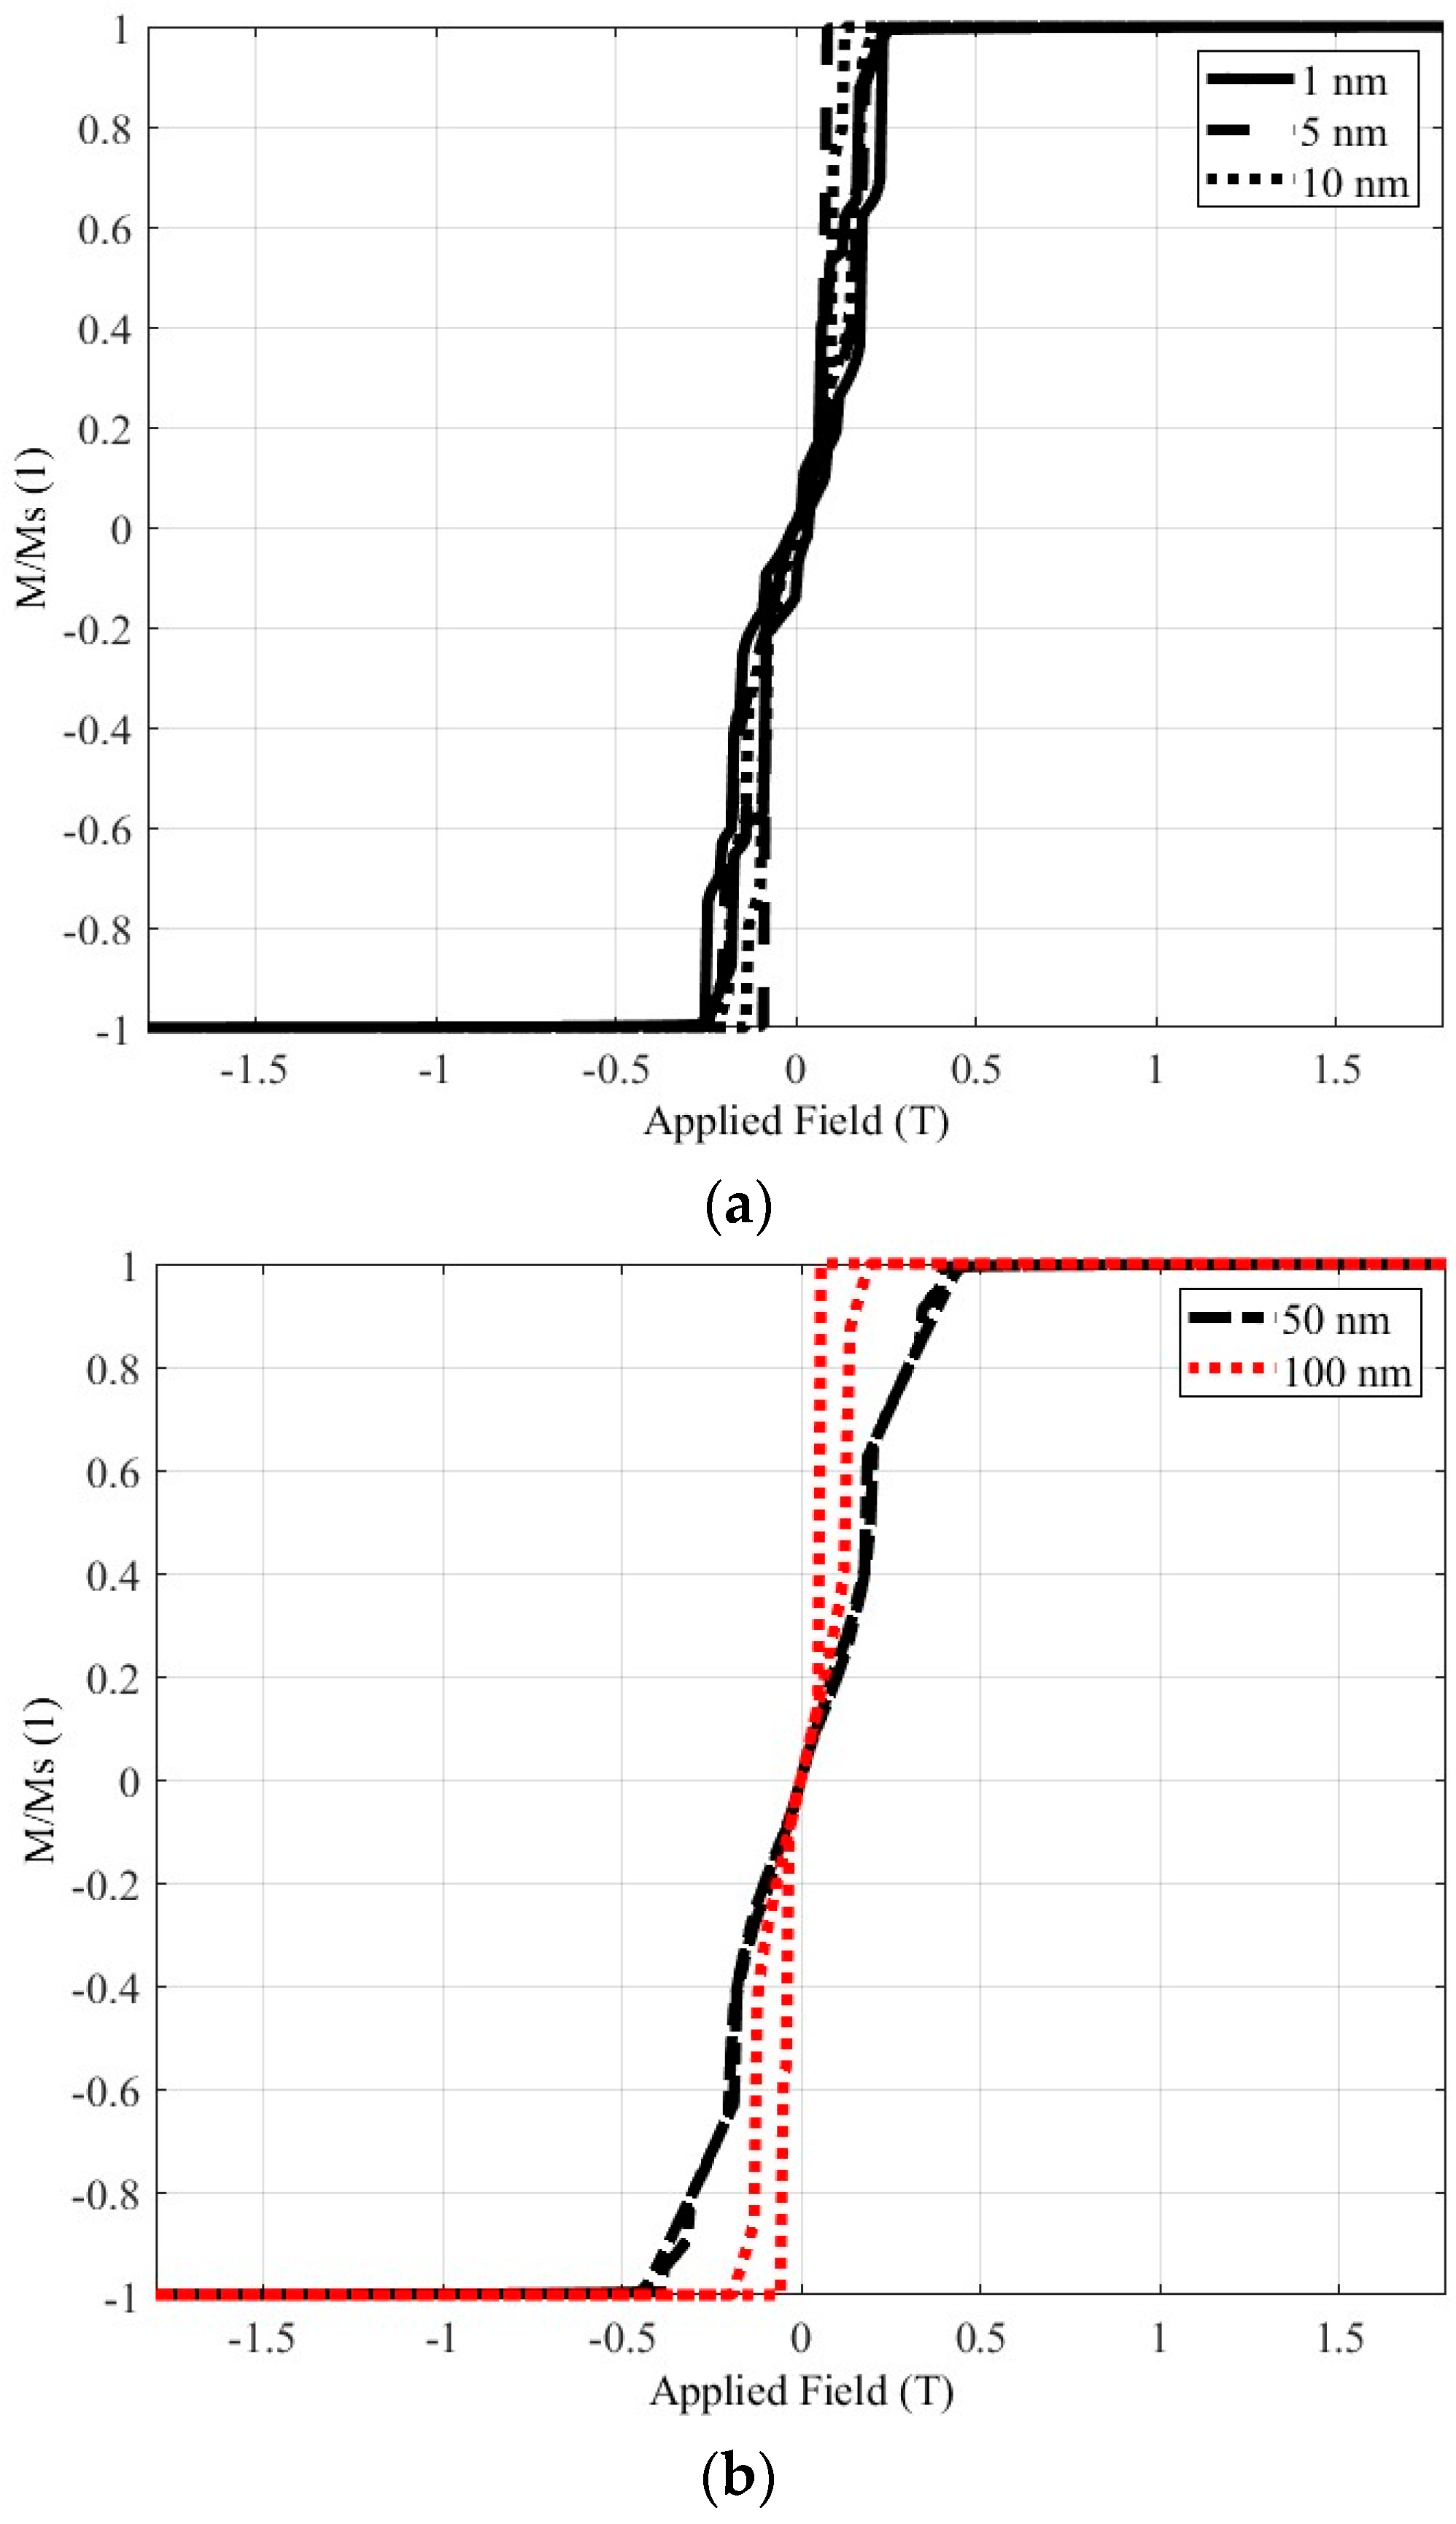
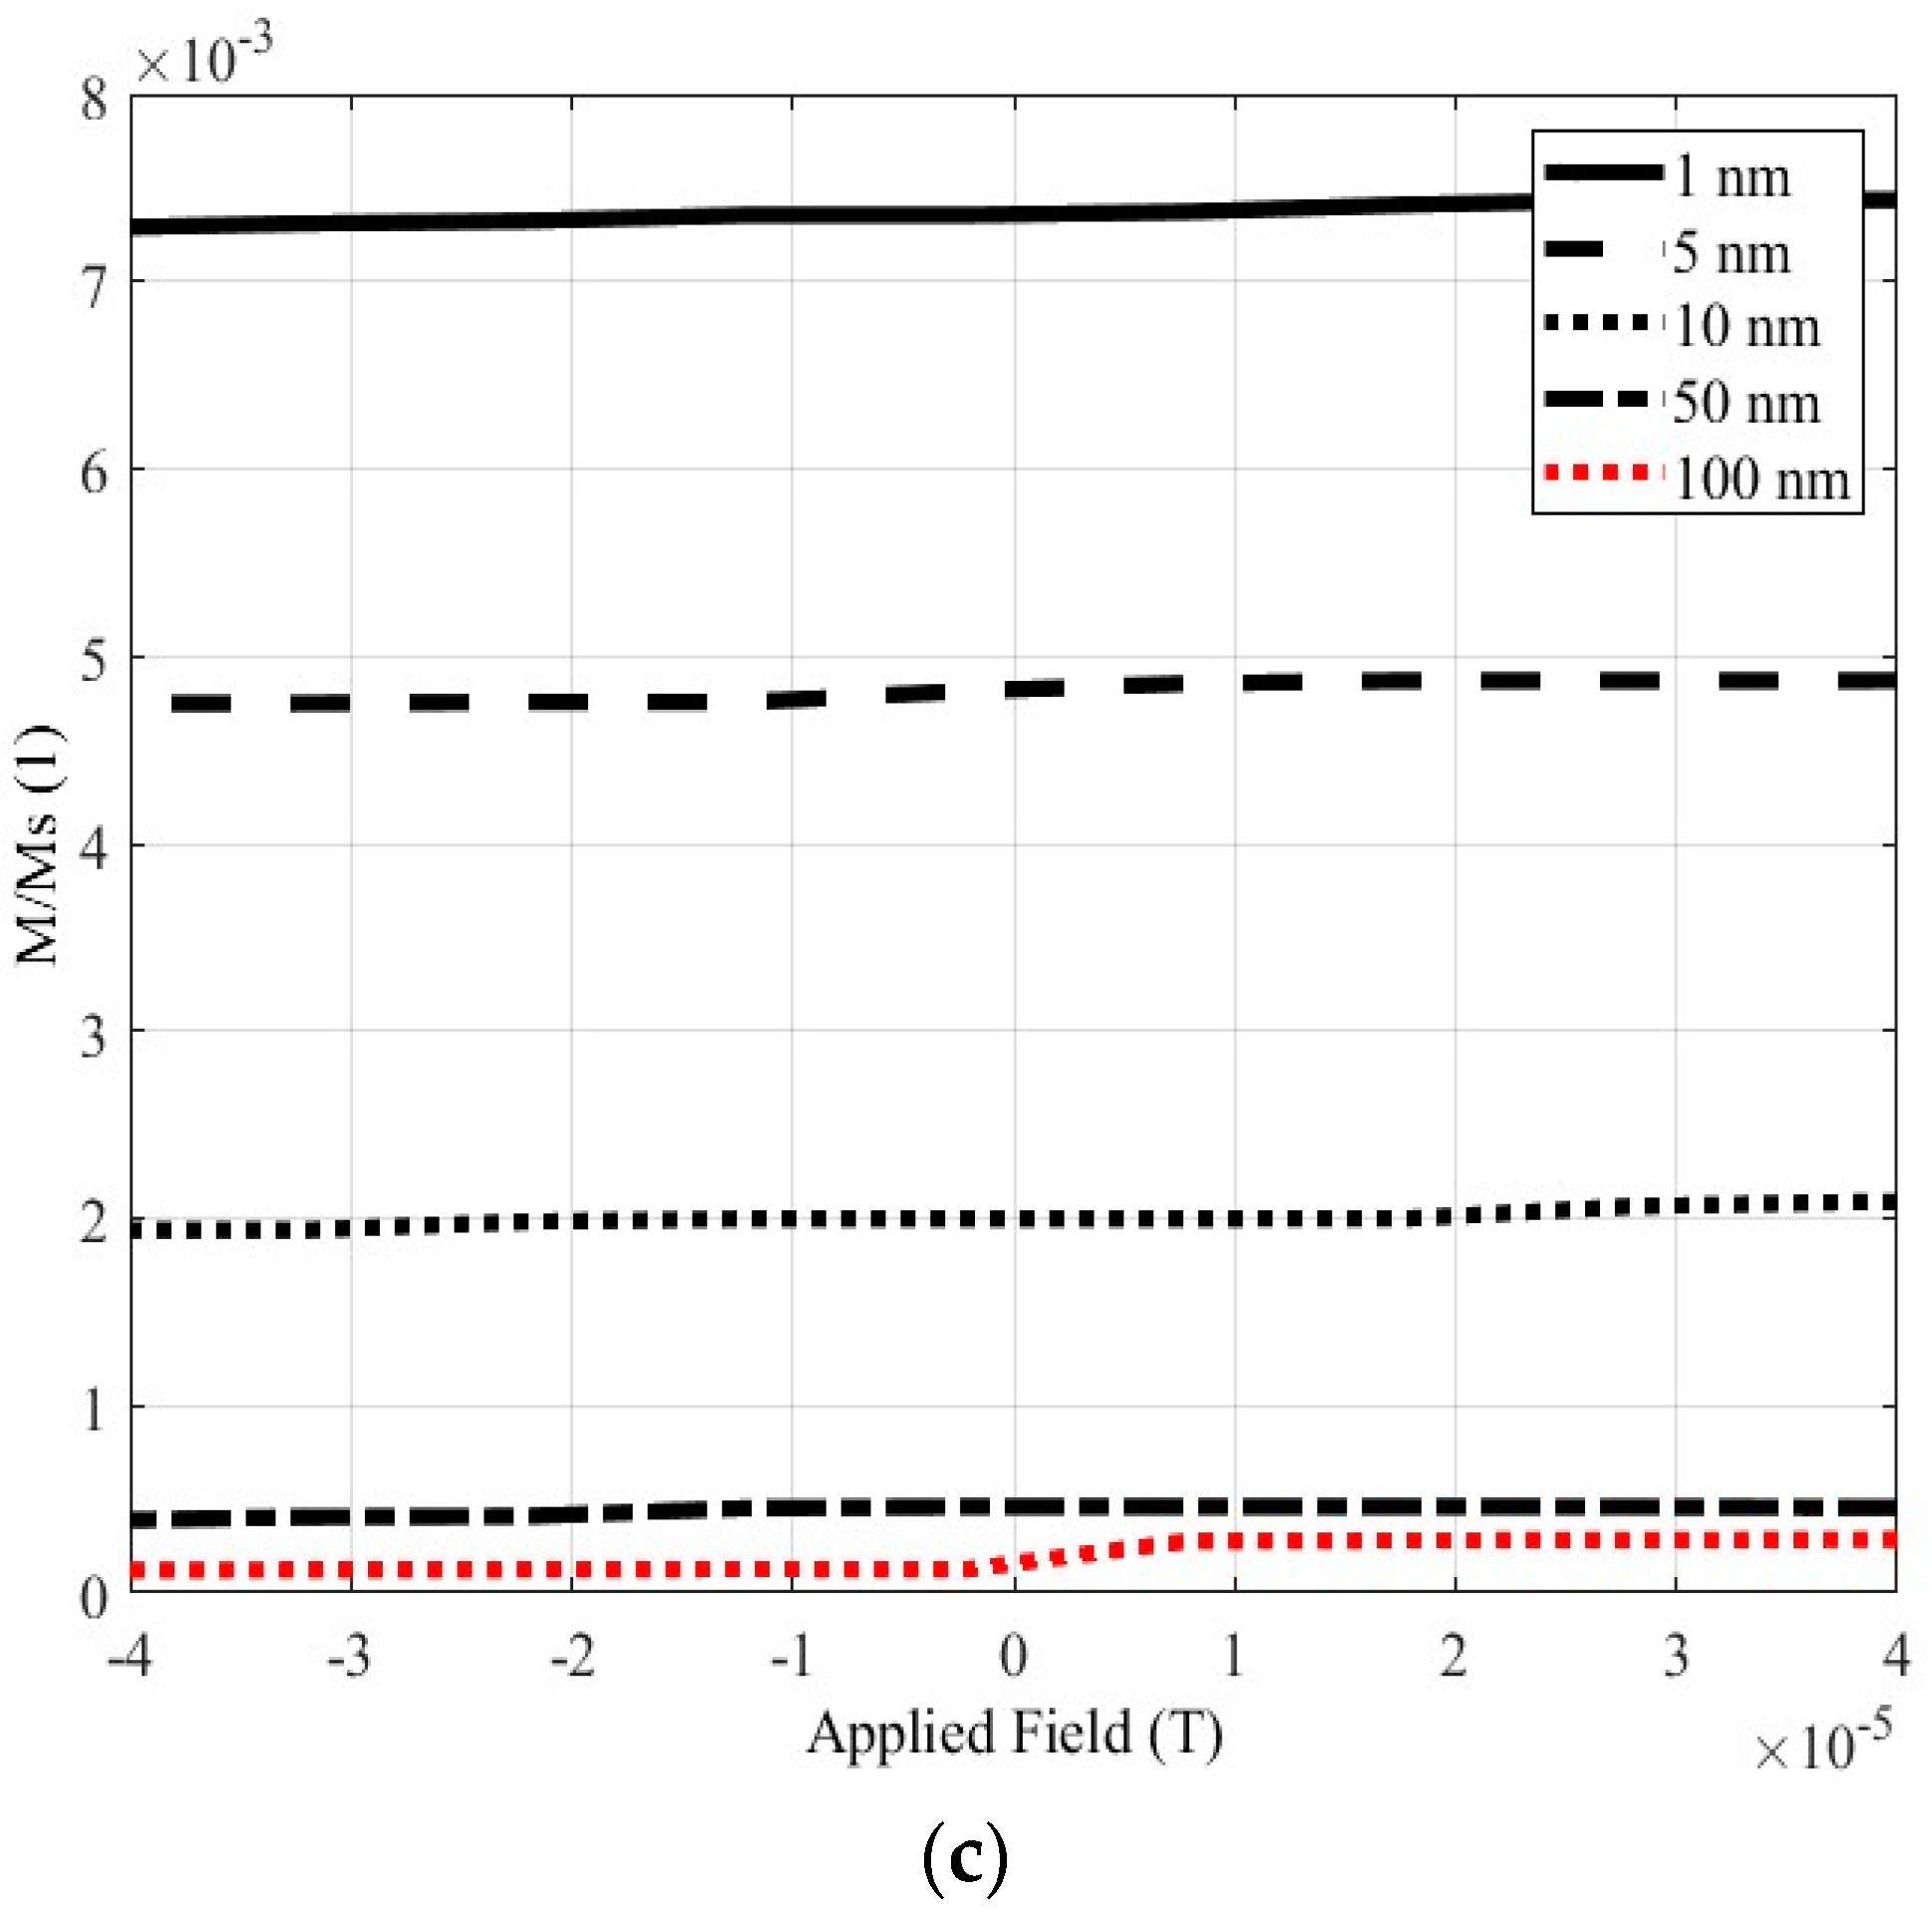
The hysteresis loop of Material 2. (a) The complete loop for nanoparticle distances 1, 5 and 10 nm. (b) The complete loop for nanoparticle distances 50 and 100 nm. (c) The part of the loop in the area of the Earth’s magnetic field.
Figure 10.
The hysteresis loop of Material 2. (a) The complete loop for nanoparticle distances 1, 5 and 10 nm. (b) The complete loop for nanoparticle distances 50 and 100 nm. (c) The part of the loop in the area of the Earth’s magnetic field.
In the same manner as in the case of the previous paragraph,
Figure 10a and Figure 10b depict the complete hysteresis loops, while
Figure 10c shows the part of the loop in the area of the Earth’s magnetic field. The conclusions will be similar to the case the material has
fcc crystal structure. The distance between the nanospheres, affects the magnetization value, when the earth magnetic field is enforced in the material. More specifically, the increment of the distance between the nanoparticles, leads to the decrement of the magnetization value. The
hcp material sample, similarly to the
fcc sample, presents the magnetization decrement, when the distance increases. In this case however, the increment of the distance by a factor of 100, decreases the magnetization by far more than tenfold. The decrement in every case can be estimated, observing the
Table 2, which summarizes the magnetization in the region of the earth magnetic field for each nanoparticle distance.
Table 2.
The magnetization values, when the Earth’s magnetic field is applied in Material 2.
Table 2.
The magnetization values, when the Earth’s magnetic field is applied in Material 2.
| Nanoparticles Distance |
M/MS (1) |
Magnetization (emu/gr) |
| 1 nm |
0.0073 |
1.095 |
| 5 nm |
0.0047 |
0.705 |
| 10 nm |
0.0019 |
0.285 |
| 50 nm |
0.0004 |
0.060 |
| 100 nm |
0.0001 |
0.015 |
3.3. Impact on the Hysteresis Loop due to nanoparticles multitude
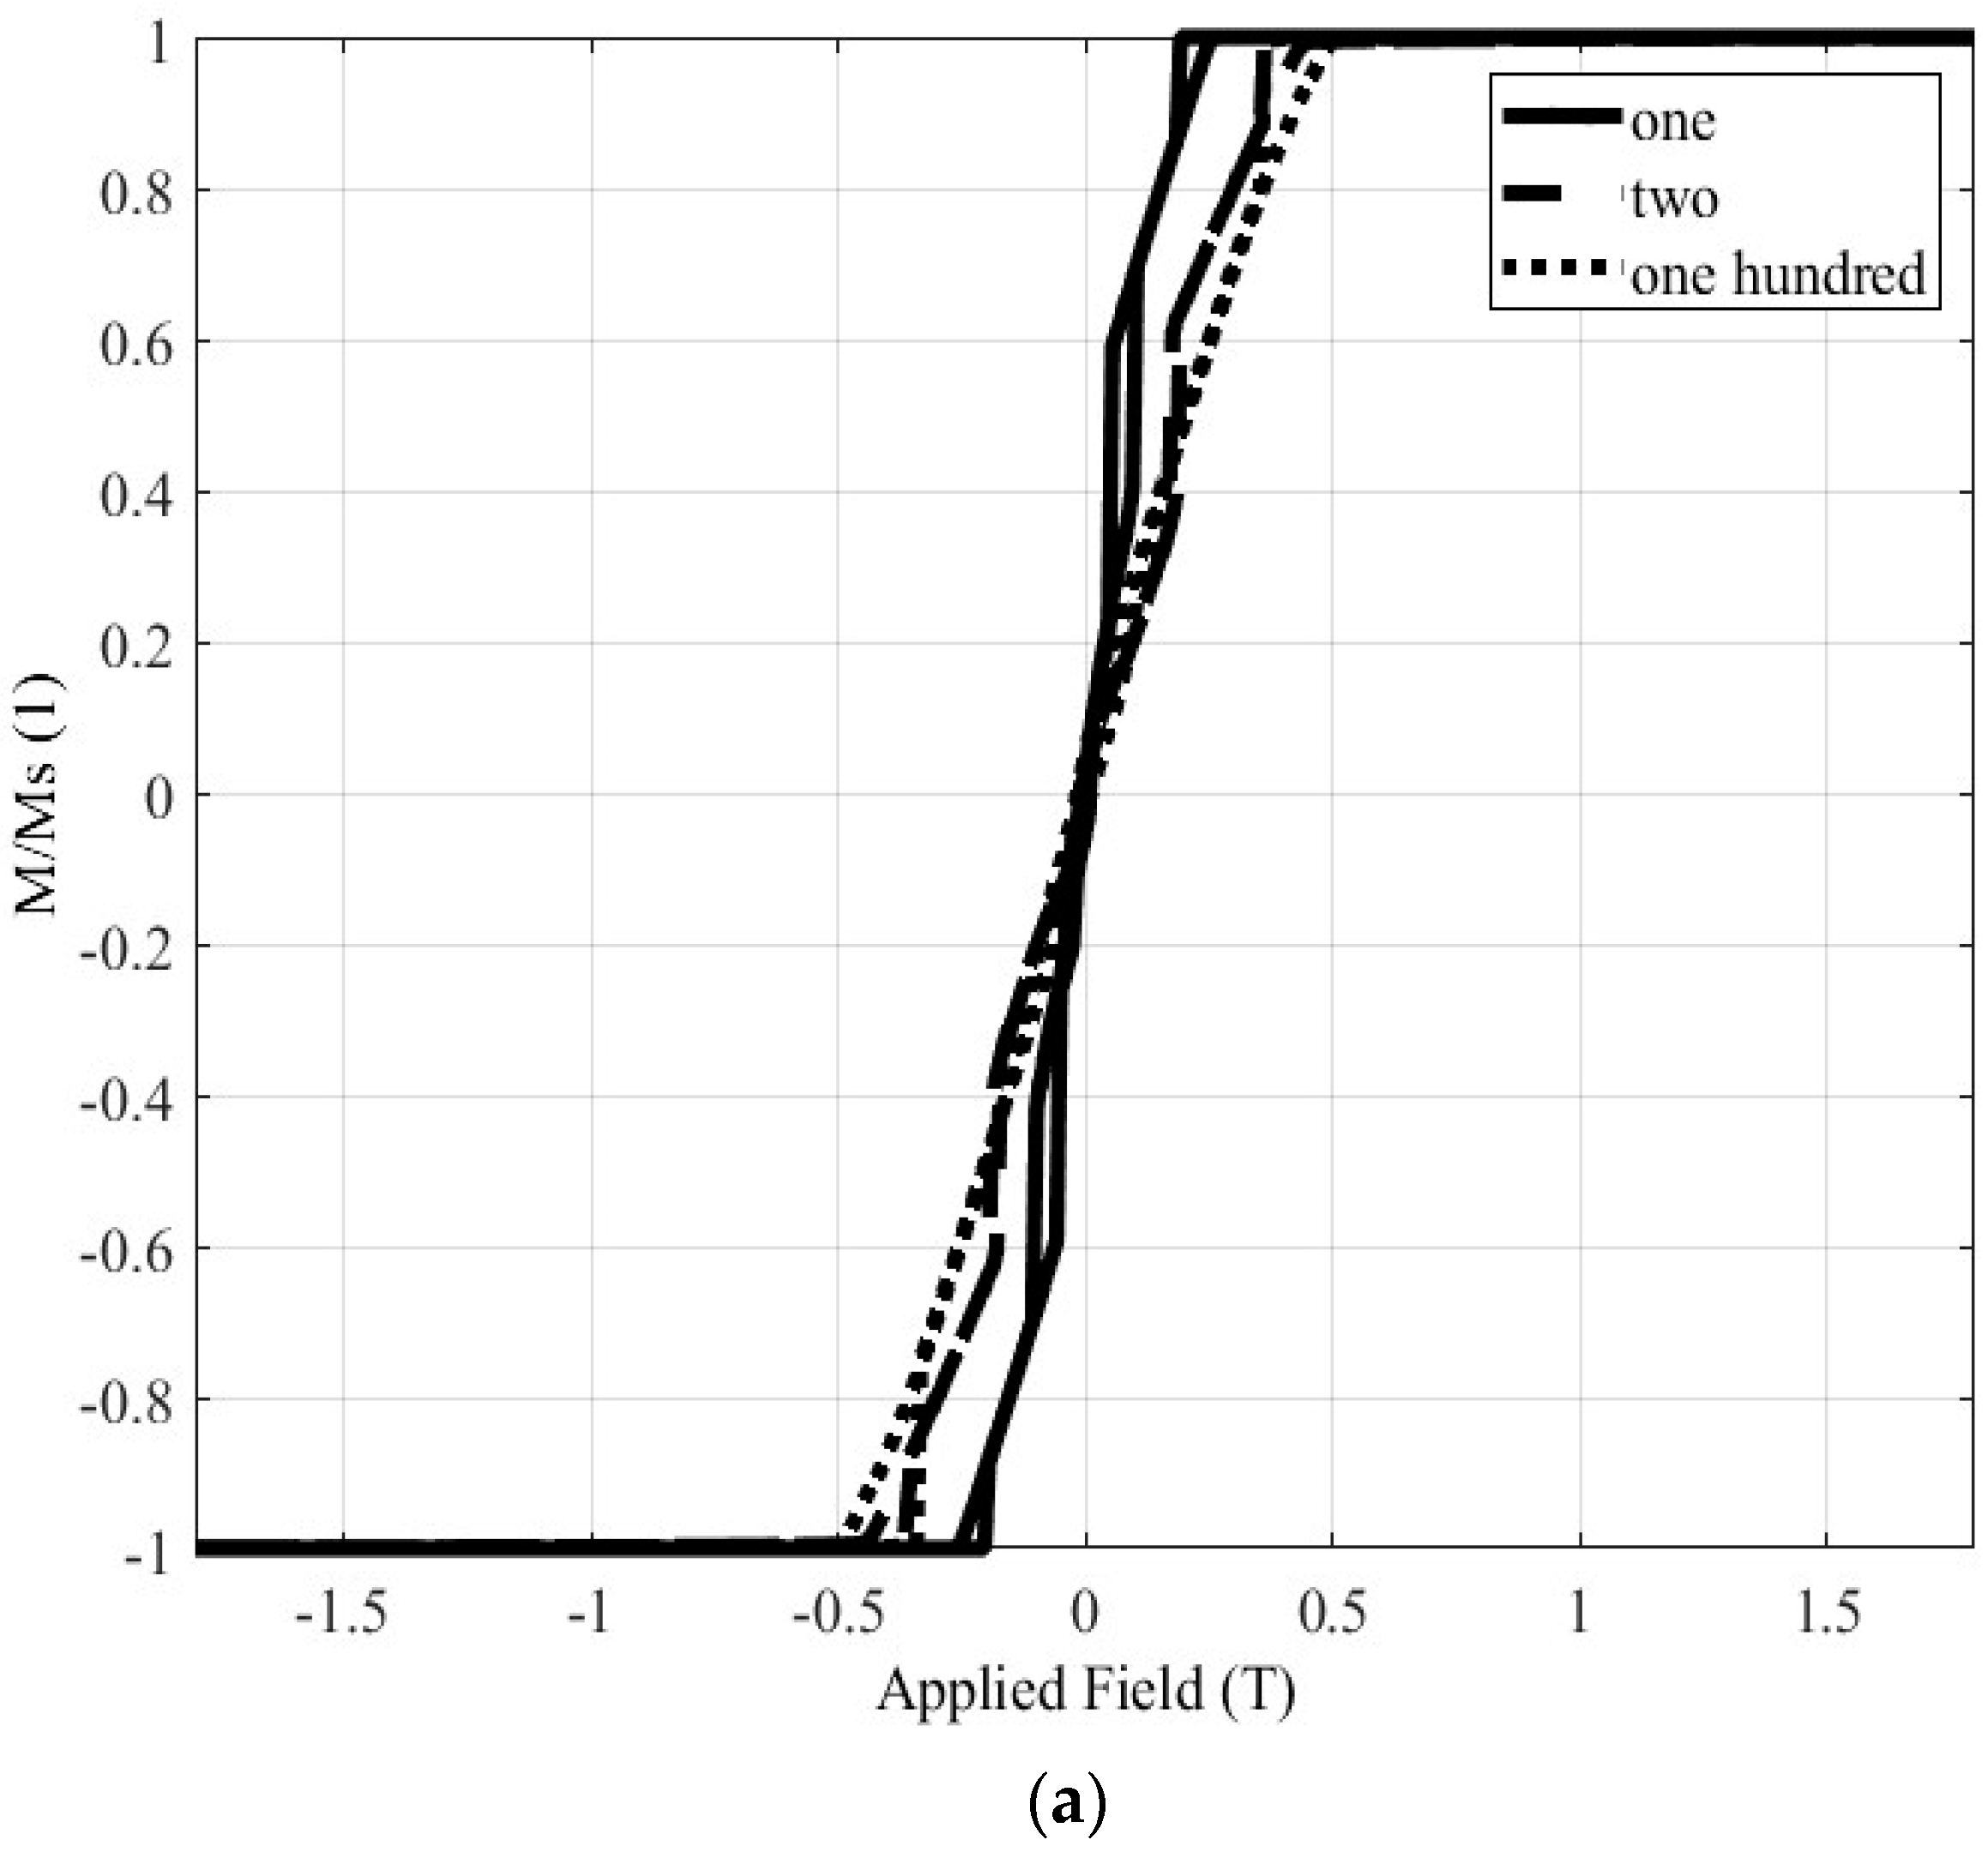
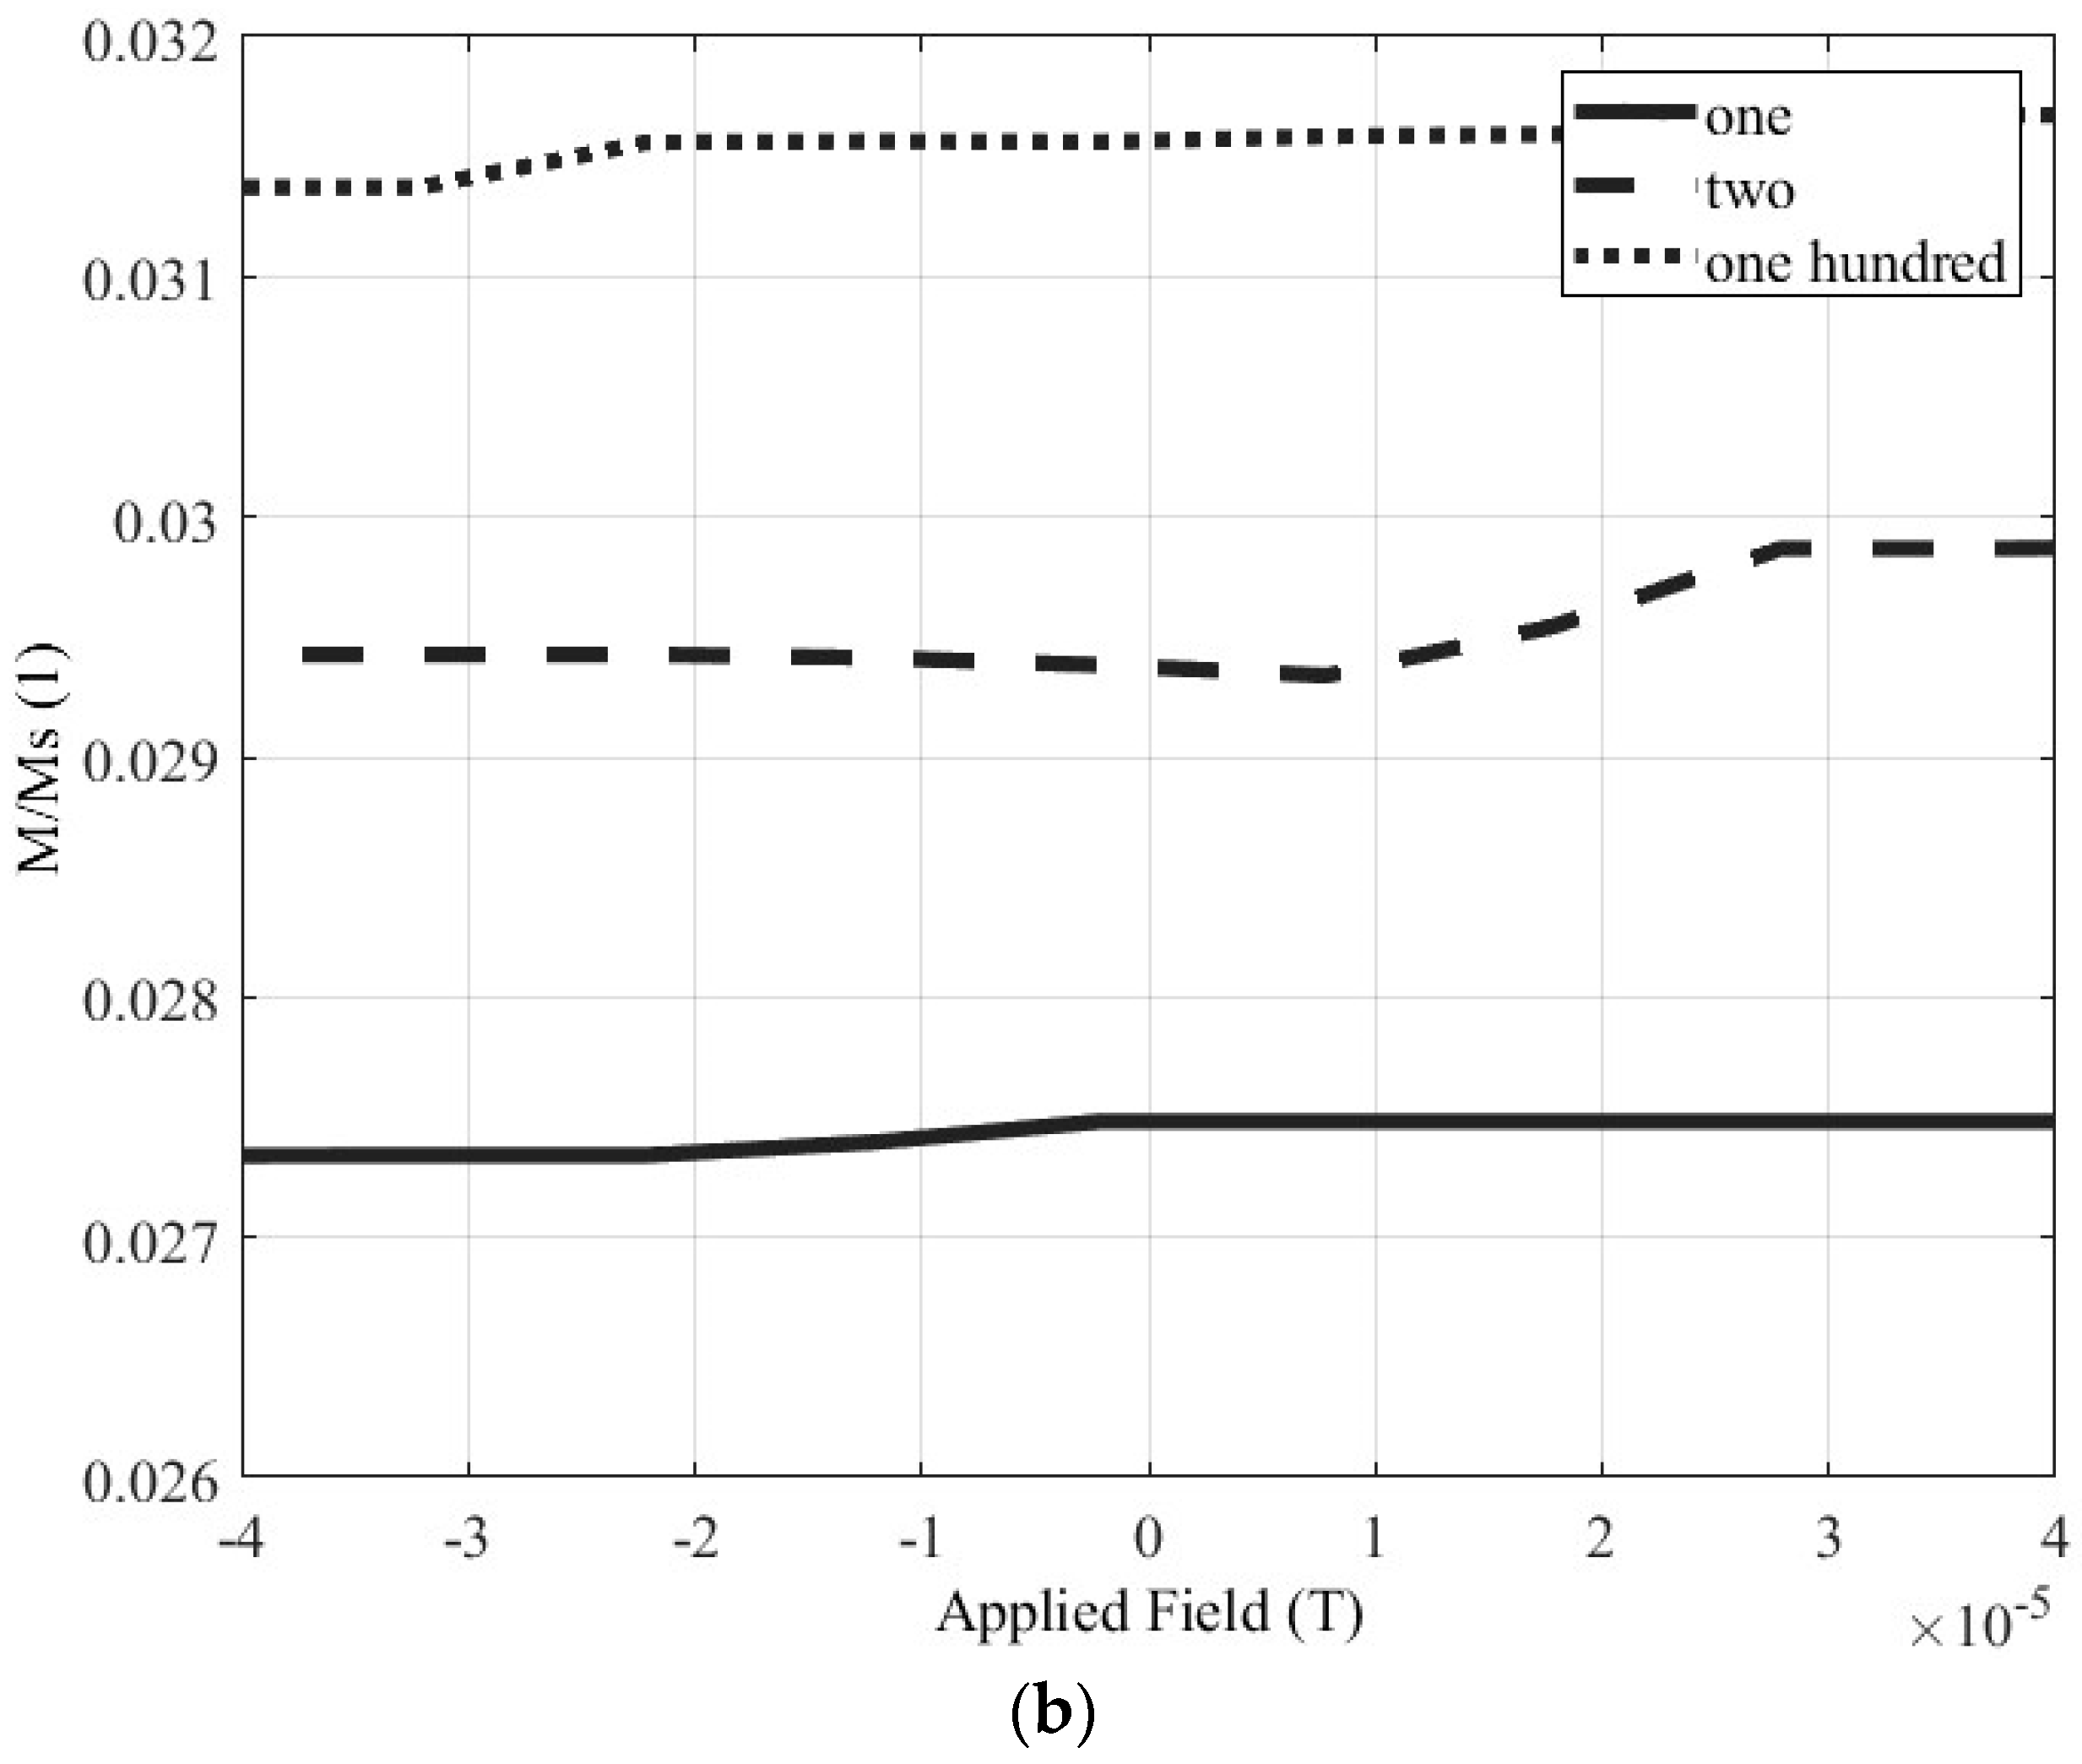
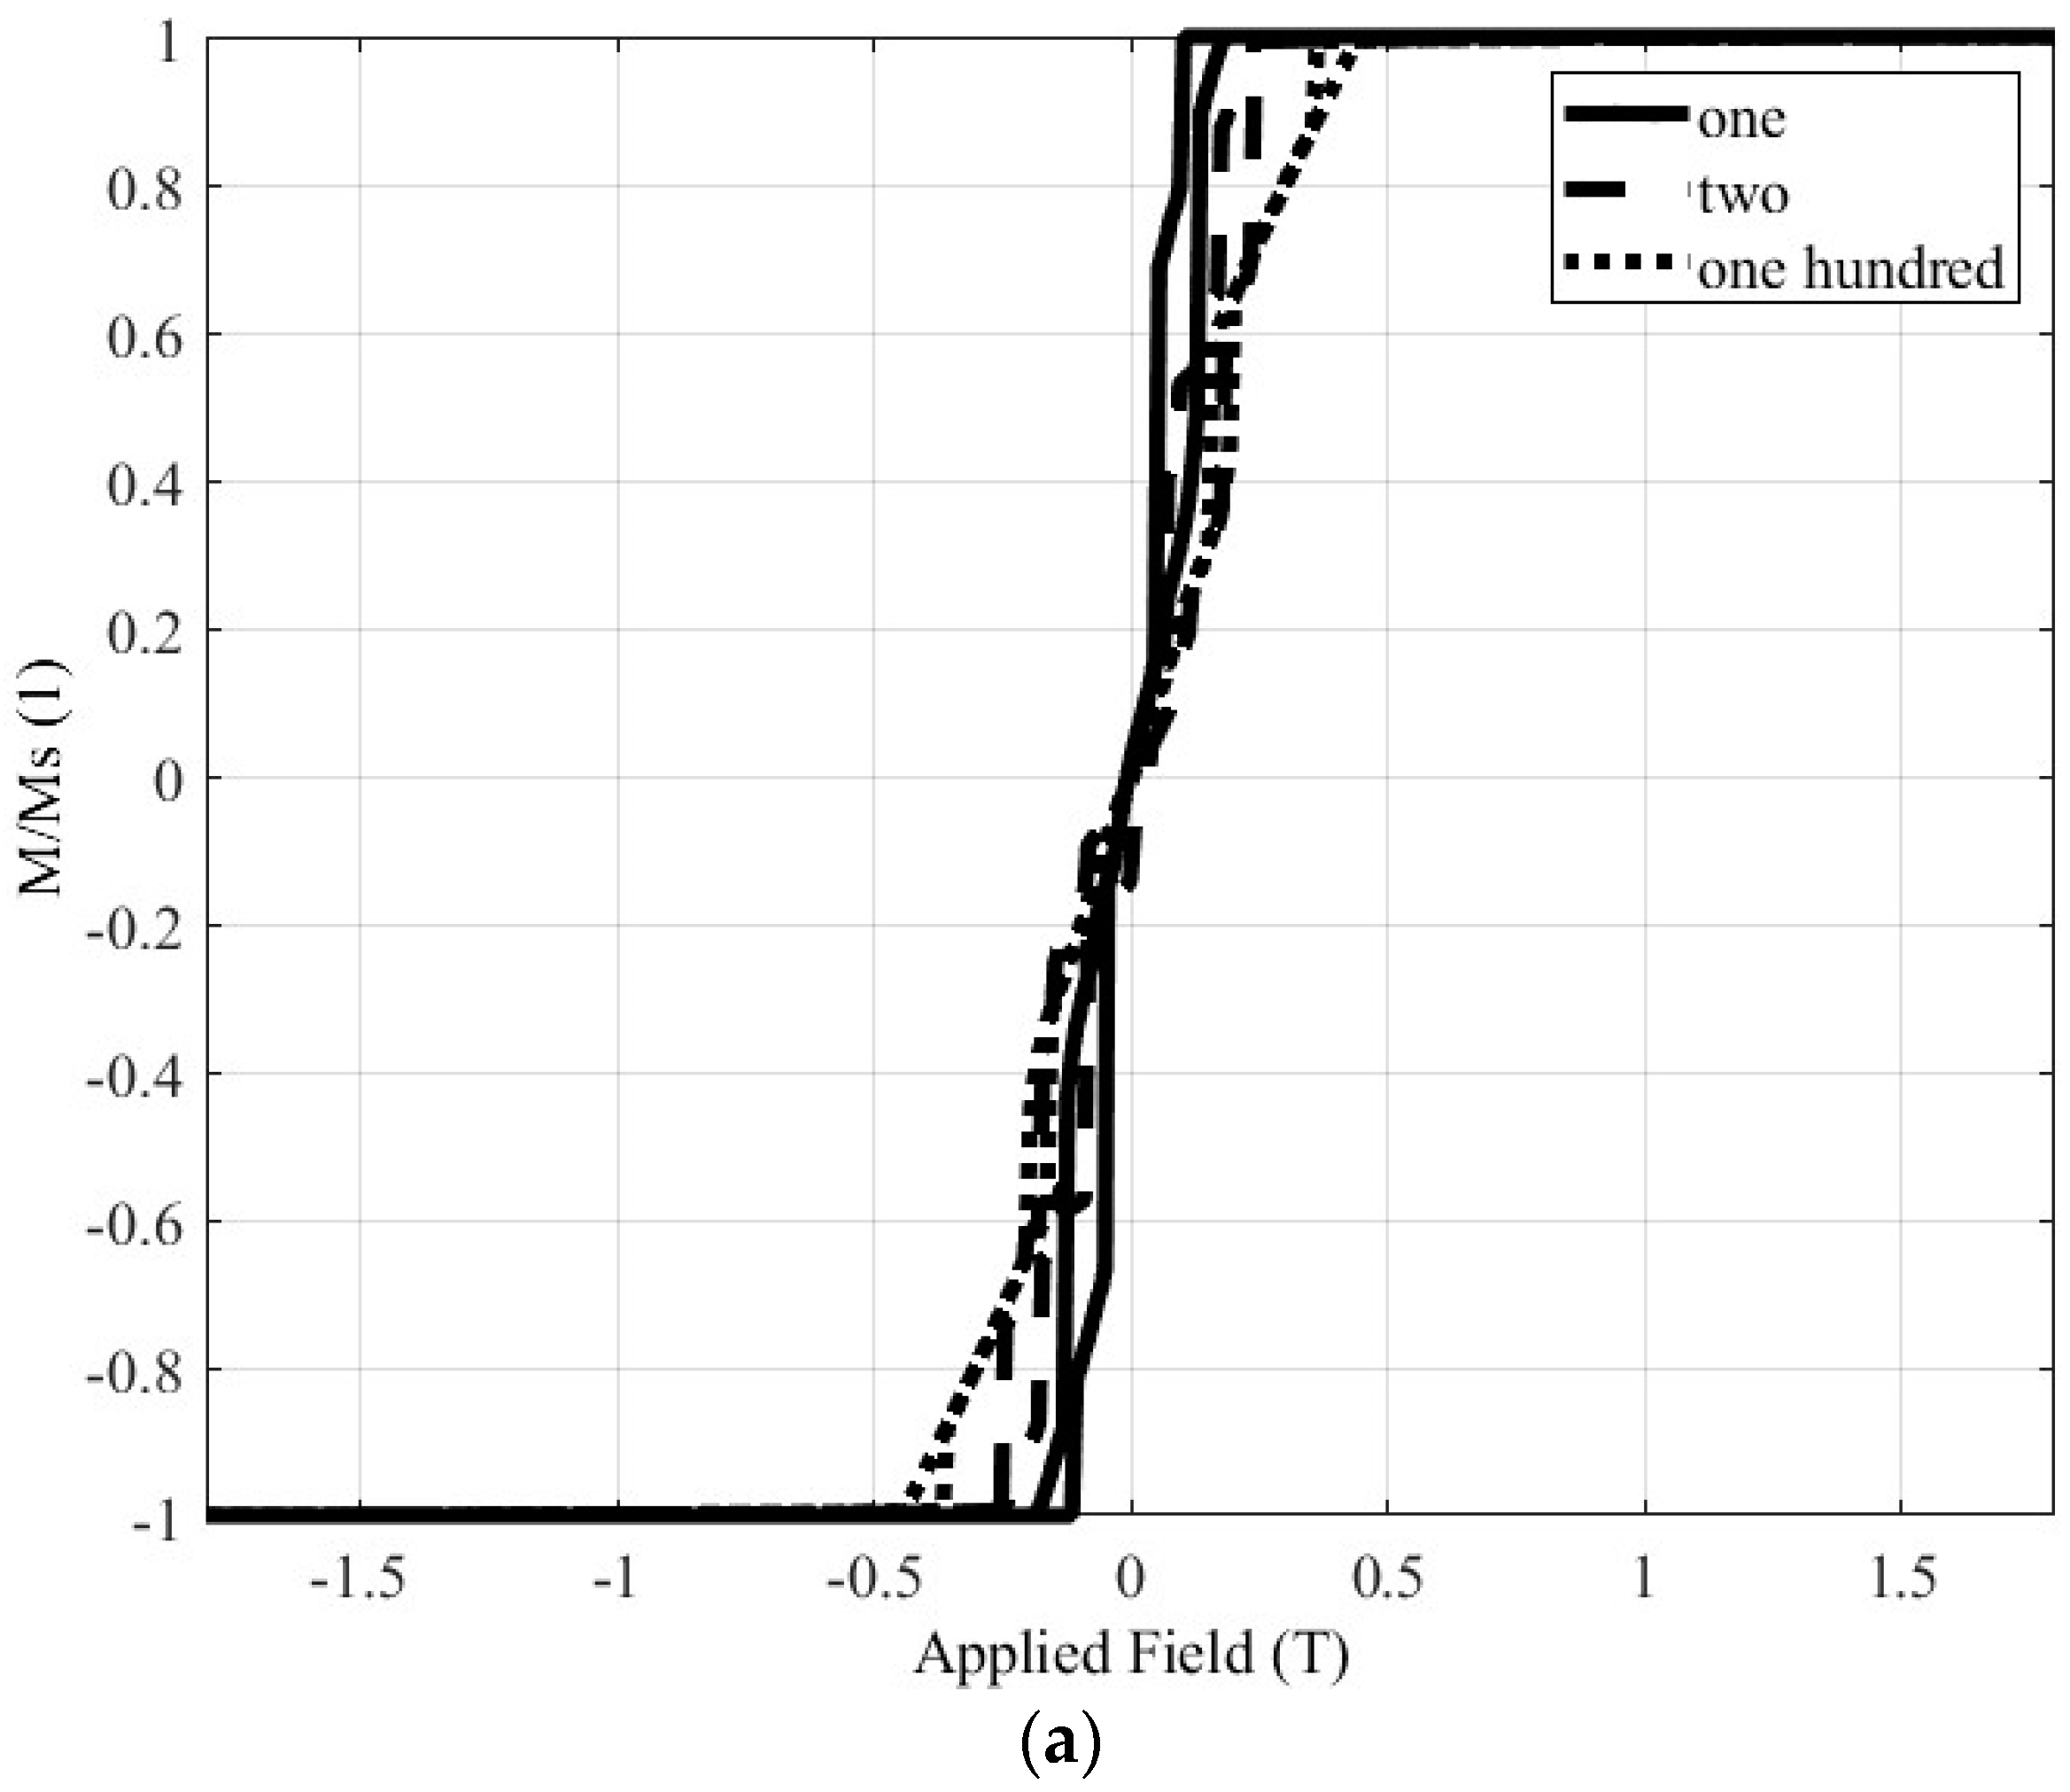
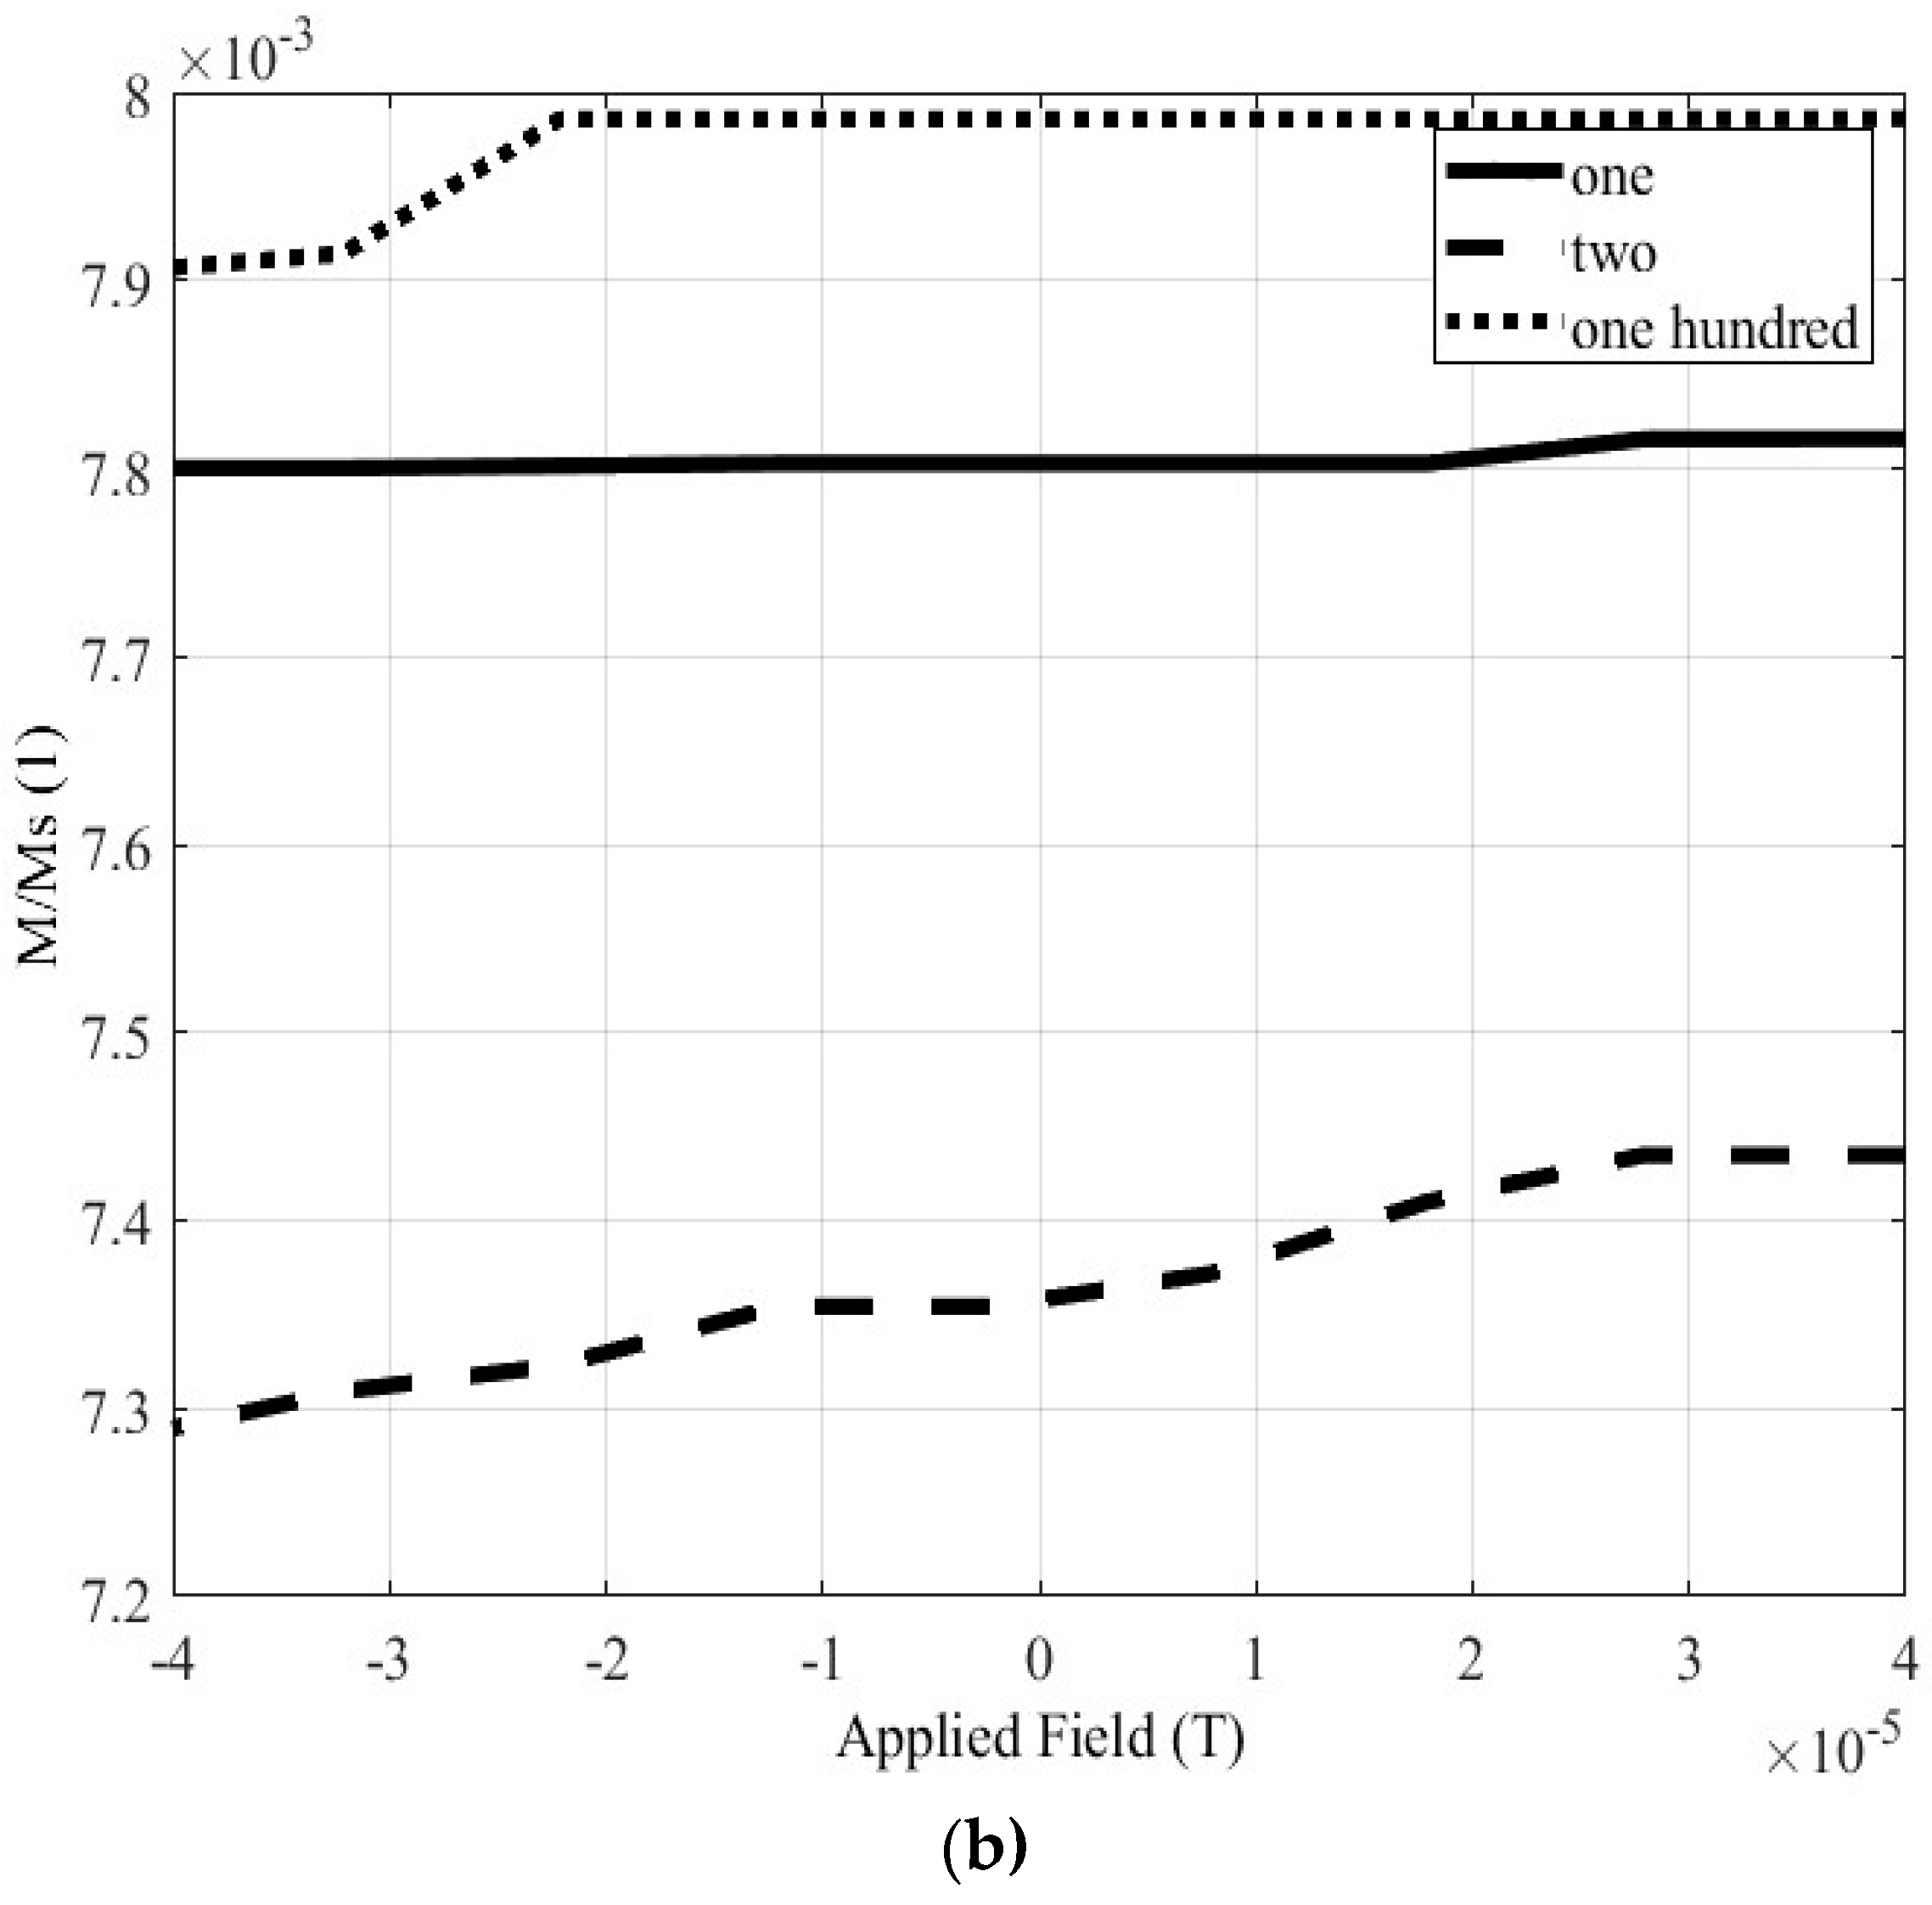
In this section, the multitude of the nanoparticles is taken into account. The comparisons are carried out preserving the total mass of the sample material, but changing the number of total nanoparticles, in the same manner as in the previous paragraph using equations (1) and (2). The investigated cases refer to 1, 2 and 100 nanoparticles, having radii equal to 12.6, 10, and 2.7 nm, respectively in each simulation set, when the nanoparticle distance is set equal to 1 nm for both Materials 1 and 2.
3.3.1. Material 1
The influence of the nanoparticle number on the hysteresis loop is studied for the material with
fcc crystal structure at first. The results of the simulation analysis are depicted in
Figure 11. In
Figure 11 and
Figure 12, the results for 1, 2 and 100 nanoparticles are depicted with solid, dashed and dotted lines, respectively.
Figure 11a depicts the complete hysteresis loop, while
Figure 11b focuses on the area of the Earth’s magnetic field.
Figure 11b reveals that the number of nanoparticles has almost no influence to the magnetization value, when the Earth’s field is applied to the catalyst. The same conclusions can be drawn from
Table 3, which quantifies the magnetization values. The average magnetization of the three values of
Table 3 is approximately 4.939 emu/gr, or in other words very close to the experimental value. This conclusion can be exploited in order to reduce the simulation time, simplifying the simulation process. After all, the simulation of an enormous number of nanospheres is a time-consuming procedure, which even most commercial simulation software packages may find difficult to support.
Table 3.
The magnetization values, when the Earth’s magnetic field is applied in Material 1.
Table 3.
The magnetization values, when the Earth’s magnetic field is applied in Material 1.
| Nanoparticles Multitude |
M/MS (1) |
Magnetization (emu/gr) |
| 1 |
0.0274 |
4.603 |
| 2 |
0.0294 |
4.939 |
| 100 |
0.0314 |
5.275 |
Figure 11.
The hysteresis loop of Material 1 for different nanoparticle number (1, 2 and 100). (a) The complete loop. (b) The part of the loop in the area of Earth’s magnetic field.
Figure 11.
The hysteresis loop of Material 1 for different nanoparticle number (1, 2 and 100). (a) The complete loop. (b) The part of the loop in the area of Earth’s magnetic field.
3.3.2. Material 2
Next, the material with the
hcp crystal structure is investigated, and simulations are done for the same cases: one, two and one hundred nanoparticles. The complete hysteresis loop is shown in
Figure 12a, while
Figure 12b depicts the magnetization when the terrestrial magnetic field is enforced to the Material 2. Then,
Table 4 summarizes the magnetization values of the Material 2 for this magnetic field. The magnetization values of each case, nearly identical, while the average magnetization is roughly 1.15 emu/gr.
Similarly to the previous case, where the fcc Co is simulated, it can be seen that when the terrestrial magnetic field is enforced, the magnetization value is almost not affected by the number of the nanoparticles, provided that the total material mass remains the same. The validation of this conclusion also for the second material, enhances its correctness and open the way for less time-consuming simulations.
Figure 12.
The hysteresis loop of Material 2 for different nanoparticle numbers (1, 2 and 100). (a) The complete loop. (b) The part of the loop in the area of the Earth’s magnetic field.
Figure 12.
The hysteresis loop of Material 2 for different nanoparticle numbers (1, 2 and 100). (a) The complete loop. (b) The part of the loop in the area of the Earth’s magnetic field.
Table 4.
The magnetization values, when the Earth’s magnetic field is applied in Material 2.
Table 4.
The magnetization values, when the Earth’s magnetic field is applied in Material 2.
| Nanoparticles Multitude |
M/MS (1) |
Magnetization (emu/gr) |
| 1 |
0.0078 |
1.170 |
| 2 |
0.0073 |
1.095 |
| 100 |
0.0079 |
1.185 |
4. Discussion
In this article the impact of the distance betwixt the nanoparticles as well as the nanoparticle number, on the hysteresis loop of Co based catalytic materials, are analyzed. The study contains simulation and experimental results. All the simulation results are extracted with the aid of Magpar, while the analysis method was the FEM. Correspondingly, for the experimental procedure, two fluxgate magnetometers are used and the simulation results are validated with satisfactory agreement. In addition, the same simulation and experimental sets are exported for Co with fcc as well as hcp crystal structure. The method yielded accurate results for both materials, validating its correctness.
Firstly, each material is simulated as one nanosphere with radius 12.6 nm, the hysteresis loops are exported and the magnetization due to terrestrial magnetic field is investigated. The experimental results validate the simulation ones, for both materials. In the case of the second material, with hcp structure, it is shown that the provided magnetization, for the same material quantity, is lower than the corresponding magnetization of the material with fcc structure.
Secondly, simulation is conducted by splitting the material into two nanospheres, preserving the total material mass. The effect of the distance between the nanospheres on the magnetization is investigated. The results for both materials reveal that when the nanosphere distance increases, the magnetization due to terrestrial magnetic field decreases.
Then the effect of the number of nanoparticles is studied. For both materials the total mass is kept unchanged and three cases of simulations are simulated, with: one, two and one hundred nanoparticles. Observing the corresponding hysteresis loops, it is evident that the number of the nanoparticles has almost negligible effect on the magnetization due to magnetic field of the earth. Consequently, the simulation of an enormous number of nanospheres can be avoided, making the procedure simpler and reducing the simulation time, which is very important for every research procedure that necessitates quick and accurate results.
In all cases, by comparing the magnetization value of the Material 2 (hcp), with the magnetization value of the Material 1 (fcc), it is clear that hcp sample has lower value for the same material mass and the same external applied magnetic field, in this case, the earth magnetic field.
The above findings are summarized also in
Table 5, which compares the magnetization values in the region of terrestrial earth field, for the two materials, exported by simulation and experiment. The magnetization of Material 1, for the same applied field is roughly 4 four times greater, compared to the Material 2 magnetization. Moreover, it can be seen that, for both materials the simulation results are close enough to the experimental. Consequently, the simulation can be validated.
Table 5.
The magnetization values, when the Earth’s magnetic field is applied in Material 1.
Table 5.
The magnetization values, when the Earth’s magnetic field is applied in Material 1.
| Material Type |
Magnetization value derived from simulation (emu/gr) |
Magnetization value derived from experiment (emu/gr) |
| Material 1 (fcc structrure) |
4.939 |
4.62 |
| Material 2 (hcp structrure) |
1.15 |
0.95 |
To conclude, the main goal of this study is to build a novel, simple and economic measurement system, utilizing fluxgate magnetometers, for nanomaterial in situ characterization purposes. A better understanding of catalysis science by state-of-the-art tools is one of the core businesses of various industries and research institutes. Due to the great range of applications that the nanomaterials are used in the industry, the condition monitoring and the fault diagnosis, are crucial needs, which demands new and economic efficient diagnostic techniques, that can detect phenomena like the change of the catalyst phase etc. Next step of this work will be the experimental investigation, using fluxgate magnetometers, of the two catalysts in different catalytic stages, in which part of the sample is deactivated. Key objective of this step is the development of a tempo-spatial model and the deactivation rate of the remaining active catalyst along.
Author Contributions
Conceptualization, C.D.N; methodology, C.D.N, A.T.B. and A.C.B.; validation A.T.B. and A.C.B.; formal analysis, I.O.V. and C.D.N.; investigation, C.D.N., A.T.B. and A.C.B.; resources, I.O.V.; data curation, C.D.N. and A.T.B.; writing—original draft preparation, A.C.B., C.D.N. and I.O.V.; writing—review and editing, A.C.B., C.D.N. and I.O.V.; visualization, A.T.B. and A.C.B..; supervision, C.D.N.; project administration, I.O.V. and C.D.N.; All authors have read and agreed to the published version of the manuscript.
Funding
This research received no external funding.
Institutional Review Board Statement
Not applicable.
Informed Consent Statement
Not applicable.
Data Availability Statement
The data used in this study are available on request from the corresponding authors.
Conflicts of Interest
The authors declare no conflict of interest.
References
- Singh, V.; Yadav, S.S.; Chauhan, V.; Shukla, S.; Vishnolia, K.K. Applications of Nanoparticles in Various Fields. Diagnostic Appl. Heal. Intell. Surveill. Syst. 2021, 221–236. [Google Scholar] [CrossRef]
- Ludwig, F.; Heim, E.; Schilling, M. Characterization of Superparamagnetic Nanoparticles by Analyzing the Magnetization and Relaxation Dynamics Using Fluxgate Magnetometers. J. Appl. Phys. 2007, 101. [Google Scholar] [CrossRef]
- Ludwig, F.; Heim, E.; Eberbeck, D.; Schwarz, K.; Trahms, L.; Schilling, M. Comparison and Calibration of Fluxgate and Squid Magnetorelaxometry Techniques for the Characterization of Magnetic Core-Shell Nanoparticles. IEEE Trans. Magn. 2009, 45, 4857–4860. [Google Scholar] [CrossRef]
- Khan, I.; Saeed, K.; Khan, I. Nanoparticles: Properties, Applications and Toxicities. Arab. J. Chem. 2019, 12, 908–931. [Google Scholar] [CrossRef]
- Sytnyk, M.; Kirchschlager, R.; Bodnarchuk, M.I.; Primetzhofer, D.; Kriegner, D.; Enser, H.; Stangl, J.; Bauer, P.; Voith, M.; Hassel, A.W.; et al. Tuning the Magnetic Properties of Metal Oxide Nanocrystal Heterostructures by Cation Exchange. Nano Lett. 2013, 13, 586–593. [Google Scholar] [CrossRef] [PubMed]
- Bertolucci, E.; Galletti, A.M.R.; Antonetti, C.; Marracci, M.; Tellini, B.; Piccinelli, F.; Visone, C.; Mishra, A.; Sardar, M. Chemical and Magnetic Properties Characterization of Magnetic Nanoparticles. Conf. Rec. - IEEE Instrum. Meas. Technol. Conf. 2015, 2015, 309–315. [Google Scholar] [CrossRef]
- Mishra, A.; Sardar, M. Isolation of Genomic DNA by Silane-Modified Iron Oxide Nanoparticles. Nanotechnology: Novel Perspectives and Prospects. 2015, 309–315. [Google Scholar]
- Baffa, O.; Matsuda, R.H.; Arsalani, S.; Prospero, A.; Miranda, J.R.A.; Wakai, R.T. Development of an Optical Pumped Gradiometric System to Detect Magnetic Relaxation of Magnetic Nanoparticles. J. Magn. Magn. Mater. 2019, 475, 533–538. [Google Scholar] [CrossRef]
- Barmpatza, A.C.; Baklezos, A.T.; Vardiambasis, I.O.; Nikolopoulos, C.D. Estimation of the Magnetic Signature of Ferromagnetic Nanoparticles by Earth’s Magnetic Field. IEEE Access 2023, 11, 14832–14840. [Google Scholar] [CrossRef]
- Kriven, G.I.; Sun, Y. Study of Magnetite Nanoparticles by the Method of Mössbauer Spectroscopy. WSEAS Trans. Appl. Theor. Mech. 2021, 16, 158–164. [Google Scholar] [CrossRef]
- Rodchenko, V. V.; Ko, K.Y. Investigation of Adsorption Capacity of Magnetite Nanoparticles. WSEAS Trans. Appl. Theor. Mech. 2021, 16, 165–171. [Google Scholar] [CrossRef]
- Utkin, Y.A.; Sha, M. Study of Electrokinetic Properties of Magnetite – Silica Core – Shell Nanoparticles. Wseas Trans. Appl. Theor. Mech. 2021, 16, 172–178. [Google Scholar] [CrossRef]
- Yang, Y.; Chen, J.; Peng, X.; Guo, H. Amplitude Dependence on Probe Frequency Detuning in Faraday-Rotation Alkali Atomic Magnetometers. IFCS/EFTF 2019 - Jt. Conf. IEEE Int. Freq. Control Symp. Eur. Freq. Time Forum, Proc. 2019, 7–8. [Google Scholar] [CrossRef]
- Liu, P.; Skucha, K.; Megens, M.; Boser, B. A CMOS Hall-Effect Sensor for the Characterization and Detection of Magnetic Nanoparticles for Biomedical Applications. IEEE Trans. Magn. 2011, 47, 3449–3451. [Google Scholar] [CrossRef]
- Denouala, M.; Saeza, S.; Kauffmanb, F.; Dolabdjiana, C. Magnetorelaxometry Using Improved Giant Magneto Resistance Magnetometer. Sensors Actuators, A Phys. 2010, 159, 184–188. [Google Scholar] [CrossRef]
- Carr, C.; Matlachov, A.N.; Sandin, H.; Espy, M.A.; Kraus, R.H. Magnetic Sensors for Bioassay: HTS SQUIDs or GMRs? IEEE Trans. Appl. Supercond. 2007, 17, 808–811. [Google Scholar] [CrossRef]
- Dieckhoff, J.; Schilling, M.; Ludwig, F. Fluxgate Based Detection of Magnetic Nanoparticle Dynamics in a Rotating Magnetic Field. Appl. Phys. Lett. 2011, 99, 14–17. [Google Scholar] [CrossRef]
- Tsakoumis, N.; Baklezos, A.T.; Vardiambasis, I.O.; Kapetanakis, T.N.; Nikolopoulos, C.D. Fluxgate Configuration for Obtaining Magnetic Properties of Catalytic Nanoparticles: A Feasibility Study. I2MTC 2020 - Int. Instrum. Meas. Technol. Conf. Proc. 2020, 1–5. [Google Scholar] [CrossRef]
- Ludwig, F.; Heim, E.; Mäuselein, S.; Eberbeck, D.; Schilling, M. Magnetorelaxometry of Magnetic Nanoparticles with Fluxgate Magnetometers for the Analysis of Biological Targets. J. Magn. Magn. Mater. 2005, 293, 690–695. [Google Scholar] [CrossRef]
- Gao, C.Y.; Lu, Q.; Choi, H.J. Effect of Magnetic Nanoparticle Additive on Viscoelastic Behaviors of Carbonyl Iron-Based Magnetorheological Suspension. IEEE Trans. Magn. 2018, 54, 54–57. [Google Scholar] [CrossRef]
- Jaufenthaler, A.; Kornack, T.; Lebedev, V.; Limes, M.E.; Körber, R.; Liebl, M.; Baumgarten, D. Pulsed Optically Pumped Magnetometers: Addressing Dead Time and Bandwidth for the Unshielded Magnetorelaxometry of Magnetic Nanoparticles. Sensors (Switzerland) 2021, 21, 1–19. [Google Scholar] [CrossRef] [PubMed]
- Piepgras, R.; Michlmayr, S.; Egger, J.; Zagar, B.G. Measurement of Magnetic Microstructures with a Faraday Rotation Magnetometer. I2MTC 2020 - Int. Instrum. Meas. Technol. Conf. Proc. 2020, 1–5. [Google Scholar] [CrossRef]
- Scholz, W.; Fidler, J.; Schrefl, T.; Suess, D.; Dittrich, R.; Forster, H.; Tsiantos, V. Scalable Parallel Micromagnetic Solvers for Magnetic Nanostructures. Comput. Mater. Sci. 2003, 28, 366–383. [Google Scholar] [CrossRef]
- Scholz, W. MagPar Manual; 2010. [Google Scholar]
- Bran, C.; Ivanov, Y.P.; Trabada, D.G.; Tomkowicz, J.; Del Real, R.P.; Chubykalo-Fesenko, O.; Vazquez, M. Structural Dependence of Magnetic Properties in Co-Based Nanowires: Experiments and Micromagnetic Simulations. IEEE Trans. Magn. 2013, 49, 4491–4497. [Google Scholar] [CrossRef]
- Vivas, L.G.; Yanes, R.; Chubykalo-Fesenko, O.; Vazquez, M. Coercivity of Ordered Arrays of Magnetic Co Nanowires with Controlled Variable Lengths. Appl. Phys. Lett. 2011, 98, 2011–2014. [Google Scholar] [CrossRef]
|
Disclaimer/Publisher’s Note: The statements, opinions and data contained in all publications are solely those of the individual author(s) and contributor(s) and not of MDPI and/or the editor(s). MDPI and/or the editor(s) disclaim responsibility for any injury to people or property resulting from any ideas, methods, instructions or products referred to in the content. |
© 2023 by the authors. Licensee MDPI, Basel, Switzerland. This article is an open access article distributed under the terms and conditions of the Creative Commons Attribution (CC BY) license (http://creativecommons.org/licenses/by/4.0/).
