1. INTRODUCTION
During the last third of the last century and so far, this century, the publication of reviews on crack growth models has increased considerably. Crack closure and crack opening models have been discussed. [
1]focusing on the volume-based strain energy density approach applied to welded structures with notches [
2], the orientation of the critical plane in multiaxial fatigue [
3]. Pippan and Hohenwarter presented a review on the controversial phenomenon of crack closure and its physical implications and consequences [
4], a study focusing on the theory of critical distances [
5], reviews of the application of the DIC technique to fatigue [
6,
7]and reviews of the use of FEM in the study of crack growth [
8,
9,
10]. In another compilation work [
11] on notched components, different types of approaches have been presented to characterise notch fatigue behaviours under complex loading histories. Among them, the consideration of the stress gradient effect is a popular perspective, together with the concepts of fatigue damage zone and critical distance. This article systematically reviews recent advances in notch fatigue analysis in relation to stress gradient effects. Despite these advances, a comprehensive analysis of published methods that use crack apex plasticity to determine or improve crack growth models has not yet been carried out.
Fatigue crack growth has been extensively studied using the curves da/dN - ΔK. ΔK is essentially an elastic parameter, while the fatigue crack growth process is related to non-linear and irreversible plastic phenomena at the crack edge. This explains the limitation of da/dN-ΔK models to predict the effect of stress ratio or load amplitude variation. Among the limitations are a) such curves are completely phenomenological, not derived from physics, and the fitting parameters have no physical justification; b) such curves are only valid in the small-scale yield range; and c) da/dN depends on other parameters, including stress ratio and loading history.
Fatigue damage is reflected in plastic phenomena that are not analysed by elastic models, so it is necessary to introduce different mechanisms to analyse the damage that occurs in each cycle. One of them is the cyclic plastic deformation in which the damage accumulation process is strongly influenced by the evolution of the dislocation substructure [
12]. The presence of surface oxides in the base material can act as crack initiation points and can significantly decrease the fatigue life of the material [
13]. They can also act as brittle inclusions and behave as cracks when loaded normal to their long axes [
14].
Brittle solids often exhibit similar micro mechanisms for the growth of static and cyclic cracks at low temperatures [
15]. However, the application of a cyclic load on a static mean stress can result in variable lifetimes and, in some cases, the cyclic frequency can influence the crack growth rate. Furthermore, under fully compressive cyclic loading, crack initiation can occur solely due to cyclic loading, even in regions without stress concentrations. These phenomena can significantly influence the growth and failure of brittle solids. Another failure mechanism is 'Fatigue micro voids', which occur because of the separation of non-coherent secondary particles from the matrix. [
16]. The void formation process is characterised by the initiation, growth and coalescence of multiple interfacial cracks around the particle.
Subsequently, the phenomenon of crack closure is introduced, which was proposed by [
17] and has been used to explain the influence of plasticity on fatigue crack growth. It has also been used to determine numerically, experimentally and analytically the effect of stress ratio [
18]short cracks [
19,
20], and model widths [
21]. From the first in-depth studies [
22] evolved to the concept of partial crack closure [
23]. Subsequently [
24]proposed a new model for the stress around the crack based on four parameters: KF (SIF opening mode), KS (SIF shear), KR (SIF retardation) and strain T. KR characterises the effect of crack tip protection arising due to plasticity in both the crack tip and the wake. The use of non-linear parameters was introduced to validate the concept of crack closure and identify the most accurate parameters [
25]. Experimentally, a relationship between crack closure and crack growth has been observed with different techniques, in. [
26] DIC is used for this, and subsequently a model is established to reproduce the results, obtaining information of the closing stresses. In another study [
27] a direct relationship between overloads, crack closure and how it affects crack growth is observed. In the works [
28,
29] a relationship is established between plastic wake sizes, COD and effective intensity factor at the crack apex. Subsequently, these parameters have also been related to crack closure with DIC experimental techniques [
30]. The DIC technique has been shown to be a very useful tool to determine the elastic or elastoplastic displacement field in the crack environment, to subsequently, through mathematical, analytical or numerical models, calculate the key parameters of the FCGR, and establish the possible driving forces of crack growth. Only in this publication [
31]the authors evaluate 5 different methods to locate the crack apex position by applying DIC. The methods are: 2 constrained Newton, the trust-region reflective and the quasi-Newton; the Nelder-Mead Simplex; a constrained Genetic Algorithm (GA) and finally a constrained Pattern Search (PS).
The X-DIC technique [
32] has also been shown to be efficient to evaluate the plastic state of the crack apex. Today, there is still a lot of controversy surrounding the crack closure phenomenon, on the one hand, many researchers deny that it has any influence on crack growth. On the other hand, Pippian and Grosinger [
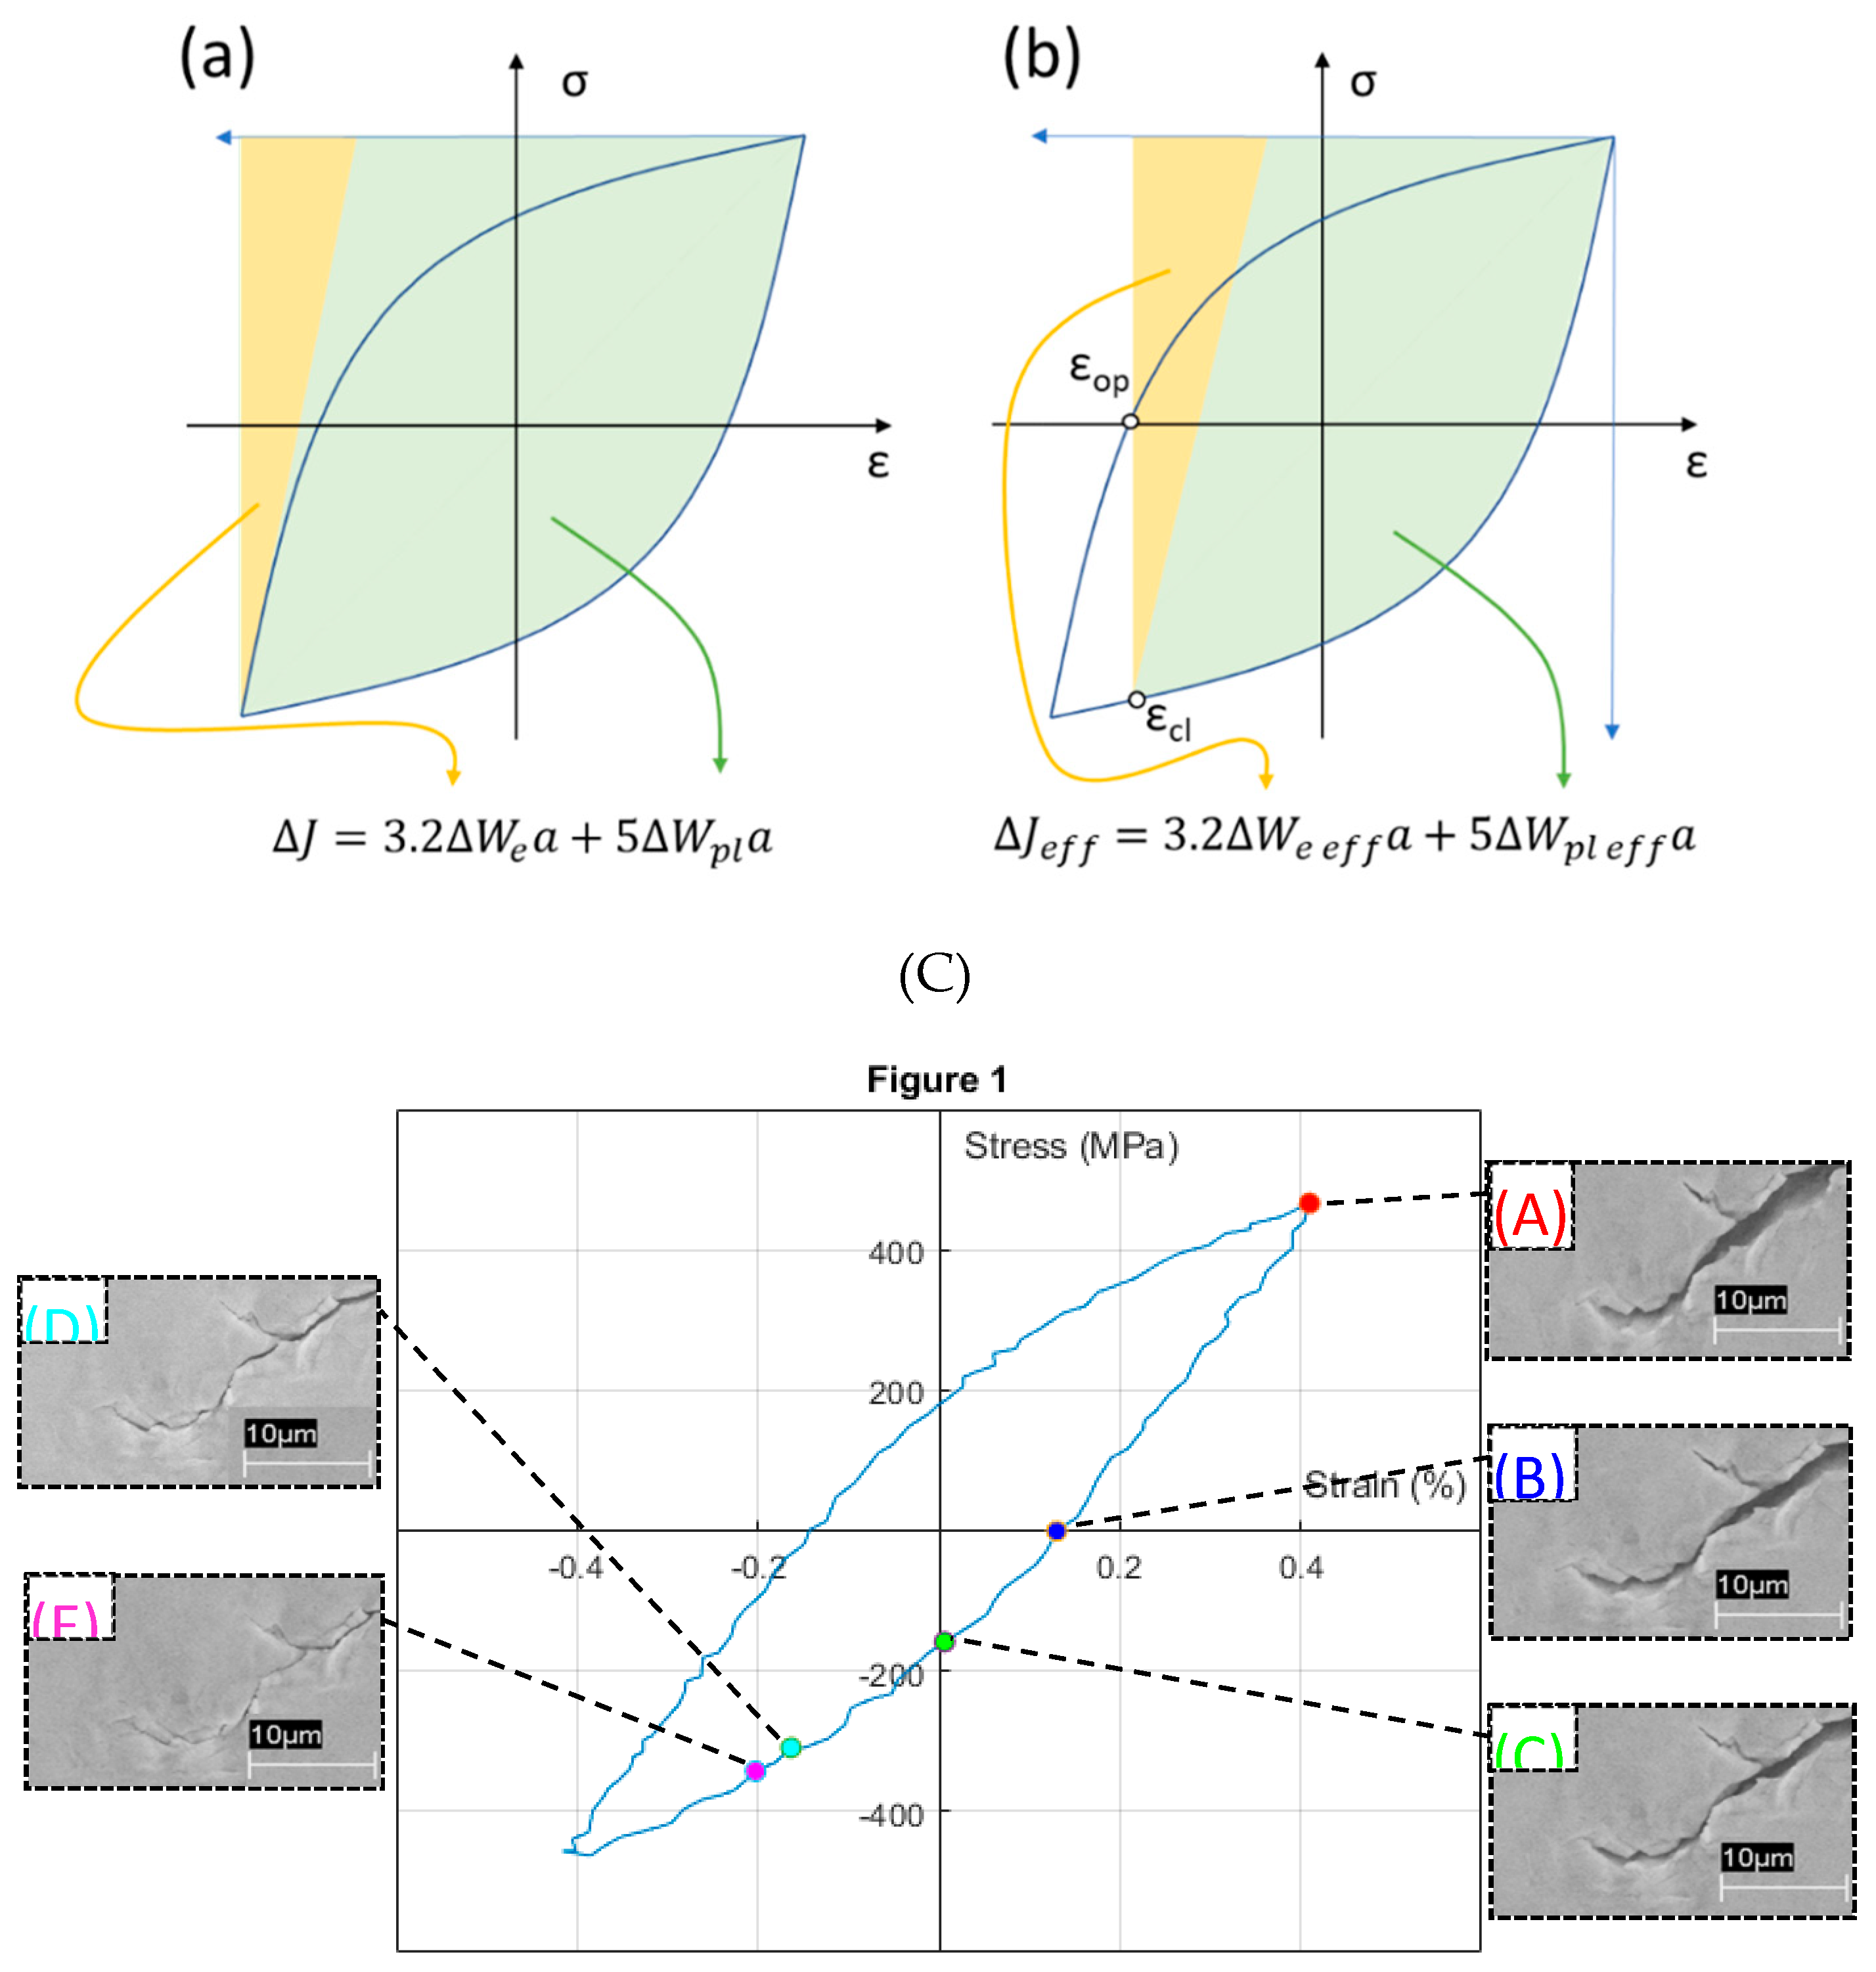
33] proposed an original approach to crack closure phenomenon, extending its importance and relevance, at the time of the research publication, the acceptance of crack closure phenomenon and its effect on FCGR was restricted to Low Cycle Fatigue (LCF) processes. Based on images from a scanning electron microscope (
Figure 1 C) and the interpretation of ΔJ and ΔJ
eff in the cyclic stress-strain hysteresis curves characteristic of fatigue processes (
Figure 1 A and B), the authors demonstrate that crack closure also occurs in High Cycle Fatigue (HCF) processes and affects ΔJ and ΔJ
eff, consequently affecting the FCGR.
The study of the effects of elasto-plastic behaviour on crack growth is approached from many points of view and mechanisms. For example, the effect of the sharpening and hardening that occurs at the crack apex on the crack development itself is addressed [
34]. The effect of crack apex sharpening and hardening under maximum and minimum loads has been investigated [
35]. This phenomenon has also been experimentally verified [
36] with the use of micro fractography. A model is proposed [
37] mathematical model based on time differential equations describing the thermodynamic process of plastic energy dissipation during the hardening and sharpening of the crack tip growth is proposed. Another analytical approach [
38] is based on the use of the Smith-Watson-Topper parameter assuming that in the first loading cycles a large and irreversible sharpening of the crack apex occurs.
Another important element to consider is the identification of the crack zone. During fatigue crack propagation, two plastic zones are created at the crack tip. [
40]. One is constant during loading, while the other is cyclic during unloading. Research has shown that the size and shape of the plastic zone significantly influences the crack growth behaviour.
It should also be mentioned that there are numerous papers whose focus is not on the relationship between crack growth and crack tip plasticity, but which provide evidence of the connection. In the work [
41] whose main objective is to validate crack growth models (Fatemi-Socie) under biaxial loads and overloads, it was clearly observed that the combined application of axial and torsion almost eliminated crack closure, thereby increasing the crack growth rate. In the following work [
42] a finite element model is carried out with Abaqus and the effect of the position of holes drilled in a plate to reduce the growth rate of future cracks is evaluated. The optimum location and size are sought, reducing the rate of crack growth by 50%. To see the effect of the circular holes drilled in the crack tip region, a direct evaluation of the ratchet limit and the plastic deformation range of the crack tip is made. This evaluation is achieved using the new Linear Matching Method (LMM). There is a situation that optimises the slowing down of crack growth because the plastic deformation decays by 50%.
Next, we will present works that propose methods for determining crack growth or corrections to these methods based on the plastic effects that occur in the vicinity of the crack apex. Works that establish quantifiable relationships between plasticity and crack growth will also be presented. Although they do not present a complete model, they detect and quantify parameters of interest and are the seed of possible future models when all the parameters are found, which, as they are unknown, do not allow the formulation of the complete model. The works have been grouped according to the theories used, as well as the damage parameters.
2. DAMAGE THEORIES BASED ON CRACK GROWTH CONCEPTS. CTOD, PLASTIC ZONE SIZE, rp, ΔK
To talk about numerical models of crack growth and their relation to plastic phenomena in the crack tip environment is to talk about Fernando Antunes. In his work [
43] he presents an elasto-plastic numerical model where the contact between the crack flanks is obviated. In all simulations, the CTOD and CTOD
P were measured. A relationship between da/dN and CTOD
p was established for the AA6082-T6 aluminium alloy, which is a quantifiable relationship between plasticity and crack growth rate, on the other hand, the relationship between CTOD
P and other parameters of interest such as ΔK was quantified. When modelling without contact (visible in Figure 4) both plastic and elastic CTOD are higher, i.e., without contact, without the effect of crack closure, the effect of loading is higher. Without contact, without crack closure, the crack propagation only depends on ΔK. The CTOD
p is plotted with respect to the deformation, linear relationship, and with respect to the energy, obtaining a quadratic relationship. In this work [
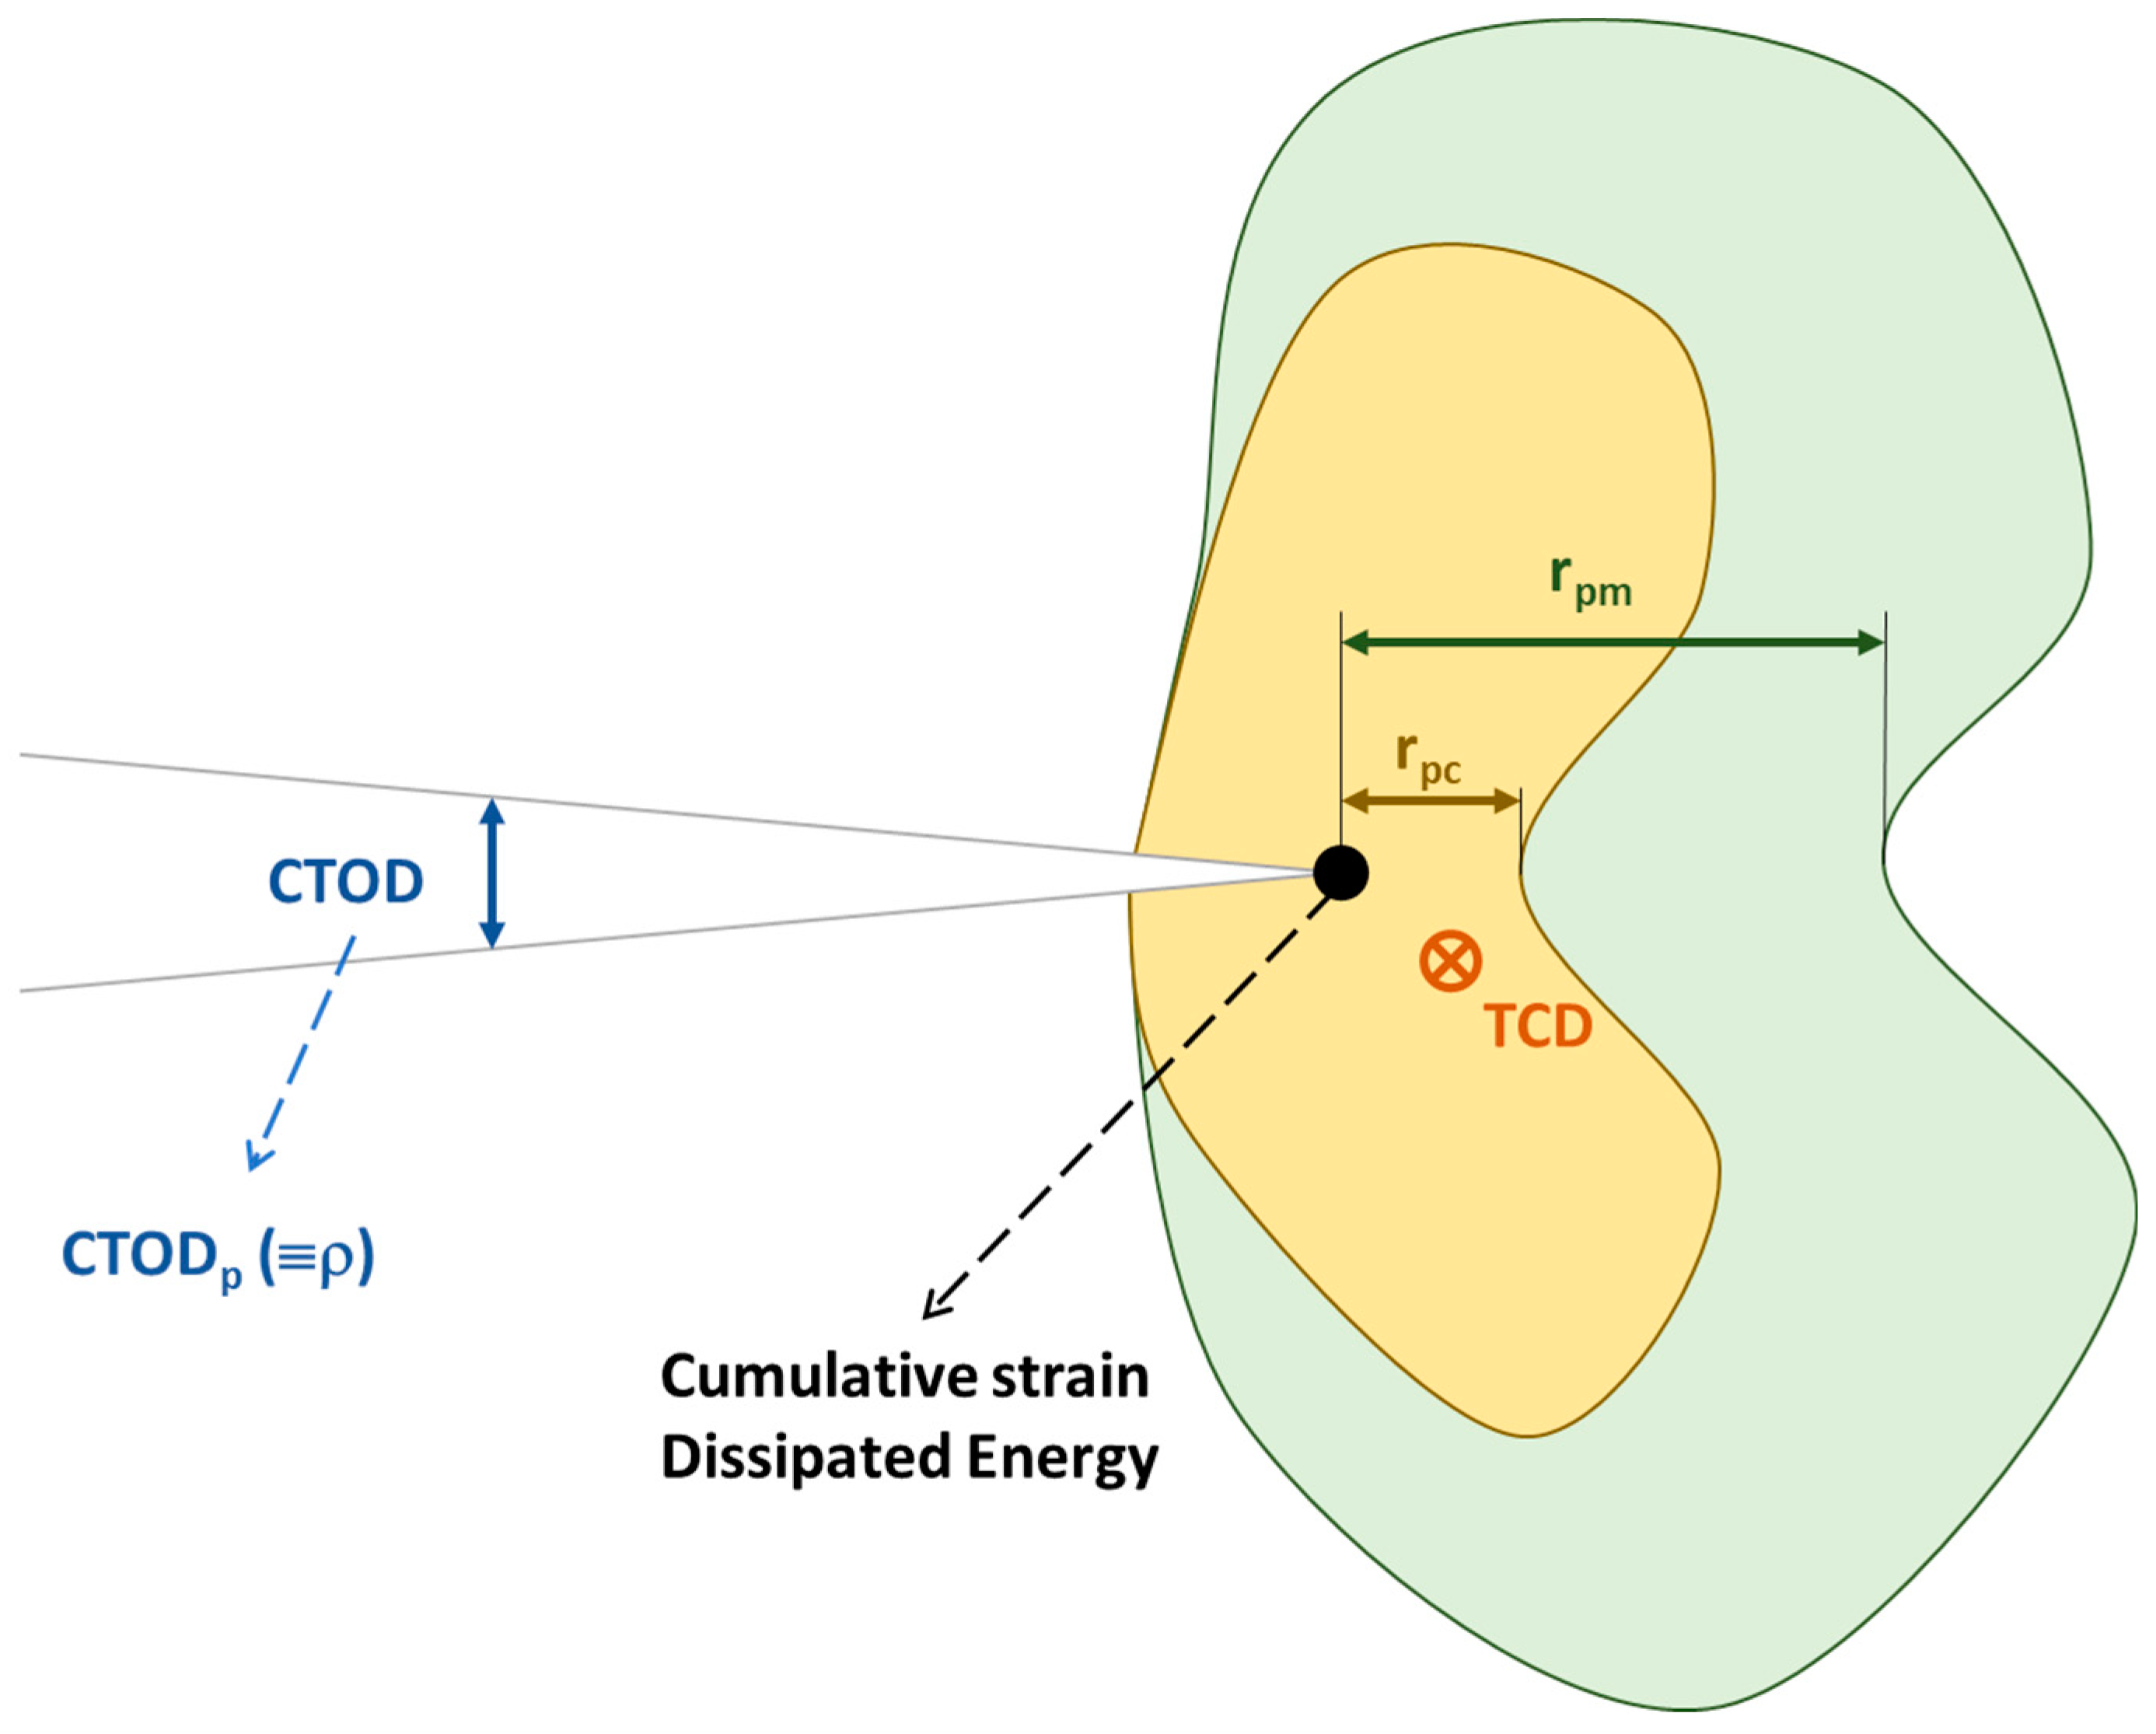
25] the main objective is to verify the effectiveness of the crack closure concept, therefore, the crack flank contact is modelled, as well as the following non-linear parameters in the crack tip environment are calculated: cyclic plastic strain range, both elastic and plastic CTOD, size of the plastic inverted zone, r
pc in
Figure 2, and the plastic energy dissipated per cycle. Direct relationships of these four parameters with the crack growth rate and ΔK are shown throughout the paper, which can be said to form a plasticity-based growth model. The paper also demonstrates the effect of crack closure on the linear parameters, as well as the effect of mesh size on the linear parameters. In another paper [
44] the same numerical finite element model is basically used as in the two previous works, which we will now describe briefly: the numerical modelling is assumed to be elastoplastic with: 1-Isotropy and 2.- The Von Mises criterion is followed in plasticity together with the Voce isotropic hardening law. [
45] and the Lemaitre-Chaboche’s kinematic law of hardening. [
46] The numerical model is implemented with the DD3IMP software. Only 1/8 of the specimen is modelled by symmetry with the consequent computational saving. The main result of the work is the relationship between the COTD
P with da/dN for 7050-T6 aluminium. Specifically, there is a linear relationship, just multiplying by 0.5245. Following the basis of the numerical modelling of the previous publications, in the following work. [
47] the relationship between plasticity and crack growth is further explored, the relationship between CTOD
P and da/dN for Aluminium 2050-T8 is also obtained. As a novelty in this work, the effect of the number of load cycles that elapse until another node is released from the crack apex with the consequent crack growth is studied. The higher the number of load cycles between node opening, the higher the CTOD
P. The da/dN is plotted against the numerical CTODp, and the strong influence of the numerical parameters can be seen. In plane strain, the higher the number of cycles, the lower the CTODp, unlike in plane deformation. In the work [
43] the methodology for the calculation of the Plastic CTOD in numerical tests is established in detail, as well as the parameters that will affect this calculation, such as the crack propagation distance, the size of the crack, the distance of the points with respect to the edge, the size of the elements and the number of previous cycles. The mesh size and the software used are those mentioned earlier in Antunes' work. The distance of the first released node after the crack edge is the most sensitive parameter together with the mesh size.
Zhang [
48] develops a fatigue crack propagation model from the results of an elastic-plastic finite element analysis performed to study the effect of compressive stress on fatigue crack growth under applied tension-compression loading. The stress near the crack tip, the displacement and the size of the plastic zone are obtained from a kinematically hardened material. The results show that the above three parameters continue to change with the change of applied compressive force. Experimental methods were used to predict the crack propagation behaviour. The study is based on analyses made by Silva [
49,
50] who found that materials exhibiting strong cyclic hardening and a high Bauschinger effect (such as Al 2024-T351, ck45, 0.4% mild steel) were strongly affected by the applied compressive load while materials not exhibiting cyclic hardening (such as Ti6Al4V and Al7175) were relatively insensitive to the applied compressive load. Silva also concludes that models based on the concept of fatigue crack closure are not suitable, while models based on materials with cyclic-plastic properties are suitable for describing fatigue crack propagation behaviour under tension-compression loading. Based on this, Zhang et al. develop a model where they identify the internal and external parameters that control the fatigue crack growth behaviour and describe the fatigue crack propagation rate under tension-compression loading. The paper concludes that using a kinematically stiffened material subjected to tension-compression loading: the compression part of the applied cyclic load has a significant effect on the crack tip stress, displacement and plastic deformation field, and that the maximum applied stress intensity factor k
max and σ
max-comp (maximum applied compressive stress) are the two external loading parameters that determine the above three variables. As an inner parameter, r
pc, the reverse plastic zone size is appropriate to correlate the fatigue crack propagation rate, see also
Figure 2. Finally, he proposes an equation for the fatigue crack growth rate under tension-compression loading, with special emphasis that it has nothing to do with the concept of crack closure, but with plasticity at the crack tip and based on the plastic damage theory [
51].
Vasco-Olmo et al. [
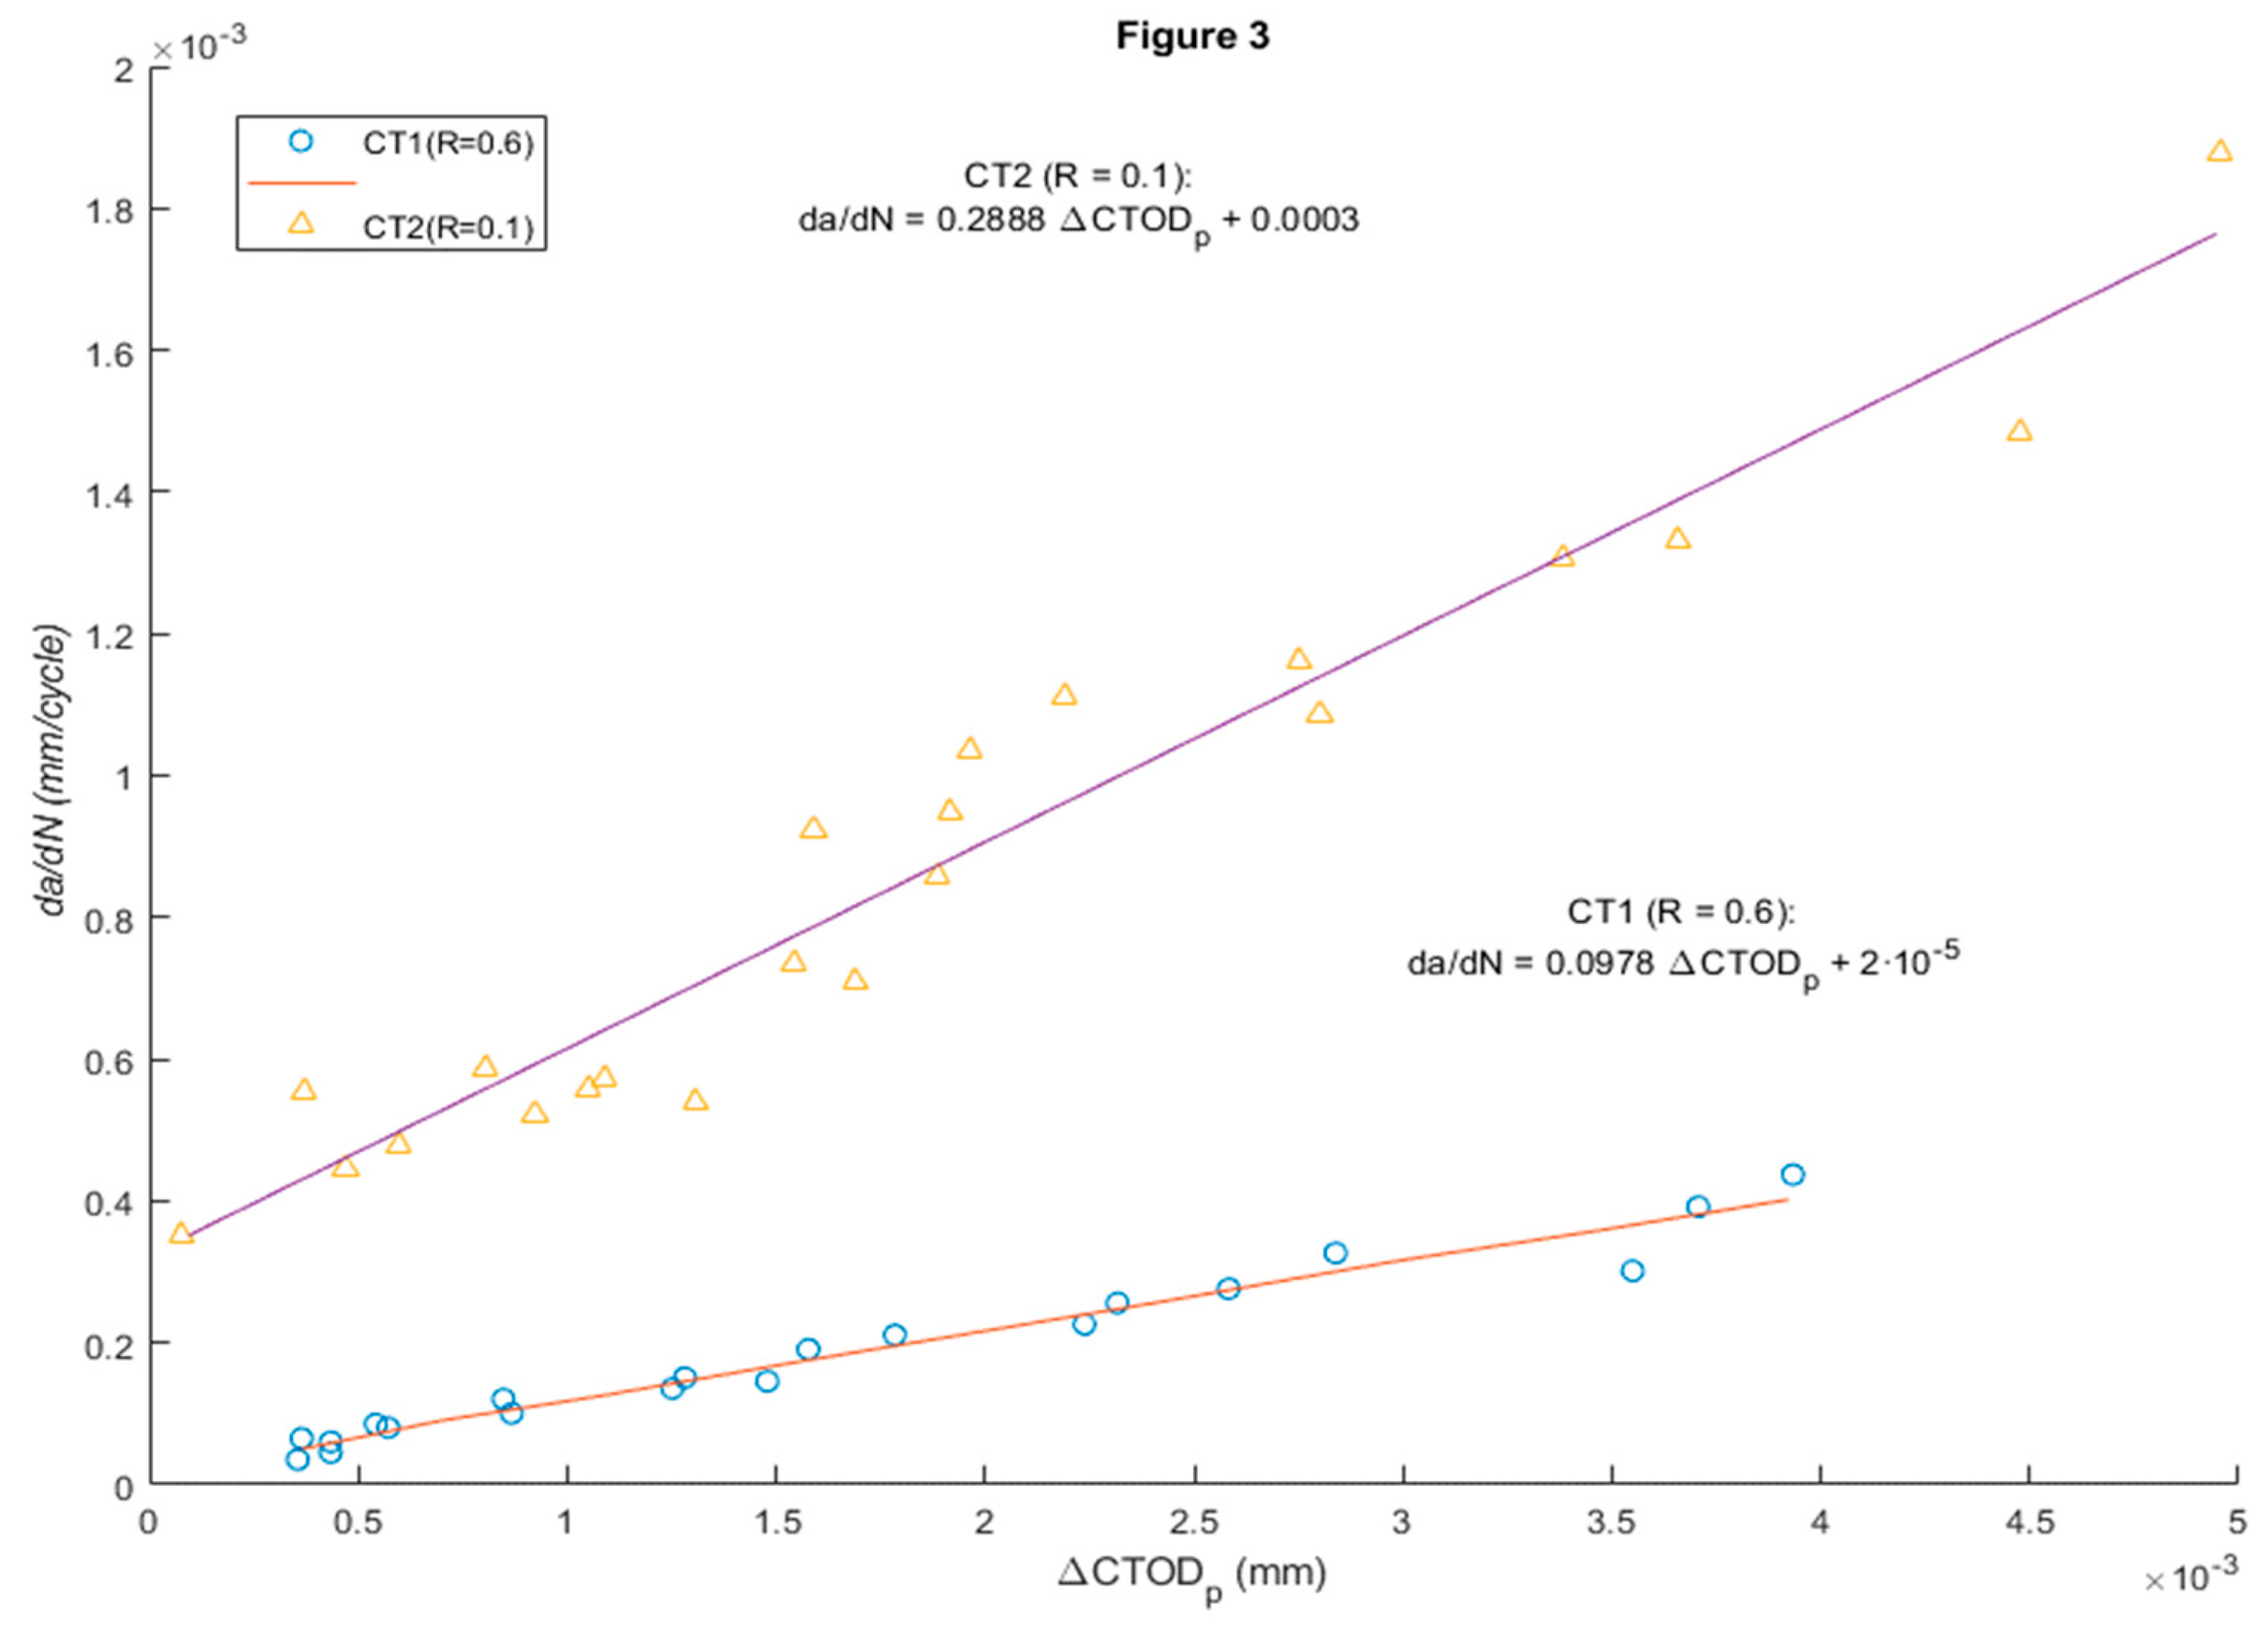
52] conducted an experimental study of crack tip displacement opening (CTOD), is performed to evaluate the ability of this parameter to characterise fatigue crack growth. A methodology is developed to measure and analyse CTOD from experimental data. Displacements are measured by implementing Digital Image Correlation in the fatigue crack growth, in this way the CTOD can be determined. Fatigue tests were performed with R of 0.1 and 0.6 on compact tension specimens made of commercial pure titanium. A sensitivity analysis was performed to explore the effect of the selected position behind the crack tip on the CTOD measurement. Analysis of a full load cycle allowed the elastic and plastic components of the CTOD to be identified. For the plastic, CTOD was found to be directly related to the plastic deformation at the crack. Furthermore, a linear relationship between da/dN and plastic CTOD was observed in both tests (
Figure 3). The results show that CTOD can be used as a viable alternative method to ΔK in characterising fatigue crack propagation because the parameter considers the fatigue threshold. This work aims to contribute to a better understanding of the different mechanisms driving fatigue crack growth and the direction of fatigue crack growth, a controversy associated with plasticity-induced fatigue crack closure.
This was one of the first works [
53] to successfully use plastic parameters to model the FCGR. Specifically, in this work, the size of the plastic zone r
pc is used as a key parameter. Starting from the equation of r
pc based on the Dugdale model, and applying plane strain conditions, we obtain eq.1 for r
pc, and with plane stress conditions we obtain eq.2. That is, a specimen of zero thickness would be ideal for plane strain and one of infinite thickness for plane strain conditions. The FCGR is expressed as da/dN=C
e (ΔKeff)
mc. Where C
e and m
c with material constants.
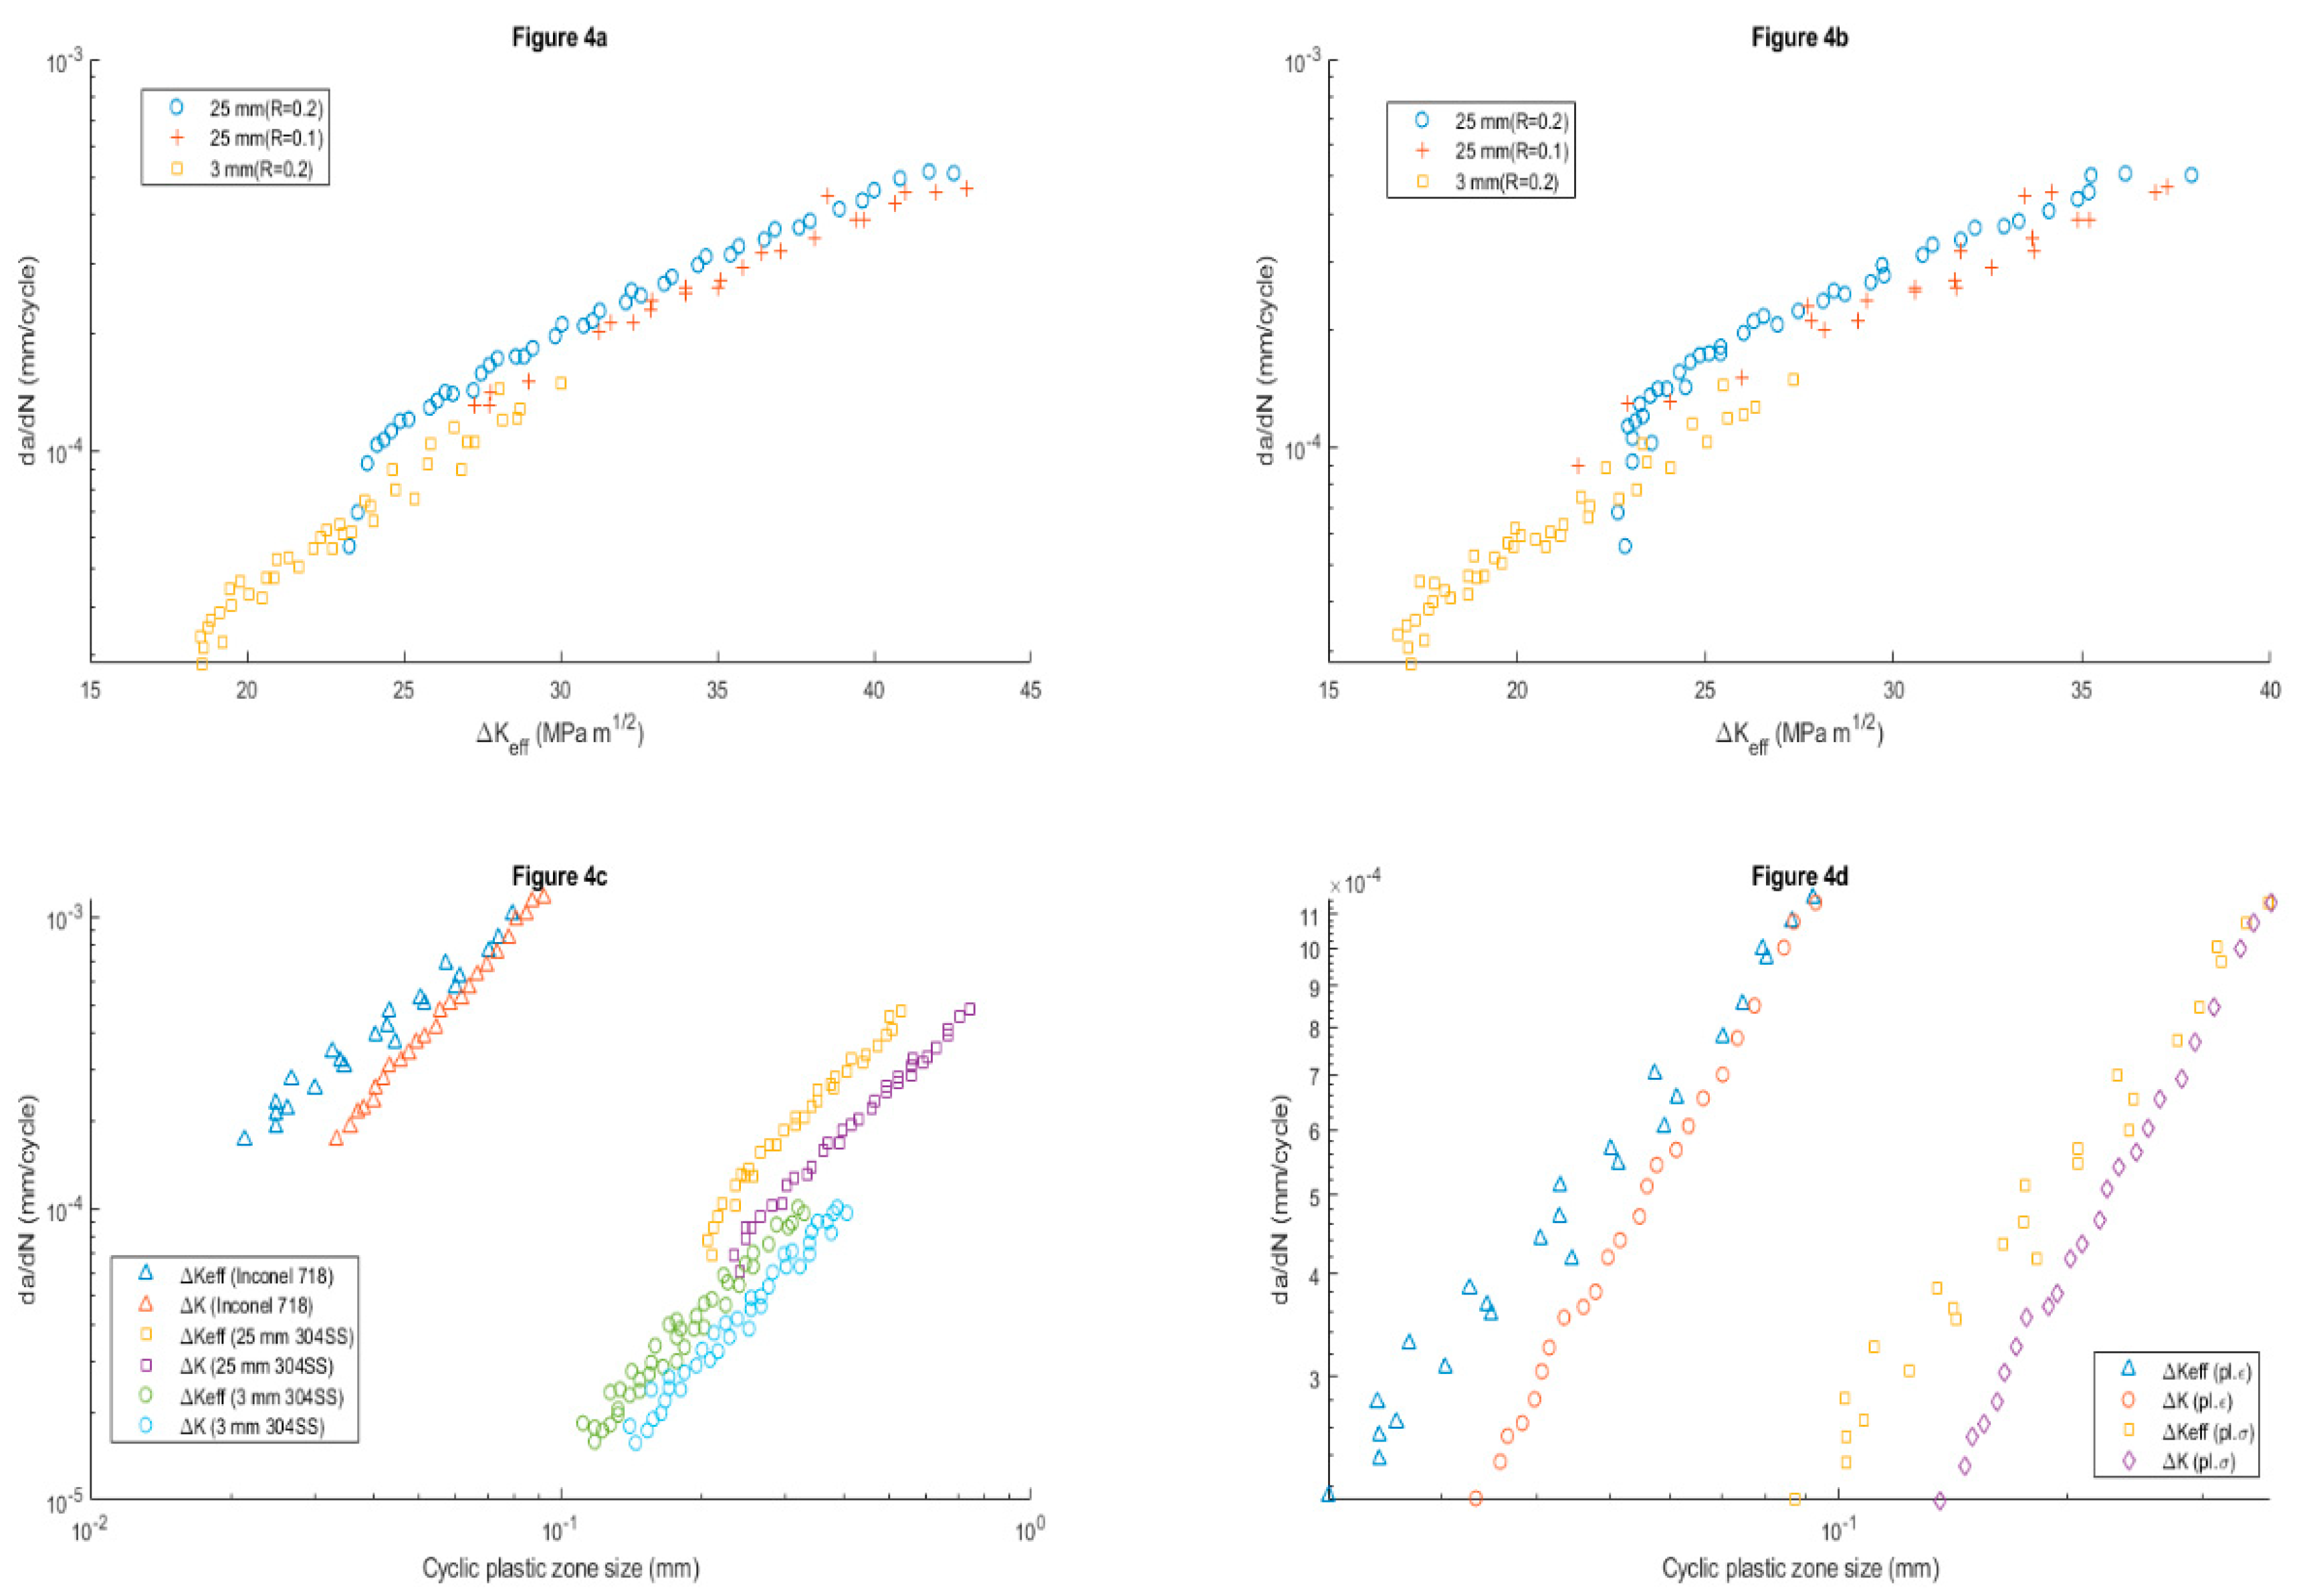
Figure 4(a, b) shows the correlation of the experimental FCGR with that obtained in the model for different specimen thicknesses, as a function of ΔK and ΔK
eff.
Figure 4(c, d) show the FCGR correlations assuming plane strain and plane stress respectively, it is observed that plane strain conditions favour the FCGR, so it increases with specimen thickness.
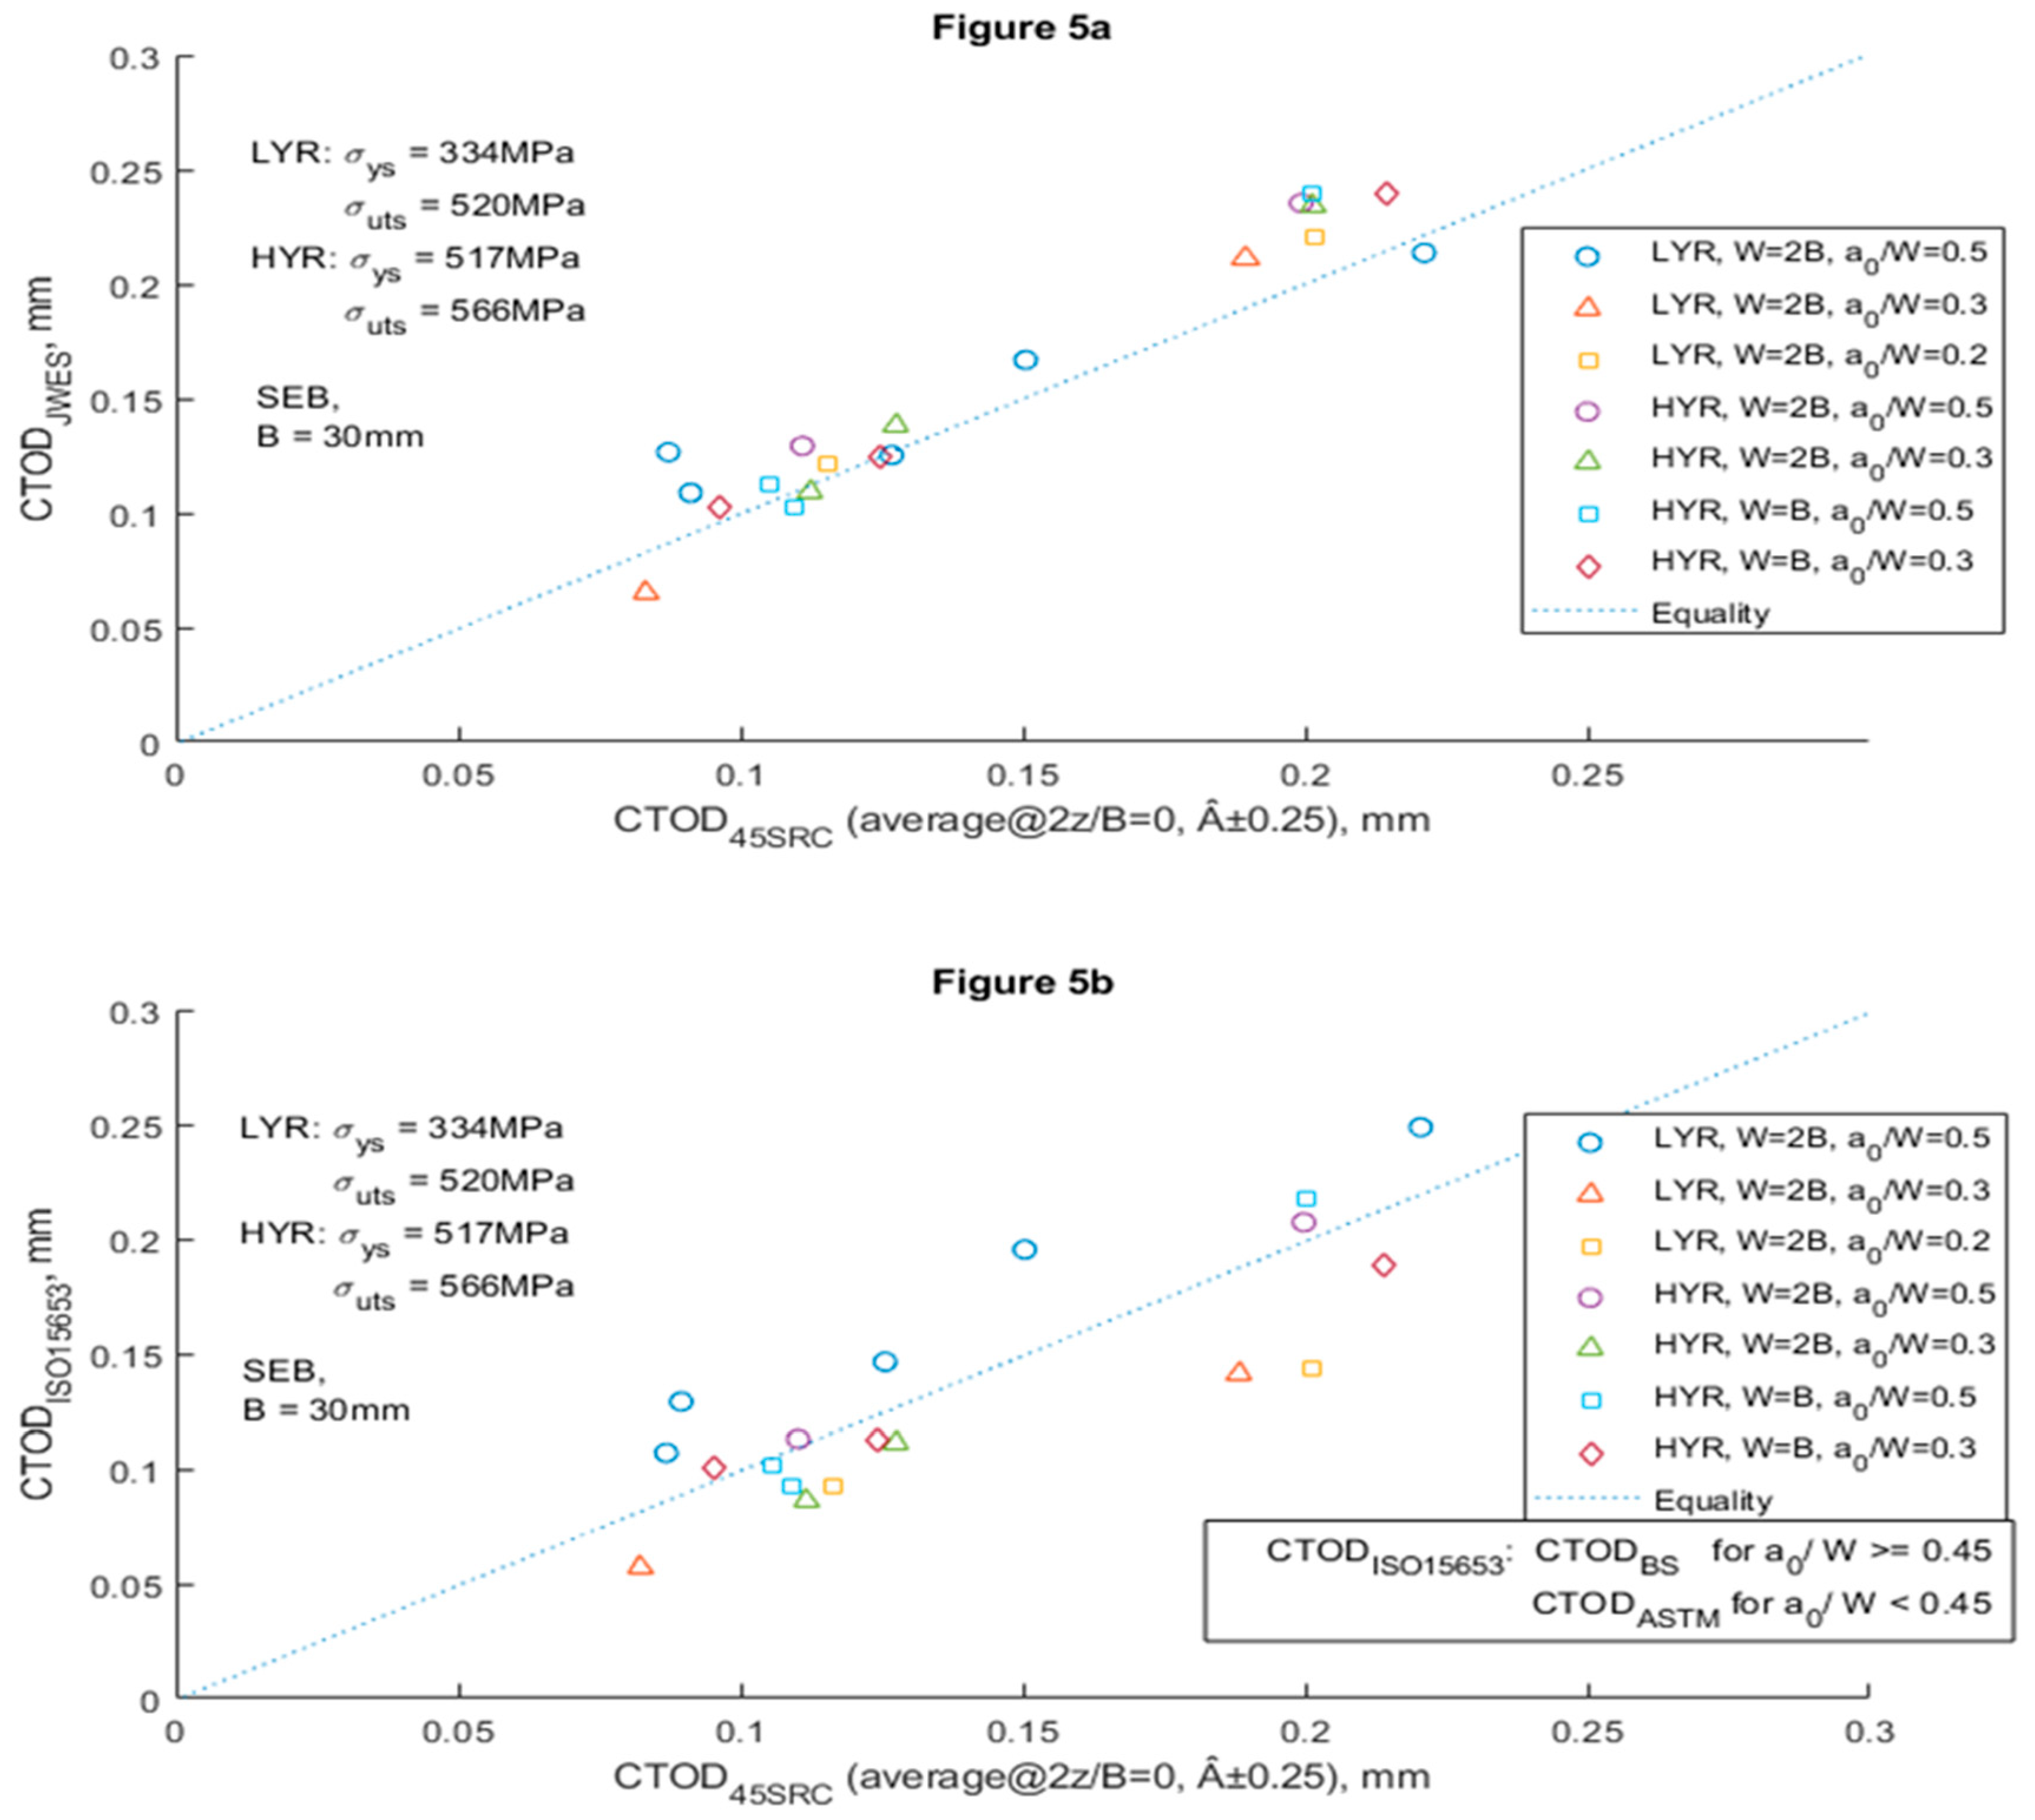
Kawataba [
34] proposed a new method for CTOD calculation based on the crack apex edge loss due to strain hardening. He introduces a new factor f to account for the plastic factor. This f-factor is a function of the plastic radius and the thickness of the specimen. The result of the correction is verified numerically and experimentally. Starting from the proposed and revised formula [
54,
55,
56,
57] for the CTOD calculation, they concluded that the CTOD calculation was overestimated due to the presence of the plastic deformation at the crack apex, which was expected with respect to the edge loss. The CTOD is the sum of an elastic and a plastic term, the elastic term is calculated based on the intensity factor K, and the plastic term based on the Hinge plastic model. For the calculation of the CTOD there are several parameters to adjust: in the plastic part m(YR) is calibrated with equation 3, the factor f (YR, B) of the plastic part is calibrated in equation 4, which gives as final result the calculation of the CTOD by equation 5. The goodness of the model is checked numerically and experimentally, the correlation is shown in
Figure 5.
At the end of the last century [
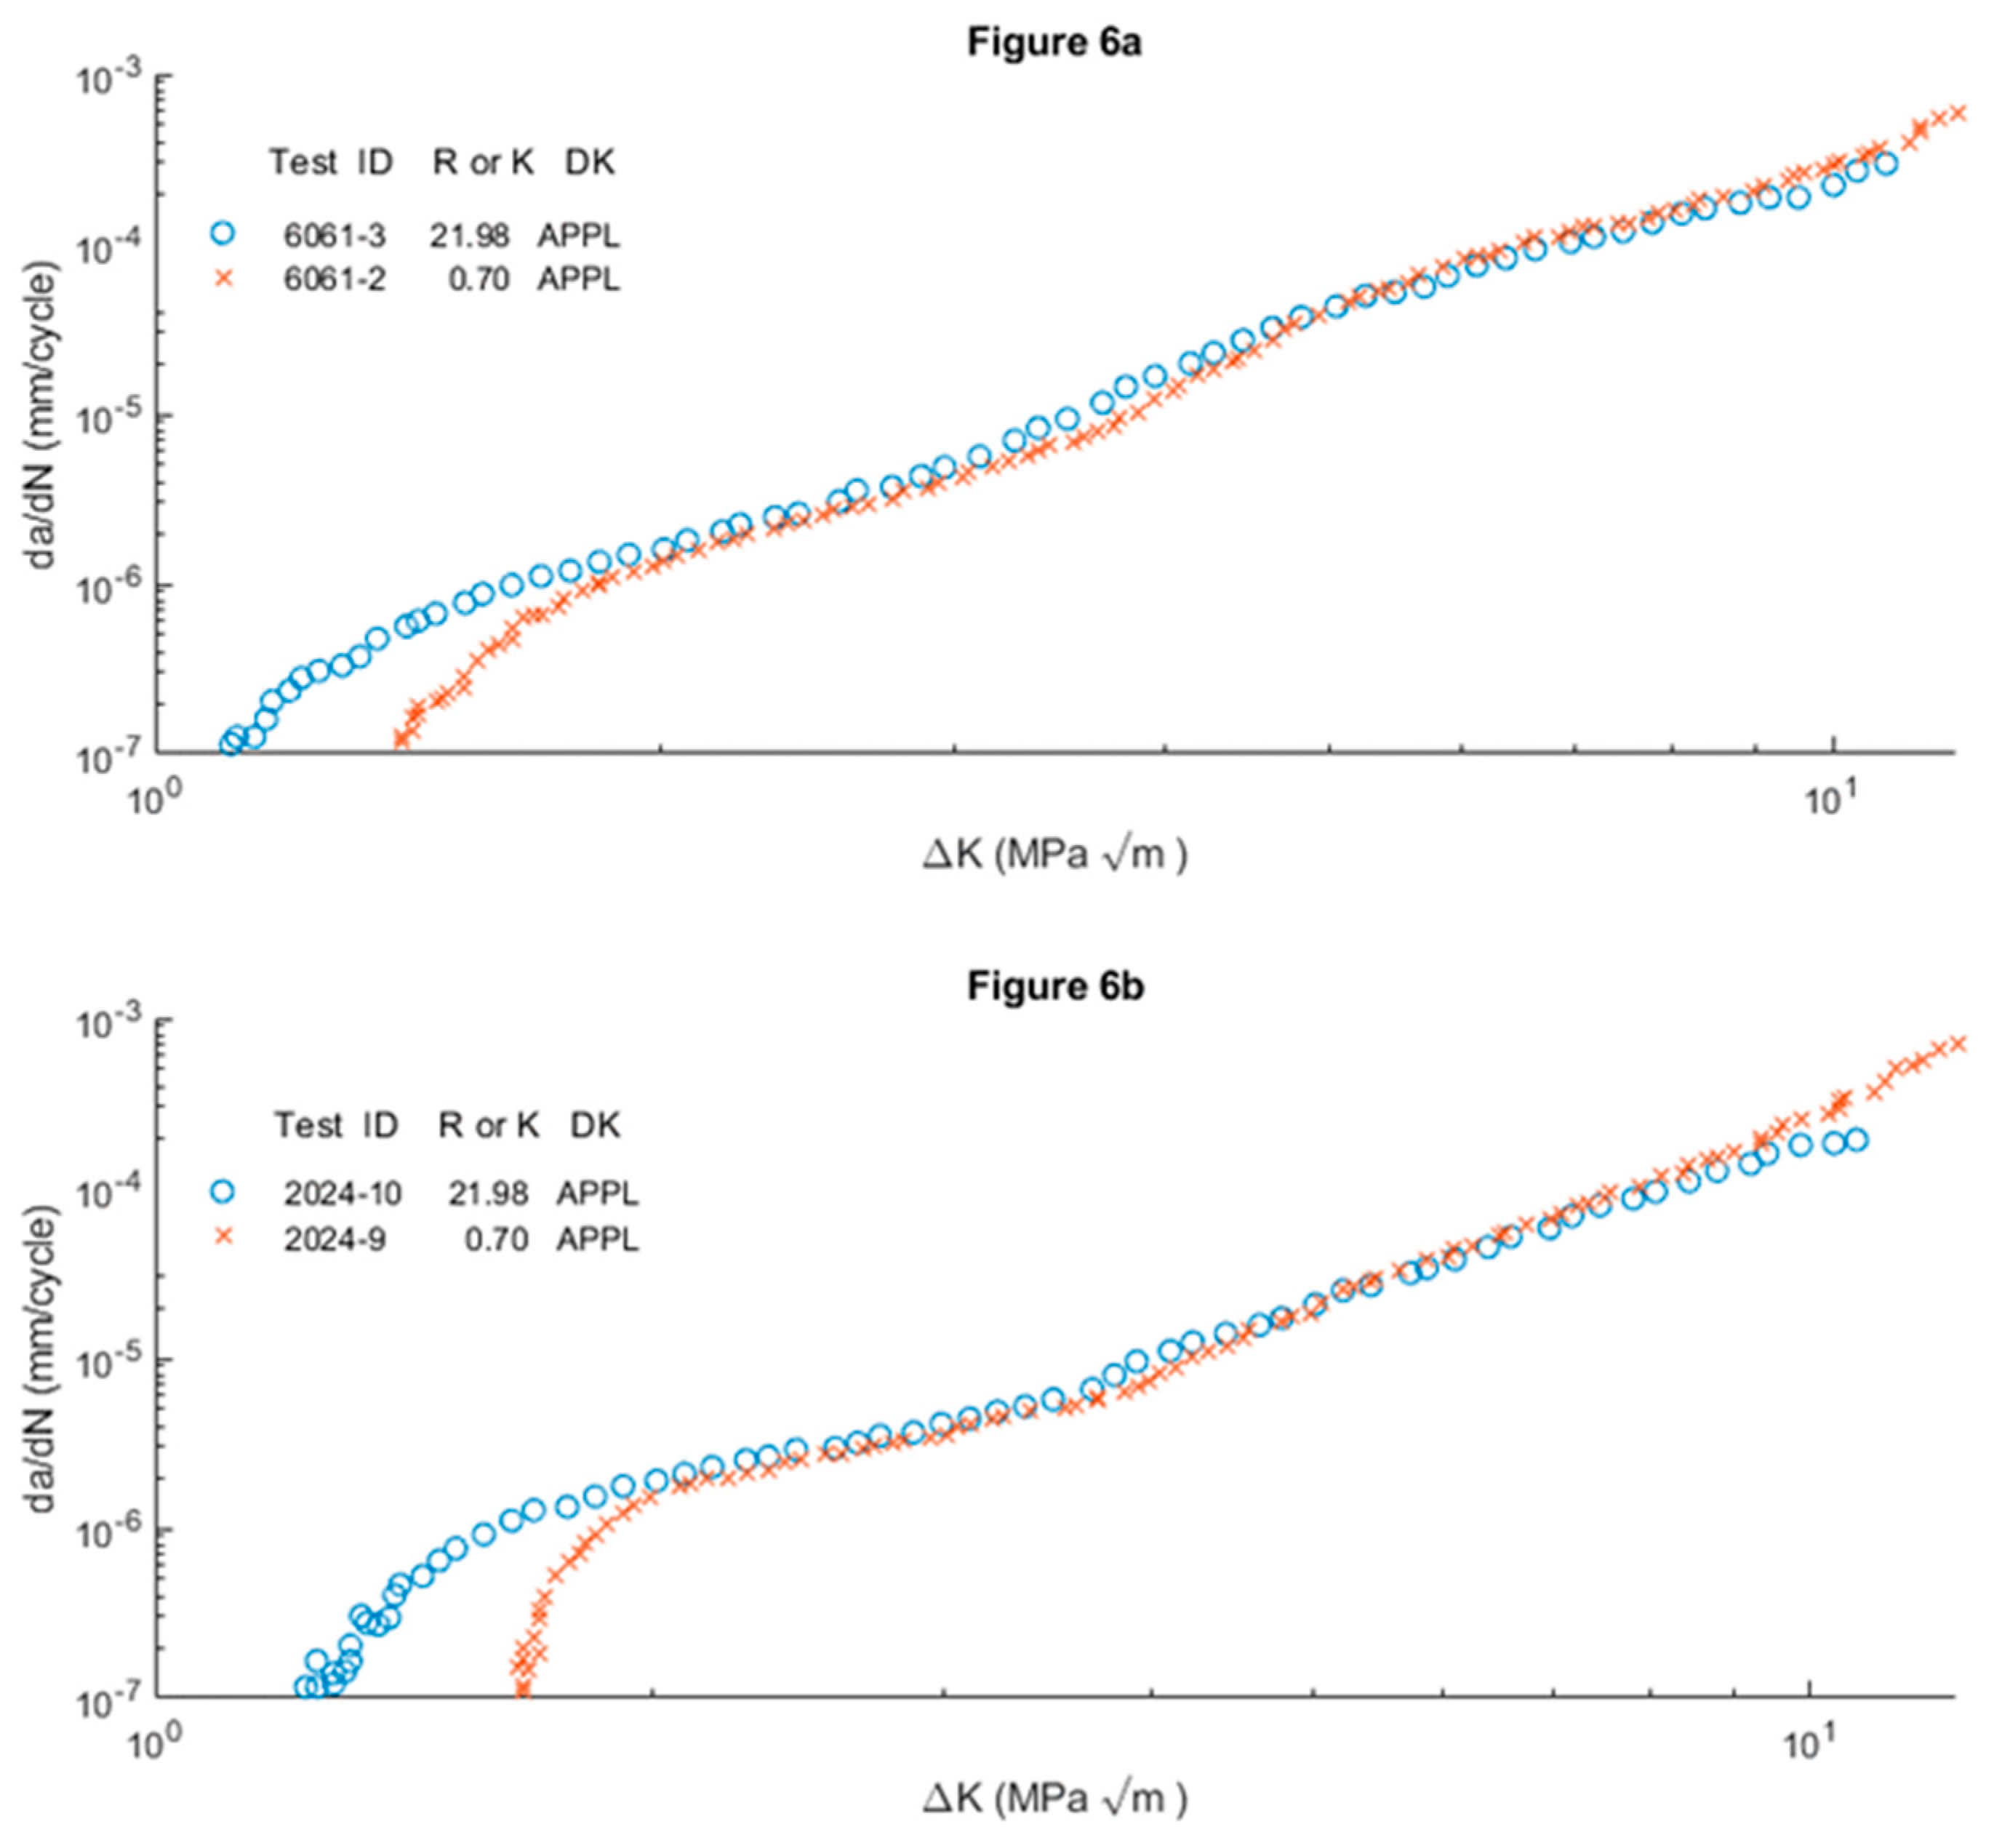
58]Donald and Paris presented a paper in which a method for calculating the ΔK
eff was established based on the Adjusted Compliance Method (ACM). Subsequently, the Crack Wake Influence (CWI) is used to understand the intrinsic limitations of the ACM, and by applying adjustments to account for the CWI and its mechanisms, develop an improved model. Starting from the expression of ΔK
eff =K -K
maxop, corrections are applied to arrive at eq.6 which basically has the same parameters (ΔK
eff, K
max and K
op,) but with different nuances.
The application of ACR leads to the expression ΔK
eff =ACR-ΔK
app, where ACR is a coefficient. The CWI method will be modelled by subtracting K
cwi from K to obtain K
eff, K
cwi is related to V
cwi which is the midline shift in a series of equations to obtain the final expression of K
eff in eq7. Two further modifications are proposed based on the adjusted compliance ratio method and the adjusted compliance ratio/opening load blend method. From this point on, the study focuses on representing the FCGR versus the ΔK, both experimental and those obtained in the models, an example of which is shown in
Figure 6. The FCGR will be the da/dN expressed in mm/Cyc and the ΔK the different intensity factors proposed in MPam
0.5. In total 7 different methods of estimating the effective intensity factor are compared. The ACR method is easy to apply but does not reflect crack closure well. The CWI is mathematically more complex to apply, limiting its applicability. ACRn2 improves the problems of ACR without adding mathematical difficulty and finally AOP is very simple because it is empirical.
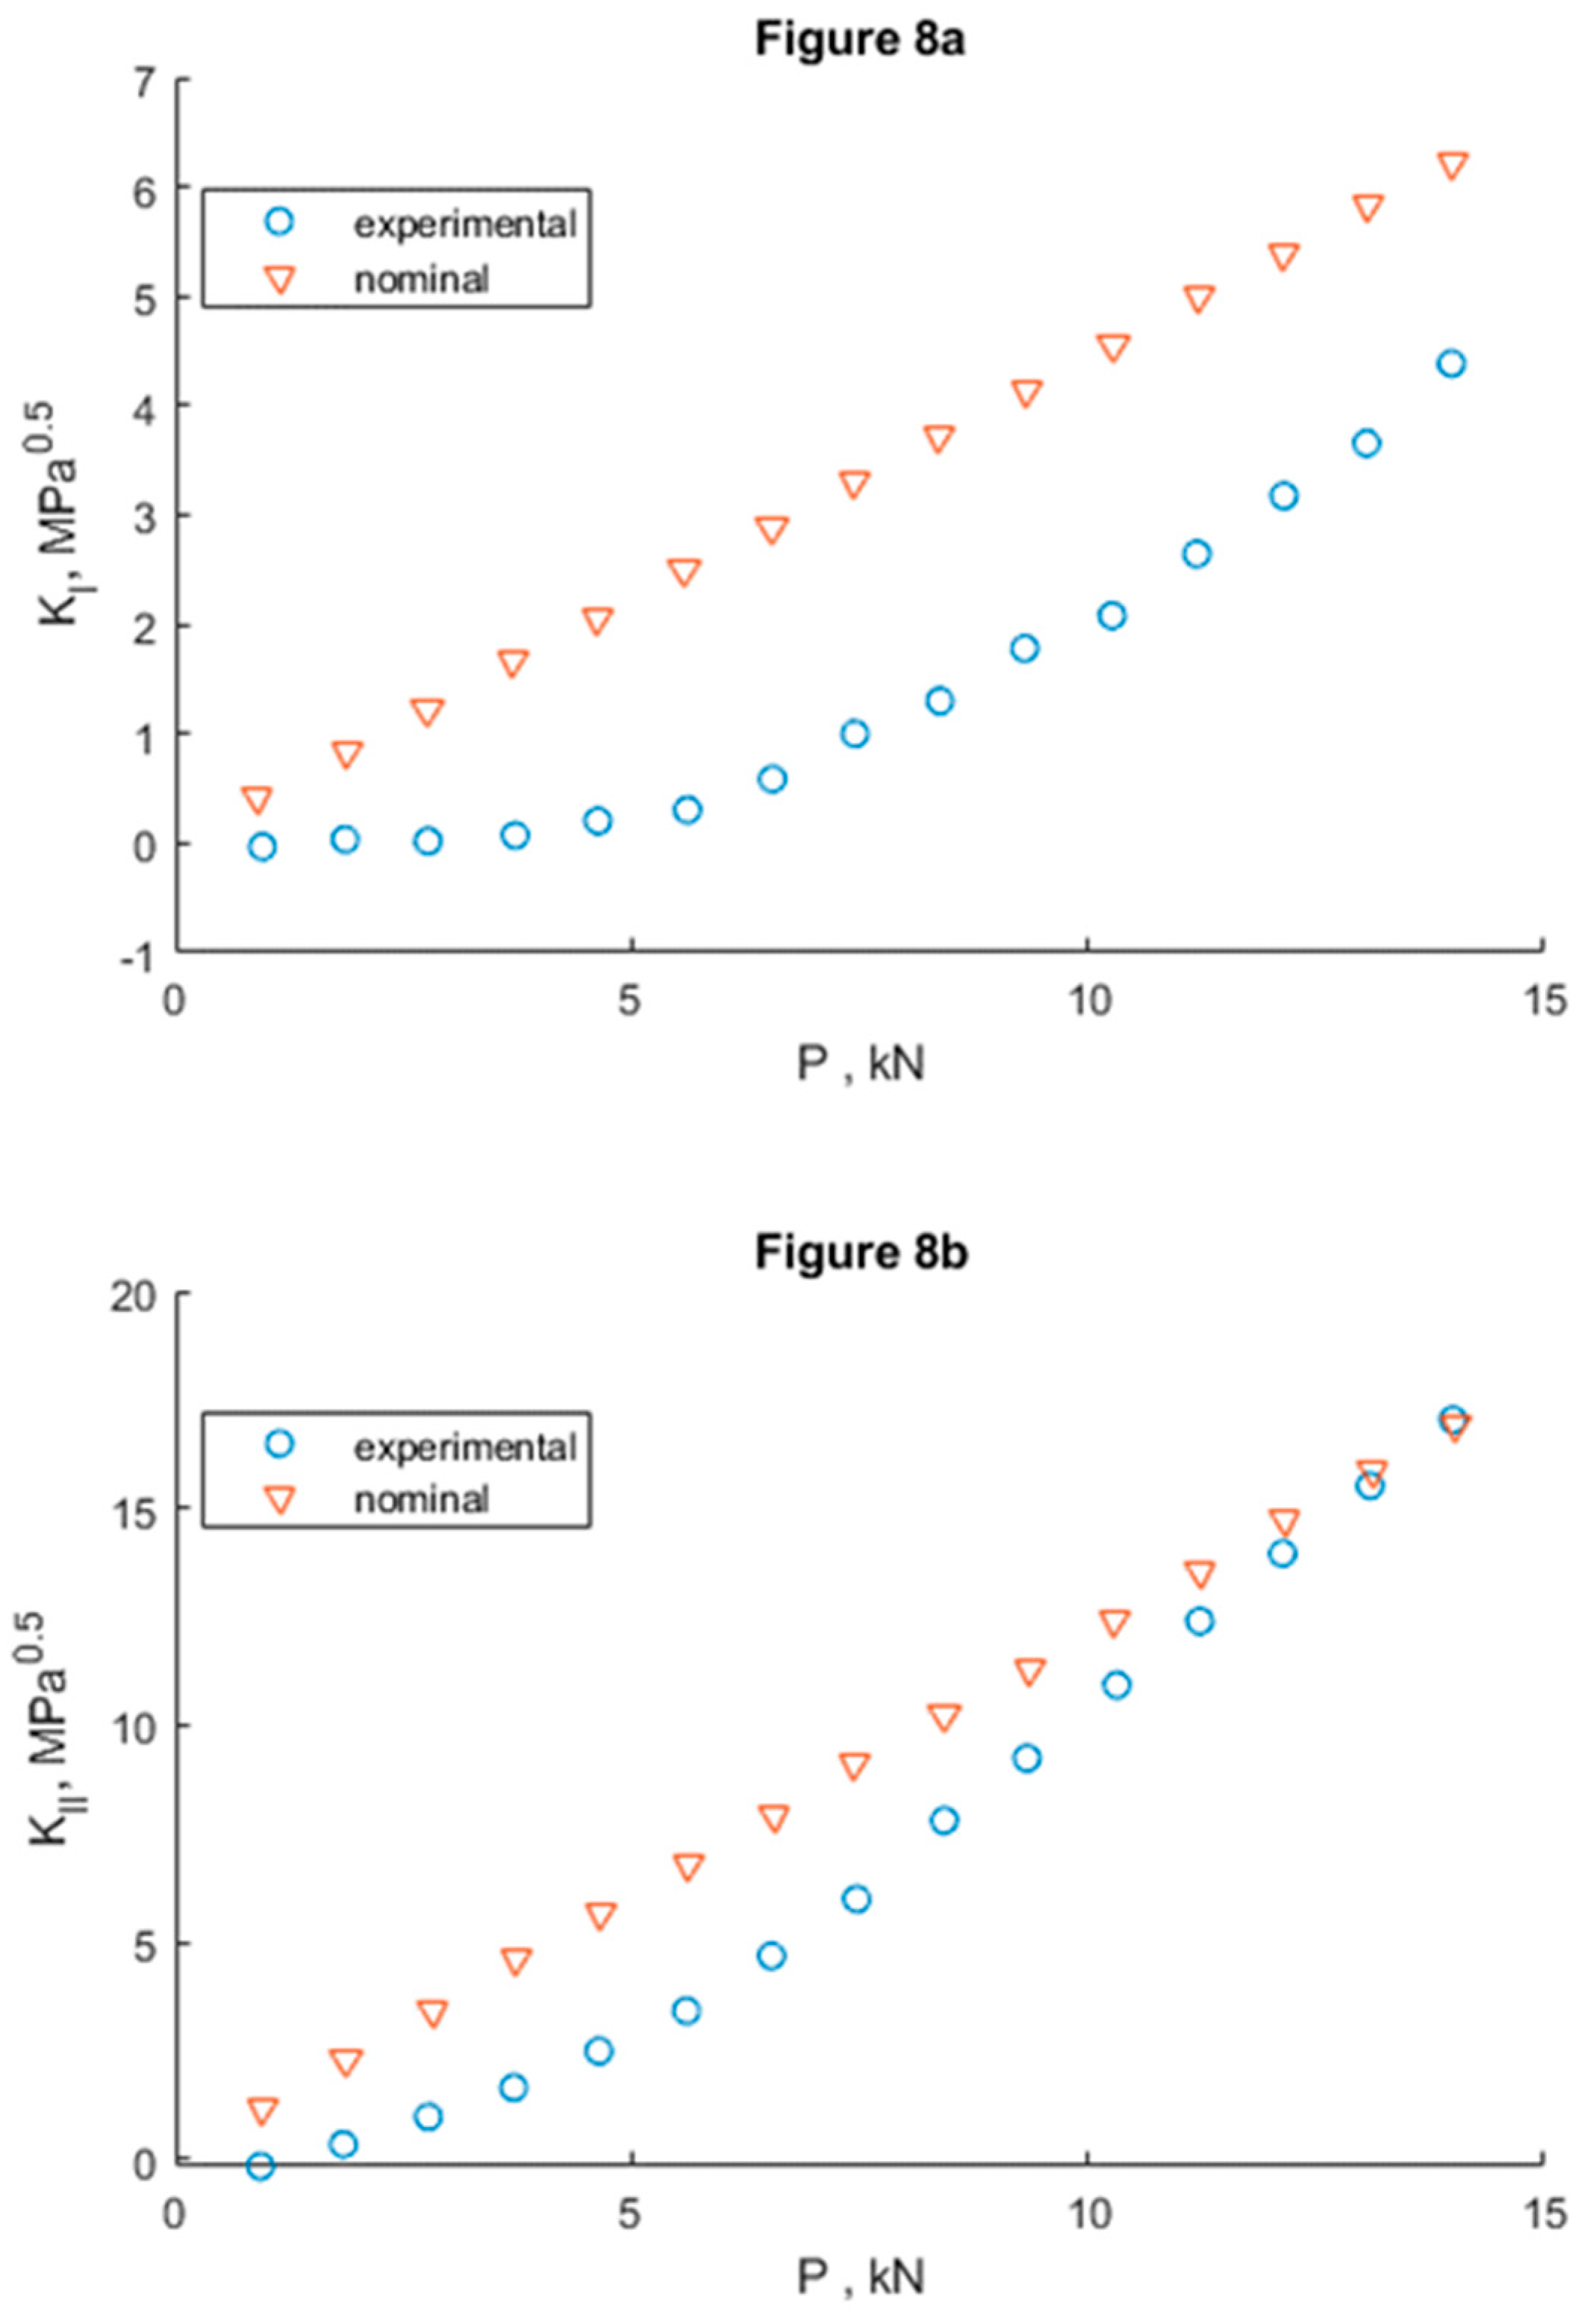
Medhi et al. [
59]propose a methodology for structural health monitoring based on a combination of digital image correlation and an analytical elastic solution. Experimentally (DIC), the full displacement field around the crack tip in a TC specimen made of 2024-T351 aluminium alloy under cyclic loading at different load levels is obtained. Then, an over deterministic multipoint method is used to calculate the stress intensity factor in modes I and II (K
I and K
II in eq. 5 in the original publication), to apply the method it is necessary to adjust the experimental displacement field obtained with the series of William [
60]. The parameter was determined to facilitate the difference between the SIF result of the (nominal) model and the experimental one. It was observed that, with increasing amplitude in cyclic loading, the difference between nominal and experimental K increased. This may be because of crack tip plasticity, which was not considered in the nominal evaluations. To account for plasticity, Irwin's approximation was used in the analytical model. The plastic term is added to the crack length, a
corr =a+r
y, where r
y is the plastic radius given by the Irwin approximation in eq8. The results showed a better agreement in the evolution of K under cyclic conditions, increasing the load up to the sharp fracture of the specimen.
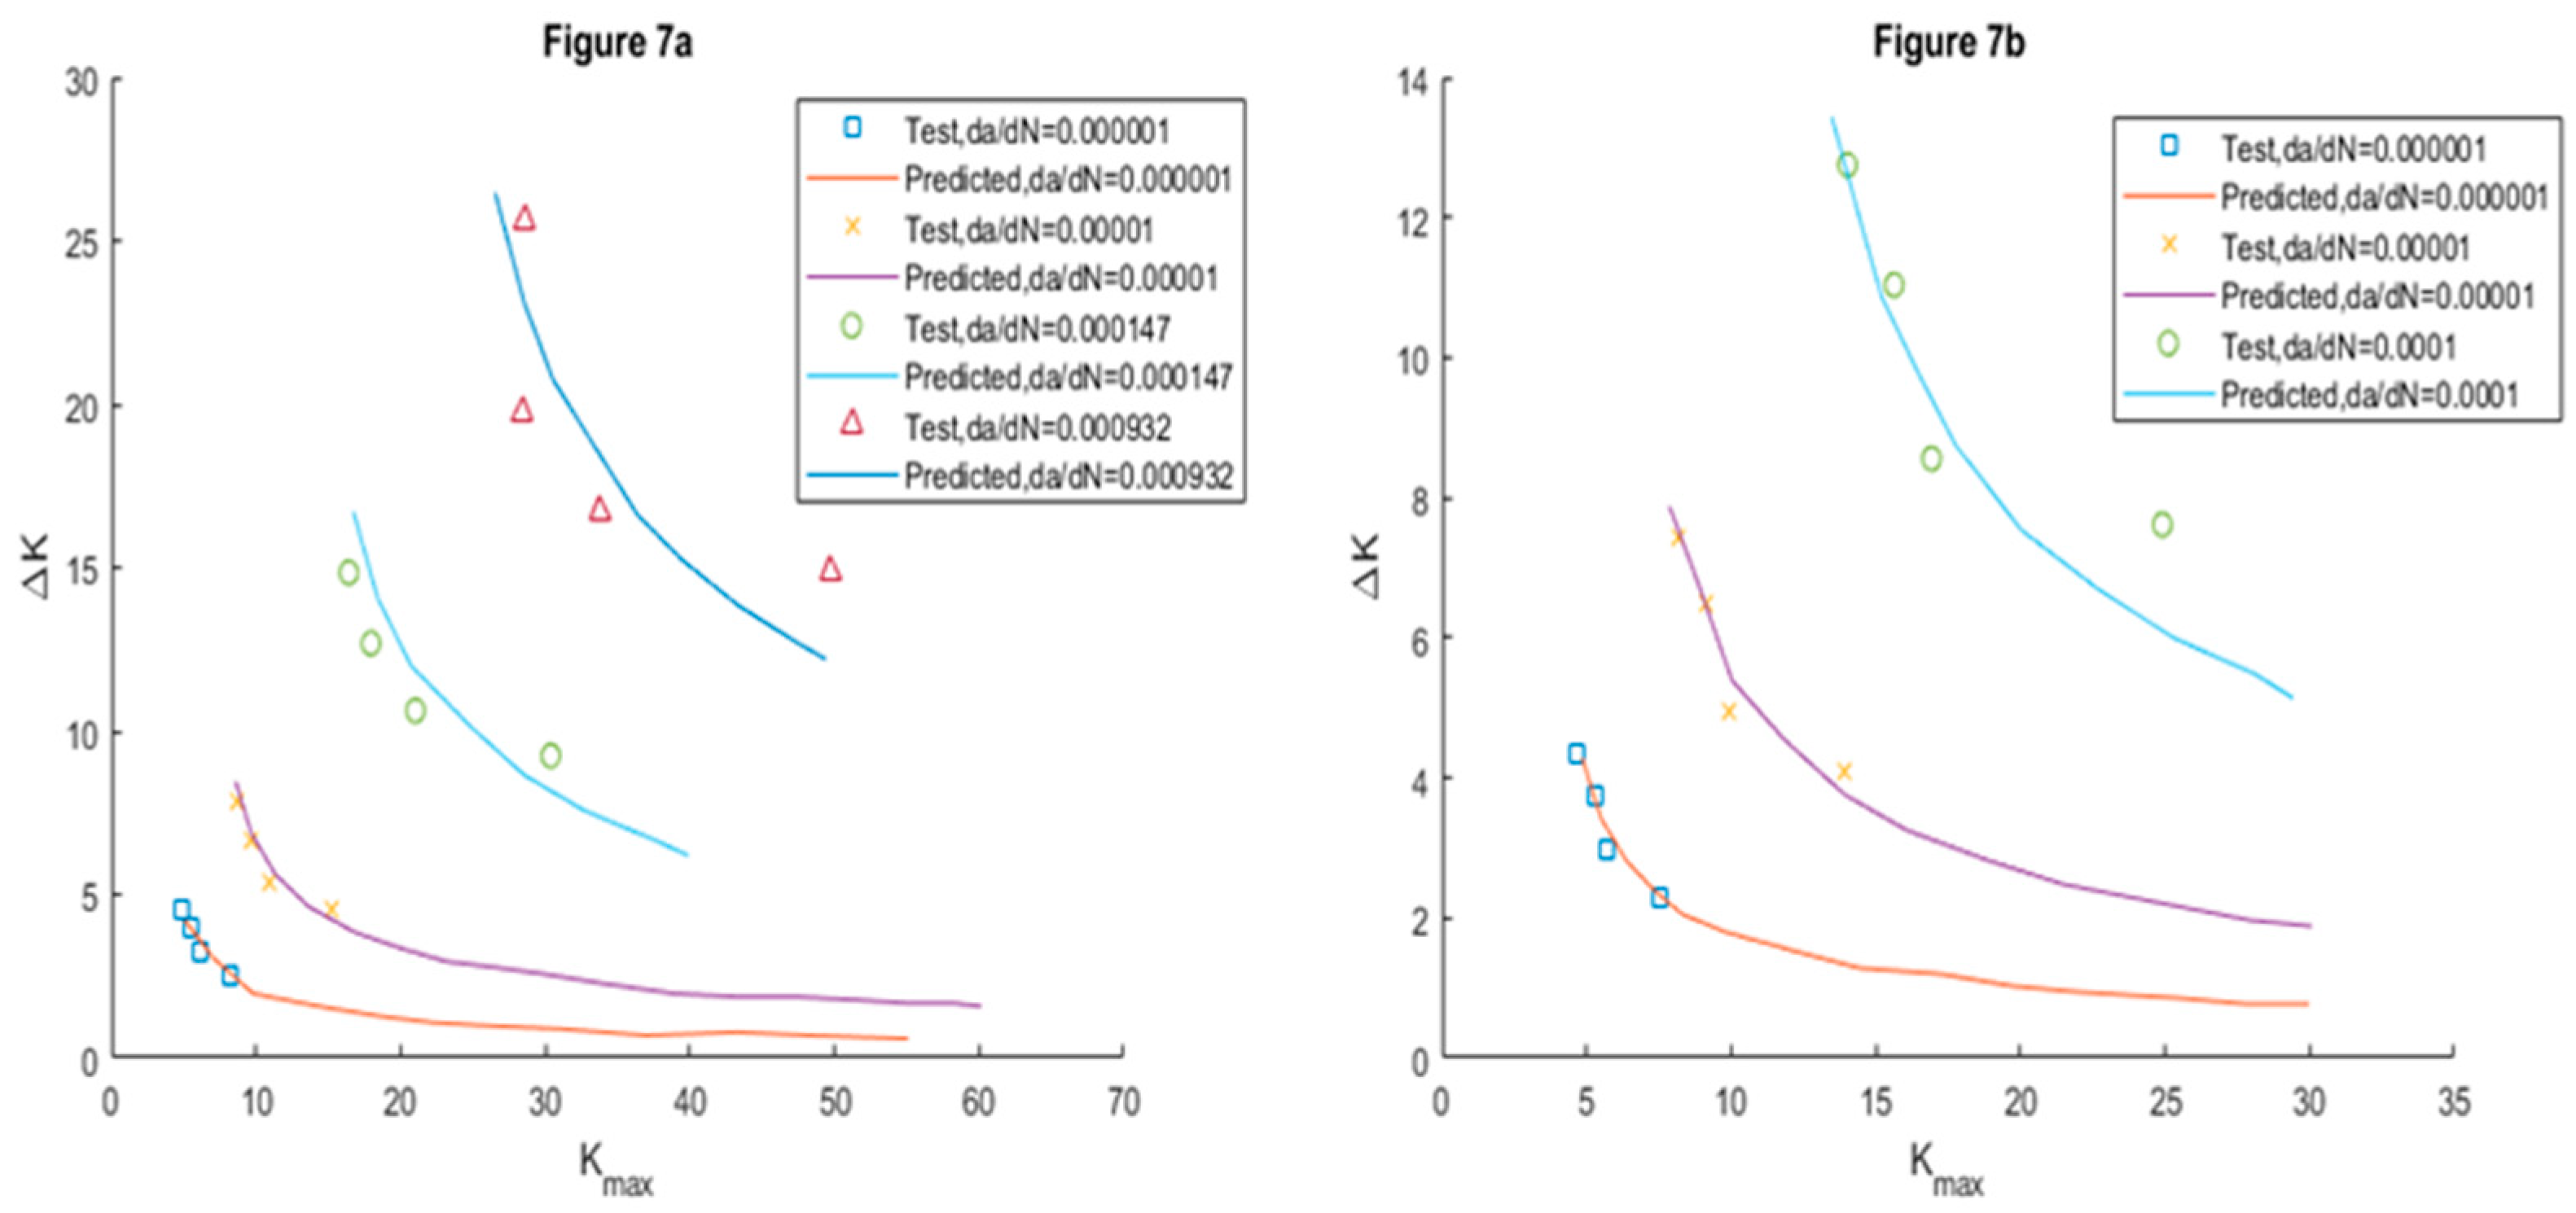
Zhang et al. [
51]presented a model based on two parameters, the classical da/dN and the novel da/dS that defines the crack propagation velocity with respect to the applied stress at any time of the cycle. Experimental methods were used to predict the crack propagation behaviour. The mentioned parameters are related and, developing mathematically, an expression is reached where da/dN is expressed as a function of ΔK, α, β and, where α and β (eq.8, in the original publication it is eq.20 and has a typo in the denominator) can be estimated from the results of two constant stress amplitude fatigue tests. The correlations of the experimental results with those proposed by the models are shown in
Figure 7.
The objectives of the work [
61] were to measure crack length and fatigue crack closure to analyse the variation of crack growth rate with K
max or ΔK
eff for different values of R (stress ratio) and B (specimen thickness), to obtain the da/dN-ΔKeff curves, and to propose an empirical model that correlates a new normalised loading parameter U with R, B and ΔK. The results are obtained for constant load amplitude in tension with 3 stress ratios: R=0, 0.2 and 0.4 and 3 specimen thicknesses: B=6, 12 and 24 mm. To measure the crack opening values, gauges are used, and with them ΔK
eff. can be calculated. The authors start from a set of equations (1-3 in original publication) to relate in first instance U, K
op and ΔK
eff. . In view of the experimental results (shown in
Figure 4,
Figure 5 and
Figure 6 in the original publication) an experimental relation between da/dN and ΔK
eff and a readjustment of U is proposed, as a final model the relation between da/dN and ΔK
eff in eq. 9 remains. An important conclusion obtained in the work is that, despite some scatter in obtaining the da/dN - ΔK
eff curves, the results of the stress ratios and thicknesses are presented by a simple curve for two parameters of the crack growth rate relationship applied to CK45 steel. A model of U as a function of R, B and DK has been proposed based on the experimental data of the crack closure. This model is limited to 0<R<0.4 and 6<B<24 mm.
The researcher [
23] proposes an improvement to the partial crack closure model proposed by Donald and Paris. The improvement consists of a transition function that evolves from the Donald and Paris partial closure model. [
58,
62] to the model in the region close to the Elber growth threshold. [
63]. Elber proposed the ΔK
eff =K-K
maxop, establishing an effective intensity factor that in turn depended on the intensity factor at crack opening. The model proposed in this paper is developed (in equations 3-10 in the original publication), resulting in eq.10 for ΔK
effM, which adequately correlates the effects of R-ratio on crack growth at low and intermediate load levels in aluminium alloys. Until the publication of this research the effect of R-ratio had been systematically neglected, it is worth noting that the R at the crack tip does not necessarily coincide with that applied to the specimen. It is noteworthy that the key parameter in this model, ΔK
effM, is related to the crack opening profile which obviously depends on the plastic deformation at the apex. Experimental tests show that the proposed model shows improvements to the model in the Elber growth threshold region.
Pablo et al. [
64] undertook an analytical-experimental study of the effect of crack closure and plasticity at the crack apex on Mode I and II intensity factors. The experimental laboratory work consisted of obtaining the displacement field at the crack tip and its environment with DIC techniques on two types of CCP and WOL specimens that had been previously initiated with a crack itself, not a notch. The analytical development is based on formulating the displacement field on the specimen surface as two-dimensional, u and v being the horizontal and vertical displacements respectively and expressing them as a complex number z=x+iy. In turn, these displacements can also be obtained from two analytical Muskhelishvili functions φ = φ(z) ψ=ψ(z) (eq. 11). These expressions can be derived by obtaining expressions as a function of u, v and the coefficients (C, D, E, F, α and β). Applying basic tensor algebra, it can be expressed in a matrix form Aχ=b where b is the vector that depends on the displacements u and v. From there it is straightforward to calculate the coefficients (C, D, E, F, α and β) of the matrix A and back in eq.11 calculate the analytical functions φ = φ(z) and ψ=ψ(z). Ultimately the complex stress intensity factor K=K
I -iK
II can be calculated with the above data using eq.12.
Figure 8 plots the intensity factor K, the effective intensity factor K
eff and the real and imaginary components of the intensity factor K
I and K
II. The difference in values obtained with the model and those obtained experimentally. This is since the model lacks the crack closure effect, while experimentally there were clear indications of its existence and possible effects.
Pokluda [
65] presented a discrete model for small plastic deformations under plane strain conditions that allows direct evaluation of the magnitude of induced crack closure components, such as plasticity (PICC) and roughness (RICC). It also determines an influence of the microstructure on the induced roughness. The advantage of the dislocation-based method over those based on continuous mechanisms is its "physical transparency" which allows the evaluation of both induced plasticity and roughness at the same time. Based on measurements taken on an array symmetrical to the crack, experimental measurements are taken, and plane strain is allowed for the interpretation of the measurements. In this case, we want to know the stress state on the crack flanks (position of the array), this stress state is the cause of the PICC and RICC. A model is proposed under certain hypotheses for the calculation of the PICC and RICC components, ΔK, K
max, K
eff, K
cl, rs, K
cl, rl and K
cl, p. The subscripts cl stands for closure, rs range-short, rl range-long,
advantage of the dislocation-based method over those based on continuous mechanisms is its "physical transparency" which allows the evaluation of both induced plasticity and roughness at the same time. Because of measurements taken on an array symmetrical to the crack, experimental measurements are taken, and plane strain is allowed for the interpretation of the measurements. In this case, we want to know the stress state on the crack flanks (position of the array), this stress state is the cause of the PICC and RICC. A model is proposed under certain hypotheses for the calculation of the PICC and RICC components, ΔK, K
max, K
eff, K
cl, rs, K
cl, rl and K
cl, p . The subscripts cl stands for closure, rs range-short, rl range-long, p plasticity. Once these characteristic parameters of RICC and PICC are calculated, they can be related to crack growth as deemed best. Finally, ΔK
eff = K
max -K
cl; K
max =ΔK/(1-R), and the expression is given in eq13.
3. THEORY OF CRITICAL DISTANCES (TCD)
In the following works [
66,
67] a numerical model based on the theory of critical distances (TCD) is proposed, this theory is not new. [
5,
68] and basically consists of ensuring that crack propagation will occur when a certain physical quantity, at a given location in front of the crack front, reaches a specific value. In this work, this theory is partially modified to model the crack growth rate, the point method (PM) is adopted, and the physical quantity will be the Plastic Energy dissipation in front of the crack tip, at the critical point. The numerical model is developed with Abaqus, under plane strain conditions due to the thin thickness of the specimens, a total of 7667 4-node elements with reduced integration were used and the minimum mesh size in the crack is less than 10 µm. Crack closure is modelled with the contact of the fronts, the linear penalty method coupled with an augmented Lagrangian algorithm was implemented to improve the accuracy of the overpressure during closure, also the frictionless sliding of the crack plane along the x-axis of contact was allowed. One of the critical points of this work, evidently, is the calculation of the plastic energy dissipated in each cycle for its parametric use as damage, and, therefore, causing the fatigue crack advance. For this purpose, an equation is proposed that basically integrates the stress over the plastic strain differential. To model the crack propagation, we must consider the mesh size in the order of 2.5-7.5 µm with the actual growth rate being around 0.1 µm /cycle, it quickly follows that many cycles must accumulate in the numerical model before the next node is released. During this accumulation of cycles, we have a stationary regime, which becomes transient when the energy accumulates at the critical distance and the crack propagates releasing the corresponding node. The modelling of crack propagation requires a specific post-processing program. Two are the key input parameters, the L
CD, the Critical Distance Length, and the E
C, the Critical Plastic Energy. The determination of these parameters is of vital importance. For this purpose, the da/dN vs ΔK curves are determined experimentally.
Figure 9 plots the numerical results obtained for the da/dN vs ΔK curves for different values of L
CD and E
C. Finally, the parameters are fitted with the least-square method at L
CD =17.5µm and E
C =0.55 J/mm
3. Good correlations between the model and the experimental results are observed.
Finally, it is studied how mesh size and microstructure size affect, the latter was done because the adjusted critical distance is of the order of the microstructure size, and several authors have previously focused on this detail. [
69,
70]. Subsequently, in another paper [
67] the same authors tested the goodness of the method against varying conditions of overload, underload, acceleration and deceleration of the loading cycles, as well as the moment (crack length) at which this is done. The model responds satisfactorily with respect to the experimental results obtained. This article [
71] aims to compare the predictive capabilities of TCD based on a damage parameter, specifically four different ones were analysed. It also relates local strains and stresses to evaluate the fatigue life of notched components subjected to bending-torsion. The fatigue damage parameters tested are defined using well-known stress-based, strain-based, SWT-based, and energy-based relationships. Multiaxial cyclic plasticity in the notch zone has been modelled with 3D Finite Elements, using three local stress-strain approaches: Neuber's rule, equivalent strain energy density rule (ESED) and the modified rule (ESEDM). Neuber's rule always led to more conservative results, and the modified ESED rule gave slightly better fatigue life predictions compared to the original ESED rule. As for the fatigue damage parameters, the energy-based models were more accurate.
Table 2.
Damage parameters.
Table 2.
Damage parameters.
| Damage parameter |
Equation |
| Stress |
σa = (σ'f -σm) (2Nf) b |
| Strain |
εa = (σ'f - σm) (1/E) (2N) fb +ε'f (2Nf) c |
| Energy |
ΔWt = κt (2Nf) αt +ΔW0t
|
| SWT |
εa σmax = (σ'f )2 (1/E) (2N) f2b + ε'f (2Nf) c+b
|
The aim of this work [
72] is to predict the fatigue life of 6201-T81 aluminium alloy wires containing geometric discontinuities using the Theory of Critical Distances (TCD). The equivalent stress was evaluated by the Point Method (PM) and the Volume Method (VM), based on the maximum principal stress (σ
I). Regarding the latter method, the relationship between the critical distance and the number of cycles to failure was calibrated using two different methodologies. When life estimations were performed based on the first calibration, the results were considered unsatisfactory. However, when the second calibration method was used, almost all predictions fell within scatter bands with respect to the experimental data used to calibrate the model.
Low cycle fatigue life (LCF) prediction is critical to ensure the structural integrity of the engine. It is developed [
73] a concept of strain energy gradient and a general procedure is established that combines the energy concept with the critical distance theory for life prediction of components with notches in LCF. There is a relationship of the strain energy distributed within the effective damage zone and fatigue crack growth. For specimens with GH4169 and TC4 notches, as well as a case study of a high-pressure turbine disc, the proposed procedure provides better life correlations than the Fatemi-Socie and Smith-Watson-Topper models.
4. ENERGY-BASED THEORIES OF DAMAGE
Pommier and Risbert presented a paper [
37] where the main objective was to propose a set of equations time derived for fatigue crack growth in order to avoid any deconstruction of the cycle. The model is based on the thermodynamics of dissipative processes. Its main originality lies in the introduction of a supplementary state variable for the crack, which allows the crack state to be described continuously throughout any complex loading sequence. The crack state is fully characterised on a global scale by its length a, its plastic blunting ρ and its elastic opening ∆CTOD. The plastic blunting is calculated by integrating the difference of the elastoplastic and elastic displacement at the crack tip along d, and dividing the result by d. The model starts from an energy balance of the crack where D is the dissipated energy which is formulated in eq.14. Together with the Clausius Duhem inequality they are combined in the expression of da/dN in eq. 15. The model finally consists of two laws: a crack propagation law, which is a relation between dρ/dt and da/dt and observes the inequality derived from the Clausius Duhem inequality, and an elasto-plastic constitutive behaviour of the cracked structure, which gives dρ/dt versus load and is derived from the energy balance equation. By solving the set of equations with the appropriate boundary conditions, the evolution of the different crack parameters with time is obtained. The model was implemented and tested. It successfully reproduces the main features of fatigue crack growth as reported in the literature, such as the Paris law, the stress ratio effect and the overload retardation effect.
In this research [
74] proposed a new theory of fatigue crack growth in ductile solids based on the total plastic energy dissipation per cycle ahead of the crack. The fundamental hypothesis of the theory proposes a unified criterion for crack growth under monotonic conditions and fatigue loading, so that the fatigue crack growth rate is given explicitly in terms of the total plastic dissipation per cycle and the monotonic plane strain or plane strain, and the fracture toughness of the material. Here, the total plastic dissipation per cycle is obtained by 2-D elastic-plastic finite element analysis of a stationary crack with constant amplitude loading, mode I CT specimens. Initially, the aim is to relate exclusively the fatigue crack growth to the total plastic energy dissipated, emulating the concept of the J-integral as a crack growth parameter. For the calculation of the dissipated energy, a stationary numerical model is proposed in which the possibility of crack closure is not given. The FEM was implemented with ABAQUS, under small elastoplastic deformations and Von-Mises criterion, reduced integration to abolish shear stiffness and minimum element size less than 0.05 µm. The dissipated energy is directly calculated by Abaqus as shown in
Figure 10(a), and
Figure 10(b) shows how the parameters affect the energy. It was obtained as a result that the dissipated energy decreased with hardening. As a result, eq.16 fits a crack growth model as a function of dissipated energy.
The aim of the work [
75] was to demonstrate that fatigue crack growth under elasto-plastic conditions can be perfectly correlated using the concept of physically finding a driving force parameter. In this work that parameter is the cumulative change in the cyclic strain energy of the net section, thereby finding a physical approach independent of geometry and loading conditions, establishing a parameter as the driving force of the crack, which is calculated analytically from the elastoplastic behaviour of the material and the relative sizes of the crack sections in their corresponding planes. The author demonstrates and calculates the stresses (σ), strains (ε), elastic and plastic energies (U), and idem with the energies of the net cross-sections (U
L, in equations 1-14 in the original publication). The applied loads will be cyclic in both, stress and strain control. The author presents an approach based on the treatment of elasto-plastic deformations in the net section, from the resistance of materials point of view. The physical driving parameters of the crack are calculated as the difference of the energy of the net section and the energy before the crack appeared. ΔC
pσ, Equation 17, for stress-controlled fatigue and ΔC
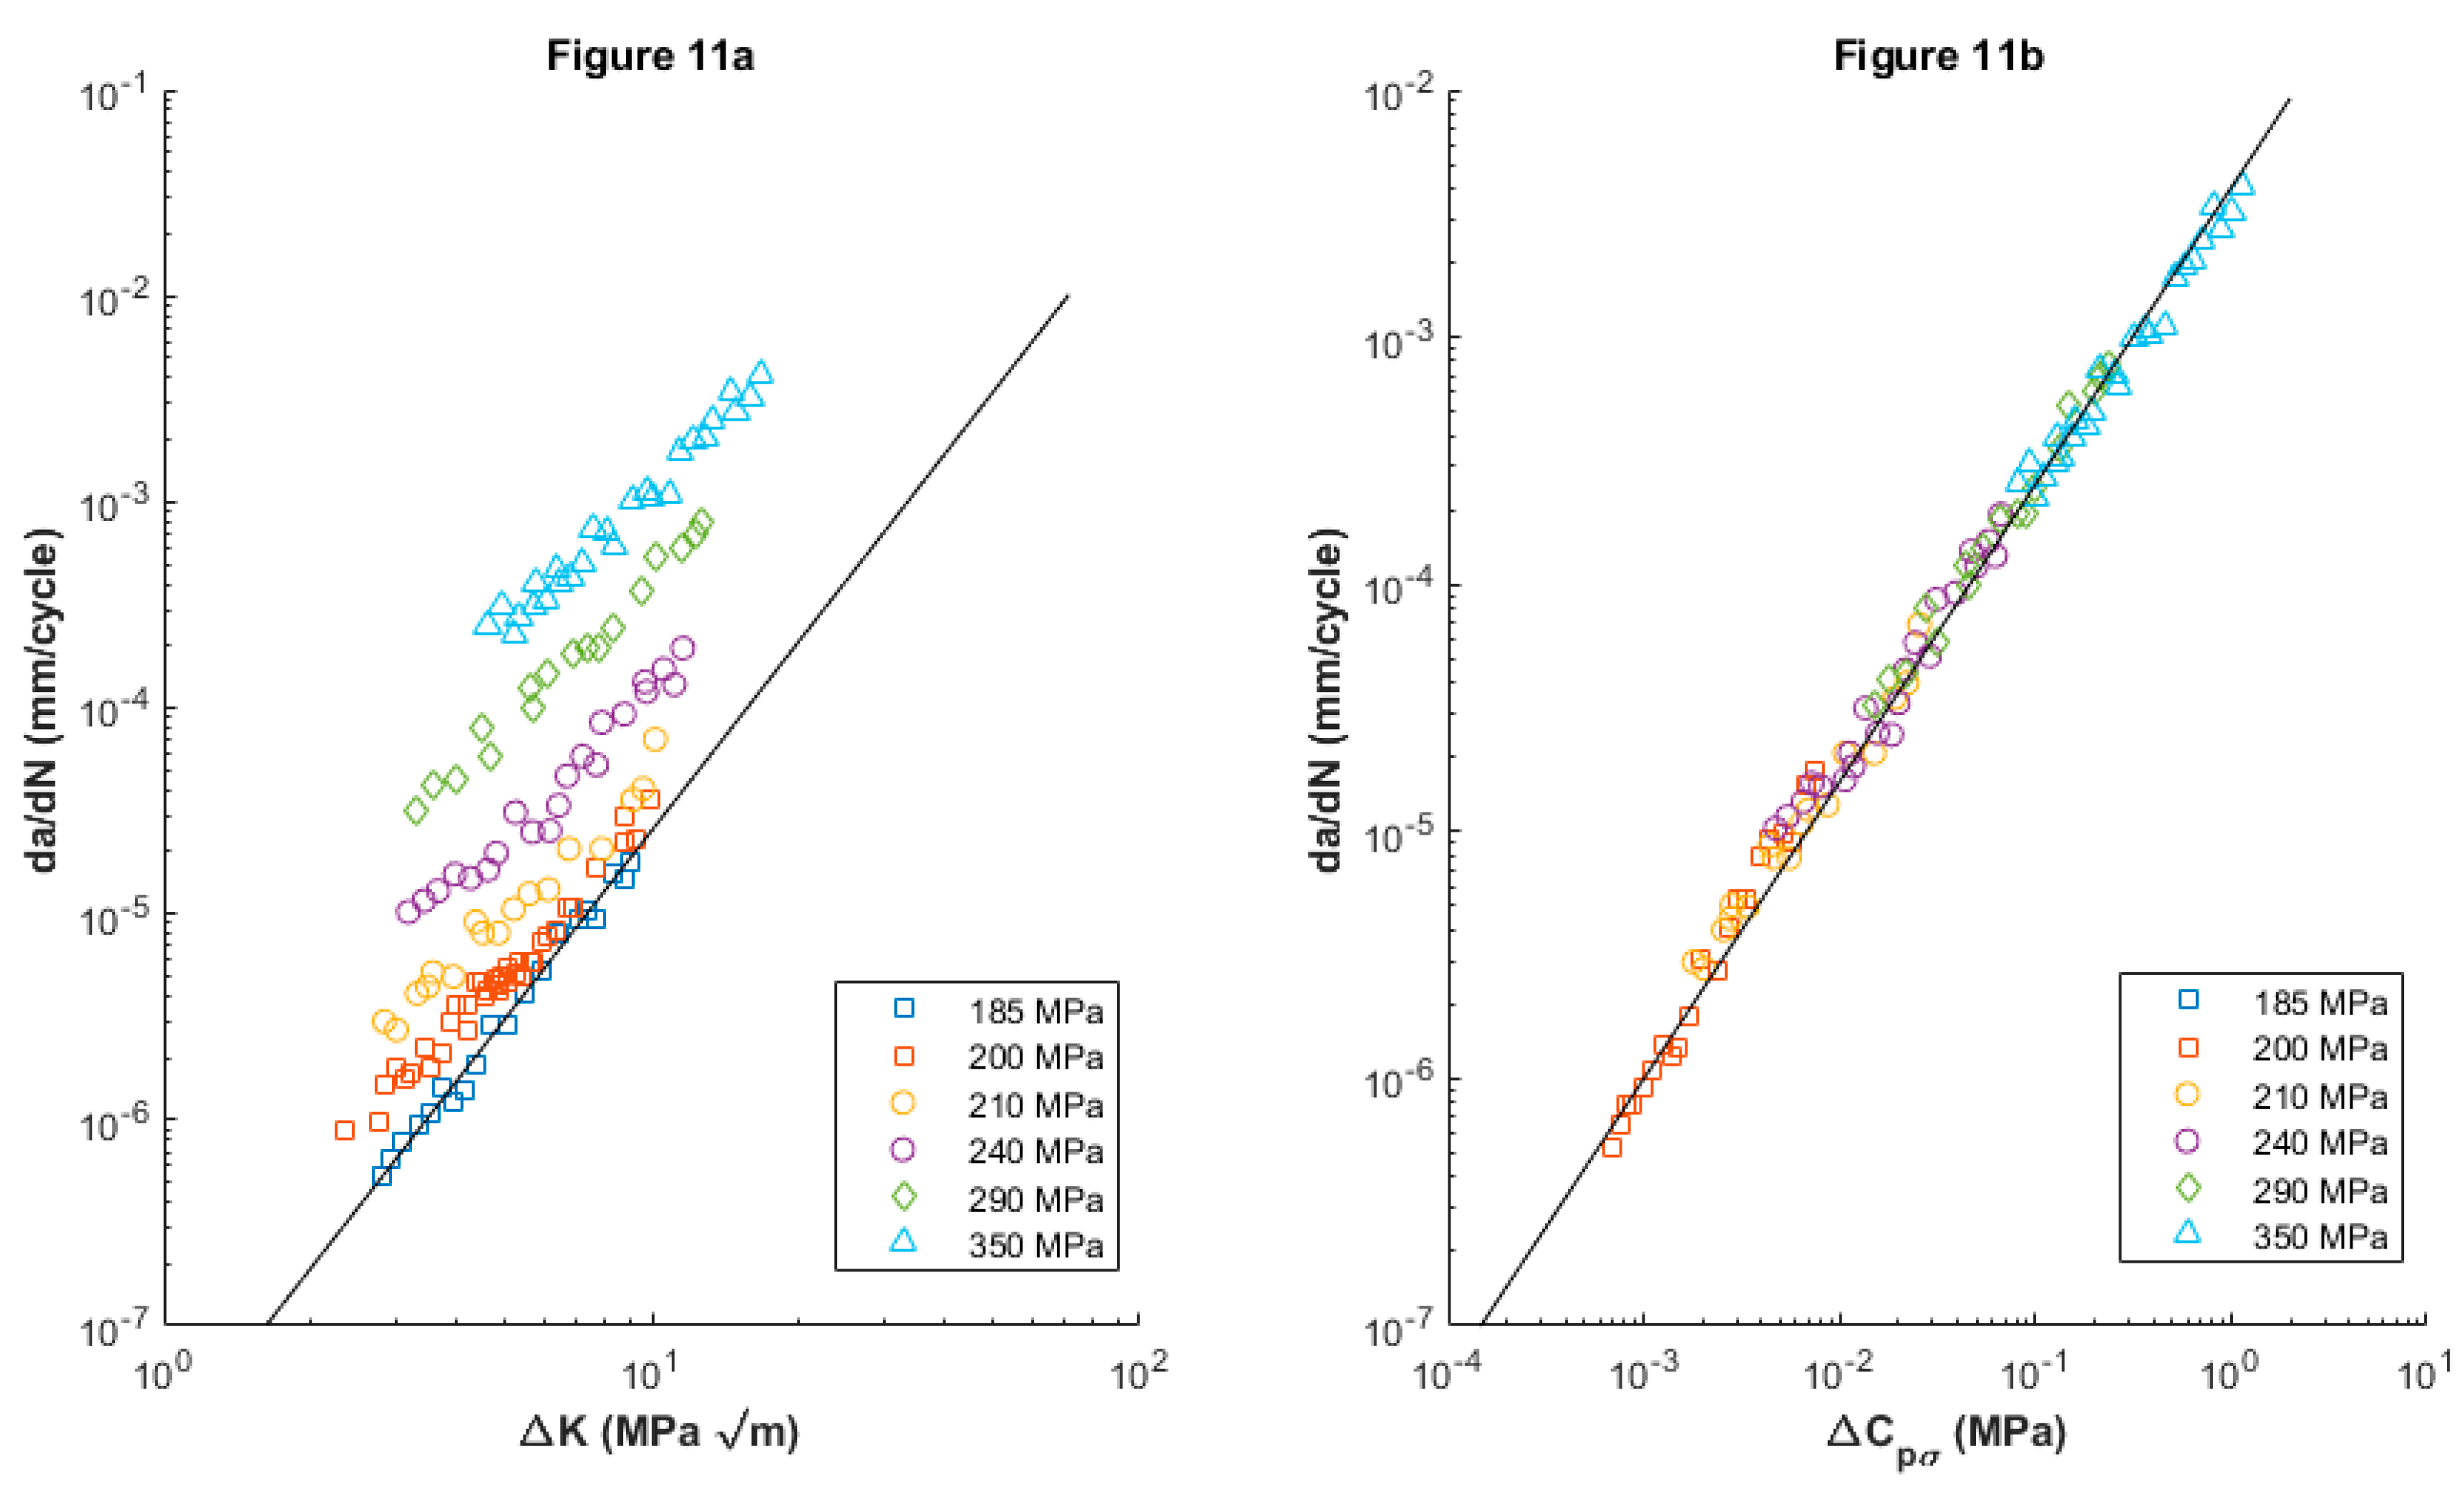
pε , Equation 18, for strain-controlled fatigue. Both parameters are expressed in terms of material hardening and deformation parameters (k, n), crack size (a) and specimen width (W). It achieves excellent correlations between the crack growth ratios as a function of the strain energy parameters in the net section as seen in
Figure 11. Furthermore, the correlations have been obtained without any consideration of the concept of crack closure. As a conclusion, he also adds that this approach can be used in many inelastic deformation situations, such as creep crack growth and crack growth in viscoelastic materials.
It is proposed [
76] an energy equation for fatigue crack growth is proposed. It equates the total external work per cycle (dW/dN) to the sum of the plastic dissipation (dU
pl /dN), the increase in stored strain energy (dU
e /dN) and the energy dissipated in the formation of new crack surface (dU
a /dN). Experimental measurements of fatigue crack growth were performed to obtain the relationship between fatigue crack growth rate (da/dN) and energy variables. The result shows that dU
pl /dN and dU
e /dN are not directly related to da/dN. The dU
a /dN, whose value cannot be obtained experimentally with sufficient regression, may be the variable directly related to da/dN within the test range.
5. CUMULATIVE DAMAGE THEORIES BASED ON STRESS AND/OR STRAIN HISTORY
In this work [
77] a numerical study based on the accumulated plastic deformation is presented to determine which parameters are decisive in fatigue crack growth. As main results, firstly, the need to stabilise the crack growth with initial cycles where the da/dN is not stable is established. Secondly, it is compared with experimental results by defining the percentage of accumulated plastic deformation as the driving parameter of crack growth.
Noroozi et al. [
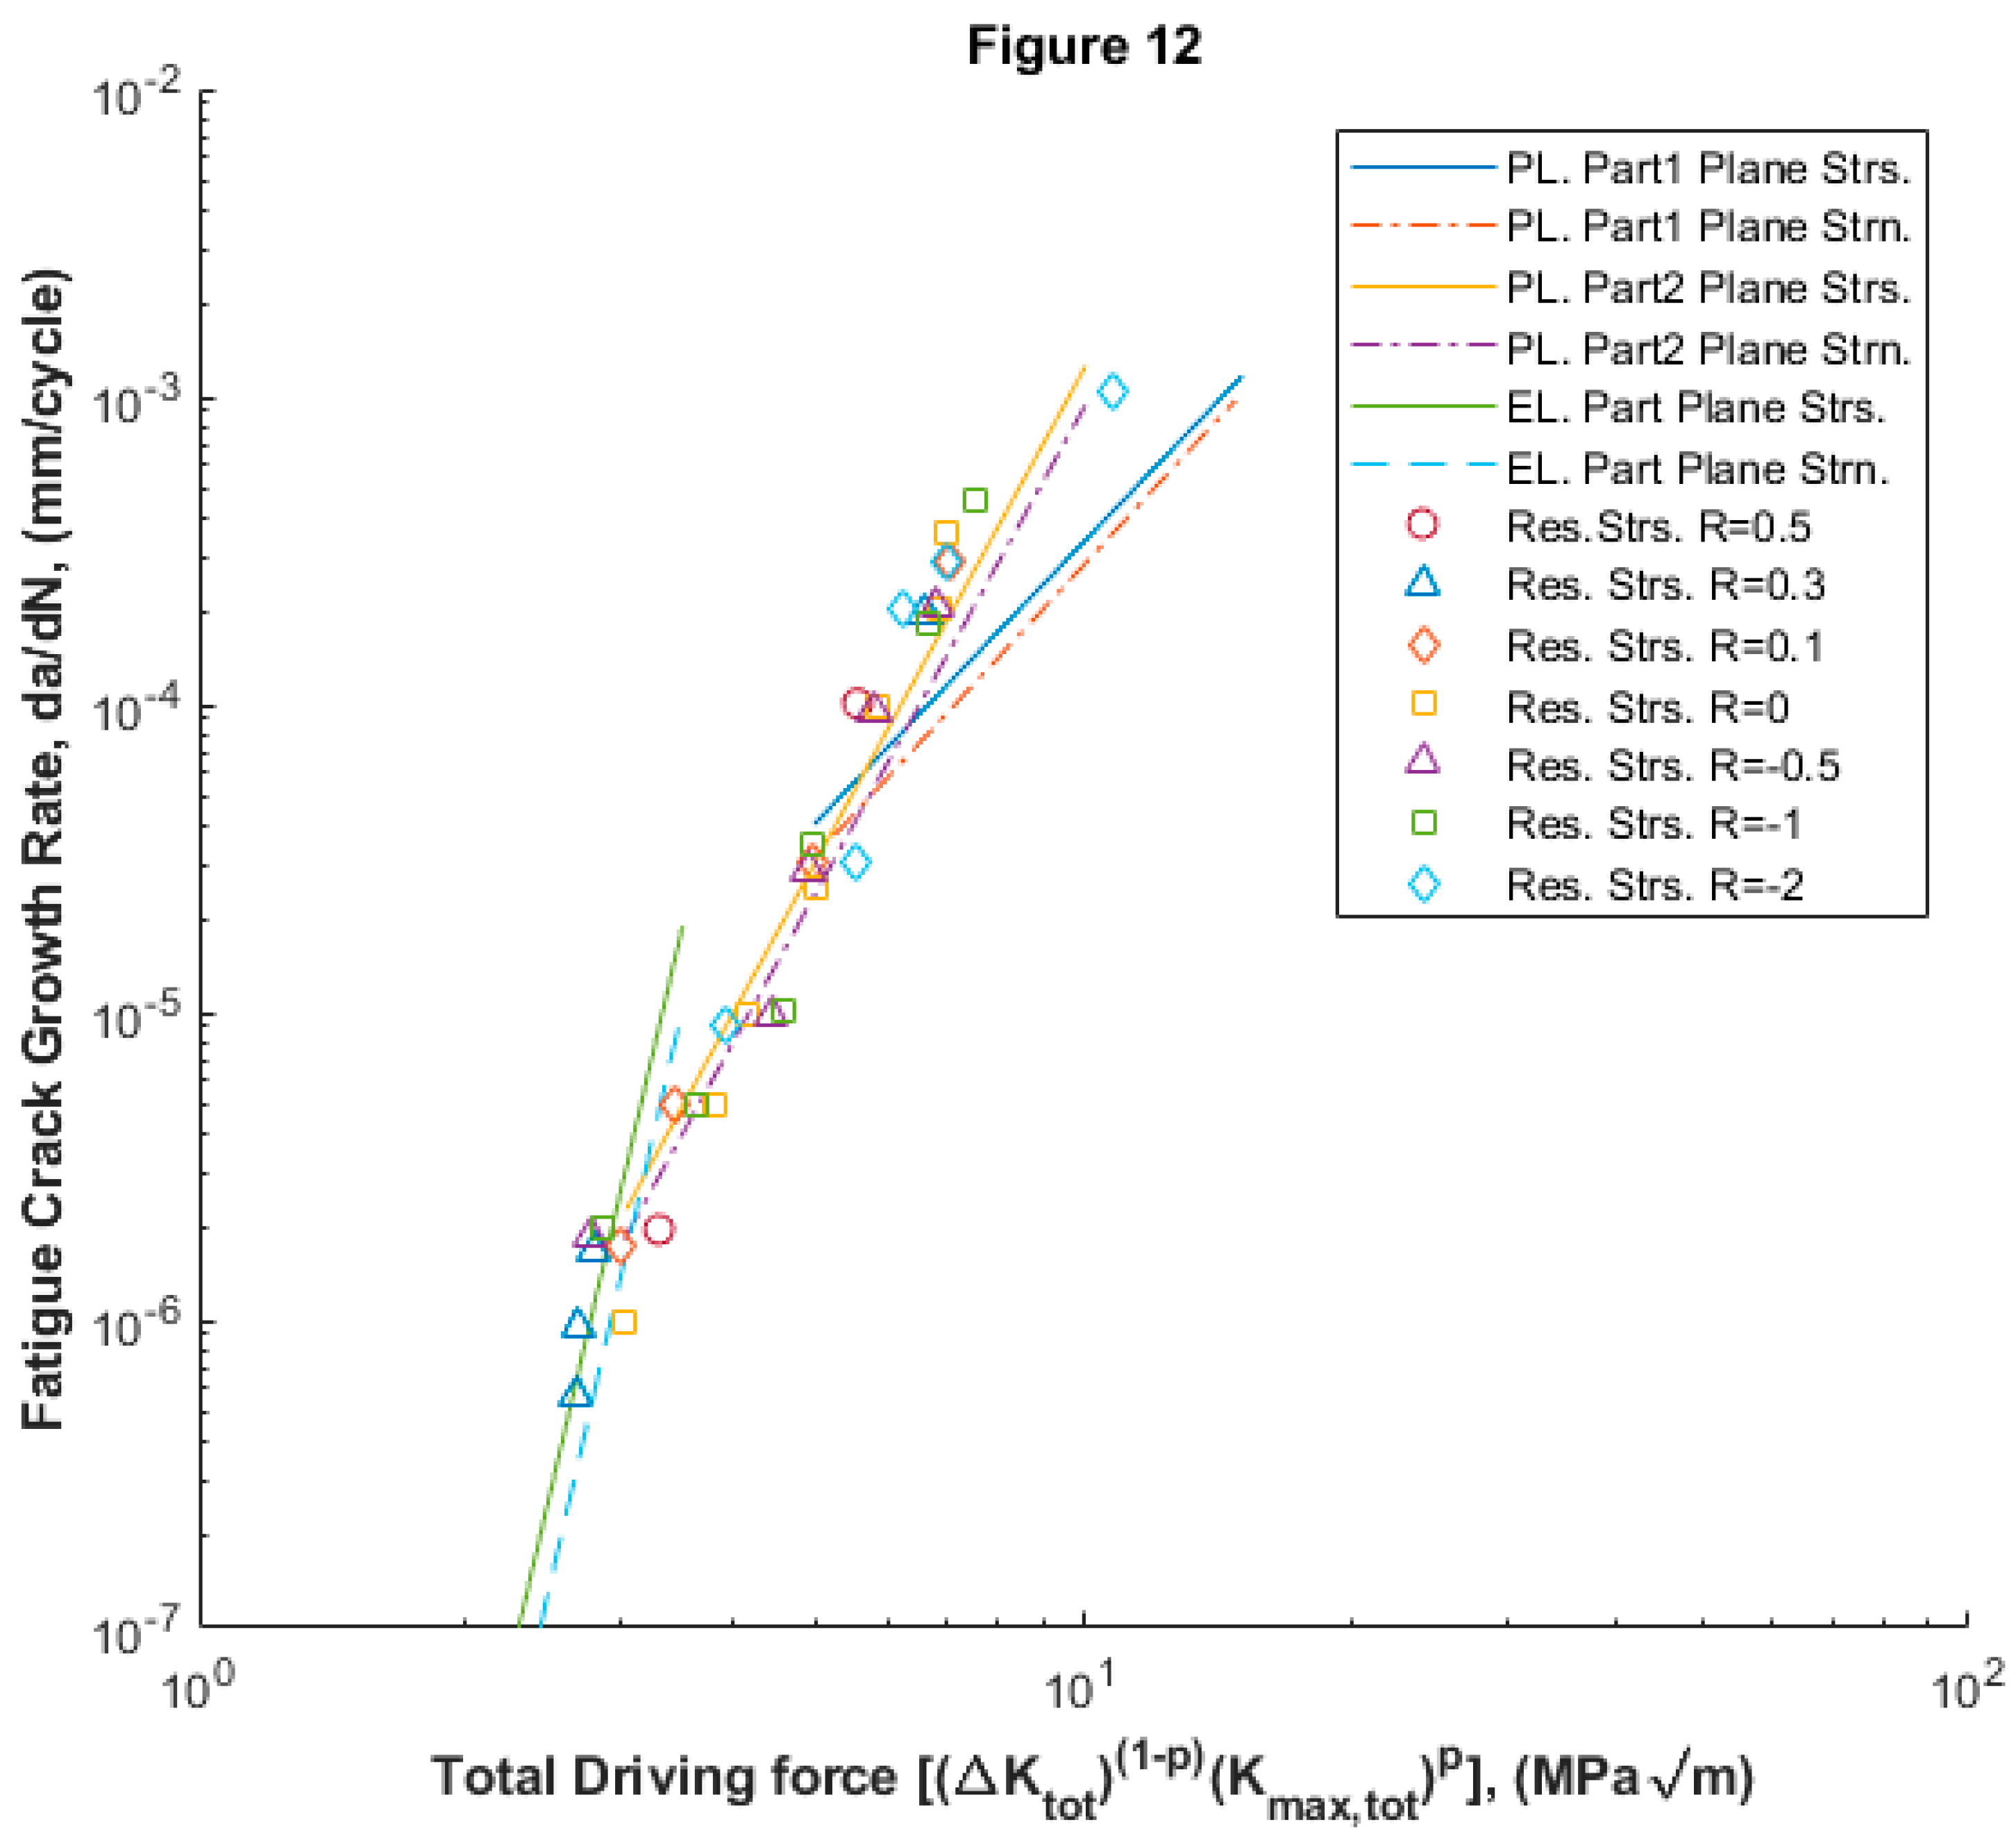
78] presented a paper proposing a FCGR model based on the elastoplastic stress-strain history at the crack tip. The driving force of crack development is derived based on the damage parameter used by Smith-Watson-Topper. The internal effect of stresses induced by the inverse plasticity cycle was also analysed. Until arriving at eq. 19 where the final model is presented as a function of the two parameters, where the authors present an extensive network of mathematical developments and balances of forces and stresses. Evidently, the complexity of this model lies in expressing this history of stresses and strains, the maximum and minimum stresses and strains at the crack tip are expressed (in eq. 8-16 in the original publication). Special attention is paid to the contribution of compressive stresses (in eqs. 17-24 in original publication), while elastoplastic stresses and strains in the crack tip environment are described (in eqs. 27-32 in original publication). The calculation of the residual intensity factor K
r is addressed (in eqs. 33-34 in original publication) and all other necessary intensity factors are listed (in eqs. 35-40 in original publication). With all the above, the fatigue crack driving force ΔK and the fatigue crack growth expression da/dN-ΔK are derived analytically (in eqs. 41-60 in original publication).
Figure 12 shows a high correlation of the model results with the experimental ones. The authors point out that the fact that being able to relate the Smith-Watson-Topper damage parameter and the stress-strain history of the crack allowed introducing residual stresses into the model has improved its goodness of fit.
In other research [
79] a crack growth model based on accumulated damage was presented in a similar way as a fatigue analysis of stationary notches. Crack growth is considered as the process of successive cracks restarting, as if it was always in its initiation stage. The driving force of crack growth is based on the local stresses and strains around the crack tip, using the Smith-Watson-Topper (SWT) fatigue damage parameter D=σ
max -Δε/2. The driving force of crack growth can be expressed as a function of two parameters. On the one hand, the residual cyclic plastic residual stresses σ
res (χ) and on the other hand, the residual intensity factor K
r which are expressed in different equations. The study shows the correlation of the experimental results and those obtained with the model, validating the use of the model which is based on modelling the crack as a succession of blunt notches of radius r
p, and not as a sharp crack, therefore with realistic stresses and strains around a rounded crack apex.
Dematos and Nowell [
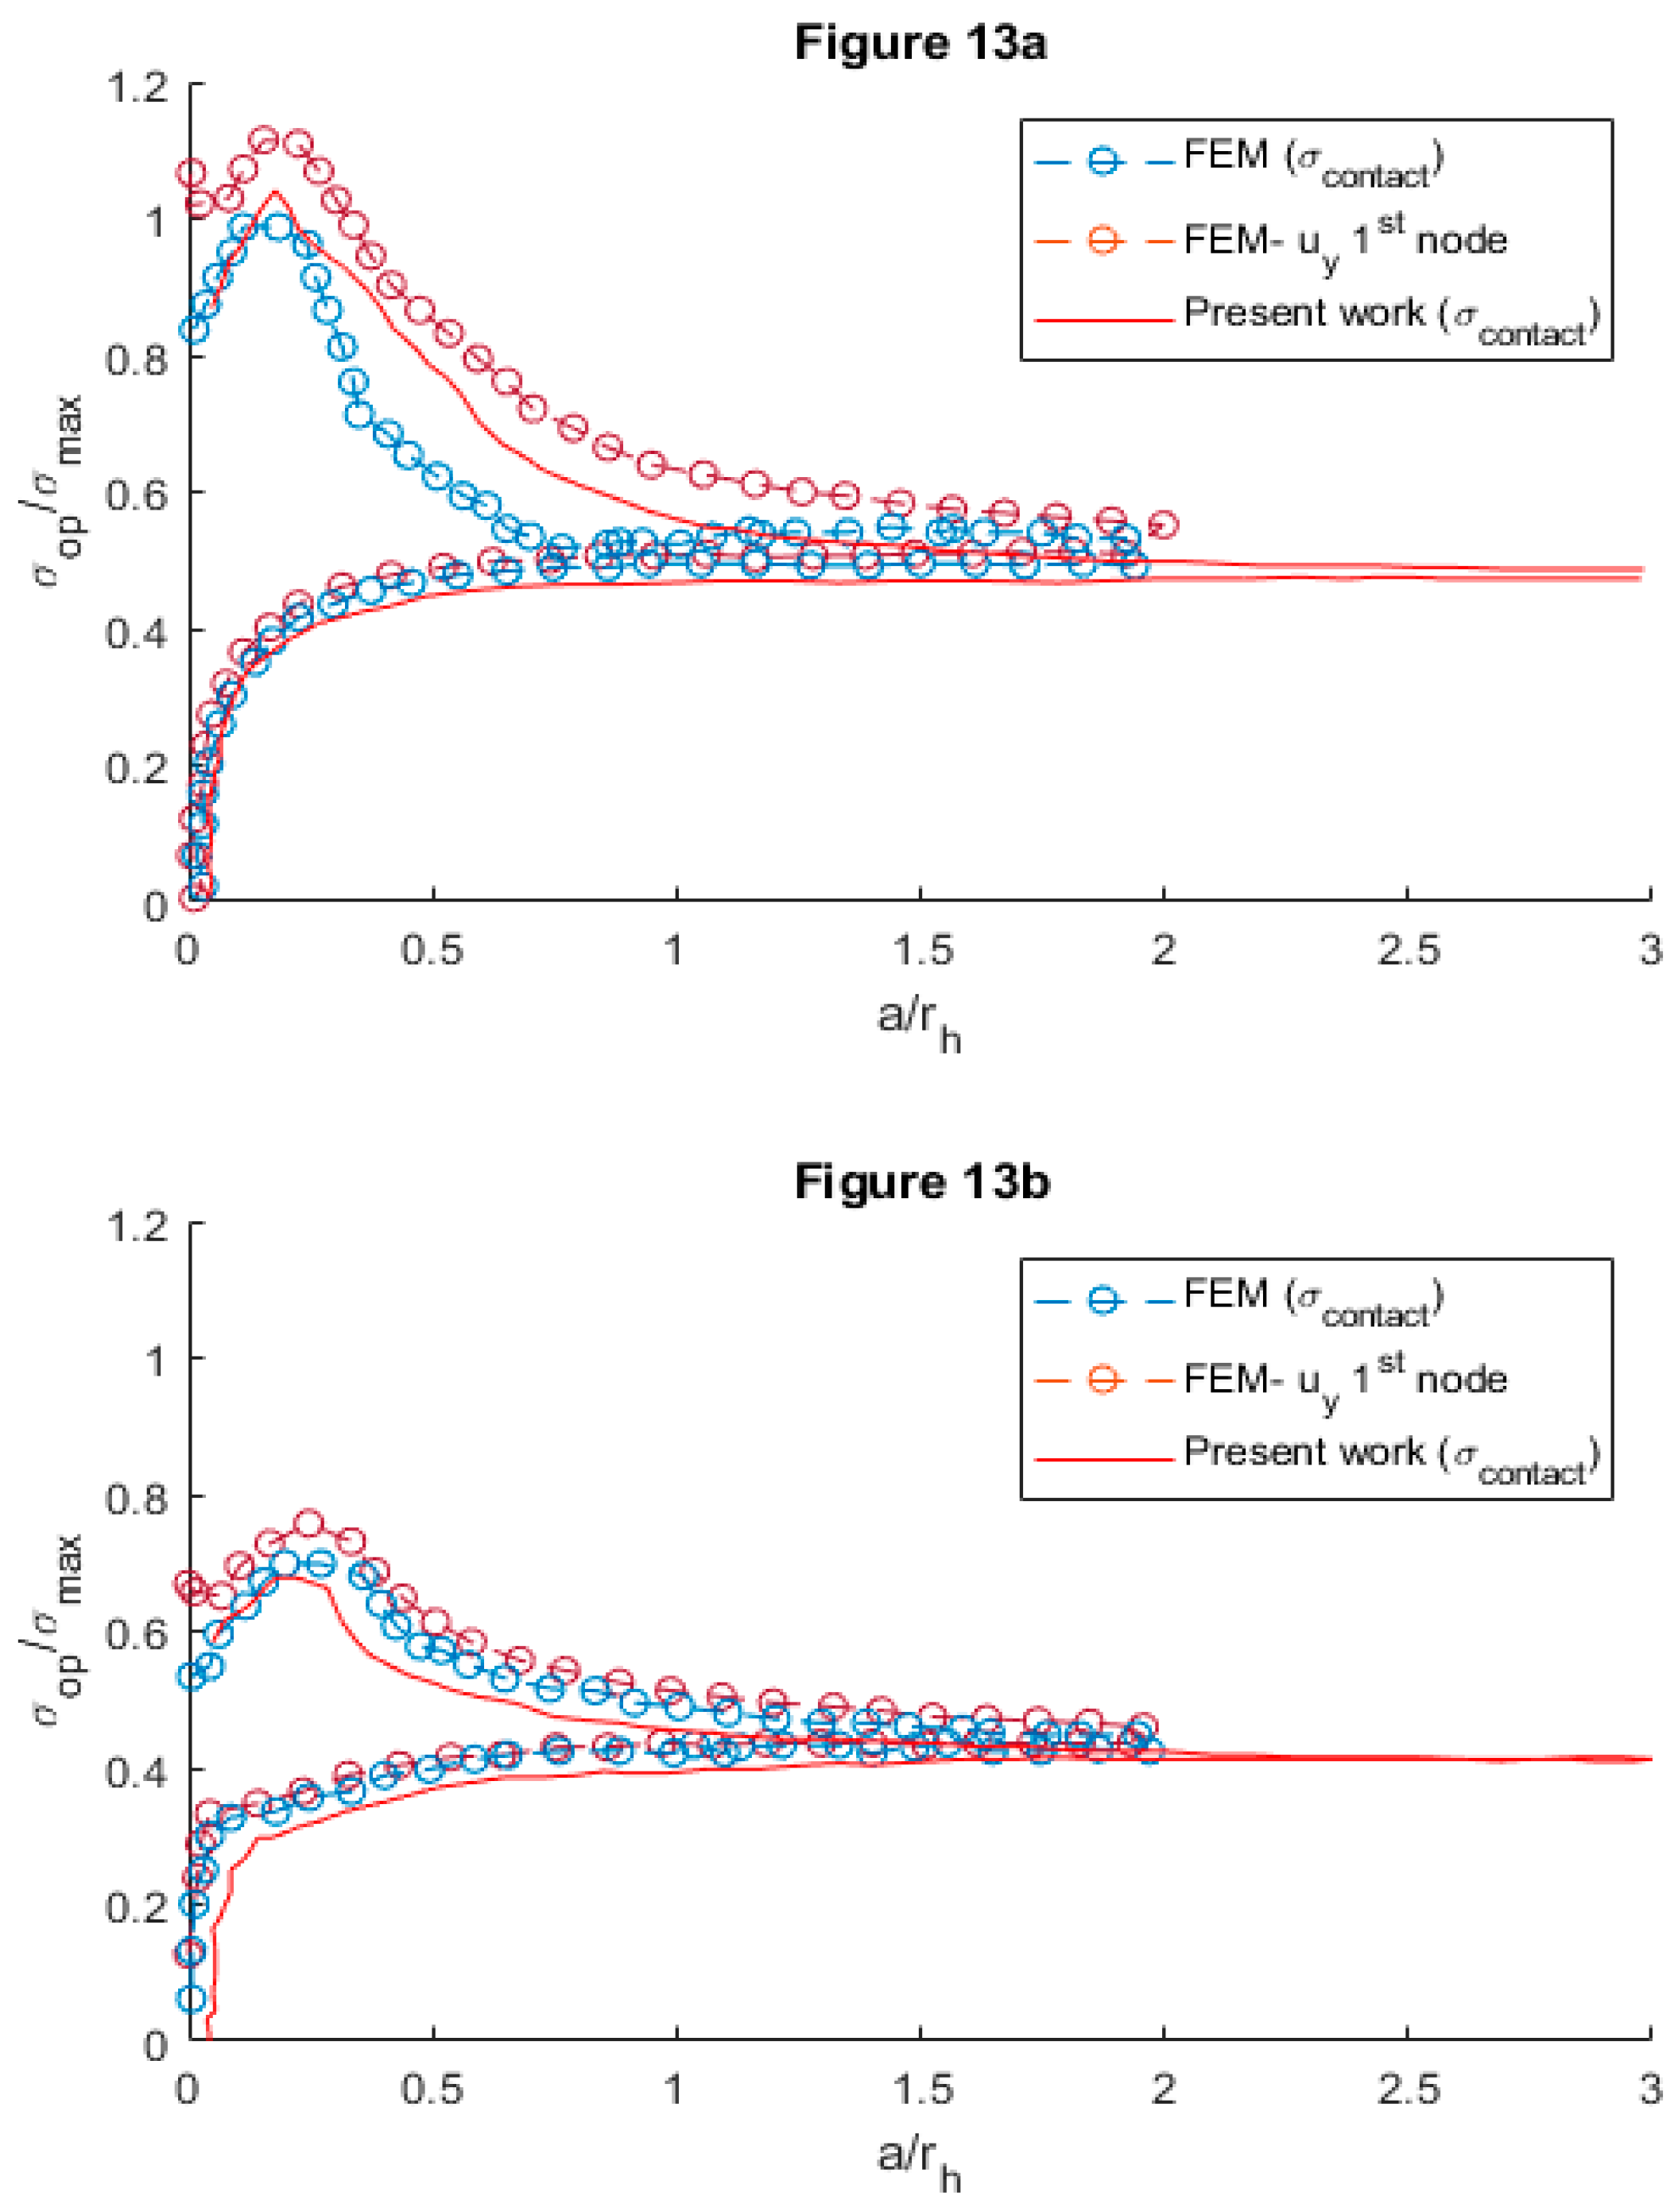
80] presented this work to extend Nowell's previous plane strain PICC model for flat plate with a circular hole and two radially symmetric cracks. The present model is improved because it can be extended to any geometry and previous residual stress fields. The analytical model starts from expressing the stress state as well as possible residual stresses with boundary elements and plane stress, the objective function is set as the crack growth. A finite element model is implemented and solved for both elastic and elasto-plastic cracks, with and without residual stresses, presenting the results in
Figure 13, which correlate the results of the analytical models with experimental.
Chikh et al. [
40] presented a study to relate the influence of the plastic zone to the crack growth rate. Since two plastic zones are produced under cyclic loading, one monotonic (r
m) and one cyclic (r
c ), this work relates this second zone r
c to the FCGR, which is produced by the local compression generated at the crack closure of each cycle. Several models can be used to relate the plastic zone to crack propagation. In this study, a simplified model based on the effect of damage accumulated in front of the crack tip da/dN=f(r
c ) is used. Taking the expression of the stress value around the LEFM crack, it implies that a plastic deformation zone is formed around the crack which has an extension relative to the value of the applied load and the crack length. Furthermore, if the plastic zone is large, a large amount of energy is absorbed during crack propagation, thus, if the zone is small, crack propagation requires less energy, the size of the plastic zone is directly proportional to the hardness of the material. Therefore, the mechanical properties of the material and the stress state govern the size and shape of the plastic zone. It is concluded that the plastic zone depends on the stress field, the applied stress, the specimen thickness and the crack length, and that the crack size is an ideal fatigue crack propagation parameter to determine crack growth, better than any other EPFM (elasto-plastic fracture mechanics) parameter. The proposed model is based on equation 20, da/dN=B(r
c)
2 where B=3.2E-6(R) e
1,3, being R
e the yield stress. Experimental tests were carried out on 12NC6 steel yielding consistent and conservative results.
One of the earliest works was proposed by Shih [
81]where a relation between the J-integral and the CTOD is obtained. It is based on the description of the stress and strain state proposed by Hutchinson--Rice-Rosengren with singularity at the crack tip. A similar expression is formulated for the CTOD. The author arrives at a relationship between CTOD and J in the equations. The coefficient d, which relates J, depends on the deformation properties of the material and is independent under small-scale plasticisation conditions. But the obtained relations are not valid for large-scale plasticisation due to the singularity. Based on deformation theory, the author arrives at a relation between J and the parameter d, eq, 20, which is a candidate for a more robust model. In fact, after numerical correlations, the model is found to be good at all scales.
In another paper [
82] the DIC technique was used to determine the displacement field around the fatigue crack tip for a constant value of the Stress Intensity factor. The data obtained by DIC was used in the evaluation of the T-strain and to see its influence on the FGCR. As an original contribution of the study, the higher order terms of the Williams expansion (WE) are determined. The displacements of a set of points outside the plastic zone were selected for the application of the over-deterministic method (ODM) to obtain several initial WE term. A numerical model of boundary conditions is also made. The calculated experimental T-stress values show a good agreement with finite element analysis and literature. It was also shown that the level of restraint influences the fatigue crack propagation rate, the higher the T-stress, the lower the growth.
Focusing on the Ratchetting Strain as a damage parameter, Tong et al. [
83] presented a novel work where they establish the Ratchetting Strain as a driving force for fatigue crack growth. For this purpose, several models, both independent and time-dependent, are developed using elasto-plastic, visco-plastic and crystal-plastic models [
84]. The authors argue that Ratcheting stress always occurs near the crack tip, leading to the progressive accumulation of stress strain normal to the crack growth plane. It seems plausible that this tensile strain, or Ratcheting strain, may be responsible for the material separation leading to crack growth. As mentioned above, the authors introduce several different material models. Subsequently, finite element analyses of the elasto-plastic, visco-plastic and crystal-plastic models are performed, and the results are shown. The correlation of the results obtained with the application of the models with experimental results is shown, showing a special agreement when used for the cumulative plastic deformation model. The results obtained for the analytical and numerical models also correlate well. Further experimental results supporting this theory have been published. [
85] . Tong et al. [
86,
87] also present further results from Finite Element numerical modelling at high temperatures (650 °C). The modelling of the material follows Chaboche's laws and isotropic kinematic hardening (Power Law) and they show the results after the application of 30 loading cycles under different values of load, frequency and Ratios (R). Among the main conclusions, the ratchetting deformation increases as the Ratio of Load (R) decreases, being higher in negative cases, and low frequencies in the loading cycle increase the accumulated deformation, as well as the crack growth rate. Another conclusion is that maintaining an initial load (Dwell) decreases the fatigue life of the specimen, for example, a dwell of 100 s. at maximum initial load reduces the fatigue life by one third. An interesting factor studied [
86] is to use meshing to define different grain sizes and orientations.
6. HYBRID DAMAGE THEORIES OR PARAMETER DEFINITION
The following paper does not present a model per se, but rather evaluates some parameters as possible future keys in models and discards others. The paper [
88] present the finite deformation elastoplastic analysis of plane strain cracks subjected to cyclic mode I loads with constant amplitude at various load ranges and ratios, as well as with overload and underload cycles. The Laird-Smith mechanism of crack growth by cyclic blunting and re-sharpening, which transfers material from the crack tip to the crack flanks, is visualised. In the present model, crack closure has never been detected. Furthermore, the assumed origin of plasticity-induced crack closure (PICC) is ruled out. However, the simulated fatigue crack growth rate (FCG) by blunting and regrinding reproduces the key experimental trends related to the effects of ΔK and single peaks of overload/underload. The calculated curves are kinked despite the absence of PICC, raising doubts about their reliability as a means of crack closure detection and assessment. Thus, the modelling performed manifests ambiguities with respect to PICC as the universal intrinsic factor capable of uniquely controlling FCG. On the other hand, in the absence of PICC, the calculated stress-strain responses near the tip, being the driving forces of fatigue damage and bond-breaking crack advance, manifest affinities with experimental FCG trends without the intervention of PICC. This implies both independent parameters of cyclic crack-tip loading under small-scale creep, such as the pair K
max and K
min, or K
max and ΔK, or other equivalent, as well as the indispensable variables that drive FCG directly without PICC mediation. One of the major problems of looking at the influence of PICC on crack growth is that under plane strain conditions PICC is not observable. Therefore, numerical modelling appears to be a good tool. The finite element models use a perfect elastoplastic model with Von-Mises criterion associated with perfect plastic flow. No contact between the flanks was introduced, nor was meshing used. To maintain this criterion, the number of cycles was lowered, and different mesh models with very small element sizes were used. The most remarkable thing according to the authors is that the effect of PICC on FGC seems to be observable, even though PICC has not been modelled, so it is questionable whether PICC affects FGC or not.
Khelil et al. [
89] presented an energetic approach to Fatigue Crack Growth (FCG). This approach is based on the numerical determination of the plastic zone by introducing a new form of plastic radius. Experimental results on two aluminium alloys of the types 2024-T351 and 7075-T7351 were used to validate the developed numerical model. A good agreement between the two types of results has been found. Starting from eq1 where ΔW
p is formulated as the plastic energy of the hysteresis cycle characteristic of cyclic loads and U as the Specific Energy. U, Equation 22, is expressed as a function of da/dN and subdivided into the three phases of the KFFD. On the other hand, taking as valid the value of the angular strain γ=ε(3)
0.5 ,near the crack apex one can express R
N (ϴ) as the singular dominant term approximating the elastoplastic boundary. This allows further development of the ΔW
p which in eq. 21 is left as an integral of stress and strain terms along r
p (plastic radius), S
pz (plasticised surface) and Q, Equation 23, (total energy dissipated).
These expressions are a function of parameters that must be calculated iteratively as indicated in the flow diagram (
Figure 7 in the original publication).
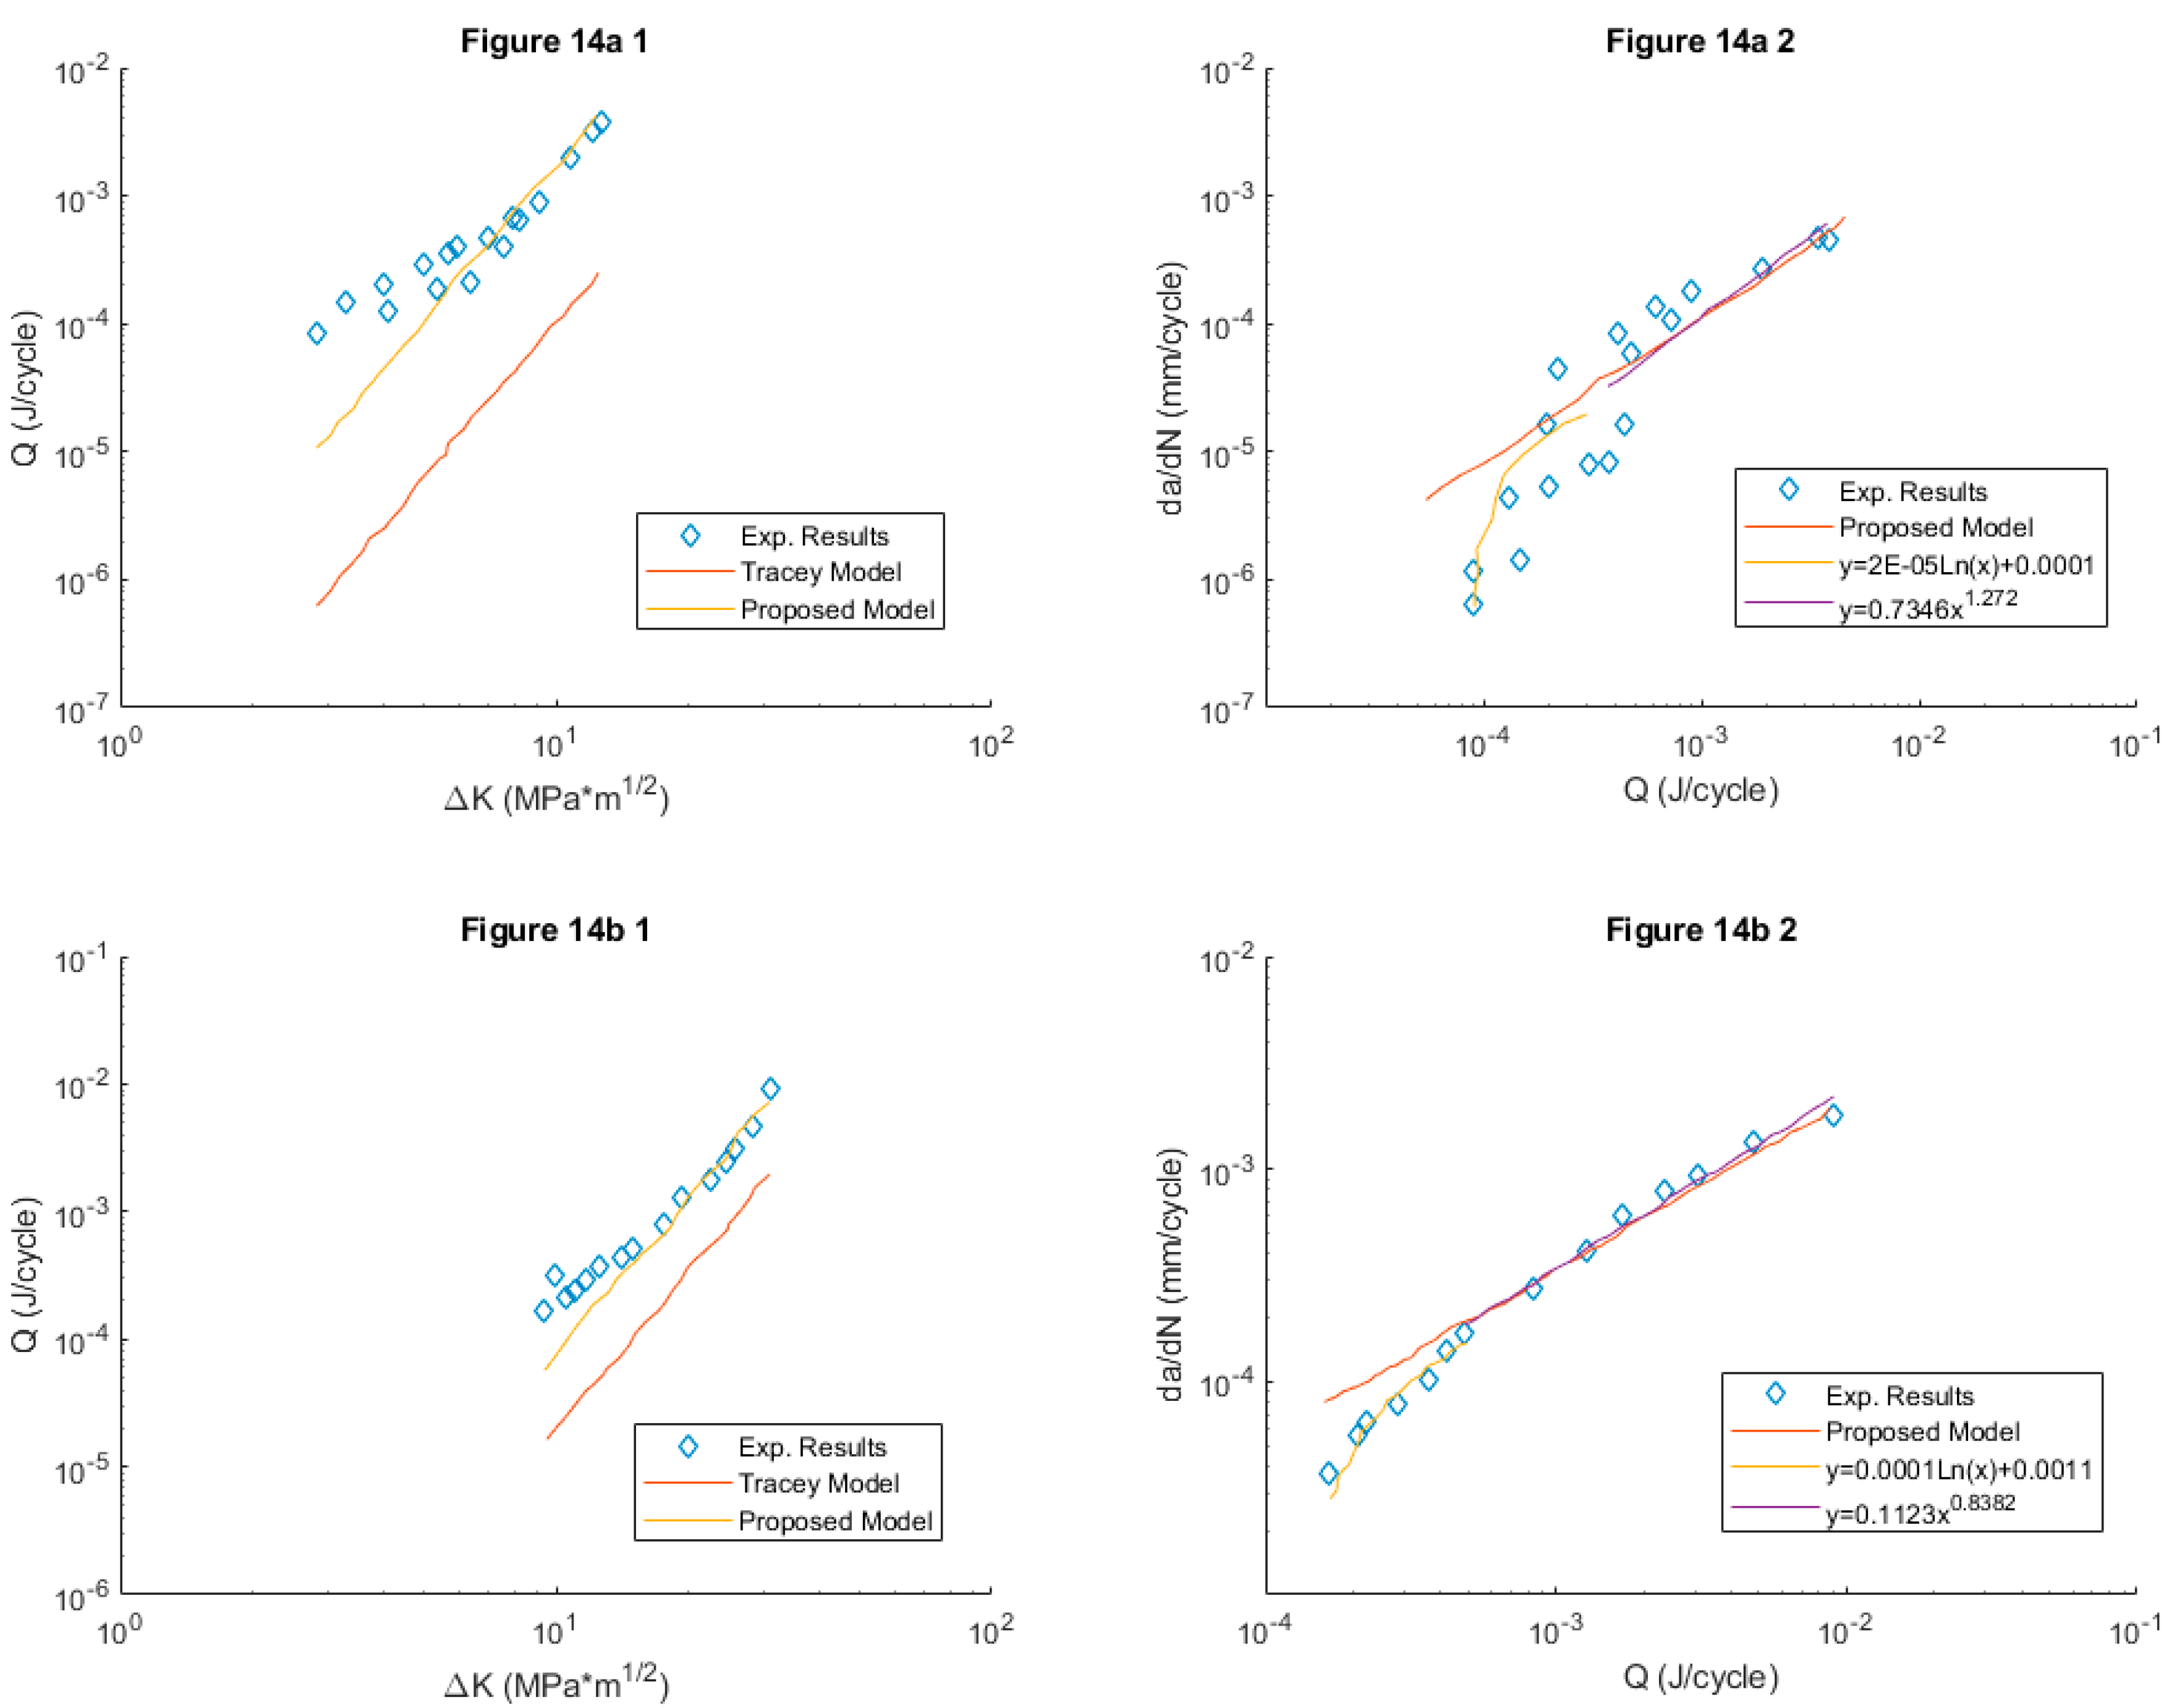
Figure 14 (a and b) shows the correlations of dissipated energy and ΔK and
Figure 14 (c and d) does the same for da/dN and Q with acceptable correlations. Finally (in eqs. 35-37 in the original publication), the relationship of da/dN and ΔK for the 3 phases of the KFDD is established.
The following work focused on [
13] on the high cycle fatigue (HCF) life in cast Al-Mg-Si alloys, which is particularly sensitive to the combination of microstructural components, inclusions and stress concentrators. Inclusions can range from large-scale shrinkage porosities to trapped oxides introduced during casting. When controlling for shrinkage porosity, the relevant microstructure at nucleation sites are often the larger Si particles within the eutectic regions. In this paper, an HCF model is introduced that recognises multiple scales of inclusions for crack formation. This ambitious work presents a model that addresses the role of constrained microplasticity around detached particles, shrinkage pores in the formation, and the microstructural growth of small fatigue cracks. It is based on cyclic crack tip displacement rather than linear elastic fracture toughness factor. The model is applied to an aluminium alloy A356-T6. A relationship between da/dN, Δσ, S
u, A and ΔCTD (S
u is the maximum force) is presented which does not seem complicated on the surface, the authors try to make a collection of all possibilities and steps (eq.1 in original publication). For example, the number of cycles is expressed as N
T=N
inc+N
MSC+N
PSC+N
LC. Where inc is incubation, MSC propagation of a microstructurally small crack, PSC during the transition from MSC status to that of a dominant long crack and LC long crack. These cycle numbers are related to the porosity size using various coefficients, for the MSC/PSC regimes the cycle numbers are also expressed as a function of the most characteristic parameters of the process according to the authors. The whole process detailed so far is repeated for five types of inclusion models:
A Distributed microporosity and Si particles; no significant pores or oxides
B high levels of microporosity--shrinkage or gas pores with maximum diameter D
p < 3DCS but greater than the maximum Si particle diameter
C large pores near the free surface (D
p > 3DCS)
D large pores near the free surface (D
p > 3DCS)
E large oxide films. The model results are correlated with the experimental A356-T6 plate results (in
Figure 4,
Figure 5,
Figure 6,
Figure 7,
Figure 8,
Figure 9,
Figure 10 and
Figure 11 of the original publication). The work ends with some interesting graphs (
Figure 13 and
Figure 14 in the original publication) where the size of the inclusions is related to the crack growth mechanisms, as well as to the fatigue life of the materials.
The following work [
90]apart from the crack growth model due to dissipated plastic energy, also presents an overview of experimental studies and modelling of fatigue crack growth rates in the aerospace titanium alloy Ti-6Al-4V. Firstly, numerous experimental tests were carried out on CT specimens of the alloy, from which the following were obtained: the fatigue crack growth rate (FCGR) under constant load. The influence of various parameters such as crack length and the effect of overload (retardation) were also evaluated experimentally. The crack opening was measured using DIC with a digital camera equipped with a Questar wide-range telescope, the set-up can record at 0.1 µm pixel quality. The residual stress intensity factor was determined using X-ray diffraction techniques with a synchrotron, which also served to map all the deformation in the vicinity of the crack apex. The modelling techniques used for FCGR prediction are based on three concepts: (i) Crack advancement is controlled by the damage processes occurring within the fracture zone located ahead of the crack tip. This zone is embedded within the plastic zone of the crack apex, which in turn is surrounded by the zone of dominance of the elastic mechanics stress field solution (K
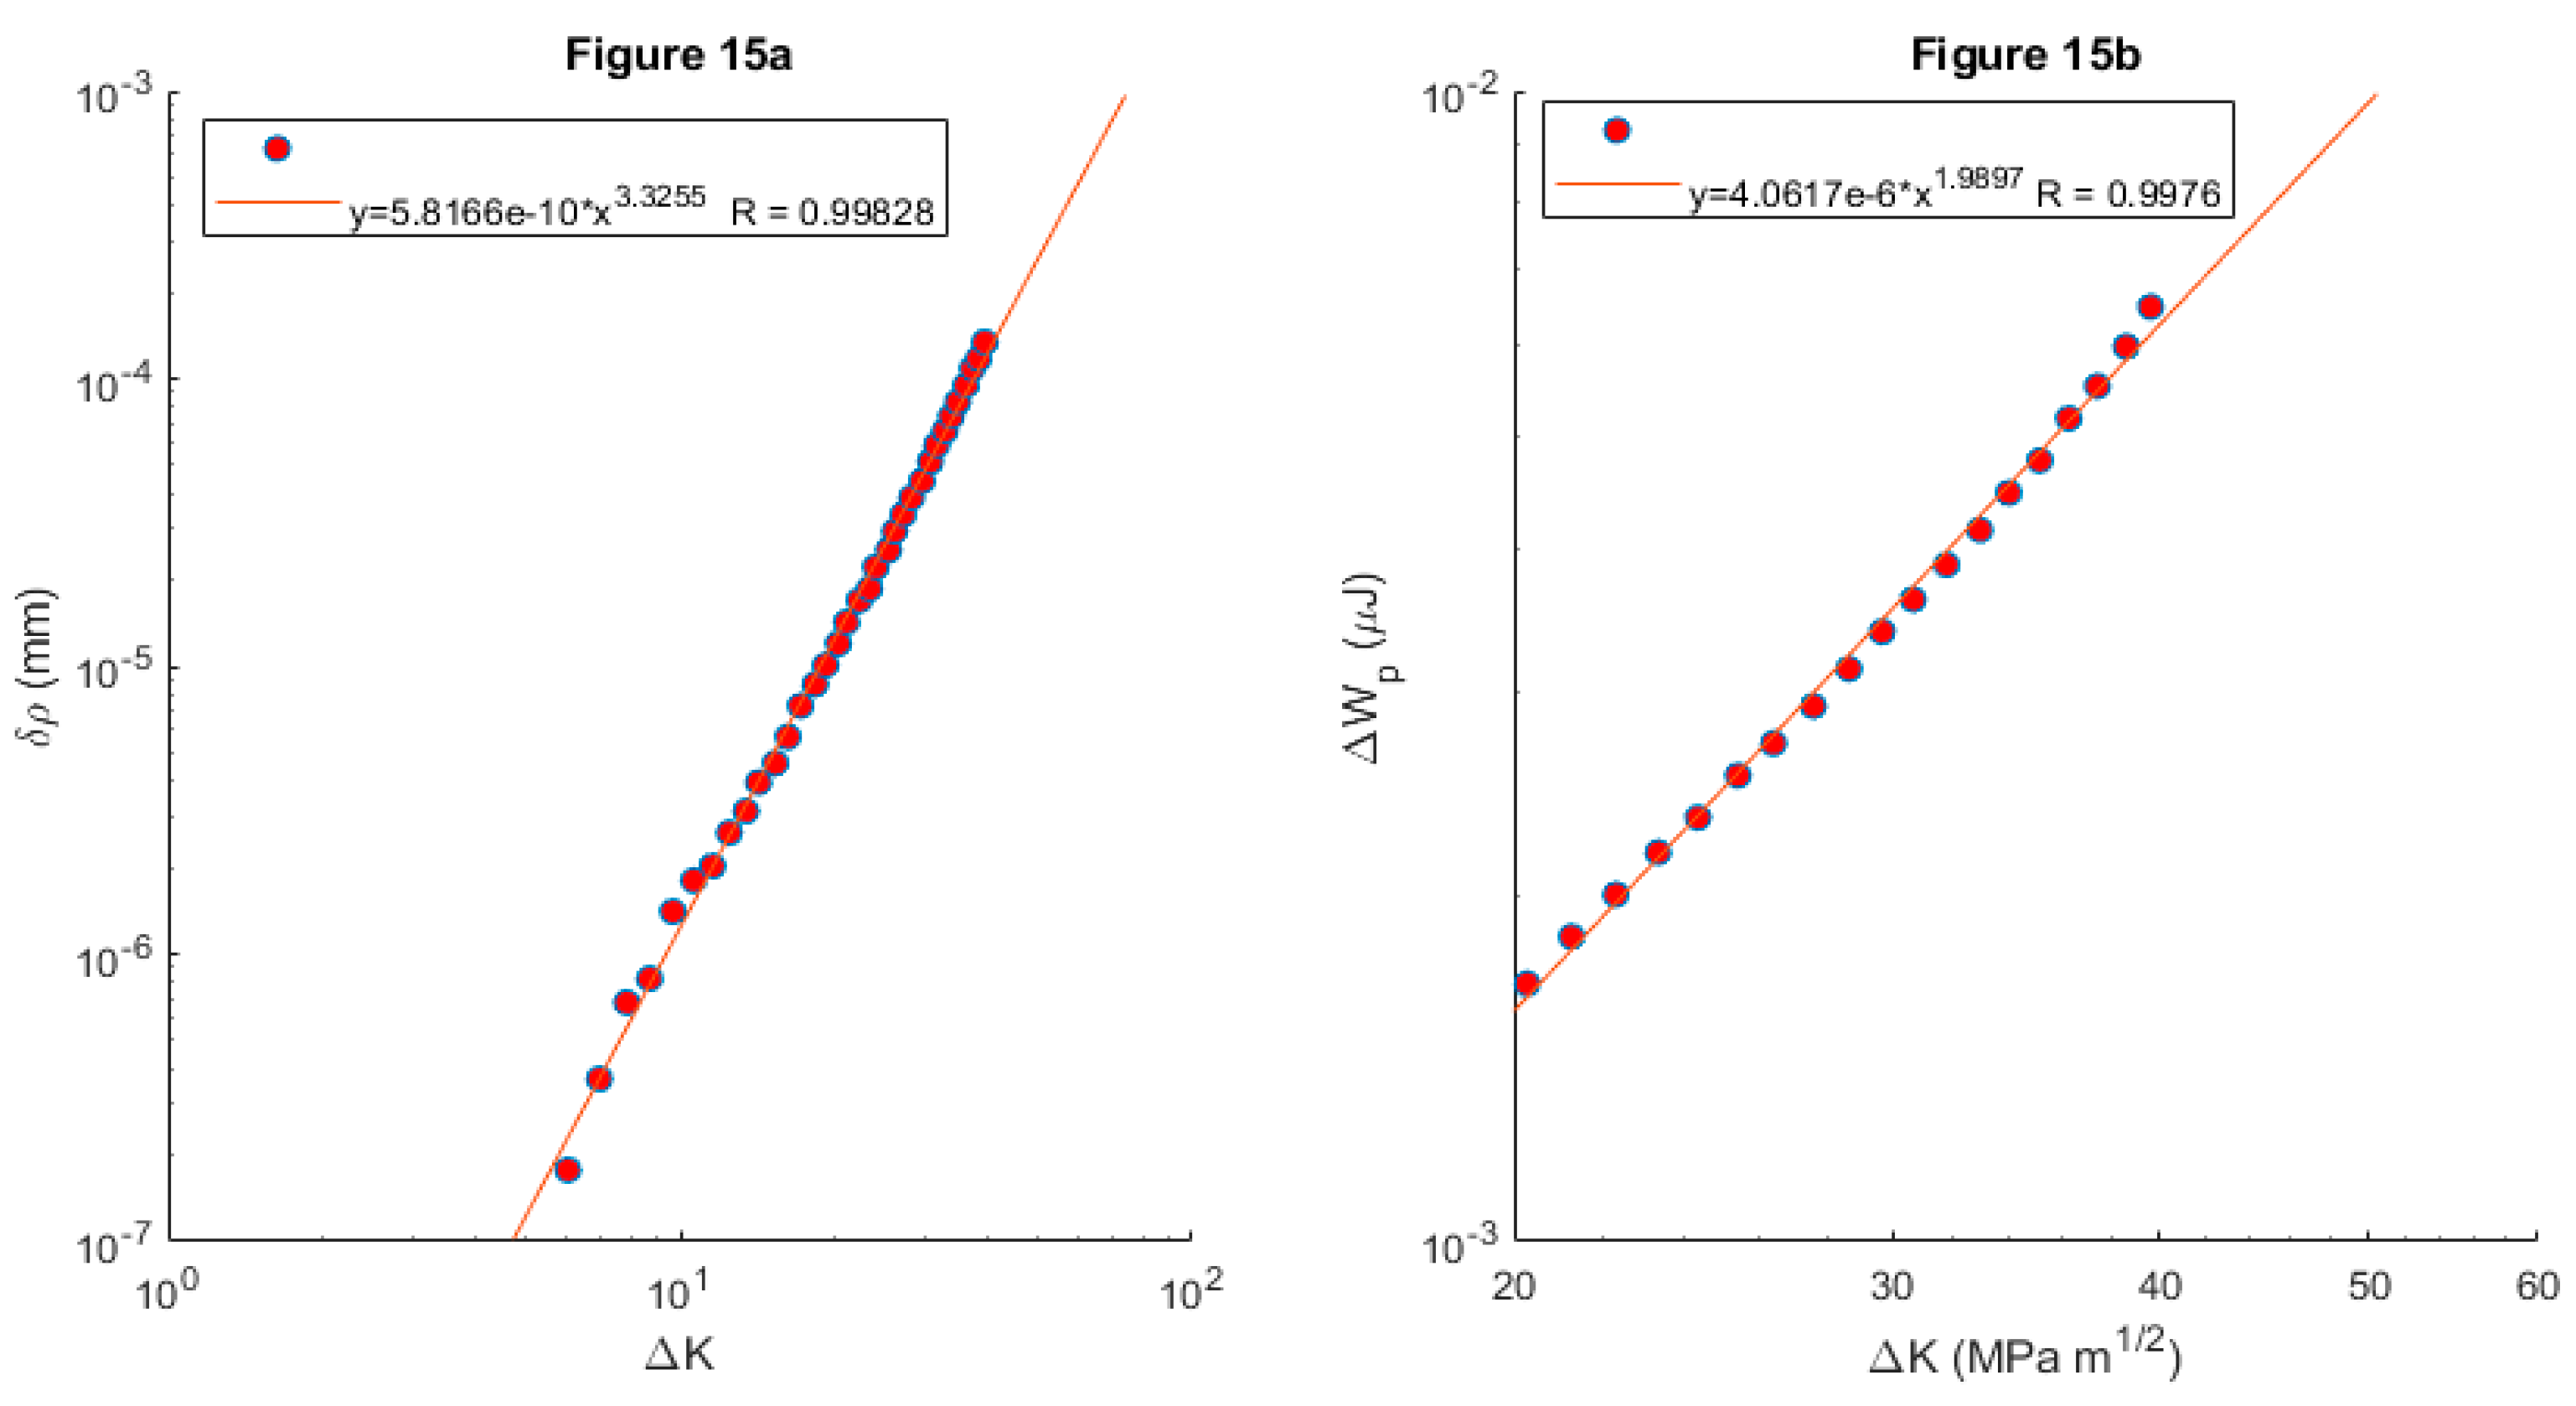
field). (ii) Prediction of crack advance should be possible by knowing the deformation of a small volume around the crack tip, including residual stress and damage accumulation. (iii) Strictly speaking, a distinction must be made between plasticity and damage: although both are dissipative mechanisms, ultimately it is the damage component that determines failure. However, in many metals, the two parameters are related, i.e., it can be assumed that the damage at each point in the material is a function of the plastic deformation. Therefore, FCGR must be correlated with the plastic deformation processes at the crack apex. To have a good growth model it is essential to choose well the parameters, in this study we first resort to the crack tip blunting ρ, and the crack length a, obtaining the first relationship between both. The FCGRs is related to the residual intensity factor, the ratio of cyclic loads R and a series of adjustable constants. The adjustment and calculation of the parameters and constants leads to postulate the equation where the FCGRs is related to the dissipated plastic energy and a coefficient β, this equation implies the relation that a part of the dissipated plastic energy is converted into damage causing propagation. Finally, the equations δp (crack tip blunting) and ΔW
p (plastic dissipate energy) are chosen as the constituents of the model whose results are compared with the experimental ones shown in
Figure 15, offering a more than satisfactory correlation with better results of the blunting parameter.
In this work [
91] the application of strip yields models implemented in NASGRO (software) to estimate fatigue crack growth under random loading is evaluated. The two different strip yields model options (constant constraint-loss (CCL) and variable constraint-loss (VCL)) are evaluated and compared. The CCL is very similar to Newman's FASTRAN fatigue crack closure model. In this model, the tensile restraint factor α is constant along the plastic zone elements, but its value depends on the stress state, ranging from plane strain to plane stress. This constraint-loss is based on the observation that cracks that initially start with a flat face will eventually grow in a tilted-face mode. Newman proposed that the transition occurs when the size of the cyclic plastic zone (calculated from ΔKeff) reaches a percentage of the thickness. In the second, constraint-loss model (VCL), the tensile restraint factor α varies along the plastic zone according to a parabolic expression. The constraint decays from its value at the crack tip (α
tip) to a flat stress value of 1.15 at the end in front of the plastic zone. The loss of restraint is also evaluated, but unlike the previous model, the value of α
tip in both strain and plane strain is calculated from the ratio of the size of the plastic zone to the thickness of the specimen. The FCGR is formulated (eq. 20), where C, n, p and q are parameters that can be adjusted thanks to the NASMAT module. Three combinations of these parameters were considered, and the results compared with data from the NASGRO materials database and the literature. The ability of the models to estimate fatigue life and variability is analysed by comparing the simulated results with experimental fatigue crack growth data under different stationary Gaussian random loading processes on 2024-T351 aluminium CT specimens. The analysis showed that the two models with their three configurations provide good fatigue life predictions, with very similar results. The variability of the results due to the randomness of the loading was also analysed, and in this case, the CCL model provides a better estimate than the VCL. Finally, it should be noted that the best correlation with the experimental results was achieved with one of the combinations of constants proposed by the authors. This combination implemented with the NASMAT module improved any combination of the NASGRO database.
7. CONCLUSIONS AND PROBLEMS WITH EXISTING METHODS
Summary tables (
Table 3,
Table 4 and
Table 5) have been drawn up for the most used parameters in the literature. The information shown in the tables consists of the bibliographical reference with its first author and date of publication, as well as a brief description of the contribution with respect to the parameter in question. It also shows the methodology used in the research, or the methodologies in case there are several of them, and finally it evaluates how positive (+), very positive (++) or extraordinarily positive (+++) the contribution of the research has been to advance in the knowledge and relationship that the parameter has with crack growth. This evaluation has an objective basis based on the number of citations of the paper, and another part of subjective evaluation in which the authors of this review have scored according to their personal experience. The Table condenses the information on the CTOD and the CTOD
P, this parameter has been questioned to replace even the CTOD, the advantages are varied, from the unity of the parameter, m. in the case of the CTOD, and above all the elastoplastic nature of the CTOD as opposed to the elastic approach of ΔK. At present, it is a well-established hypothesis that the origin and first stage of the crack has a plastic and microstructural basis, while the second growth phase is of an elastic nature and much more influential on a macro level. In table 4, geometrical parameters that are used to measure some property or definition of the plastic zone are collected. Without obtaining a valid model for all situations, there are many investigations that manage to obtain very reliable correlations between the geometric parameters that define the plastic zone and crack growth.
The existing problems are based on the absence of a physical basis for most of the proposed models. This makes models based on experimental results representative only if the operational conditions are the same. Something similar, but with a different nature, occurs in Finite Element Models, where boundary conditions, mesh size, analysable parameters, etc. are imposed. FEMs must be validated with experimental results and serve to extrapolate new test conditions; numerical simulations are much more efficient and economical than experimental tests. But we must not lose sight of the main objective of fatigue research, which is mathematical modelling based on physical phenomena that are common to fatigue cracks. As previously mentioned, in the problem of fracture and fatigue, the microstructural and macrostructural levels, as well as the plastic and/or elastic domain, intersect, representing a handicap for its physical and mathematical modelling.
Table 5 presents a summary of the main lines of research that have in common some aspect of plastic energy as a driving parameter in crack growth. It is wise to mention the differences between the terms in
Table 5. They can be divided into groups, terms related to Plastic Strain Energy, Elastic Strain Energy, Strain energy gradient, Total strain energy and Specific Energy. The terms related to Plastic Strain Energy are Plastic CTOD [
43]
, plastic energy in the point used in PM [
66,
67], Kujawsky and Ellyin plastic energy [
69,
70], ΔW
p [
74] [
89] [
90] , U
pl [
76] and Q [
89]
. All of them consider a threshold of the plastic energy that triggers the crack growth when surpassed. Nevertheless, there are some differences between them; while [
74] [
89] [
90] refer to the same term ΔW
p related to load cycle, other terms like [
69,
70], U
pl [
76] and Q [
89] are related to crack or fracture cycle release. Quan and Alderliesten [
76] also refer to the variation in elastic strain energy in one entire crack propagation cycle, which is included inside the Elastic Strain Energy group. The Strain Energy Gradient is mentioned in [
69,
70] and [
73] with the difference that Zhu et al. reflect stress and strain effects. Regarding the group where Total Strain Energy is mentioned, terms like ΔWt [
71], U_L, ΔCpσ and ΔCpε [
75] , and Ua [
76] are included. While ΔWt [
71], U_L, and ΔCpσ [
75] are stress-related parameters, ΔCpε [
75] is strain-related, and Ua [
76] is surface related. The last term is linked to Specific Energy, U [
89], energy dissipated per unit volume during fatigue crack growth.
Table 5.
Energy as a critical parameter used as driving force in the crack grown modelization.
Table 5.
Energy as a critical parameter used as driving force in the crack grown modelization.
| Ref |
Specific Parameter |
Authors and Date |
Description |
Definition |
Methodology |
| 43 |
CTODp |
Antunes et all. 2018 |
Plastic Energy Dissipated per Cycle |
Plastic portion of the crack tip opening displacement Plastic CTOD is obtained by subtracting the elastic CTOD from the total. |
Numerical |
| 66-67 |
PM |
Zheng et all. 2013, 2014 |
Critical plastic energy, at the point close to crack tip |
The fatigue damage experienced by a point located within a specific distance from the crack tip can accurately represent the average damage condition at the crack tip area. |
Numerical |
| 69 |
EC |
Kujawsky and Ellyin 1984 |
Critical plastic energy |
Amount of plastic strain energy that a material can dissipate before experiencing fatigue failure |
Numerical |
| 70 |
EC |
Chalant and Remy 1983 |
Critical plastic energy |
The strain gradient inside the grain at the crack tip |
Numerical |
| 71 |
ΔWt |
Branco et all. 2021 |
Critical plastic energy |
Accounts for the mean stress effect, measure of the energy dissipated per cycle and is capable of unifying both the low-cycle and high-cycle fatigue regimes. |
Numerical-Analytical |
| 73 |
χW
|
Zhu et all 2018 |
Critical plastic energy |
Reflects the distribution of both stress and strain gradients within the actual structure. |
Analytical |
| 90 |
ΔWp |
Kornsusky et all. 2009 |
Equivalent deformation energy |
Amount of energy dissipated due to plastic deformation at the crack tip during each loading cycle. |
Analytical-Experimental |
| 74 |
ΔWp |
Klingbei 2003 |
Strain energy gradient |
Change in total plastic dissipation per unit width during a specific cycle. |
Numerical-Analytical |
| 75 |
U_L |
Ravi Chandran 2018 |
Total dissipated plastic energy |
Total net-section strain energy in the crack plane of the ligament. Combination of elastic and plastic strain energies due to the increased stress. |
Analytical-Experimental |
| 75 |
ΔCpσ |
Ravi Chandran 2018 |
Total dissipated plastic energy |
Change in net-section strain energy parameter in stress-controlled fatigue.
Eq. 17
|
Analytical-Experimental |
| 75 |
ΔCpε |
Ravi Chandran 2018 |
Cumulative change in cyclic strain energy of the net section |
Change in net-section strain energy density in strain-controlled fatigue.
Eq.18
|
Analytical-Experimental |
| 76 |
Upl |
Quan and Alderliesten 2022 |
Plastic energy difference in the net-section |
Energy consumed in the process of crack growth through plastic deformation of the material surrounding the crack. |
Numerical-Experimental |
| 76 |
Ue |
Quan and Alderliesten 2022 |
Elastic energy difference in the net-section |
Variation in elastic strain energy stored throughout one full cycle of crack propagation. |
Numerical-Experimental |
| 76 |
Ua |
Quan and Alderliesten 2022 |
Surface energy difference in the net-section |
Surface energy
differential dissipated through new crack surface formation |
Numerical-Experimental |
| 89 |
ΔWp |
Kheli et all. 2013 |
Stored deformation dissipation |
Cyclic plastic strain energy, corresponding to one loading cycle.
Eq. 21
|
Numerical-Experimental |
| 89 |
U |
Kheli et all. 2013 |
Dissipation new crack surface formation |
Specific energy, energy dissipated per unit volume during fatigue crack growth.
Eq. 22
|
Numerical-Experimental |
| 89 |
Q |
Kheli et all. 2013 |
Plastic energy of the hysteresis cycle characteristic of cyclic loads |
Total dissipated energy in the specimen during fatigue crack growth
Eq. 23
|
Numerical-Experimental |
The difficulty in this case lies in how to measure or estimate experimentally such specific aspects of the energy in such a small space as the plastic zone at the vertex of the crack. Also, analytically it presents an enormous challenge, because repeating concepts, applying mechanics of continuous media or particle systems, to date there has not been published (except for error or omission) an energetic study with Lagrangian or Hamiltonian mechanics, which were developed for an energetic approach to physics. [
92].
