Submitted:
22 October 2023
Posted:
23 October 2023
You are already at the latest version
Abstract
Keywords:
1. Introduction
2. Results
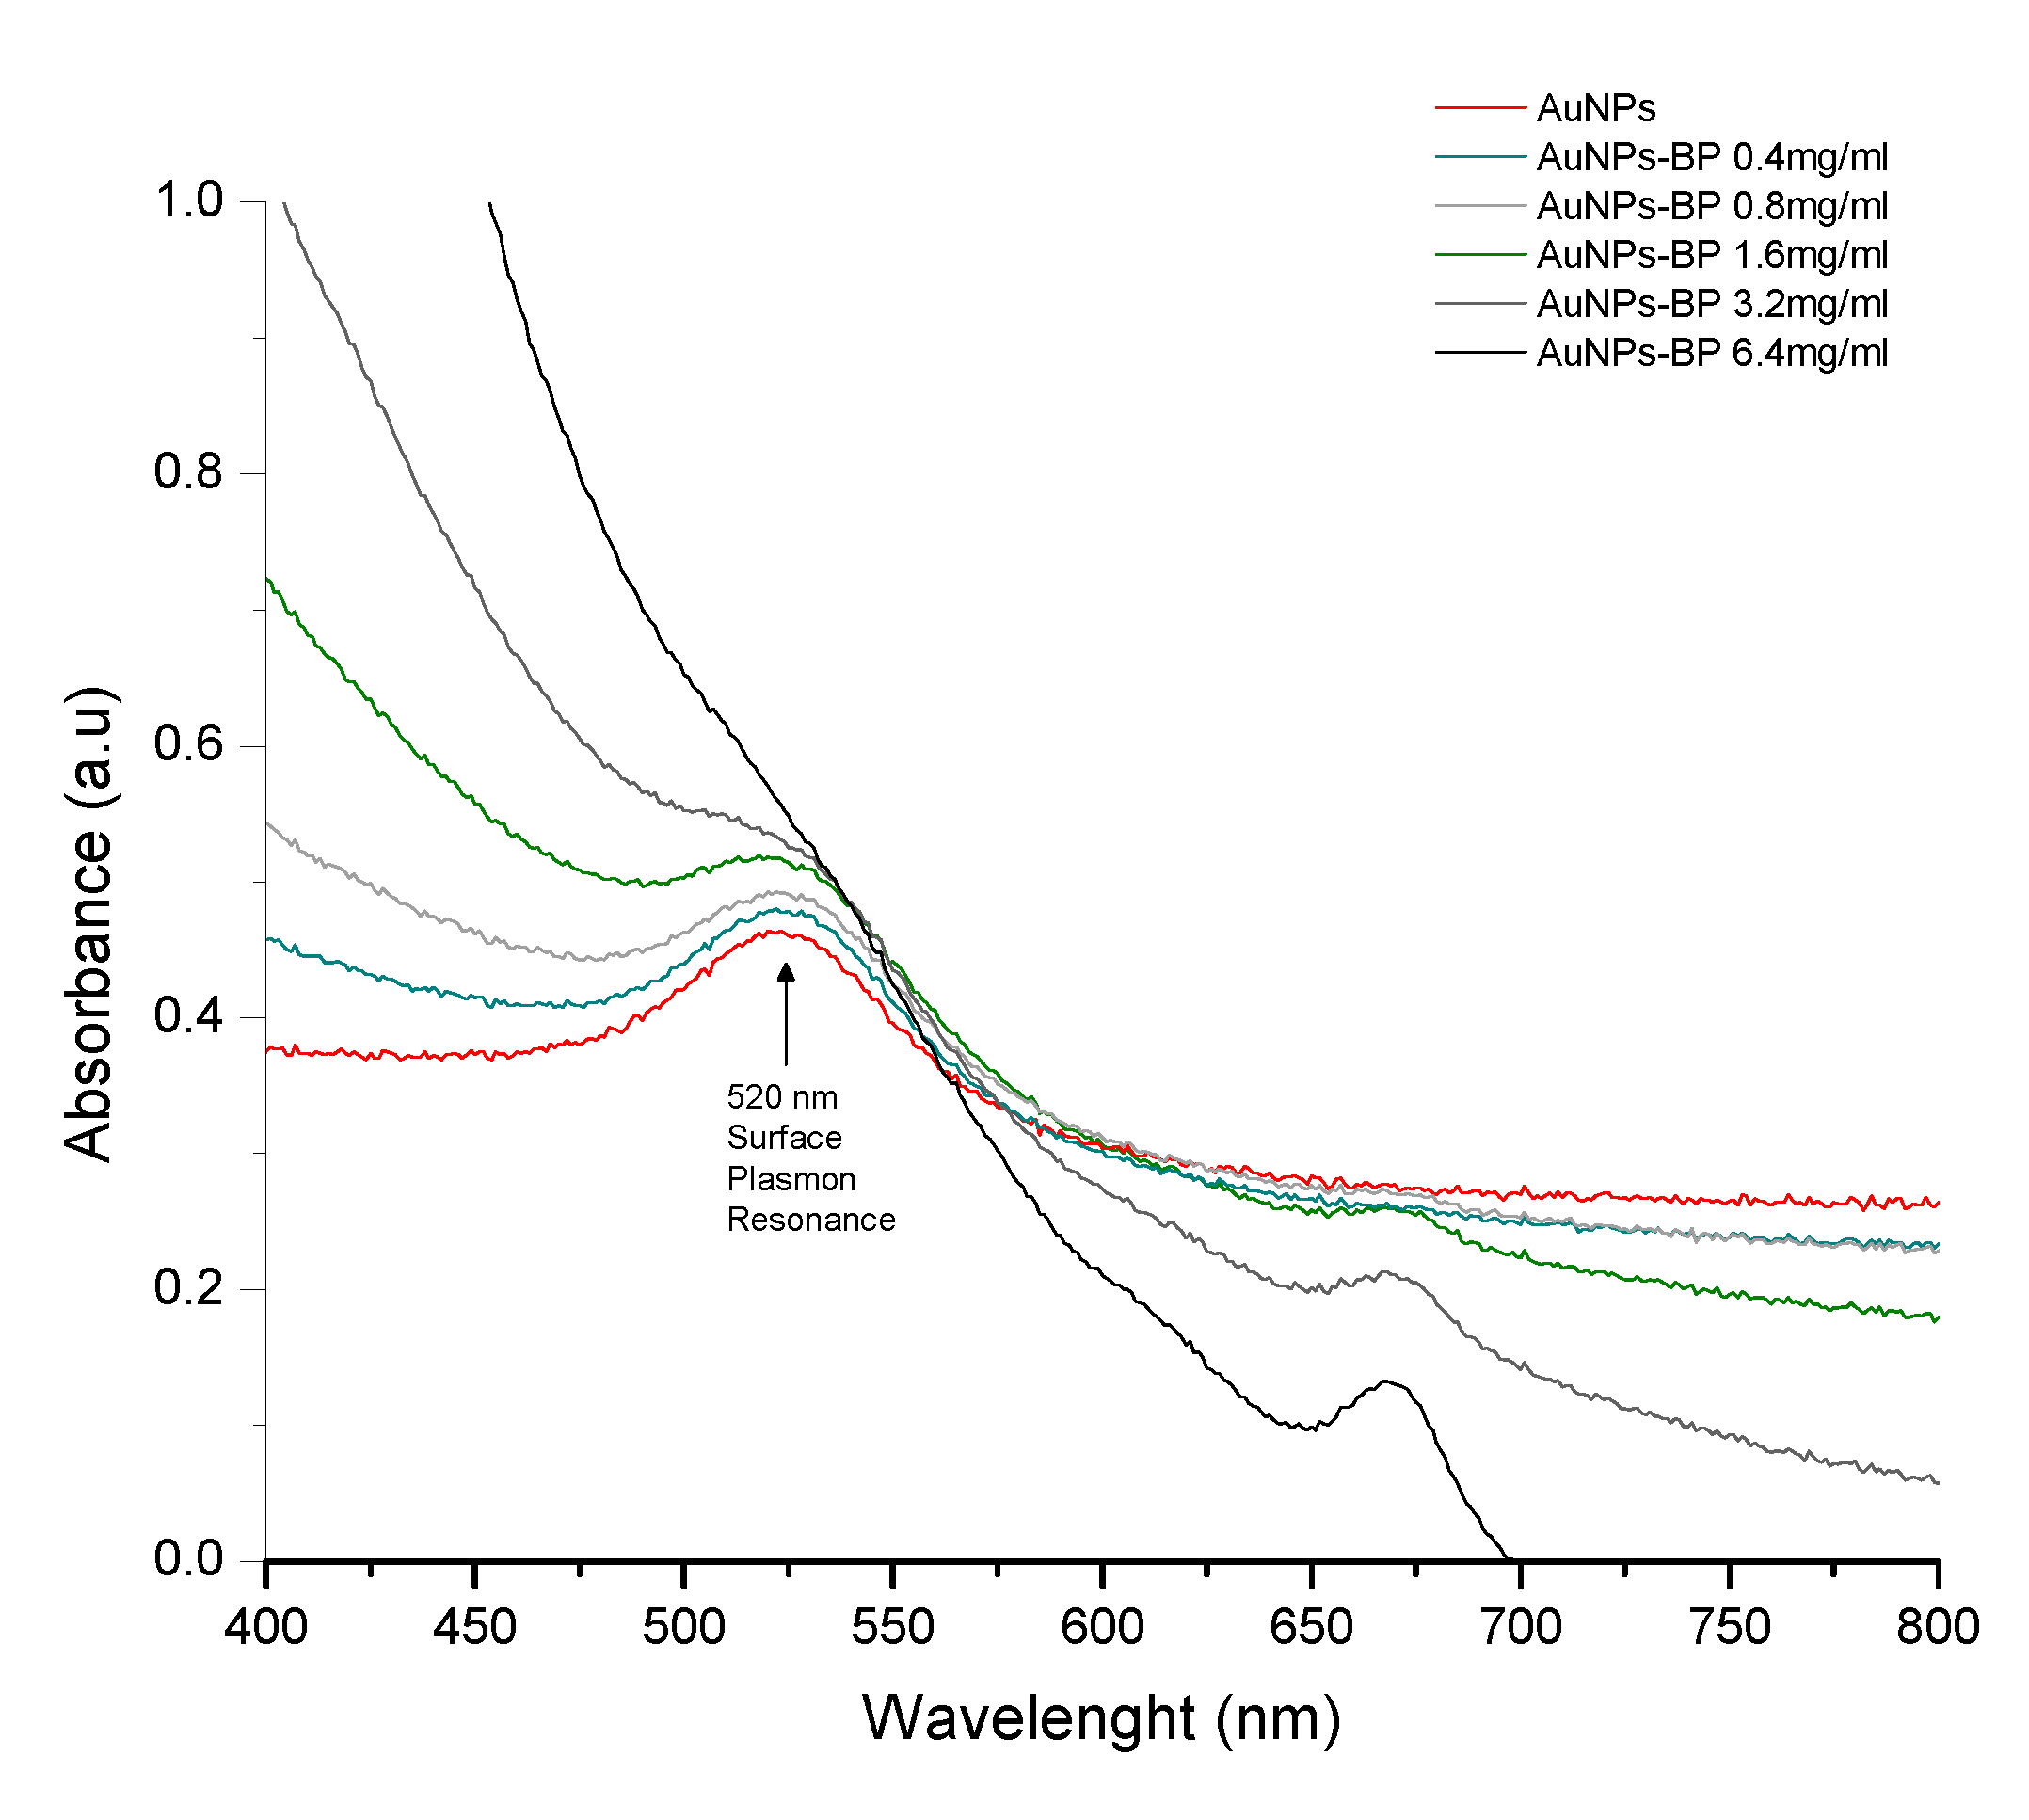
2.1. UV–visible spectrophotometry analyses of nanofunctionalized gold nanoparticles with polyphenolic compounds of B. procumbens (AuNP-BP)
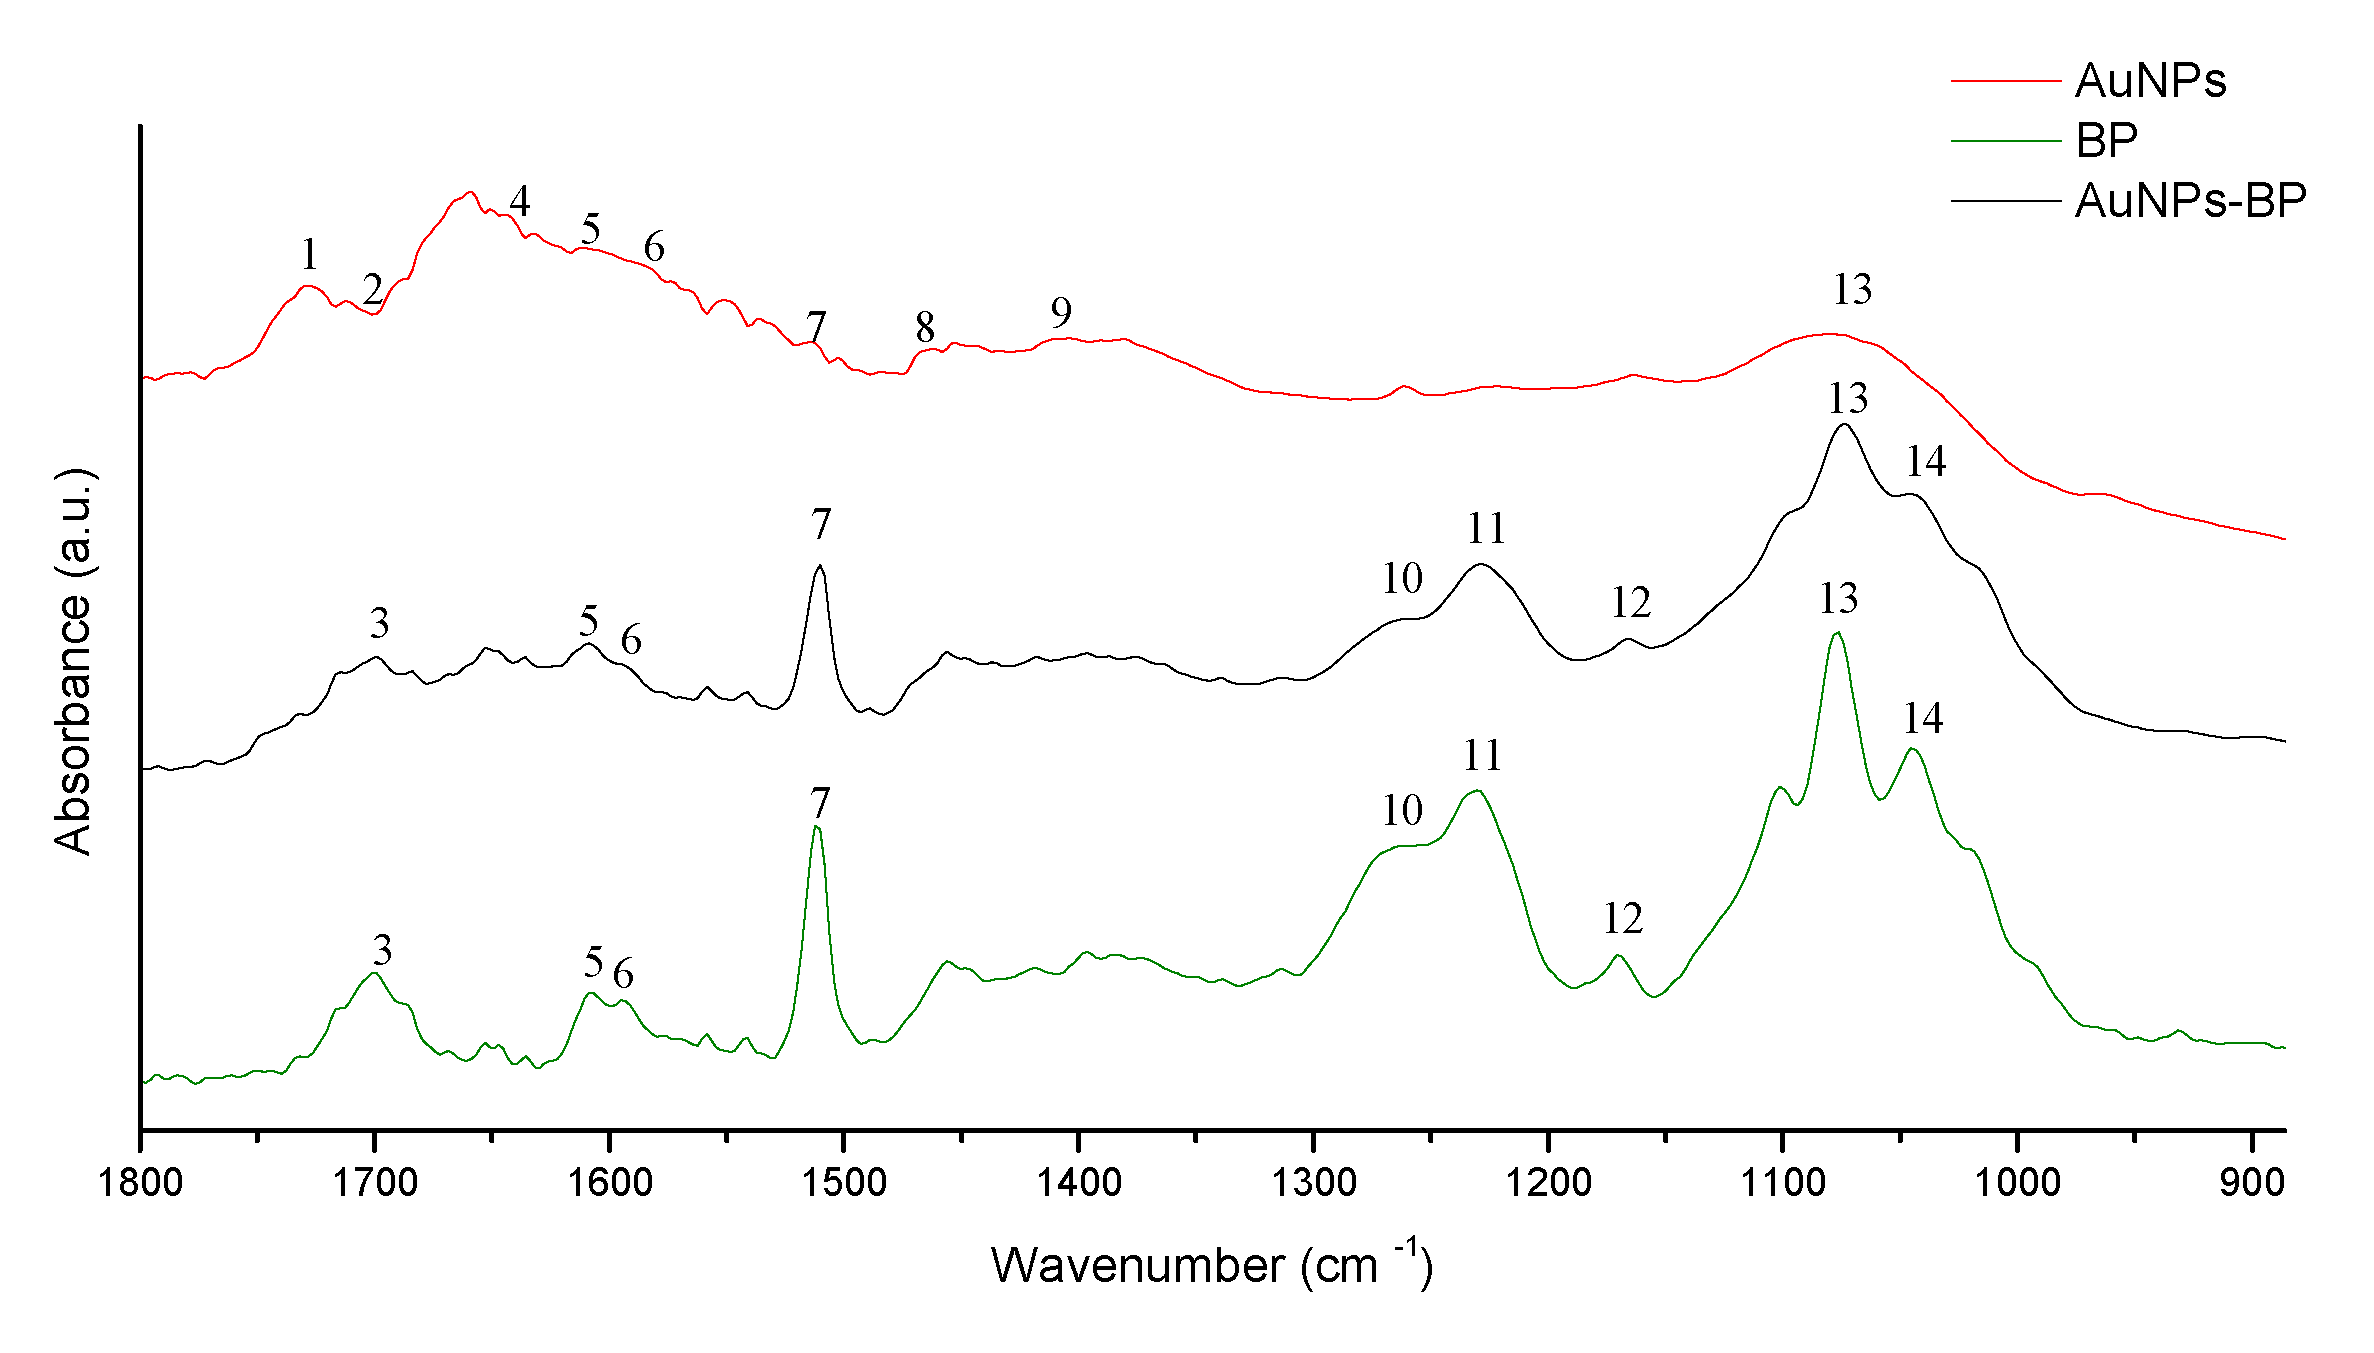
2.1.1. FTIR spectroscopy of the AuNP-BP
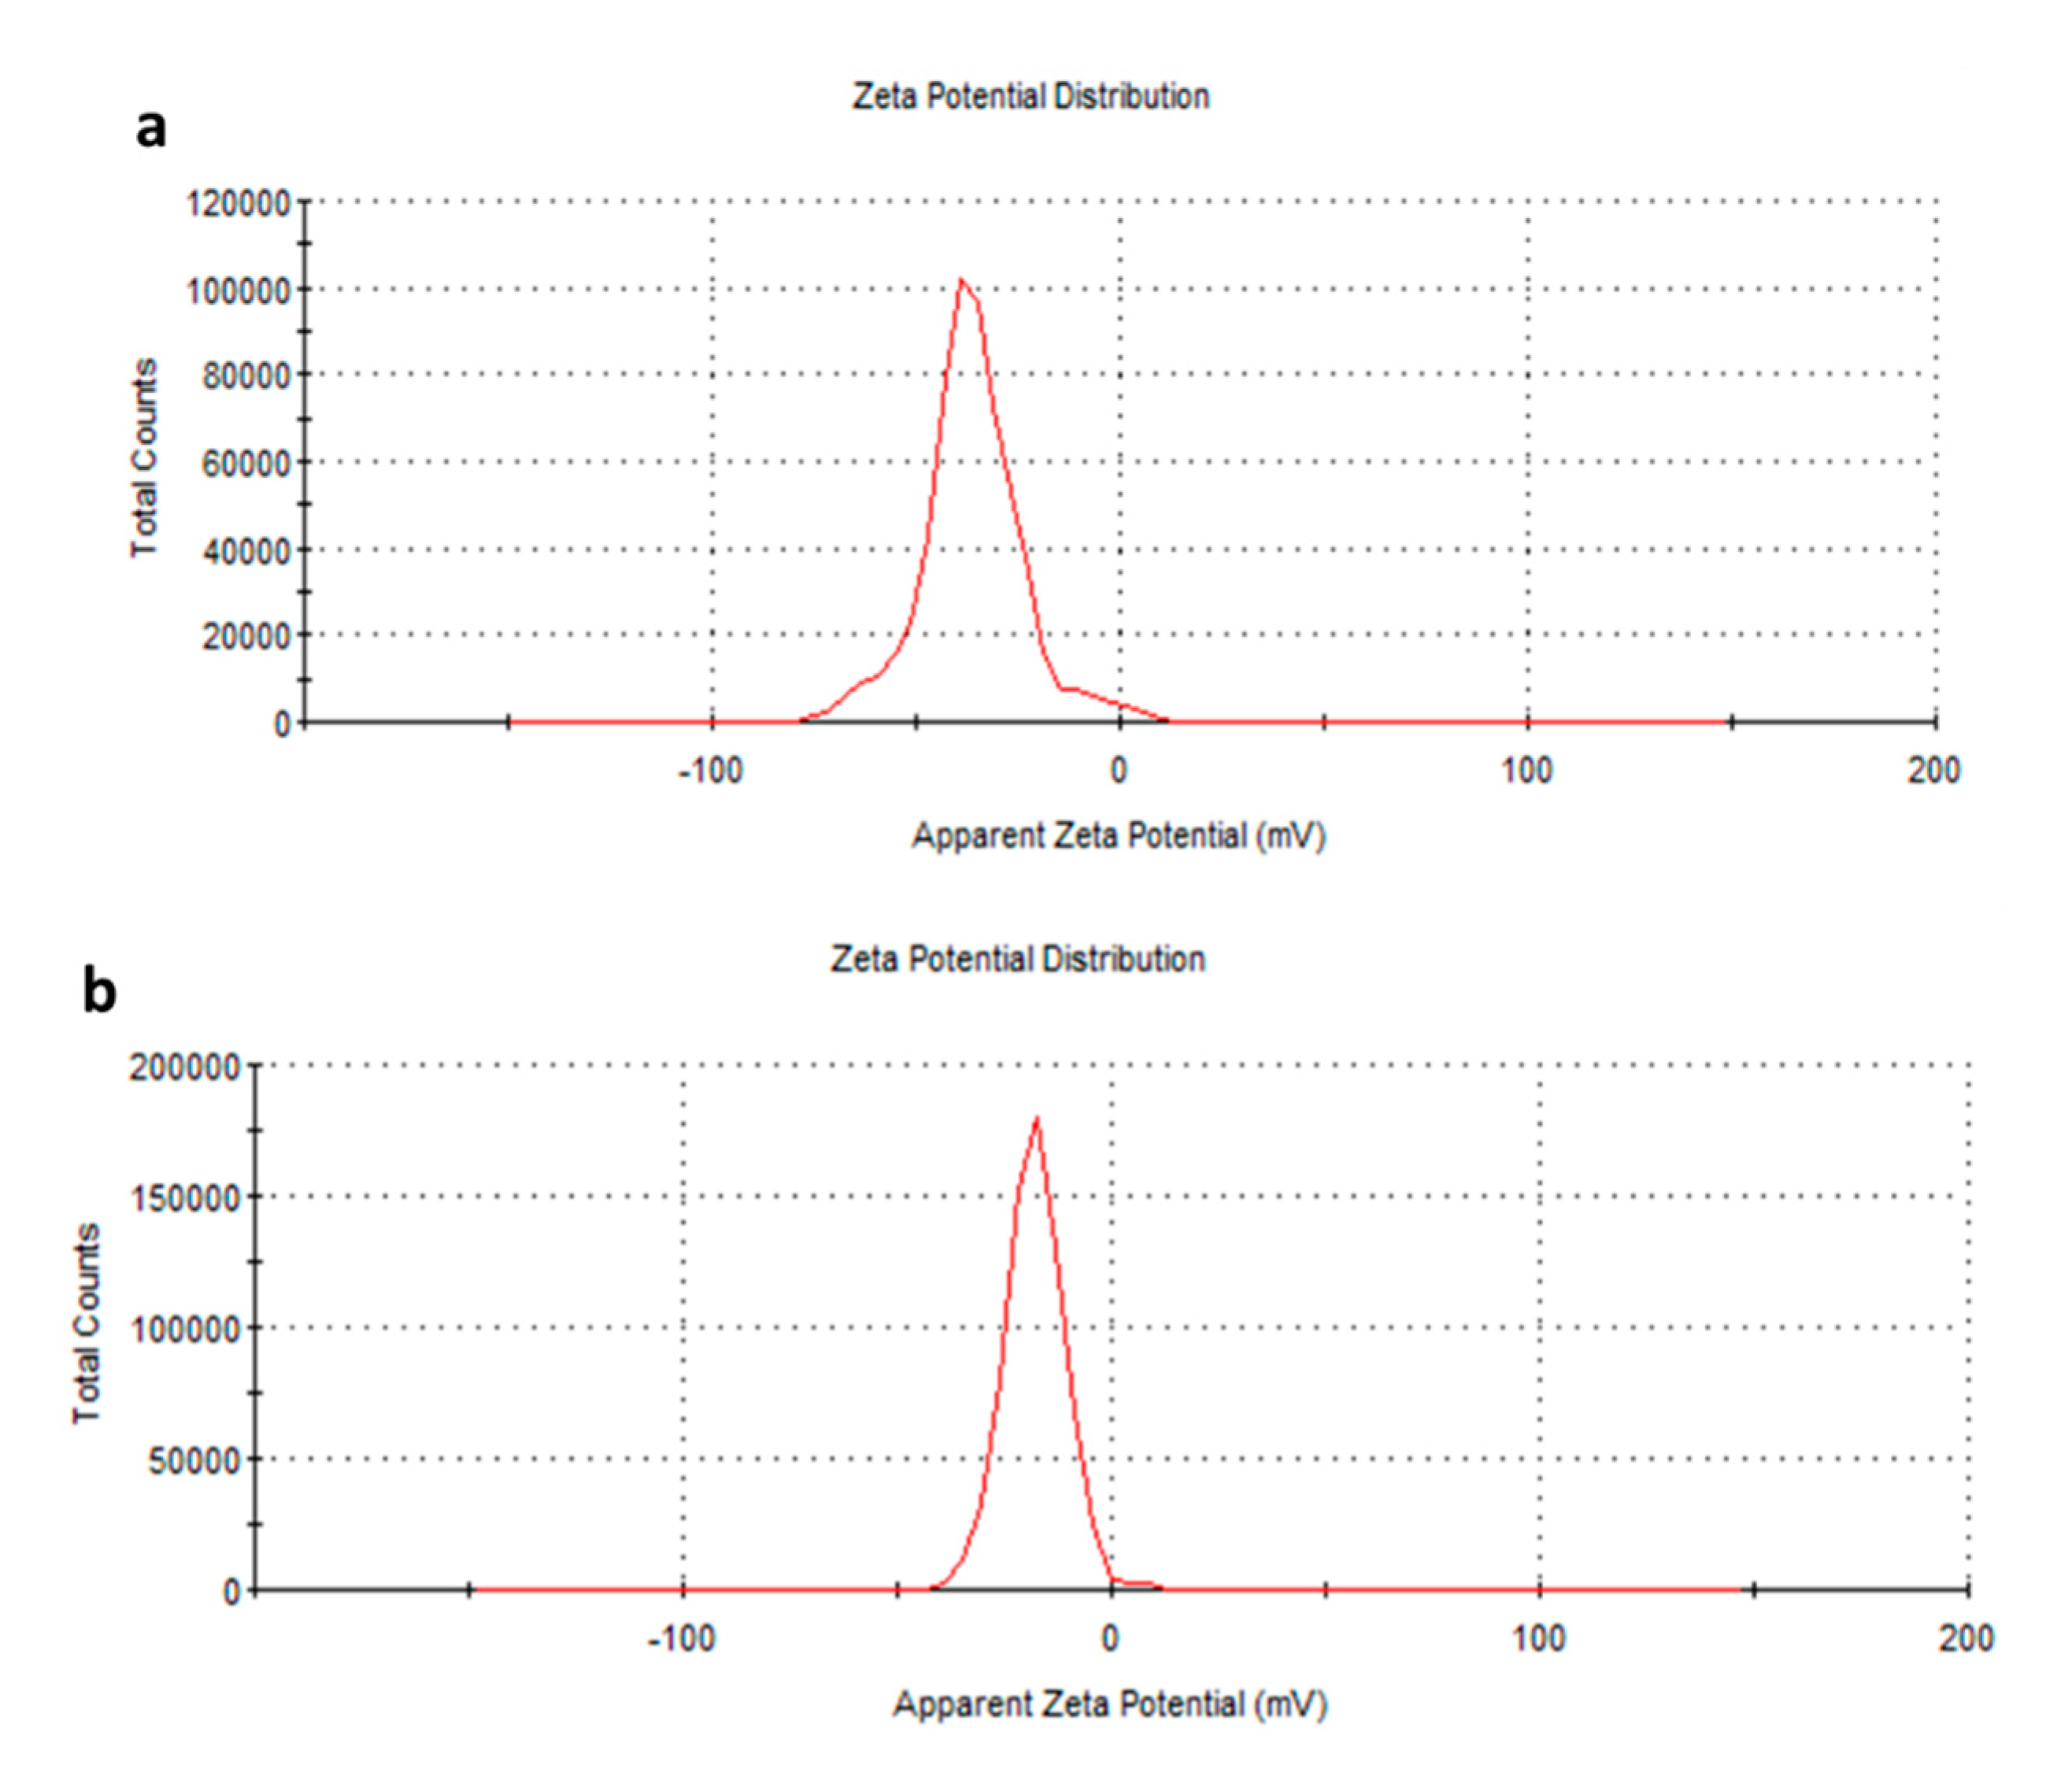
2.1.2. Dynamic Light Scattering measurements (DLS) and Electrophoretic Ligth Scattering (ELS)
2.2. Effects of topical application of AuNP-BP hydrogel in rat wound healing model
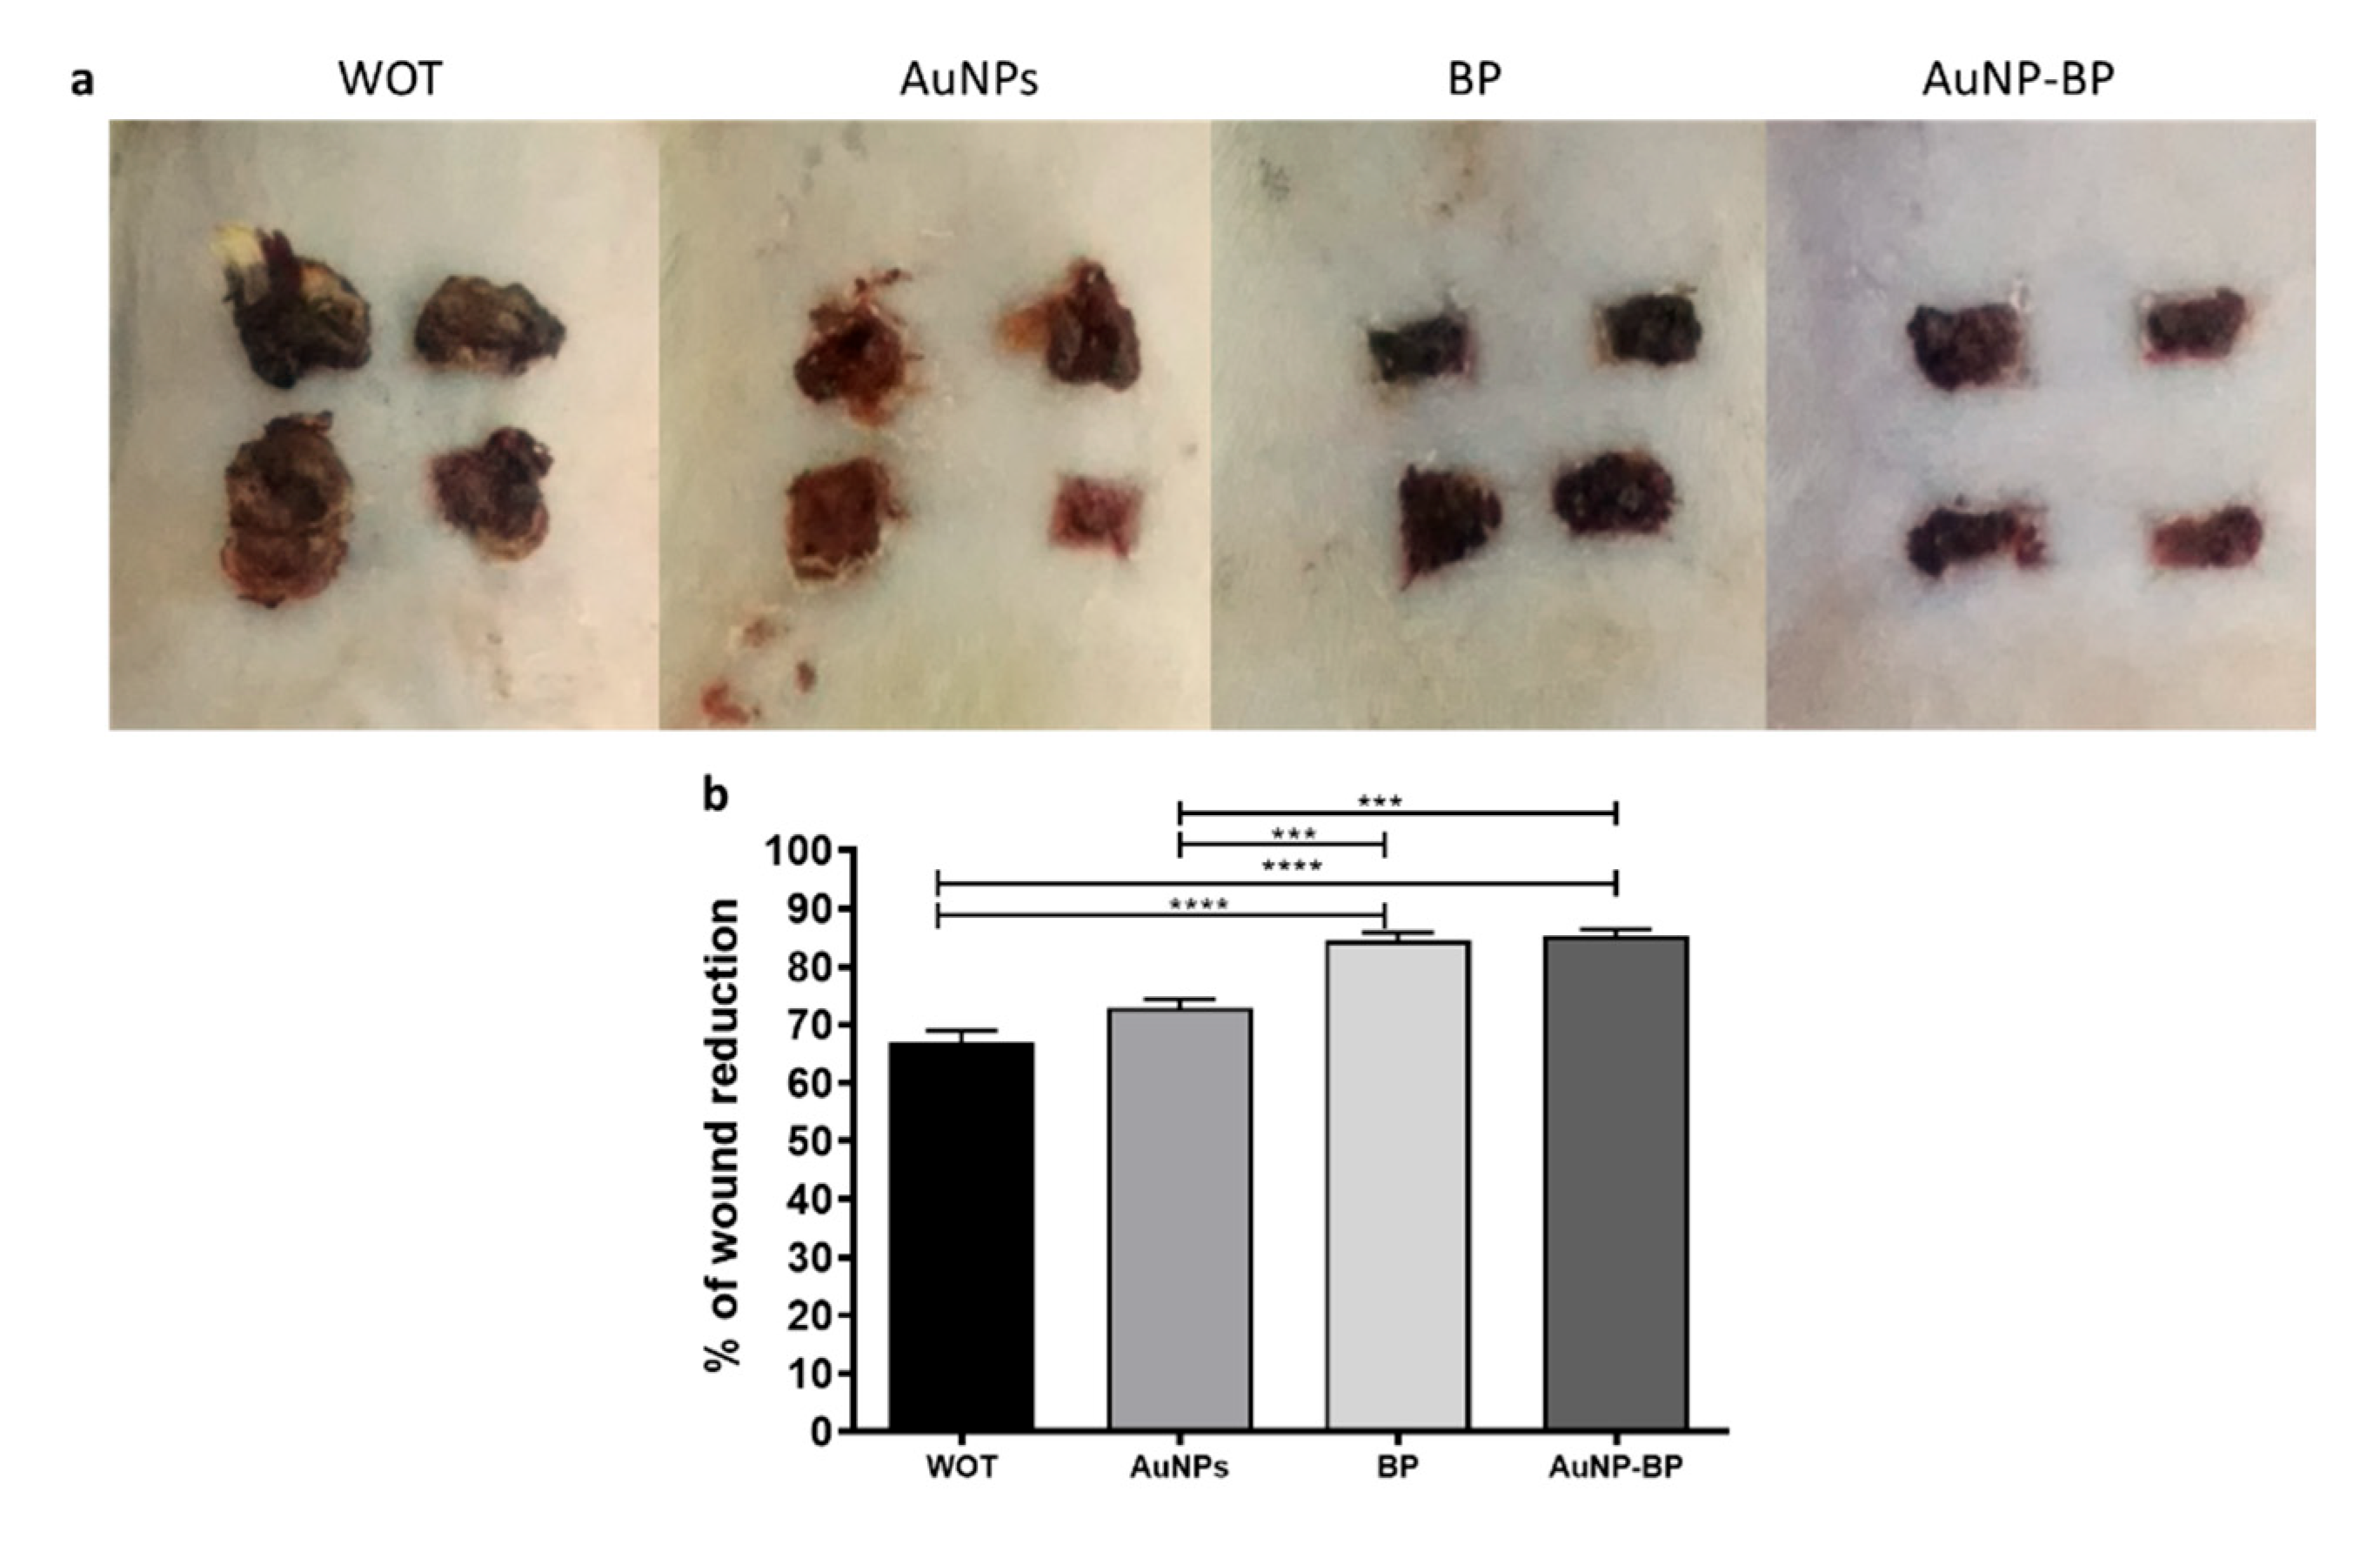
2.2.1. Macroscopic changes induced by AuNP-BP hydrogel
2.2.2. AuNP-BP hydrogel enhance histological wound healing
2.2.3. ATR-FTIR spectra changes on skin wound healing induced by AuNP-BP
3. Discussion
4. Materials and Methods
4.1. Polyphenolic compounds extraction from Bacopa procumbens
4.2. Gold nanoparticles synthesis
4.3. Gold nanoparticles conjugation with polyphenolic compounds of Bacopa procumbens
4.4. Instrumentation
4.5. In vivo skin wound model
4.5.1. Animals
4.5.2. Morphometric analysis
4.5.3. Histopathological analysis
4.5.4. ATR-FTIR spectra analysis
4.6. Statistical analysis
5. Conclusions
6. Patents
Author Contributions
Funding
Institutional Review Board Statement
Informed Consent Statement
Data Availability Statement
Acknowledgments
Conflicts of Interest
References
- Kwan, K.H.; Liu, X.; To, M.K.; Yeung, K.W.; Ho, C.M.; Wong, K.K. Modulation of collagen alignment by silver nanoparticles results in better mechanical properties in wound healing. Nanomedicine 2011, 7, 497–504. [Google Scholar] [CrossRef]
- Velnar, T.; Bailey, T.; Smrkolj, V. The wound healing process: An overview of the cellular and molecular mechanisms. J Int Med Res. 2009, 37, 1528–1542. [Google Scholar] [CrossRef]
- Spampinato, S.F.; Caruso, G.I.; De Pasquale, R.; Sortino, M.A.; Merlo, S. The Treatment of Impaired Wound Healing in Diabetes: Looking among Old Drugs. Pharmaceuticals 2020, 13, 60. [Google Scholar] [CrossRef] [PubMed]
- Naskar, A.; Kim, K.S. Recent Advances in Nanomaterial-Based Wound-Healing Therapeutics. Pharmaceutics 2020, 12, 499. [Google Scholar] [CrossRef] [PubMed]
- Melguizo-Rodríguez, L.; de Luna-Bertos, E.; Ramos-Torrecillas, J.; Illescas-Montesa, R.; Costela-Ruiz, V.J.; García-Martínez, O. Potential Effects of Phenolic Compounds That Can Be Found in Olive Oil on Wound Healing. Foods 2021, 10, 1642. [Google Scholar] [CrossRef] [PubMed]
- Martínez-Cuazitl, A.; Gómez-García, M.D.C.; Hidalgo-Alegria, O.; Flores, O.M.; Núñez-Gastélum, J.A.; Martínez, E.S.M.; Ríos-Cortés, A.M.; Garcia-Solis, M.; Pérez-Ishiwara, D.G. Characterization of Polyphenolic Compounds from Bacopa procumbens and Their Effects on Wound-Healing Process. Molecules 2022, 27, 6521. [Google Scholar] [CrossRef] [PubMed]
- Cucci, L.M.; Trapani, G.; Hansson, Ö.; La Mendola, D.; Satriano, C. Gold Nanoparticles Functionalized with Angiogenin for Wound Care Application. Nanomaterials 2021, 11, 201. [Google Scholar] [CrossRef] [PubMed]
- Grzelczak, M.; Pérez-Juste, J.; Mulvaney, P.; Liz-Marzán, L.M. Shape control in gold nanoparticle synthesis. Chem Soc Rev. 2008, 37, 1783–1791. [Google Scholar] [CrossRef] [PubMed]
- Wang, A.; Ng, H.P.; Xu, Y.; Li, Y.; Zheng, Y.; Yu, J. Gold nanoparticles: Synthesis, stability test, and application for the rice growth. J Nanomater. 2014, 2014, 3–6. [Google Scholar] [CrossRef]
- Mourdikoudis, S.; Pallares, R.M.; Thanh, N.T.K. Characterization techniques for nanoparticles: Comparison and complementarity upon studying nanoparticle properties. Nanoscale 2018, 10, 12871–12934. [Google Scholar] [CrossRef]
- Kus-Liśkiewicz, M.; Fickers, P.; Ben Tahar, I. Biocompatibility and Cytotoxicity of Gold Nanoparticles: Recent Advances in Methodologies and Regulations. Int J Mol Sci. 2021, 22, 10952. [Google Scholar] [CrossRef]
- Kadhim, R.J.; Karsh, E.H.; Taqi, Z.J.; Jabir, M.S. Biocompatibility of gold nanoparticles: In-vitro and In-vivo study. Materials Today Proceedings 2021, 42, 3041–3045, ISSN 2214-7853. [Google Scholar] [CrossRef]
- Sandiningtyas, R.D.; Suendo, V. Isolation of chlorophyll from spinach and its modification using Fe2+ in photostability study. In: Third international conference on mathematics and natural science. 2010, pp 859–873.
- Aravinthan, A.; Kamala-Kannan, S.; Govarthanan, M.; Kim, J.H. Accumulation of biosynthesized gold nanoparticles and its impact on various organs of Sprague Dawley rats: A systematic study. Toxicol Res. 2016, 5, 1530–1538. [Google Scholar] [CrossRef] [PubMed]
- Ha Lien Nghiem, T.h.i.; La, H.u.y.e.n.; Xuan Hoa, V.u.; Chu Viet, H.a.; Nguyen, T.h.a.n.h.; Fort, E.m.m.a.n.u.e.l.; Do Quang, H.o.a.; Hong Nhung, T.r.a.n. Synthesis, capping and binding of colloidal Gold Nanoparticles to Proteins. Advances in Natural Sciences Nanoscience and Nanotechnology 2010, 1, 025009. [Google Scholar] [CrossRef]
- Sanna, V.; Pala, N.; Dessì, G.; Manconi, P.; Mariani, A.; Dedola, S.; Rassu, M.; Crosio, C.; Iaccarino, C.; Sechi, M. Single-step green synthesis and characterization of gold-conjugated polyphenol nanoparticles with antioxidant and biological activities. Int J Nanomedicine 2014, 9, 4935–4951. [Google Scholar] [CrossRef]
- Oliveira, R.N.; Mancini, M.C.; Oliveira FCS de Passos, T.M.; Quilty, B.; Thiré RM da, S.M. FTIR analysis and quantification of phenols and flavonoids of five commercially available plants extracts used in wound healing. Matéria 2016, 21, 767–779. [Google Scholar] [CrossRef]
- Vazquez-Zapien, G.J.; Martinez-Cuazitl, A.; Granados-Jimenez, A.; Sanchez-Brito, M.; Guerrero-Ruiz, M.; Camacho-Ibarra, A.; Miranda-Ruiz, M.A.; Dox-Aguillón, I.S.; Ramirez-Torres, J.A.; Mata-Miranda, M.M. Skin wound healing improvement in diabetic mice through FTIR microspectroscopy after implanting pluripotent stem cells. APL Bioeng. 2023, 7, 016109. [Google Scholar] [CrossRef]
- Sanden, K.W.; Kohler, A.; Afseth, N.K.; Böcker, U.; Rønning, S.B.; Liland, K.H.; Pedersen, M.E. The use of Fourier-transform infrared spectroscopy to characterize connective tissue components in skeletal muscle of Atlantic cod (Gadus morhua L.). J Biophotonics 2019, 12, e201800436. [Google Scholar] [CrossRef] [PubMed]
- Nguyen, T.T.; Eklouh-Molinier, C.; Sebiskveradze, D.; Feru, J.; Terryn, C.; Manfait, M.; Brassart-Pasco, S.; Piot, O. Changes of skin collagen orientation associated with chronological aging as probed by polarized-FTIR micro-imaging. Analyst. 2014, 139, 2482–2488. [Google Scholar] [CrossRef]
- Aji, A.; Oktafiani, D.; Yuniarto, A.; Kurnia, A.A. Biosynthesis of gold nanoparticles using Kapok (Ceiba pentandra) leaf aqueous extract and investigating their antioxidant activity. Journal of Molecular Structure 2022, 1270, 133906. [Google Scholar] [CrossRef]
- González, V.; Kharisov, B.; Gómez, I. Preparation, optical characterization and stability of gold nanoparticles by facile methods. Revista Mexicana de Fisica 2019, 65, 690–698. [Google Scholar] [CrossRef]
- Haiss, W.; Thanh, N.T.; Aveyard, J.; Fernig, D.G. Determination of size and concentration of gold nanoparticles from UV-vis spectra. Anal Chem. 2007, 79, 4215–4221. [Google Scholar] [CrossRef] [PubMed]
- Elbagory, A.M.; Hussein, A.A.; Meyer, M. The In Vitro Immunomodulatory Effects Of Gold Nanoparticles Synthesized From Hypoxis hemerocallidea Aqueous Extract And Hypoxoside On Macrophage And Natural Killer Cells. Int J Nanomedicine 2019, 14, 9007–9018. [Google Scholar] [CrossRef] [PubMed]
- Korani, S.; Rashidi, K.; Hamelian, M.; Jalalvand, A.R.; Tajehmiri, A.; Korani, M.; Sathyapalan, T.; Sahebkar, A. Evaluation of Antimicrobial and Wound Healing Effects of Gold Nanoparticles Containing Abelmoschus esculentus (L.). Aqueous Extract. Bioinorg Chem Appl. 2021, 2021, 7019130. [Google Scholar] [CrossRef]
- Castro, P.A.A.; Lima, C.A.; Morais, M.R.P.T.; Zorn, T.M.T.; Zezell, D.M. Monitoring the Progress and Healing Status of Burn Wounds Using Infrared Spectroscopy. Appl Spectrosc. 2020, 74, 758–766. [Google Scholar] [CrossRef]
- Vidal Bde, C.; Mello, M.L. Collagen type I amide I band infrared spectroscopy. Micron. 2011, 42, 283–289. [Google Scholar] [CrossRef]
| Band | AuNPs | BP | AuNP-BP 1.6 mg/ml | Functional group | Reference | |
|---|---|---|---|---|---|---|
| 1 | 1742 | - | - | O-H on AuNPs | [14] | |
| 2 | 1712 | - | - | N-H on AuNPs | [14] | |
| 3 | - | 1703 | 1703 | C=O | [16] | |
| 4 | 1637 | - | - | N-H on AuNPs | [15] | |
| 5 | 1612 | 1608 | 1608 | aromatic double bond | [16] | |
| 6 | 1589 | 1589 | 1589 | CH2-O on AuNPs | [15] | |
| 7 | 1512 | 1512 | 1510 | C-C flavonoids and aromatic rings | [17] | |
| 8 | 1470 | - | - | C-C on AuNPs | [14] | |
| 9 | 1402 | - | - | C=O on AuNPs | [15] | |
| 10 | - | 1258 | 1259 | C-O on polyols | [17] | |
| 11 | - | 1230 | 1229 | C-O on polyols | [17] | |
| 12 | 1171 | 1165 | C-O and –OH of primary alcohols | [17] | ||
| 13 | 1076 | 1076 | 1074 | C-O alcohols, phenols, carboxylic anions | [14,17] | |
| 14 | - | 1045 | 1055 | C-O and –OH of tertiary alcohols | [17] |
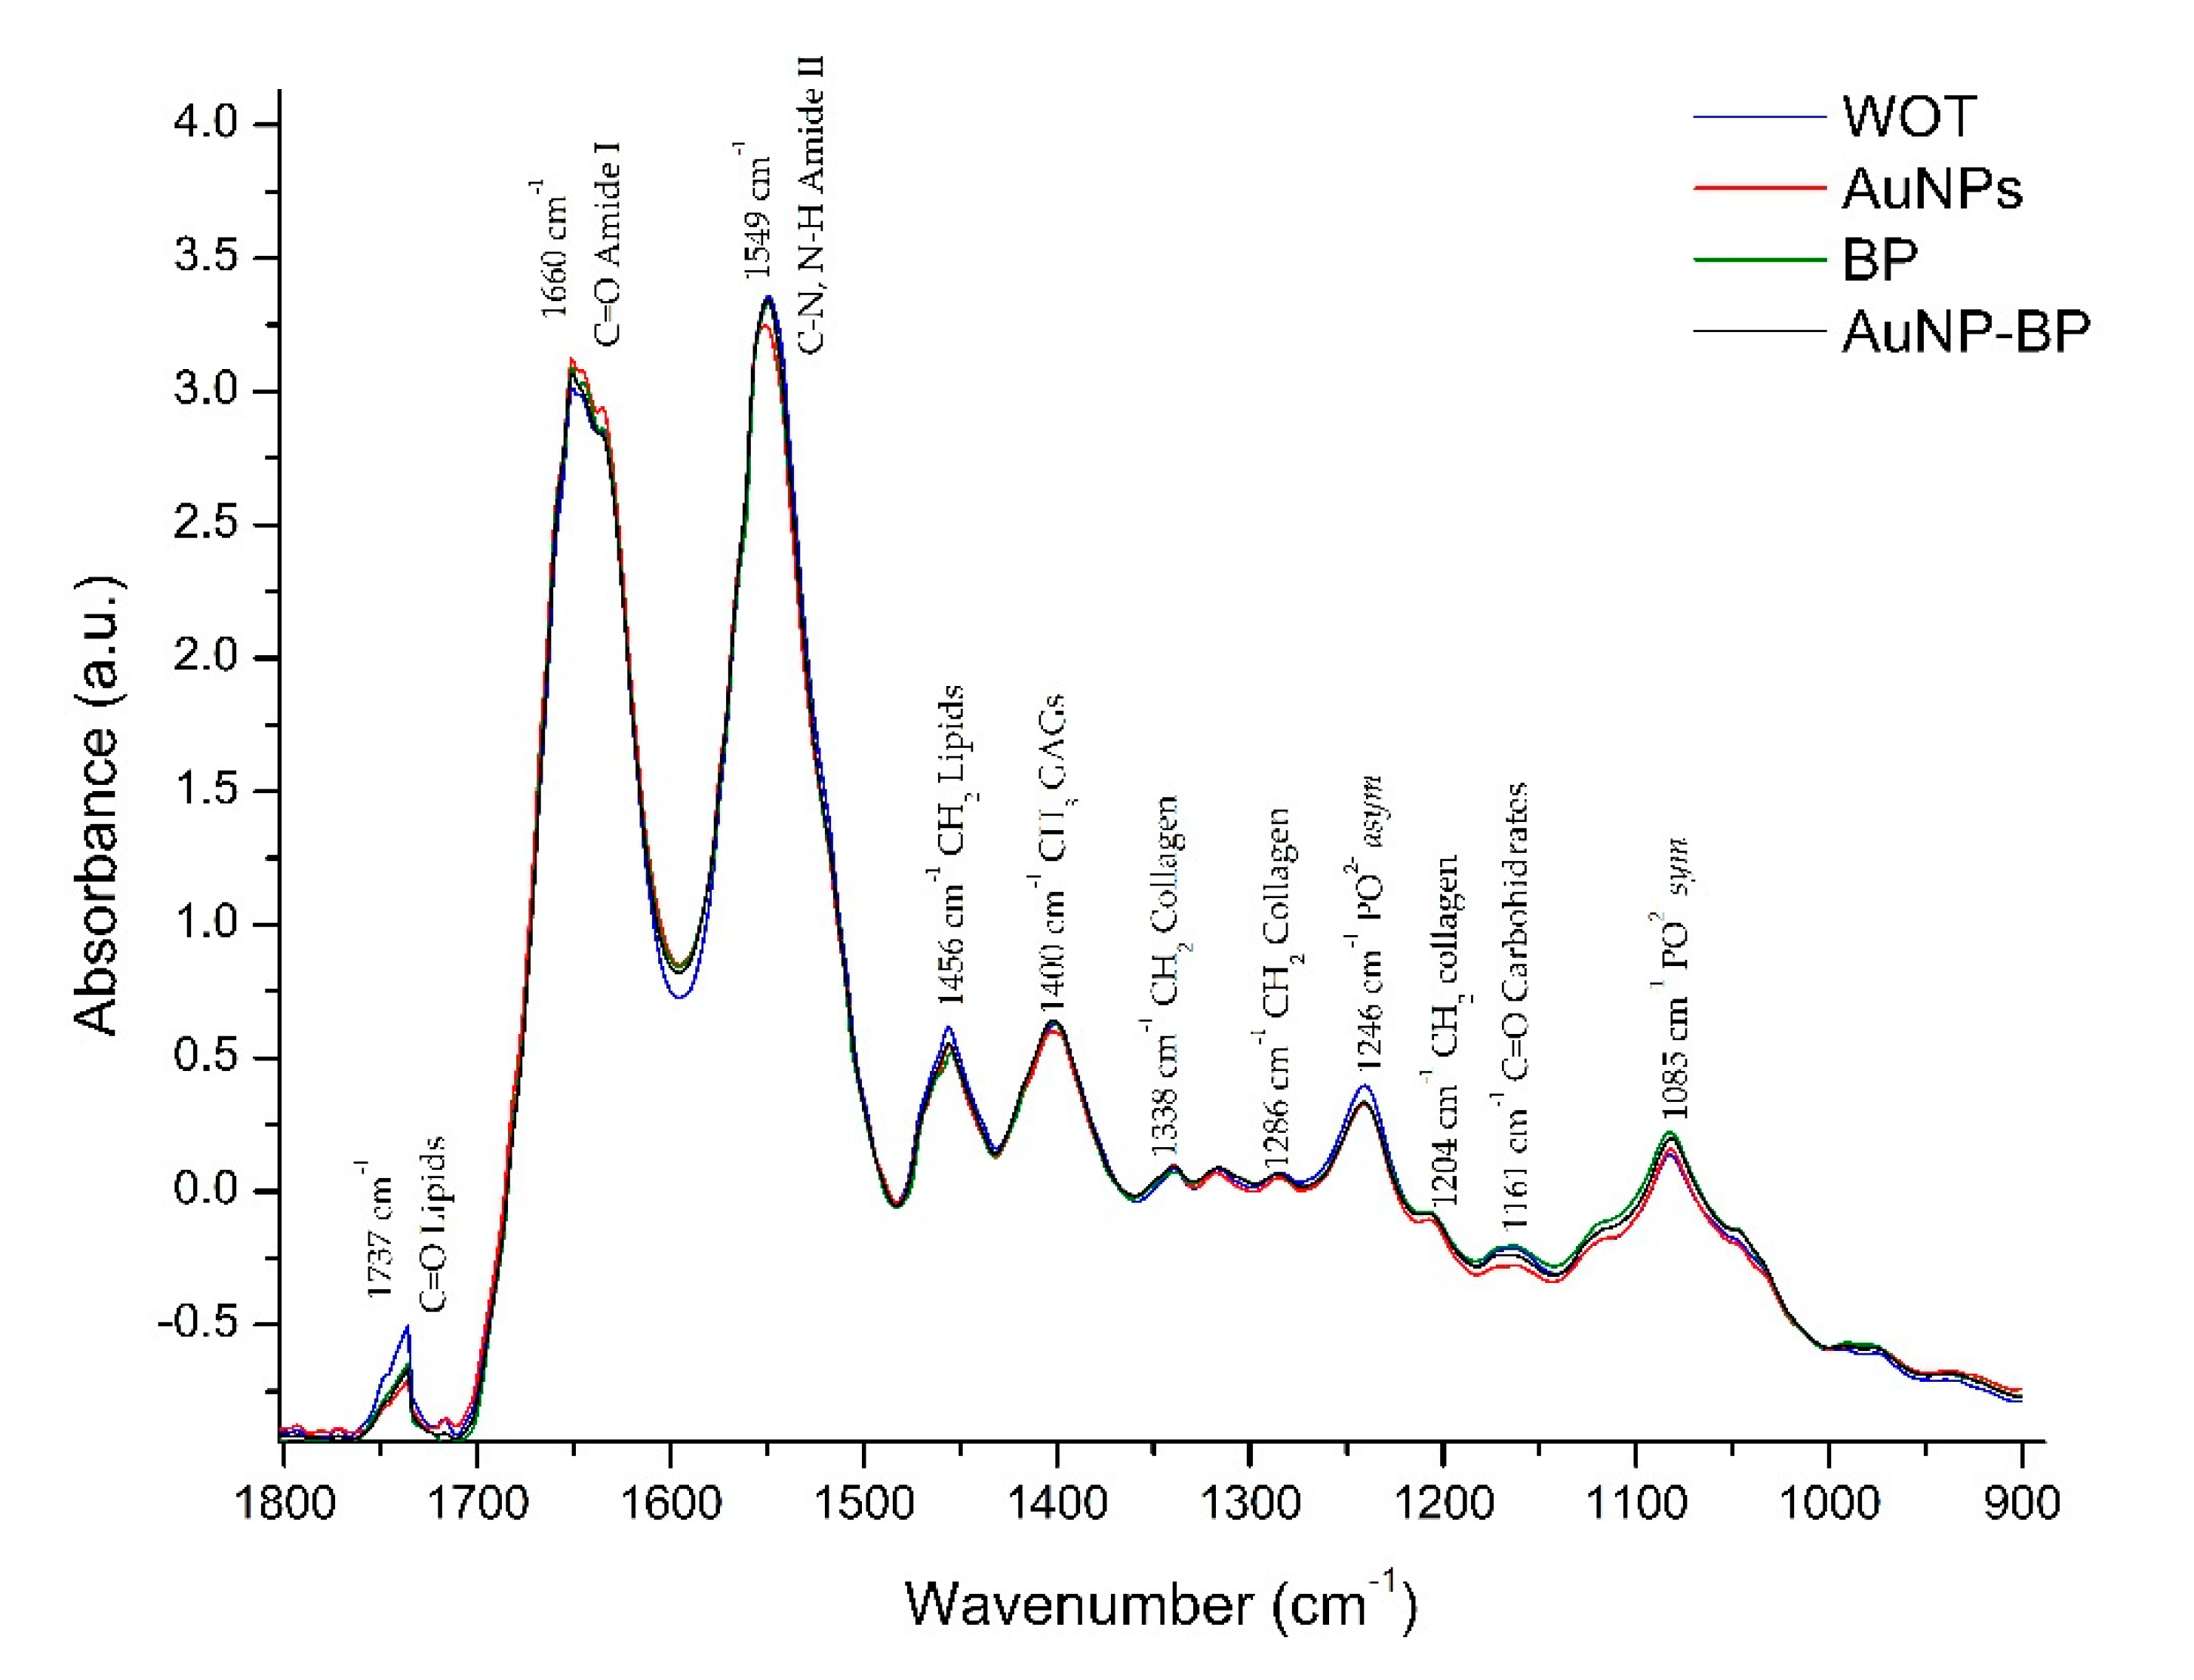
| Band | Assignment | Reference | |
|---|---|---|---|
| 1 | 1737 | C=O lipids | [18] |
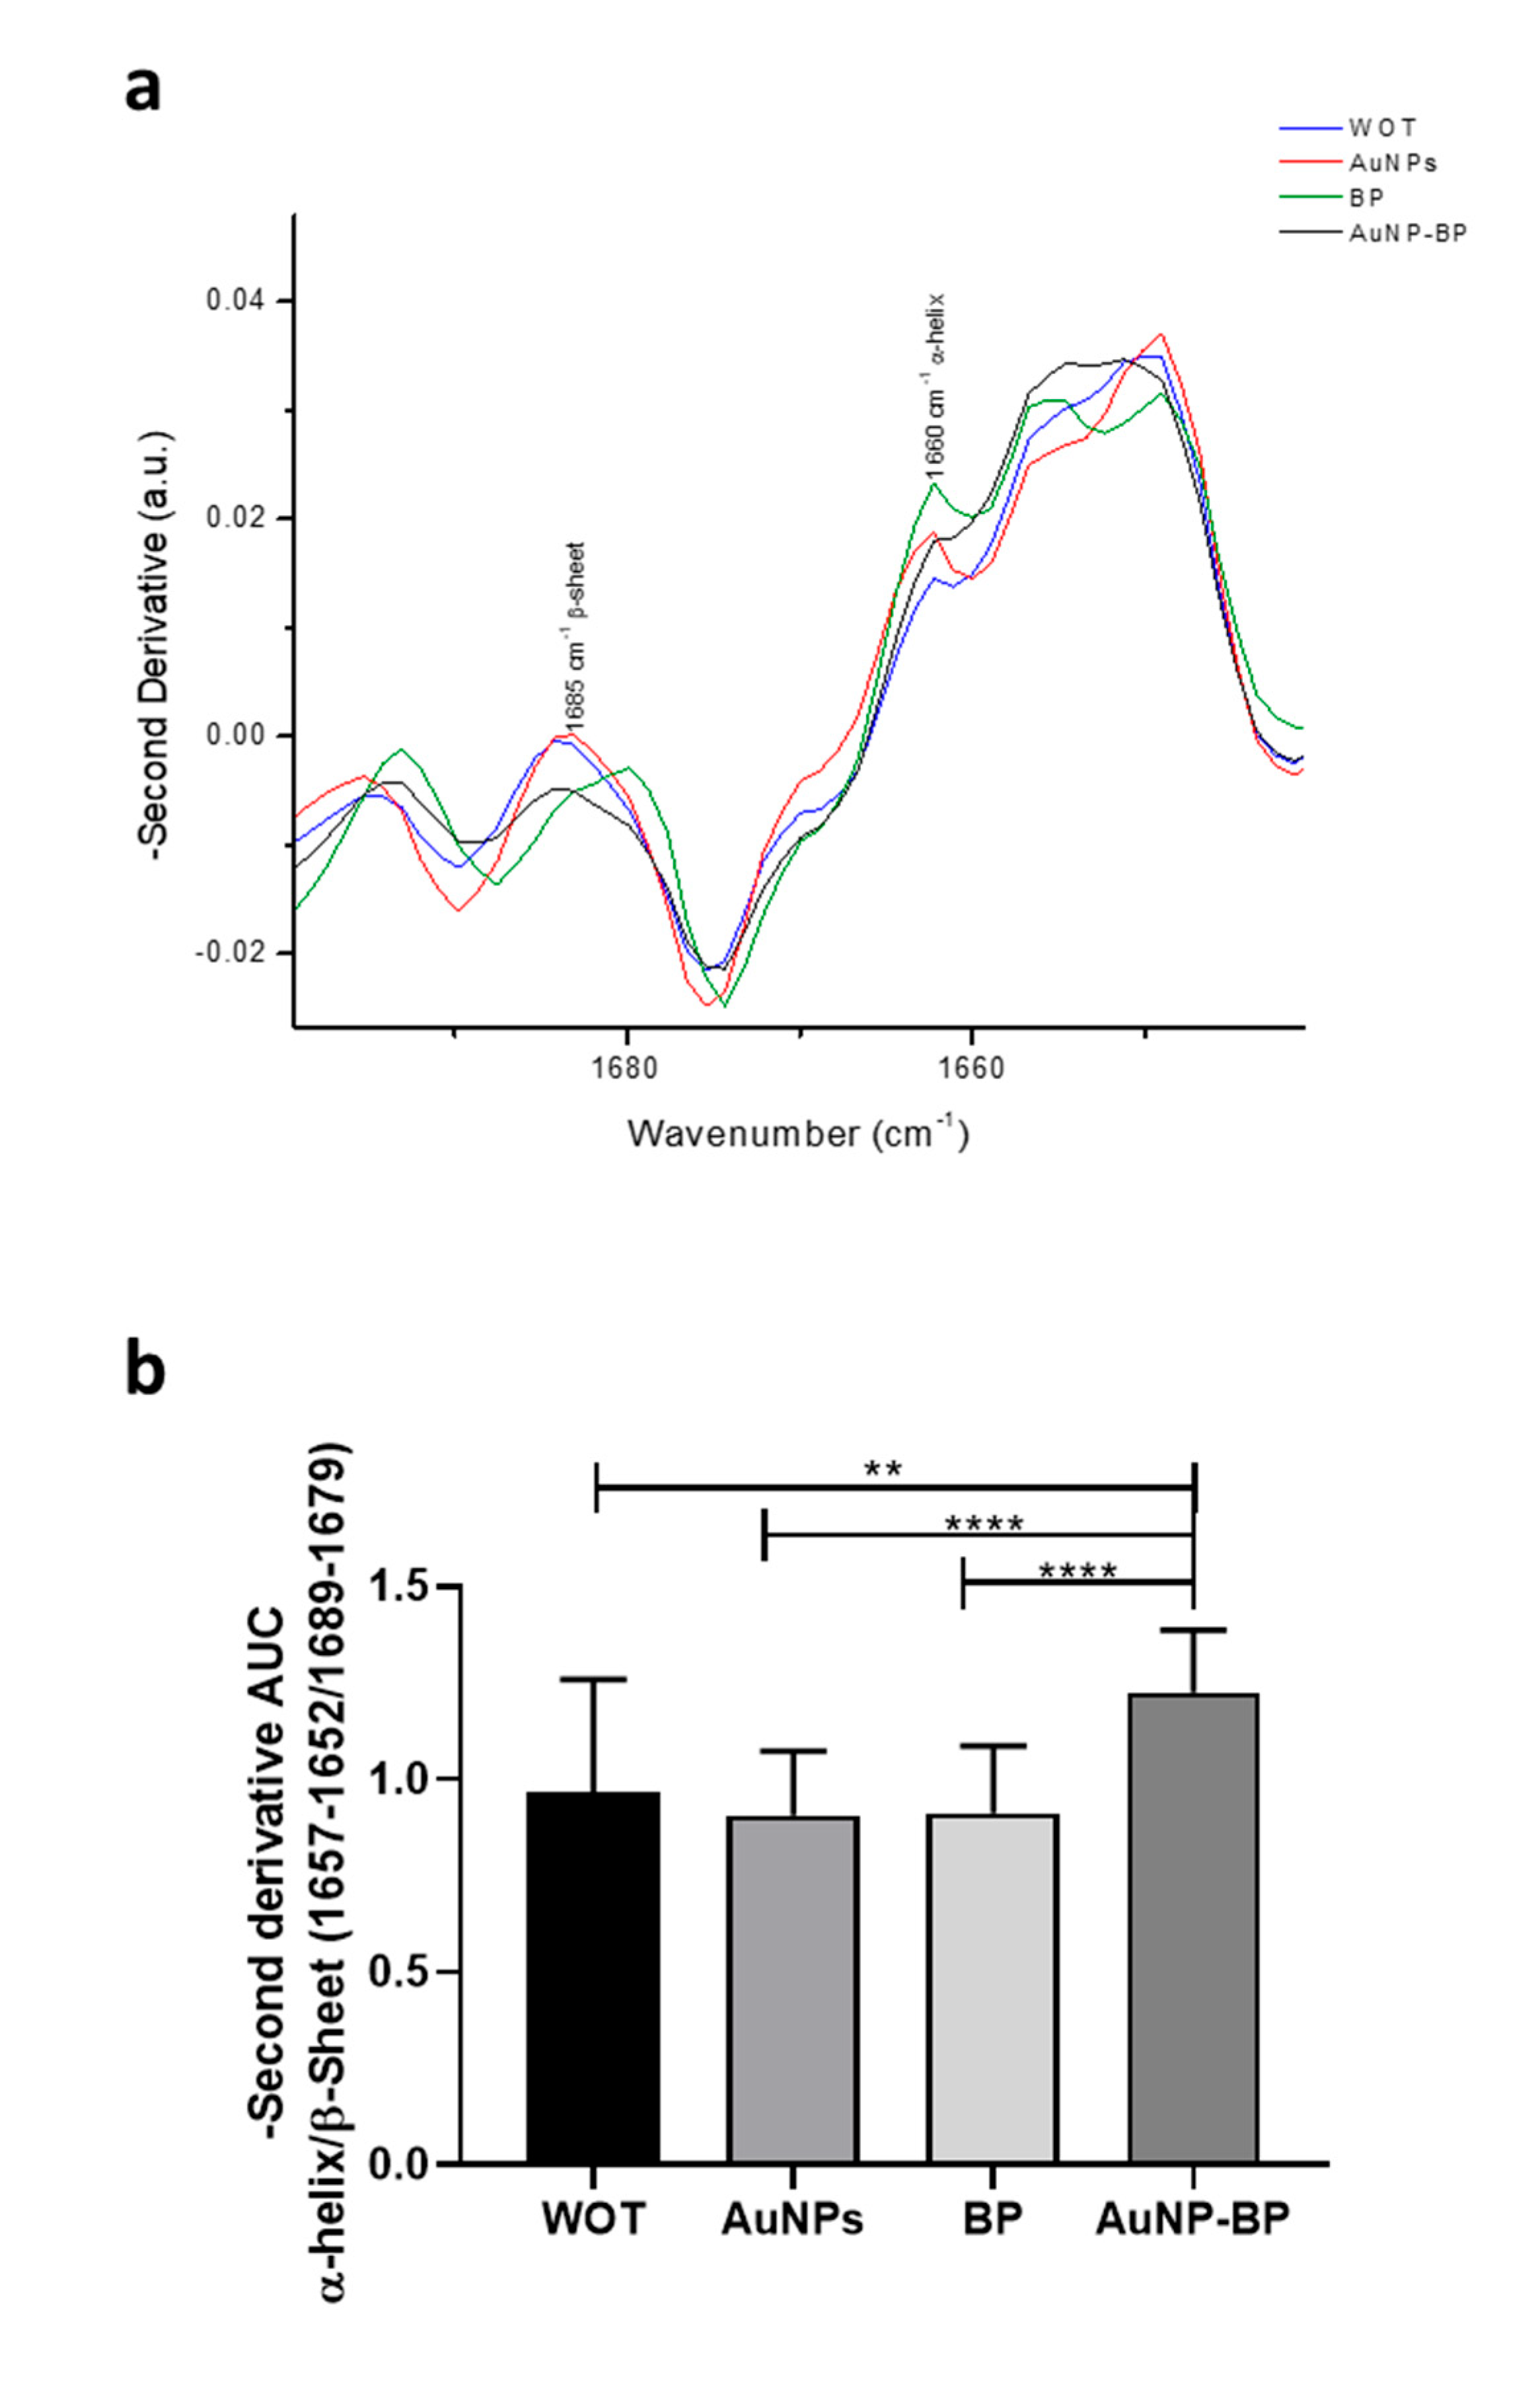
| 2 | 1660 | C= O Amide I | [18,19] |
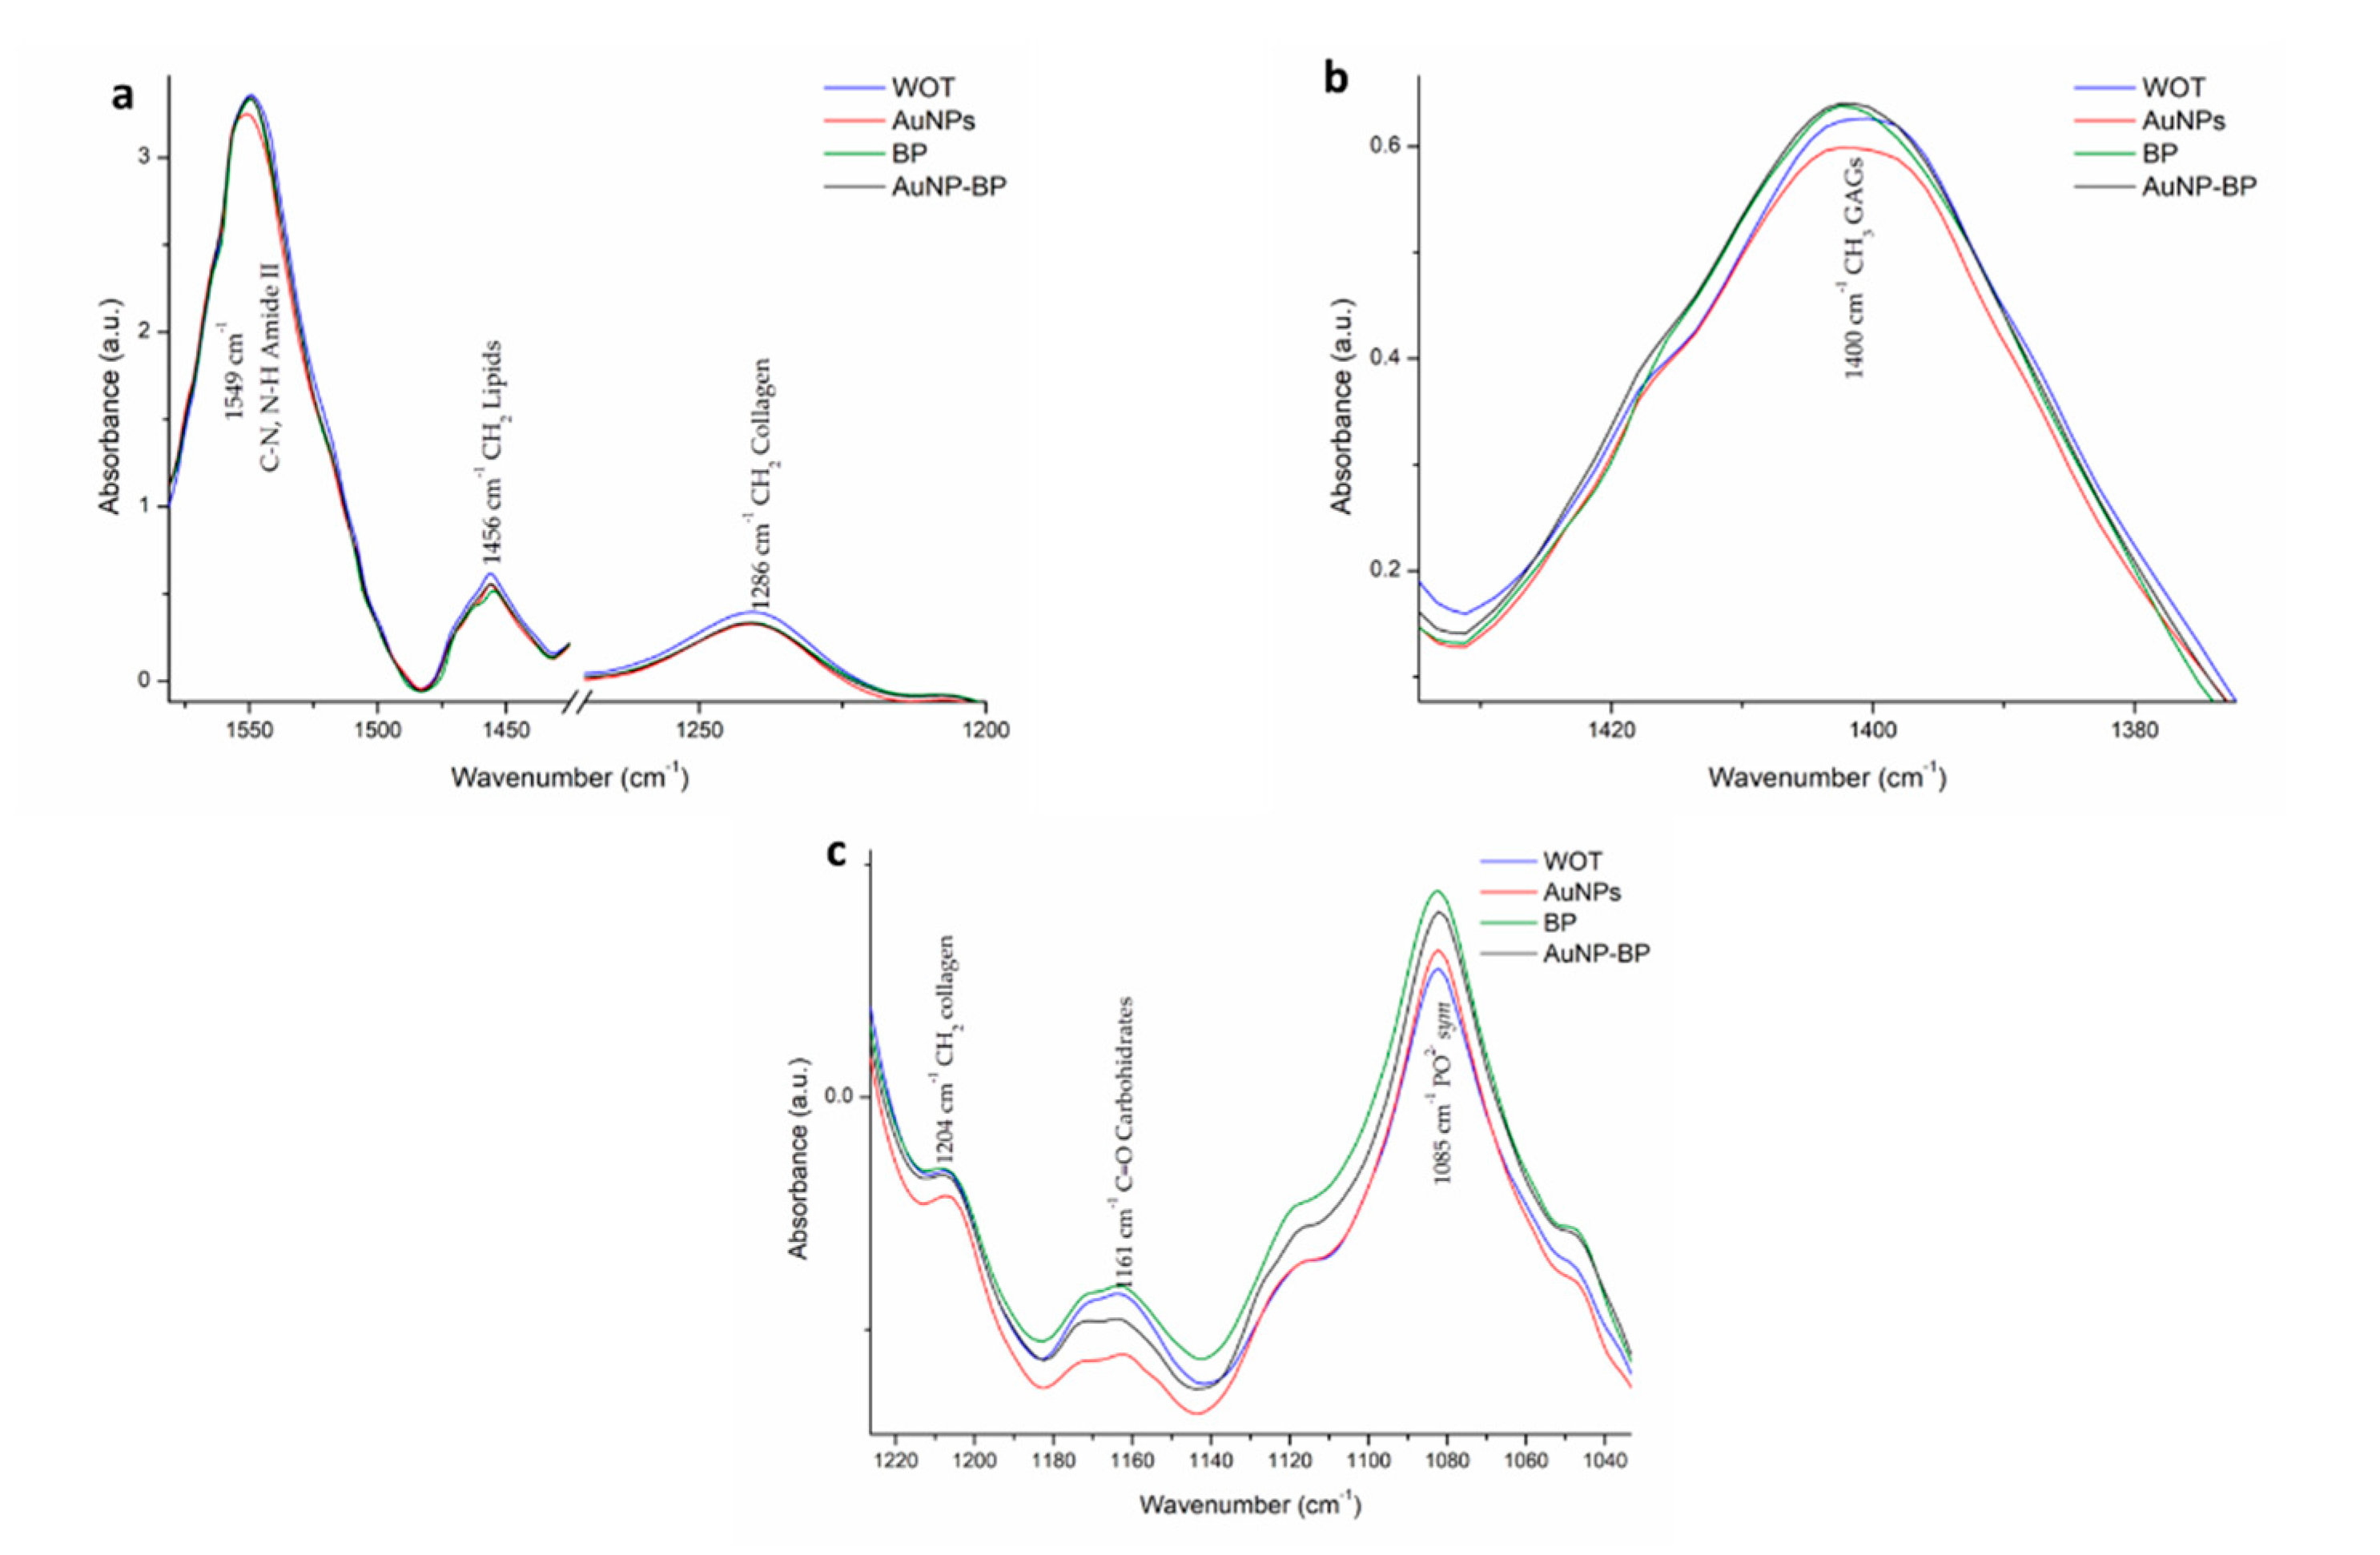
| 3 | 1549 | C-N, N-H Amide II | [18,19] |
| 4 | 1456 | CH2 lipids | [18,19] |
| 5 | 1400 | CH3 GAGs | [19] |
| 6 | 1338 | CH2 Collagen type I | [19] |
| 7 | 1286 | CH2 collagen Amide III, glycine and proline | [19] |
| 8 | 1246 | PO2- asym Phospholipds | [18] |
| 9 | 1204 | CH2 Collagen Amide III | [19] |
| 10 | 1161 | C-O carbohidrates residues | [19] |
| 11 | 1085 | PO2- sym Phospholipds, C-O of carbohydrate on Collagen and PG | [18,19] |
| Band | WOT | AuNPs | BP | AuNP-BP | P |
|---|---|---|---|---|---|
| 1 | 1736 (1736, 1736) |
1736 (1736, 1736) |
1736 (1736, 1736) |
1736 (1736, 1736) |
0.069 |
| 2 | 1651 (1645, 1651) |
1651 (1651, 1651)a |
1651 (1651, 1651)a |
1651 (1651, 1651)a |
0.016 |
| 3 | 1549 (1549, 1549) |
1551 (1551, 1552)a |
1551 (1549, 1551)a |
1551 (1549, 1551)ab |
0.000 |
| 4 | 1456 (1454, 1456) |
1456 (1456, 1456) |
1456 (1454, 1656)b |
1456 (1456, 1456.) |
0.001 |
| 5 | 1402 (1400, 1402) |
1402 (1402, 1402) |
1402 (1402, 1402) |
1402 (1402, 1402) |
0.317 |
| 6 | 1339 (1339, 1340) |
1339 (1339, 1340) |
1339 (1337, 1340) |
1340.46 (1339, 1340) |
0.713 |
| 7 | 1285 (1283, 1286) |
1285 (1285, 1286) |
1286 (1285, 1288) |
1285 (1285, 1286) |
0.081 |
| 8 | 1240 (1240, 1240) |
1240 (1240, 1242) |
1240 (1240, 1242) |
1242 (1240, 1242)ab |
0.028 |
| 9 | 1207 (1207, 1211) |
1207 (1207, 1209) |
1209 (1207, 1211) |
1209 (1207, 1211) |
0.088 |
| 10 | 1163 (1161, 1171) |
1164 (1162, 1168) |
1163 (1163, 1171) |
1167 (1163, 1171) |
0.497 |
| 11 | 1082 (1082, 1082) |
1082 (1082, 1082) |
1082 (1082, 1084)ab |
1082 (1082, 1082) |
0.000 |
| Band | WOT | AuNPs | BP | AuNP-BP | P |
|---|---|---|---|---|---|
| 1 | 0.4 (0.16, 0.64) | 0.19(0.12, 0.29) | 0.28 (0.23, 0.62) | 0.28 (0.23, 0.34) | 0.08 |
| 2 | 4.03 (3.88, 4.17) | 4.08 (4.96, 4.13) | 4.09 (4.06, 4.2) | 4.07 (4.03, 4.1) | 0.128 |
| 3 | 4.36 (4.33, 4.45) | 4.21 (4.19, 4.24)a | 4.35 (4.24, 4.45)b | 4.28 (4.24, 4.33)ab | 0.0001 |
| 4 | 1.58 (1.52, 1.74) | 1.51 (1.47, 1.54) | 1.55 (1.51, 1.61)b | 1.53 (1.49, 1.55)a | 0.012 |
| 5 | 1.64 (1.55, 1.66) | 1.56 (1.53, 1.58)a | 1.63 (1.58, 1.74)b | 1.63 (1.56, 1.67) b | 0.001 |
| 6 | 1.06 (1.01, 1.13) | 1.06 (1.03, 1.08) | 1.09 (1.04, 1.15) | 1.06 (1.05, 1.08) | 0.305 |
| 7 | 1.06 (1, 1.12) | 1.01 (0.98, 1.04)a | 1.07 (0.99, 1.17) b | 1.02 (1.02, 1.04) | 0.04 |
| 8 | 1.36 (1.28, 1.44) | 1.3 (1.23, 1.34) | 1.36 (1.25, 1.48) | 1.28 (1.26, 1.33) | 0.091 |
| 9 | 0.89 (0.84, 0.99) | 0.85 (0.81, 0.89)a | 0.93 (0.84, 1.02) b | 0.89 (0.86, 0.93) b | 0.015 |
| 10 | 0.76 (0.72, 0.87) | 0.66 (0.63, 0.72)a | 0.79 (0.69, 0.92) b | 0.75 (0.69, 0.81) b | 0.003 |
| 11 | 1.14 (0.99, 1.22) | 1.11 (1.07, 1.17) | 1.19 (1.13, 1.35)ab | 1.2 (1.16, 1.23) b | 0.003 |
Disclaimer/Publisher’s Note: The statements, opinions and data contained in all publications are solely those of the individual author(s) and contributor(s) and not of MDPI and/or the editor(s). MDPI and/or the editor(s) disclaim responsibility for any injury to people or property resulting from any ideas, methods, instructions or products referred to in the content. |
© 2023 by the authors. Licensee MDPI, Basel, Switzerland. This article is an open access article distributed under the terms and conditions of the Creative Commons Attribution (CC BY) license (http://creativecommons.org/licenses/by/4.0/).


