Submitted:
20 October 2023
Posted:
23 October 2023
You are already at the latest version
Abstract
Keywords:
1. Introduction
2. Materials and Methods
3. Results
3.1. Fuel thinning effect on microclimate
3.2. Site most suspectible to the threat of wildfire
3.3. Stand-level wildfire risk models
3.3.1. Microclimate
3.3.2. Fuel Moisture
4. Discussion and Conclusions
Author Contributions
Funding
Informed Consent Statement
Data Availability Statement
Acknowledgments
Conflicts of Interest
Appendix A
Appendix B
| Site | Treatment | Overstory Tree Species1 | Avg. DBH | Avg. Height (m) (min-max) | Avg. Density (SPH) | Avg. Age (Min-Max) |
|---|---|---|---|---|---|---|
| Alpine | Unthinned | Bl, Cw, Fd, Hw | 33.4 | 20.1 (12-26) | 440 | 87.4 (54 - 195) |
| Thinned | Bl, Cw, Fd | 44.6 | 21.5 (16-26) | 220 | 71.6 (34-102) | |
| Lost Lake | Unthinned | Bl, Cw, Fd, Hw, Pw, Pl | 29.8 | 18.0 (8-30) | 548 | 97.7 (25-163) |
| Thinned | Bl, Cw, Fd, Hw, Pw, Pl, Py | 26.9 | 18.9 (11-26) | 733 | 78.0 (47-118) | |
| Callaghan | Unthinned | Bl, Cw, Fd, Hw | 22.4 | 18.9 (12-35) | 900 | 33.7 (22-41) |
| Thinned | Bl, Cw, Fd, Hw | 35.5 | 19.9 (12-26) | 567 | 36.3 (28-41) | |
| Cheakamus | Unthinned | Bl, Cw, Fd, Hw | 29.0 | 20.1(11-27) | 717 | 40.7 (36-47) |
| Thinned | Bl, Cw, Fd, Hw, Pw | 33.6 | 21.7 (13-28) | 317 | 40.5 (30-48) |
References
- Coogan, S.C.P.; Daniels, L.D.; Boychuk, D.; Burton, P.J.; Flannigan, M.D.; Gauthier, S.; Kafka, V.; Park, J.S.; Wotton, B.M. Fifty years of wildland fire science in Canada. Can. J. For. Res. 2020, 51, 283–302. [CrossRef]
- Beverly, J.L.; Leverkus, S.E.R.; Cameron, H.; Schroeder, D. Stand-level fuel reduction treatments and fire behaviour in Canadian boreal conifer forests. Fire 2020, 3, 35. [CrossRef]
- Beresford, H. (Environmental Manager, Resort Municipality of Whistler). Personal communication, 4 January 2022.
- Van Wagner, C.E. Conditions for the start and spread of crown fire. Can. J. For. Res. 1977, 7, 23–34. [CrossRef]
- Agee, J.K.; Skinner, C.N. Basic principles of forest fuel reduction treatments. For. Ecol. Manage. 2005, 211, 83–96. [CrossRef]
- Flannigan, M.D.; Wotton, B.M.; Marshall, G.A.; de Groot, W.J.; Johnston, J.; Jurko, N.; Cantin, A.S. Fuel moisture sensitivity to temperature and precipitation: Climate change implications. Clim. Change 2016, 134, 59–71. [CrossRef]
- Reilly, M.J.; Zuspan, A.; Halofsky, J.S.; Raymond, C.; McEvoy, A.; Dye, A.W.; Donato, D.C.; Kim, J.B.; Potter, B.E.; Walker, N.; et al. Cascadia Burning: The historic, but not historically unprecedented, 2020 wildfires in the Pacific Northwest, USA. Ecosphere 2022, 13, e4070. [CrossRef]
- Alexander, M.E.; Cruz, M.G. Evaluating the 3-m tree crown spacing guideline for the prevention of crowning wildfires in lodgepole pine forests. Alberta. For. Chron. 2020, 96, 165–173. [CrossRef]
- Byram, G.M.; Jemison, G.M. Solar radiation and forest fuel moisture. J. Agric. Res. 1943, 67, 149–176.
- Gibos, K.E. Effect of Slope and Aspect on Litter Layer Moisture Content of Lodgepole Pine Stands in the East Slopes of the Rocky Mountains of Alberta. Master’s Thesis, University of Toronto, Toronto, ON, Canada, 2010; pp. 1–155.
- Marshall, G.; Thompson, D.K.; Anderson, K.; Simpson, B.; Linn, R.; Schroeder, D. The impact of fuel treatments on wildfire behaviour in North America boreal fuels: A simulation study using FIRETEC. Fire 2020, 3, 18.
- Flannigan, M.D.; Logan, K.A.; Amiro, B.D.; Skinner, W.R.; Stocks, B.J. Future area burned in Canada. Clim. Change 2005, 72, 1–16. [CrossRef]
- Whitehead, R.J.; Russo, G.; Hawkes, B.C.; Taylor, S.W.; Brown, B.N.; Armitage, O.B.; Barclay, H.J.; Benton, R.A. Effect of Commercial Thinning on Within-stand Microclimate and Fine Fuel Moisture Conditions in a Mature Lodgepole Pine Stand in Southeastern British Columbia. In Information Report; FI-X-004; Natural Resources Canada, Canadian Forest Service, Canadian Wood Fibre Centre: Victoria, BC, Canada, 2008; pp. 1–16.
- Simpson, M. Case Study 2015 Elaho fire. 2015, Unpublished; pp. 1–10.
- Cohen, J.D.; Westhaver, A. An examination of the Lytton, British Columbia wildland-urban fire destruction. Summary report to the British Columbia FireSmart TM Committee. Institute for Catastrophic Loss research paper #73, 2022, pp. 1–43.
- Van Wagner, C.E. Development and Structure of the Canadian Forest Fire Weather Index System. In Forestry Technical Report 35; Government of Canada, Canadian Forestry Service: Ottawa, ON, Canada, 1987; pp. 1–37.
- Stocks, B.J.; Lawson, B.D.; Alexander, M.E.; Van Wagner, C.E.; McAlpine, R.S.; Lynham, T.J.; Dubé, D.E. The Canadian Forest Fire Danger Rating System: An overview. For. Chron. 1989, 65, 450–457. [CrossRef]
- Kane, J.M. Stand conditions alter seasonal microclimate and dead fuel moisture in a Northwestern California oak woodland. Agric. For. Meteorol. 2021, 308-309, 108602. [CrossRef]
- Bates, D.; Mächler, M.; Bolker, B.; Walker, S. Fitting linear mixed-effects models using lme4. J. Stat. Softw. 2015, 67, 1–48.
- Forestry Canada Fire Danger Group. Development and Structure of the Canadian Forest Fire Behavior Prediction System. In.
- Information Report; ST-X-3; Forestry Canada, Science and Sustainable Development Directorate: Ottawa, ON, Canada, 1992; pp. 1–63.
- Pickering, B.J.; Duff, T.J.; Baillie, C.; Cawson, J.G. Darker, cooler, wetter: Forest understories influence surface fuel moisture. Agric. For. Meteorol. 2021, 300, 108311. [CrossRef]
- Faiella, S.M.; Bailey, J.D. Fluctuations in fuel moisture across restoration treatments in semi-arid ponderosa pine forests of northern Arizona, USA. International Journal of Wildland Fire 2007, 16:119-127. [CrossRef]
- Stickel, P.W. The measurement and interpretation of forest fire-weather in the western Adirondacks. In Technical Publication No. 34; Syracuse University, New York State College of Forestry: Syracuse, NY, USA, 1931; pp. 1–115.
- Bigelow. S.W.; North, M.P. Microclimate effects of fuels-reduction and group-selection silviculture: Implications for fire behaviour in Sierran mixed-conifer forests. For. Ecol. Manage. 2011 264, 51-59.
- Weatherspoon, C.P. Fire-silviculture relationships in Sierra forests. In: Sierra Nevada Ecosystem Project, Final Report to Congress, II: Assessments, scientific basis for management options, ed., vol. II: Assessments and scientific basis for management options. Centers for Water and Wildland Resources, University of California, Davis, Water Resources Center Report No. 37, pp. 1167– 1176. Available at https://pubs.usgs.gov/dds/dds-43/VOL_II/VII_C44.PDF [Verified 12 May 2023], 1996, 1167-1176.
- Wotton, B.M. A grass moisture model for the Canadian Forest Fire Danger Rating System. In Proceedings of the 8th Fire and Forest Meteorology Symposium, Kalispell, MT, USA, 13-15 October 2009; American Meteorological Society, MA, USA, 2009; Paper 3A.2.
- Hallett, D.J.; Lepofsky, D.S.; Mathewes, R.W.; Lertzman, K.P. 11 000 years of fire history and climate in the mountain hemlock rain forests of southwestern British Columbia based on sedimentary charcoal. Can. J. For. Res. 2003, 33, 292–312. [CrossRef]
- Hoffman, K.M.; Gavin, D.G.; Lertzman, K.P.; Smith, D.J.; Starzomski, B.M. 13,000 years of fire history derived from soil charcoal in a British Columbia coastal temperate rain forest. Ecosphere 2016, 7, e01415. [CrossRef]
- Brown, K.J.; Hebda, N.J.; Conder, N.; Golinski, K.G.; Hawkes, B.; Schoups, G. Changing climate, vegetation, and fire disturbance in a sub-boreal pine-dominated forest, British Columbia, Canada. Can. J. For. Res. 2017, 47, 615–627. [CrossRef]
- Brown, K.J.; Hebda, N.J.R.; Schoups, G.; Conder, N.; Smith, K.A.P.; Trofymow, J.A. Long-term climate, vegetation and fire regime change in a managed municipal water supply area, British Columbia, Canada. Holocene 2019, 29, 1411–1424. [CrossRef]
- Graham, R.T.; Harvey, A.E.; Jain, T.B.; Tonn, J.R. The effects of thinning and similar stand treatments on fire behavior in Western forests. In General Technical Report; PNW-GTR-463;: USDA Forest Service, Pacific Northwest Research Station: Portland, OR, USA, 1999; pp. 1–27.
- Lezberg, A.L.; Battaglia, M.A.; Shepperd, W.D.; Schoettle, A.W. Decades-old silvicultural treatments influence surface wildfire severity and post-fire nitrogen availability in a ponderosa pine forest. For. Ecol. Manage 2008, 255, 49–61. [CrossRef]
- Cumming, S.G. Forest type and wildfire in the Alberta boreal mixedwood: What do fires burn? Ecol. Appl. 2001, 11, 97–110.
- Parisien, M.-A.; Barber, Q.E.; Hirsch, K.G.; Stockdale, C.A.; Erni, S.; Wang, X.; Arsenault, D.; Parks, S.A. Fire deficit increases wildfire risk for many communities in the Canadian boreal forest. Nat. Commun. 2020, 11, 2121.
- PIP. FireSmart: Protecting your community from wildfire. 2nd ed. Partners in Protection, Edmonton, AB, Canada, 2003; pp. 1–165.
- Alexander, M.E. Surface fire spread potential in trembling aspen during the summer in the boreal forest region of Canada. For. Chron. 2010, 86, 200–212. [CrossRef]
- Ricotta, C.; Bajocco, S.; IGuglietta, D.; Conedera, M. Assessing the influence of roads on fire ignition: Does land cover matter? Fire 2018, 1, 24.
- https://www2.gov.bc.ca/gov/content/safety/wildfire-status/prevention/vegetation-and-fuel-management.
- Stevens, V. 1997. The ecological role of coarse woody debris: An overview of the ecological importance of CWD in B.C. forests. Res. Br., B.C. Min. For., Victoria, B.C. Work. Pap. 30/1997.
- Scheungrab, D.B.; Trettin, C.C.; Lea, R.; Jurgensen, M.F. 2000. Woody debris. In: Gen. Tech. Rep. SRS-38. Asheville, NC: U.S. Department of Agriculture, Forest Service, Southern Research Station. p. 47-48.
- van Galen, L.G.; Jordan, G.J.; Baker, S.C. Relationships between coarse woody debris habitat quality and forest maturity attributes. Conserv. Sci. Pract. 2019, 1, e55. [CrossRef]
- Hart, S.C.; Porter, T.M.; Basiliko, N.; Venier, L.; Hajibabaei, M.; Morris, D. 2022. Fungal community dynamics and carbon mineralization in coarse woody debris across decay stage, tree species, and stand development stage in northern boreal forests. [CrossRef]
- Whistler.ca Available online: URL (accessed on 10 November 2022). https://www.whistler.ca/media/news/media-advisory-infrastructure-announcement-whistler?utm_medium=email&utm_campaign=Whistler%20Today%20November%2010%202022&utm_content=Whistler%20Today%20November%2010%202022+CID_36a9958ef0633a2e4eba703717db32dc&utm_source=Email%20marketing%20software&utm_term=Read%20More.
- Taylor, C.; Blanchard, W.; Lindenmayer, D.B. Does forest thinning reduce fire severity in Australian eucalypt forests? Conserv. Lett. 2020, 14, e12766.
- Merrill, D.L.; Alexander, M.E., Eds. 1987. Glossary of Forest Fire Management Terms, 4th ed. In Publication; NRCC No. 26516; National Research Council of Canada, Canadian Committee on Forest Fire Management: Ottawa, ON, Canada, 1987; pp. 1–91.
- Hirsch, K.G.; Pengelly, I. Forest fuels management in theory and practice. In C.R. Bamsey, editor. Stand Density Management: Planning and Implementation. Proceedings of a Conference, November 6-7, 1997, Edmonton, Alberta. Clear Lake Ltd., Edmonton, Alberta. 1998. 112-116.
- Smith, D.M. The Practice of Silviculture, 7th ed.; John Wiley & Sons, New York, NY, USA, 1962; pp. 1–578.
- Alexander, M.E. Are shaded fuelbreaks the answer to Canada’s community wildfire protection problem? For. Chron. 2019, 95, 2–3. [CrossRef]
| Season | Treatment | Site | |||
|---|---|---|---|---|---|
| Alpine | Lost Lake | Cheakamus | Callaghan | ||
| Spring | Thinned | 4 | 13 | 19 | 8 |
| Unthinned | 6 | 13 | 22 | 14 | |
| Late summer | Thinned | 4 | 15 | 25 | 8 |
| Unthinned | 6 | 12 | 28 | 13 | |
| Direction of Effect with Higher Risk | Variable | Instrument |
|---|---|---|
| Increase | Solar radiation (W-m-2) | Extech Solar power meter; hand-held (110 cm above ground) |
| Ambient air temperature (°C) | Kestrel 5500 with vane, tripod-mounted (134 cm above ground) | |
| Wind speed (m s-1) | Kestrel 5500; wind speed averaged over a x-min interval | |
| Decrease | Relative humidity (%) | Kestrel 5500 |
| Snow depth (cm) | Snow ruler (mm) | |
| Snow cover (cm2) | Snow ruler (mm) | |
| Soil moisture (%) | Extech MO750 Soil Moisture Meter (20-cm probe) | |
| Fuel moisture (%) | OHaus Scot II model balance (0.01 g), Excalibur 4-tray Dehydrator | |
| Canopy cover (%) | Olympus Tough TG4 |
| Treatment | Site | |||
|---|---|---|---|---|
| Alpine | Lost Lake | Cheakamus | Callaghan | |
| Thinned | 2 | 4 | 5 | 4 |
| Unthinned | 2 | 3 | 7 | 3 |
| Treatment | Site | |||
|---|---|---|---|---|
| Alpine | Lost Lake | Cheakamus | Callaghan | |
| Thinned | 4 | 4 | 18 | 17 |
| Unthinned | 6 | 0 | 25 | 22 |
| Direction Change | Variable | UnT Avg. | T Avg. |
% Change | UnT SD | T SD |
UnT n |
T n |
|---|---|---|---|---|---|---|---|---|
| Increase | Solar radiation (W-m-2) | 26.4 | 213.5 | 78.0 | 141.3 | 15.4 | 55 | 44 |
| Avg. temperature (°C) | 9.1 | 10.8 | 8.6 | 1.1 | 0.5 | 55 | 44 | |
| Avg. wind speed (m-s-1) | 0.2 | 1.0 | 68.1 | 0.6 | 0.2 | 55 | 44 | |
| Decrease | Relative humidity (%) | 73.6 | 61.4 | -9.0 | 5.5 | 7.9 | 55 | 44 |
| Soil moisture (%) | 4.6 | 2.4 | -32.1 | 1.0 | 1.7 | 55 | 44 | |
| Avg. snow depth (cm) | 7.8 | 0.0 | -100.0 | 0.0 | 8.3 | 55 | 44 | |
| Snow cover (cm2) | 4.9 | 0.0 | -100.0 | 0.0 | 3.8 | 55 | 44 |
| Direction Change | Variable | UnT Avg. | T Avg. |
% Change | UnT SD | T SD |
UnT n |
T n |
|---|---|---|---|---|---|---|---|---|
| Increase | Solar radiation (W-m-2) | 23.3 | 485.4 | 90.8 | 3.5 | 330.0 | 67 | 46 |
| Avg. temperature (°C) | 25.2 | 26.7 | 3.0 | 3.4 | 1.8 | 67 | 46 | |
| Avg. wind speed (m-s-1) | 0.2 | 0.7 | 63.4 | 0.1 | 0.5 | 67 | 46 | |
| Decrease | Relative humidity (%) | 44.9 | 40.0 | -5.8 | 14.2 | 13.7 | 67 | 46 |
| Soil moisture (%) | 1.6 | 1.3 | -10.8 | 1.3 | 1.3 | 67 | 46 | |
| Fuel moisture (%) | 33.3 | 23.7 | -16.8 | 10.4 | 13.4 | 67 | 46 |
| Treatment | Site | Total % Canopy | ||
|---|---|---|---|---|
| Alpine | Cheakamus | Callaghan | ||
| Thinned | 66.6 | 60.4 | 63.6 | 63.5 |
| Unthinned | 96.5 | 88.8 | 94.1 | 93.2 |
| Difference | -18 | -19 | -19 | -19 |
| Treatment | Fuel Component | Site | ||
|---|---|---|---|---|
| Alpine | Cheakamus | Callaghan | ||
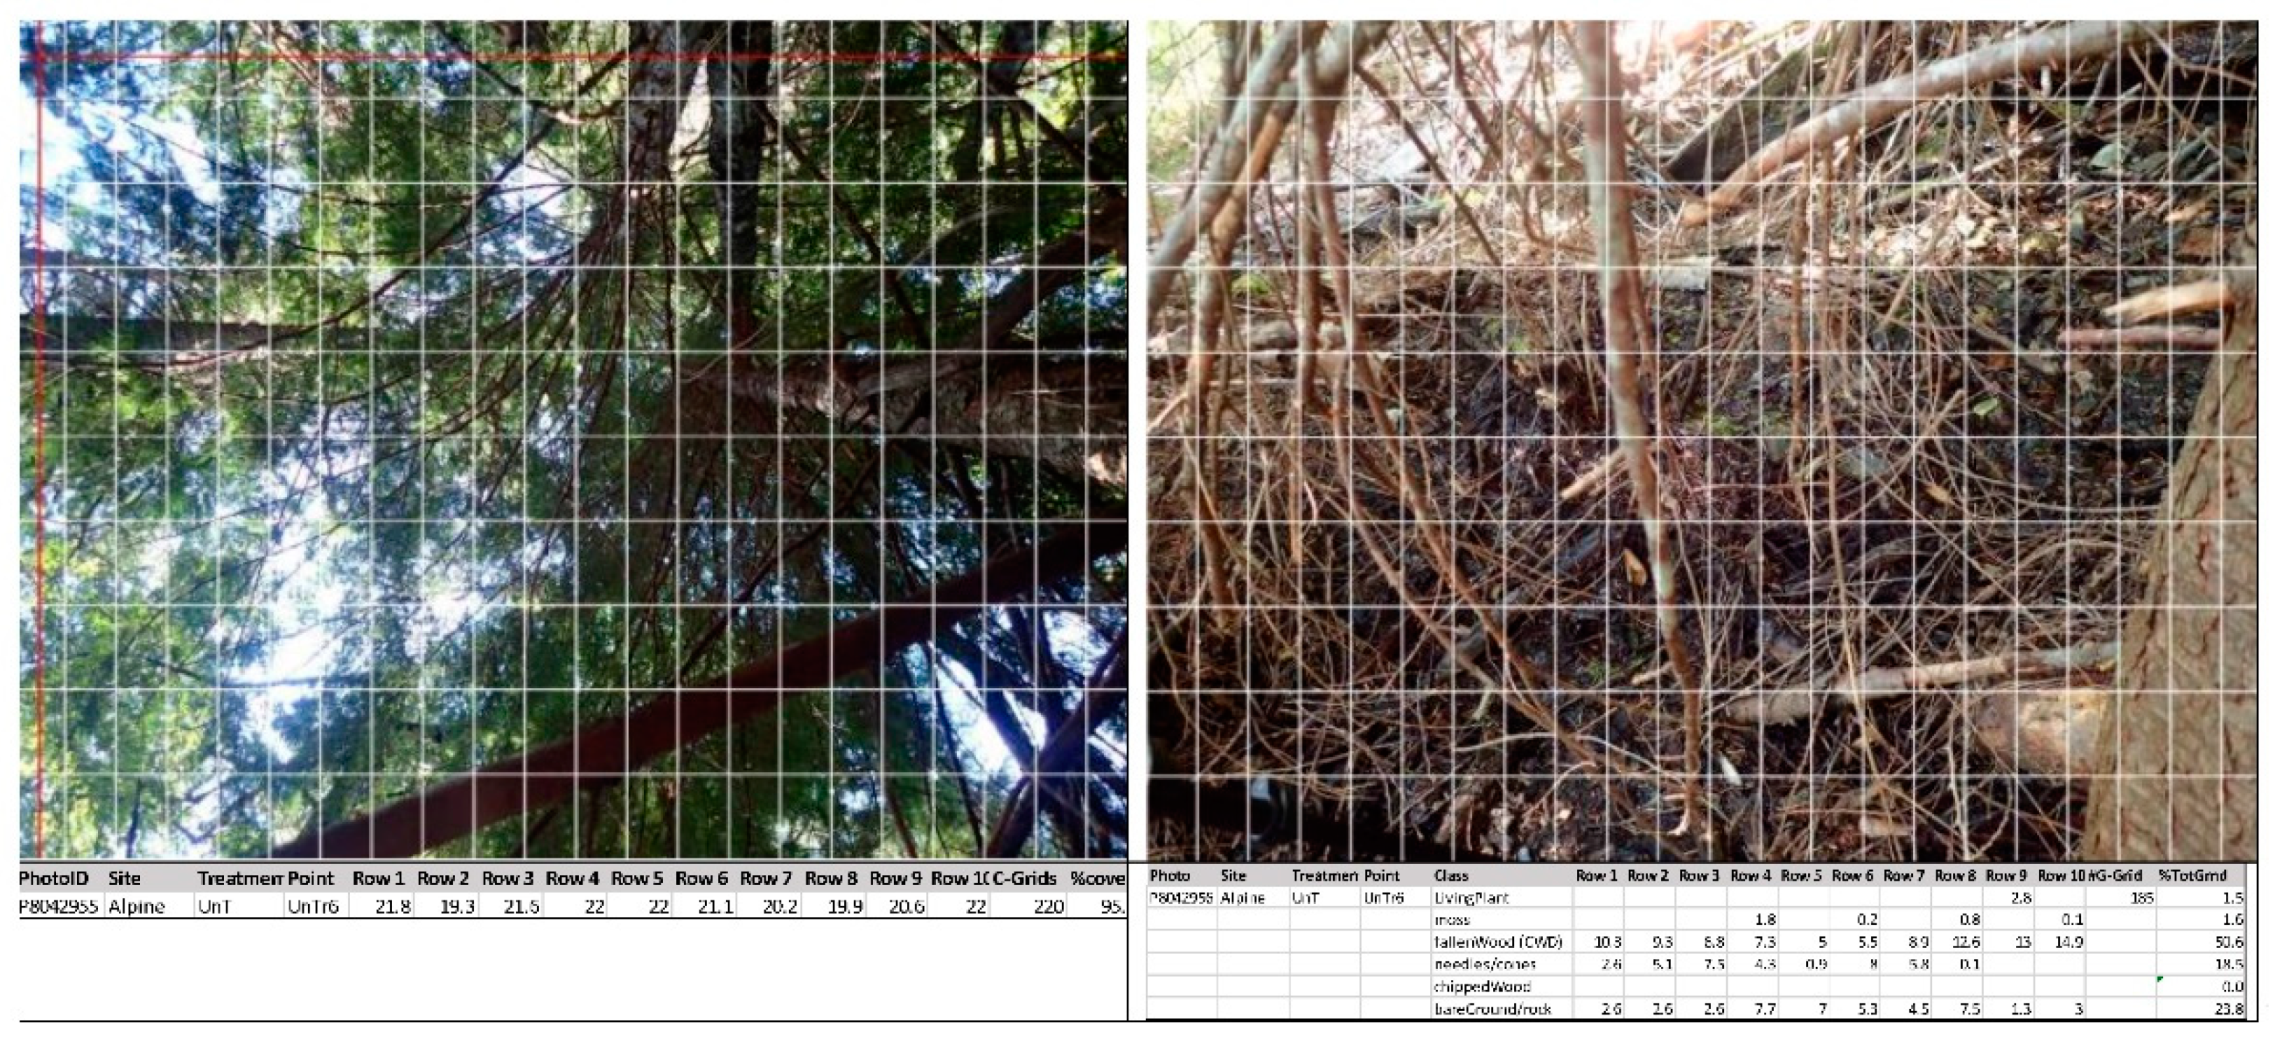
| Thinned | Living plants | 14.43 | 38.96 | 18.96 |
| Moss | 0.78 | 5.32 | 1.64 | |
| Coarse wood debris | 25.17 | 27.86 | 26.64 | |
| Needles/cones | 24.71 | 5.90 | 4.21 | |
| Chipped wood | 0.00 | 0.05 | 4.03 | |
| Bare ground/rock | 34.35 | 18.91 | 44.98 | |
| Un-thinned | Living plants | 1.51 | 37.88 | 17.36 |
| Moss | 1.57 | 16.72 | 8.72 | |
| Coarse woody debris | 50.59 | 29.50 | 22.18 | |
| Needles/cones | 18.54 | 4.20 | 10.04 | |
| Chipped wood | 0.00 | 0.02 | 0.01 | |
| Bare ground/rock | 23.84 | 7.67 | 43.68 | |
| Site | Reduction in % Canopy Cover (T - UnT) |
Year | Contractor |
|---|---|---|---|
| Alpine | -29.9 | 2021 | 3 |
| Callaghan | -30.5 | 2017-1019 | 1 |
| Cheakamus | -28.4 | 2019-2021 | 2 |
| “Lightly-Thinned” | -12.0 | ||
| “Moderately-Thinned” | -20.0 |
Disclaimer/Publisher’s Note: The statements, opinions and data contained in all publications are solely those of the individual author(s) and contributor(s) and not of MDPI and/or the editor(s). MDPI and/or the editor(s) disclaim responsibility for any injury to people or property resulting from any ideas, methods, instructions or products referred to in the content. |
© 2023 by the authors. Licensee MDPI, Basel, Switzerland. This article is an open access article distributed under the terms and conditions of the Creative Commons Attribution (CC BY) license (http://creativecommons.org/licenses/by/4.0/).


