Submitted:
20 October 2023
Posted:
24 October 2023
You are already at the latest version
Abstract
Keywords:
1. Introduction
2. Methods
2.1. Efficiency Model for HVFPCs
3. Results and Discussion
3.1. Application of Proposed HVFPCs Efficiency Model to MT-Power TVP-Solar Collector
3.3. HVFPCs Annual Energy Producibility Calculation
4. Conclusions
Acknowledgment
Nomenclature
| Aabs | Absorber Surface (m2) | DHW | Domestic Hot Water |
| Ac | Collector Aperture Surface (m2) | HTF | Heat Transfer Fluid |
| c1 | First Order Heat Loss Coefficient | HVFPC | High Vacuum Flat Plate Collector |
| c2 | Second Order Heat Loss Coefficient | IAM | Incident Angle Modifier |
| cp | Specific Heat at constant pressure (kJ/kg K) | SSA | Selective Solar Absorber |
| G | Solar Irradiation (W/m2) | sub | Substrate |
| Mass flow rate (kg/s) | th | thermal | |
| Pabs | Absorbed Power (W) | IR | InfraRed |
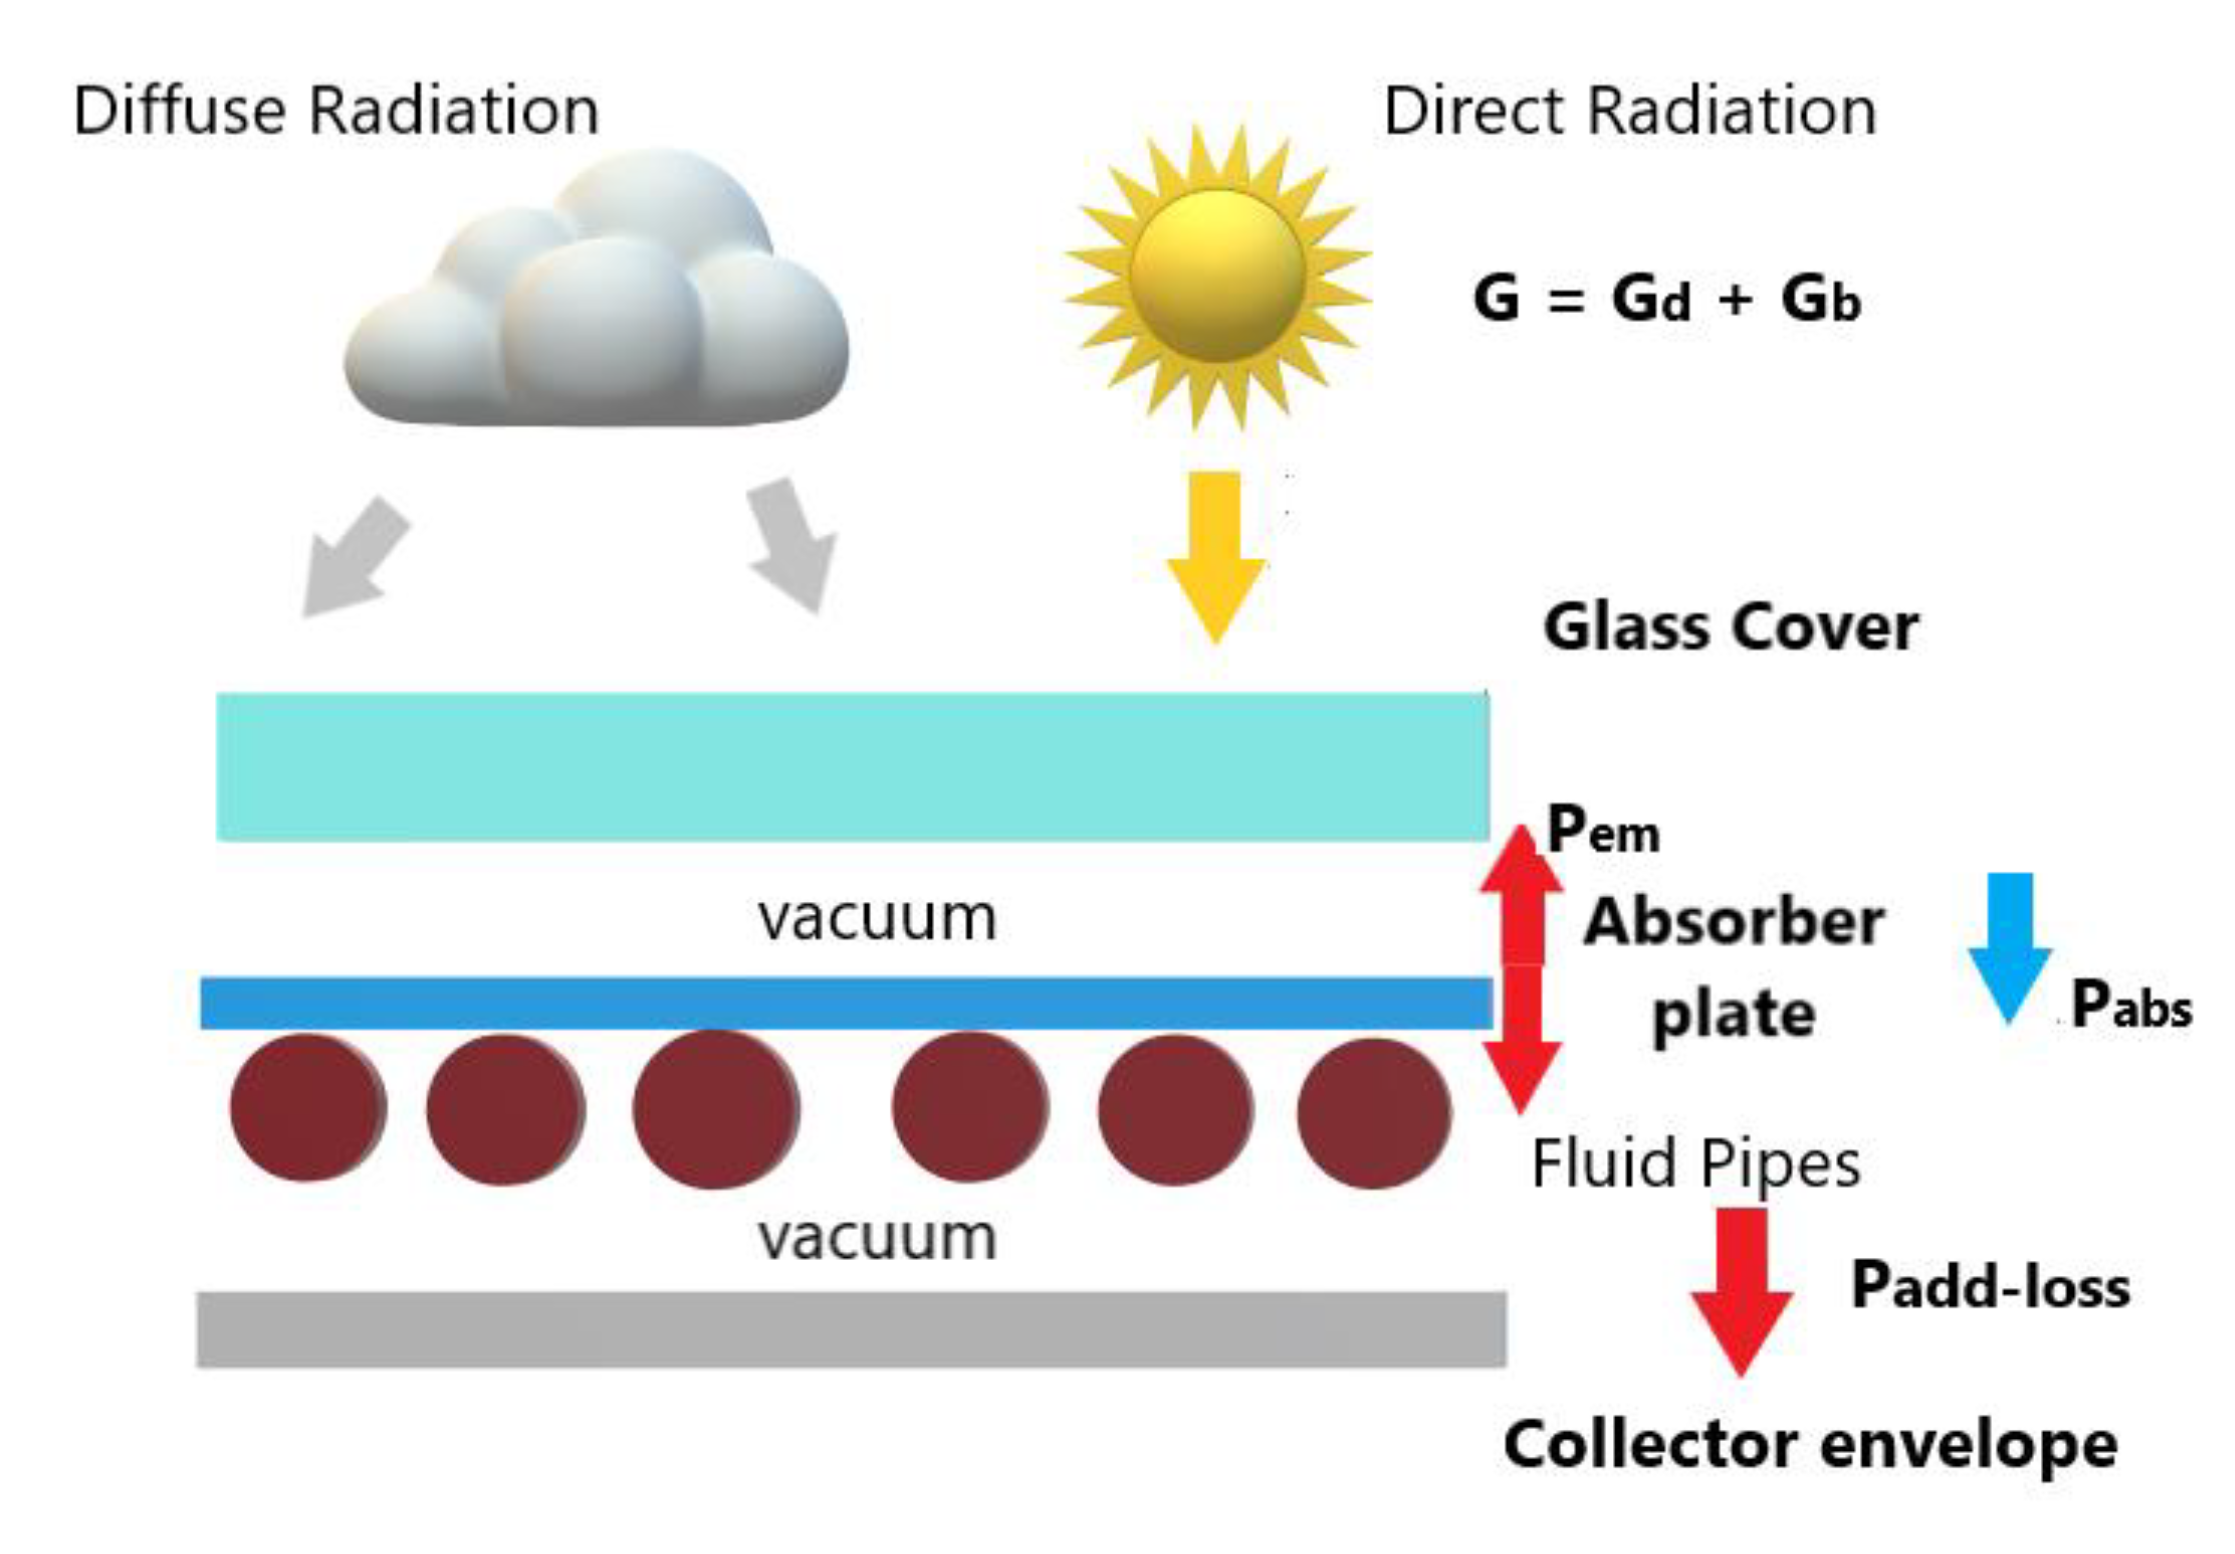
| Padd-loss | Lost Power due to conductive losses (W) | Symbols | |
| Pem | Emitted Power (W) | α | Spectrally averaged absorptivity |
| Pu | Useful Power (W) | ε | Spectrally averaged emissivity |
| Tm | Average Temperature (°C) | η | Efficiency |
| Tamb | Ambient Temperature (°C) | Zero-Loss efficiency | |
| Tg | Glass Temperature (°C) | σ | Stefan-Boltzmann constant (W/m2K4) |
| Tv | Vessel Temperature (°C) | λ | Wavelength |
| Abbreviations | k | Conductive Heat losses coefficient (W /m2K) | |
| abs | Absorber | ||
| comm | Commercial |
References
- «United States Environmental Protection Agency».
- «Our world in Data website https://ourworldindata.org/co2-emissions».
- G. P. Thiel e A. K. Stark, «To decarbonize industry, we must decarbonize heat», Joule, vol. 5, fasc. 3, pp. 531–550, mar. 2021. [CrossRef]
- L. Kumar, M. L. Kumar, M. Hasanuzzaman, e N. A. Rahim, «Global advancement of solar thermal energy technologies for industrial process heat and its future prospects: A review», Energy Conversion and Management, vol. 195, pp. 885–908, set. 2019. [CrossRef]
- «IEA (2020), World Energy Statistics and Balances 2020 (database)».
- S. K. Verma, N. K. S. K. Verma, N. K. Gupta, e D. Rakshit, «A comprehensive analysis on advances in application of solar collectors considering design, process and working fluid parameters for solar to thermal conversion», Solar Energy, vol. 208, pp. 1114–1150, set. 2020. [CrossRef]
- S. C. Bhatia, A c. di, Advanced Renewable Energy Systems, (Part 1 and 2), 0 ed. WPI Publishing, 2014. [CrossRef]
- R. Eismann, «Accurate analytical modeling of flat plate solar collectors: Extended correlation for convective heat loss across the air gap between absorber and cover plate», Solar Energy, vol. 122, pp. 1214–1224, dic. 2015. [CrossRef]
- H. Herwig, «What Exactly is the Nusselt Number in Convective Heat Transfer Problems and are There Alternatives?», Entropy, vol. 18, fasc. 5, p. 198, mag. 2016. [CrossRef]
- D. Gao, J. D. Gao, J. Li, X. Ren, T. Hu, e G. Pei, «A novel direct steam generation system based on the high-vacuum insulated flat plate solar collector», Renewable Energy, vol. 197, pp. 966–977, set. 2022. [CrossRef]
- C. Benvenuti, «The SRB solar thermal panel», Europhysics News, vol. 44, fasc. 3, pp. 16–18, mag. 2013. [CrossRef]
- «TVP Solar, MT-30 datasheet <http://www.tvpsolar.com/files/pagine/1464011780_MTPower%20Datasheet%20(v4.2x)(ver5).pdf>».
- et al. , «Roadmap for the next-generation of hybrid photovoltaic-thermal solar energy collectors», Solar Energy, vol. 174, pp. 386–398, nov. 2018. [CrossRef]
- R. W. Moss, P. R. W. Moss, P. Henshall, F. Arya, G. S. F. Shire, T. Hyde, e P. C. Eames, «Performance and operational effectiveness of evacuated flat plate solar collectors compared with conventional thermal, PVT and PV panels», Applied Energy, vol. 216, pp. 588–601, apr. 2018. [CrossRef]
- C. B. Eaton e H. A. Blum, «The use of moderate vacuum environments as a means of increasing the collection efficiencies and operating temperatures of flat-plate solar collectors», Solar Energy, vol. 17, fasc. 3, pp. 151–158, lug. 1975. [CrossRef]
- H. Zheng, J. H. Zheng, J. Xiong, Y. Su, e H. Zhang, «Influence of the receiver’s back surface radiative characteristics on the performance of a heat-pipe evacuated-tube solar collector», Applied Energy, vol. 116, pp. 159–166, mar. 2014. [CrossRef]
- D. De Maio et al., «A Selective Solar Absorber for Unconcentrated Solar Thermal Panels», Energies, vol. 14, fasc. 4, p. 900, feb. 2021. [CrossRef]
- D. Gao et al., «Experimental and numerical analysis of an efficiently optimized evacuated flat plate solar collector under medium temperature», Applied Energy, vol. 269, p. 115129, lug. 2020. [CrossRef]
- M. A. Rosen, «Energy efficiency and sustainable development», IEEE Technol. Soc. Mag., vol. 15, fasc. 4, pp. 21–26, 1996. [CrossRef]
- D. E. Prapas, B. D. E. Prapas, B. Norton, e S. D. Probert, «Optics of parabolic-trough, solar-energy collectors, possessing small concentration ratios», Solar Energy, vol. 39, fasc. 6, pp. 541–550, 1987. [CrossRef]
- S. A. Kalogirou, «Solar thermal collectors and applications», Progress in Energy and Combustion Science, vol. 30, fasc. 3, pp. 231–295, 2004. [CrossRef]
- W. J. Platzer, D. W. J. Platzer, D. Mills, e W. Gardner, «Linear Fresnel Collector (LFC) solar thermal technology», in Concentrating Solar Power Technology, Elsevier, 2021, pp. 165–217. [CrossRef]
- S. Fischer e H. Drück, «Standards and Certification Schemes for Solar Thermal Collectors, Stores and Systems — An Overview about the Latest Developments», Energy Procedia, vol. 57, pp. 2867–2871, 2014. [CrossRef]
- F. Cao, K. F. Cao, K. McEnaney, G. Chen, e Z. Ren, «A review of cermet-based spectrally selective solar absorbers», Energy Environ. Sci., vol. 7, fasc. 5, p. 1615, 2014. [CrossRef]
- D. De Maio et al., «Multilayers for efficient thermal energy conversion in high vacuum flat solar thermal panels», Thin Solid Films, vol. 735, p. 138869, ott. 2021. [CrossRef]
- C. D’Alessandro et al., «Performance analysis of evacuated solar thermal panels with an infrared mirror», Applied Energy, vol. 288, p. 116603, apr. 2021. [CrossRef]
- D. De Luca, D. D. De Luca, D. Kortge, E. Di Gennaro, R. Russo, e P. Bermel, «Ultra-thin sputter-deposited infrared rugate mirror for enhancing solar-to-thermal energy conversion», Opt. Lett., vol. 47, fasc. 2, p. 230, gen. 2022. [CrossRef]
- D. De Maio, C. D. De Maio, C. D’Alessandro, A. Caldarelli, M. Musto, e R. Russo, «Solar selective coatings for evacuated flat plate collectors: Optimisation and efficiency robustness analysis», Solar Energy Materials and Solar Cells, vol. 242, p. 111749, ago. 2022. [CrossRef]
- J. R. Howell, M. P. J. R. Howell, M. P. Mengüç, K. Daun, e R. Siegel, Thermal Radiation Heat Transfer, 7a ed. Seventh edition. | Boca Raton : CRC Press, 2021. | Revised edition of: Thermal radiation heat transfer / John R. Howell, M. Pinar Mengüç, Robert Siegel. Sixth edition. 2015.: CRC Press, 2020. [CrossRef]
- C. D’ Alessandro et al., «Low Cost High Intensity LED Illumination Device for High Uniformity Laboratory Purposes», ENGINEERING, preprint, giu. 2020. [CrossRef]
- C. D’Alessandro et al., «Calorimetric testing of solar thermal absorbers for high vacuum flat panels», Solar Energy, vol. 243, pp. 81–90, set. 2022. [CrossRef]
Disclaimer/Publisher’s Note: The statements, opinions and data contained in all publications are solely those of the individual author(s) and contributor(s) and not of MDPI and/or the editor(s). MDPI and/or the editor(s) disclaim responsibility for any injury to people or property resulting from any ideas, methods, instructions or products referred to in the content. |
© 2023 by the authors. Licensee MDPI, Basel, Switzerland. This article is an open access article distributed under the terms and conditions of the Creative Commons Attribution (CC BY) license (http://creativecommons.org/licenses/by/4.0/).


