1. Introduction
The exponential progress of technology and science has resulted in a commensurate surge in population growth in recent years, the rise of the real estate sector and the encouragement of urban development, the global demand for construction materials has doubled, and river sand, sea sand and other natural sand resources have been in short supply. The imbalance of river bed sediments is caused by the detrimental exploitation of river sand, has adverse effects on flood control and navigation channels, and even causes natural disasters in the basin area. Excessive exploitation of sea sand causes irreversible damage to the living environment of marine organisms. In the context of the short supply of sand and stone resources, coupled with the uneven distribution of natural sand, it being not easy to transport and other restrictions, the cost of natural sand has experienced an increase significantly. At the same time, excessive demand for sand and stone also gives rise to illegal activities, such as illegal mining, trade, etc., disrupt the social economy from developing as normal. To sum up, the excessive mining of sand and gravel is detrimental to the natural environment and social environment, and new sand and gravel resources are urgently needed to make up for the gap in the natural sand supply chain and solve the problem of limited resources.
In response to this problem, the implementation of “construction sand” on February 1, 2002 for the first time stipulated the definition of artificial sand, technical requirements, inspection methods and so on. Since then, manufactured sand as an important source of construction sand began to enter the building materials market [
1], while the study of manufactured sand concrete has also gradually increased.
The water-cement ratio plays a pivotal role in the mix ratio design of manufactured sand concrete [
2], which has a significant influence [
3,
4] on its working performance and mechanical properties. The durability of concrete made with manufactured sand is positively correlated with the water-cement ratio, as evidenced by various studies [
5,
6] indicating that a lower ratio enhances frost resistance and chloride ion erosion resistance. According to the relative humidity method, Song et [
7] al. explained from the microscopic level that the water-cement ratio affects the capillary suction in concrete, thus affecting the porosity of concrete, and that it is also an important parameter for the mix ratio design of pervious concrete [8-10].
Based on the investigation of the water-cement ratio, the proportioning of manufactured sand concrete mix design has also emerged as a significant aspect of the study [
11]. Due to variations in particle shape, gradation, and other factors, there are variances in the characteristics of manufactured sand and that of natural sand, the characteristics of manufactured sand and natural sand concrete are slightly different even with the same mix ratio [
12]. The problem [
13,
14] of poor workability often occurs in mixes of manufactured sand concrete. G et al. [
15] put forth a mix design methodology for an optimal water-cement ratio based on the water consumption of concrete. Luan et al. [
16] used the minimum paste theory to prepare concrete with good working performance. Wu Maosheng [
17] improved the fluidity of a concrete mix by controlling the production process of manufactured sand. Many scholars have added mineral powder and fiber [18-21] or used orthogonal experiments [
22] to prepare concrete to improve its performance in all aspects.
In summary, the correlation between the water-cement ratio and the performance of concrete made with manufactured sand is significant [
23], and the sources of manufactured sand are rich and varied, so it cannot follow the same sets of concrete mix designs. According to the physical and chemical characteristics of Fujian granite sand, the present study investigates the influence of different water-cement ratios on both the operational efficiency and mechanical properties of C35, C40 and C50 sand concrete, and the optimum water-cement ratio for Fujian granite sand is compiled, so as to achieve the optimal concrete performance.
2. Test materials and scheme
2.1. Raw materials
The raw materials of concrete are cement, manufactured sand, gravel, water, and a water reducer.
2.1.1. Cement
The cement selected for testing was Yangchunshanshui brand 42.5 grade ordinary Portland cement produced in Zhucheng, Shandong, and
Table 1 shows its mechanical and physical properties.
2.1.2. Manufactured sand
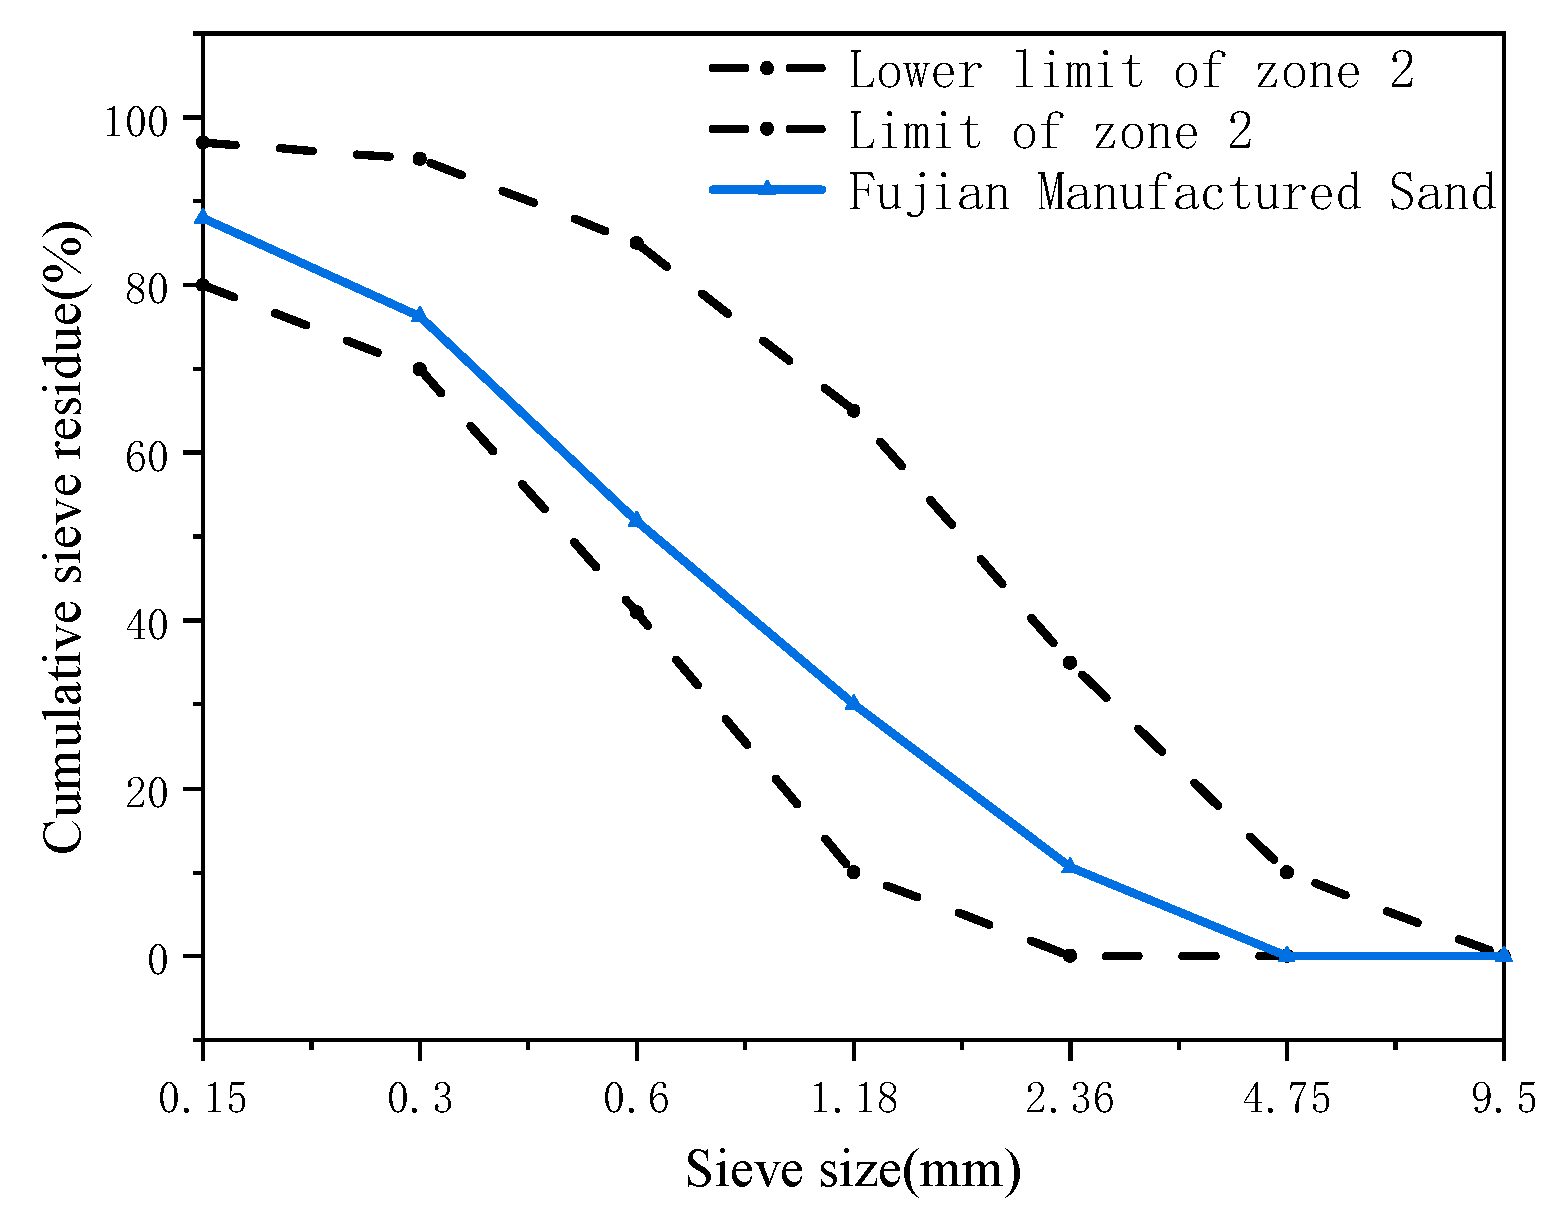
The manufactured sand produced in Quanzhou, Fujian Province, has sharp edges, rough particles and appropriate thickness. The grading curve is shown in
Figure 1. It conforms to the provisions of manufactured sand Zone 2 and the Class I technical requirements of “Sand for Construction” and the “Technical Regulations for Quality Inspection and Application of Concrete Manufactured sand for Transportation Construction Projects of Fujian Province”. The performance indexes of the manufactured sand are presented in
Table 2.
2.1.3. Gravel
Gravel, as the coarse aggregate with the largest volume proportion of concrete, which acts as the concrete skeleton and is an essential guarantee of concrete volume stability. We used Shandong Jinan stone Factory homemade 5~20mm continuous graded gravel, for its hard texture, low needle flake content, and low water absorption (
Table 3).
2.1.4. Water
Water and the cement hydration reaction are the key to improving the strength of concrete. Ordinary Jinan tap water was used.
2.1.5. Water-reducing agent
A water-reducing agent is a common admixture in concrete construction. Its effect can significantly improve the flow of the mixture, improve workability, reduce water consumption to enhance the durability and strength of concrete, reduce cement quantities, save costs, etc. This study used polycarboxylic acid superplasticizer, with 30% water reduced and 50% solid content.
2.2. Test scheme
2.2.1. Mix ratio design
The design of the mixing ratio of manufactured sand concrete should not only meet the requirements for the strength of concrete, but also meet the requirements for the performance of the mixture, the mechanical properties and the durability of the cured cement concrete. The preliminary mix design of manufactured sand concrete was carried out according to the “General concrete mix design Regulations” (JGJ55-2011).
The procedure for determining the mix ratio of concrete using manufactured sand is as follows: First, determine the preparation strength of the manufactured sand concrete, taking into account the working conditions during construction and the technical level of workers. The preparation strength is 1.645 times greater than the standard deviation of the design strength. Determine the water-cement ratio and use it to determine water consumption and cement dosage. The concrete test mix is then adjusted to determine the sand rate. Finally, determine the amount of gravel and manufactured sand. After determining the amount of raw materials, adjust on the basis of the concrete test mix, keep the water-cement ratio unchanged, adjust other parameters to ensure that the performance of the concrete mix meets the design and construction requirements, and put forward the benchmark mix ratio after correction.
Each strength grade of concrete design of three mixes, a benchmark mix, the water consumption of the other two mixes should be the same as the benchmark mix, water-cement comparison of the benchmark mix increased and reduced 0.05, sand rate increased and reduced 1%. The preliminary mix ratio design for C35, C40 and C50 concrete is shown in
Table 4.
2.2.2. Concrete performance test standards
The research in this paper primarily focuses on two aspects of the properties of manufactured sand: its working properties and mechanical properties.
The assessment of its workability is primarily taken into account in the investigation of the operational performance of manufactured sand concrete mix. The expansion test and slump test were conducted in accordance with the (GB/T 50080-2016) “Standard for Performance Test Methods of Ordinary Concrete Mix” in this study.
Highlights of this paper is to examine the mechanical properties of concrete made with manufactured sand, specifically through tests on compressive strength of cubes, flexural strength and splitting tensile strength on C35, C40 and C50 concrete test blocks according to the (GBT 50081-2019) “Test Method for Physical and Mechanical Properties of Concrete”. The compressive strength test was conducted on concrete test blocks aged 7-day and 28-day, while the flexural strength and splitting tensile strength tests were performed on blocks aged 28-day. The size and quantity of test blocks required for the test are shown in
Table 5.
2.2.3. Trial procedure
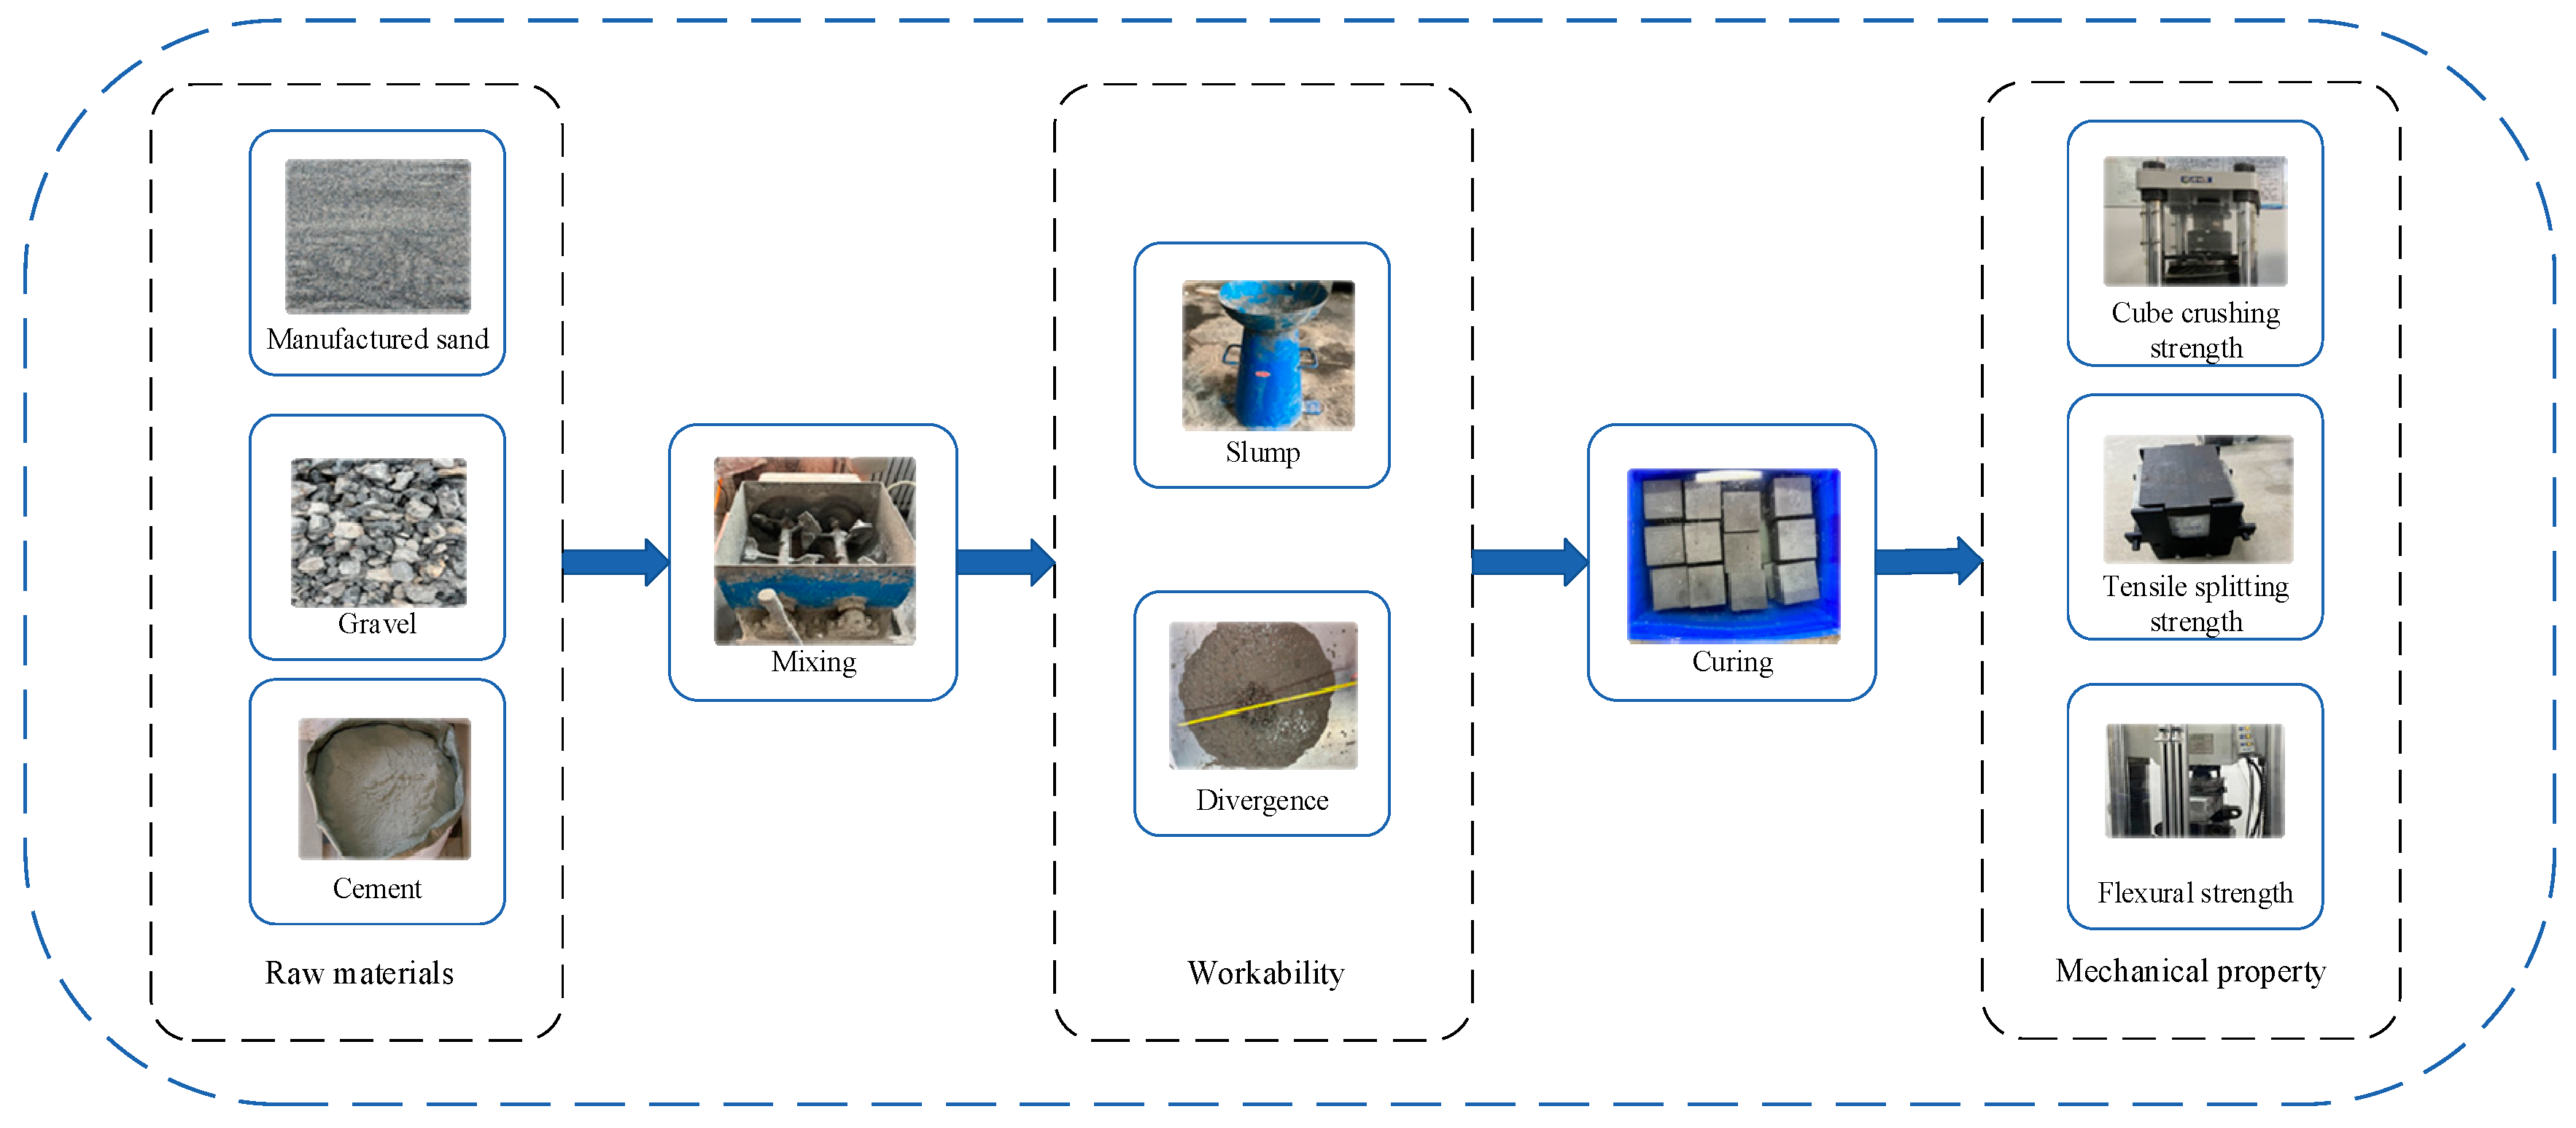
According to the preliminary mix ratio design, the manufactured sand, gravel and cement were mixed evenly in the mixer, adding water and observing the viscosity of the concrete mix, adding water-reducing agent according to the situation, and stopping the mixing after one minute when the mix showed a filigree shape. After 5 minutes, the mix was taken out for slump and expansion test. The concrete mix was loaded into the test mold within 15 minutes and shaped using a standard vibrating table. The vibration time did not exceed 90s. After vibration molding, the mix stood 24h demolding, and was put into the saturated calcium hydroxide solution at 20℃±2℃ for maintenance. After reaching the test age, the surface water waw removed and wiped, and the cube compressive strength, bending strength and splitting tensile strength were tested. The experimental procedure is displayed in
Figure 2.
3. Analysis of experimental results
3.1. The impact of the water-cement ratio on the workability of concrete
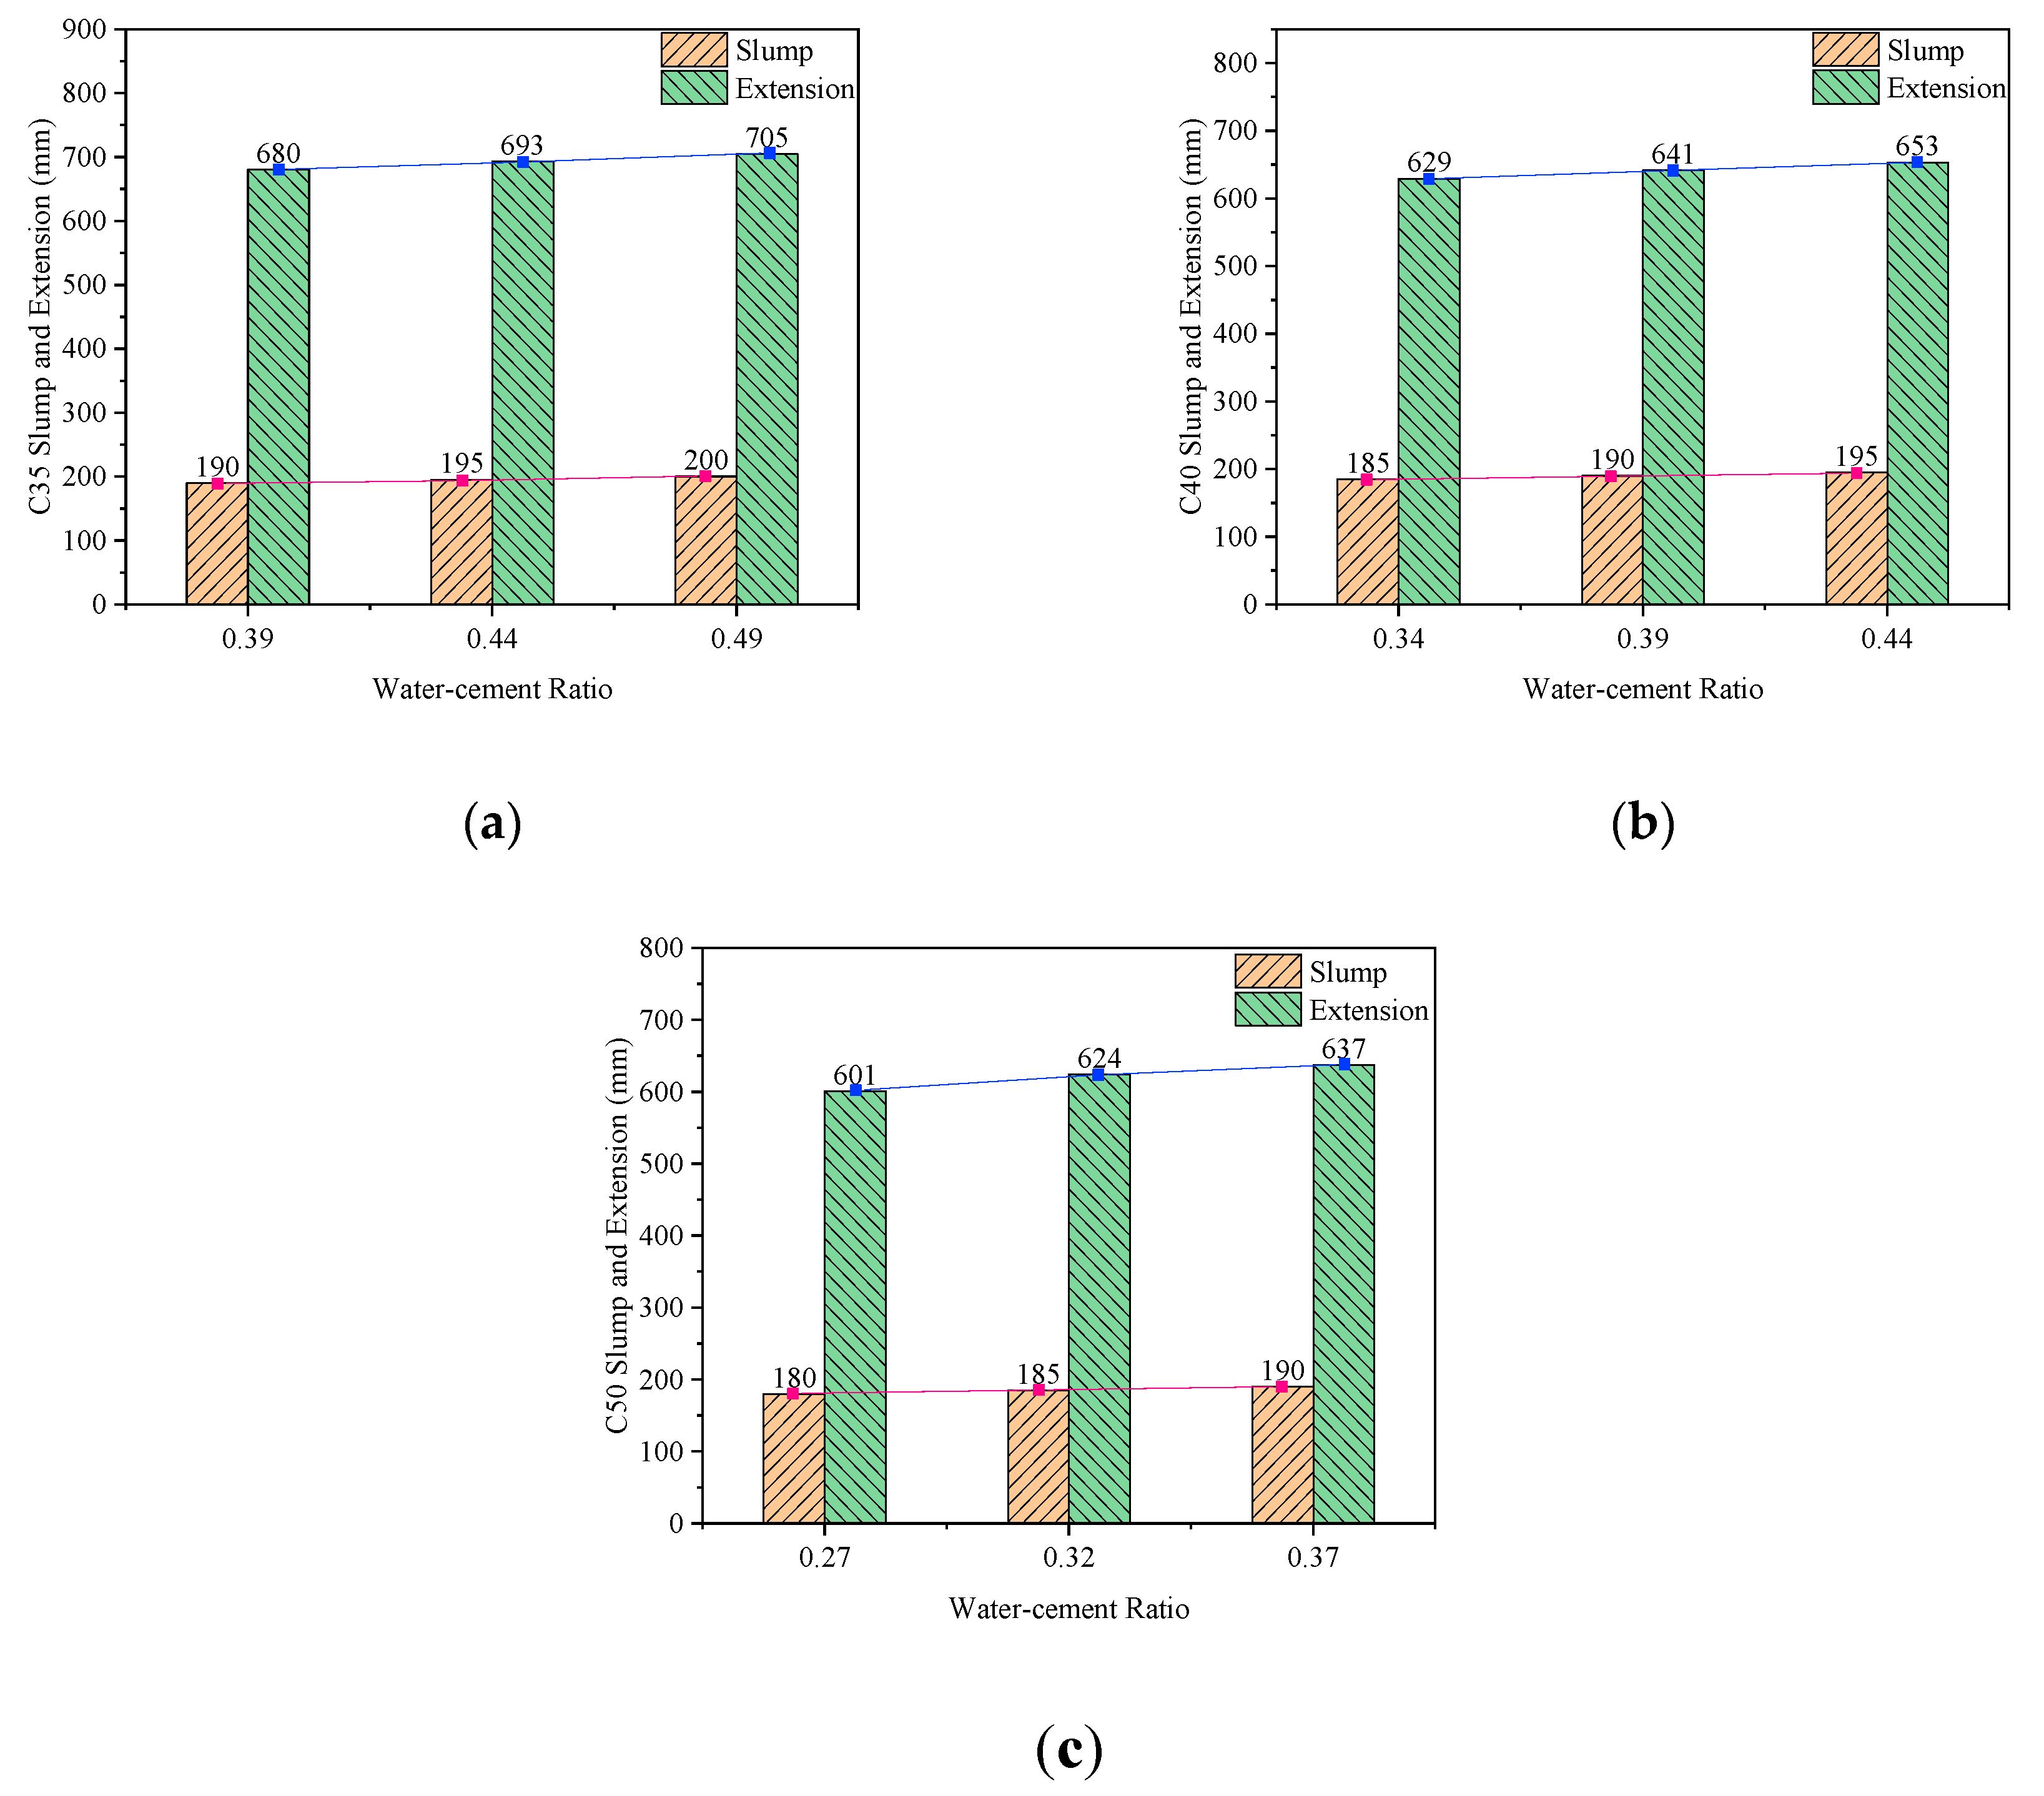
After mixing the manufactured sand concrete, the mixture was subjected to slump and expansion test. Slump and expansion of C35, C40 and C50 under different water-cement ratios are presented in
Figure 3.
The figure illustrates that as the water-cement ratio increases, slump and expansion of C35, C40 and C50 concrete all show an increasing trend. The observation depicted in
Figure 3 (a) is evident, when the water-cement ratio of C35 concrete mix is increased from 0.39 to 0.44, there is a corresponding increase in slump by 2.6% and expansion by 1.9%; when it increases to 0.49, slump increases by 5.3% and expansion increases by 3.7%. The observation depicted in
Figure 3 (b) is evident, when the water-cement ratio of C40 concrete mix increases from 0.34 to 0.39, slump increases by 2.7% and expansion by 1.9%, and when it increases to 0.44, slump increases by 5.4% and expansion by 3.8%. The observation depicted in
Figure 3 (c) is evident, when the water-cement ratio of C50 concrete mix increases from 0.27 to 0.32, the slump increases by 2.8% and the expansion degree increases by 3.8%, and when it increases to 0.37, the slump increases by 5.6% and the expansion degree increases by 6.0%.
In the process of the slump test, the concrete cone of C35 and C40 gradually sank and had good cohesion as evidence by gently tapping on the side of the collapsed concrete cone with a rammer. The C50 concrete cone, which had a water-cement ratio of 0.27, experienced structural failure, indicating inadequate cohesion. During the expansion test, after the slump cylinder was lifted, no dilute cement slurry was precipitated in the C50 concrete mix, only a small amount of dilute cement slurry was precipitated from the bottom of the C40 concrete mix, and the water retention was good. The C35 concrete with a water-cement ratio of 0.49 had more dilute cement slurry precipitation, and the aggregate of the concrete mix in the cone was exposed due to the loss of slurry, indicating that its water retention was poor.
As the strength grade increased, the slump and shrinkage of the concrete mixes tended to decrease. The denseness of the structure and the level of porosity decrease as the strength grade of concrete increases, and the corresponding water consumption will also decrease, which leads to a decrease in the fluidity of the concrete mix. In concrete mix ratio design, sand rate improvement and other ways to achieve improved strength grade are usually achieved by reducing the water-cement ratio, however, an insufficient water-cement ratio can result in inadequate performance of the concrete mixture, which is not conducive to site construction. When selecting the optimal mix ratio, considering the convenience of construction, the water-cement ratio should be carefully regulated in order to achieve both high strength and optimal workability of the concrete.
3.2. The impact of water-cement ratio on mechanical properties of concrete
3.2.1. The impact of the water-cement ratio on compressive strength
The SANS compression tester was utilized to evaluate the compressive strength of the concrete cubes, and the failure modes of C35, C40 and C50 concrete specimens are depicted in
Figure 4.
The strength grade of the C35 concrete is relatively low. During the test, many cracks first occurred in the center of the surface of the test block, and then the cracks spread up and down, and finally the test block made a dull noise and was damaged. The damaged shape is depicted in
Figure 4 (a). During the cube compressive strength test of the C40 concrete specimen, cracks extended from the center of the test block to the upper and lower surfaces, while the number of cracks increased, the cement began to flake off, and finally the specimen made suffered crackling damage, as depicted in
Figure 4 (b). After the failure, it becomes evident that the failure form of the specimen was close to a funnel shape. The crack development of the C50 concrete specimen in the early stage is similar to that of C35 and C40. When the C50 concrete specimen was damaged, it made a loud noise, and at the same time, the spalling fragments of the specimen exploded, and the state after the failure is depicted in
Figure 4 (c). The figure illustrates that the specimen has two quad-corner cones directly connected to each other.
It can be concluded that the compressive failure of the concrete was a brittle failure, according to the test phenomena, the residual deformation before the failure was very small, and the brittleness of the concrete increased with the rise in strength grade. In analysis of its failure mechanism, in the initial stage of concrete cube compression, there were many micro cracks in the test block. With the continuous pressure of top and bottom, the micro cracks gradually expanded and connected to the through cracks, and several cracks developed at the same time, until the failure. When the concrete was under one-way pressure, the upper and lower sides of the aggregate produced compressive stress, and the side of the aggregate produced tensile stress. Due to the transfer of force in the upper and lower sides, the aggregate formed a wedge. The hardened cement on both sides of the wedge was subjected to shear stress, so the final damage surface and vertical load direction was roughly 45°, close to the positive inverted quad-cone [
24].
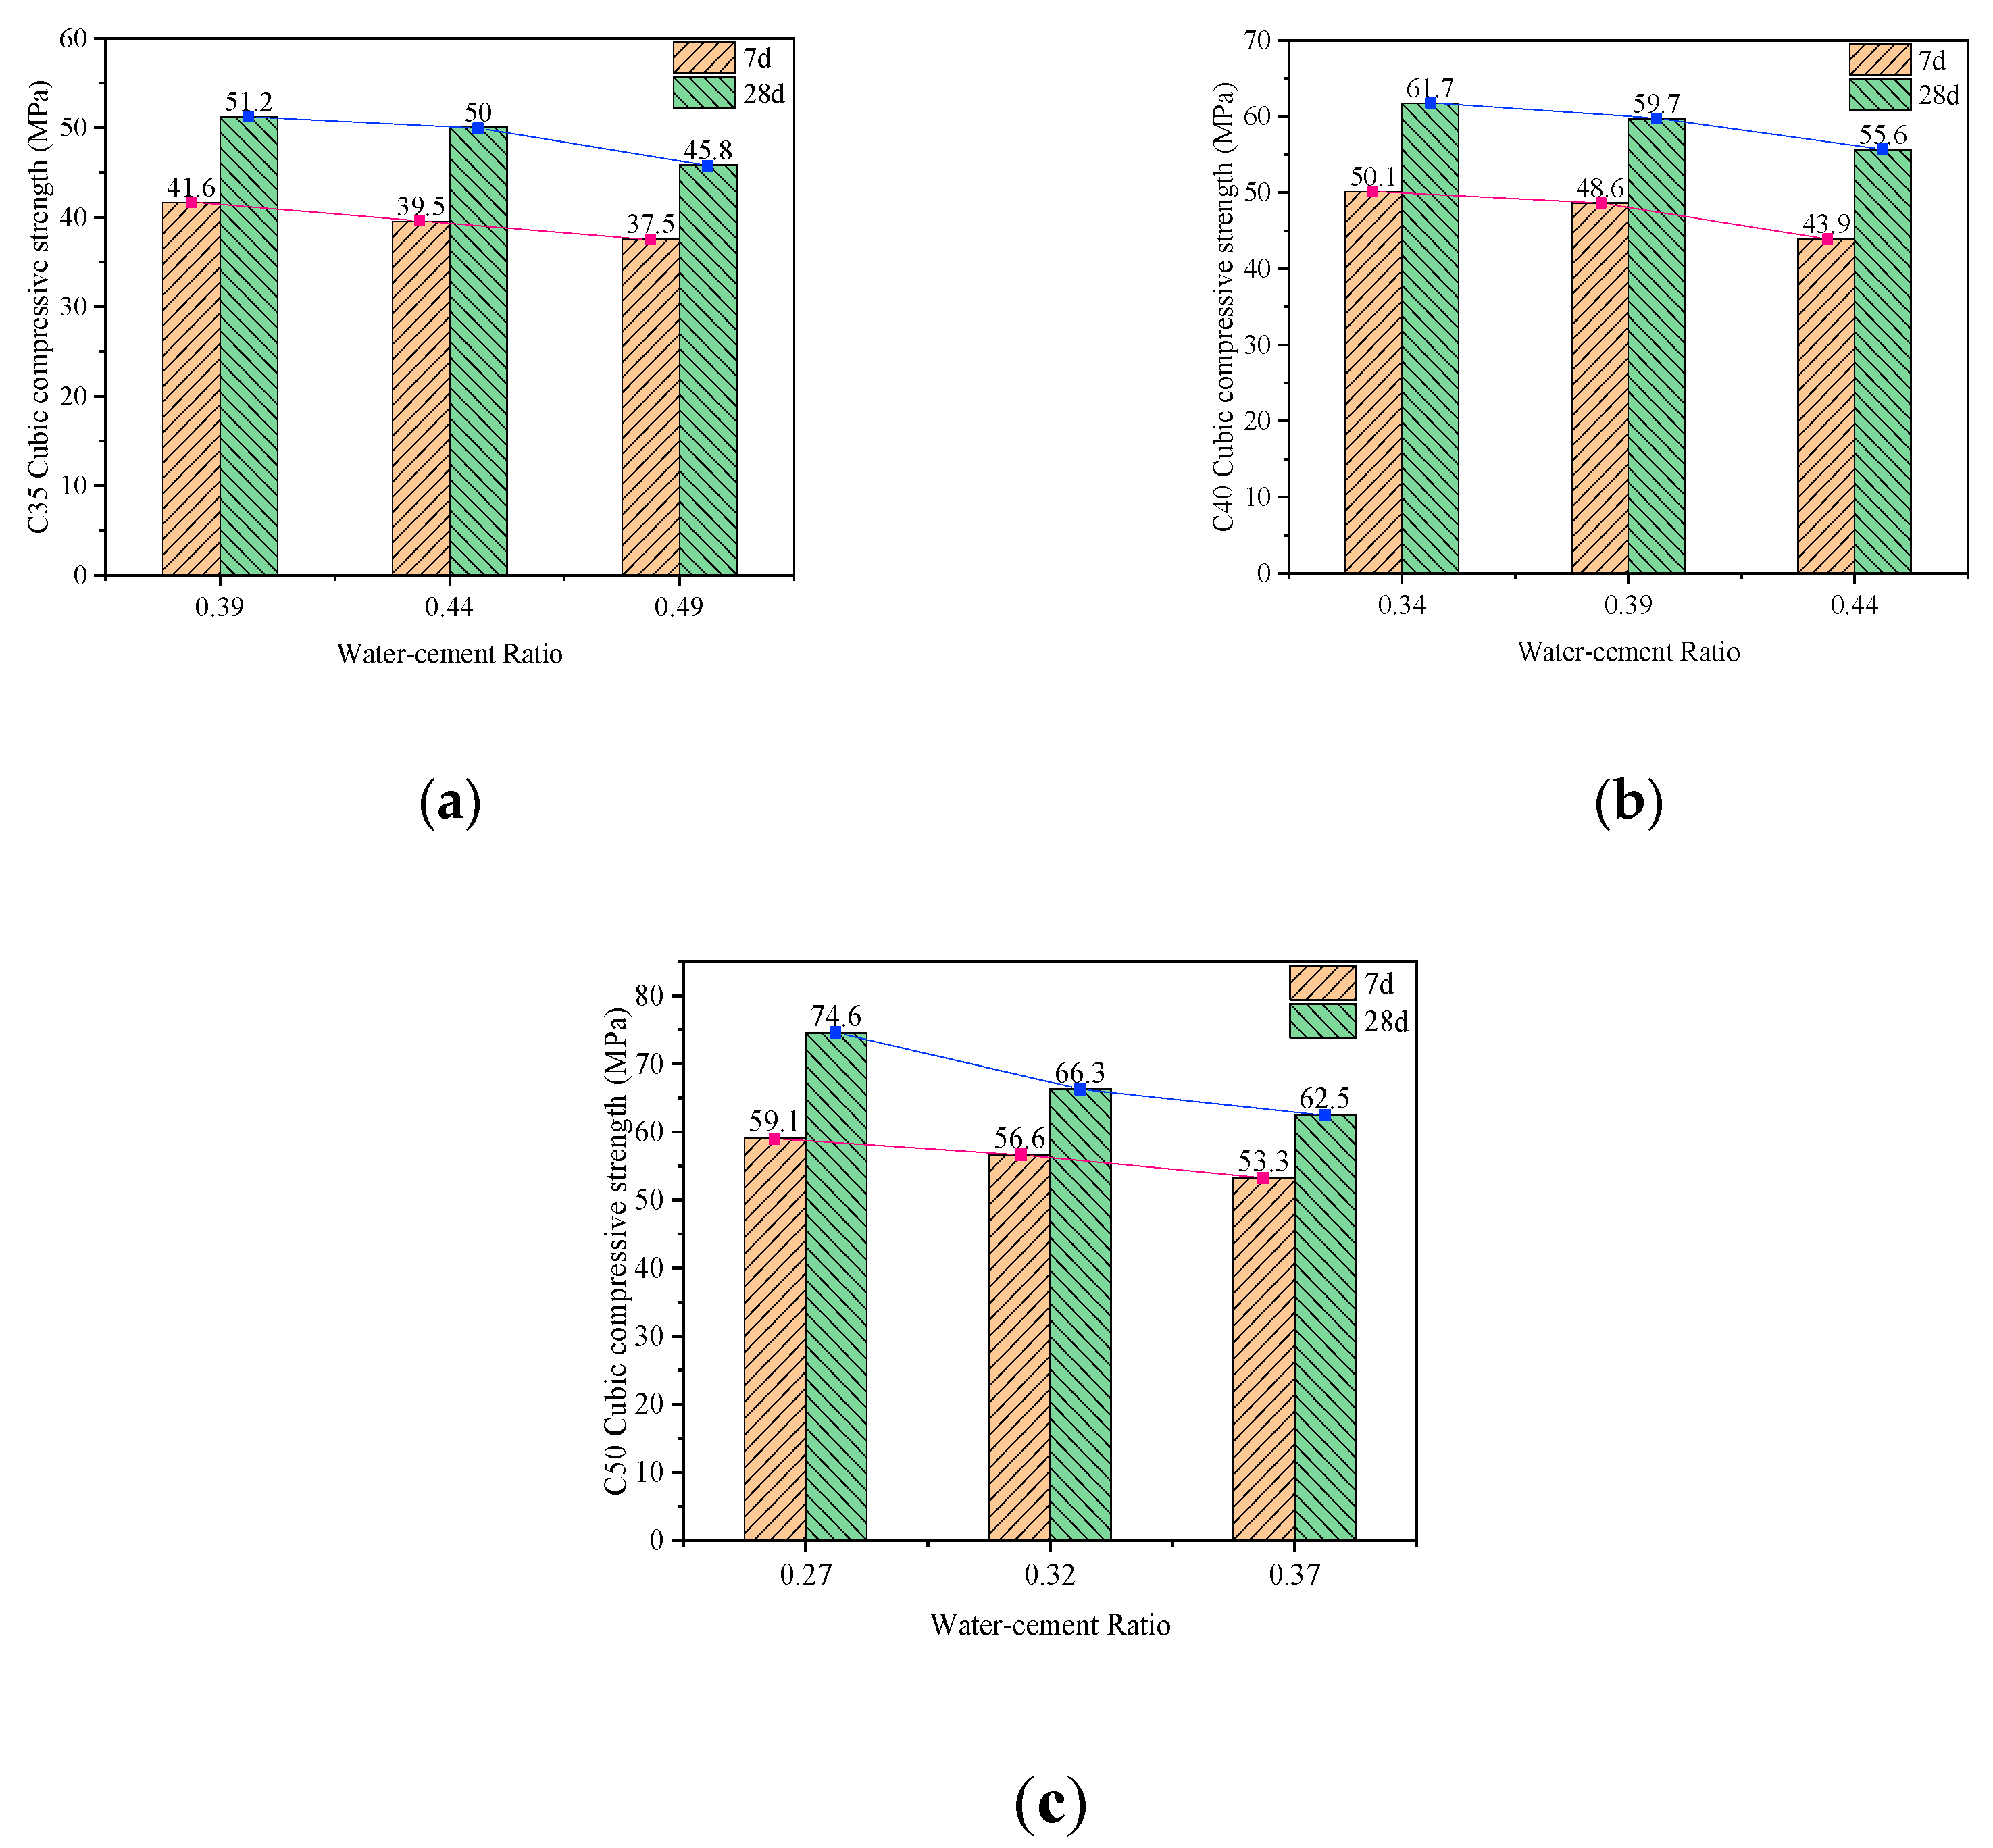
The C35, C40 and C50 manufactured sand concrete specimens with different mix ratios were subjected to compressive strength testing at the ages of 7-day and 28-day, and the test results can be found in
Figure 5.
The diagram demonstrates that the compressive strength of C35, C40 and C50 manufactured sand concrete cubes decreases as the water-cement ratio increases, both at 7-day and 28-day. This means that the water-cement ratio was inversely proportional to the compressive strength of the concrete cubes. When the ratio of water-cement in C35 concrete was raised from 0.39 to 0.44, there was a reduction of 5.0% in its compressive strength after 7-day and a decrease of 2.3% after 28-day. When the ratio was further raised to 0.49, there was a reduction of 9.9% in compressive strength at 7-day and a decrease of 10.5% at 28-day. When the water-cement ratio of C40 concrete was raised from 0.34 to 0.39, there was a reduction in its compressive strength by 3.0% at 7-day and by 3.2% at 28-day. When the ratio was further raised to 0.44, there was a reduction of 12.4% in compressive strength at 7-day and a decrease of 9.9% at 28-day. When the water-cement ratio of C50 concrete was raised from 0.27 to 0.32, there was a reduction in its compressive strength by 4.2% at 7-day and by 11.1% at 28-day. When the ratio was further raised to 0.37, there was a reduction of 9.8% in compressive strength at 7-day and a decrease of 16.2% at 28-day.
The concrete exhibited accelerated initial strength development following the pouring process. The 7-day compressive strength of C35 concrete achieved approximately 80.1% of the strength observed at 28-day, while the 7-day compressive strength for C40 grade was around 80.5% of the corresponding value at 28-day, and the 7-day compressive strength for C50 grade reached roughly 83.3% of its value at 28-day. In brief, the compressive strength of machine-made sand concrete cubes at 7-day can achieve approximately 80% to 90% of the strength observed at 28-day.
3.2.2. The impact of the water-cement ratio on the splitting tensile strength
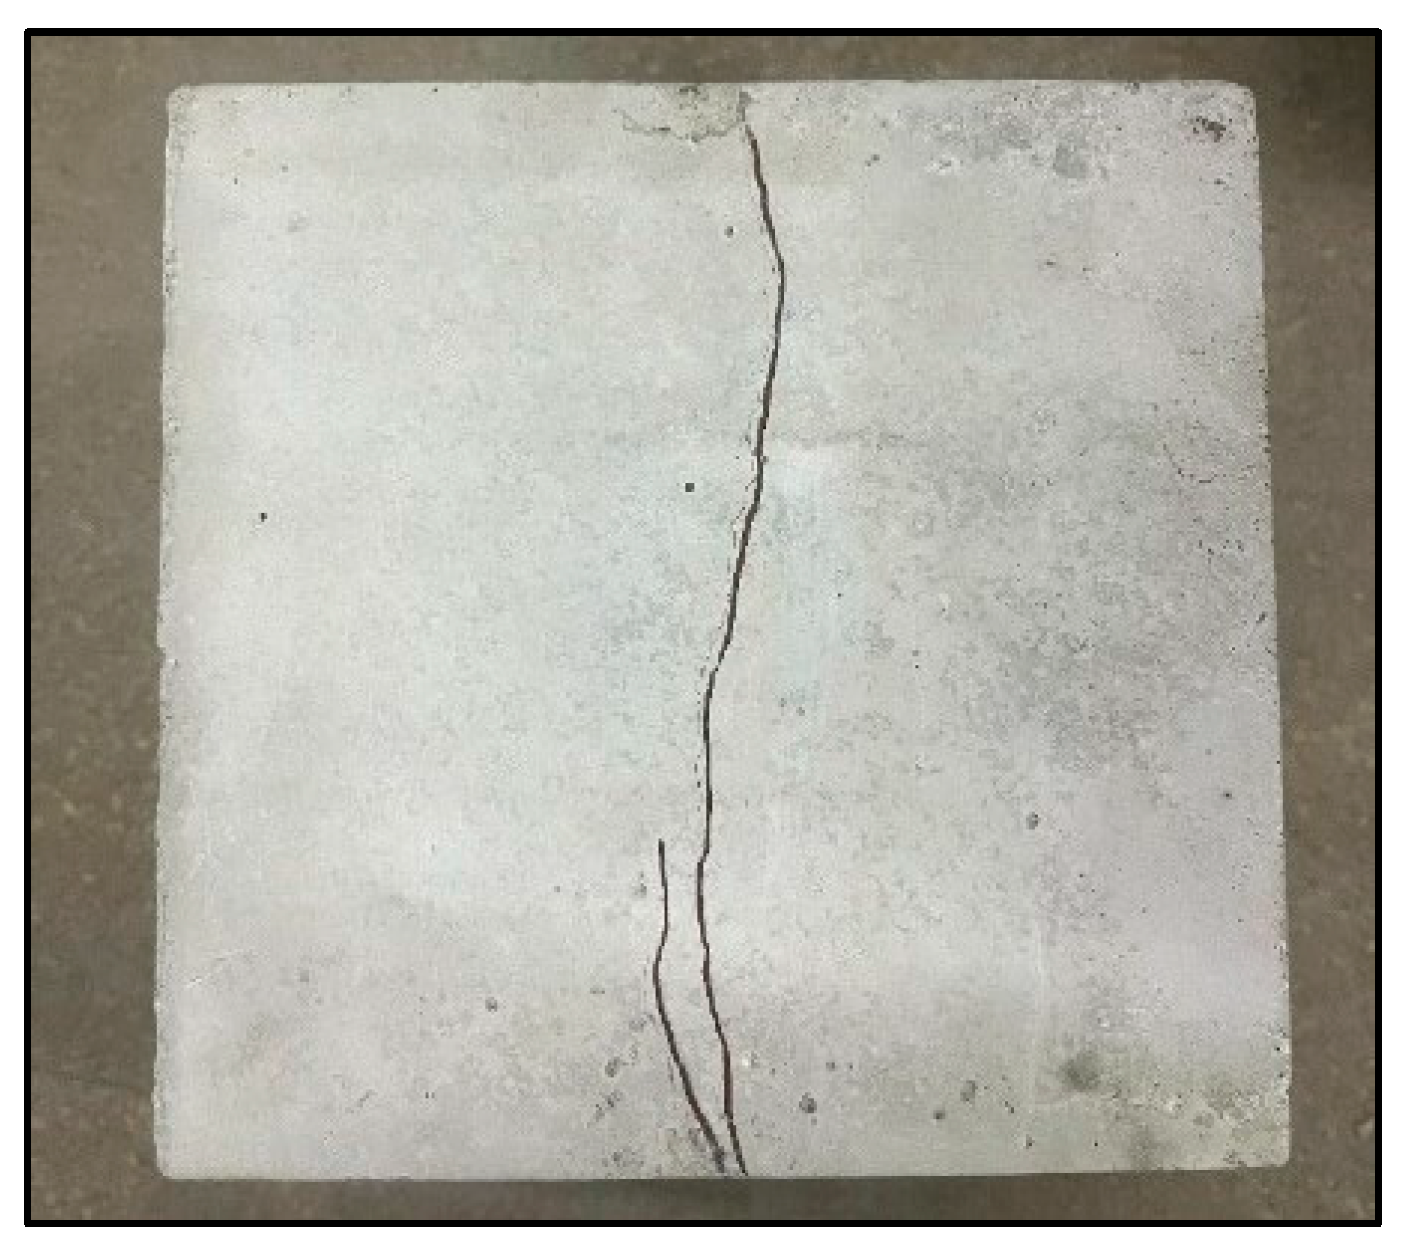
The SANS pressure testing machine was utilized to evaluate the splitting tensile strength of concrete made with manufactured sand, and the crack development of the concrete test block after splitting is shown in
Figure 6.
The information depicted in
Figure 6 is evident, after the splitting tensile failure of the concrete test block, there is an obvious crack running through the upper and lower surfaces in the center of the compression vertical plane. The concrete test block produced transverse deformation after being subjected to the pressure of the upper and lower surfaces. The splitting tensile strength of concrete, similar to the compressive tensile strength test, also exhibited a brittle failure, which resulted in cracking when the force produced a small deformation, and there was no residual deformation before fracture.
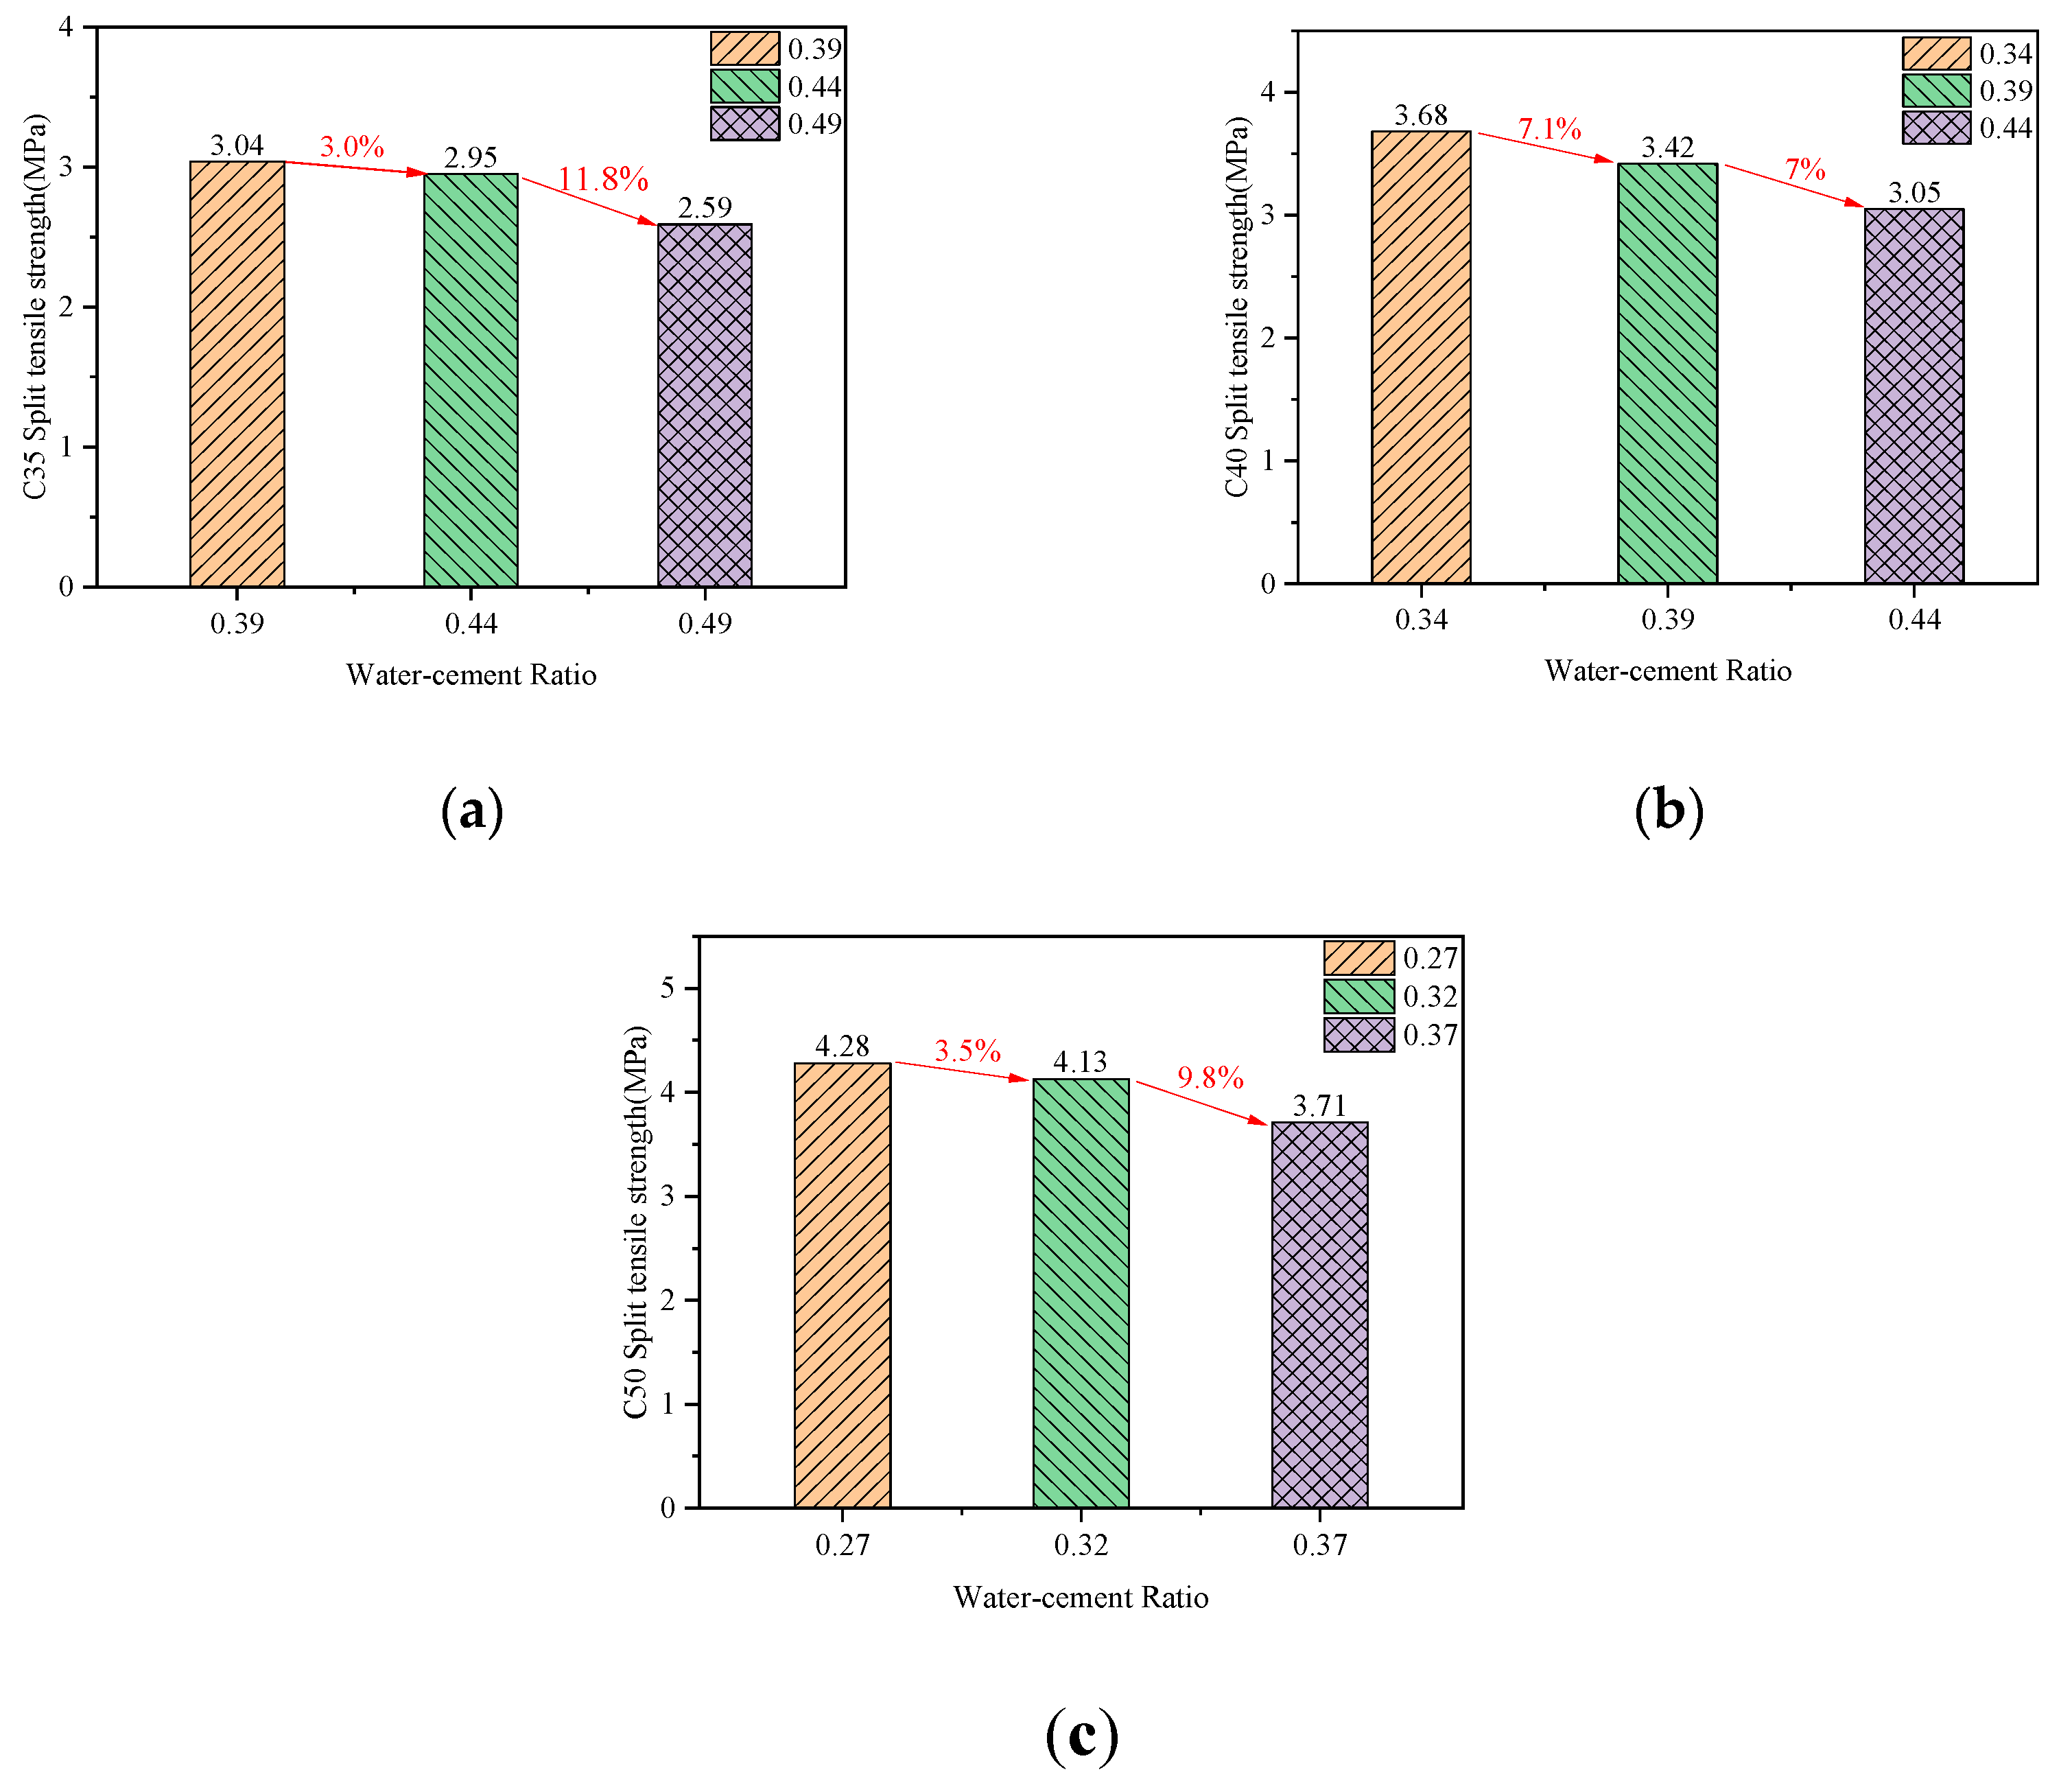
The splitting tensile strength of C35, C40 and C50 concrete test blocks under different feed ratios is depicted in
Figure 7.
The information depicted in
Figure 7 demonstrates a decline in the splitting tensile strength of C35, C40, and C50 concrete with an increase in the water-cement ratio. The splitting tensile strength of C35 concrete exhibited a reduction of 3.0% and 14.8%, correspondingly, with an increase in the water-cement ratio from 0.39 to 0.44 and 0.49. The strength of water-cement ratio 0.44 to 0.49 decreased significantly more than that of water-cement ratio 0.39 to 0.44. When the water-cement ratio was raised to 0.39 and 0.44 from 0.34, there was a corresponding reduction in the splitting tensile strength of C40 concrete by 7.1% and 14.1% respectively. Moreover, it was observed that the decreasing range of splitting tensile strength slightly increased with an increase in the water-cement ratio. The tensile strength under splitting of C50 concrete exhibited a reduction of 3.5% and 13.3%, correspondingly, with an increase in the water-cement ratio from 0.27 to 0.32 and 0.37. Furthermore, an increase in the water-cement ratio resulted in a greater decrease in the splitting tensile strength.
With the rise in the water-cement ratio, a decline was noted in the splitting tensile strength of C35, C40 and C50. Additionally, this decreasing trend was more pronounced with a reduction in water-cement ratio, which aligns with the corresponding change in cube compressive strength.
3.2.3. The impact of the water-cement ratio on the flexural strength
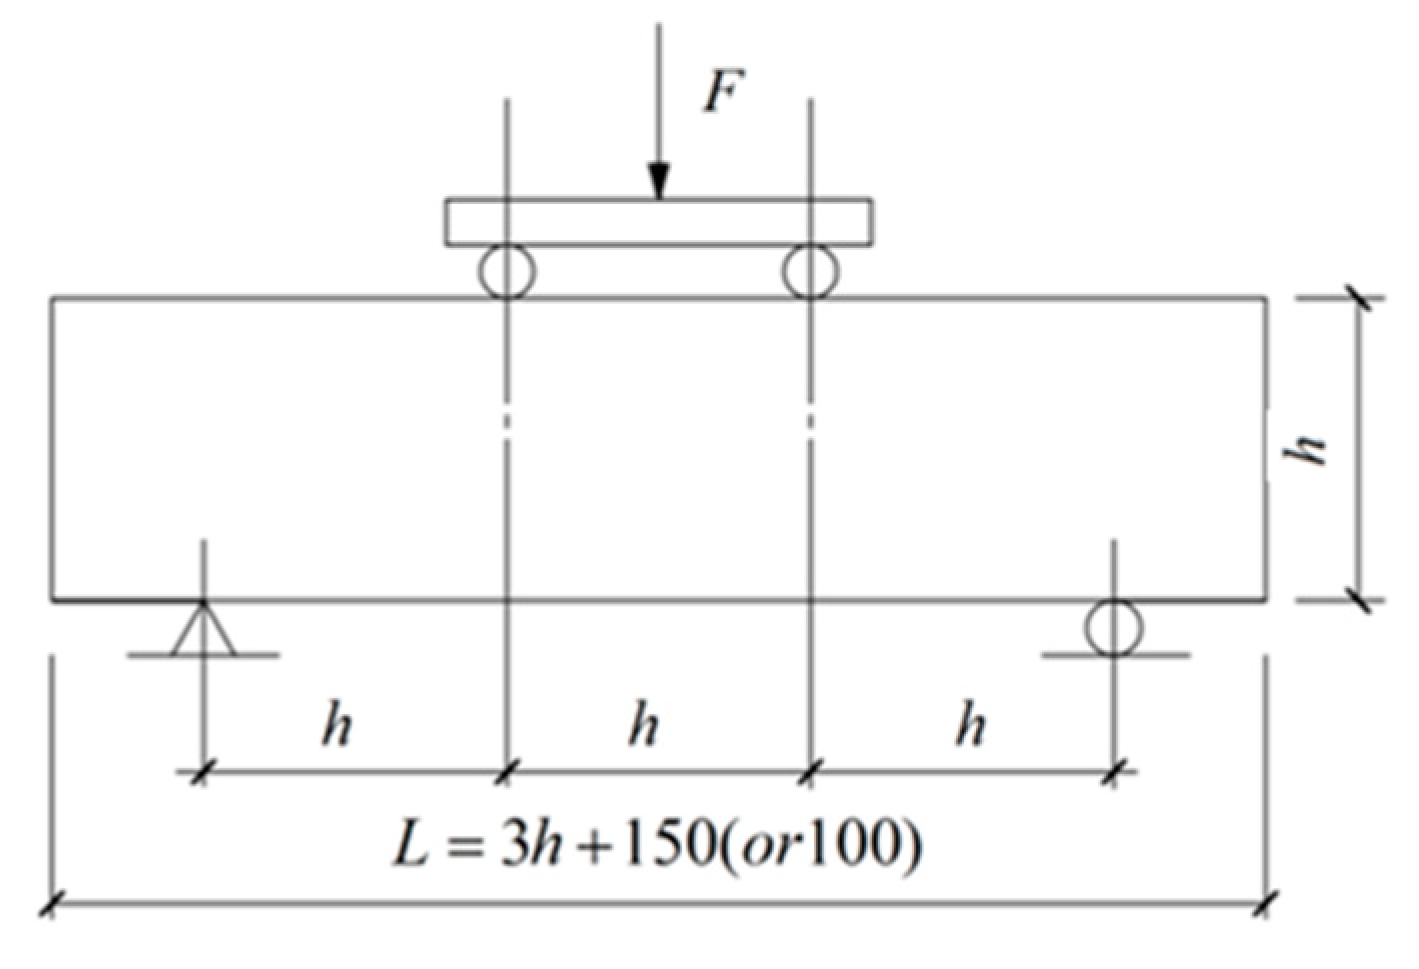
The flexural strength test of C35, C40 and C50 manufactured sand concrete specimens with different mix ratios was carried out after reaching the age of 28d. The test adopted the method of two-point loading at the three points of the test block. The simplified test device is depicted in
Figure 8.
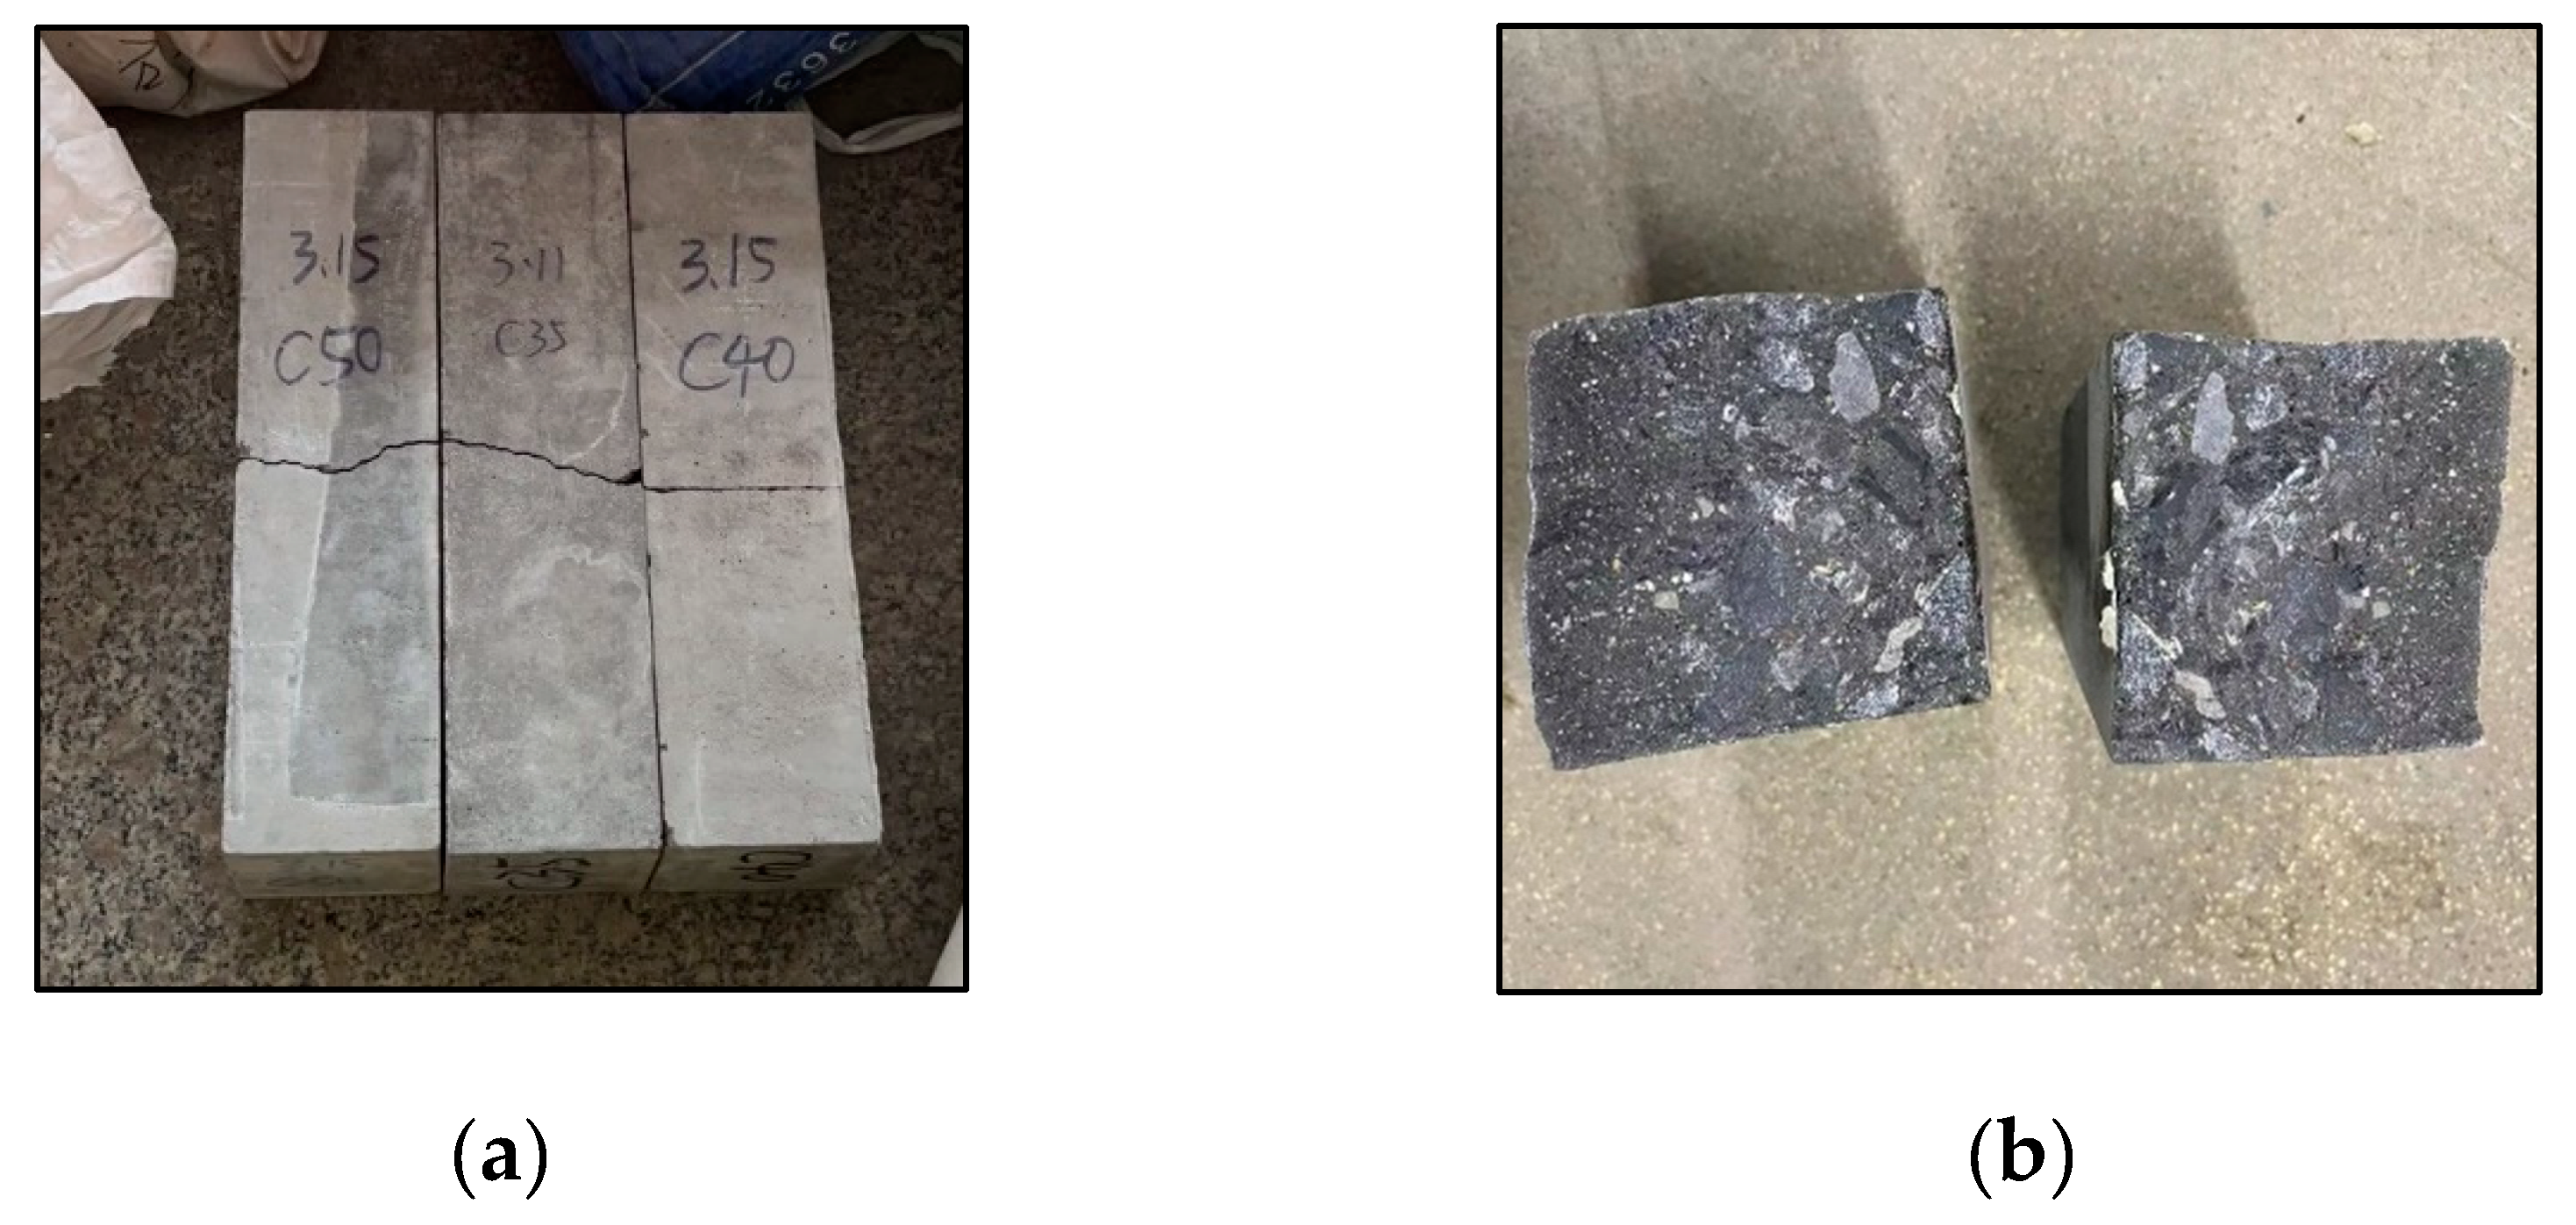
The fracture position and fracture surface of concrete test blocks C35, C40 and C50 are shown in
Figure 9. It is evident from the illustration that the fracture surface occurs within the loading point, thereby validating the obtained results.
The manufactured sand concrete test block was analyzed in the stress state during bending resistance. The external force it was subjected to can be simplified as bending force. Bending force produces a bending moment at the center line of the test block, and the concrete will fracture and be destroyed under the action of the bending moment. According to the stress state and form of the test block, the flexural strength is calculated by using the elastic modulus, cross section area, and stress distance of the concrete. The test results in
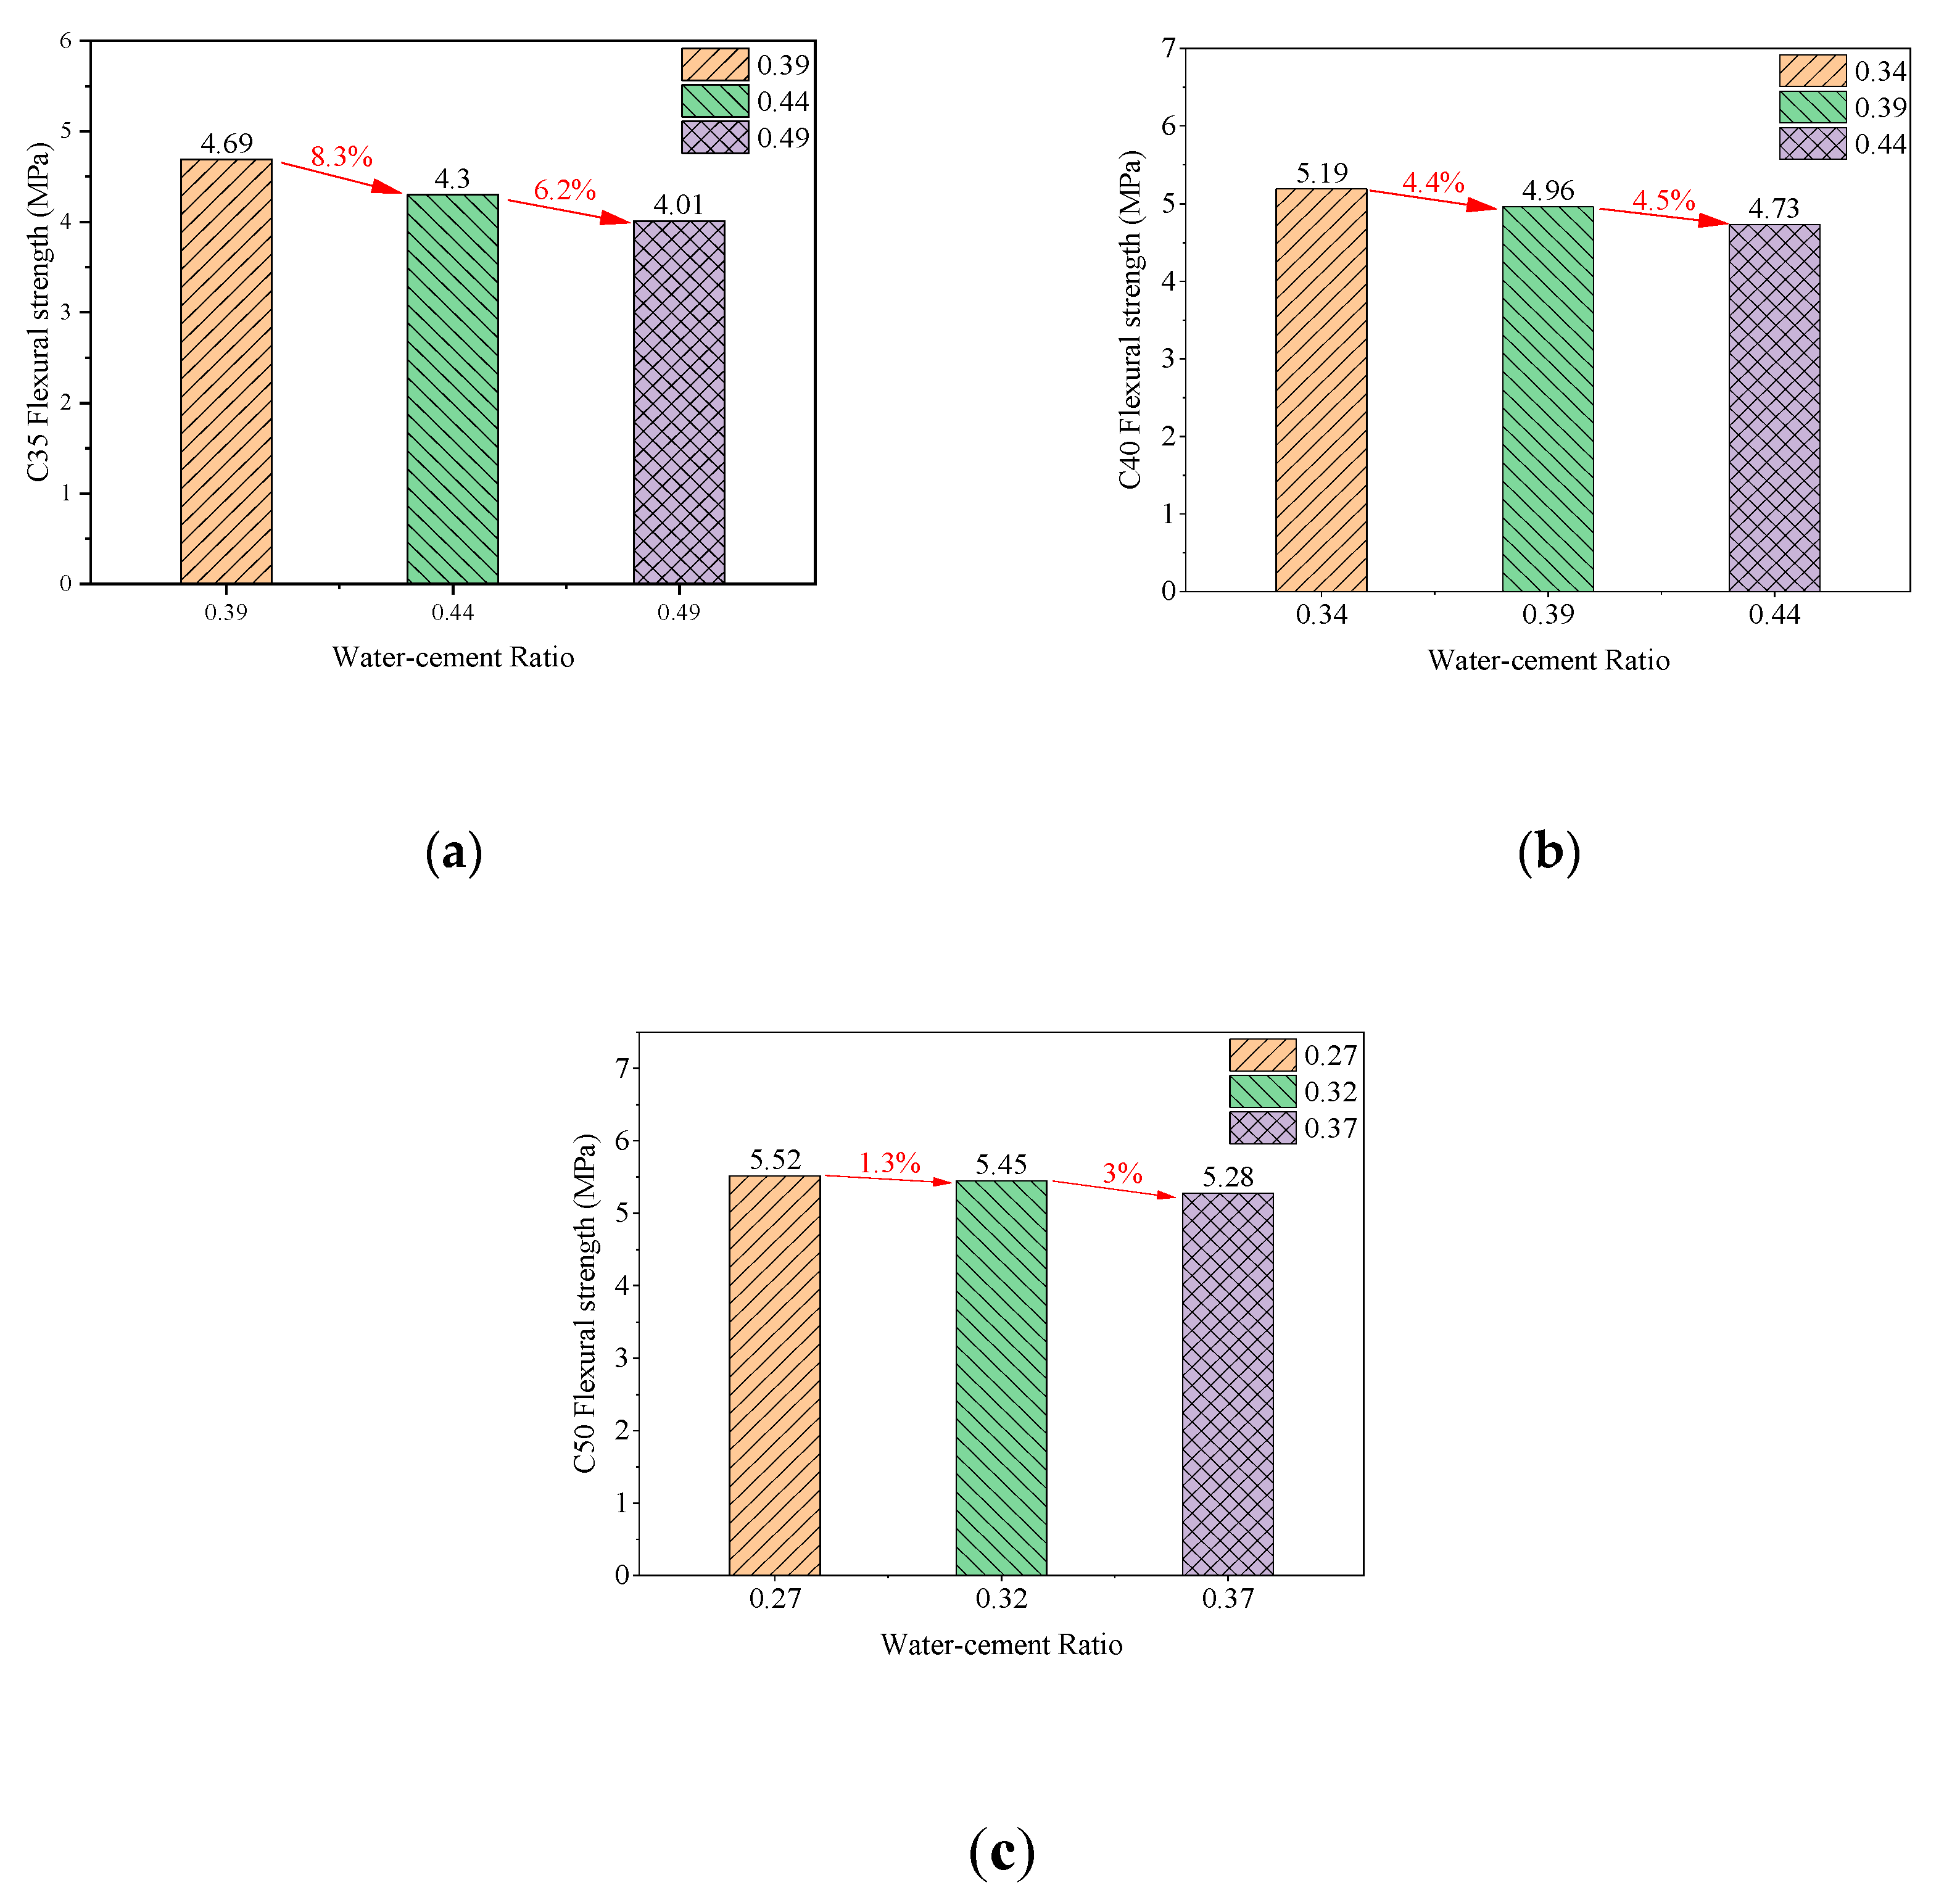
Figure 10 illustrate the flexural strength of manufactured sand concrete with grades C35, C40 and C50.
The information depicted in
Figure 10 is evident, the flexural strength of C35, C40 and C50 concrete was inversely related to the water-cement ratio. The water-cement ratio for C35 concrete experienced an incremental rise from 0.39 to 0.44 and subsequently to 0.49, resulting in a corresponding decrease in its flexural strength by 8.3% and 14.5%, respectively. Furthermore, as the water-cement ratio increased, the rate of decline in flexural strength exhibited a decelerating trend. The water-cement ratio of C40 concrete increased from 0.34 to 0.39 and 0.44, and its flexural strength decreased by 4.4% and 8.9%, respectively. The water-cement ratio for C50 concrete increased from 0.27 to 0.32 and 0.37, resulting in a respective decrease in flexural strength of 1.3% and 4.3%. Furthermore, the decrease in magnitude was observed to be more pronounced with a reduction in the water-cement ratio.
The analysis of the variation law of flexural strength among different strength grades reveals that as the concrete strength grade increases, the decline in flexural strength diminishes. Additionally, it is observed that the flexural strength of C35, C40 and C50 concrete decreases with an increase in water-cement ratio, which aligns with changes in splitting tensile strength and compressive strength.
3.3. Determination of the mix ratio
In conclusion, the influence of water-cement ratio on concrete performance made with manufactured sand is of utmost importance, as it directly affects both its workability and mechanical properties. As the ratio of water to cement is increased, there is a gradual enhancement in the workability of the concrete mixture, but a too-large water-cement ratio will result in segregation and bleeding of the mix. The mechanical strength of concrete gradually increases as the water-cement ratio decreases, but a too-small water-cement ratio will lead to the concrete mix being too viscous, with poor working performance. Therefore, there is an optimal water-cement ratio, which gives manufactured sand concrete excellent mechanical properties on the basis of good working performance.
By conducting tests on the operational performance and mechanical characteristics of concrete produced using manufactured sand in Fujian, the best water-cement ratio of C35 concrete is 0.39, the best water-cement ratio of C40 concrete is 0.34, and the best water-cement ratio for C50 concrete is 0.32. The optimal mixture proportions for C35, C40, and C50 concrete are presented in
Table 6.
4. Conclusions
The present study focuses on the physical and chemical properties of manufactured sand from Fujian, the mix ratio design of manufactured sand concrete was carried out, working performance tests, such as slump and expansion tests, were carried out, and mechanical properties tests, such as compressive strength of cube test, flexural strength test, and splitting tensile strength test, were carried out. The operational efficiency and mechanical characteristics of C35, C40 and C50 concrete have been analyzed at different water to cement ratios. Finally, the optimum mix ratio of each strength grade of manufactured sand concrete was determined, and the conclusions are as follows:
The working performance and mechanical property tests conducted on concrete made with manufactured sand indicate that the optimal water-cement ratio for C35 concrete is 0.39, for C40 concrete is 0.34, and for C50 concrete is 0.32;
The performance of the concrete is immediately impacted by the ratio of water to cement. Slump is used as an index to test the workability of the concrete mix. The slump and expansion of the mix increase with a higher water-cement ratio, resulting in improved flowability. Conversely, the lower the water-cement ratio, the higher the flowability of the concrete mix;
The mechanical properties of the produced sand concrete are indirectly influenced by the water-cement ratio. Compressive strength, flexural strength and splitting tensile strength were used as the indexes for testing mechanical properties. With the decrease of the water-cement ratio, the mechanical property of C35, C40 and C50 concrete gradually increased. According to the analysis of the mechanism, the decrease of the water-cement ratio reduces porosity of the concrete, leads to the improvement of concrete compactness, and thus enhance its mechanical properties;
The mechanical properties of C35, C40 and C50 concrete demonstrated a consistent trend of variation. The alteration of the water-cement ratio led to a consistent trend change in the compressive strength, flexural strength and splitting tensile strength of all three manufactured sand concrete grades.
Author Contributions
Conceptualization, W.H.; methodology, H.Z.; investigation, K.L.; resources, Y.X.; data curation, Y.H.; formal analysis, W.Y. writing—original draft preparation, P.L.; supervision, P.W.
Funding
This research was funded by Shandong Provincial Natural Science Foundation (Grant No. ZR2021ME238) and Science and Technology Project of Universities in Shandong Province (Grant No. J18KA216).
Conflicts of Interest
The authors declare no conflict of interest.
References
- Xu. Jian, CAI Jiwei, Wang Jiliang, et al. Research status of artificial sand and artificial sand concrete [J]. Foreign Building Materials Science and Technology 2004, 25, 20–24. [CrossRef]
- Lu Zili, Yang Zhenguo, Shen Weiguo, et al. Research on the design parameters of the mixing ratio of mechanical sand concrete [J]. Journal of Wuhan University of Technology 2014, 36, 32–36. [Google Scholar] [CrossRef]
- Zhu Wenping. Research on mechanical properties and skid resistance of machine-made sand concrete [J]. Value Engineering 2022, 41, 58–61. (In Chinese) [Google Scholar] [CrossRef]
- Chen san ‘an, Wu Rong, Xiao Ji, et al. Mechanism sand concrete application in Kenya’s horse in railway construction [J]. Journal of China harbor construction, the lancet 2023, 5, 51–56. [Google Scholar] [CrossRef]
- Feng, H. Study on composite ratio of Machine-made sand grout based on durability [J]. Journal of Taiyuan University (Natural Science Edition) 2023, 41, 1–6. [Google Scholar] [CrossRef]
- Liu Guifeng, Qin Yanlong, Chen Zhengfa, et al. Influence of water-cement ratio on performance of mechanized sand concrete in harsh environment [J]. Concrete 2015, 10, 44–47. [Google Scholar] [CrossRef]
- Song Tao, Tong Fuguo, Xue Song, et al. Influence of water-cement ratio on capillary suction of concrete [J]. Journal of Hydroelectric Energy 2022, 40, 170–173. [Google Scholar]
- Zhang Yang, Zheng Yang, Huang Jiuda. Research on Mechanical properties optimization and Influencing factors of pervious concrete [J]. Concrete and Cement Products 2022, 12, 97–100. [Google Scholar] [CrossRef]
- Li Wei, WANG Zhaolun. Experimental study on workability and mechanical properties of permeable concrete [J]. China & Foreign Highway 2022, 42, 232–236. (In Chinese) [Google Scholar] [CrossRef]
- Li Chongzhi, Ren Qiangwei, Sun Xiaoran, et al. Study on mix ratio design and performance of C40 pervious concrete [J]. Materials Review 2022, 36, 201–205. [Google Scholar]
- Cao Kangjian, Ji Yonggang, Fan Xingan, et al. Research on mix ratio design and performance of granite-made sand concrete with different stone powder content [J]. Concrete 2023, 4, 120–125. [Google Scholar] [CrossRef]
- Lin Tian-Le, Chen Zhen-guang, Zhang Chun-ying, et al. Study on mix ratio of natural sand and machine-made sand concrete with same workability and strength [J]. Concrete and Cement Products 2023, 5, 17–21. [Google Scholar] [CrossRef]
- Zhu Xian-Yu, Hu De-Shang, Wang Zhen-Fan, et al. Experimental study on mix ratio of machine-made sand concrete rich in fine grained soil hollow slag [J]. Concrete 2022, 5, 88–92. (In Chinese) [Google Scholar] [CrossRef]
- Yan Yongdong, Tao Songtao, Zhuang Zhijian, et al. Optimization design and experiment of mixing ratio of sand concrete with pumping mechanism [J]. Concrete 2022, 2, 121–126. [Google Scholar] [CrossRef]
- Gonzalez-Diaz, E., Jaizme-Vega, E., & Jubera-Perez, J. Assessment of the influence of the effective water-cement ratio on the workability and strength of a commercial concrete used for the construction of concrete caissons. Revista De La Construccion. Journal of Construction 2018, 17, 231–239. [CrossRef]
- Luan, Jinjin, Xudong Chen, Yingjie Ning, and Zhenxiang Shi. Beneficial Utilization of Ultra-Fine Dredged Sand from Yangtze River Channel as a Concrete Material Based on the Minimum Paste Theory. Case Studies in Construction Materials 2022, e01098. [CrossRef]
- Design and application of mix ratio of machine-made sand in concrete [J]. Journal of Shandong Agricultural University (Natural Science Edition) 2015, 5, 730–733. [CrossRef]
- Zhang Shuyun, Zhou Jie, Zhang Zheng, et al. Mix ratio design of mechanized sand self-compact lightweight aggregate concrete based on orthogonal test [J]. Concrete and Cement Products 2021, 12, 84–88. [Google Scholar] [CrossRef]
- Liang Yuanbo, Gu Kunpeng, Wang Chengqi. Influence of silica fume on concrete preparation by high stone powder content sand [J]. Water Transport Engineering 2017, 7, 53–57. (In Chinese) [Google Scholar] [CrossRef]
- Qiao Hongxia, Chen Zhichao, Liang Jinke, et al. Sulfate resistance of basalt-made sand concrete [J]. Journal of Building Science and Engineering 2019, 36, 48–55. [Google Scholar] [CrossRef]
- Yu Lin, WANG Xuelei. Effect of polypropylene fiber on mixing performance, impermeability and mix ratio optimization of mechanized sand concrete [J]. Building Technology 2023, 54, 303–305. (In Chinese) [Google Scholar] [CrossRef]
- Liu D, Zhang W, Tang Y, Jian Y, Lai Y. Orthogonal Experimental Study on Concrete Properties of Machine-Made Tuff Sand. Materials 2022, 15, 3516. [Google Scholar] [CrossRef] [PubMed]
- Wang Xiaolong, Yang Yongfu, Zhang Yujia, et al. Review on compressive performance of recycled concrete [J]. Science and Technology Innovation Guide 2022, 19, 84–87. [Google Scholar] [CrossRef]
- Xie Kaizhong, Liu Zhenwei, Zheng Kesi, et al. Research on properties of mechanical sand concrete with different particle gradations [J]. Concrete 2021, 4, 91–95. (In Chinese) [Google Scholar] [CrossRef]
|
Disclaimer/Publisher’s Note: The statements, opinions and data contained in all publications are solely those of the individual author(s) and contributor(s) and not of MDPI and/or the editor(s). MDPI and/or the editor(s) disclaim responsibility for any injury to people or property resulting from any ideas, methods, instructions or products referred to in the content. |
© 2023 by the authors. Licensee MDPI, Basel, Switzerland. This article is an open access article distributed under the terms and conditions of the Creative Commons Attribution (CC BY) license (http://creativecommons.org/licenses/by/4.0/).
