Preprint
Article

Influence of Laser Marking Parameters in The DMC Code Quality on the PBT/Glass Fibre Composite Surface Using SEM

Altmetrics

Downloads

294

Views

56

Comments

0

Submitted:

23 October 2023

Posted:

25 October 2023

You are already at the latest version

Alerts
Abstract
Laser marking on polymer composite surfaces can be difficult to contrast and cause readability problems for electronic decoding equipment on production lines due to poor interaction between the laser and the fibres used to reinforce these materials. This problem can be solved with the right choice of marking parameters, resulting in savings for companies by avoiding production problems such as rejection, scrap and customer complaints. The present work uses the PBT/glass fibre composite used in the manufacture of instrument panels for motorcycles. The tests were carried out with different laser marking parameters using a Nd: YAG laser. Subsequently, the laser-marked DMC codes were analysed using a Verifier to evaluate the quality according to the ISO/IEC 29158:2020 standard. A detailed analysis of these surfaces was also carried out to observe some physical and chemical changes using SEM microscopy and EDS spectroscopy. The optical analysis showed that the lower the radiation power and pulse frequency and the higher the marking speed, the weaker the laser marking and therefore the poorer the DMC code quality, which was confirmed by the SEM. EDS spectroscopy showed that the laser marking process did not affect the chemical changes on the sample surface.
Keywords: 
Subject: Engineering  -   Mechanical Engineering

1. Introduction

The introduction should briefly place the study in a broad context and highlight why it is important. It should define the purpose of the work and its significance. The current state of the research field should be carefully reviewed and key publications cited. Please highlight controversial and diverging hypotheses when necessary. Finally, briefly mention the main aim of the work and highlight the principal conclusions. As far as possible, please keep the introduction comprehensible to scientists outside your particular field of research. References should be numbered in order of appearance and indicated by a numeral or numerals in square brackets—e.g., [1] or [2,3], or [4,5,6]. See the end of the document for further details on references.
As a result of global industrial competitiveness, companies are increasingly investing in technology and digitalisation to improve operational efficiency and productivity, quality, production times and other outcomes in their production processes, to guarantee the quality of the final products and reduce production costs [1,2]. The new industrial revolution, Industry 4.0, brings increasing automatization and digitization through the IoT concept, where the traceability of the manufacturing process plays an increasingly important role in guaranteeing the quality of the final product [3,4,5]. For these purposes, laser-marked codes have been used to provide permanent, legible marking and effective traceability, and can be used with various information such as part and serial number, batch, and manufacturing date [6]. In addition to this, the use of these codes along the supply chain makes it possible to analyse and store information about the materials and manufacturing processes, and quality inspections [3]. These codes are defined as a 2D barcode used to store a large amount of data in a grid of black and white squares that can be placed in either a square or rectangular form. They can be directly marked with a laser on the material surface, providing permanent, legible marking and effective traceability [4,5], but the quality of the printed code can be affected by the material, process parameters and type of laser used in the marking process.
Laser engraving is the most widely used technique to produce a high-quality marked surface, marking the material by creating grooves. It can be used on both metallic and polymeric materials. The penetration depth can be some millimetres, depending on the number of passes to be made. This method requires the energy density to be high enough to raise the surface temperature of the material well above the melting point, causing melting or evaporation [7,8,9].
The laser interaction in metal materials was studied by Qi et al [10]. They investigated the influence of pulse frequency on the marking quality of stainless steel by analysing the width, depth (penetration) and contrast using scanning electron microscopy (SEM), energy dispersive X-ray spectroscopy (EDS), a profilometer and a special imaging device. In this study, it was observed that the presence of oxygen in the markings was higher at higher values of pulse frequency due to increased oxidation of the material. They concluded that the pulse frequency has a significant effect on the quality of the marking, as an increase in the pulse frequency results in less evaporation of the material and more oxidation, which increases the contrast [10].
Jangsombatsiri and Porter [11] established a relationship between laser marking parameters and the quality obtained in DMCs marked on cold rolled carbon steel substrates AISI C1008/1010 and AISI C1095. The parameters were tested using factorial experiment planning. The quality of all DMCs was assessed according to ISO/IEC 16022:2006. The authors used SEM to check the condition of the substrates before and after cleaning, and EDS to determine the chemical composition of the substrates surface after marking. It was therefore concluded that the laser parameters should be carefully selected to avoid residues that may generate an unacceptable final quality grade. The pulse frequency and the radiation power directly influence the quality obtained in the marked DMCs.
In addition to metallic materials, polymeric materials and their nanocomposites have been increasingly used in the manufacture of aerospace and automotive parts due to their lightweight, high modulus, chemical resistance, and excellent wear resistance [12]. Within the production process, parts made from polymer materials must also be easily traceable to ensure the quality of the final product. Since laser marking is fast and effective for most materials used in production, it is necessary to understand the influence of laser parameters on the surfaces of these materials.
The nature of the laser-material interaction and the quality of the laser marking are highly dependent on both the material composition and the laser settings. Some of the polymers receive additives to facilitate laser marking and improve the quality of the codes, such as PP [13], ABS [14,15], and PA [16]. Some authors have studied the performance of laser marking on the surface of polymeric materials added by nanocomposites. Changes in surface morphology and structure of composite materials were observed by Raman spectroscopy and scanning electron microscopy techniques after using the laser marking process [17].
Czyzewski et al [13] studied laser marking on PP-LMA surface. They observed that the low value of radiation power can influence the quality of marked codes. It was also observed by SEM technique that the high additive percentage promotes a higher production of more laser beam spots on the mould surface than samples with lower additive content. They also observed that higher frequency and speed can influence the space between the dots. These irregularities can affect code quality.
Cheng et al [18] studied the carbonization mechanism of the laser marking process on PP/ATO@PI and PP/ATO composite surfaces. Using SEM, TEM, Raman and near-infrared (NIR) they observed after irradiation of a 1064 nm laser, the PP/ATO@PI composite promoting the best black laser-induced pattern comes from the local carbonisation of the polymer surface subject to the laser irradiation and a more efficient and environmentally friendly process.
Other polymers such as polycarbonate [19], polystyrene [12], TPU [20,21] and polyethene terephthalate [22,23] are susceptible to laser light at this wavelength and produce carbonised dark marks on their surface. The marking mechanism is the combination of blackening by carbonization and brightening by microbubbles. Normally, plastic materials are marked with a yttrium aluminium garnet (Nd: YAG) laser at a wavelength of 1064 nm [24].
Zhong et al. [20] observed that the loading amount of Bi2O3 added to TPU determined the marking contrast properties of the TPU/Bi2O3 composite materials. Bi2O3 dispersed in TPU absorbed the laser energy and heated the surrounding TPU matrix, leading to pyrolysis and carbonization of the TPU chains. Using optical microscope images, SEM, XPS, Raman spectroscopy, TGA, and XRD measurements they demonstrated that the Bi2O3 in the TPU can be partially reduced to black bismuth metal by carbonized materials resulting in. The marking contrast and visual appearance of the surface of the TPU/Bi2O3 composites.
In other studies, Cao et al. [21] observed that TPU/BiOCl composite samples showed high-contrast black markings on the surface after laser treatment, depending on the BiOCl loading and laser fluence in terms of visual and microscopic analysis. Using XPS, XRD, and Raman spectroscopy the results revealed that the laser-induced blackening on the composite surface entails laser absorption of the BiOCl particles and local heating of the surrounding TPU chains leading to the generation of amorphous black carbonised materials and the reduction of BiOCl into black bismuth metal contributing to the formation of the black-coloured marking on composite surfaces.
PBT is a versatile polymer that can be moulded by injection process and used as a variety of materials for selective laser sintering (SLS) [25,26]. This polymer is relevant for industrial use, such as automotive applications, due to its high mechanical properties, good thermal insulation, relatively low cost, and high production rates in geometrically complex parts. It can be used as a blend with a semi-crystalline or amorphous component, added by nanoparticles or even combined with glass fibre to be used as a laser-welded joint composite [27].
Some studies have shown the influence on the PBT material surface promoted by the laser marking using a Nd: YAG laser. Ng and Yeo [22,23] evaluated laser marking using a Nd: YAG laser on different laser marking speeds on different materials surfaces such as metallic materials, stainless steel and anodized aluminium and compared the results with the polymeric materials, PBT and phenol-formaldehyde. In terms of maximum colour difference values, anodized aluminium could be classified as low, PBT and stainless steel as medium and phenol formaldehyde as high. In the next study [23], they analyzed the influence of the luminosity ratio based on spectral reflectance measurements on the material surface. It was observed that the optimum speed was highest for PBT and lowest for stainless steel. The markings on phenol-formaldehyde and anodized aluminium had the highest and lowest visibility, respectively. In both studies, they concluded that the changes were related to the interaction of the laser with the material.
Ng and Yeo [28] investigated the use of spectrophotometers in the quantitative evaluation of four types of surfaces marked with an Nd: YAG laser. They found that in the polymeric materials, polybutylene tetraftalate (PBT) and phenol formaldehyde, the spectra had discernible changes in the average reflectance obtained because of different marking speeds but that the reflectance trace of the spectrum of the metallic materials was not efficiently distinguished due to the nature of the material. Compared to metallic materials, the physical integrity of polymeric materials is more susceptible to temperature changes.
Few studies have shown the changes promoted by the laser marking parameters and their influence on the surface of polymeric composite materials analyzed by the SEM technique. Therefore, the present work brings an outstanding contribution to this field. The main objective of the research is to analyse the surface aspects of Ultradur® B 4406 G6, PBT-GF30 FR (17) surface composed of Polybutadiene Terephthalate (PBT) and 30% glass fibre modified by the Nd: YAG lasers and the influence of laser marking parameters on the quality of the code produced. This material is widely produced by moulding injection of the instrumental panel back housing of motorcycles.

2. Materials and Methods

The Materials and Methods should be described with sufficient details to allow others to replicate and build on the published results. Please note that the publication of your manuscript implies that you must make all materials, data, computer code, and protocols associated with the publication available to readers. Please disclose at the submission stage any restrictions on the availability of materials or information. New methods and protocols should be described in detail while well-established methods can be briefly described and appropriately cited.
Research manuscripts reporting large datasets that are deposited in a publicly available database should specify where the data have been deposited and provide the relevant accession numbers. If the accession numbers have not yet been obtained at the time of submission, please state that they will be provided during review. They must be provided prior to publication.
Interventional studies involving animals or humans, and other studies that require ethical approval, must list the authority that provided approval and the corresponding ethical approval code.

2.1. Material

Figure 1 presents the exploded view of the instrumental panel of motorcycles. This panel is composed of an instrumentation system that is enclosed in a back housing made of a thermoplastic composite produced by moulding injection. The back housing material is composed of Polybutadiene Terephthalate (PBT) and 30% Glass fiber named for Ultradur® B 4406 G6, PBT-GF30 FR (17) [29].

2.2. Sample Analyses and Preparation before the Laser Marking Process

Next, Rofin Coherent®'s Visual Laser Marker (VLM) software was used to create exclusive software for the polished area (Figure 1. A), as this was the area where the DMC would be marked. Once the marking software was created, the need for cleaning the lens, extraction system and surrounding area was determined. Cleaning was then carried out using tissue and methanol-based liquid. The focal length was adjusted so that the distance from the marking head reference to the workpiece surface was 432 mm.
After adjusting the focal length, a 9 mm x 9 mm code was marked on a part to be set up and its size was confirmed using the Dino-Lite® - model AM3113T microscope, thus confirming the focal length. Next, a line was marked, and its thickness was measured with the same microscope, obtaining a value of 0.262 mm (Figure 2. a). Using the value obtained, the thickness of the line was set in the VLM software.
The contour line function was activated when marking the modules to obtain codes with well-defined squares (Figure 2. b). The dimensions of the modules were measured with the microscope used in the previous step and the contour offset - the correction factor applied to the marking of the contour line - was adjusted using the VLM software until a uniform distribution was obtained between the size of the marked module and the space around it. For DMC, a correction of 0.06mm was applied.

2.3. Laser Marking Equipment and Parameters

For the laser marking process, Rofin + Coherent® equipment was used. Inside this equipment, there is a fibre optic laser designated as Power Line F20. The laser power is 20 W, a providing wavelength of 1065 nm ± 5 nm produced by Ytterbium (Yb) diodes. The characteristics of the laser system used are pulsed operating mode, spot diameter 20 μm, pulse frequency (f) 20 - 80 kHz, marking speed (V) 0 - 20 000 mm/s, pass-by overlap (S) 0 – 100%, pulse length (τ) 4 - 200 ns, working area 120 x 120 mm2, and temperature range: 15-35°C.
Four laser marking parameters were considered in this work: Radiation Power (W), Pulse Frequency (Hz), Marking Speed (mm/s), and Pass overlap (%).
A complete factorial DoE was chosen taking into account the parameters recommended by the manufacturer and the variations followed the classification: i) higher value than recommended by the manufacturer, ii) equal value as recommended by the manufacturer, and iii) lower value than recommended by the manufacturer. The parameters are nominal radiation power, pulse frequency, marking speed, and pass overlap were 17 W, 25 kHz, 2000 mm/s and 15%, respectively. The tests’ parameters and the levels are established in Table 1.
The set of experiments to be performed was obtained with random parameter variation, in this case, 81 experiments (result obtained by increasing the number of levels to the number of factors - 34, 4 factors with 3 levels each). The map of experiments performed and discussed in this work is shown in Table 2.

2.4. Quality Assurance of Laser-Marked Codes

Using a REA® VeriCube Verifier, the laser-marked codes were accurately classified according to the characteristics of the codes. Each of the characteristics followed the criteria presented in ISO/IEC 29158:2020 [30], which can be A (4.0), B (3.0), C (2.0), D (1.0) or F (0.0), with A being the best and F being the worst. The overall quality class assigned to the code corresponds to the minimum classification of all these evaluated characteristics. All the marked codes, even those with a quality of F, could be decoded so that a positive decodability result was obtained for all the DMCs. Once all the codes had been analysed using the Verifier, the results were exported to MS Excel®, processed and correlated using Minitab® software.
Regarding the response variables, the characteristics considered relevant to qualify the DMC codes were: i) The ability of a code to be decoded by a decoding algorithm, such as a scanner = Decodability; ii) The difference in reflectance value between the light and dark elements, and between the quiet zone and the peripheral elements = Cell Contrast (CC); iii) Reflection uniformity of the light and dark elements of the code = Cell Modulation (CM); iv) Damage present in the Finder Pattern, Timing Pattern, Alignment Pattern and the Quite Zone = Fixed Pattern Damage (FPD); v) No uniformity between the X and Y axis of the code = Axial Non-Uniformity (ANU); and vi) Module positioning deviation relative to the theoretical position = Grid Non-Uniformity (GNU).

2.5. Code Surface Analyses by SEM

After the laser marking process, samples were cut on the polished area using a milling cutter coupled to an OPTIMUM® - model OPTI drill DX 15V bench-top drilling and milling machine.
For surface analyses by SEM, samples were coated with a thin gold film, and their surface was analyzed by SEM technique using a HITACHI® SEM - FlexSEM 1000 model. Images were obtained at 50 μm and 100 μm in two distinct areas of the codes as shown in the figure (centre and corner). Using a Bruker® Quantax 80 EDS system for this model, a sample was chemically analyzed in an area without and with laser marking.

3. Results and Discussion

3.1. Quality Analysis of the Codes

The quality of the codes was analyzed following the ISO/IEC 29158:2020 standard [31], with the use of a verifier for this purpose, as previously mentioned. Figure 3 shows two examples of DMC analyses of quality grades A and F, respectively, obtained by the code verifier. As mentioned above, the overall quality class assigned to a code is the minimum of all the features evaluated.
In Figure 3. a, sample VIII, a DMC is presented with quality A (4.0) in all its features, therefore its overall quality rating is A (4.0). In contrast, Figure 3. b, Sample V, shows a DMC with an overall quality rating of F (0.0) because it has a reflectance value of 4% against a minimum requirement of 5%, and therefore it is rated F (0.0) does not reach the minimum required value. Even though Cell Modulation (CM) is rated 2.0 (C), Fixed Pattern Damage (FPD) is rated 3.0 (B) and the remaining features are rated 4.0 (A), the overall quality grade assigned to this code is F (0.0), as it is limited to the lowest ranking of all the characteristics that have been evaluated. All codes, even those with quality F, were decodable, so a positive decodability result was obtained for all DMCs.
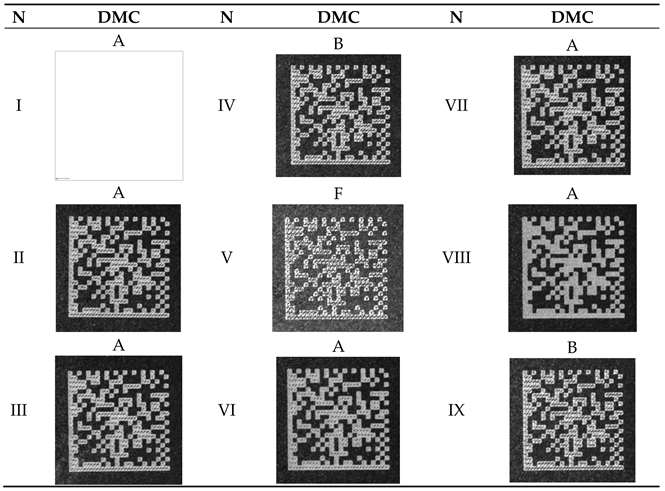
Table 3 presents the analyses of DMC codes obtained through the code verifier equipment. These samples represent the best set of code quality classes obtained from the laser-marking parameters. The overall quality class assigned to a code corresponds to the minimum of all the features evaluated according to the parameters presented in section 2.4.
The difference between the two results is due to the choice of laser marking parameters. The marking of sample VIII was acquired using values of radiance, frequency and pass overlap higher than the nominal values indicated by the manufacturer (radiation power: 19 W, pulse frequency: 30 kHz, and pass overlap: 30%). Only the marking speed was lower than the nominal value recommended by the manufacturer (marking speed: 1000 mm/s). At lower speeds, as in the case of sample VIII, the laser interacts with the material for longer and modifies its aspect more. At higher speeds (marking speed: 3000 mm/s), as in the case of sample V, as the material is exposed for less time, it changes less and produces a lower-quality code.
Samples IV and IX were of quality B (3.0) according to the criteria of ISO/IEC 29158:2020 [30]. These samples were obtained with the same values of radiance (17 W) and pass overlap (15%) as the nominal values specified by the manufacturer, the only values modified being the pulse frequency of 25 kHz and 15 kHz and the marking speed of 3000 and 2000 mm/s respectively. It should be noted that increasing the marking speed reduces the quality of the code because the laser interacts with the material for a shorter period, and if the frequency is lower than that recommended by the manufacturer, the number of oscillations produced by the electric and magnetic fields during the one-second interval is lower, so the laser interacts less with the material.
Therefore, the lower the radiation power and pulse frequency and the higher the marking speed, the more faded, the resulting marking and therefore the worse the code quality. Regarding the pass overlap, it has no significant impact on the overall rating assigned to the code quality, as there are codes with low pass overlap and good ratings. However, this marking parameter combined with others allows more filling of the code, improving its appearance and robustness.

3.2. Analysis of the marked surface on samples

Figure 4 presents the back housing part of the motorcycle component. Region A is the polished area where the laser marking process is done. Regions A.1, A.2, A 3 and A.4 are the pressure points of the injection moulding process. Due to the injection moulding process to manufacture the back housing, the presence of stains in the polished area surface is inherent to the process used, and usually appears in the same places and cannot be removed by the supplier, reducing the quality of the codes during the laser marking process.
Also in Figure 4, it can be seen the polished area is surrounded by a white square and four injection points are indicated by high irregular spots. In a magnified image, the injection defects can be observed divided into four regions, with and without defects. This area is near two injection points A.1 and A.3. Still in Figure 4, Regions 1 and 4 show dark stains, in the corner near the A.1 and A.3 points. These stains are caused by the way the cavity is filled by the jetting stream, known as secondary flow in cavity corners. The melt flows out from the narrow gate into the wide cavity, when the pressure is increased with the injection time, the waves disappear, but they are still visible in the part’s corners [31], as shown in Figures 4.A.1 and 4.A.3. Region 3 presents a defect known as weld mark, represented by a dark line. This line is formed due to the confluence of two separate streams of melting polymer with relatively low front temperatures [32]. Then, Region 2 is the most suitable position for marking the DMC, because no defects are visible at this magnification.
After the laser marking tests, the marked surfaces of several samples were analysed in detail by SEM techniques. Only DMCs were selected as references. Since pass overlap is not a parameter that significantly affects the quality of the marked codes, not all samples were submitted for analysis, but only 30 with the following characteristics: i) samples at the nominal pass overlap level, but with radiation power, pulse frequency and marking speed at the minimum, nominal and maximum levels - a total of 27 samples; ii) the sample with the best or the worst quality obtained by the code verifier; and iii) a sample without laser marking.
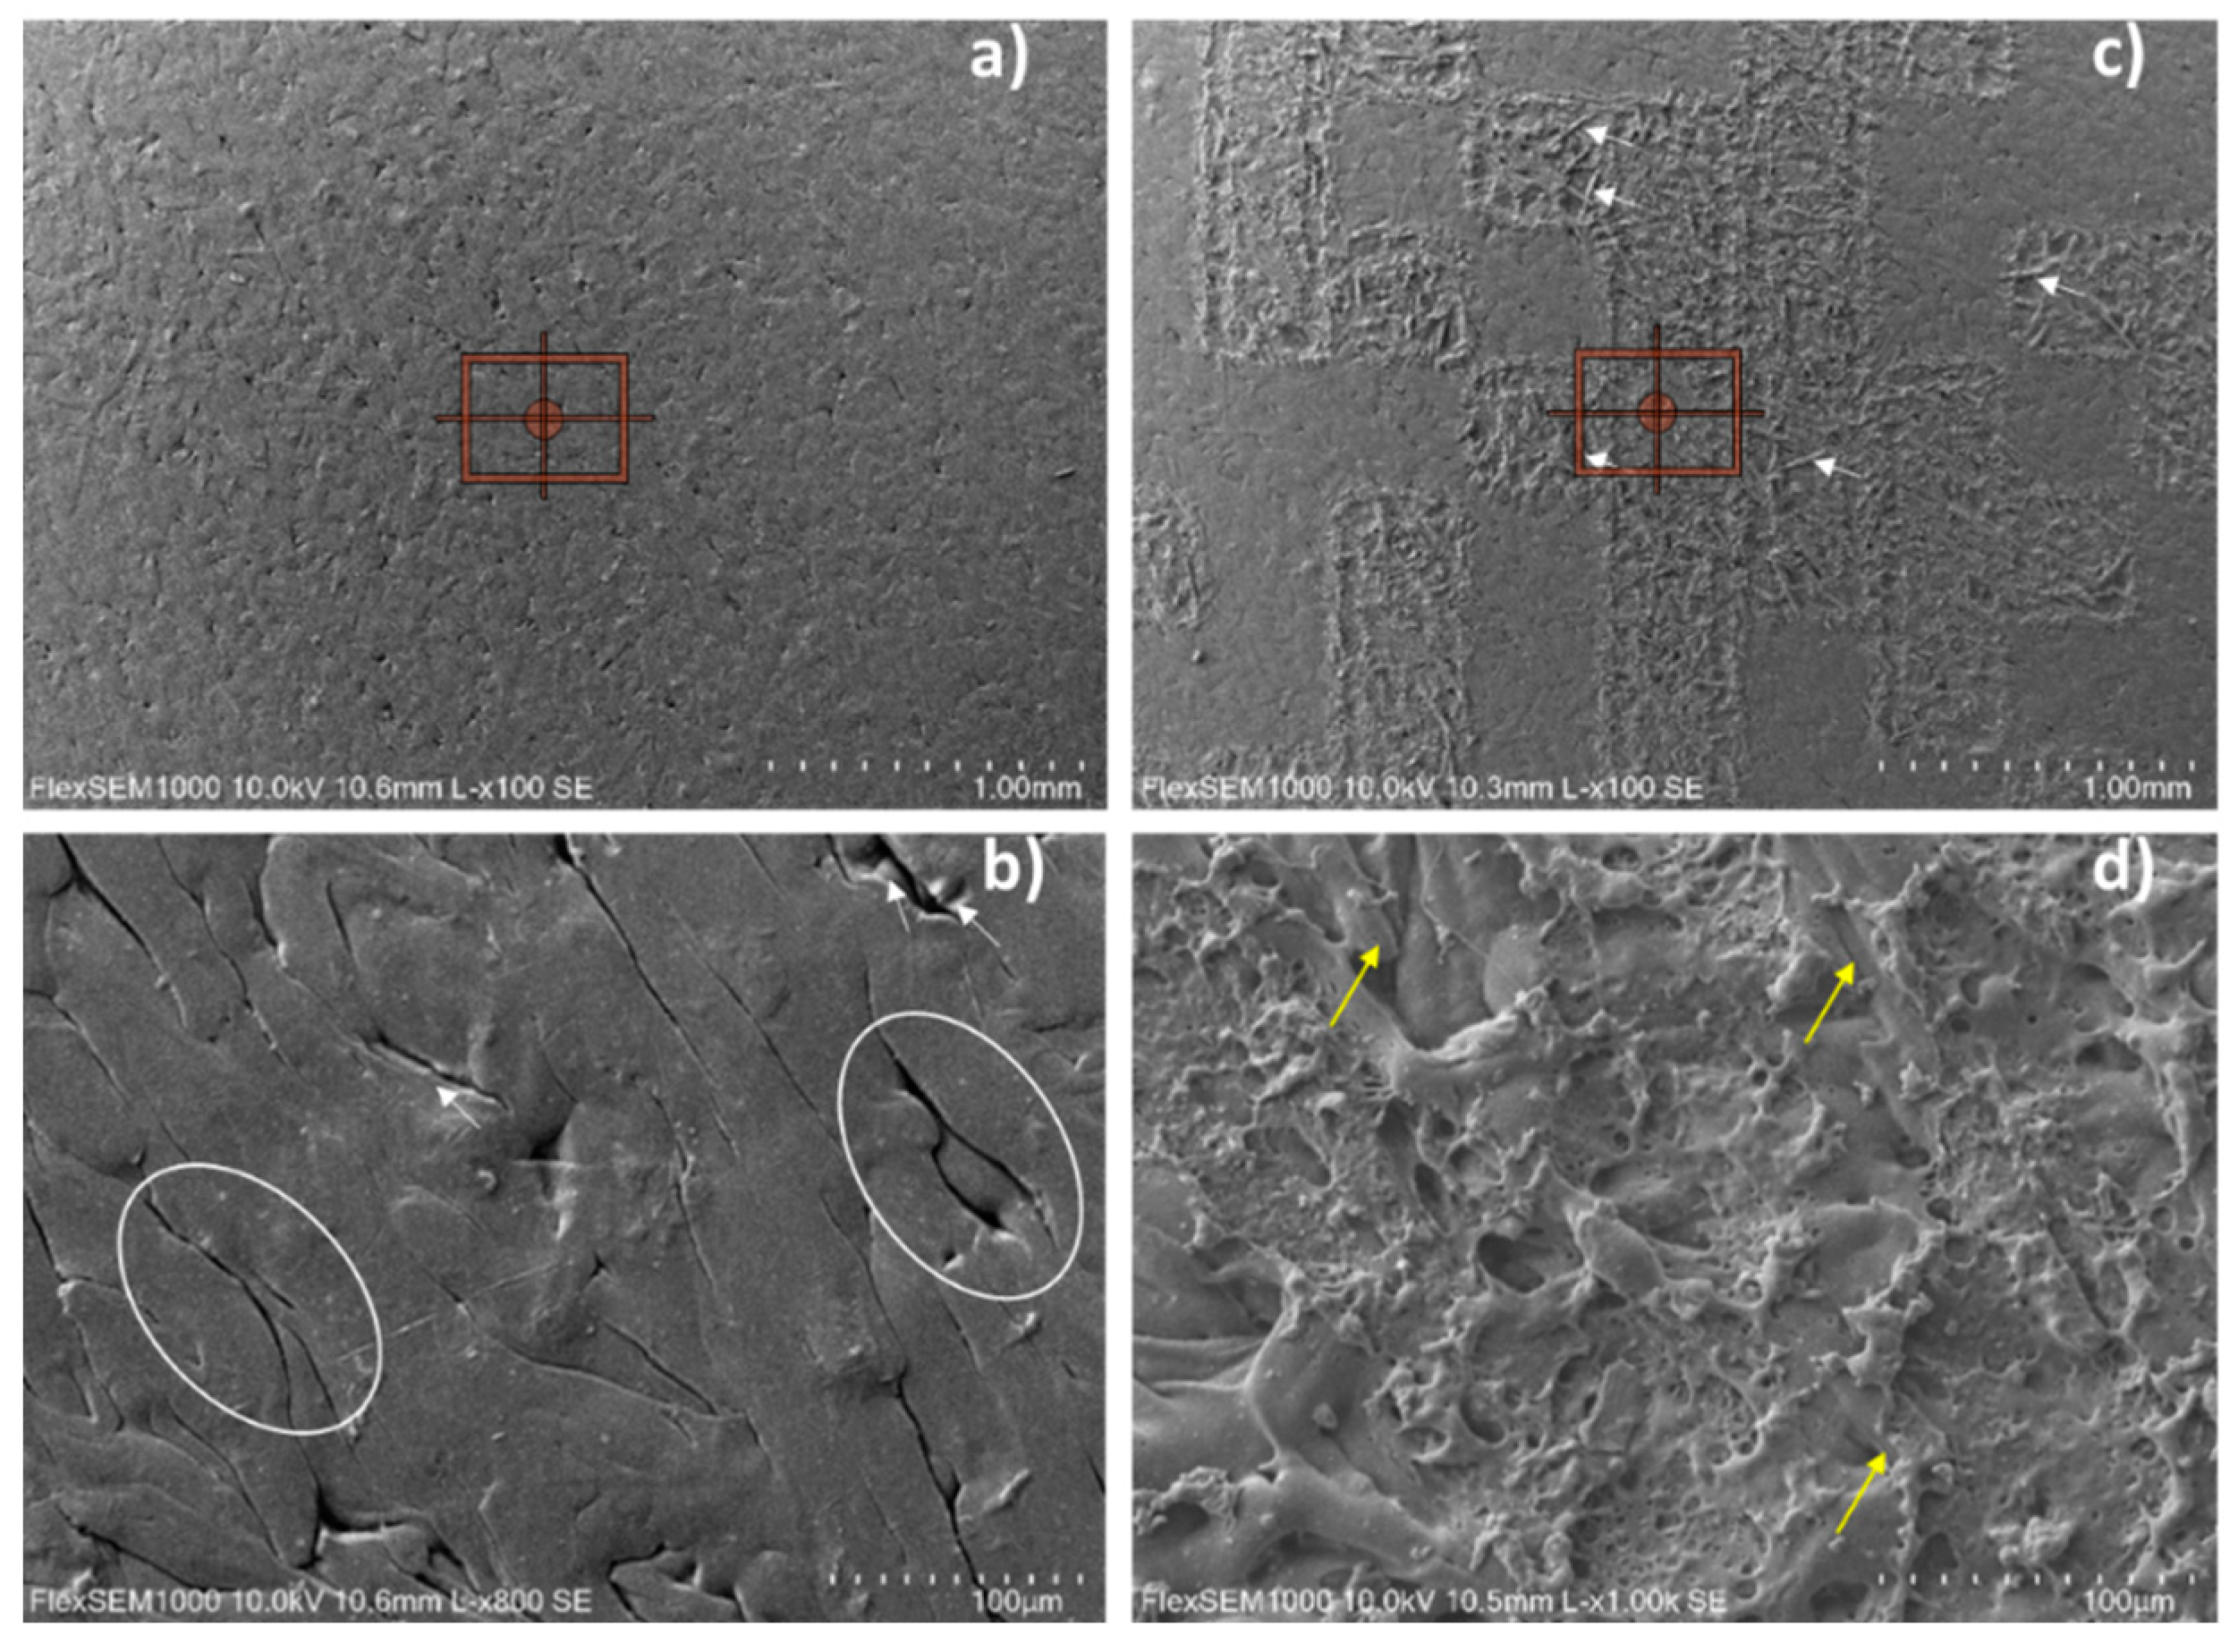
The first step was to analyse the material surface of a sample without laser marking, Figure 5. a and 5. b, and compare it with a sample with laser marking 5.c and 5.d.
In Figure 5. a, it can be seen that the unmarked sample has a more homogeneous surface than the marked sample (Figure 5. c), which is uneven due to the passage of the laser beam. When the unmarked sample surface image is magnified 1kx (Figure 5. b), it is possible to observe some gaps in polymeric mass promoted by pellets stretching during the injection process. These defects could be promoted by two factors that typically occur under high-speed injection moulding, the mould temperature, and/or the particles on filled polymer materials. According to Gim and Turng [33], during the filling and packing stages, the reinforcing fibres and particles restrict the flow of the matrix polymer material. The matrix polymer material cannot contact the mould surface sufficiently, presenting irregular whitish marks on the surface. Combined with the mould temperature, the melt polymer melt will cool abruptly once it contacts the cold cavity surface during filling and its fluidity will be significantly reduced [34]. This promotes gaps in the polymeric matrix (white circles, Figure 5. b) and exposes the glass fibres (yellow arrows, Figure 5.d).
The sample surface after the laser marking process is represented in Figure 5. c and 5.d. It can be seen that after the code production, some glass fibres are exposed, represented by needle aspects indicated by white arrows in Figure 5. c. Figure 5.d is a laser marking region magnified 1000x. In those images, it can be seen the rough surface due to the melting of the polymeric matrix, represented by some surface aspects such as depressed holes and irregular protrusions [34]. The melting of the polymeric matrix induced by the laser action in contact with the surface causes the exposure of the short-glass fibres used as reinforcement in this composite material, indicated by the yellow arrows (Figure 5.d).

3.3. Effect of Different Values of Radiation Power

To understand the influence of radiation power value on the laser marking process, samples with radiation power lower than the manufacturer's requirements (Pi = 15 W, Sample I), radiation power equal to the manufacturer's requirements (Pn = 17 W, Sample VII), and radiation power higher than manufacturer's requirement (Ps = 19 W, Sample II) were analysed by SEM technique and compared.
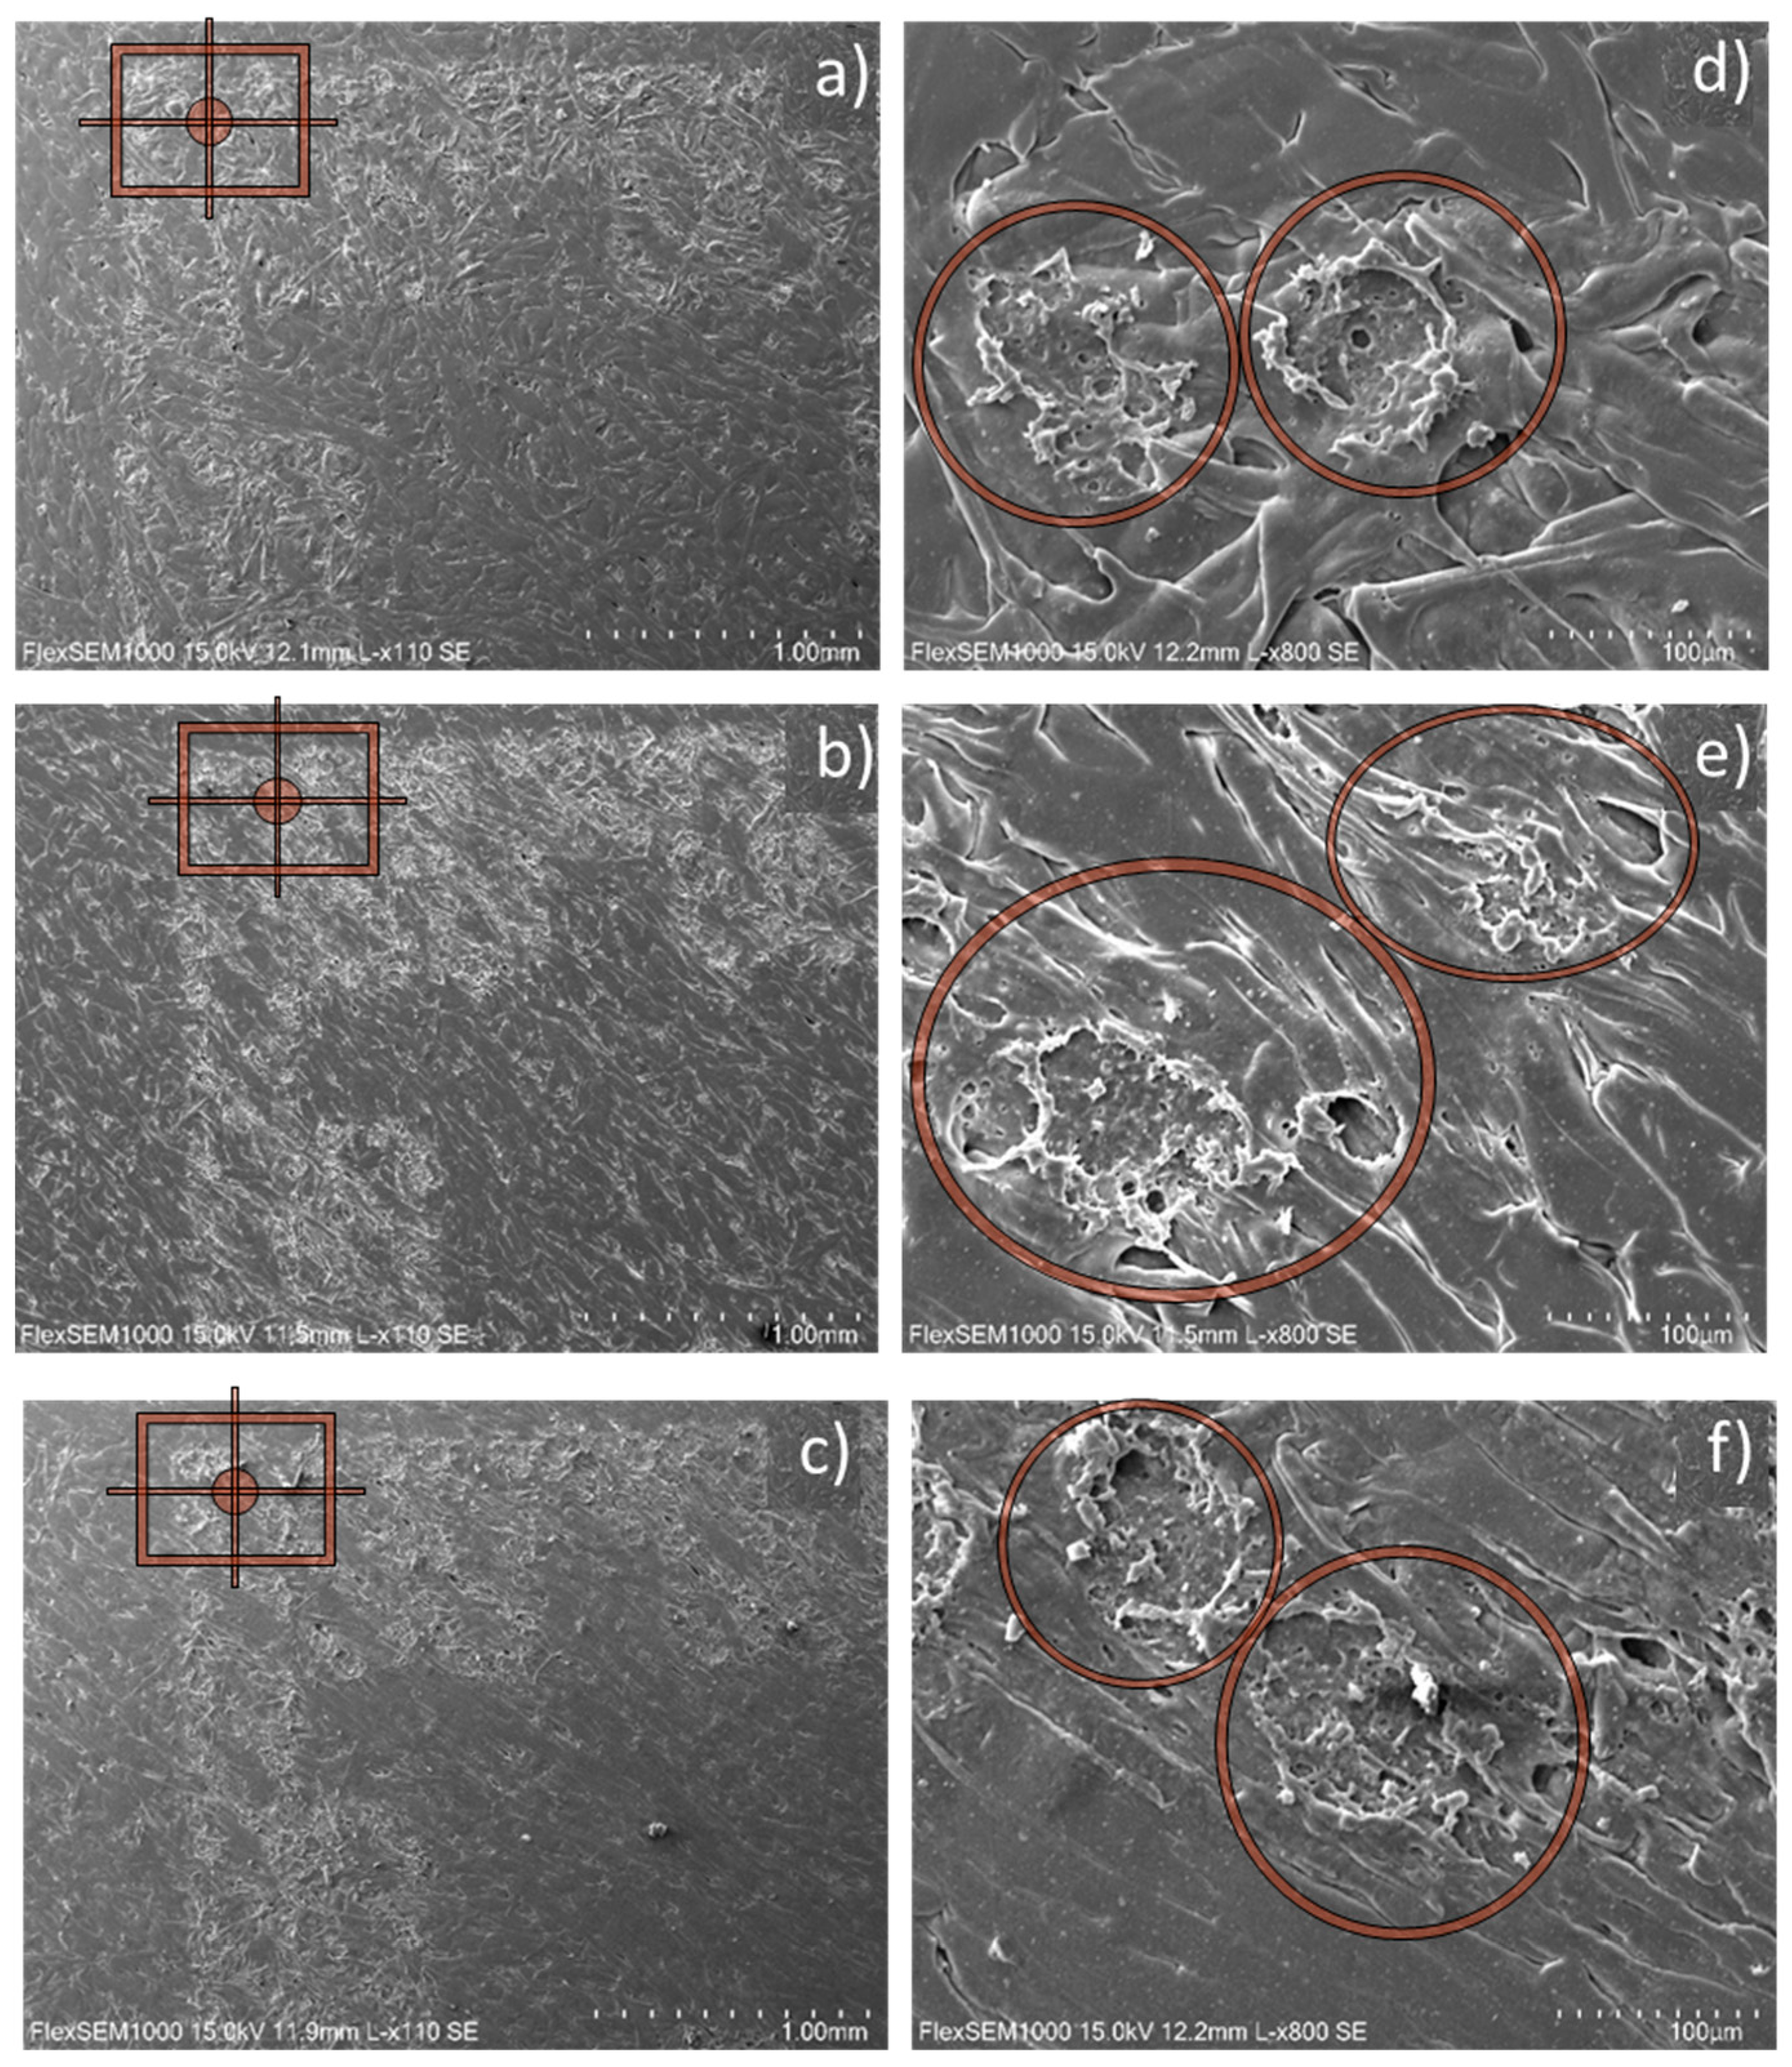
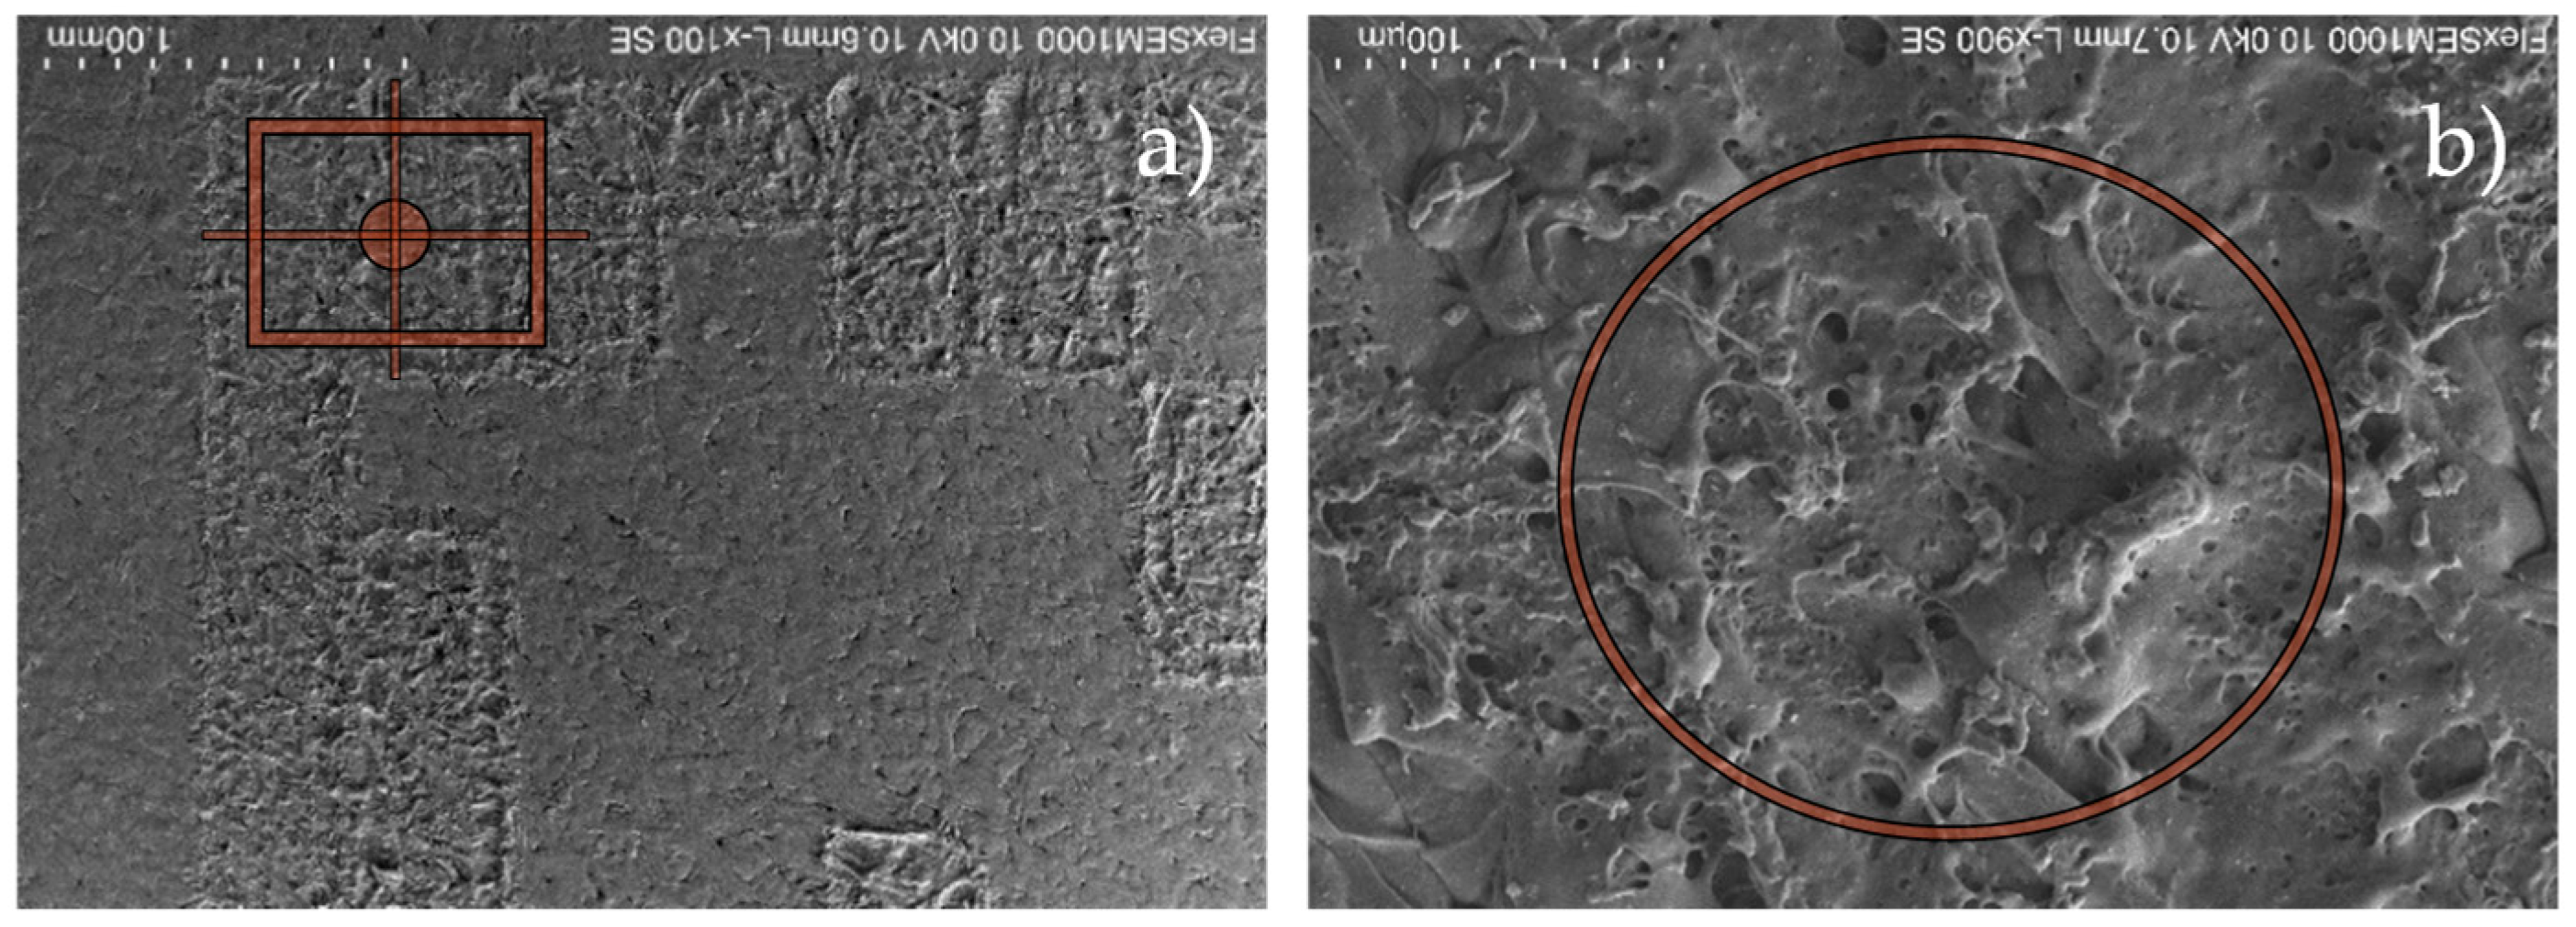
Figure 6 shows the images taken at 1 mm and 100 μm, respectively, with a radiation power lower, equal to and higher than the manufacturer's recommendations (Pi, Pn and Ps). At lower magnifications, Figures 6. a, 6. b, 6. c, at 1 mm, part of the DMC code marking is observed. The area marked with the red square is analysed at higher magnifications, Figures 6.d, 6. e, 6. f, at 100 μm, is possible to observe the interaction of the laser beam markings with the surface.
At lower radiation power (Pi), Figure 6. a, the difference between the marked and unmarked surface area is not very evident as the power applied is not high enough to generate significant changes, resulting in a faded marking. At higher magnifications, at 100 μm, Figure 6.d, marks from the laser beam can be observed, but there are not many changes in the vicinity of the marked area.
When the radiation power is changed to the power level equal to that recommended by the manufacturer (Pn) (Figure 6. b), the difference between the marked and unmarked surface area is clearer than when the radiation power is lower than the manufacturer's recommended level (Pi) because the applied power is higher and produces more significant changes. At higher magnification, Figure 6. e, at 100 μm, it is also possible to observe scattered marks from the laser beam in the vicinity of the marked area and micro-holes.
The radiation power was modified to a power level higher than that recommended by the manufacturer (Ps). In Figures 6. c and 6. f, the images for this power level are presented, at 1 mm and 100 μm, respectively. The radiation power applied is higher than the power recommended by the manufacturer (Pn) resulting in a more evident marking. At higher magnifications, at 100 μm, it can be seen that a more laser-attacked surface has formed, indicated by the presence of flaky regions and deep holes.
Due to the differences in the thermal properties of the deformed and undeformed regions of the polymer matrix [35], the thermal energy released during the laser marking process reaches the glass transition temperature for amorphous polymers and the crystallite melting temperature for semi-crystalline polymers, molecular relaxation increases, which melted the material, leading to changes in the surface topography and defects such as stress-associated dislocations [36], and blurred characters would be seen through surface lift and memory effect [37]. A large number of dislocations were observed, evidenced by holes in areas between the fused zone (marked area) in the polymer matrix. These defects can form peaks and valleys, creating occluded areas that act as cracks [34,38].
For some polymeric matrices, some components are added to promote physical and chemical modification. In the case of Acrylonitrile Butadiene and Styrene / Organically Modified Montmorillonite (ABS/OMMT) composite, the laser marking process generates deep holes with irregular internal structures due to the melting, pyrolysis, and carbonization of the ABS matrix at the local due to the high temperature induced by the presence of OMMT particles after laser marking process [39].
This phenomenon occurs because to obtain a good response during the laser marking parameters, chemical components are added polymer matrix. These additives can absorb the laser light, convert it into thermal energy and modify the neighborhood in which they are inserted. According to the material safety data sheet of the material analyzed in this work, the Ultradur® B 4406 G6, PBT-GF30 FR(17) (BASF) [29] is composed of 49% of Polybutadiene Terephthalate (PBT) and 30% of Glass fibre, 1% of carbon black, 5.5% of Antimony trioxide (Sb2O3) and 13% Halogen 13% (fire retardant). In this case, the PBT matrix only has a physical phenomenon, such as melting, that occurs during the laser marking process.
To understand the influence of pulse frequency on the laser marking surface, parameters with lower values (Fi = 15 kHz), equal to (Fn = 25 kHz), higher than the manufacturer's requirement (Fs = 30 kHz) were tested. Samples IX, VII and III were analysed and compared by SEM technique.
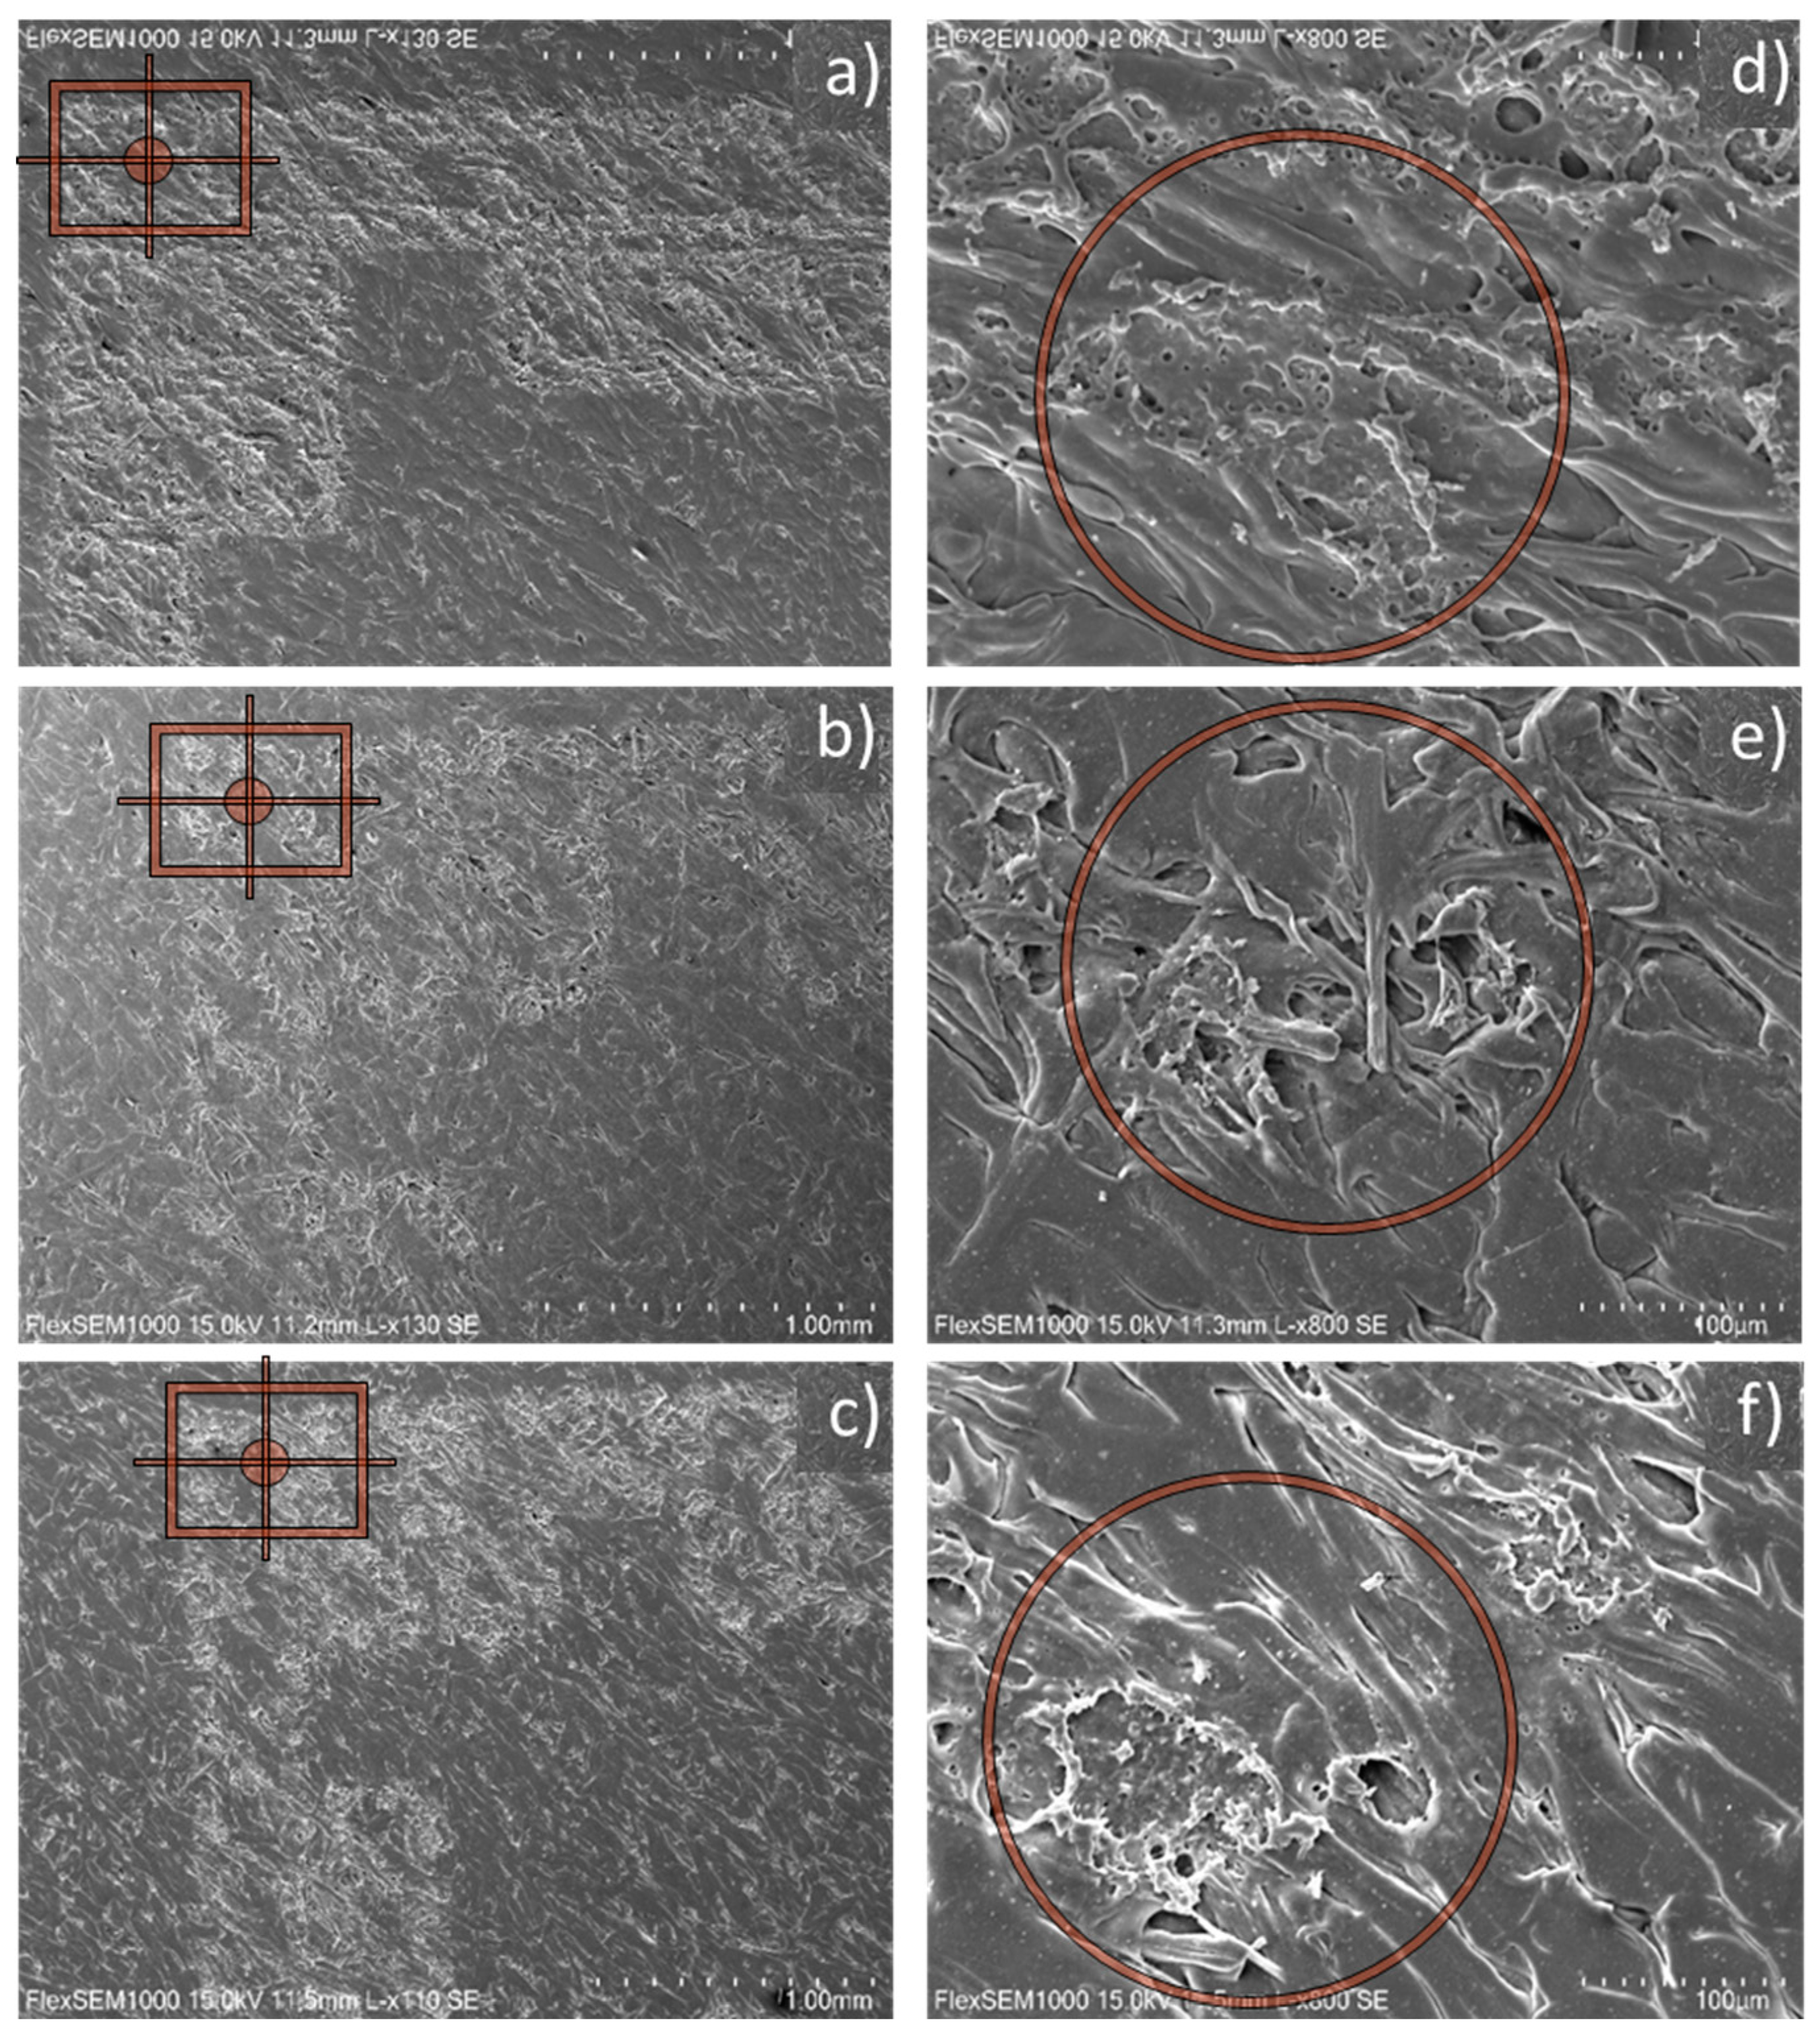
Figure 7 shows the images taken at 1 mm and 100 μm, respectively, with a pulse frequency lower, equal and higher than the manufacturer's recommendations (Fi, Fn and Fs). At lower magnifications, Figures 7. a, 7. b, and 7. c, at 1 mm, part of the DMC code marking was observed. The area marked with the red square was analysed at higher magnifications, Figures 7.d, 7. e, and 7. f, at 100 μm making it possible to observe the interaction of the laser beam markings with the surface.
Figures 7.a. and 7.d. show the images taken with a pulse frequency lower than that recommended by the manufacturer (Fi), at 1 mm and 100 μm, respectively. The difference between the marked and unmarked area is not very clear as the applied pulse frequency is not high enough to obtain a continuous marking. At higher magnifications, at 100 μm, it is possible to observe the laser beam marking a homogeneous surface, indicated by the presence of micro-holes and a deformed polymer matrix caused by the melting process promoted by the local heating caused by the energy absorbed from the laser by the additives [29,39].
If the pulse frequency is changed to a level equal to that recommended by the manufacturer (Fn), the laser marks on the sample surface (Figure 7. b) are more visible compared to the pulse frequency level lower than that recommended by the manufacturer (Fi). The higher pulse frequency applied makes it possible to obtain a more continuous marking on the sample surface. In Figure 7. e it is possible to observe, at higher magnifications, the laser marks that appear deeper and more continuous compared to the previous scenario, some exposed glass fibres can also be seen (yellow arrows).
After changing the pulse frequency to a level higher than the manufacturer's specifications (Fs), it was possible to observe a more pronounced difference between the marked and unmarked surface (Figures 7. c and 7. f). Figure 7. c shows a clearer and more continuous marking compared to Figure 7. b. At higher magnifications it is possible to observe a deeper marking, bigger holes, and more exposed fibres (Figure 7. f) than in the previous case (Figure 7. e), resulting from a more sequential laser beam.
According to Man et al [40], the amount of matrix removed depends on the total number of pulses. As the number of laser pulses was increased, the glass fibres were gradually exposed. However, as the energy density was increased, the damage to the glass fibre gradually became apparent, as shown by the thermally distorted fibres.
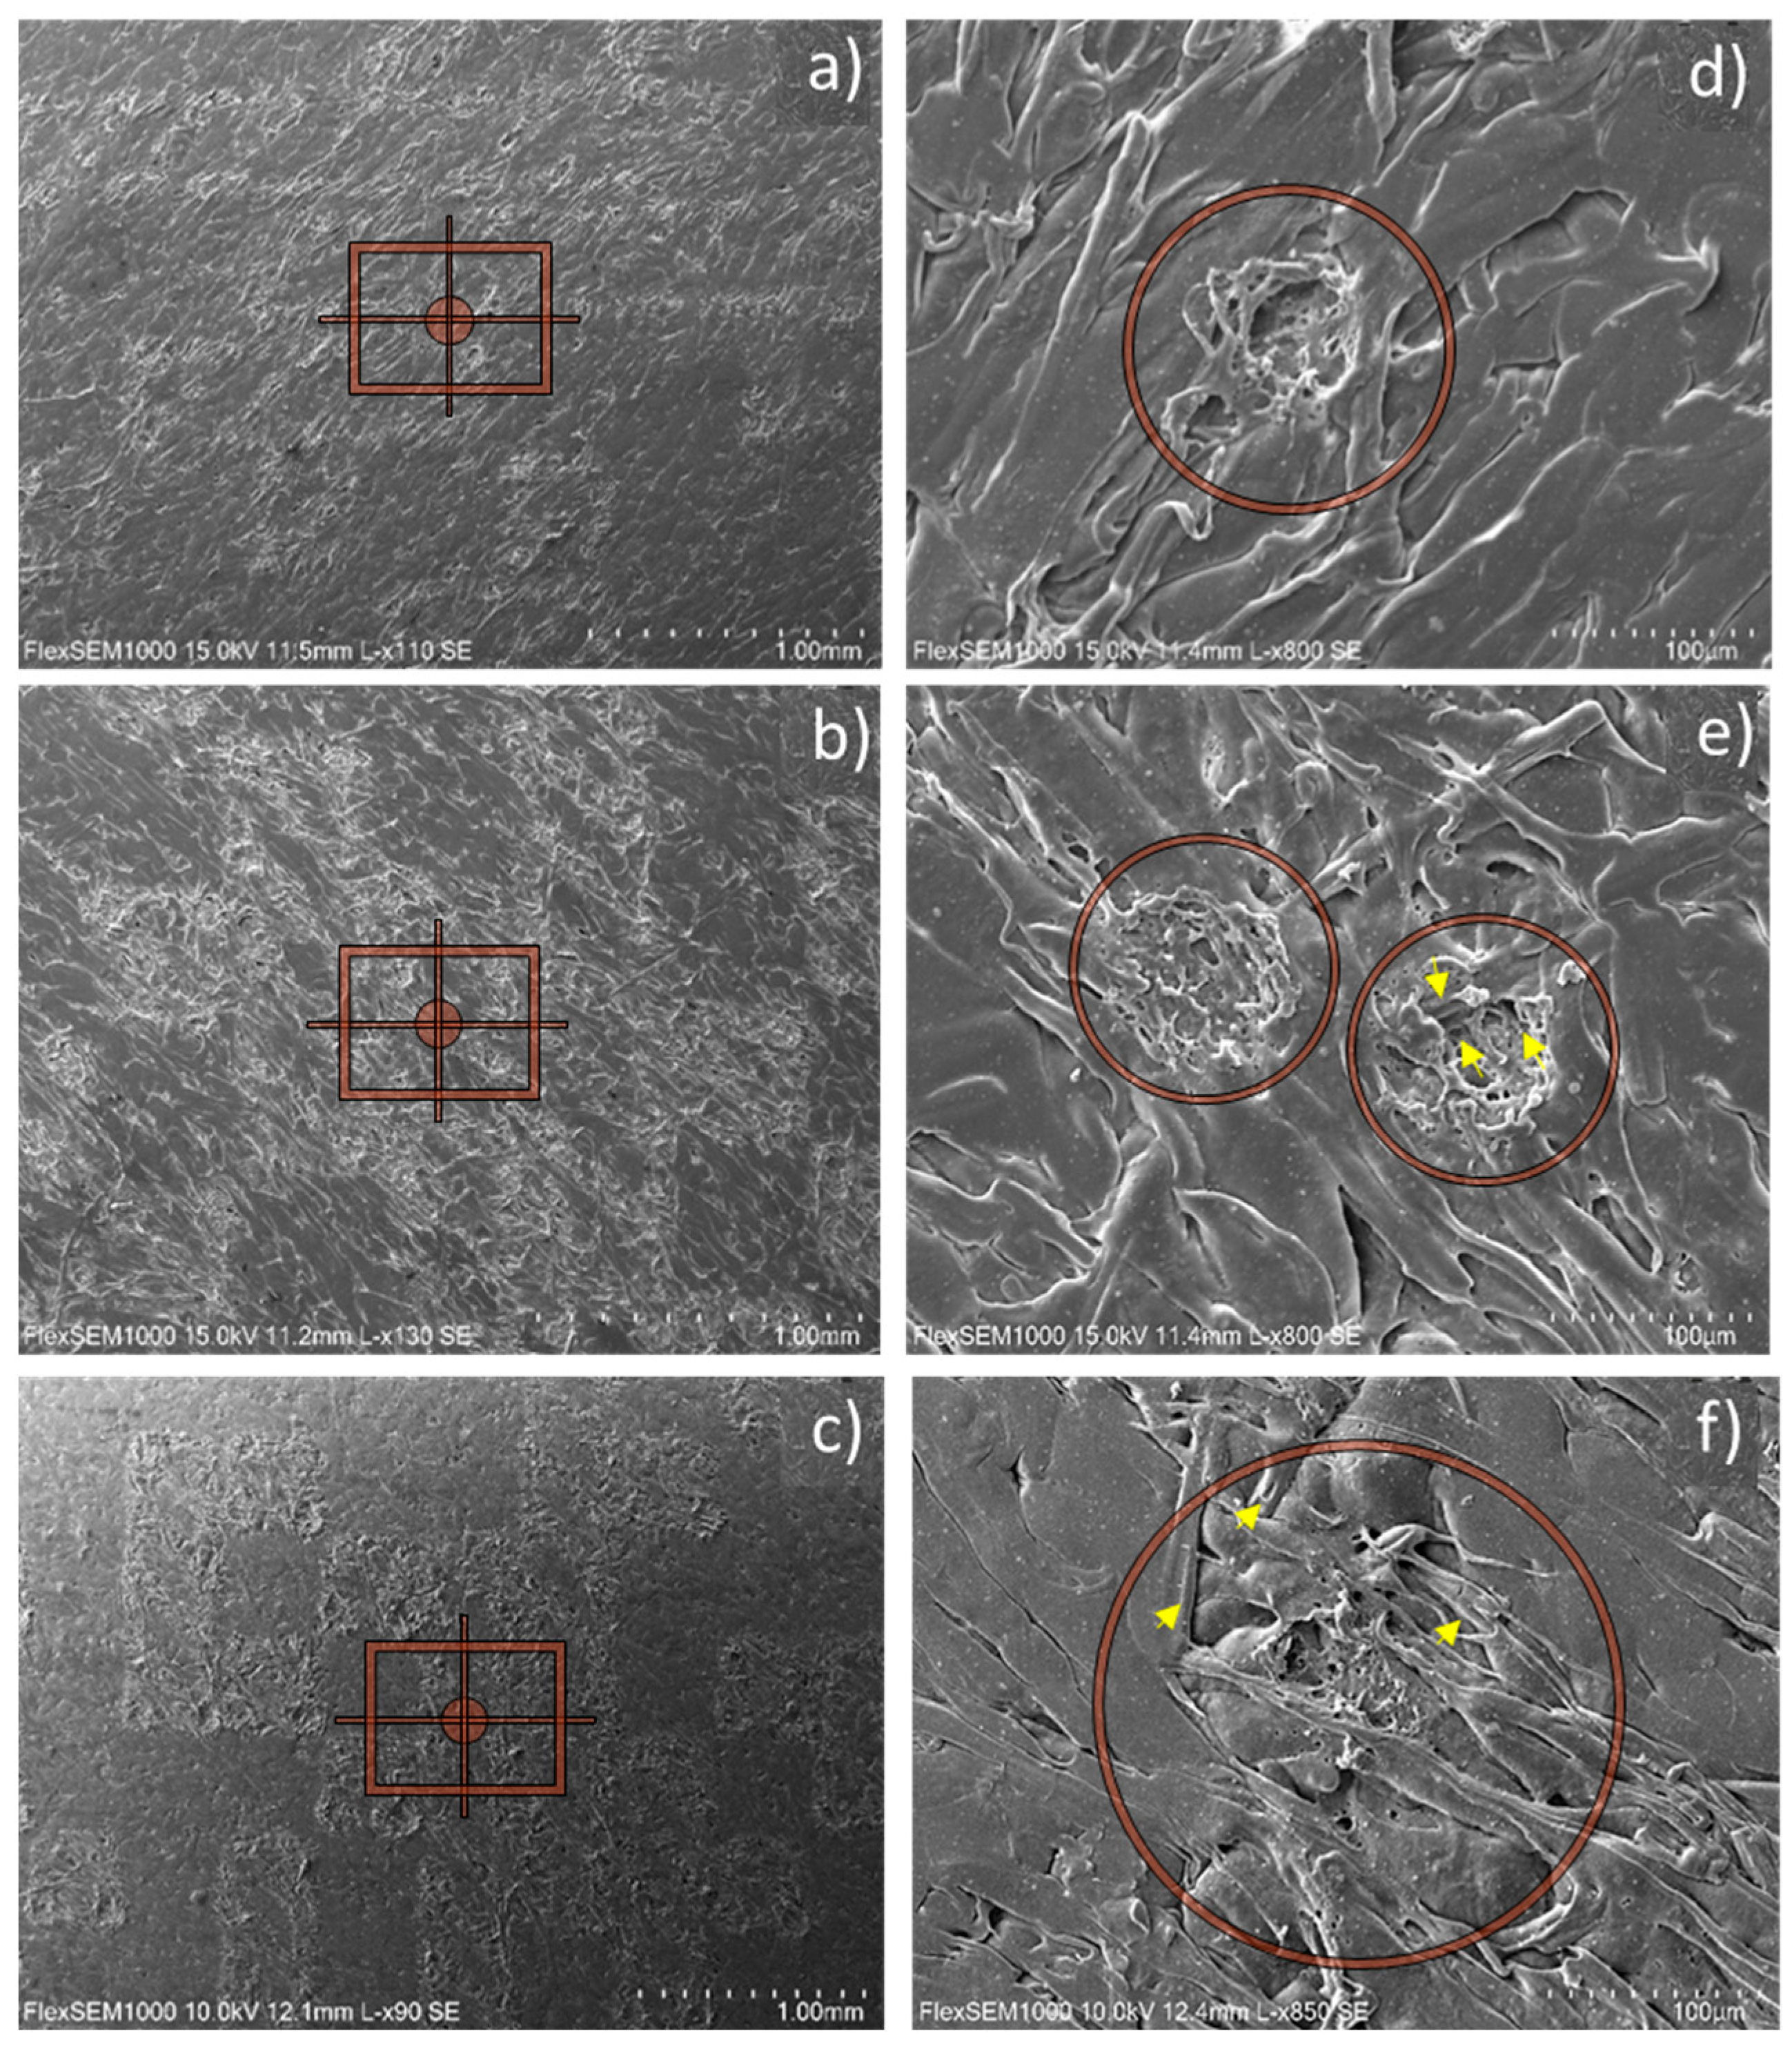
Figure 8 shows the images obtained using the SEM technique with a marking speed lower than that recommended by the manufacturer (Vi = 1000 mm/s, sample VI), equal to that recommended by the manufacturer (Vn = 2000 mm/s, sample VII) and higher than that recommended by the manufacturer (Vs = 3000 mm/s, sample IV), at 1 mm and 100 μm, respectively.
In Figure 8. a and 8.d, a marking speed lower than that recommended by the manufacturer (Vi) was used. The difference between the marked and unmarked surface area is quite obvious, as the selected speed is low, resulting in a longer laser interaction time with the part, causing significant surface changes. At higher magnifications, at 100 μm, some black points due to polymeric matrix pyrolysis on a continuous marking surface can be observed. This phenomenon is promoted by the additives which are often dispersed in the polymer matrix. They can absorb the laser energy and locally heat the surrounding polymer chains, leading to black carbonized materials revealing some patterns during the laser marking process [41].
It is observed that after changing the marking speed to the speed level equal to that recommended by the manufacturer (Vn) (Figure 8. b and 8. e), the difference between the marked and unmarked surface area is not as clear compared to the marking speed level lower than that recommended by the manufacturer (Vi), because the higher the speed is selected the shorter the laser interaction time is, generating less significant surface changes, presenting discontinuous surface marking, which can be observed in Figure 8.e. but it can be seen next to non-uniform holes formed by ablation process [42].
The image obtained from a higher marking speed than recommended by the manufacturer (Vs) is shown in Figures 8. c and 8. f. In the images obtained from samples subjected to this speed level, it is not possible to observe the difference between the marked and unmarked surface area. The marking speed is higher than the manufacturer's recommendation, resulting in a surface appearance with little change and a faded mark. At higher magnifications, Figure 8. f, it is possible to observe that the material has a surface with a poor attack by the laser.
Figure 9 presents the surface of sample VIII after the laser marking process, which contains the code with the best quality of the set samples. In this sample, the difference between the marked and unmarked surface area can be observed. The surface resulting from the combination of parameters turns out to be more attacked by the laser and with continuous marking presenting a lot of deformed regions and black points that can be observed in Figure 9. b.
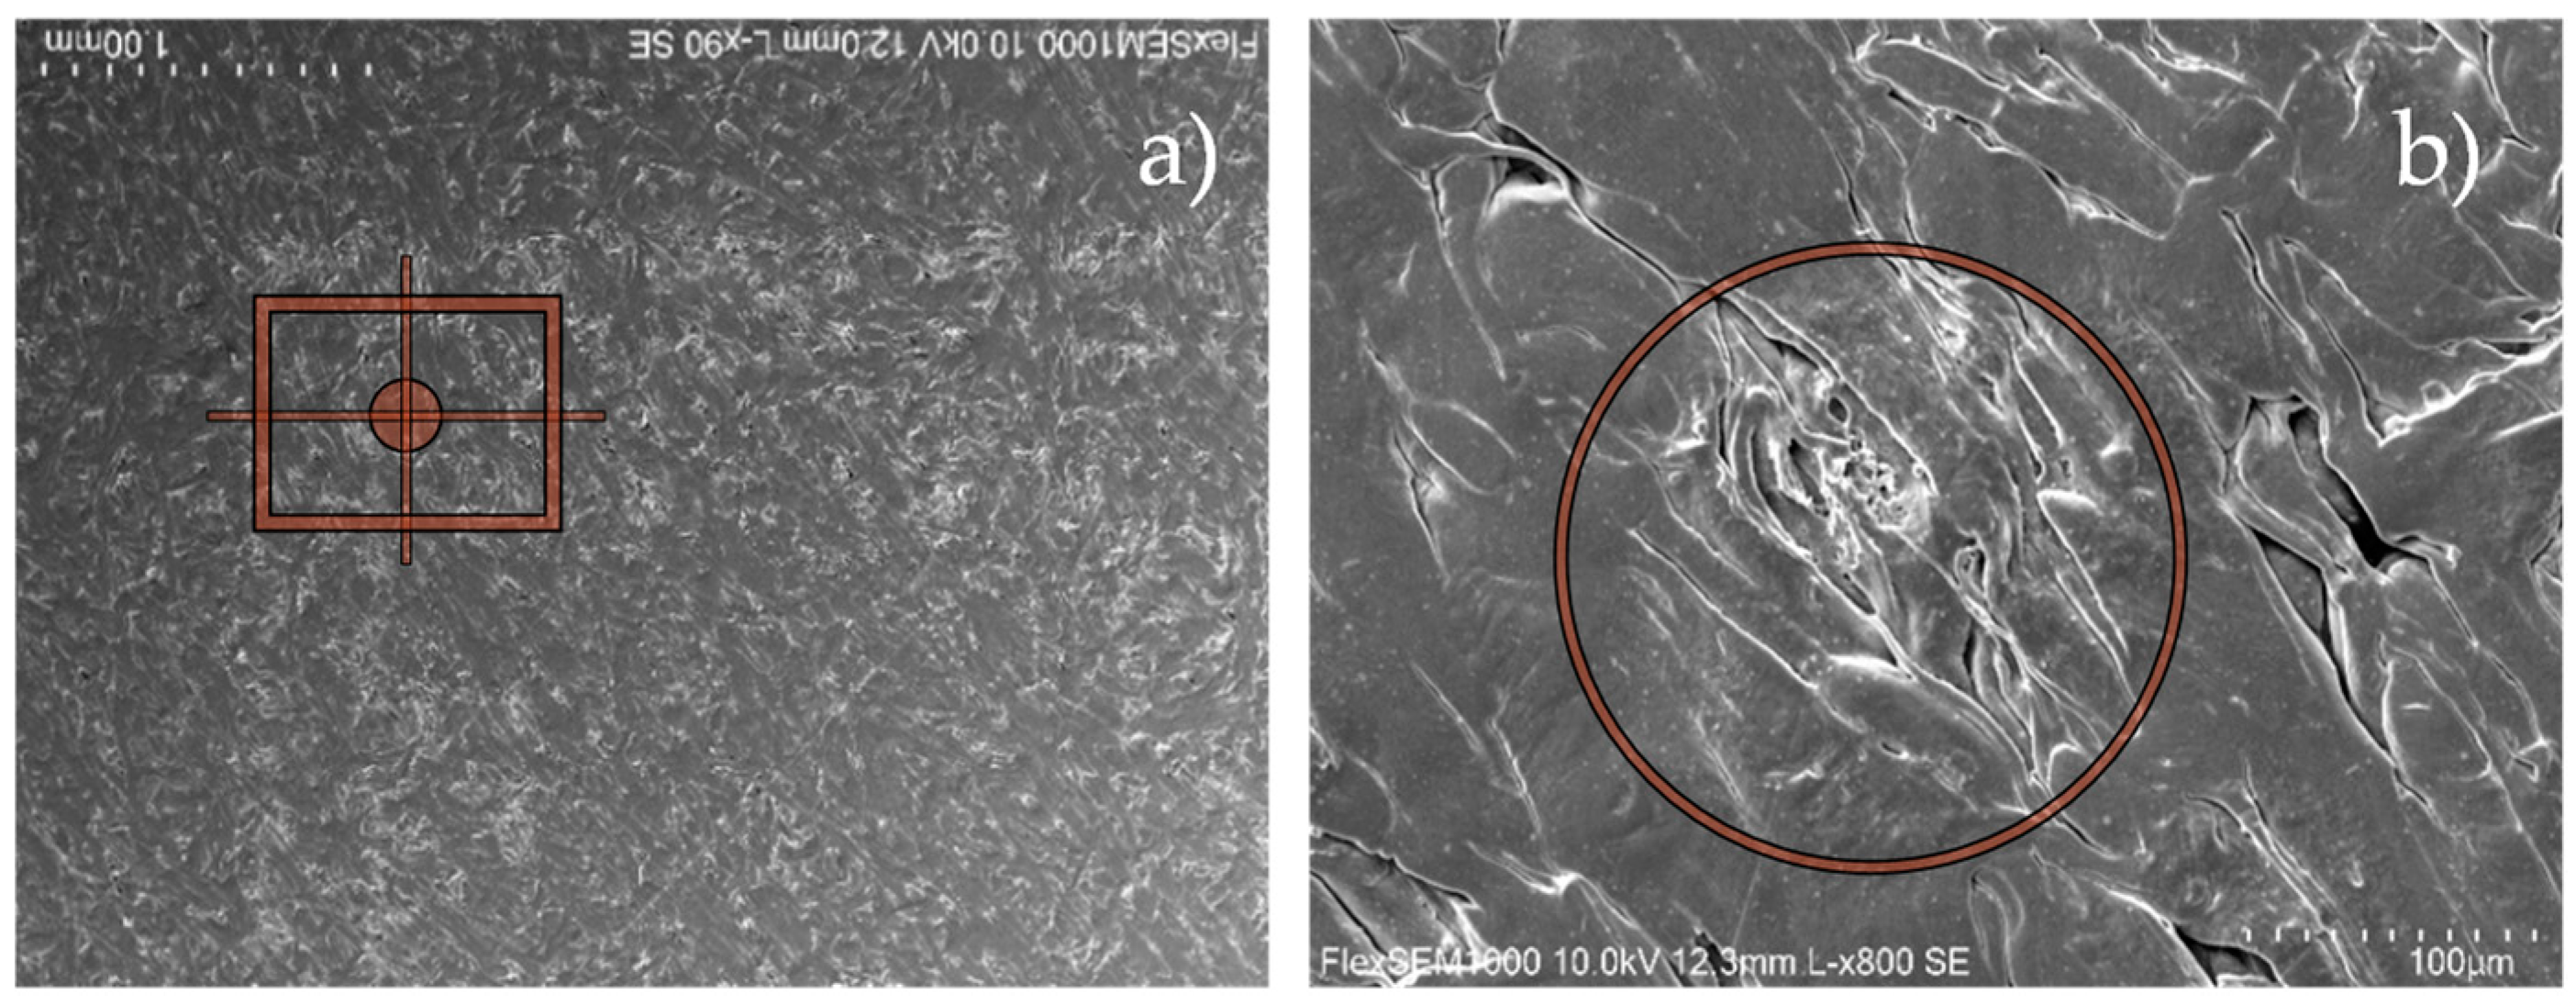
Comparing the surface of sample VIII (Figure 9) with sample V (Figure 10) using the SEM technique, it can be observed that as the pulse frequency, radiation power and pass overlap are increased to levels higher than those recommended by the manufacturer, and the marking speed set for levels below the recommendation, the surface is more attacked and the marking becomes more visible and continuous, due to greater interaction of the laser with the material.
In contrast, in Figure 10 the surface of sample V can be seen, which contains the code that has the worst quality of all sets of samples. In this sample, it is not possible to see the difference between the marked and unmarked surface area. The combination of parameters results in a surface appearance with little change and a faded marking. In Figure 10. b, at higher magnification, it can be seen that the material has an almost homogeneous surface with little deformation on the PBT matrix surface.

3.4. Analysis of Chemical Properties after the Laser Marking Process

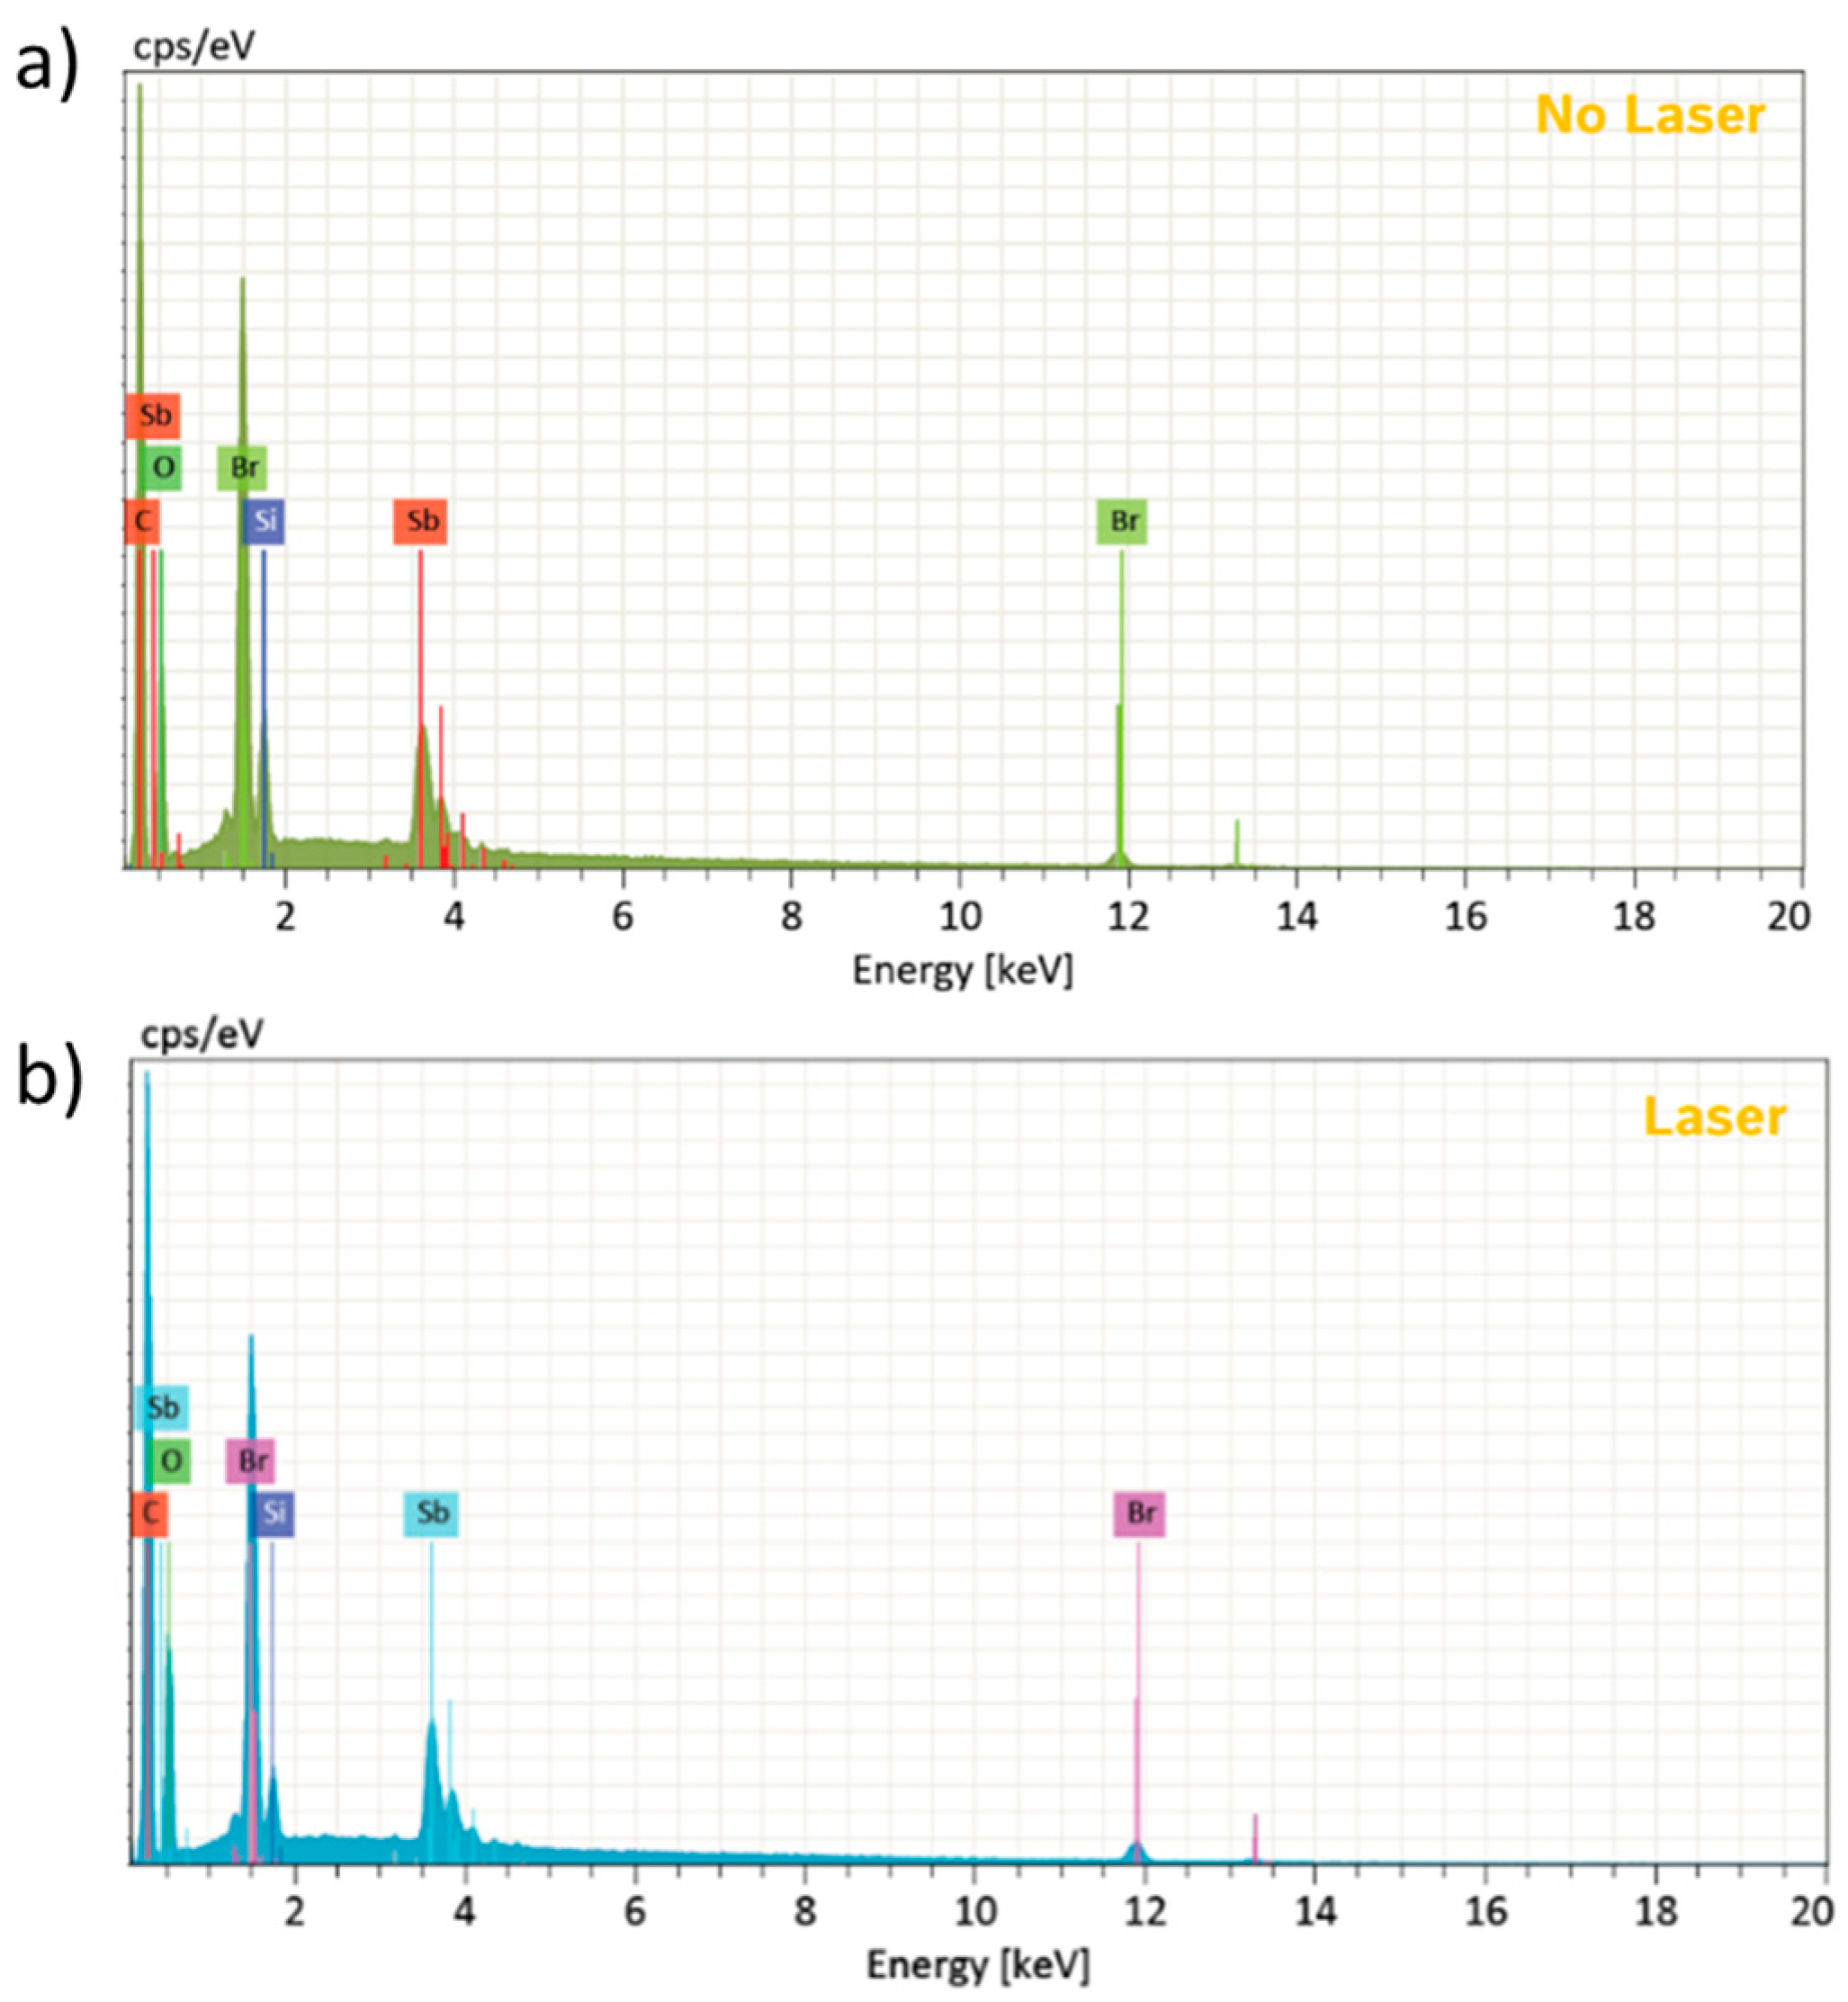
Using a proprietary EDS system, sample VIII was chemically analyzed in an area without laser marking (Figure 11. a), and with laser marking (Figure 11. b). The results obtained are semi-quantitative because the equipment cannot detect the chemical element hydrogen (H), which greatly impacts the percentages obtained. The normalized mass concentration of each chemical element present on the surface of sample VIII is shown in Table 4.
The presence of Br and Sb components on PBT/Glass Fiber composite was confirmed by EDS analysis, as shown in Table 4. As aforementioned, these additives improve the laser marking process absorbing the laser energy and turning it into thermal energy, heating the vicinity and melting the polymeric matrix.
As mentioned by the manufacturer, carbon black is also present in the polymer matrix but was not identified separately by the EDS technique. The carbon black also improves the marking contrast, it absorbs the laser light and converts it into thermal energy increasing the local temperature in the polymeric matrix, helping to melt it.
It is well known that the addition of antimony compounds, such as antimony trioxide (Sb2O3), gives a strong synergy when used with halogen-containing compounds. Bromine is widely used as the primary flame-retardant ingredient and antimony trioxide as a synergist [43].
Cheng et al [44] observed the same phenomenon in laser marking in TPU/Sb2O3 composites studies. In the laser marking process, Sb2O3 particles absorb the laser and convert it into thermal energy, and the crystal structure of Sb2O3 does not change according to XRD analysis.
The EDS analysis revealed that there is no difference in chemical composition between these two areas, indicating that the laser parameters used do not cause chemical changes on the surface.

5. Conclusions

A systematic study was carried out to improve the quality of the DMC code on the PBT/glass fibre composite surface obtained by laser marking. The samples were subjected to laser parameters lower, equal, and higher than the manufacturer's requirements and the sample surface was microscopically analyzed using a verifier microscopy and SEM technique.
All marked codes were optically analyzed using a verifier and the ISO/IEC 29158:2020 classification was accurately obtained. It was confirmed that the lower the radiation power and pulse frequency and the higher the marking speed, the fainter the resulting marking, and therefore, the poorer the code quality. Pass overlap does not have a significant effect on the overall code quality score, as there are codes with low pass overlap and good scores. However, this marking parameter allows the code to be filled in more, improving its appearance and robustness.
Surface analysis of the samples using the SEM technique before and after laser marking. The same surface aspects of the samples observed using optical analysis with the Verifier were confirmed using the SEM technique, which made it possible to analyze the marked surface of several samples in detail and study the effect of the parameters on the surface changes.
Radiation power lower than that recommended by the manufacturer is not sufficient to produce obvious changes between the marked and unmarked surface, resulting in blurred markings and deep holes. Increasing the power to levels equal to or greater than those recommended by the manufacturer, while maintaining the pulse frequency, marking speed and passage overlap at levels recommended by the manufacturer, will make the marking more visible. It is possible to observe the presence of flaky areas and deep holes can be observed. The defects observed are caused by the thermal effects of the laser improved by the additives, carbon black and Sb2O3, which have melted the material and caused changes in the surface topography.
A pulse frequency lower than the manufacturer's recommended is insufficient to produce obvious changes between marked and unmarked areas, resulting in intermittent and therefore discontinuous marking. Increasing the pulse frequency to levels equal to or greater than those recommended by the manufacturer, while maintaining the radiant power, marking speed and passage overlap at levels recommended by the manufacturer, will cause the surface to be more attacked and the marking to become more visible and continuous because of a more sequential laser beam and therefore greater interaction between the laser and the part.
A marking speed higher than the manufacturer's recommended speed is not sufficient to produce clear changes between the marked and unmarked areas, resulting in a blurred marking. Reducing the marking speed to levels equal to or less than those recommended by the manufacturer, while maintaining the radiant power, pulse frequency and pass overlap at levels recommended by the manufacturer, will make the marking more visible and continuous. This is because the lower the speed, the more the laser interacts with the part, causing significant surface changes. It was concluded that the lower radiation power levels, lower pulse frequencies and higher marking speeds resulted in barely visible marking. The surface aspects were represented by polymeric matrix melting and some glass fibers were visible but with polymeric matrix adhered to the fiber surface.
It was concluded that higher pulse frequencies and lower marking speeds result in a greater surface attack by the laser and a more continuous marking, as the greater the interaction of the laser with the part, the greater the surface changes. The surface aspects, in these cases, present flaky regions and deep holes.
The laser only affects the physical properties during the marking process, melting the PBT polymer matrix as the code is recorded. EDS analysis showed that the laser marking process did not significantly affect the chemical composition of the samples.

Author Contributions

Conceptualization, R.C.M. Sales-Contini, J. P. Costa and F.J.G. Silva: Conceptualization, methodology, formal analysis and investigation, F.J.G. Silva, R.D.S.G. Campilho, R. P. Martinho and A. M. G. Pinto: funding acquisition, project administration, resources and data curation, R.C.M. Sales-Contini and J. P. Costa; writing—original draft preparation and writing—review and editing, F.J.G. Silva, A. M. G. Pinto, R.D.S.G. Campilho, R. P. Martinho and I. M. Pinto, and V. F. C. Sousa; visualization, supervision, and writing—review and editing. All authors have read and agreed to the published version of the manuscript.

Funding

This research received no external funding.

Institutional Review Board Statement

Not applicable.

Informed Consent Statement

Not applicable.

Data Availability Statement

Not applicable.

Conflicts of Interest

The authors declare no conflict of interest.

References

  1. Marin-Garcia, J.A., Pardo del Val, M. and Bonavía Martín, T. Longitudinal study of the results of continuous improvement in an industrial company, Team Perform. Manag. 2008;14, 1-2, 56-69. [CrossRef]
  2. Grütter, A. W., Field, J. M., Faull, N. H. B., Work team performance over time: Three case studies of South African manufacturers, J. Oper. Manag., 2002; 20:5:641–657, . [CrossRef]
  3. Bosch, Manual BPS. Publicação Interna, 2021.
  4. Barad, M. Design of Experiments (DoE)—A Valuable Multi-Purpose Methodology, Appl. Math. 2014; 5: 14: 2120–2129. [CrossRef]
  5. Loh, S.H., The, P.C., Sim, J.J., Tai, C.K., Yeap, K.H., Lee, Y.J, Mazlan, A.U. Decoding Dot Peen Data Matrix Code with Deep Learning Capability for Product Traceability. Appl. of Model. and Simul. 2023; 7: 38-48. Available at: http://arqiipubl.com/ojs/index.php/AMS_Journal/article/view/385.
  6. Li, C., Lu, C., Li, J., Research on the quality of laser marked Data Matrix symbols, Key Eng. Mater. 2018; 764: 1: 219–224. [CrossRef]
  7. Sobotova, L., Demec, P. Laser marking of metal materials. MM Sci. J. 2015; 808-812. [CrossRef]
  8. Javale V., Nair, V. A Review on Laser marking by Nd-Yag Laser and Fiber Laser, Int. J. Sci. Res. Dev. 2013; 1: 9: 95–97.
  9. TROTEC, A comprehensive guide to industrial laser applications, Handbook to Industrial Laser Applications, 2019. Available at: https://www.troteclaser.com/static/images/News/EN_US/2016-11-Industrial-application-guide/Industrial_Application_guide.pdf. Accessed on April 15th, 2022.
  10. Qi J., Wang K., Zhu Y., A study on the laser marking process of stainless steel, J. Mater. Process. Technol. 2003; 139: 1–3: 273–276. [CrossRef]
  11. Jangsombatsiri, W., Porter, J. D. Laser direct-part marking of data matrix symbols on carbon steel substrates, J. Manuf. Sci. Eng. Trans. ASME 2007; 129: 3: 583–591. [CrossRef]
  12. Zelenska, K.S., Zelensky, S.E., Poperenko, L.V., Kanev, K., Mizeikis, V., Gnatyuk, V.A., Thermal mechanisms of laser marking in transparent polymers with light-absorbing microparticles, Optics & Laser Techn. 2016; 76: 96-100. [CrossRef]
  13. Czyzewski, P.; Sykutera, D.; Rojewski, M. The Impact of Selected Laser-Marking Parameters and Surface Conditions on White Polypropylene Moldings. Polym. 2022; 14: 1879. [CrossRef]
  14. Lu, G., Wu, Y., Zhang, Y., Wang, K, Gao, H., Luo, K., Cao, Z., Cheng, J., Liu, C., Zhang, L., Qi, J., Surface Laser-Marking and Mechanical Properties of Acrylonitrile- Butadiene-Styrene Copolymer Composites with Organically Modified Montmorillonite, ACS Omega 2020; 5: 19255−19267. [CrossRef]
  15. Narica, P., Fedotovs J., Marking of a Small Sized QR Code on a Plastic Surface, 19th International Conference on Reliability and Statistics in Transportation and Communication, RelStat’19, 2019; pp. 16–19, Riga, Latvia Springer. https://link.springer.com/chapter/10.1007/978-3-030-44610-9_41.
  16. Li, W.H., Preparation of laser markable polyamide compounds, 2nd International Conference on Graphene and Novel Nanomaterials (GNN), J. of Phys: Conference Series, IOP Publishing, 2021; 012003. [CrossRef]
  17. Chen, M. F., Hsiao, W. T., Huang, W. L., Hu, C. W., Y. P. Chen, Laser coding on the eggshell using pulsed-laser marking system, J. Mater. Process. Technol. 2009; 209:2: 737–744. [CrossRef]
  18. Cheng, J., Zhou, J., Zhang, C., Cao, Z., Wu, D., Liu, C., Zou, H. . Enhanced laser marking of polypropylene induced by “core-shell” ATO@PI laser-sensitive composite, Polym. Degrad. and Stab. 2019; 167: 77e85.
  19. Yang, J., Xiang, M., Zhu, Y. et al. Influences of carbon nanotubes/polycarbonate composite on enhanced local laser marking properties of polypropylene. Polym. Bull. 2023; 80:1321–1333 (2023). [CrossRef]
  20. Zhong, W., Cao, Z., Qiu, P., Wu, D., Liu, C., Li, H., Zhu, H., Laser-Marking Mechanism of Thermoplastic Polyurethane/Bi2O3 Composites. ACS Appl. Mater. Interf. 2015: 7: 24142−24149. [CrossRef]
  21. Cao, Z., Hu, Y., Lu, U., Xiong, Y., Zhou, A., Zhang, C., Wu, D., Liu, C., Laser-induced blackening on surfaces of thermoplastic polyurethane/ BiOCl composites, Polym. Degrad. and Stab. 2017; 141: 33-40. [CrossRef]
  22. Ng, T.W., Yeo, S.C., Aesthetic laser marking assessment, Optics & Laser Techn. 2000; 32: 187-191. [CrossRef]
  23. Ng, T.W., Yeo, S.C., Aesthetic laser marking assessment using luminance ratios, Optics and Lasers in Eng., 2001; 35: 177-186. [CrossRef]
  24. Li, W.H., Preparation of laser markable polyamide compounds, 2nd International Conference on Graphene and Novel Nanomaterials (GNN), J. of Phys: Conference Series, IOP Publishing, 2021; 012003. [CrossRef]
  25. Arai, S., Tsunoda, S., Yamaguchi, A., Ougizawa, T. Effect of anisotropy in the build direction and laser-scanning conditions on characterization of short-glass-fiber-reinforced PBT for laser sintering. Opt. and Laser Techn. 2019; 113: 345–356. [CrossRef]
  26. Greiner, S., Wudy, K., Lanzl, L., Drummer, D. Selective laser sintering of polymer blends: Bulk properties and process behaviour. Polym, Test. 2017; 64: 136–144. [CrossRef]
  27. Silva, L.R.R., Marques, E.A.S., Carbas, R.J.C., Akhavan-Safar, A., da Silva, L.F.M. Study of the optical, thermal, morphological and mechanical characteristics of a laser weldable fibre reinforced polymer, Polym. Compos. 2002; 43: 4038–4055, . [CrossRef]
  28. Ng, T.W., Yeo, S.C., Aesthetic laser marking assessment using spectrophotometers, J. of Mat. Proc. Techn. 2000; 104: 280-283. [CrossRef]
  29. BASF. Product Data Sheet Ultradur® B 4406 G6 05/2023 PBT-GF30 FR(17). Available at: https://download.basf.com/p1/8a8081c57fd4b609017fd64d909d71c4/en/ULTRADUR%3Csup%3E%C2%AE%3Csup%3E_B4406_G6_Product_Data_Sheet_Asia_PacificEurope_English.pdf Accessed on: July 29th, 2023.
  30. ISO/IEC 29158, Information technology - Automatic identification and data capture techniques - Direct Part Mark (DPM) Quality Guideline. 2020.
  31. Bociga, E., Jaruga, T. Experimental investigation of polymer flow in injection mould. Arch. of Mater. Sci. and Eng. 2007; 28: 3: 165-172.
  32. Wang G., Zhao G., Wang X., Effects of cavity surface temperature on reinforced plastic part surface appearance in rapid heat cycle moulding, Mater. Des. 2013; 44: 509–520. [CrossRef]
  33. Gim, J., Turng, L.S. A review of current advancements in high surface quality injection moulding: Measurement, influencing factors, prediction, and control, Polym. Test. 2022; 115: 107718. [CrossRef]
  34. Mercan, S.U.M., Uzun, L. Serial number restoration on polymer surfaces: A survey of recent literature, Forensic Chem. 2020; 20: 100267. [CrossRef]
  35. Katterwe H., The recovery of erased numbers in polymers, J. Forensıc Sci. 1994; 34: 1: 11-16. [CrossRef]
  36. Young R.J., Lovell P.A., Introduction to Polymers, CRC Press, 2011.
  37. Aly A.A., Heat treatment of polymers: a review, Int. J. Mater. Chem. Phys. 2015; 1: 2: 132–140. https://api.semanticscholar.org/CorpusID:53342231.
  38. Pieretti, E.F., Costa, I. Surface characterisation of ASTM F139 stainless steel marked by laser and mechanical techniques. Electrochimica Acta 2013; 114: 838-843. [CrossRef]
  39. Lu, G., Wu, Y., Zhang, Y., Wang, K., Gao, H., Luo, K., Cao, Z., Cheng, J., Liu, C., Zhang, L., Juan Q. Surface Laser-Marking and Mechanical Properties of Acrylonitrile Butadiene-Styrene Copolymer Composites with Organically Modified Montmorillonite. ACS Omega, 2020; 5: 19255−19267. [CrossRef]
  40. Man H.C., Li M., Yue T.M., Surface treatment of thermoplastic composites with an excimer laser, Int. J. of Adhes. and Adhesiv. 1998; 18: 3: 151-157, ISSN 0143-7496. [CrossRef]
  41. Cao, Z., Hu, Y., Yu, Q., Lu, Y., Wu, D., Zhou, A., Ma, W., Xia, Y., Liu, C. and Loos, K., Facile Fabrication, Structures, and Properties of Laser-Marked Polyacrylamide/Bi2O3 Hydrogels. Adv. Eng. Mater. 2017; 19: 1600826. [CrossRef]
  42. Obilor, A.F., Pacella, M., Wilson, A. et al. Micro-texturing of polymer surfaces using lasers: a review. Int J Adv Manuf Technol. 2022; 120: 103–135. [CrossRef]
  43. Margolis, J.M. Engineering Plastic Handbook, p. 463, McGraw-Hill, New York, 2006. [CrossRef]
  44. Cheng J., Li H., Zhou J., Cao, Z., Wu, D., Liu, C. Influences of diantimony trioxide on laser-marking properties of thermoplastic polyurethane. Polym. Degrad. and Stab. 2018; 154: 149-156. [CrossRef]
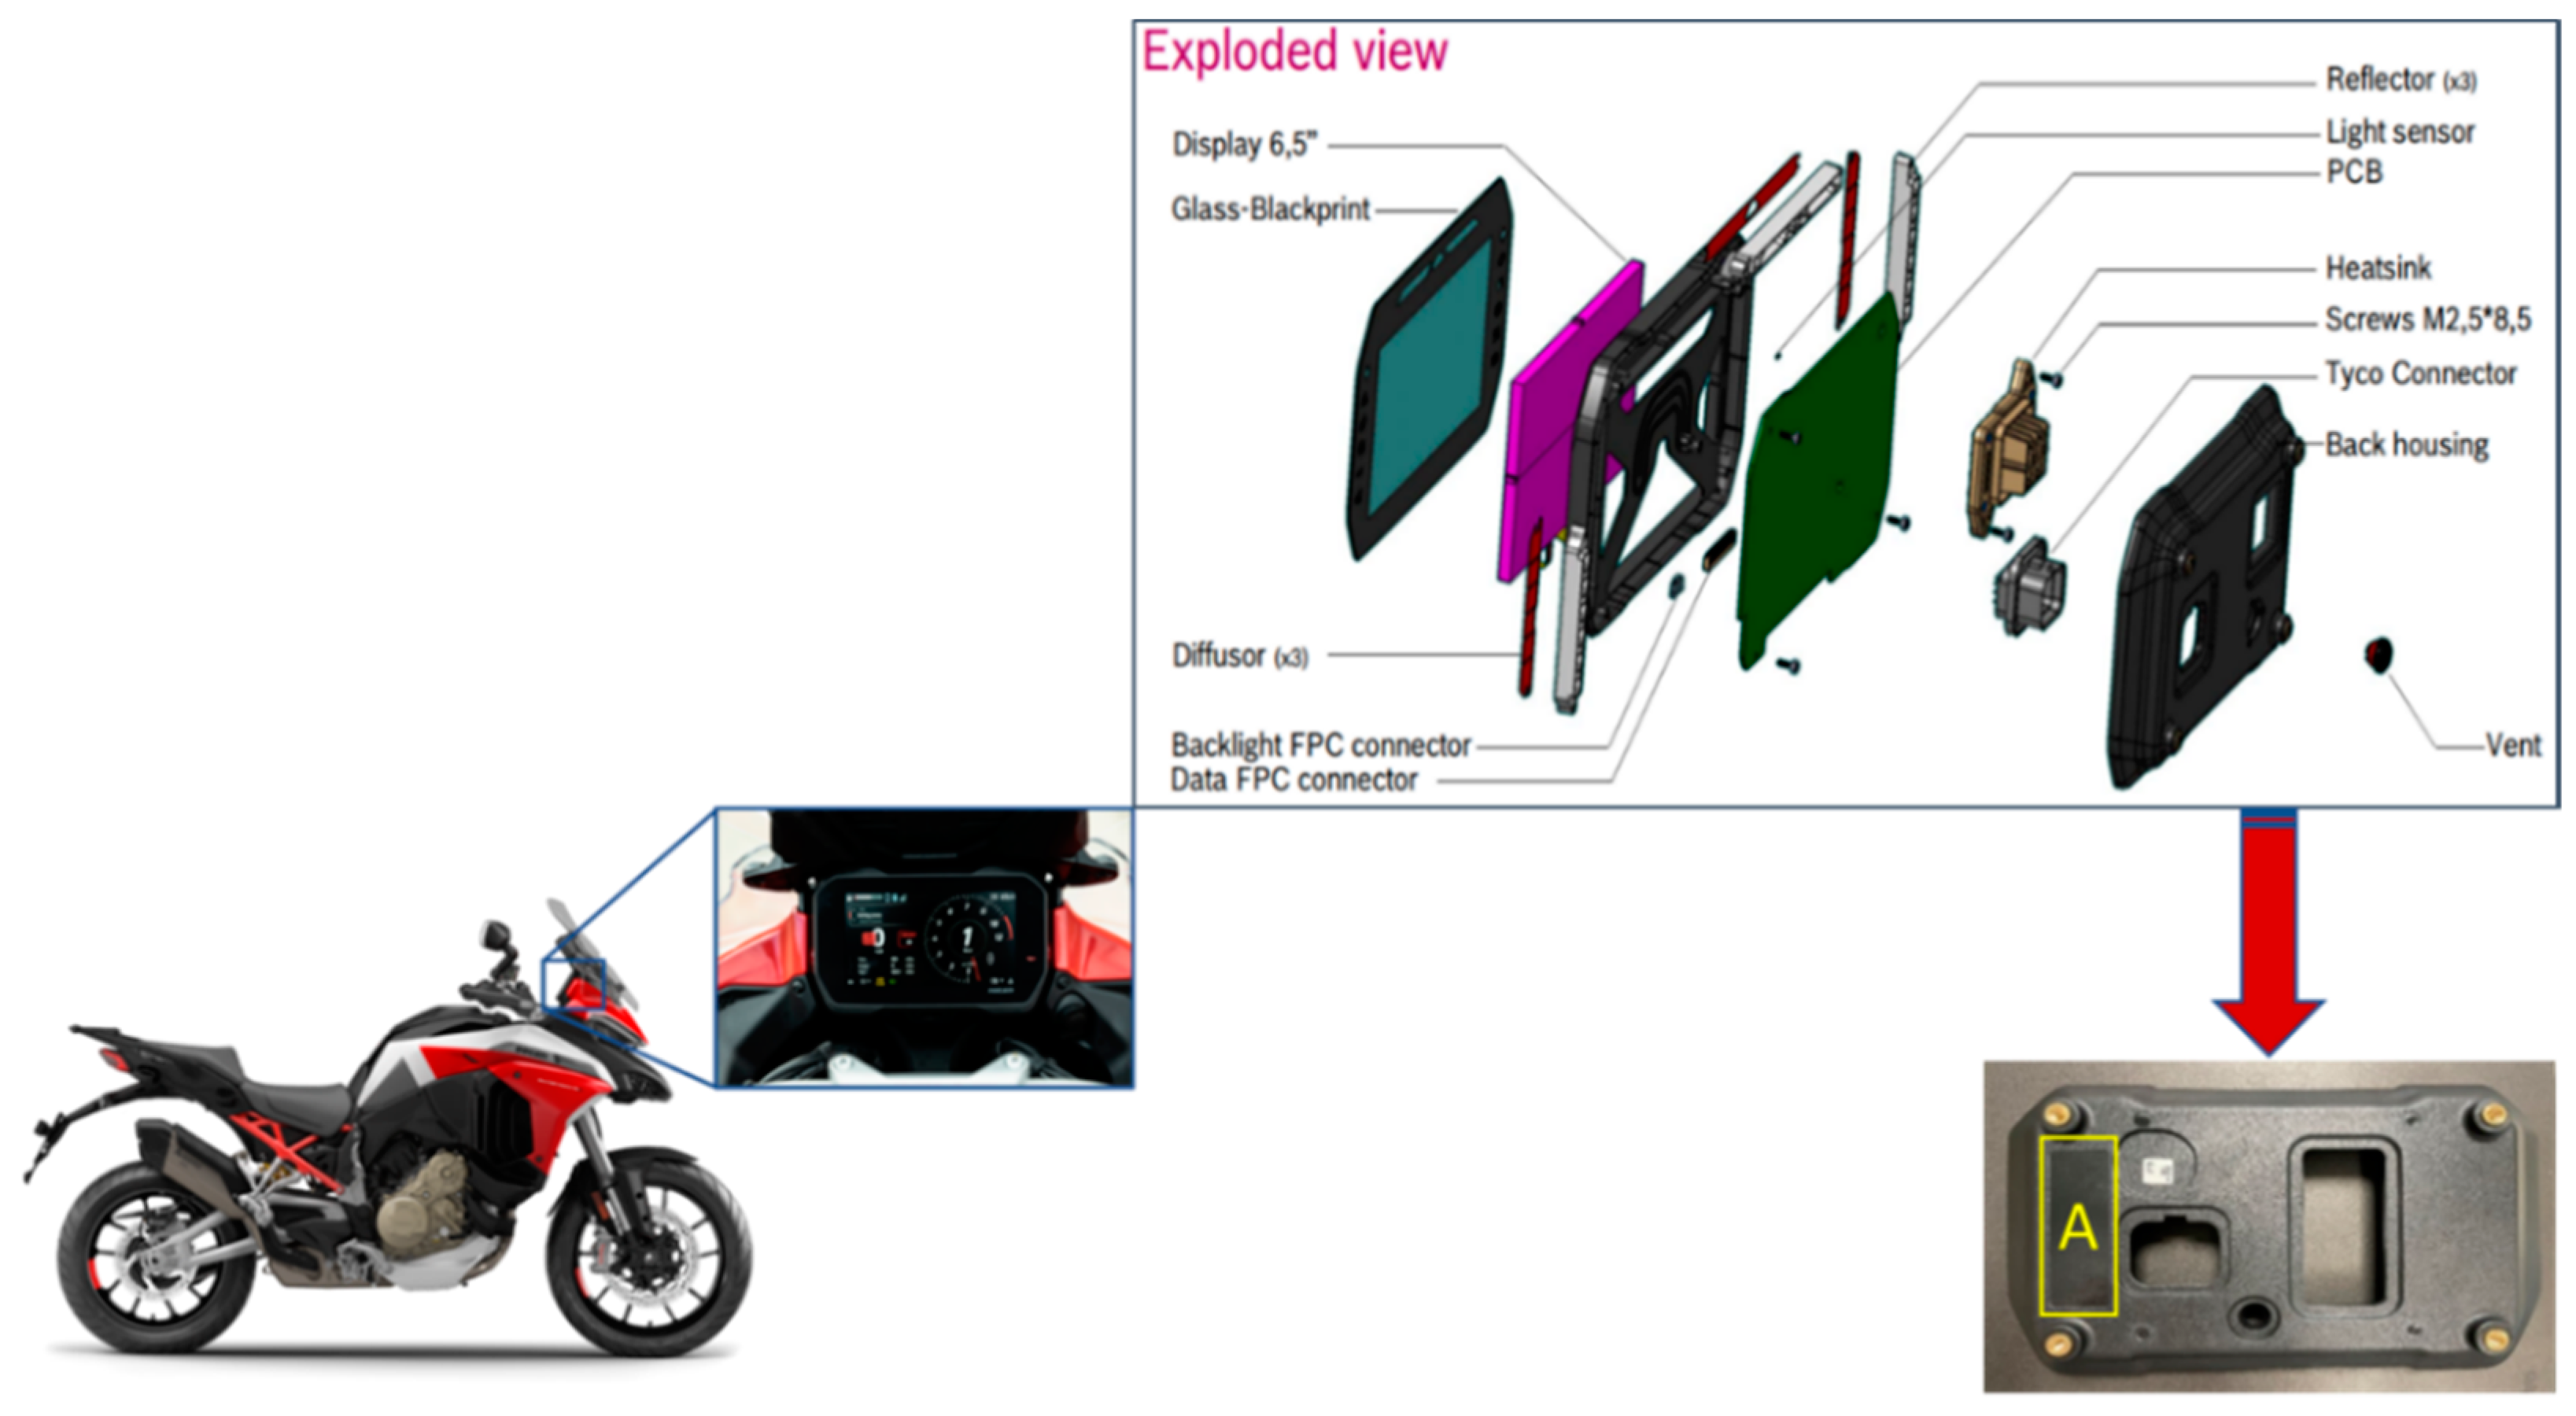
Figure 1. Exploded view of Motorcycle instrument panel and back housing part. Region A Polished area exclusively for the laser marking process.
Preprints 88532 g001
Figure 2. a) Laser marking code line measurement and b) Laser marking code square measurement.
Preprints 88532 g002
Figure 3. Quality analysis of DMC code laser marked on PBT/glass fibre composite surface: a) Sample VIII with quality A e b) Sample V with quality F.
Preprints 88532 g003

Sample Radiation Power (W) Pulse Frequency (kHz) Marking Speed (mm/s) Pass overlap (%)
I 15 25 2000 15
II 19 25 2000 15
III 17 30 2000 15
IV 17 25 3000 15
V 15 15 3000 0
VI 17 25 1000 15
VII 17 25 2000 15
VIII 19 30 1000 30
IX 17 15 2000 15

Factor Name Level Level values
A Radiation Power (W) 3 Pi Pn Ps
15 17 19
B Pulse Frequency (kHz) 3 Fi Fn Fs
15 25 30
C Marking Speed (mm/s) 3 Vi Vn Vs
1000 2000 3000
D Pass overlap (%) 3 Si Sn Ss
0 15 30
Figure 4. Polished surface area where the DMC will be marked during production. The magnified image of the red circles shows the presence of injection marks on the polished surface. Region 1: Secondary flow marks. Region 2: No defects, Region 3: Weld marks, and Region 4: Secondary flow marks.
Preprints 88532 g004
Figure 5. SEM analysis of PBT/glass fibre composite surface, comparison between a sample without laser marking a), b) and with laser marking c), d).
Preprints 88532 g005
Figure 6. SEM images with a) and d) radiation power lower than the manufacturer's requirements (Pi = 15 W, Sample I), b) and e) radiation power equal to the manufacturer's requirements (Pn = 17 W, Sample VII), and c) and f) radiation power higher than the manufacturer's requirement (Ps = 19 W, Sample II), at 1 mm and 100 μm, respectively.
Preprints 88532 g006
Figure 7. SEM images with a) and d) pulse frequency lower than the manufacturer's requirements (Fi = 15 kHz, Sample IX), b) and e) pulse frequency equal to the manufacturer's requirements (Fn = 25 kHz, Sample VII), and c) and f) pulse frequency higher than the manufacturer's requirement (Fs = 30 kHz, Sample III), at 1 mm and 100 μm, respectively.
Preprints 88532 g007
Figure 8. SEM images with a) and d) marking speed lower than the manufacturer's requirements (Vi = 1000 mm/s, Sample VI), b) and e) marking speed equal to the manufacturer's requirements (Vn = 2000 mm/s, Sample VII), and c) and f) marking speed higher than the manufacturer's requirement (Vs = 3000 mm/s, Sample IV), at 1 mm and 100 μm, respectively.
Preprints 88532 g008
Figure 9. SEM images of Sample VIII a) 1 mm; b) 100 μm. Laser marking parameters: radiation power: 19 W, pulse frequency: 30 kHz, pass overlap: 30%, and marking speed: 1000 mm/s.
Preprints 88532 g009
Figure 10. SEM images of Sample V a) 1 mm; b) 100 μm. Laser marking parameters: radiation power: 15 W, pulse frequency: 15 kHz, pass overlap: 0%, and marking speed: 3000 mm/s.
Preprints 88532 g010
Figure 11. Chemical analysis of sample VIII: a) area without laser marking and b) area with laser marking.
Preprints 88532 g011
Table 1. Laser marking parameters and their variations considered for the tests.
Factor Name Level Level values
A Radiation Power (W) 3 Pi Pn Ps
15 17 19
B Pulse Frequency (kHz) 3 Fi Fn Fs
15 25 30
C Marking Speed (mm/s) 3 Vi Vn Vs
1000 2000 3000
D Pass overlap (%) 3 Si Sn Ss
0 15 30
Table 2. Full-factorial DoE applied to the study to be carried out on the equipment.
Sample Radiation Power (W) Pulse Frequency (kHz) Marking Speed (mm/s) Pass overlap (%)
I 15 25 2000 15
II 19 25 2000 15
III 17 30 2000 15
IV 17 25 3000 15
V 15 15 3000 0
VI 17 25 1000 15
VII 17 25 2000 15
VIII 19 30 1000 30
IX 17 15 2000 15
Table 3. Samples´ optical image quality after laser marking.
Preprints 88532 i001
Table 4. Normalized mass concentration of each chemical element contained in sample VIII.
Sample Area Normalised mass concentration [%]
Area without laser marking C O Si Br Sb
59.53 21.08 1.59 10.68 7.12
Area with laser marking C O Si Br Sb
59.32 21.15 0.89 11.38 7.26
Disclaimer/Publisher’s Note: The statements, opinions and data contained in all publications are solely those of the individual author(s) and contributor(s) and not of MDPI and/or the editor(s). MDPI and/or the editor(s) disclaim responsibility for any injury to people or property resulting from any ideas, methods, instructions or products referred to in the content.
Copyright: This open access article is published under a Creative Commons CC BY 4.0 license, which permit the free download, distribution, and reuse, provided that the author and preprint are cited in any reuse.
Prerpints.org logo

Preprints.org is a free preprint server supported by MDPI in Basel, Switzerland.

Subscribe

© 2024 MDPI (Basel, Switzerland) unless otherwise stated