1. Introduction
In the realm of wheel utilization, a substantial 90% of component deterioration stems from fatigue-related failures [
1]. As such, it becomes imperative to subject wheels to meticulous testing procedures that preclude any event of failure during their operational lifespan. One of the prominent testing methodologies employed for this purpose is the radial dynamic fatigue test, adhering to the SAE J 328 standard. Nonetheless, direct application of this test can induce damage to the test specimen and necessitates iterative trials, thereby resulting in significant financial investments and protracted temporal commitments. To mitigate the financial and temporal expenses associated with testing, a pragmatic solution involves the application of numerical simulation techniques, prominently realized through the finite element method (FEM) [
2]. The FEM approach has found extensive utility in fatigue analysis of various materials, such as leaf springs [
3,
4,
5]and piston rods [
6,
7].
The merits of the FEM methodology extend to the resolution of issues inherent in the trial-and-error approach, as it allows for component analysis preceding the fabrication of prototypes. This not only conserves costs, space, and time but also underscores the essence of the present study. Specifically, the SAE 328 dynamic radial fatigue test was conducted employing the FEM to ascertain the cycle life, pressure thresholds, load limits, and safety factors. Such critical insights, often absent in mechanical product documentation, empower users to optimize wheel usage for durability and safety [
8].
Prior research has underscored the imperative of conducting fatigue life analyses on vehicular wheels, as instances abound where these components fail to meet the SAE 328 standard. For instance, Bahri and Pramono [
9] elucidate that non-conformities with the SAE 328 standard stem from suboptimal initial leg designs. Notably, these designs lack compliance with the standard's requisites, with the minimum fatigue life failing to attain the mandated 600,000 cycles. The need to address this concern through material fatigue analyses via numerical simulations is evident, a point corroborated by Prasetiyo et al. [
9] who emphasize the efficacy of natural frequency analyses to curb damage and production costs associated with such components.
Building on this contextual foundation, the researchers propose an innovative approach to address these challenges. Leveraging Solidworks software and referencing data encoded within the wheel's print code [
10], they employ the finite element method for visualizing wheels—a technique at the forefront of the current study. The central objective of this research is to employ finite element method static structural software to simulate wheels. This entails emulating the radial dynamic fatigue test as prescribed by the SAE J 328 standard [
11], introducing mesh variations while optimizing the maximum mesh size employed, and calibrating the load parameters to the 2011 Xenia IX car model. These endeavors are designed to discern the wheels' strength and lifecycle [
12], circumventing the need for costly and time-intensive experimental assessments.
2. Materials and Methods
2.1. Finite Element Method (FEM)
The Finite Element Method (FEM) research method is used to analyze and model physical structures or phenomena using numerical analysis techniques based on the basic principles of classical mechanics. [
13]. FEM divides a complex object into more minor elements (finite elements) that are connected to each other and apply physical equations to each element to describe the system's overall response.
2.2. Research Stages
The step for determining conditions, including loading, must also be by the standards and actual conditions in the field. The next stage is the variation of the mesh after running as a result of the assumption that determines the critical point of the wheels, then variations of the mesh are carried out in order to precision the number of meshes used so that the value of the von-misses is obtained which best corresponds to the actual situation [
14].
After the static simulation has been carried out, the next stage is fatigue simulation, with the conditions used are static conditions which previously obtained results; from the fatigue simulation, a life plot value will be obtained where the standards used must reach a minimum of 600,000 new cycles to be said to be safe and have met the standards SAE J 328 [
15].
3. Results
- A.
3D modeling
Modeling can type wheels with code 14X5JHET35 can be translated into data as follows:
Table 1.
Code Specifications.
Table 1.
Code Specifications.
| No |
Specifications |
Value |
| 1 |
Flange |
J (h1=17.5 mm, b1= 13mm , r1= 9,5mm) |
| 2 |
Hump models |
H |
| 3 |
Offset |
38,83 mm |
| 4 |
PCD |
114.3mm |
| 5 |
Bolt hole |
4 buah (diameter 12mm) |
| 6 |
Center bore diameter |
126 mm |
| 7 |
Materials |
alloy 6061 |
| 8 |
Velg diameter |
365,6 mm |
| 9 |
Velg surface width |
140,7 mm |
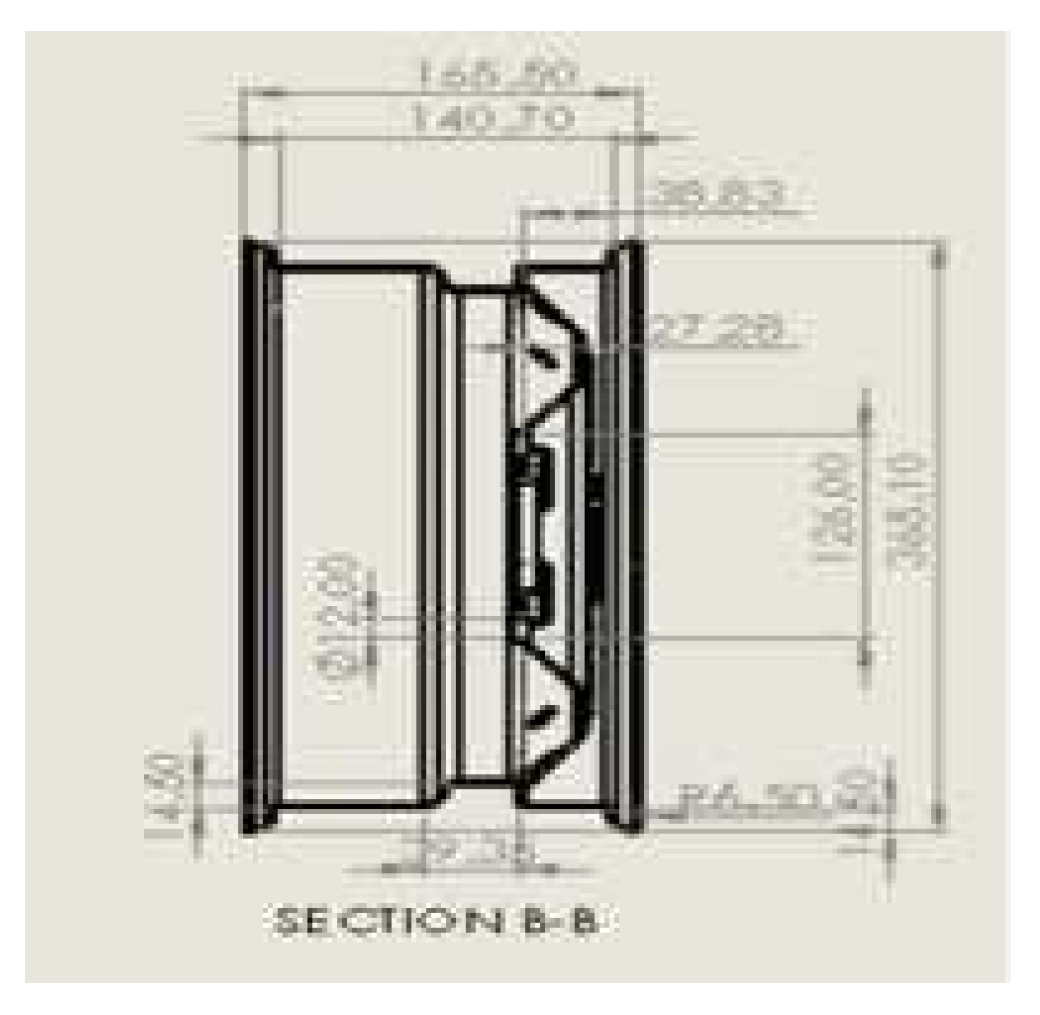
From this data, dimensions are obtained which are used as 2D Sketches to create 3D [
16] Sketch as presented in
Figure 2:
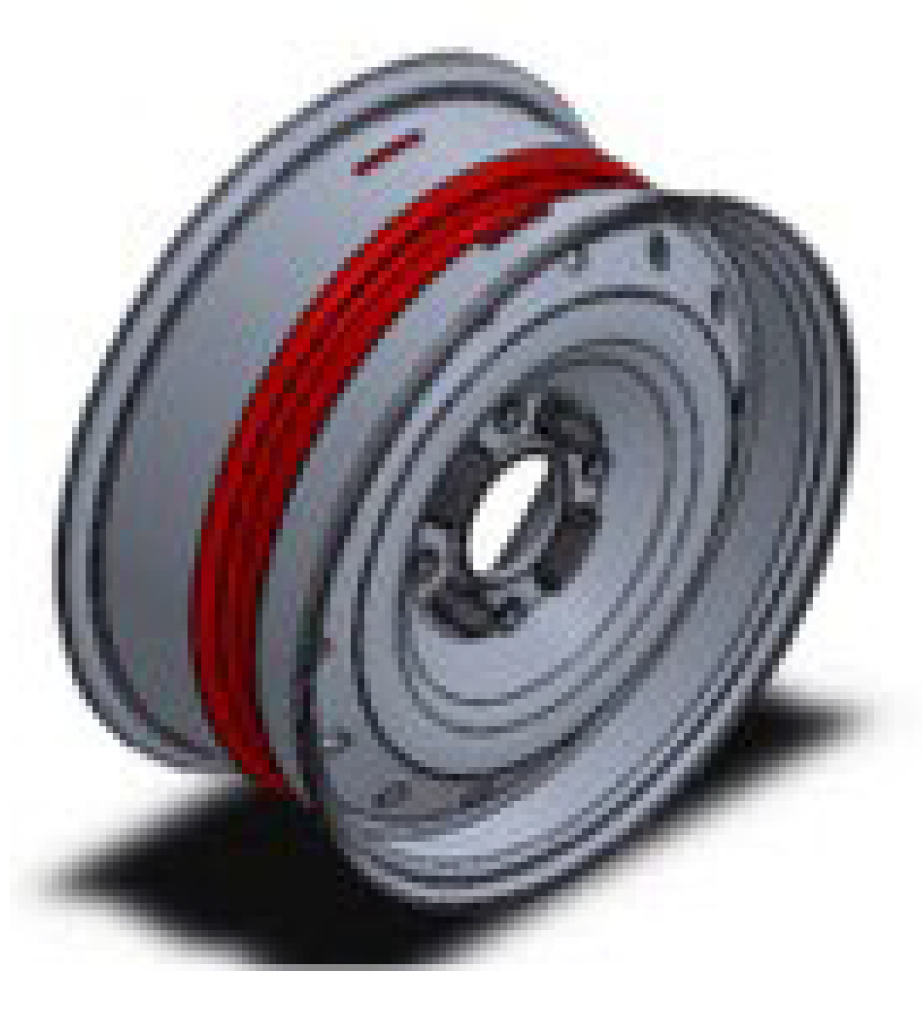
Furthermore, from the existing dimensions, a 3D model was created using Solidwork 2019 based on the dimensions of the image above; the 3D Wheels model is presented in
Figure 3:
The material used on these wheels is alloy 6061 with the following specifications:
Table 2.
Material specification.
Table 2.
Material specification.
| No |
Name |
6061 Alloy |
| 1 |
Model type |
Linear Elastic Isotropic |
| 2 |
Default failuree criterion |
Max von Mises Stress |
| 3 |
Yield strength |
5,51485e+07 N/m^2 |
| 4 |
Tensile strength |
1,24084e+08 N/m^2 |
| 5 |
Elastic modulus |
6,9e+10 N/m^2 |
| 6 |
Poisson's ratio |
0,33 |
| 7 |
Mass density |
2.700 kg/m^3 |
| 8 |
Shear modulus |
2,6e+10 N/m^2 |
| 9 |
Thermal expansion coefficient |
2,4e-05 /Kelvin |
- B.
Load Calculation
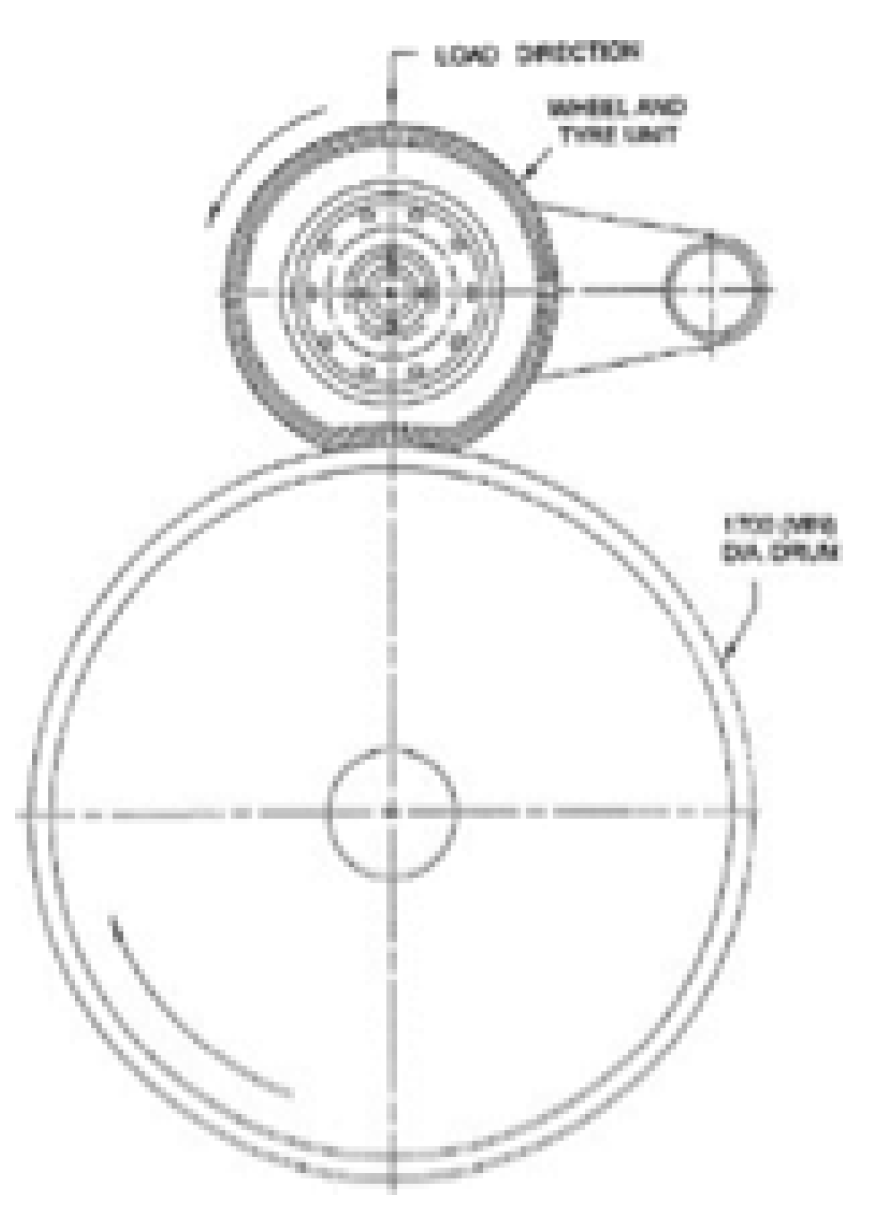
The load used is the testing load for the wheel-type dynamic radial fatigue test. The loading is done by applying a compressive force in the radial direction on one side. The wheel provided by the carriage is one of the components of the dynamic radial fatigue test equipment. The other side of the wheel touches the road wheel, which rotates at 237 rpm. The dynamic radial fatigue test is shown in
Figure 4 [
17].
According to the SAE J 328 standard, there are 4 types of loads tested in the Dynamic Radial fatigue test; the explanation is as follows:
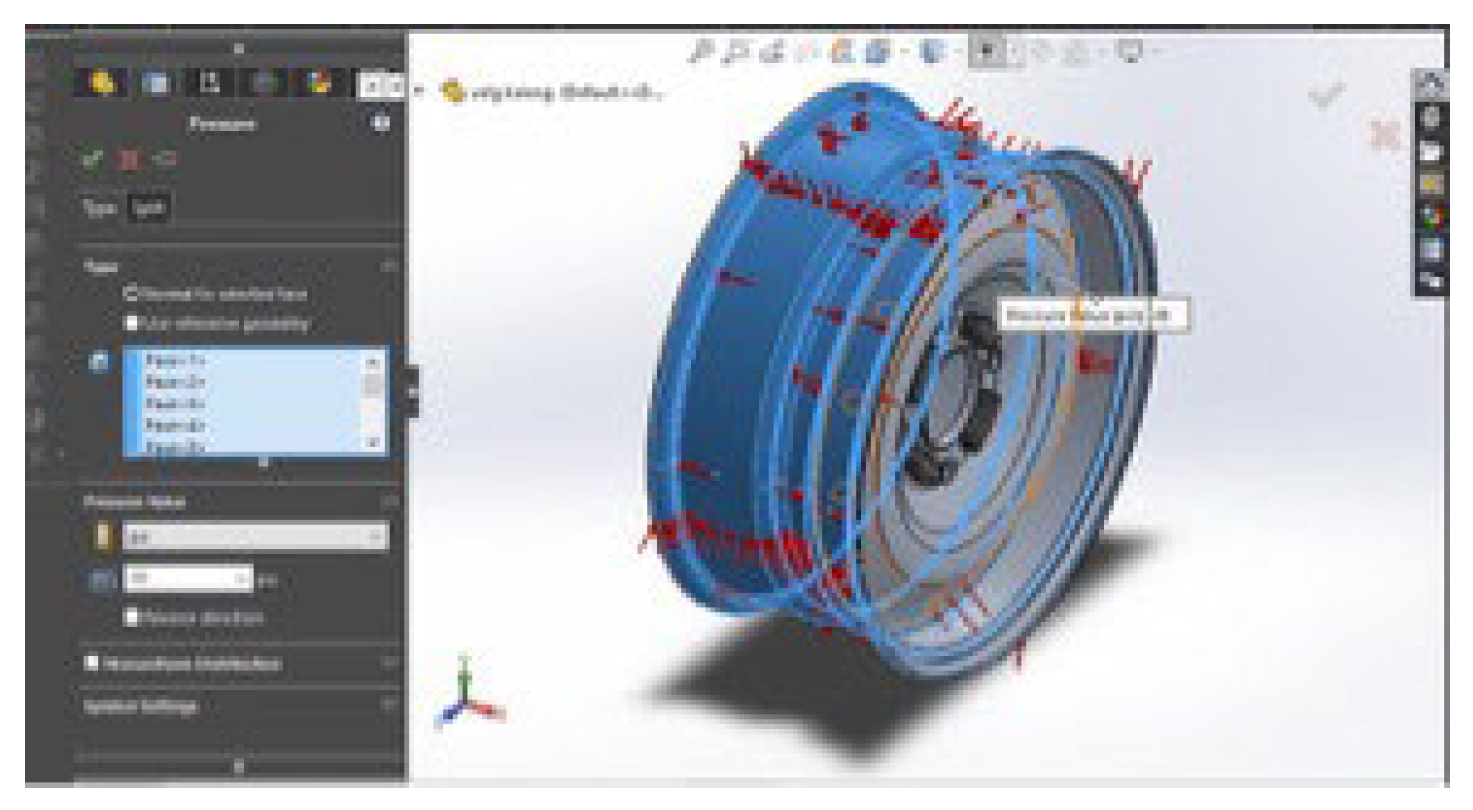
When the wheels are used, pressure tires are installed, and the wheels receive tire pressure on the rim, including the bead seat and flange.
The display shown in
Figure 5 above shows this first type of load spread over the part occupied by the tire of 65 psi or 448 kPa based on the SAE J 328 standard.
- 2.
Load Due to Radial Load
Radial load can be formulated
Fr = W x K
Fr = Radial Force
W = Load and K is Load factor .
If the total load is Xi 2011, it is 1030 kg [
18], and 4 passengers weigh 240 kg; then the total weight is 1270 kg, then for 1 wheel, it is 1270 / 4 = 317.5 kg. According to the SAE J 328 standard, the load factor used is 2.5 [
19], then from these data, it can be calculated:
Fr = W x K
Fr = 317.5 x 2.5
Fr = 793.75 kg
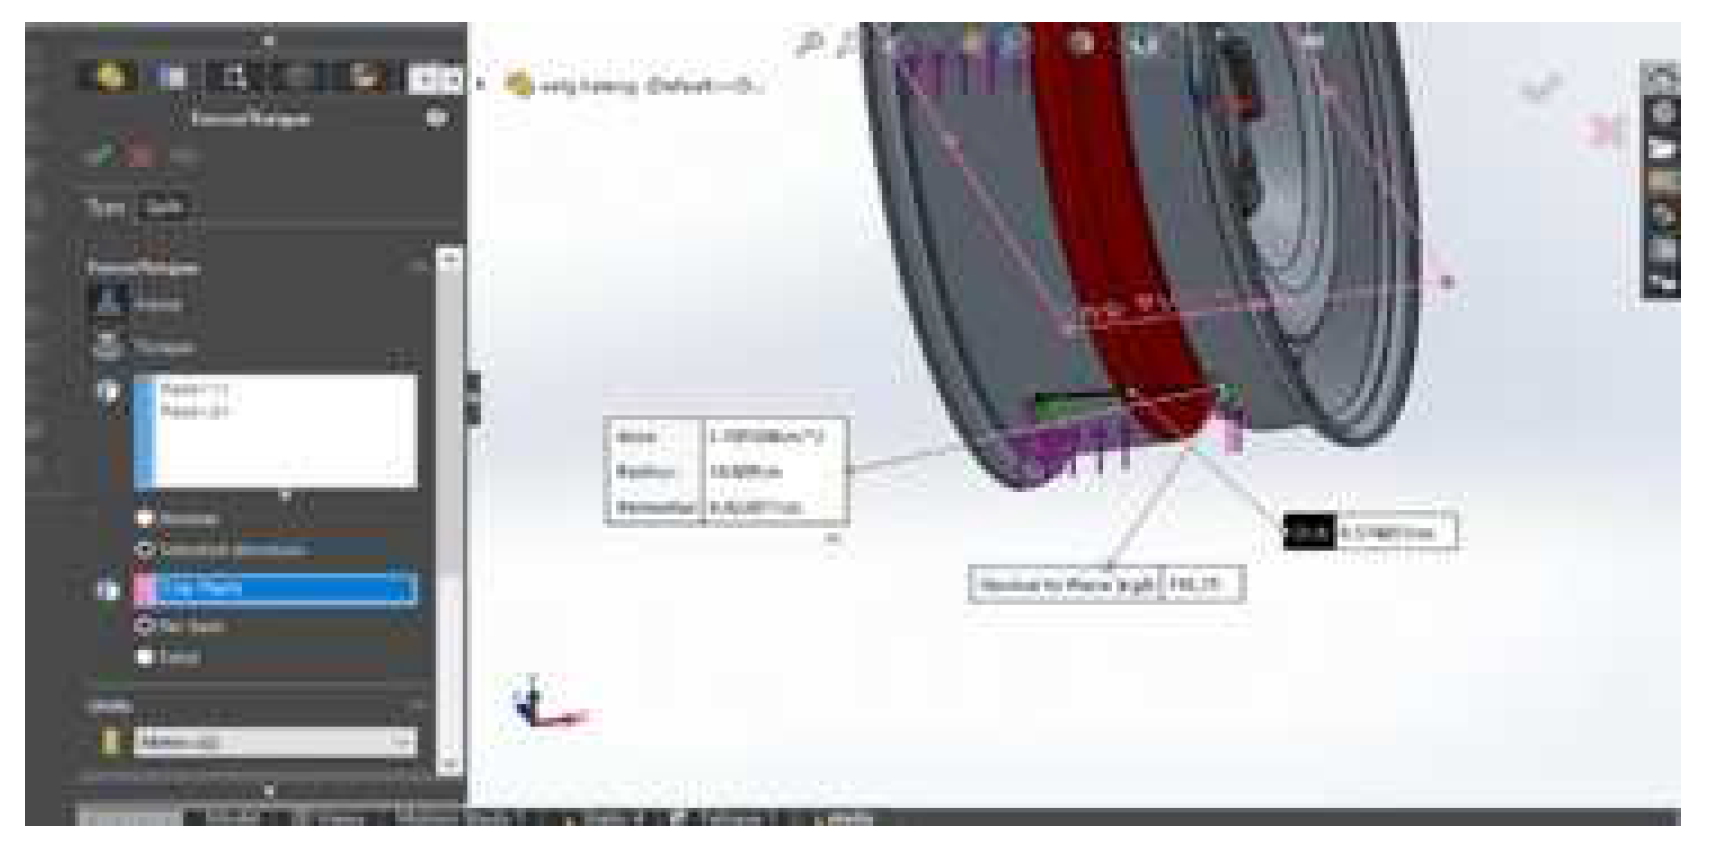
With a radial load contact of 42.11 mm obtained from similar tests, as shown in
Figure 6:
- 3.
Load due to Bolt Tightness
Formula:
Σ = 0 ; fg = µ. N dan = N cos θ
With MR is the moment of tightness of the bolt, which is 115 Nm on the SAE J 328 standard. Meanwhile, the coefficient of friction between the nut and the rim surface (µ) is 0.5 while the pitch diameter of the bolt (dp) is 15 mm and the angle of inclination (θ) is 50
So :
Figure 7.
Bolt tightness load.
Figure 7.
Bolt tightness load.
When entered in the Software it looks as shown in
Figure 2.7 below:
- 4.
Load Due to Wheel Rotating Speed
In the Dynamic Radial fatigue test, according to the SAE J 328 standard, the wheels are rotated by a drum with a diameter of 1707.06 mm and a drum rotational speed of 237 rpm. The tested wheels have a diameter of 364 mm, so the wheels rotate at a speed of 1110.59 rpm [
20]
D1 * N1 = D2 * N2
In this case, we have:
D1 = 1707,06 mm
N1 = 237 rpm
D2 = 364 mm ( new diameter)
we substitute the value into the formula:
N2 = (1707,06 mm * 237 rpm) / 364 mm
N2 =1110,59 rpm
- C.
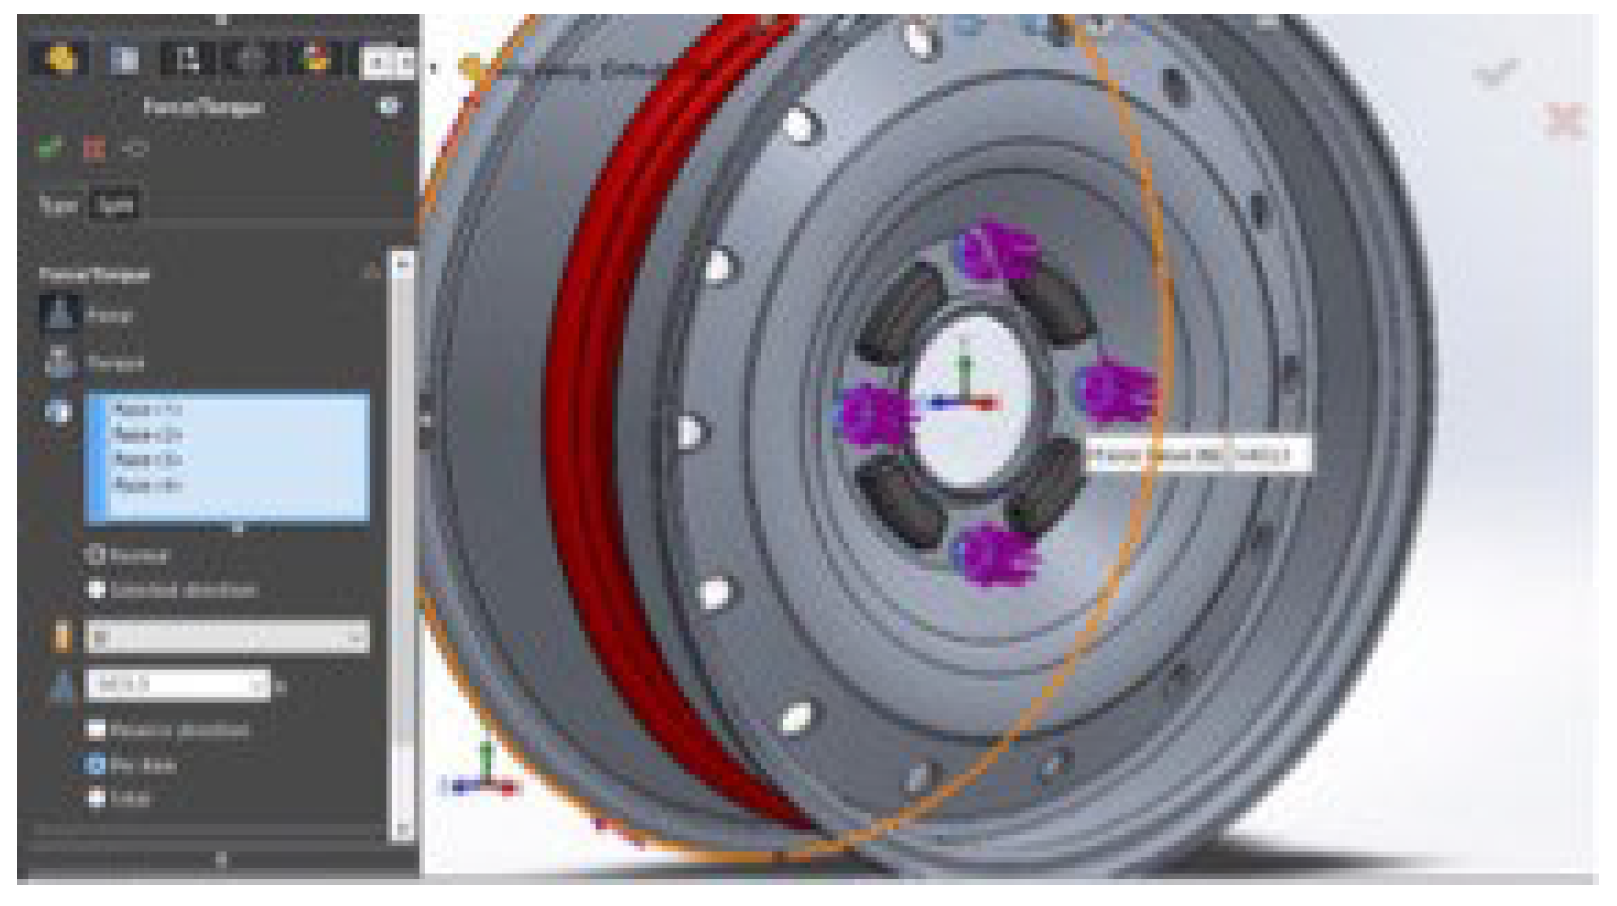
Simulation
- 1.
Boundary condition
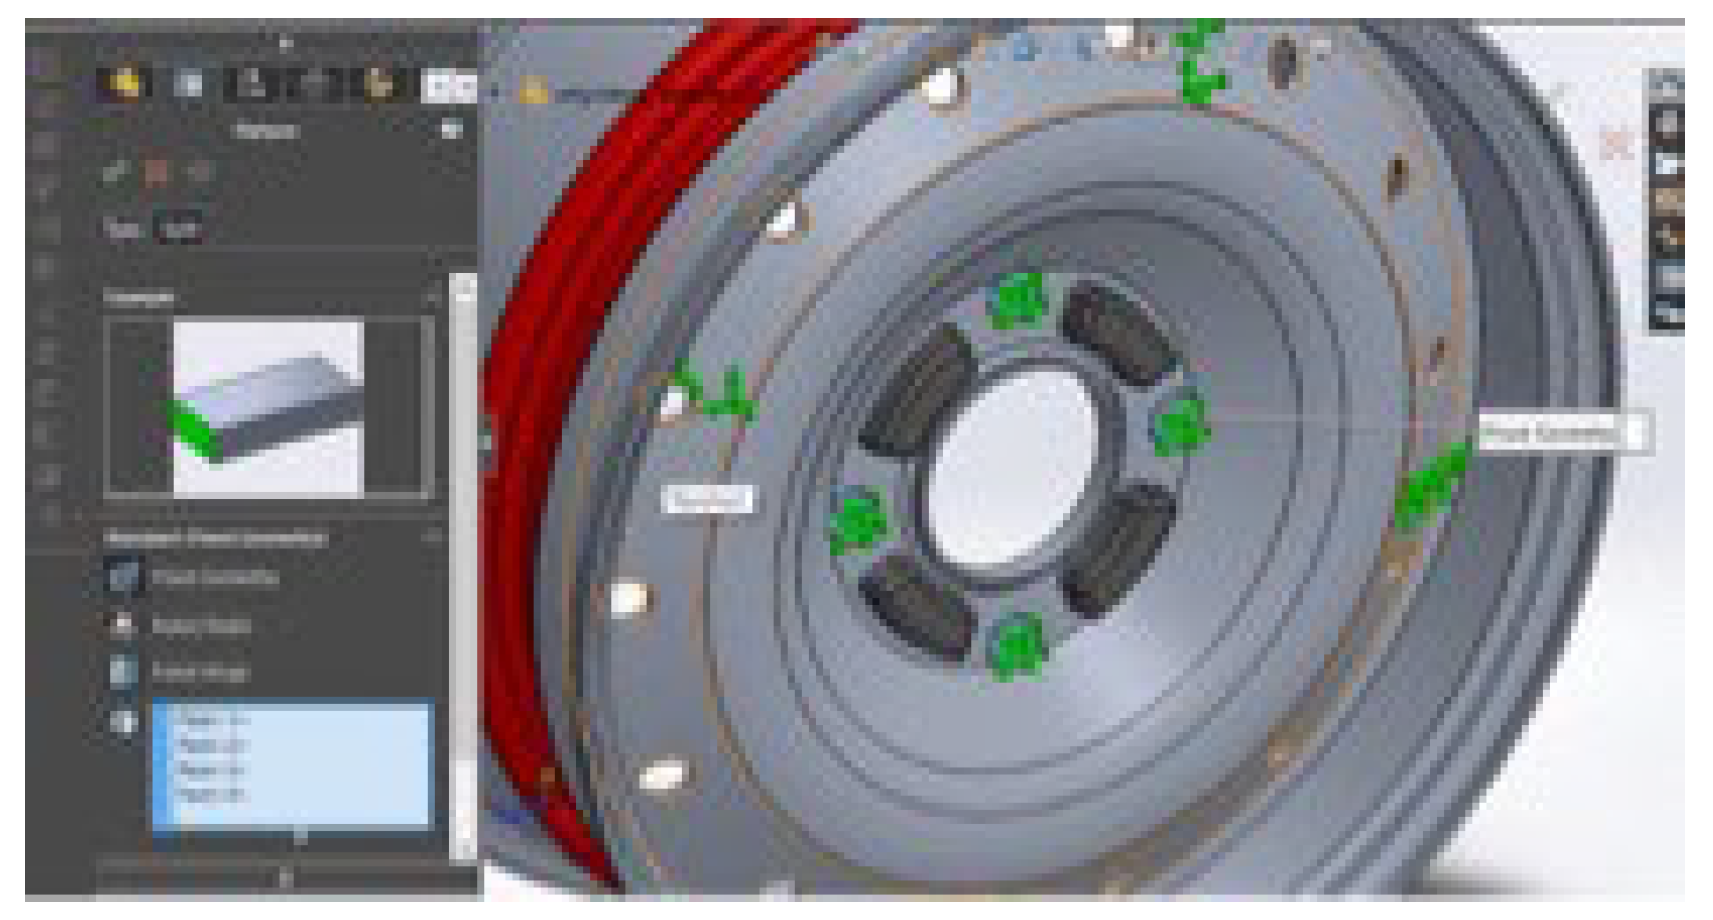
Solidworks "Fixed Geometry" or "Fixed Hinge" type anchors allow rotation but limit translation. Using this pedestal, researchers can lock or limit translation at the wheel fulcrum so that translational movement is not allowed [
21]. However, wheels can still rotate or move in the desired direction of rotation as shown in
Figure 9:
The part that is used as a fulcrum is where the bolt is where the hub is connected to the wheel.
- 2.
Variation of mesh
The mesh parameter or the size of the mesh elements in numerical simulations is an essential factor affecting the simulation results' accuracy and reliability. A mesh element size that is too large can result in inaccurate numerical simulation results, while a mesh element size that is too small can worsen computation time and produce insignificant data [
22].
In order to obtain an accurate and efficient numerical solution, the effective mesh parameters must be chosen carefully. Usually, the mesh parameters are selected through a convergence study. This is done by comparing the numerical simulation results with different mesh element size variations and selecting the mesh element size that produces the most stable and accurate results. [
23].
- 3.
S-N curve
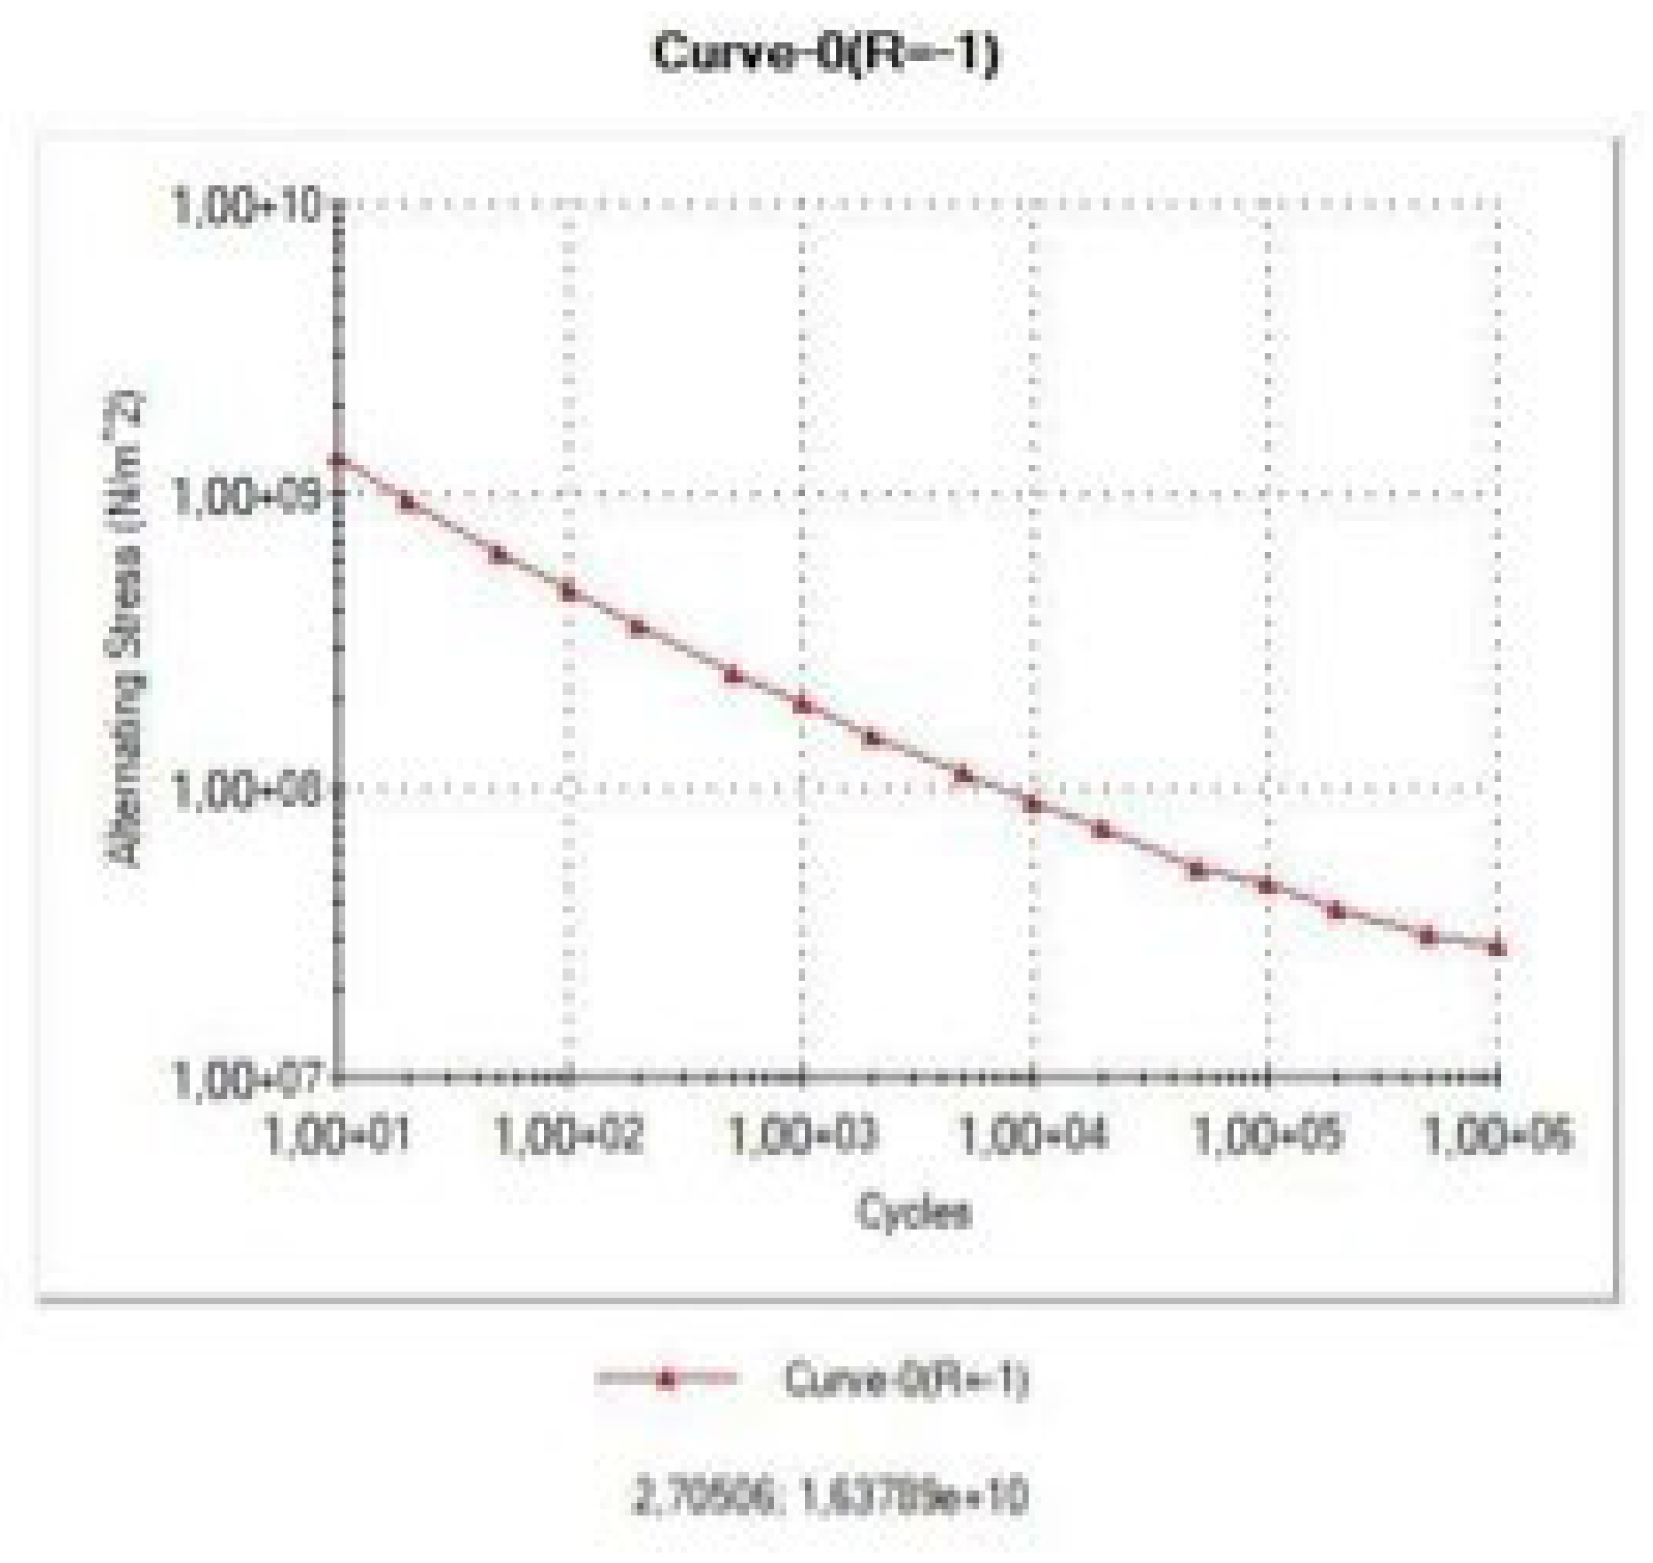
The S-N curve is a graph of the magnitude of the cyclic stress (S) on the logarithmic scale of the failure cycle (N). The S-N curve is derived from tests on material samples that will be generalized for that material. The testing machine determines the magnitude of the sinusoidal stress, and then, from the test results, it is obtained that the material cycle results in failure [
24]. The input curve used is the ASME carbon steel curve in the Solidwork 2019 library, as shown in
Figure 10:
- 4.
Input Condition Study
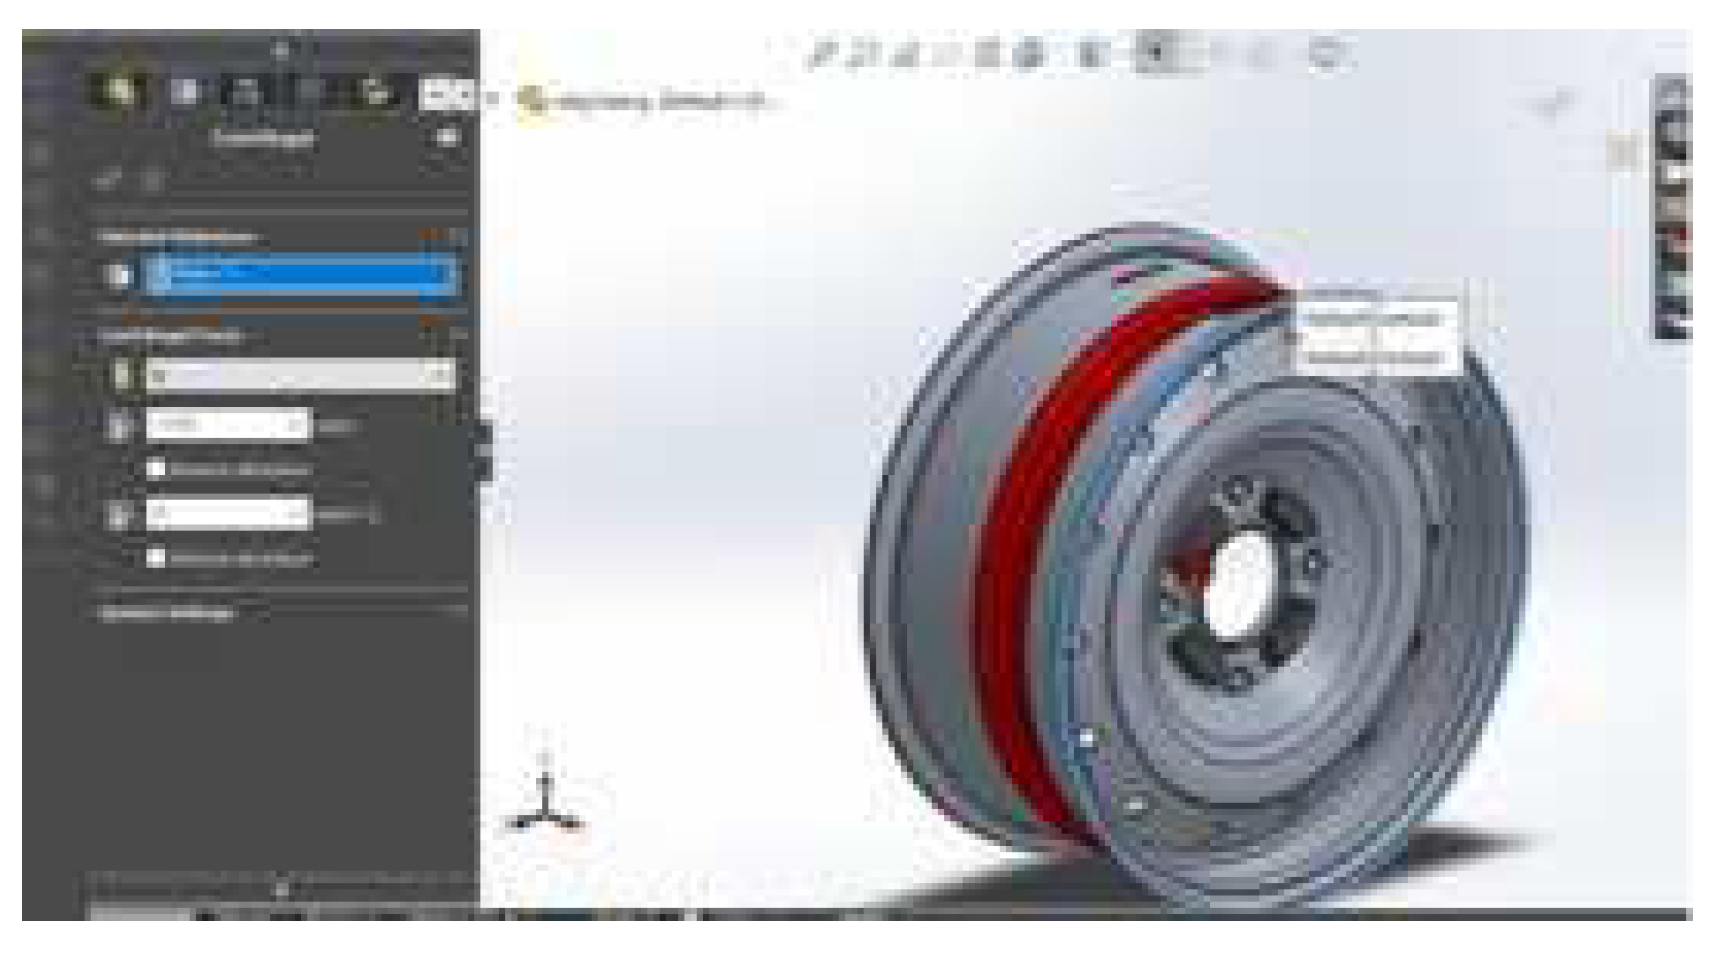
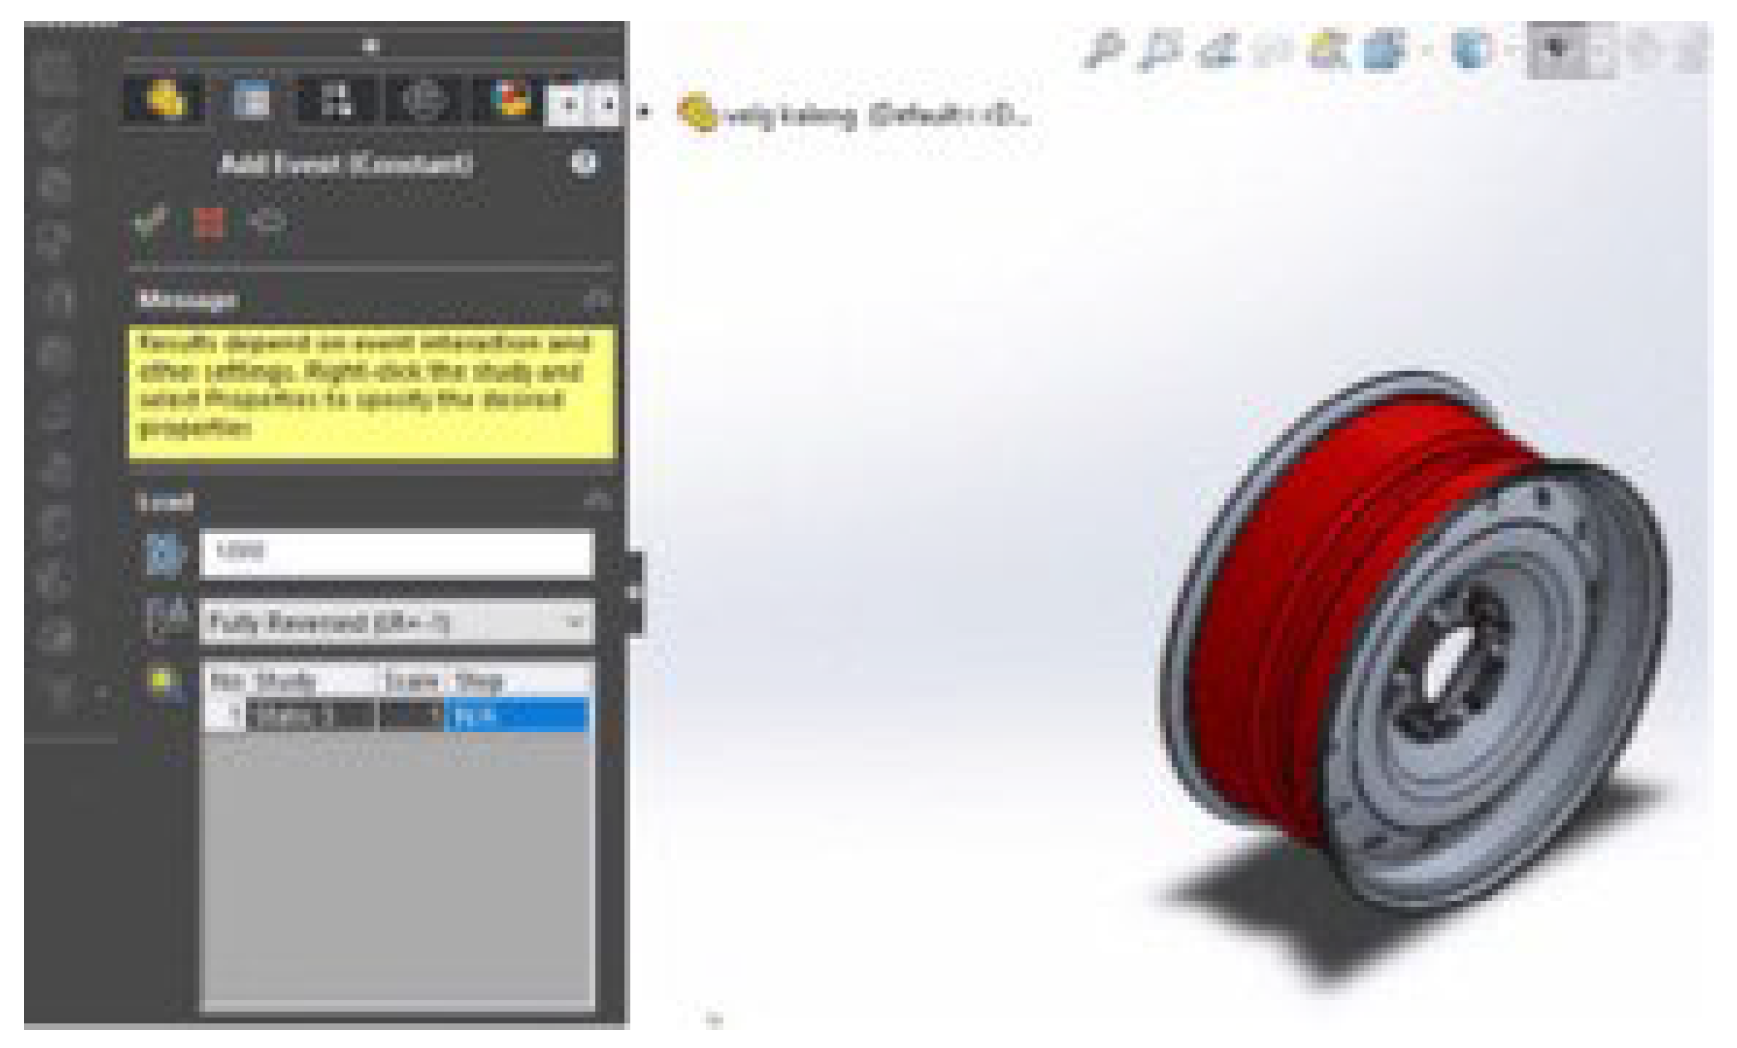
The conditions entered are static conditions, scale 1:1 and for 1000 iterations as shown in
Figure 11:
with R=-1, A=~ (fully reserved conditions) then the allowable amplitude stress is the fatigue limit value (Se). Thus if the average voltage is greater then the amplitude voltage must be lowered [
13].
4. Discussion
1.1. Mesh Variation
After carrying out variations of the mesh in the static simulation, the most effective mesh data will be obtained which will be presented in
Table 3:
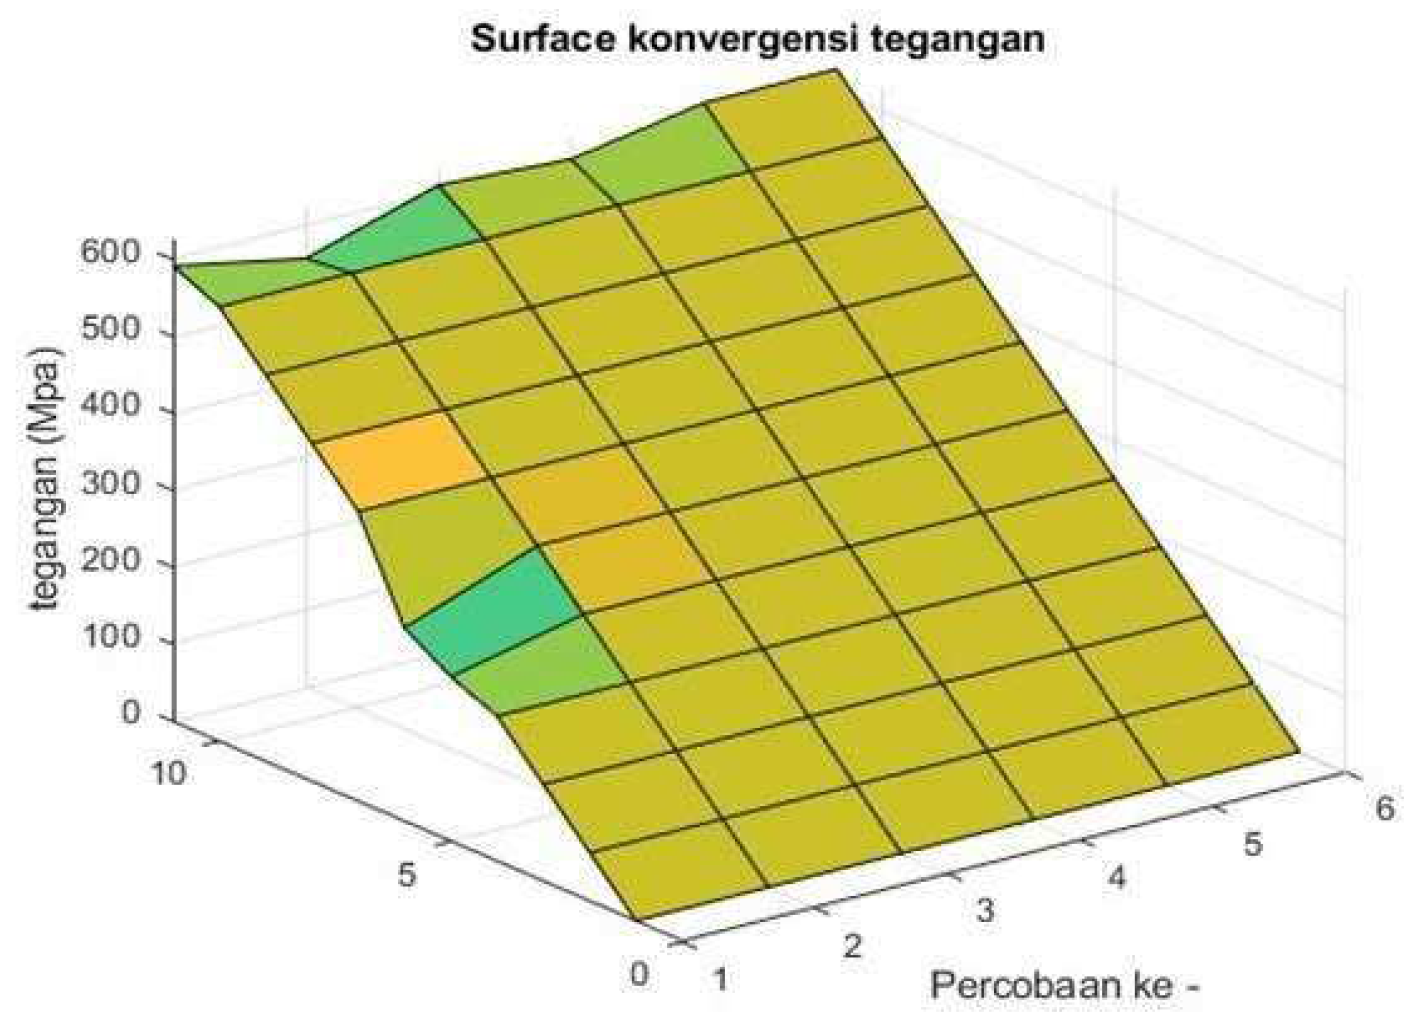
From the table, it is obtained that the most effective mesh used is a mesh with a max size of 25 mm and a running factor of 0.087890; this is considered the most effective mesh due to several factors, namely:
Has a running factor value that is not far adrift from other experiments
Has a stable running factor value
An experiment with few elements but not far adrift from the above experiment.
It is an experiment with more minor results than the experiment under it.
Alternatively, in other words, the researcher chose the number of meshes because it has a small mesh value, but the value is not far from a large mesh so that when testing, the results will converge faster with results that are not far from processing a long experiment, as shown in
Figure 12.
1.2. Static simulation results
In the static simulation, the values of stress, strain, displacement, and Running Factor are obtained. The following is the data from the static simulation results:
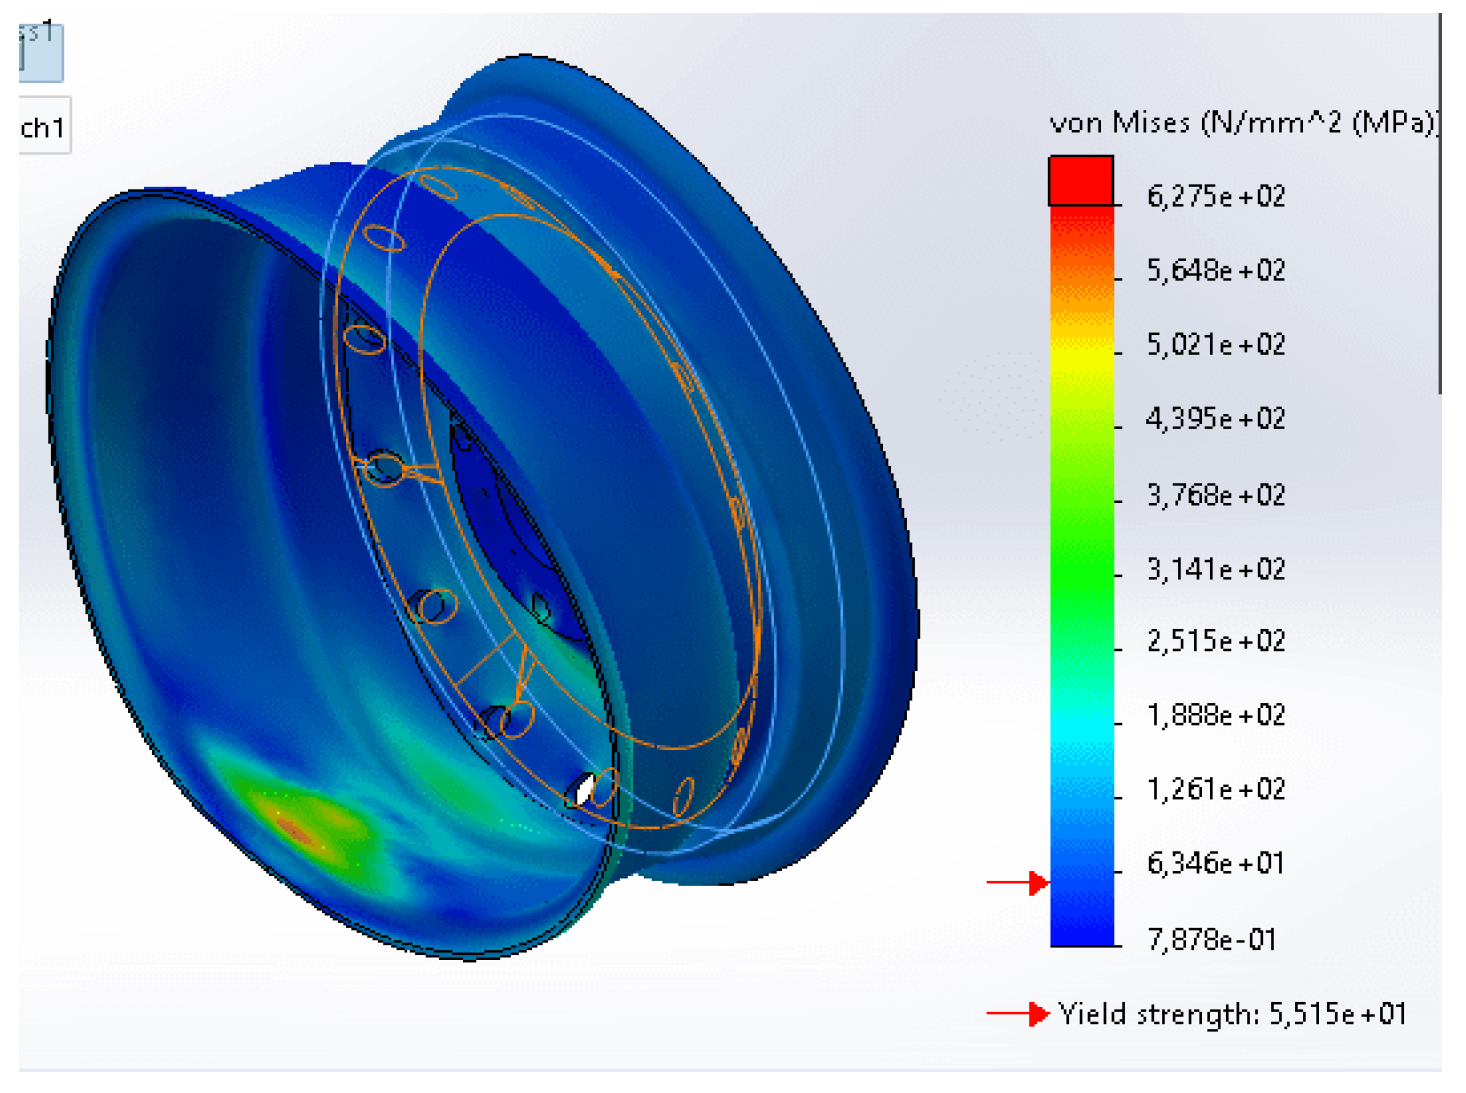
Wheels have a minimum stress value of 0.787808 (MPa) and a maximum of 627.4702 MPa, with the stress distribution symbolized by color as shown in
Figure 13:
The part of the wheel experiencing maximum stress is the tire support. This is because this part absorbs the most pressure caused by loading on it and cannot transmit pressure to the bottom because it is held back by pressure from the ground, and is denoted in red so that this area will get a high concentration of stress, this was also explained in previous studies. [
25,
26,
27]. Loi et al [
27] The maximum stress equivalent von Misses occurs in the joint area between the rim wheel and the spokes.
- B.
Strain
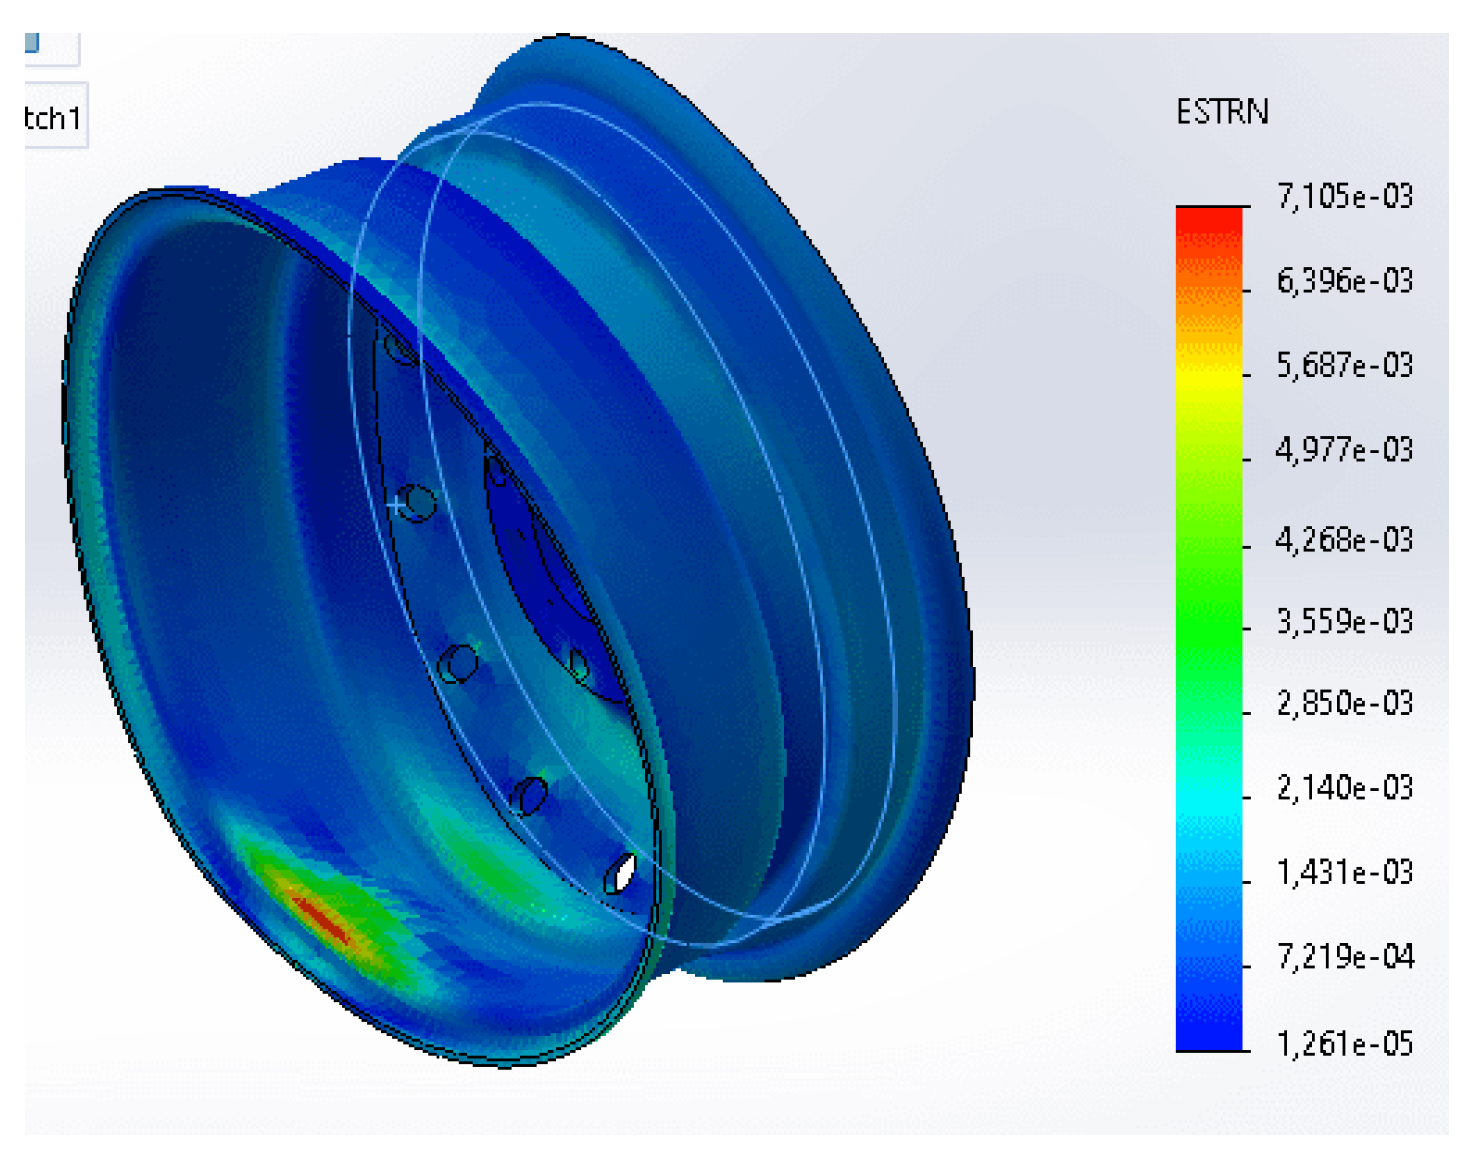
Wheels have a maximum strain value of 0.007105, with the spread of strain symbolized by the color shape as shown in
Figure 14:
The spread of strain is the same as the stress. The difference lies in the type of size being measured. Strain measures deformation or deformation, while stress measures the amount of force applied to a material.
Figure 14 shows that the increase in strain occurs in the outer area of the wheels. This was also shown in previous studies. [
9,
28].
- C.
Displacement
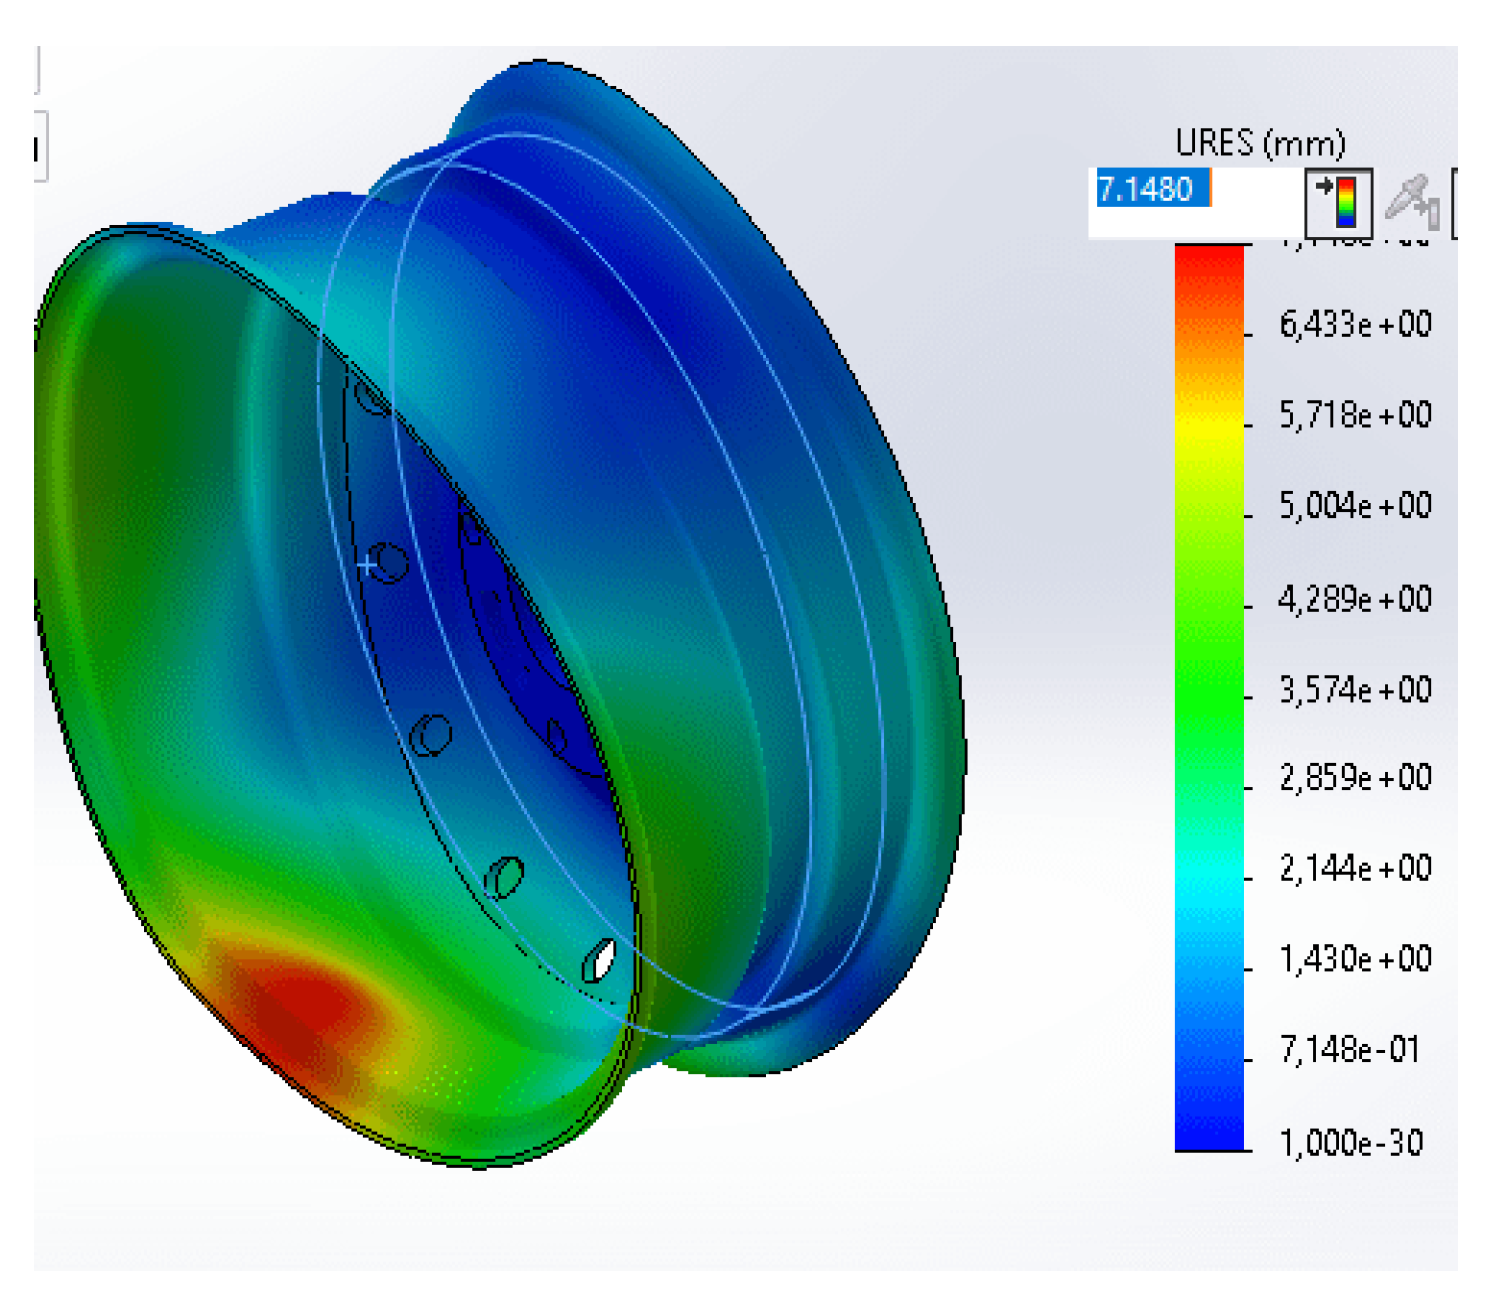
Displacement is the movement or shift of an object or point from its original position to a new position. The position shift on this wheel can be shown in
Figure 15
In the same way that the color distribution voltage in displacement has the same way of working, in the picture, a substantial positional displacement occurs on the upper rear wheel surface—dominant backward.
- D.
Factor of safety
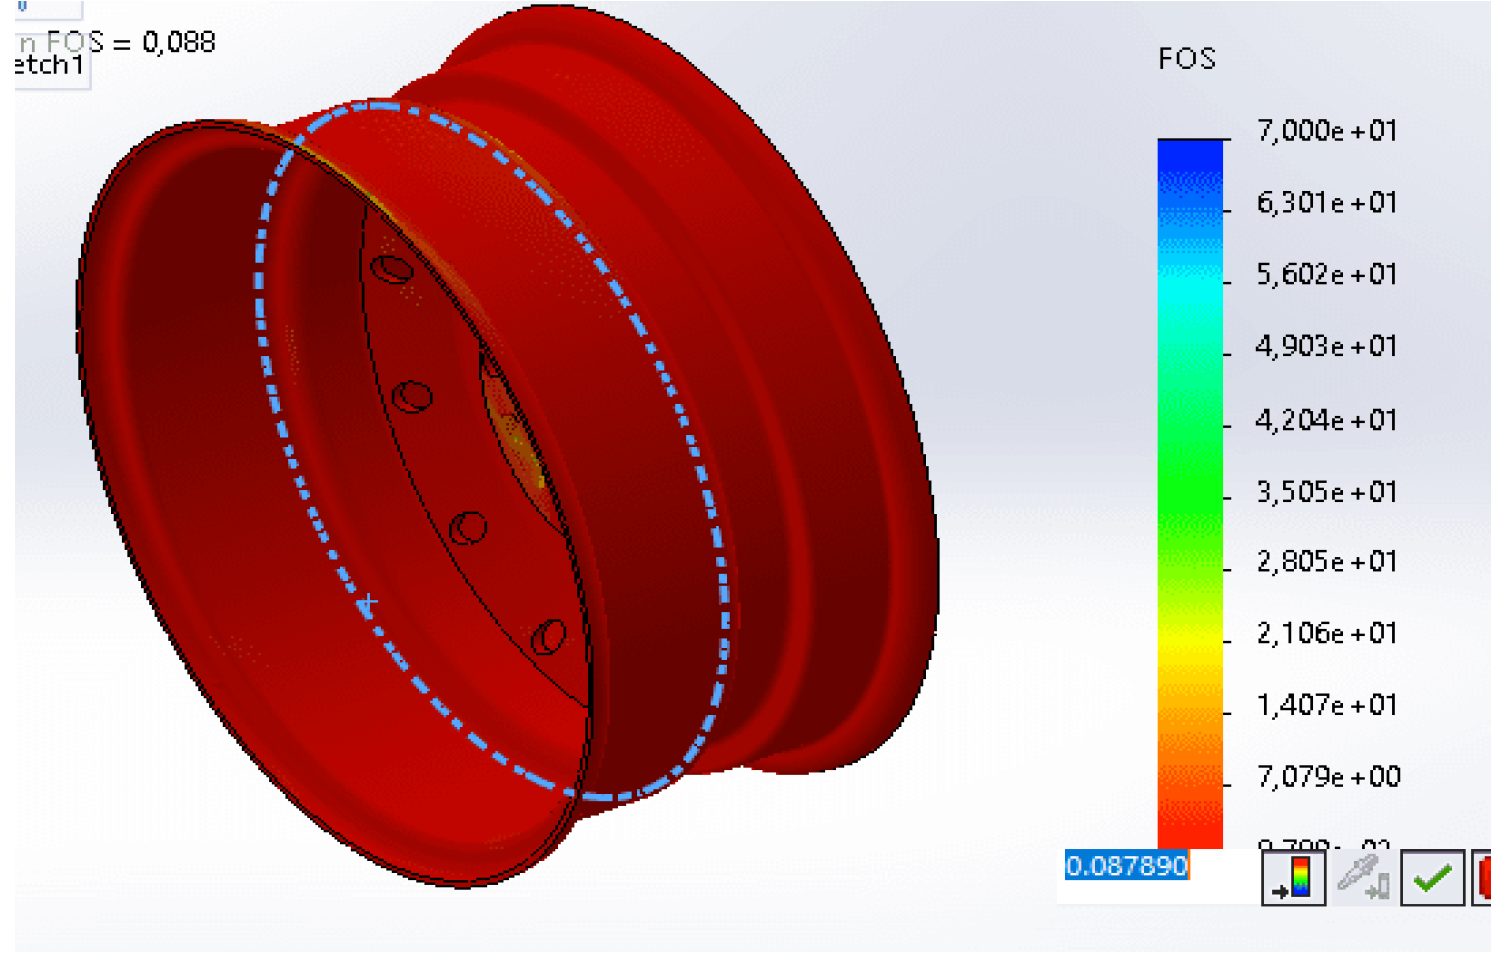
The safety factor Is calculated by dividing the allowable or safe load capacity by the load expected or applied to the structure or component. In industry, in general, this FOS must be close to 1, and there are also those who make three the standard [
29]. Based on the test, the safety factor of the wheels is 0.087890. shown is
Figure 16.
1.3. Fatigue simulation results
- A.
Damage plot
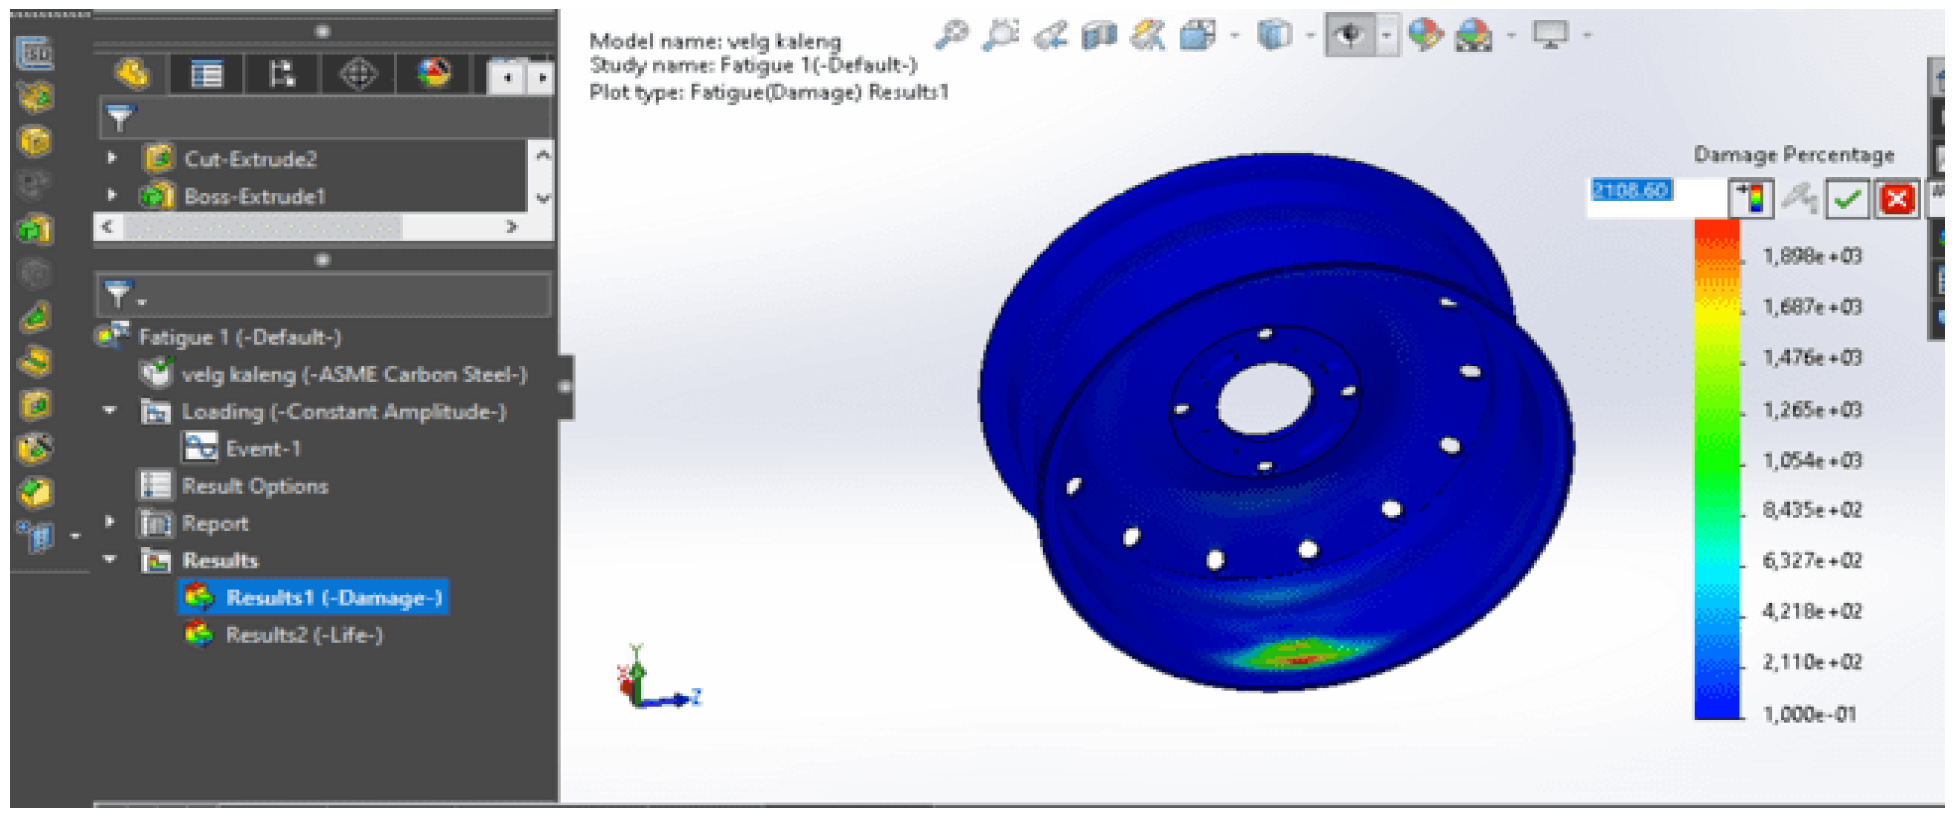
Damage plots usually depict accumulative damage or fatigue in terms of the percentage of fatigue life used by the material [
30]. Lighter or more intense colors indicate areas of high damage, while darker or dimmer colors indicate areas of low damage shown in
Figure 17:
A damage plot is a handy tool in the product design and development process because it allows engineers and designers to understand how a structure will react to a given load, as well as identify areas that may need improvement or design changes to optimize product performance and strength, from the appearance of the damage plot. On wheels, few points have changed, or visually, no points have been damaged, so no design changes are needed. From the simulation results, the resulting damage plot is 2108.60.
- B.
Life Plot
A life plot is a visualization of the age of a structure or component in working conditions. In the process of strength analysis in Solidworks, life plots are used to visualize the life of a structure or component in a model given a particular load or force [
31].]. The life plot shows areas in the model that have a shorter or longer life than other areas.
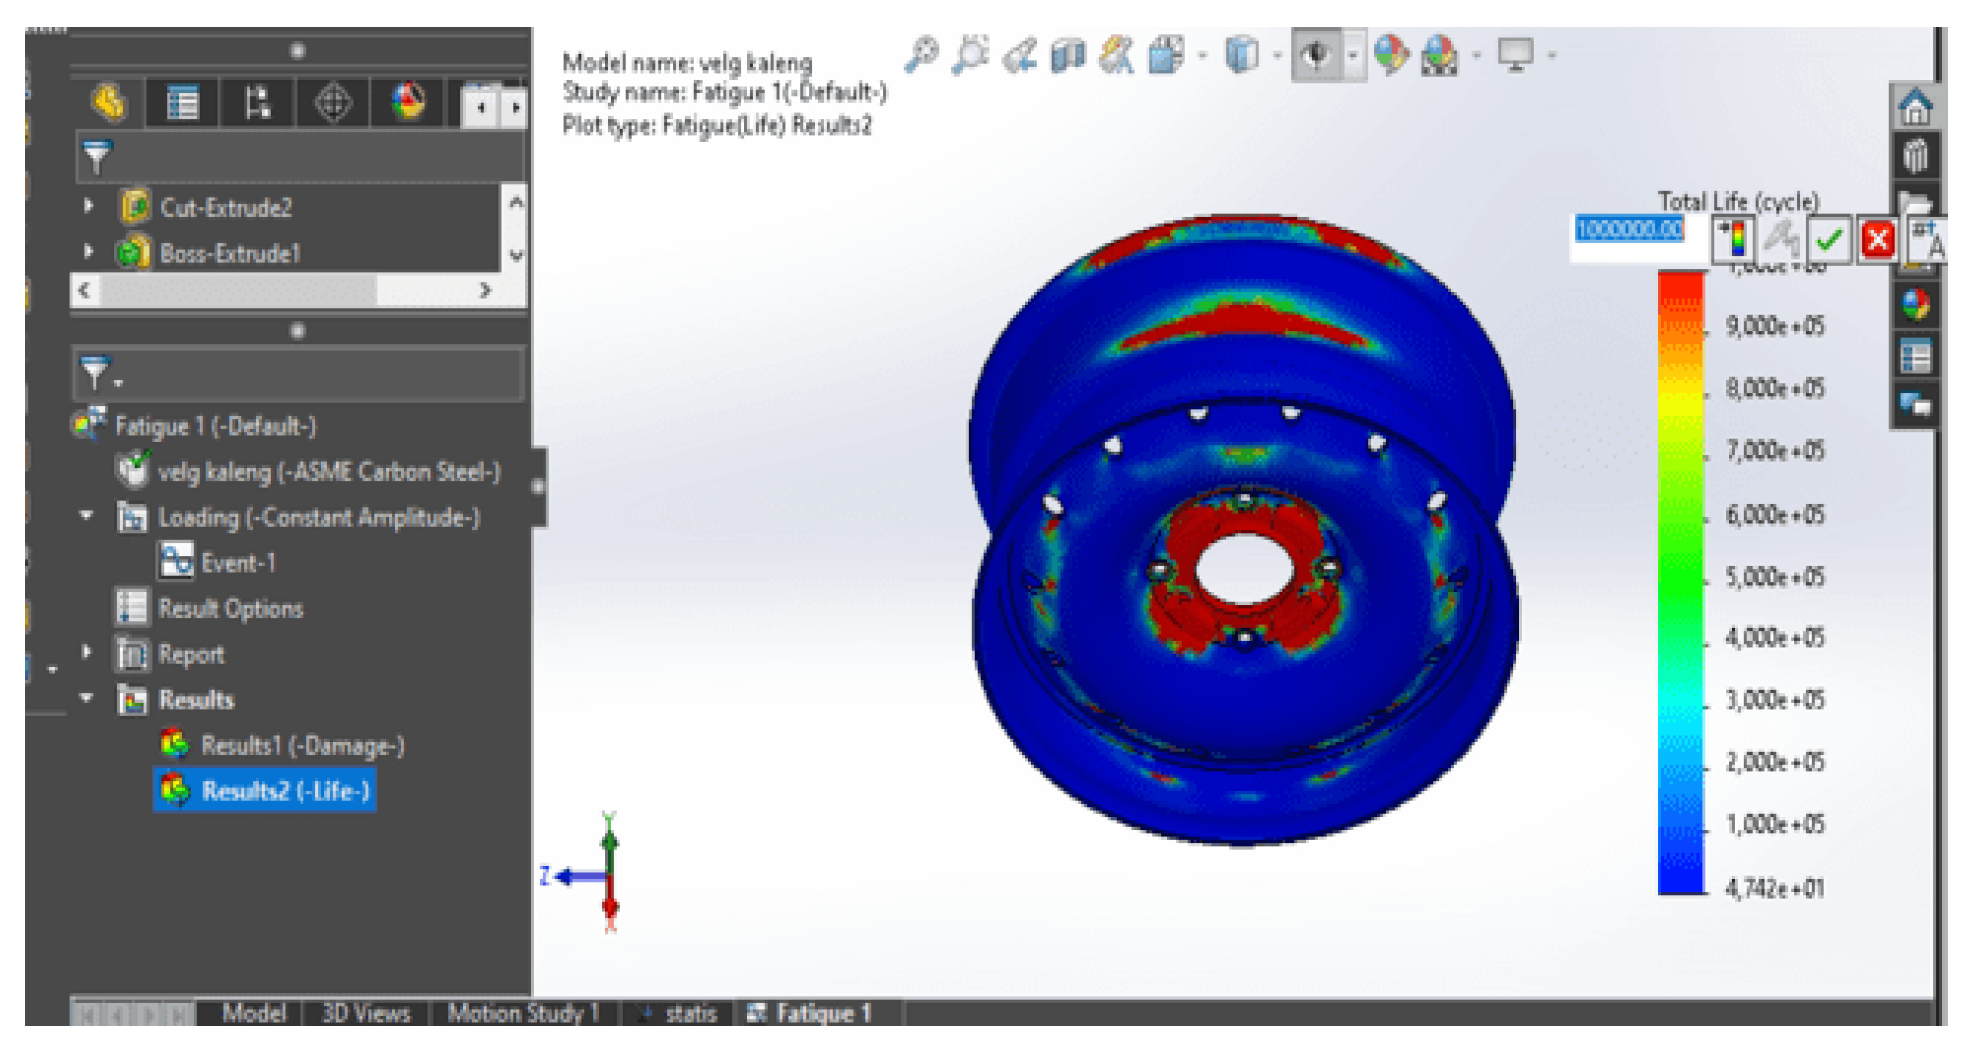
Figure 18 shows that the center area of the rim wheel has a shorter life because it gets greater force and pressure so that it will easily experience deformation; this was also shown in previous studies [
27,
32]. In the life plot, the color displayed on the model shows the age of each point in the model ; [
23] here is the visualization of the life plot in
Figure 18:
From the picture above, it is obtained that the life plot value is 1000,000 at its maximum point so that it can be said that this life fatigue value meets the SAE J 328 standard with a minimum Cycle of 600,000.
The impact of this research on car users is that they can find out the maximum load limit that can be absorbed by wheels with the weight recommended by the SAE 328 J standard, the maximum weight of the car wheels studied is 793.75 kg per wheel, and 3,175 kg for the overall weight, or it can be In conclusion, the load of the car and components weighs 1400, so the car can carry a load of 1775 kg, so the user can control the age of the wheels by limiting the use of loads on the car, from the cycle life value of this xenia car it can reduce according to use if the user loads reach the maximum limit or more than that the wheels will crack.
The impact for manufacturers of this type of wheel can be input related to design or design optimization by adding or reducing the materials used so that these wheels become optimal with the critical point orientation resulting from this fatigue simulation without carrying out tests using the trial and error method which costs a lot—time, tools, and equipment.
As well as other impacts, namely on students and students, this research is expected to be a reference for students carrying out fatigue simulations because this study includes steps from the initial preparation of data collection to the presentation of research results which in similar studies, there is very little information about the stages of fatigue simulation.
5. Conclusions
The fatigue analysis process on car wheels with the finite element method uses Solidworks. Based on the static simulation, which is used as the boundary for the analysis conditions on the wheels, the equivalent von Misses maximum stress results are 627.4702 MPa. Fatigue results on xenia 2011 car wheels with finite element method using Solidworks results from fatigue simulation on wheels according to SAE J 328, minimum fatigue life of 600,000 cycles for this type of dynamic radial test, and from the simulation results in this study, it produces 1000,000 cycles or 1000,000 complete cycles the load applied to the rim.
6. Patents
This section is not mandatory but may be added if there are patents resulting from the work reported in this manuscript.
Supplementary Materials
The following supporting information can be downloaded at: Preprints.org, Figure S1: title; Table S1: title; Video S1: title.
Author Contributions
For research articles with several authors, a short paragraph specifying their individual contributions must be provided. The following statements should be used “Conceptualization, X.X. and Y.Y.; methodology, X.X.; software, X.X.; validation, X.X., Y.Y. and Z.Z.; formal analysis, X.X.; investigation, X.X.; resources, X.X.; data curation, X.X.; writing—original draft preparation, X.X.; writing—review and editing, X.X.; visualization, X.X.; supervision, X.X.; project administration, X.X.; funding acquisition, Y.Y. All authors have read and agreed to the published version of the manuscript.” Please turn to the CRediT taxonomy for the term explanation. Authorship must be limited to those who have contributed substantially to the work reported.
Funding
Please add: “This research received no external funding” or “This research was funded by NAME OF FUNDER, grant number XXX” and “The APC was funded by XXX”. Check carefully that the details given are accurate and use the standard spelling of funding agency names at
https://search.crossref.org/funding. Any errors may affect your future funding.
Institutional Review Board Statement
Not applicable.
Informed Consent Statement
Not applicable.
Data Availability Statement
Not applicable.
Acknowledgments
Researchers thank the Institute for Research and Community Service (LPPM) through the Automotive Engine Department of the Piksi Ganesha Indonesia Polytechnic; Researchers can make an excellent contribution to this research, especially to students and fellow lecturers across universities who have helped in the research process.
Conflicts of Interest
The authors declare that they have no known competing financial interests or personal relationships that could have appeared to influence the work reported in this paper.
References
- R. Anggraini, “Analisis frekuensi optimum pengujian horizontal fatigue pada berbegai rangka sepeda tipe trekking dengan metode elemen hingga,” pp. 1–51, 2016.
- Fahd Riyal Pris, Budhi M Suyitno, and Amin Suhadi, “Analisis Kekuatan Velg Aluminium Alloy 17 Inc Dari Berbagai Desain Menggunakan Metode Finite Element Analysis (Fea).,” Teknobiz J. Ilm. Progr. Stud. Magister Tek. Mesin, vol. 9, no. 2, pp. 33–39, 2019. [CrossRef]
- and N. S. R. A. Kusmiran, Z. Abidin, M. Hidayat, R. Desiasni, “MECHANICAL FATIGUE LIFE ANALYSIS OF STEEL LEAF SPRING STRUCTURE USING FINITE ELEMENT METHOD,” 3rd Int. Conf. Sci. Technol., pp. 154–162, 2018.
- Ö. SUNAR and M. ÇEVİK, “fatigue analysis of single leaf springs with finite element method,” Bayar Univ. J. Sci., vol. 11, p. no. 1, pp. 1–6, 2015.
- M. V. K. Aher and M. P. M. Sonawane, “Static and fatigue analysis of multi leaf spring used in the suspension system of LCV,” Int. J. Eng. Res. Appl, vol. 2, no, pp. 1786–1791, 2012.
- A. Andoko et al., “Failure analysis on the connecting rod by finite element method,” AIP Conf. Proc., vol. 2262, 2020.
- K. AbhinavGautam and P. Ajit, “tatic stress analysis of connecting rod using finite element approach,” IOSR J. Mech. Civ. Eng, vol. 10, n, pp. 47–51, 2013.
- M. Bahri, “Strength Analyze of Passenger Car on Dynamic Radial Fatigue Simulation Test Using Finite Element Methods,” 2016.
- and I. P. A. A. A. B. Prasetiyo, K. A. Sekarjati, “Analisis Frekuensi Natural Velg Ring 16 Menggunakan Finite Element Method,” Pros. Nas. Rekayasa Teknol. Ind. dan Inf. XVII, pp. 354–359, 2021.
- T. Sihombing, “memahami apa itu Velg dan cara bacanya,” 2022. Velg adalah salah satu komponen kendaraan yang paling esensial, tanpanya mobil tidak bisa melaju. Selama bertahun-tahun, mobil telah mengalami banyak evolusi. Desain eksterior, interior, mesin hingga teknologi dan fitur berkali-kali mengalami variasi. Tet (accessed Jan. 31, 2023).
- “ANALISA PEMBEBANAN STATIC TERHADAP KEKUATAN VELG RACING SEPEDA MOTOR YAMAHA MATIC DENGAN MENGGUNAKAN SOFTWARE SOLIDWORK.pdf.”.
- J. Marta, “Simulasi Pengujian Fatigue Pada Fork Racing Bicycle Menggunakan Standar Cen 14781,” 2016.
- D. Yan Kosasih, W. Anggono, and F. Dwiputra Suprianto, “Optimasi Desain Pelek Mobil Melalui Simulasi Pengujian Impact Sesuai Standar Sae J175,” pp. 1–5.
- M. A. Hendrawan, P. I. Purboputro, M. A. Saputro, and W. Setiyadi, “Perancangan Chassis Mobil Listrik Prototype ‘ Ababil ’ dan Simulasi Pembebanan Statik dengan Menggunakan Solidworks Premium 2016,” 7th Univ. Res. Colloq. 2018, pp. 96–105, 2018.
- S. Suryady, “Design Dan Analisis Velg Racing Mobil Dengan Simulasi Von Mises Menggunakan Software Solidworks 2018,” 2018.
- S. Yerri, “Dasar – Dasar Metode Elemen Hingga,” Yogyakarta Andi, 2004.
- F. T. Industri, “DYNAMIC CORNERING FATIGUE BERDASARKAN SAE J 328 DENGAN METODE STATIC STRUCTURAL ANALYSIS,” 2017.
- Z. Wheel, “2011 Daihatsu Xenia Xi AT - Zigwheels Indonesia,” Zeeg Wheel, 2023. https://www.zigwheels.co.id/mobil-bekas/daihatsu/xenia/xi-at-523377/.
- B. A. Nugraha, P. Studi, and T. Kelautan, “ANALISIS SPECTRAL FATIGUE PADA,” pp. 1–5, 2013.
- A. Suhada, “Analisis Konduktivitas Termal Pada Berbagai Jenis Logam Dengan Menggunakan Aplikasi Solidworks,” Fak. Tek. Univ. Muhammadiyah Sumatera Utara, 2021.
- wordpress, “Impact Test Wheel.,” wordpress, 2016. https://dutafisika.wordpress.com/2018/12/23/tegangan-regangan-dan-modulus-elastisitas/ (accessed May 08, 2023).
- A. Saravanan, P. Suresh, V. Arthanari, S. Nethaji, and S. Muthukumar, “Design and analysis of trestle hydraulic jack using finite element method,” Int. J. Mech. Prod. Eng. Res. Dev., vol. 8, no. 6, pp. 437–448, 2018. [CrossRef]
- T. Mulyana, D. Sebayang, A. M. D. Rafsanjani, J. H. D. Adani, and Y. S. Muhyiddin, “Mesh control information of windmill designed by Solidwork program,” IOP Conf. Ser. Mater. Sci. Eng., vol. 277, no. 1, 2017. [CrossRef]
- M. Awwaluddin, “Analisis Fatigue Life Struktur Dudukan Bogie Monorail Utm 125 Kapasitas 24 Ton Menggunakan Metode Finite Element,” J. Tek. Mesin Cakram, vol. 2, no. 2, p. 59, 2020. [CrossRef]
- A. J. Nuru and M. I. P. Hidayat, “ANALISIS DESAIN PROFIL RIM VELG TRUCK PADA PROSES PENGEROLAN DENGAN METODE ELEMEN HINGGA,” Inst. Teknol. Sepuluh Nop., 2017.
- and N. S. K. M. M. Topaç, S. Ercan, “Fatigue life prediction of a heavy vehicle steel wheel under radial loads by using finite element analysis,” Eng. Fail. Anal, vol. 20, pp. 67–79, 2012, doi: doi: . [CrossRef]
- C. Y. Loi and H. Y. Choy, “Modelling and Fatigue Analysis of Automobile Wheel Rim,” 5th Int. Conf. Control. Autom. Robot., pp. 696–701, 2019, doi: doi: 10.1109/ICCAR.2019.8813410.
- and R. A. R. A. Rizqi, R. Rifky, “Analisis Dinamika Eksplisit Pada Pelek Ring 15 Dengan Metode Simulasi Uji Impak,” Teknobiz J. Ilm. Progr. Stud. Magister Tek. Mesin, vol. 13, n, pp. 101–106, 2023.
- J. Dižo, J. Harušinec, and M. Blatnický, “Computation of modal properties of two types of freight wagon bogie frames using the finite element method,” Manuf. Technol., vol. 18, no. 2, pp. 208–214, 2018. [CrossRef]
- Society of Automotive Engineer (SAE), “Wheels Passenger Car and Light Truck Performance Requirements and Test Procedure,” United State Am., 2005.
- A. Ramadhan, “Perancangan dan Pembuatan Sambungan Seat Tube Sepeda Menggunakan 3D Printer dengan Perkuatan Lapisan Fiberglass,” 2022.
- E. M. A. and E. O. Nangi, “Computer aided design and simulation of radial fatigue test of automobile rim using ANSYS,” IOSR J. Mech. Civ. Eng, vol. 11, n, pp. 68–73, 2014.
|
Disclaimer/Publisher’s Note: The statements, opinions and data contained in all publications are solely those of the individual author(s) and contributor(s) and not of MDPI and/or the editor(s). MDPI and/or the editor(s) disclaim responsibility for any injury to people or property resulting from any ideas, methods, instructions or products referred to in the content. |
© 2023 by the authors. Licensee MDPI, Basel, Switzerland. This article is an open access article distributed under the terms and conditions of the Creative Commons Attribution (CC BY) license (http://creativecommons.org/licenses/by/4.0/).
