
Submitted:
24 October 2023
Posted:
25 October 2023
You are already at the latest version
Abstract
Drug-target affinity (DTA) prediction is crucial for understanding molecular interactions and aiding drug discovery and development. While various computational methods have been proposed for DTA prediction, their predictive accuracy remains limited, failing to delve into the structural nuances of interactions. With increasingly accurate and accessible structure prediction of targets, we developed a novel deep learning model, named S2DTA, to accurately predict DTA by fusing sequence and structural knowledge of drugs, targets, and pockets using heterogeneous models based on graph and semantic networks. Experimental findings underscored that complex feature representations imparted negligible enhancements to the model’s performance. However, the integration of heterogeneous models demonstrably bolstered predictive accuracy. In comparison to three state-of-the-art methodologies, the supremacy of S2DTA became strikingly apparent. It showcased a noteworthy 25.2% reduction in Mean Absolute Error (MAE) and an impressive 20.1% decrease in Root Mean Square Error (RMSE). Furthermore, S2DTA exhibited substantial advancements in other pivotal metrics, including Pearson Correlation Coefficient (PCC), Spearman, Concordance Index (CI), and R2. These metrics experienced remarkable increments of at least 19.6%, 17.5%, 8.1%, and a remarkable 49.4%, respectively. Finally, we conducted interpretability analysis on the effectiveness of S2DTA by bidirectional self-attention mechanism, fully proving that S2DTA is a valuable and accurate tool for predicting DTA. For further exploration, the source data and code repository can be accessed at https://github.com/dldxzx/S2DTA.
Keywords:
graph neural network
; convolutional neural network
; drug-target affinity
; sequence and structural knowledge
; heterogeneous models
Introduction
Target proteins are crucial biological macromolecules that play diverse roles in cells. Identifying drug-target interactions is an important process in drug discovery [1]. Calculating drug molecule with high binding affinity against the target is a crucial step in early-stage drug research [2]. The successful identification of drug-target affinity (DTA) has received long-term attention from academia and industry due to its significant role in drug discovery and design [3]. Typically, drug molecules interact with specific targets through direct physicochemical interactions in shallow hydrophobic depressions on the surface of targets known as pockets [4,5]. Biological experimental observations suggest that the amino acid composition and properties of these pockets are vital determinants for drug-target interactions [4].
The most accurate method to determine DTA is measuring the half maximal inhibitory concentration (IC50) between a pair of drugs and targets using bioassays [6]. However, traditional biological experiments to measure DTA are time-consuming, labor-intensive, and resource-intensive [7]. With the increasing number of drug molecules and targets in databases, experimental characterization of all possible drug-target pairs becomes nearly impossible. To address this, numerous computational methods have been developed to predict DTA [8,9,10,11], with some deep learning models based on sequence or/and structural knowledge showing promising results [12,13].
Most DTA prediction models based on deep learning, including DeepDTA [9], DeepDTAF [10], DeepAffinity [14], FusionDTA [15], WideDTA [16], AttentionDTA [17], DeepCDA [18], and MRBDTA [19], primarily rely on sequence knowledge of drugs and targets. These sequence-based methods leverage Convolutional Neural Networks (CNNs) [20], Recurrent Neural Networks (RNNs) [21], or attention mechanism [22] to extract high-level features from the sequences of drugs and targets. For instance, DeepDTA used three consecutive 1D-convolutional layers to extract local features from drug SMILES and the sequences of targets, which were then passed through three fully connected (FC) layers for DTA prediction. On the other hand, DeepDTAF employed three independent CNN blocks to learn high-level features from the sequences of drugs, targets, and pockets. These CNN blocks consisted of a 1D-convolutional layer for extracting local features from pockets and two 1D dilated convolutional networks [23] for deciphering global features of drugs and targets, respectively. MRBDTA utilized the Trans block with a multi-head attention mechanism to extract molecule features from drug SMILES and the sequences of targets. Then interaction learning integrated these extracted features for DTA prediction. While sequence-based approaches are effective in predicting DTA, it is evident that their performance can be further enhanced if structural knowledge is incorporated. For example, in DeepDTAF, the pocket knowledge which is essentially obtained from both its sequences and structures may achieve higher performance. Furthermore, these methods are limited in providing a reasonable interpretation of drug-target interactions due to the lack of structural knowledge.
While the structures of targets are challenging to obtain experimentally, some methods, such as GraphDTA [11], MgraphDTA [24], and DGraphDTA [25], have successfully extracted high-level features from a limited number of the structures of drugs and targets to predict DTA. For instance, GraphDTA recognized the structures of small molecules and employed graph convolutional networks (GCNs) [26] to extract graph-based features. In MgraphDTA, multiscale graph neural networks (MGNN) were utilized to extract multiscale features from the input graph of drug. In DGraphDTA, the structures of targets were represented as graphs based on the contact maps and then combined with the graphs of drugs to predict DTA by two GCNs. Although structure-based methods offer better interpretation, they do have some limitations: (1) the full potential of structural knowledge of drugs and targets remains untapped; (2) most models lack the utilization of semantic knowledge in sequence format, relying solely on structural data for DTA prediction; (3) the 3D spatial positions of the atoms in targets are not fully characterized, as some methods only use contact maps.
In recent years, the accumulation of experimentally resolved the structures of targets and the emergence of algorithms like AlphaFold [27], which accurately predict the structures of targets, have made obtaining high-quality structures for targets easier. To address the problem of insufficient feature extraction from the sequences and structures of drugs and targets in existing methods, a novel deep learning model called S2DTA was proposed. S2DTA predicted DTA by integrating the sequence and structural knowledge of drugs and targets using a heterogeneous model that combined GCNs and CNNs. Experimental results demonstrated that S2DTA outperformed three other state-of-the-art models by using simple feature representations. Additionally, we conducted an interpretability analysis on the effectiveness of S2DTA by bidirectional self-attention mechanism, fully proving that S2DTA is a valuable and accurate tool for predicting DTA.
Methods
2.1. Datasets
In line with current competing methods [9,10,11], we utilized a benchmark dataset from the PDBbind database (2016 version) [28] to train, validate, and test our model. This dataset comprises 13283 high-quality structures of drug-target complexes sourced from the Protein Data Bank (PDB, https://www.rcsb.org), along with experimental values of DTA, typically represented by . The training and testing datasets were constructed from the PDBbind database (2016 version), resulting in 12993 and 290 samples, respectively. To ensure the training efficiency of the model, the sequence length of targets was fixed at 2100 amino acids to cover 98.74% of samples (Supplementary Figure S1) of the training dataset. A total of four samples were excluded due to processing issues with the Biopython package [29]. Consequently, the training dataset comprises 12823 samples, while the testing dataset has 289 samples. The maximum length of drug SMILES (Simplified Molecular Input Line Entry System) [30] was chosen as the fixed length. Sequences of targets or drug SMILES shorter than their fixed lengths were zero-padded.
2.2. Sequence Representation
We utilized label encoding and one-hot encoding as baseline representations to depict the 20 commonly used amino acids in targets and the 27 different atoms in drugs. Label encoding employs a single number to differentiate objects, while one-hot encoding maps encoded objects to status registers, generating encoding vectors. To characterize diverse amino acids of targets and atoms of drugs, we selected 24 physical-chemical properties (Supplementary Table S1) and 9 physical-chemical properties (Supplementary Table S2), respectively. For the sequence features of targets, we extracted the position-specific scoring matrix (PSSM) [31] and utilized HHBlits [32] for aligning homologous sequences to achieve the Hidden Markov Models matrix (HMM). PSSM and HMM matrices, with dimensions of 20, encapsulate the features of the 20 commonly used amino acids in the sequences of targets. Furthermore, we harnessed multiple sequence processing models, including Protbert [33], CNN, and Word2Vec [34], to extract semantic features from the sequences of targets.
2.3. Structure Representation
To leverage structural insight, we devised a graph-based data format for drugs, targets, and pockets. In the case of drugs, the individual atoms composing the drug formed the vertices of its molecular graph. Covalent bonds from the .sdf or .mol2 files of drugs were employed to establish edges. Regarding the graphs of targets, the carbon α atoms of amino acid residues in the structures of targets were designated as vertices, and edges were established between any two carbon α atoms within a Euclidean distance of 8Å. The structure representation of pocket was consistent with the target.
2.4. Proposed S2DTA Approach
In this study, a deep learning method consisting of heterogeneous models, called S2DTA (see Figure 1), was proposed to accurately and interpretively predict DTA by fusing sequence and structural knowledge of drugs and targets. S2DTA was an end-to-end model that contained four modules: data input module, sequence learning module, structure learning module, and feature fusion module.
(1) Data input module: S2DTA processed the sequence and structure data of drugs, targets, and pockets, where input sequences were represented as one-hot encoded feature vector, and structure data included the molecular graphs for drugs and the graphs of targets and pockets.
(2) Sequence learning module: a 1D-CNN layer was employed to extract semantic features from both targets and pockets based on their sequence data. The 20-dimensional sequence data of targets underwent convolution with a kernel size of 5, a stride of 1, resulting in an output dimension of 128. Meanwhile, the 20-dimensional sequence data of pockets utilized a convolution kernel of size 3, with the remaining parameters identical to those used for targets.
(3) Structure learning module: three independent GCN networks, utilizing the message passing mechanism, were employed to extract high-level features from vertices within the graph-based representation of drugs, targets, and pockets. Each GCN network consisted of three layers of graph convolutions. In the case of targets and pockets, the feature dimension of each vertex was 128, with the three graph convolutional layers having dimensions of 32, 64, and 128, sequentially. The 128-dimensional feature vector obtained from the final graph convolutional layer for targets and pockets were linearly transformed into a 256-dimensional feature vector. For drugs, the 27-dimensional sequence data was the feature dimension of their vertices, and the dimensions of the three graph convolutional layers were 32, 64, and 128. Similarly, the 128-dimensional feature vector of drug from the third graph convolutional layer were linearly transformed into a 256-dimensional feature vector.
(4) Feature fusion module: the features extracted from drugs, targets, and pockets through GCN networks were concatenated, resulting in a comprehensive 256-dimensional feature vector. This feature vector was then fed into a FC network to predict DTA. The FC network comprised two linear layers. The initial linear layer, acting as a hidden layer, comprised 256 neurons. The subsequent linear layer, serving as the output layer, consisted of a single neuron responsible for producing the affinity.
2.5. Training Process
S2DTA underwent a training process spanning 300 iterations, with optimization carried out using Adam optimizer [35]. LeakyReLU activation function [36] was employed, and Mean Square Error (MSE) served as the chosen loss function. The hyperparameters adopted for S2DTA were as follows: a learning rate of 0.0001, a batch size of 128, and a dropout rate of 0.4.
2.6. Comparison Strategy
A comprehensive set of machine learning (ML) and deep learning (DL) models were employed in this study to establish a robust baseline for evaluation. The ML models encompassed ridge regression (RR), K nearest neighbor (KNN), support vector machine regression (SVR), decision tree (DT), and random forest (RF). On the other hand, the DL models comprised 1D-CNN and RNN. Additionally, a variety of graph-based models, including GCN, ChebyNet [37], GraphSAGE [38], GAT [39], and GIN [40], were meticulously tested.
The implementation of ML models was facilitated through the scikit-learn library (https://scikit-learn.org), while the DL models were meticulously crafted using the Pytorch package (https://pytorch.org/). Furthermore, the graph-based models leveraged the capabilities of the Deep Graph Library (DGL, https://www.dgl.ai/) to carry out their computations and operations.
2.7. Evaluation Metrics
Six evaluation metrics including Mean Absolute Error (MAE), Root Mean Square Error (RMSE), Pearson Correlation Coefficient (PCC), Spearman, Concordance Index (CI), and R2 were used to comprehensively evaluate the performance of the model. MAE is used to measure the mean absolute error between predictive and real values. It reflects the size of the real prediction error; RMSE is often used to measure the deviation between predictive and real values; PCC is used to measure the mutual relationship between two variables; Spearman is a nonparametric measure of the dependence of two variables; CI is an index used to evaluate the prediction accuracy of the model; R2 is mainly used to measure how well the predictive value fits the real value.
Results
3.1. Limited Performance Improvement by Using Only Sequence Knowledge
Numerous predictive models for DTA primarily rely on the sequences of targets due to the challenge of obtaining the experimental structures of targets. In our study, we conducted comprehensive tests involving both ML and DL models, comparing models that used solely sequence data against a fundamental GCN model that incorporated structural insights of targets (Table 1). Within the realm of ML models, RF exhibited the most promising performance across all evaluation metrics. Specifically, MAE, RMSE, PCC, Spearman, CI, and R2 achieved values of 1.221, 1.527, 0.726, 0.713, 0.760, and 0.504, respectively. Turning to DL models, sequence-oriented DL architectures like 1D-CNN and RNN demonstrated relatively weaker performance compared to RF with label encoding. This outcome highlighted that complex DL models didn’t necessarily lead to performance enhancements. However, 1D-CNN relying on one-hot encoding delivered superior performance across all evaluation metrics. This underscored that one-hot encoding provided robust feature representation, enhancing the efficacy of sequence-based DL models. To further enrich the understanding of targets, we incorporated the structural knowledge of targets into the GCN model by characterizing the sequence knowledge of targets as vertex features within the graphs of targets. Empirical findings demonstrated that even a straightforward GCN model with label encoding surpassed RF and 1D-CNN. Notably, when the sequence feature representations of targets employed one-hot encoding, the performance of GCN outshined RF and 1D-CNN. Specifically, the GCN outperformed RF with a reduction of 0.063 in both MAE and RMSE, and exhibited increments of 0.012, 0.016, 0.009, and 0.04 in PCC, Spearman, CI, and R2, respectively. All experimental results stated clearly that the simple GCN model with a baseline feature representation outperformed all sequence-based models. Only using the sequence knowledge of targets to predict DTA limited performance improvement.
3.2. Performance Comparison of Different Graph-Based Models
Although GraphSAGE has demonstrated superior performance as depicted in Table 1, it is important to note that Graph Neural Networks (GNNs) offers an array of models employing diverse approaches to extract features from graphs. Presently, GNNs are broadly categorized into two types: spectral-based GNNs and spatial-based GNNs. Spectral-based GNNs like GCN and ChebyNet operate on Laplacian matrices, focusing on single graphs. However, for the context of this study, ChebyNet was excluded due to interpretability concerns. Diverging from spectral-based models, spatial-based GNNs such as GraphSAGE, GAT and GIN gather knowledge from neighboring vertices directly in the spatial domain.
The methodology entailed initial one-hot encoding of drug SMILES and the sequences of targets, utilizing them as the features of vertices in the respective graphs. Subsequently, four distinct graph-based models were harnessed for DTA prediction. The ensuring comparison of experimental results (Table 2) highlighted that GraphSAGE consistently outperformed the other three models across all evaluation metrics. Particularly striking was its achievement of MAE and RMSE reductions of no less than 0.266 and 0.326 compared to the other models. Moreover, GraphSAGE secured improvements of no less than 0.157, 0.156, 0.071, and 0.219 in PCC, Spearman, CI, and R2, respectively, all of which demonstrated values exceeding the 0.5. This resounding success of GraphSAGE underscored its efficacy in capturing interactions within the tertiary structures of drugs and targets, reinforcing the significance of structural knowledge in DTA prediction.
3.3. Complex Feature Representations Do Not Improve Performance
In addition to employing one-hot encoding, the utilization of complex feature representations for the sequences of drugs and targets could potentially exert a substantial impact on the performance of DTA prediction. Within the scope of this investigation, a variety of complex feature representations were explored for the sequences of targets, encompassing physical-chemical properties of amino acids, PSSM, HMM, Protbert, CNN, and Word2Vec. For drugs, only the physical-chemical properties of atoms were considered. It is noteworthy that when alternative complex feature representations were applied to the sequences of targets, the drug SMILES representation was employed using one-hot encoding.
Experimental results (Table 3) demonstrated that GraphSAGE attained comparable performance across various representations, including one-hot encoding, Protbert, CNN, and Word2Vec. For instance, the key evaluation metrics like RMSE and R2 hovered around 1.4 and 0.5, respectively. However, it's pertinent to acknowledge that generating semantic features for the sequences of targets through complex representations like Protbert, CNN, and Word2Vec can be time-intensive. Despite this investment of time, the performance improvements garnered from these complex representations have not been notably substantial.
3.4. Impact of Pocket Knowledge on Drug-Target Affinity Prediction
As demonstrated by DeepDTAF, pockets played a crucial rule in predicting DTA, and their characteristics directly influenced the binding affinity of drugs with their respective targets. The maximum sequence length for pockets was 125, serving as the fixed sequence length. In cases where the pocket sequences were shorter than 125, padding was applied using zeros. The representation of the sequences of pockets employed one-hot encoding. The structures of pockets were utilized for constructing the graphs, following a methodology consistent with the graph construction of target.
Three distinct experiments were conducted based on the sequences and structures of targets, pockets, and their combination. Experimental results (Table 4) showed that the performance of GraphSAGE utilizing the sequences and structures of targets was comparable to that using the sequences and structures of pockets across all evaluation metrics. Notably, the MAE, RMSE, PCC, Spearman, CI, and R2 exhibited values of approximately 1.1, 1.4, 0.7, 0.7, 0.7, and 0.5, respectively. The distribution plots depicting the real and predictive affinity based on targets and pockets were illustrated in Figure 2. However, noteworthy enhancements were observed in the performance of GraphSAGE when incorporating a combination of the sequences and structures of targets and pockets. As compared to using only the knowledge of targets, the MAE and RMSE exhibited reductions of 0.047 (4.2%) and 0.04 (2.8%), respectively. Moreover, improvements of 0.018 (2.4%) in PCC, 0.028 (3.8%) in Spearman, 0.013 (1.7%) in CI, and 0.024 (4.2%) in R2 were realized. Similarly, in comparison to using only the knowledge of pockets, the MAE and RMSE experienced decreases of 0.021 (1.9%) and 0.43 (3%), while enhancements of 0.017 (2.2%) in PCC, 0.018 (2.4%) in Spearman, 0.009 (1.2%) in CI, and 0.026 (4.6%) in R2 were achieved. The distribution of real and predictive affinity, incorporating both the sequence and structural knowledge of targets and pockets, is visualized in Figure 2.
3.5. Fusing Sequence and Structure Knowledge with Heterogeneous Models
Although the semantic features extracted from the sequences of targets using Protbert, CNN, and Word2Vec did not lead to an improvement in the performance of GraphSAGE, fusing sequence knowledge with CNN to create an end-to-end model could enhance the performance. The process involved employing one-hot encoding for the sequences of targets, which was then fed into a CNN to extract sequence knowledge. This extracted sequence knowledge was utilized as vertex features within the graphs of targets, subsequently combined with the graphs of targets and input into to a three-layer GCN network to extract the fusion knowledge. This approach was also consistently applied to the sequences of pockets, but it would not be used to drug SMILES. Finally, the knowledge extracted from drugs, targets, and pockets by three independent three-layer GCN networks were concatenated and fed into the FC network to predict DTA.
Experimental results (Table 5) demonstrated a significant enhancement in performance by integrating CNN into the model alongside GCN and FC. In comparison to the model without CNN (Table 4), the MAE and RMSE were reduced by 0.090 (8.3%) and 0.078 (5.7%), respectively. Moreover, the PCC, Spearman, CI, and R2 exhibited improvements of 0.025 (3.2%), 0.027 (3.5%), 0.013 (1.6%) and 0.044 (7.4%), respectively. In addition to CNN, several other sequence processing models, such as Long Short-Term Memory (LSTM) [41] and Bidirectional LSTM (BiLSTM) [42], are also capable of extracting sequence knowledge. Extensive experiments were conducted on these commonly utilized sequence processing models, with the findings (Table 5) indicating that integrating sequence knowledge with CNN consistently yielded superior performance. The distribution of predictive affinity resulting from the fusion of sequence knowledge with sequences processing models is depicted in Figure 3.
In summary, the proposed method, denoted as S2DTA, which encompassed CNN, GCN, and FC, exhibited the highest performance by amalgamating sequence and structural knowledge from drugs, targets, and pockets. The process involved extracting the sequence knowledge from the sequences of targets and pockets, incorporating structures and the extracted sequence knowledge from targets and pockets into GCN to attain the high-level fused features. For drugs, high-level features were directly extracted from their sequences and structures through GCN. Ultimately, all of these features were concatenated and fed into a FC network to predict DTA.
3.6. Comparison with State-of-the-Art Methods
To comprehensively assess the predictive capability of S2DTA for DTA prediction, a comparative analysis was conducted against three contemporary deep learning methods: DeepDTA, DeepDTAF, and GraphDTA. Employing the test dataset sourced from the PDBbind database (2016 version), S2DTA emerged as the superior performer across all evaluation metrics (Table 6). Remarkably, the experimental findings unveiled the pronounced superiority of S2DTA, showcasing at least a 25.2% reduction in MAE and a 20.1% decrease in RMSE when compared to the three state-of-the-art methodologies. Additionally, S2DTA exhibited substantial improvements in other vital metrics: PCC, Spearman, CI, and R2, which elevated by a minimum of 19.6%, 17.5%, 8.1%, and an impressive 49.4%, respectively. Through these rigorous experiments, the robustness and reliability of S2DTA as a predictive model for DTA were vividly demonstrated.
3.7. Performance Comparison between the Real Structures and Predictive Structures of Targets
Currently, a significant number of targets possess known sequences but lack clear structures. This limitation hampers the application of S2DTA. However, the emergence of AlphaFold offers the potential to generate high-quality predictive structures of targets. To evaluate the adaptability of S2DTA on these predictive structures of targets, we selected 225 sequences from the test dataset, each with a length of approximately 500 amino acid residues. Employing AlphaFold, we obtained predictive structures for these 225 sequences. The outcomes of S2DTA using both real and predictive structures of targets are presented in Table 7. For S2DTA utilizing the predictive structures of targets, the MAE and RMSE stood at 1.133 (compared to 1.046 with real structures) and 1.432 (1.316), respectively. The PCC, Spearman, CI, and R2 for S2DTA employing the predictive structures of targets were 0.748 (compared to 0.792 with real structures), 0.749 (0.787), 0.78 (0.799), and 0.558 (0.627), respectively. The evaluation metrics collectively indicated that the performance of S2DTA was similar to that when using real structures of targets. S2DTA demonstrated commendable generalization proficiency when using the predictive structures of targets.
3.8. Structure-Based Interpretable Analysis of S2DTA
To explain the effectiveness of S2DTA, we employed a bidirectional self-attention mechanism to extract crucial information regarding drug-target binding affinity. This was done after the pooling operation in S2DTA, resulting in attention score matrices that capture the interactions between drugs and targets. By leveraging the structural knowledge of drugs and targets, we aimed to provide interpretability for the effectiveness of S2DTA. The pockets on the surface of the targets are the primary sites where drug-target interactions take place. Hence, we conducted a structural explanatory analysis of S2DTA by explaining the atoms constituting the drugs and the amino acids present in the targets, using different attention score matrices. For drugs, we computed the binding data between each atom (excluding hydrogen atoms) and all amino acids in the targets. Subsequently, we performed data statistics (Table 8) to determine whether the top 5, top 10, and top 20 amino acids in the attention score matrices were located within the pockets. The statistical findings revealed that the top 5, top 10, and top 20 amino acids within the pockets accounted for 13.7%, 12.8%, and 12.4%, respectively. In the upper row of Figure 4, we showcased the top 10 amino acids (depicted in purple) identified by four drugs (PubChem ID: 43158872, 444128, 44629533, 53308636) within the pockets of their respective targets (PDBID: 3AO4, 1A30, 2QNQ, 3O9I). These proportions were relatively low due to the length of target sequences, which made it challenging to identify any interactions between each atom and the amino acids in the pockets. However, S2DTA demonstrated its ability to effectively identify the amino acids within the pockets that interacted with the atoms. Conversely, we also examined the interaction between each amino acid and all atoms (excluding hydrogen atoms). Statistical analysis (Table 8) was performed on the top 3, top 5, and top 8 atoms in the attention score matrices. Interestingly, these atoms accounted for 48.6%, 56%, and 64.8% of the total number of atoms in the drugs, respectively. The lower row of Figure 4 presented the visualization results of the top 5 atoms (represented by the purple logo) with the highest scores in the interactions between the amino acids constituting the targets and the corresponding drugs. These above statistical results strongly indicated that S2DTA could effectively identify the specific atoms that interacted with the amino acids. Hence, the attention score matrices derived from bidirectional self-attention served as a key explanation for the efficacy of S2DTA in accurately predicting drug-target binding affinity. This underscores the reliability and interpretability of S2DTA as a valuable tool for drug-target affinity prediction.
Discussion and Conclusion
In this study, we proposed S2DTA, a graph-based deep learning model designed to predict DTA with accuracy and interpretability. By leveraging heterogeneous models and fusing sequence and structural knowledge, S2DTA demonstrated novel advancements in DTA prediction. The S2DTA model introduces two main innovations. Firstly, it integrates structural and sequence knowledge from drugs, targets, and pockets. This builds upon previous research which primarily focused on drug SMILES and the sequences of targets, thereby enhancing overall performance of the model. Secondly, the incorporation of structural knowledge not only boosts predictive accuracy but also offers interpretability for DTA. However, it’s important to recognize two limitations of S2DTA.
While AlphaFold, a high-precision structure prediction tool of targets, accurately predicts the tertiary structures based on the sequences of targets, in encounters challenges when dealing with longer sequences of targets in practical applications.
In cases where pocket knowledge for drug-target binding is missing from datasets, precise pocket identification tools or biological experiments become necessary to provide this crucial knowledge.
While S2DTA has demonstrated itself as a remarkably accurate and interpretable predictive model for DTA, its refinement is still underway with a focus on two key aspects: (1) although S2DTA utilizes CNN effectively to extract local sequence knowledge, it will be advanced to incorporate the extraction of long-range dependence knowledge. This expansion will broaden the understanding of intricate relationship of the model within sequences and contribute to its predictive performance; (2) recognizing the substantial impact that surface pocket features have on DTA, S2DTA will undergo further development to extract and integrate these features into its predictive framework.
In summary, the accessibility of drug molecular maps and target tertiary structures has paved the way for exciting prospects in drug-target affinity research. Leveraging the power of CNN, GNN, and 3D-CNN models to extract high-level features from the sequences and structures of drugs and targets, along with complementary fusion of the extracted heterogeneous knowledge, enables us to fully harness the potential of both sequence and structural data. Undoubtedly, the integration of deep learning with the sequence and structure of drugs and targets will emerge as a prominent and promising research direction in the future.
Supplementary Materials
The following supporting information can be downloaded at the website of this paper posted on Preprints.org.
Author Contributions
Xin Zeng: Ideas, Writing-Original Manuscript, Writing-Review&Editing, Writing-Revised Manuscript. Kaiyang Zhong: Creation of models, Data Curation, Implementation of the computer code and supporting algorithms. Bei Jiang: Supervision. Yi Li: Development of methodology, Formal analysis, Writing-Review&Editing, Modification guidance.
Funding
This work was supported by National Natural Sciences Foundation of China (No. 62241602), Yunnan Fundamental Research Projects (No. 202101BA070001-227), and the Yunnan Key Laboratory of Screening and Research on Anti-pathogenic Plant Resources from Western Yunnan (No. APR202110).
Data Availability Statement
The source data and code repository can be accessed at https://github.com/dldxzx/S2DTA.
Conflicts of Interest
There are no conflicts to declare.
References
- Chen, X.; Yan, C.C.; Zhang, X.; Zhang, X.; Dai, F.; Yin, J.; Zhang, Y. Drug–Target Interaction Prediction: Databases, Web Servers and Computational Models. Brief. Bioinform. 2016, 17, 696–712. [Google Scholar] [CrossRef]
- Santos, R.; Ursu, O.; Gaulton, A.; Bento, A.P.; Donadi, R.S.; Bologa, C.G.; Karlsson, A.; Al-Lazikani, B.; Hersey, A.; Oprea, T.I.; et al. A Comprehensive Map of Molecular Drug Targets. Nat. Rev. Drug Discov. 2017, 16, 19–34. [Google Scholar] [CrossRef]
- Mofidifar, S.; Sohraby, F.; Bagheri, M.; Aryapour, H. Repurposing Existing Drugs for New AMPK Activators as a Strategy to Extend Lifespan: A Computer-Aided Drug Discovery Study. Biogerontology 2018, 19, 133–143. [Google Scholar] [CrossRef] [PubMed]
- Du, X.; Li, Y.; Xia, Y.-L.; Ai, S.-M.; Liang, J.; Sang, P.; Ji, X.-L.; Liu, S.-Q. Insights into Protein–Ligand Interactions: Mechanisms, Models, and Methods. Int. J. Mol. Sci. 2016, 17, 144. [Google Scholar] [CrossRef]
- Sehnal, D.; Svobodová Vařeková, R.; Berka, K.; Pravda, L.; Navrátilová, V.; Banáš, P.; Ionescu, C.-M.; Otyepka, M.; Koča, J. MOLE 2.0: Advanced Approach for Analysis of Biomacromolecular Channels. J. Cheminformatics 2013, 5, 39. [Google Scholar] [CrossRef] [PubMed]
- Hu, G.; Li, X.; Zhang, X.; Li, Y.; Ma, L.; Yang, L.-M.; Liu, G.; Li, W.; Huang, J.; Shen, X.; et al. Discovery of Inhibitors To Block Interactions of HIV-1 Integrase with Human LEDGF/P75 via Structure-Based Virtual Screening and Bioassays. J. Med. Chem. 2012, 55, 10108–10117. [Google Scholar] [CrossRef]
- Zhang, H.; Liao, L.; Cai, Y.; Hu, Y.; Wang, H. IVS2vec: A Tool of Inverse Virtual Screening Based on Word2vec and Deep Learning Techniques. Methods 2019, 166, 57–65. [Google Scholar] [CrossRef]
- Abbasi, K.; Razzaghi, P.; Poso, A.; Ghanbari-Ara, S.; Masoudi-Nejad, A. Deep Learning in Drug Target Interaction Prediction: Current and Future Perspectives. Curr. Med. Chem. 2021, 28, 2100–2113. [Google Scholar] [CrossRef] [PubMed]
- Öztürk, H.; Özgür, A.; Ozkirimli, E. DeepDTA: Deep Drug–Target Binding Affinity Prediction. Bioinformatics 2018, 34, i821–i829. [Google Scholar] [CrossRef]
- Wang, K.; Zhou, R.; Li, Y.; Li, M. DeepDTAF: A Deep Learning Method to Predict Protein–Ligand Binding Affinity. Brief. Bioinform. 2021, 22, bbab072. [Google Scholar] [CrossRef]
- Nguyen, T.; Le, H.; Quinn, T.P.; Nguyen, T.; Le, T.D.; Venkatesh, S. GraphDTA: Predicting Drug–Target Binding Affinity with Graph Neural Networks. Bioinformatics 2021, 37, 1140–1147. [Google Scholar] [CrossRef] [PubMed]
- Ain, Q.U.; Aleksandrova, A.; Roessler, F.D.; Ballester, P.J. Machine-Learning Scoring Functions to Improve Structure-Based Binding Affinity Prediction and Virtual Screening: Machine-Learning SFs to Improve Structure-Based Binding Affinity Prediction and Virtual Screening. Wiley Interdiscip. Rev. Comput. Mol. Sci. 2015, 5, 405–424. [Google Scholar] [CrossRef] [PubMed]
- Kimber, T.B.; Chen, Y.; Volkamer, A. Deep Learning in Virtual Screening: Recent Applications and Developments. Int. J. Mol. Sci. 2021, 22, 4435. [Google Scholar] [CrossRef] [PubMed]
- Karimi, M.; Wu, D.; Wang, Z.; Shen, Y. DeepAffinity: Interpretable Deep Learning of Compound–Protein Affinity through Unified Recurrent and Convolutional Neural Networks. Bioinformatics 2019, 35, 3329–3338. [Google Scholar] [CrossRef] [PubMed]
- Yuan, W.; Chen, G.; Chen, C.Y.-C. FusionDTA: Attention-Based Feature Polymerizer and Knowledge Distillation for Drug-Target Binding Affinity Prediction. Brief. Bioinform. 2022, 23, bbab506. [Google Scholar] [CrossRef]
- Öztürk, H.; Ozkirimli, E.; Özgür, A. WideDTA: Prediction of Drug-Target Binding Affinity. 10.48550/arXiv.1902.04166. [CrossRef]
- Zhao, Q.; Duan, G.; Yang, M.; Cheng, Z.; Li, Y.; Wang, J. AttentionDTA: Drug-Target Binding Affinity Prediction by Sequence-Based Deep Learning with Attention Mechanism. IEEE/ACM Trans. Comput. Biol. Bioinform. [CrossRef]
- Abbasi, K.; Razzaghi, P.; Poso, A.; Amanlou, M.; Ghasemi, J.B.; Masoudi-Nejad, A. DeepCDA: Deep Cross-Domain Compound–Protein Affinity Prediction through LSTM and Convolutional Neural Networks. Bioinformatics 2020, 36, 4633–4642. [Google Scholar] [CrossRef]
- Zhang, L.; Wang, C.-C.; Chen, X. Predicting Drug–Target Binding Affinity through Molecule Representation Block Based on Multi-Head Attention and Skip Connection. Brief. Bioinform. 2022, 23, bbac468. [Google Scholar] [CrossRef]
- Kang, L.; Ye, P.; Li, Y.; Doermann, D. Convolutional Neural Networks for No-Reference Image Quality Assessment. In Proceedings of the 2014 IEEE Conference on Computer Vision and Pattern Recognition; IEEE: Columbus, OH, USA, June, 2014; pp. 1733–1740. [Google Scholar]
- Cho, K.; van Merrienboer, B.; Gulcehre, C.; Bahdanau, D.; Bougares, F.; Schwenk, H.; Bengio, Y. Learning Phrase Representations Using RNN Encoder–Decoder for Statistical Machine Translation. In Proceedings of the Proceedings of the 2014 Conference on Empirical Methods in Natural Language Processing (EMNLP); Association for Computational Linguistics: Doha, Qatar, 2014; pp. 1724–1734. [Google Scholar]
- Vaswani, A.; Shazeer, N.; Parmar, N.; Uszkoreit, J.; Jones, L.; Gomez, A.N.; Kaiser, L.; Polosukhin, I. Attention Is All You Need 2017.
- Yu, F.; Koltun, V. Multi-Scale Context Aggregation by Dilated Convolutions. In Proceedings of the ICLR; 2016. [Google Scholar]
- Yang, Z.; Zhong, W.; Zhao, L.; Yu-Chian Chen, C. MGraphDTA: Deep Multiscale Graph Neural Network for Explainable Drug–Target Binding Affinity Prediction. Chem. Sci. 2022, 13, 816–833. [Google Scholar] [CrossRef]
- Jiang, M.; Li, Z.; Zhang, S.; Wang, S.; Wang, X.; Yuan, Q.; Wei, Z. Drug–Target Affinity Prediction Using Graph Neural Network and Contact Maps. RSC Adv. 2020, 10, 20701–20712. [Google Scholar] [CrossRef]
- Bronstein, M.M.; Bruna, J.; LeCun, Y.; Szlam, A.; Vandergheynst, P. Geometric Deep Learning: Going beyond Euclidean Data. IEEE Signal Process. Mag. 2017, 34, 18–42. [Google Scholar] [CrossRef]
- Jumper, J.; Evans, R.; Pritzel, A.; Green, T.; Figurnov, M.; Ronneberger, O.; Tunyasuvunakool, K.; Bates, R.; Žídek, A.; Potapenko, A.; et al. Highly Accurate Protein Structure Prediction with AlphaFold. Nature 2021, 596, 583–589. [Google Scholar] [CrossRef]
- Wang, R.; Fang, X.; Lu, Y.; Yang, C.-Y.; Wang, S. The PDBbind Database: Methodologies and Updates. J. Med. Chem. 2005, 48, 4111–4119. [Google Scholar] [CrossRef]
- Cock, P.J.A.; Antao, T.; Chang, J.T.; Chapman, B.A.; Cox, C.J.; Dalke, A.; Friedberg, I.; Hamelryck, T.; Kauff, F.; Wilczynski, B.; et al. Biopython: Freely Available Python Tools for Computational Molecular Biology and Bioinformatics. Bioinformatics 2009, 25, 1422–1423. [Google Scholar] [CrossRef]
- Weininger, D. SMILES, a Chemical Language and Information System. 1. Introduction to Methodology and Encoding Rules. J. Chem. Inf. Model. 1988, 28, 31–36. [Google Scholar] [CrossRef]
- Jong Cheol Jeong; Xiaotong Lin; Xue-Wen Chen On Position-Specific Scoring Matrix for Protein Function Prediction. IEEE/ACM Trans. Comput. Biol. Bioinform. 2011, 8, 308–315. [CrossRef]
- Remmert, M.; Biegert, A.; Hauser, A.; Söding, J. HHblits: Lightning-Fast Iterative Protein Sequence Searching by HMM-HMM Alignment. Nat. Methods 2012, 9, 173–175. [Google Scholar] [CrossRef] [PubMed]
- Zhang, Y.; Zhu, G.; Li, K.; Li, F.; Huang, L.; Duan, M.; Zhou, F. HLAB: Learning the BiLSTM Features from the ProtBert-Encoded Proteins for the Class I HLA-Peptide Binding Prediction. Brief. Bioinform. 2022, 23, bbac173. [Google Scholar] [CrossRef] [PubMed]
- Adjuik, T.A.; Ananey-Obiri, D. Word2vec Neural Model-Based Technique to Generate Protein Vectors for Combating COVID-19: A Machine Learning Approach. Int. J. Inf. Technol. 2022, 14, 3291–3299. [Google Scholar] [CrossRef] [PubMed]
- Isola, P.; Zhu, J.-Y.; Zhou, T.; Efros, A.A. Image-to-Image Translation with Conditional Adversarial Networks. In Proceedings of the 2017 IEEE Conference on Computer Vision and Pattern Recognition (CVPR); IEEE: Honolulu, HI, July, 2017; pp. 5967–5976. [Google Scholar]
- Tang, Z.; Luo, L.; Xie, B.; Zhu, Y.; Zhao, R.; Bi, L.; Lu, C. Automatic Sparse Connectivity Learning for Neural Networks. IEEE Trans. Neural Netw. Learn. Syst. 2022, 1–15. [Google Scholar] [CrossRef]
- Defferrard, M.; Bresson, X.; Vandergheynst, P. Convolutional Neural Networks on Graphs with Fast Localized Spectral Filtering. In Proceedings of the Advances in Neural Information Processing Systems; 2016; pp. 3844–3852. [Google Scholar]
- Hamilton, W.; Ying, Z.; Leskovec, J. Inductive Representation Learning on Large Graphs. In Proceedings of the Advances in Neural Information Processing Systems; Guyon, I., Luxburg, U.V., Bengio, S., Wallach, H., Fergus, R., Vishwanathan, S., Garnett, R., Eds.; Curran Associates, Inc., 2017; Vol. 30; pp. 1024–1034. [Google Scholar]
- Xie, Y.; Zhang, Y.; Gong, M.; Tang, Z.; Han, C. MGAT: Multi-View Graph Attention Networks. Neural Netw. 2020, 132, 180–189. [Google Scholar] [CrossRef] [PubMed]
- Xu, K.; Hu, W.; Leskovec, J.; Jegelka, S. HOW POWERFUL ARE GRAPH NEURAL NETWORKS? Int. Conf. Learn. Represent. 2019. [Google Scholar]
- Zhang, J.; Zhu, M.; Qian, Y. Protein2vec: Predicting Protein-Protein Interactions Based on LSTM. IEEE/ACM Trans. Comput. Biol. Bioinform. [CrossRef]
- Wei, B.; Zhang, Y.; Gong, X. DeepLPI: A Novel Deep Learning-Based Model for Protein–Ligand Interaction Prediction for Drug Repurposing. Sci. Rep. 2022, 12, 18200. [Google Scholar] [CrossRef] [PubMed]
Figure 1.
Architecture of S2DTA. S2DTA is an advanced model designed to predict drug-target affinity (DTA) by leveraging sequence and structural knowledge from drugs, targets, and pockets. This model comprises four essential modules: (1) Data input module was responsible for representing the sequence and structural data of drugs, targets, and pockets. (2) Within sequence learning module, a 1D-CNN layer was employed to extract semantic features from both targets and pockets, based on their sequence data. (3) In structure learning module, three independent Graph Convolutional Networks (GCNs) were employed to extract high-level features from the vertices present in the graph-based representation of drugs, targets, and pockets. (4) Feature fusion module encompassed a two-layer fully connected (FC) network, which played a pivotal role in predicting DTA by integrating the extracted features.
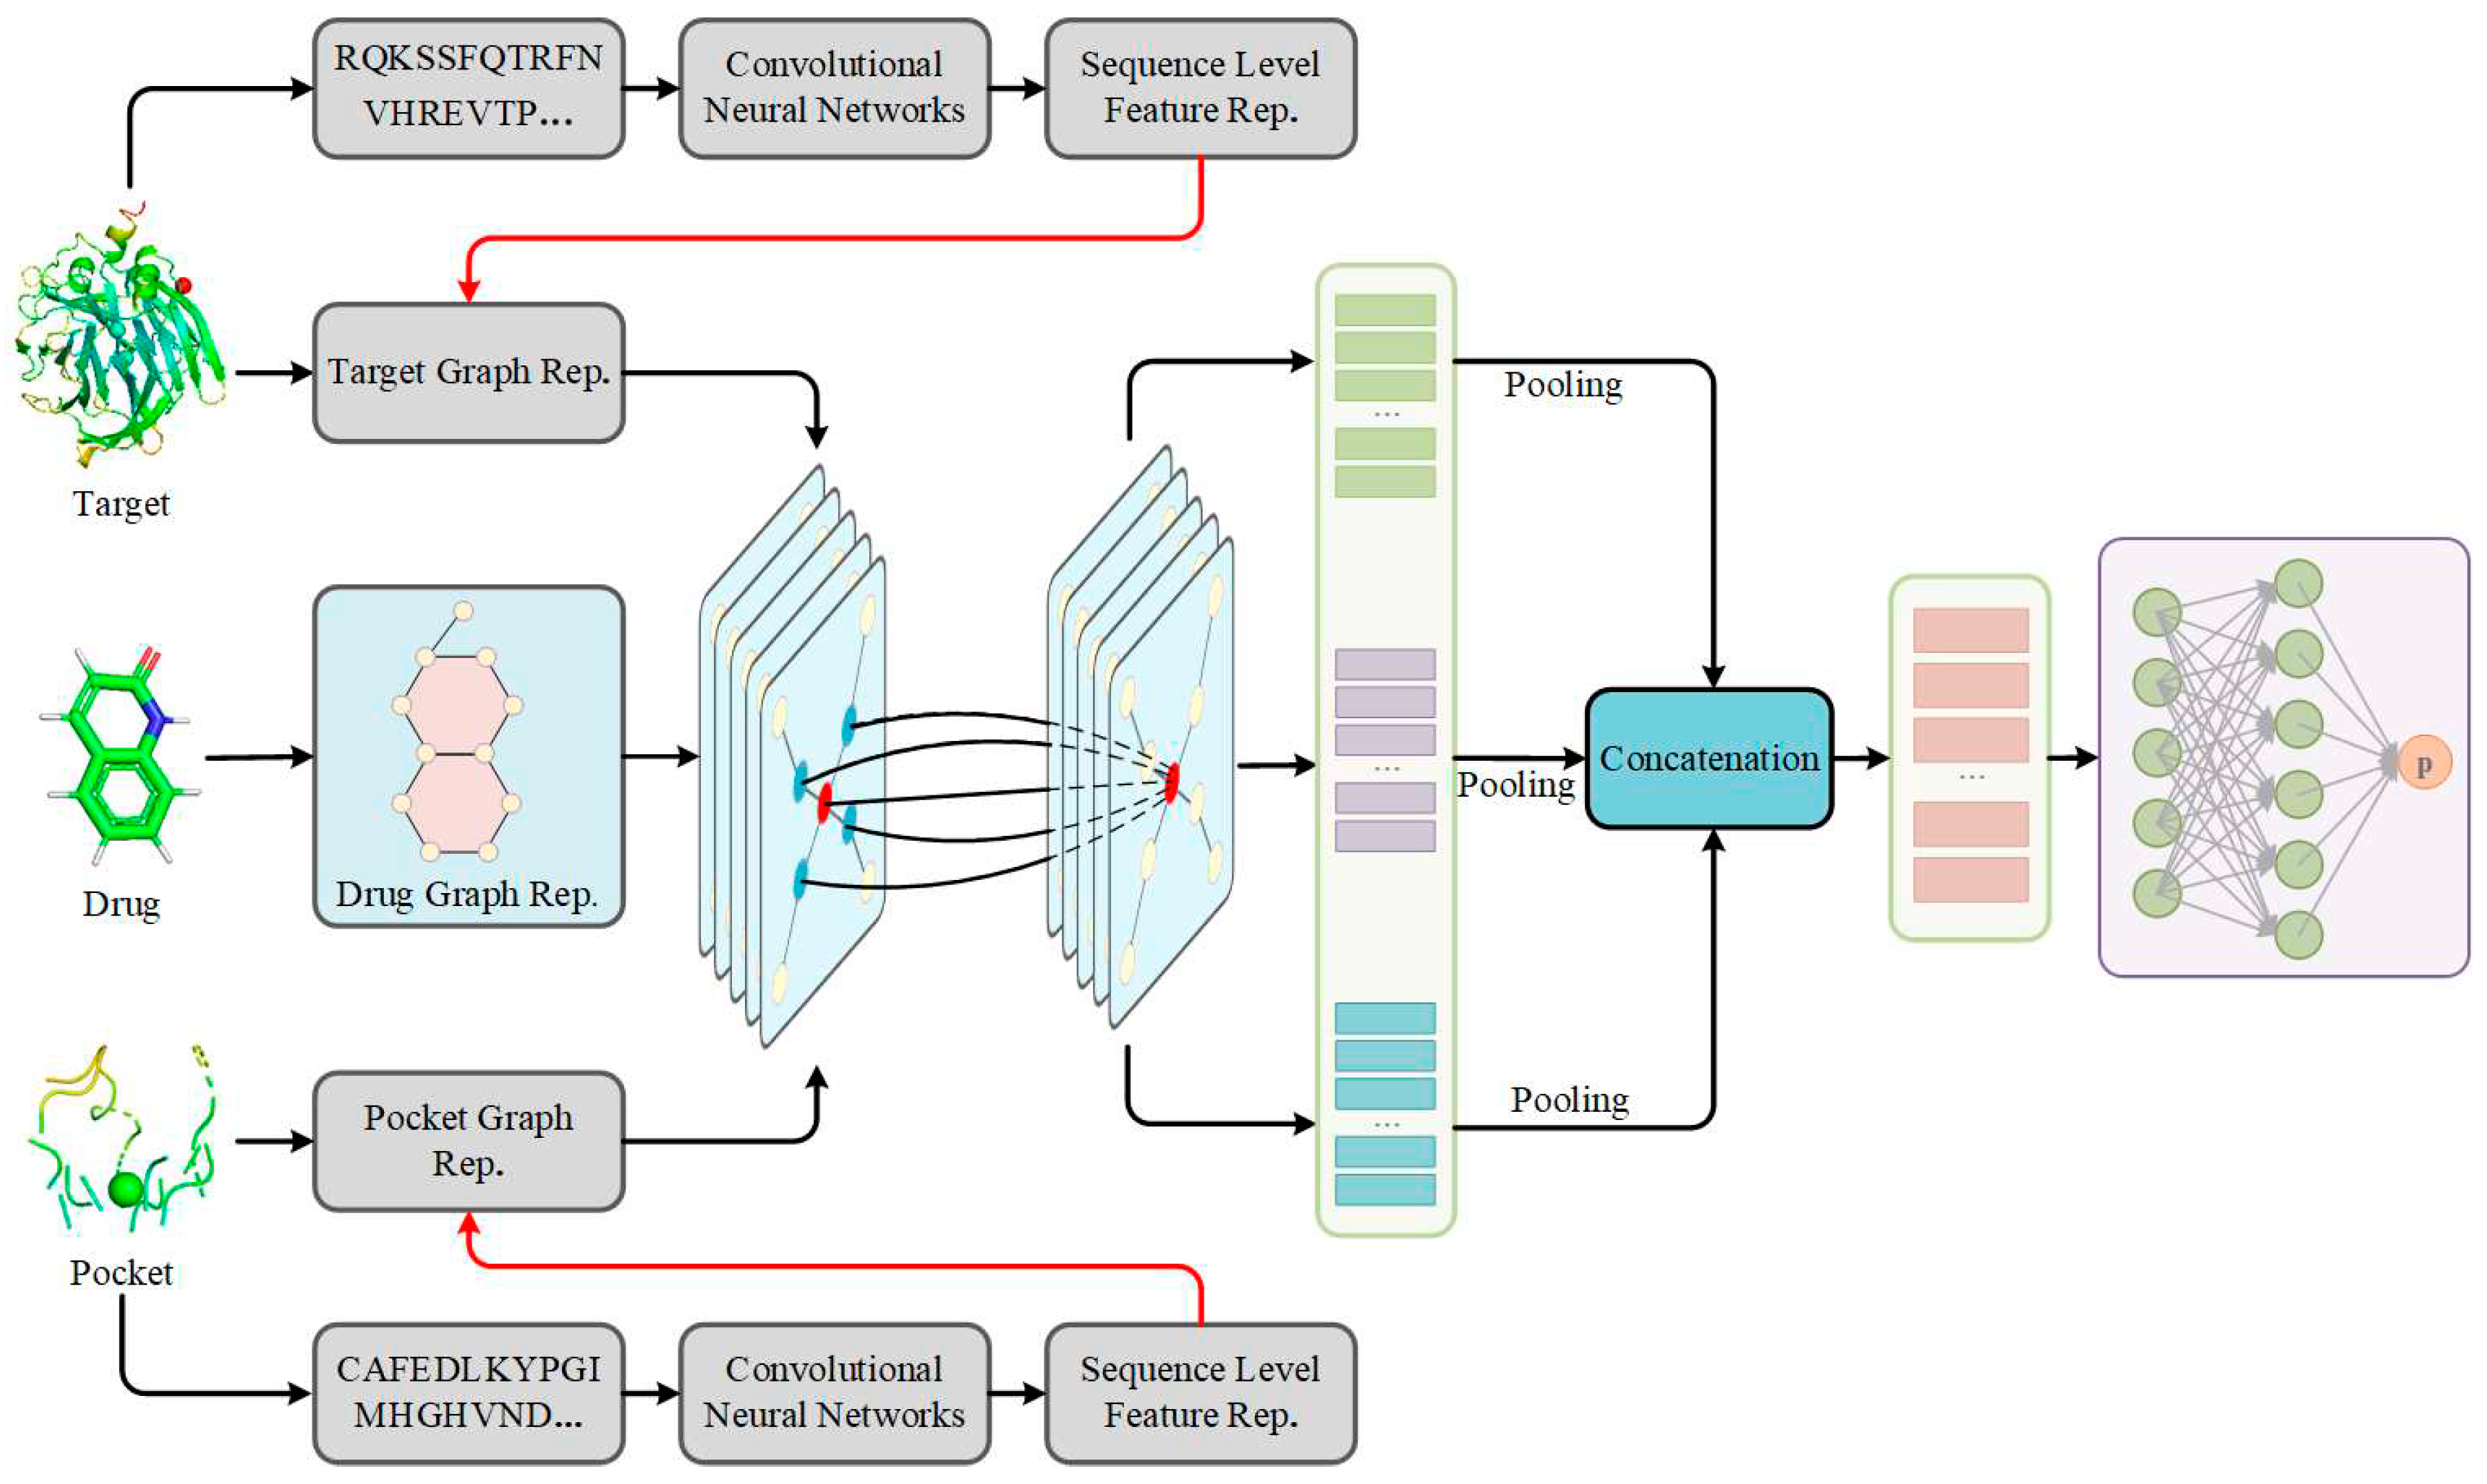
Figure 2.
The distribution of real and predictive affinity of GraphSAGE with targets, pockets, and their combination. The performance of GraphSAGE, when harnessed in conjunction with both the sequence and structural knowledge of targets and pockets, surpassed that achieved by solely relying on the sequence and structural knowledge of targets or pockets individually.
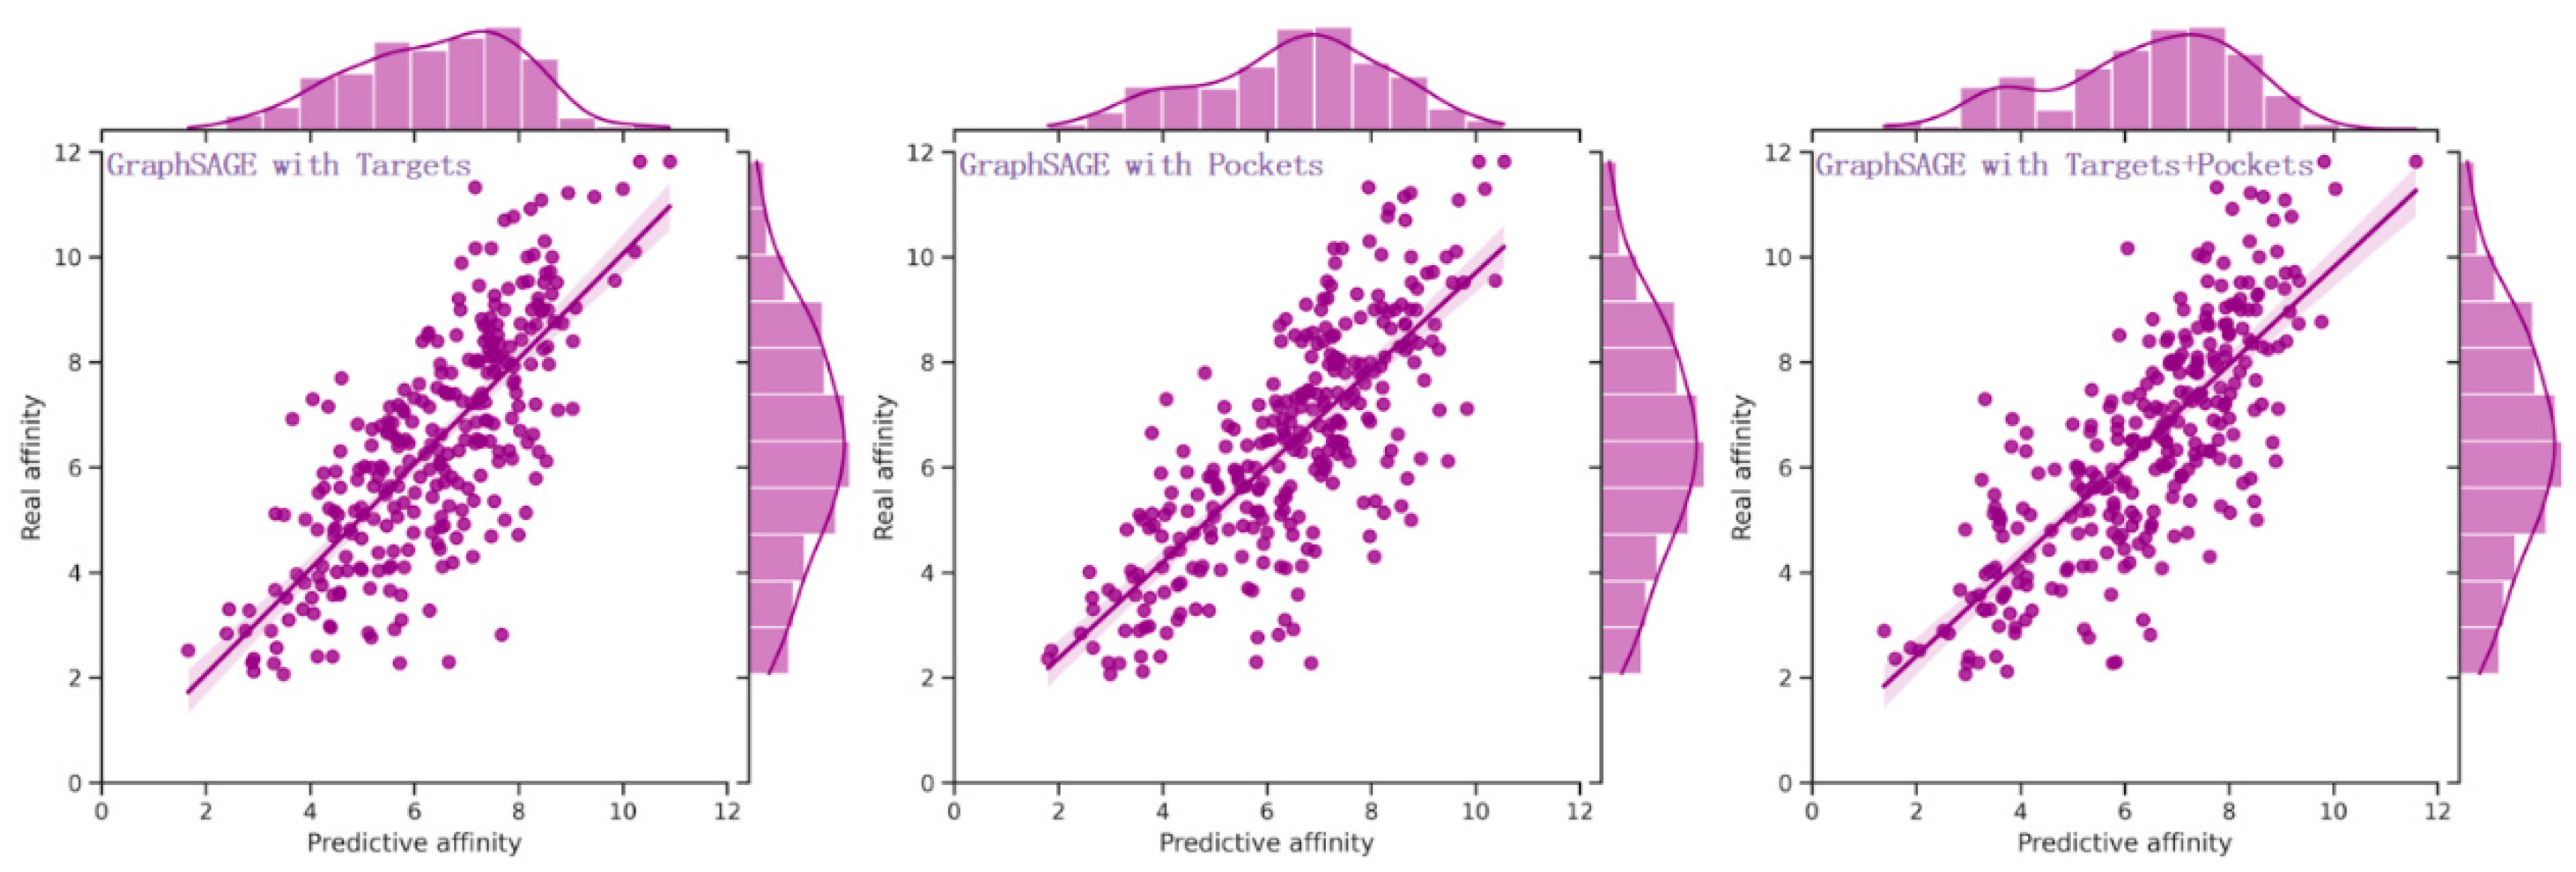
Figure 3.
The distribution of real and predictive affinity of heterogeneous models to fuse sequence and structural knowledge from drugs, targets, and pockets. Among multiple sequence processing models, including CNN, LSTM, BiLSTM, and their combinations, the end-to-end heterogeneous model composed of CNN and GCN exhibited the best performance.
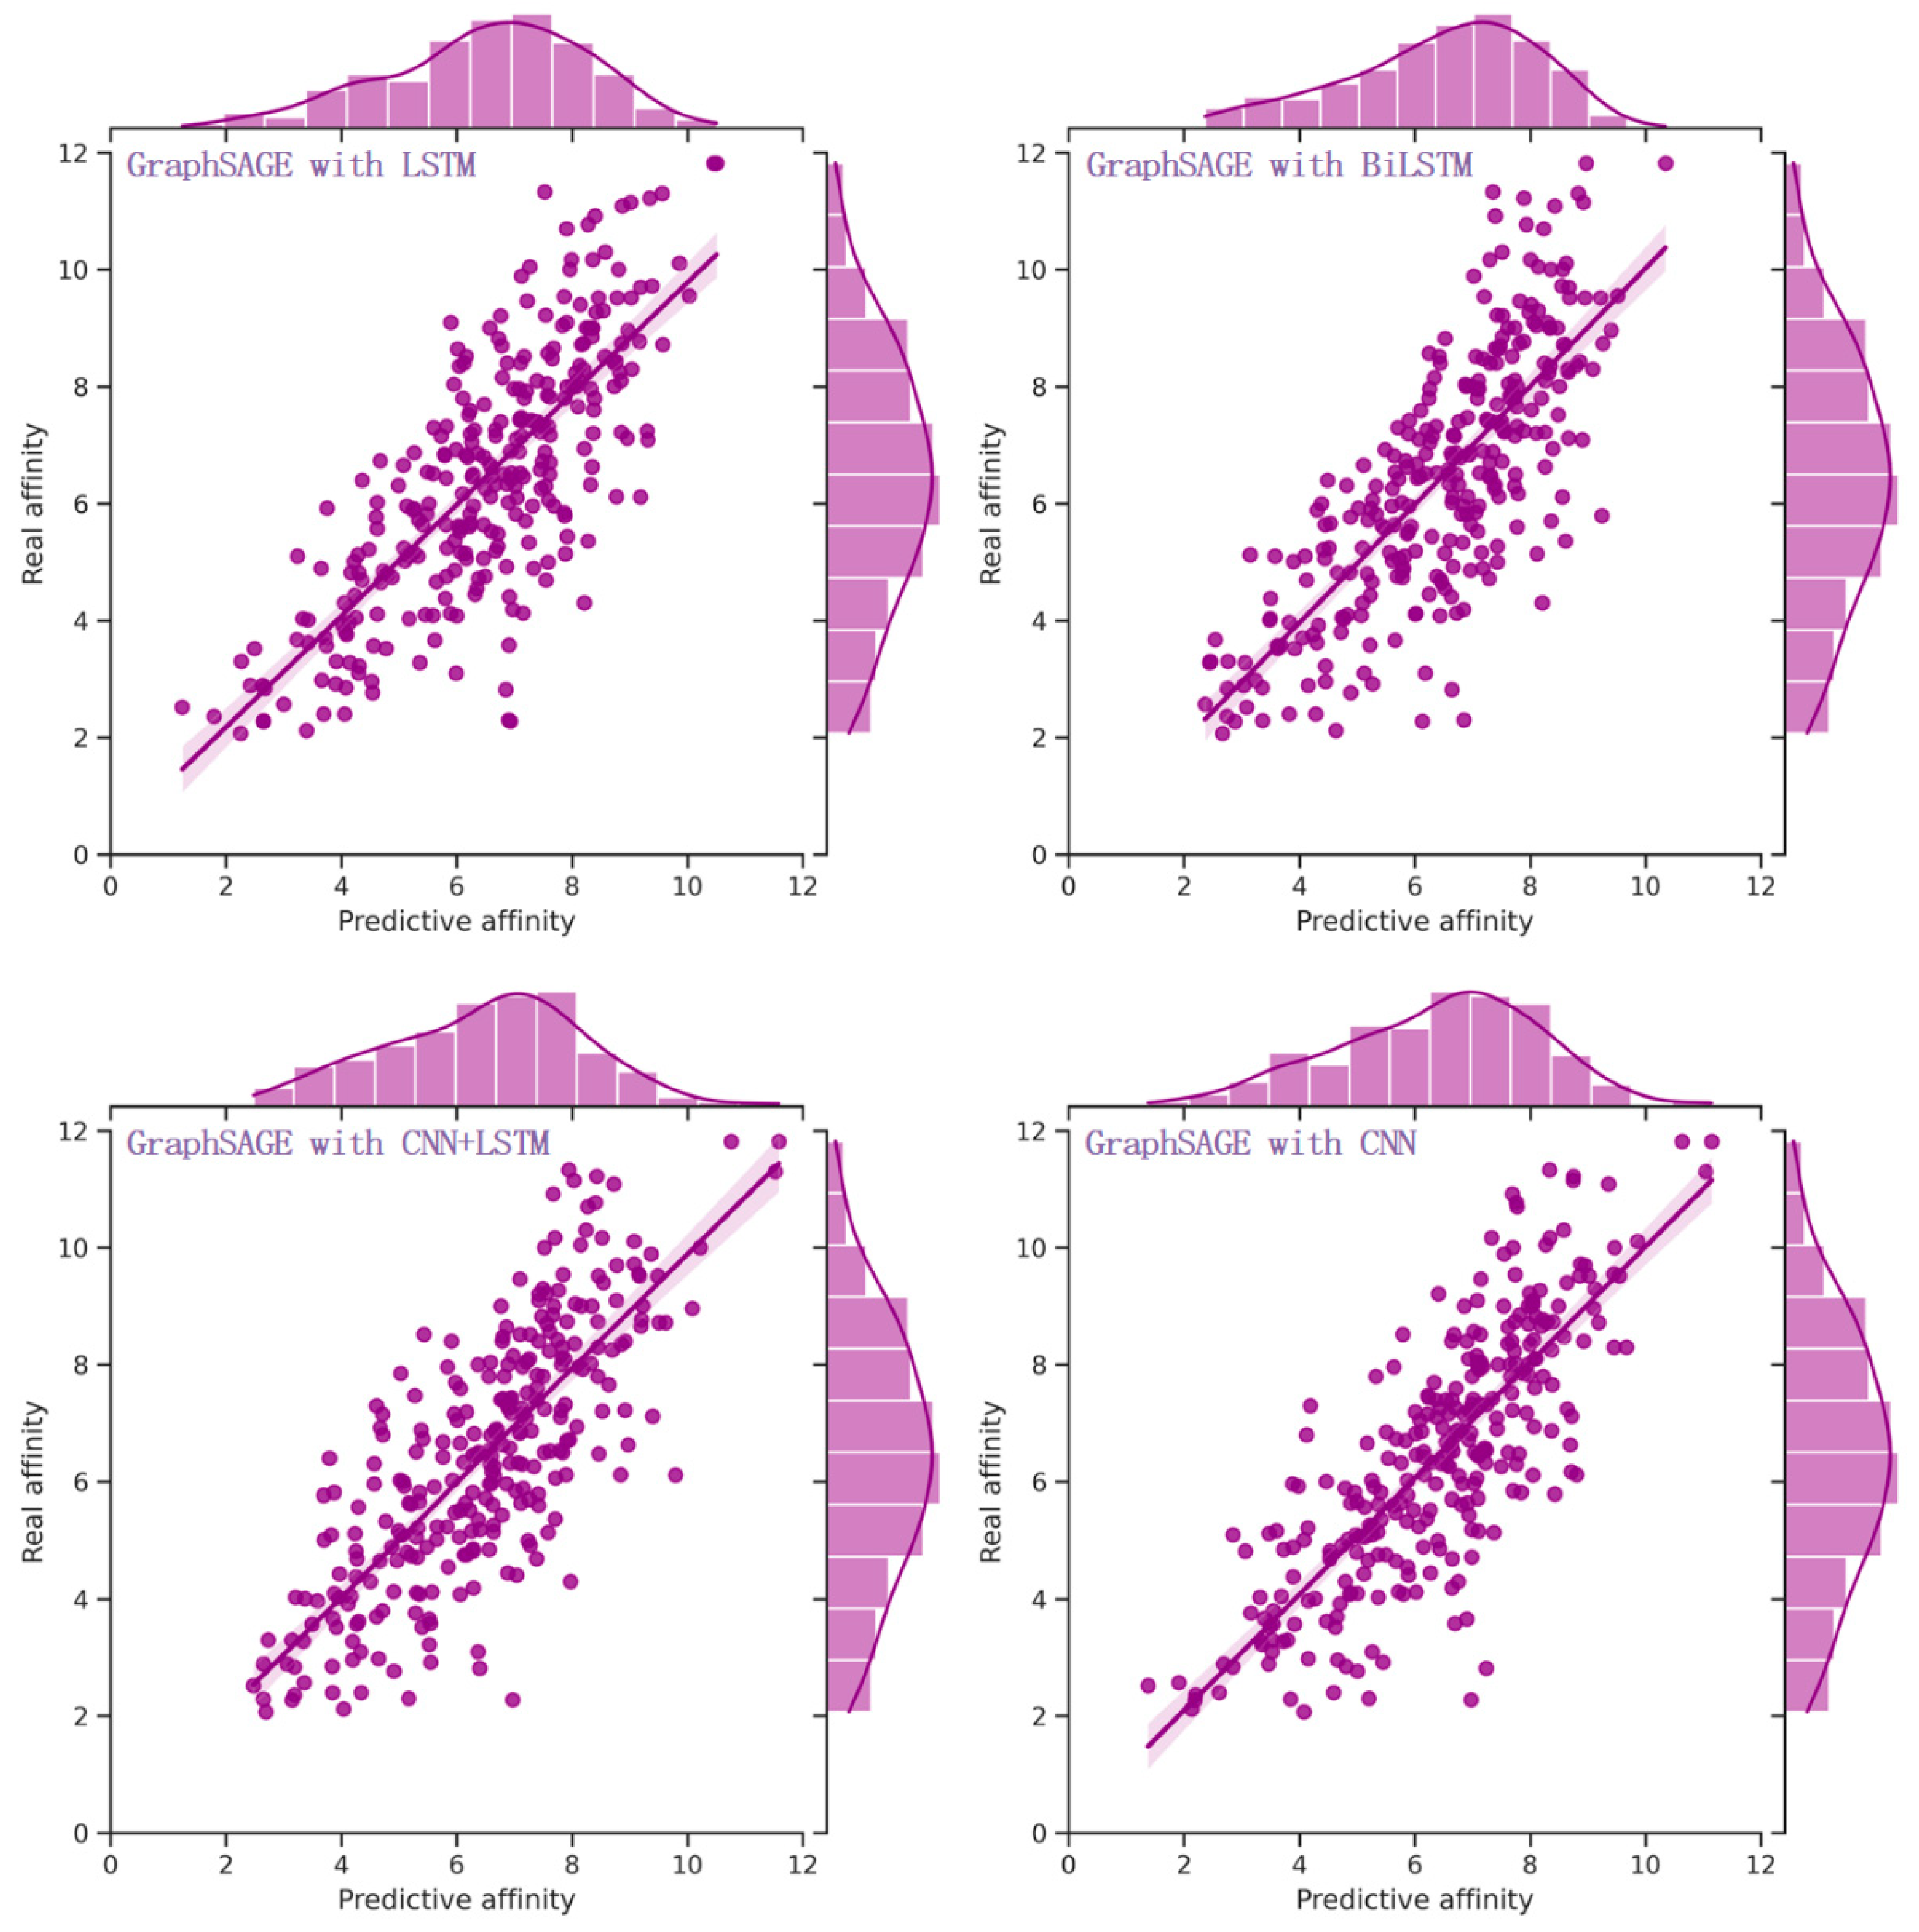
Figure 4.
The visualization results of drug-target binding affinity by a bidirectional self-attention mechanism for explaining the effectiveness of S2DTA. (a) In the upper row, we showcased the top 10 amino acids (depicted in purple) identified by four drugs (PubChem ID: 43158872, 444128, 44629533, 53308636) within the pockets of their respective targets (PDBID: 3AO4, 1A30, 2QNQ, 3O9I). (b) The lower row presented the visualization results of the top 5 atoms (represented by the purple logo) with the highest scores in the interactions between the amino acids constituting the targets and the corresponding drugs.
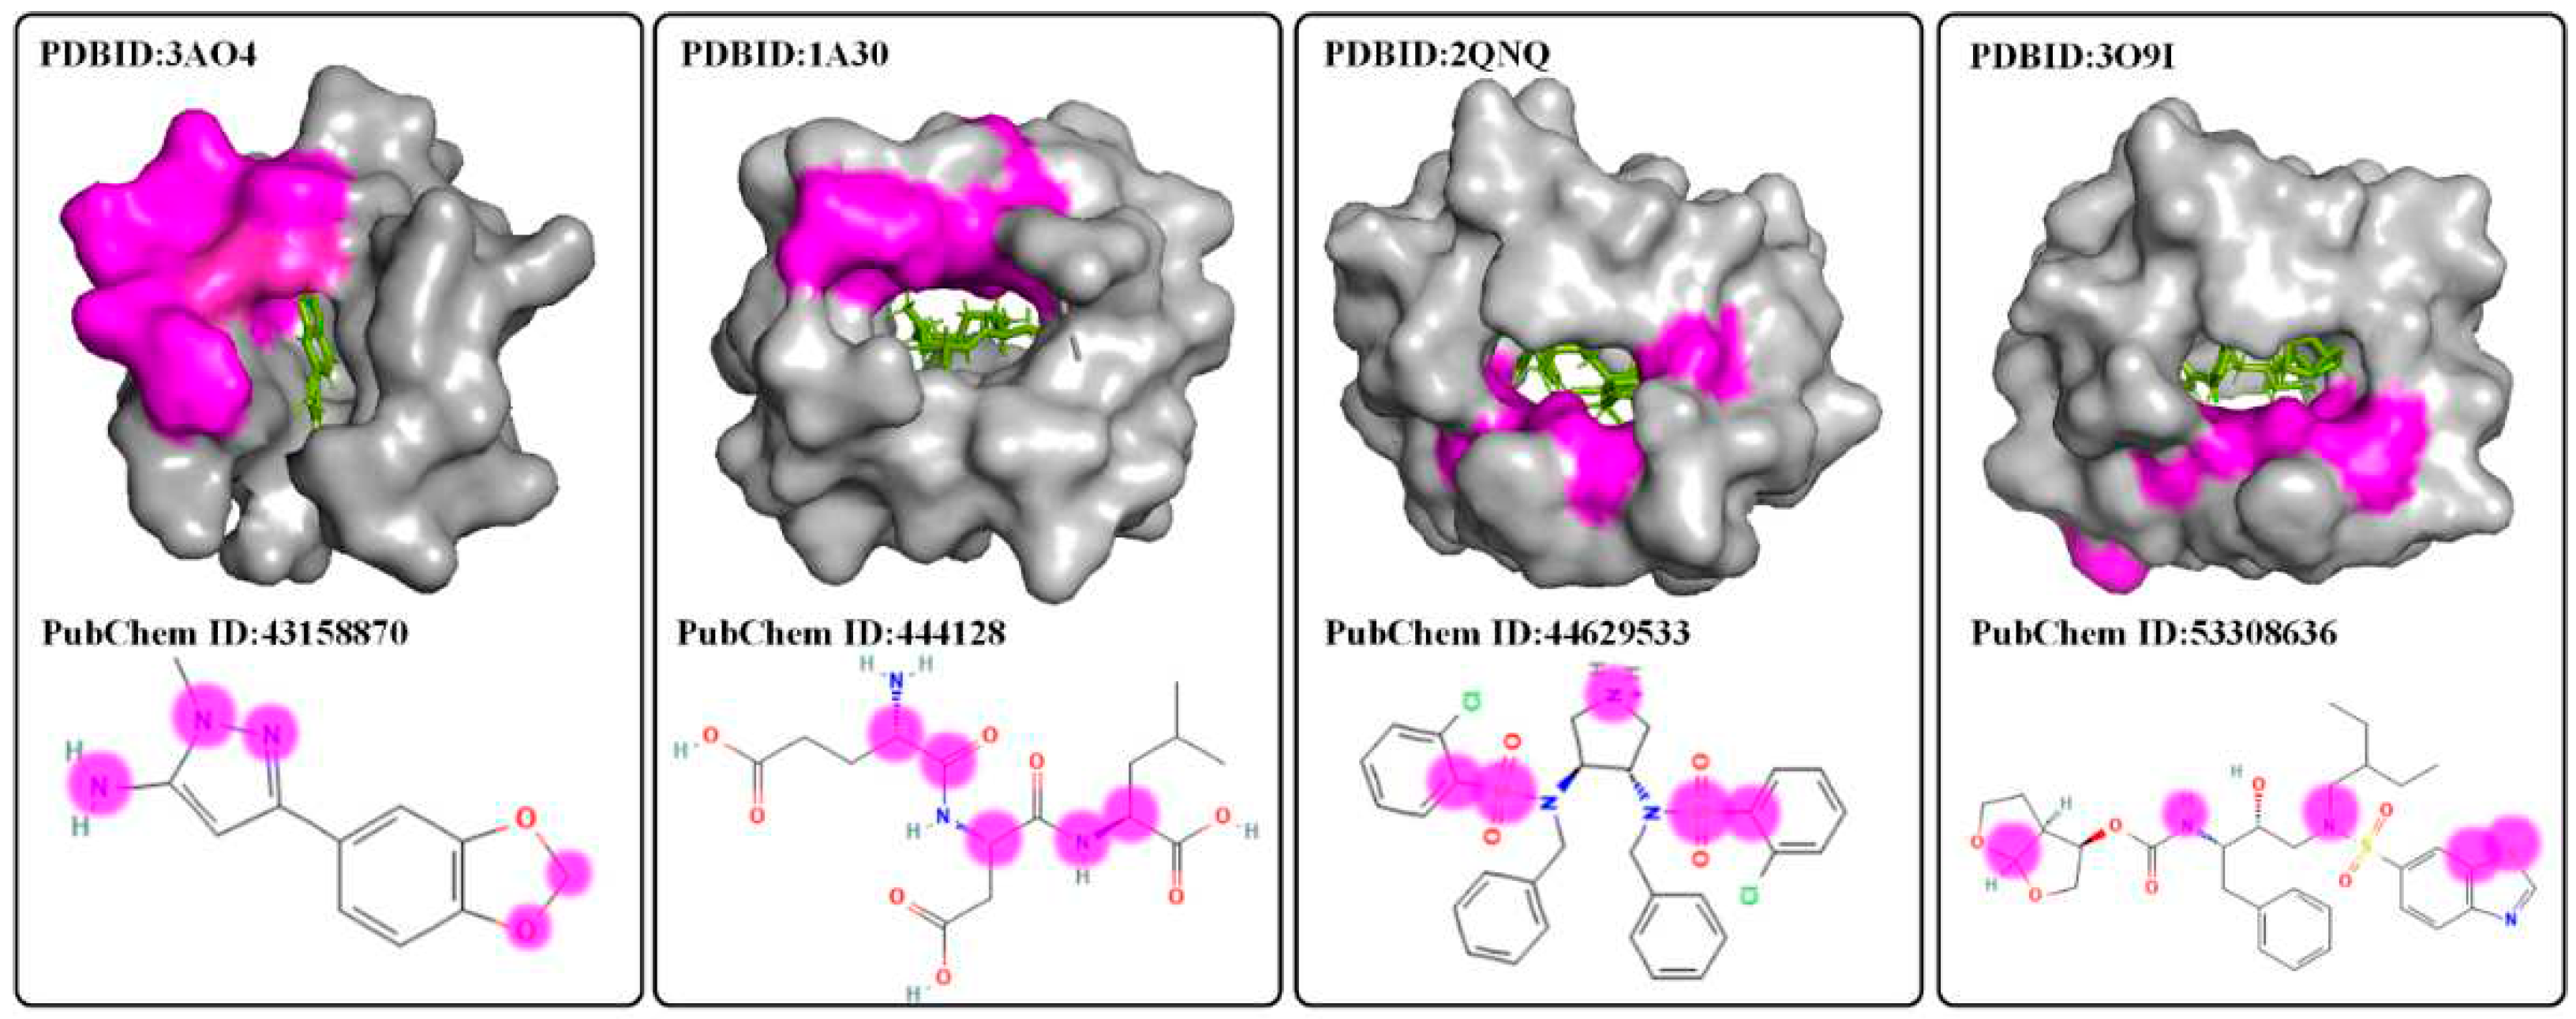

Table 1.
Performance of machine learning and deep learning models using only sequence knowledge compared to graph-based models fusing structure knowledge.
Table 1.
Performance of machine learning and deep learning models using only sequence knowledge compared to graph-based models fusing structure knowledge.
| Category | Model | Feature representation | MAE | RMSE | PCC | Spearman | CI | R2 |
|---|---|---|---|---|---|---|---|---|
| Machine learning models | RR | label encoding | 1.471 | 1.864 | 0.515 | 0.521 | 0.685 | 0.261 |
| KNN | label encoding | 1.377 | 1.732 | 0.604 | 0.565 | 0.703 | 0.362 | |
| DT | label encoding | 1.409 | 1.882 | 0.590 | 0.577 | 0.707 | 0.247 | |
| SVR | label encoding | 1.749 | 2.150 | 0.156 | 0.231 | 0.527 | 0.017 | |
| RF | label encoding | 1.221 | 1.527 | 0.726 | 0.713 | 0.760 | 0.504 | |
| Sequence-based deep learning models | 1D-CNN | label encoding | 1.569 | 1.938 | 0.535 | 0.531 | 0.683 | 0.201 |
| one-hot encoding | 1.159 | 1.473 | 0.752 | 0.741 | 0.776 | 0.539 | ||
| RNN | label encoding | 1.815 | 2.227 | 0.175 | 0.329 | 0.611 | -0.054 | |
| one-hot encoding | 1.669 | 2.045 | 0.459 | 0.460 | 0.657 | 0.111 | ||
| Structure-based deep learning models | GraphSAGE | label encoding | 1.288 | 1.599 | 0.675 | 0.664 | 0.739 | 0.449 |
| one-hot encoding | 1.127 | 1.417 | 0.758 | 0.745 | 0.778 | 0.573 |
Table 2.
Performance comparison of different graph-based models.
| Model | Feature representation | MAE | RMSE | PCC | Spearman | CI | R2 |
|---|---|---|---|---|---|---|---|
| GCN | one-hot encoding | 1.393 | 1.743 | 0.601 | 0.589 | 0.707 | 0.354 |
| GIN | one-hot encoding | 1.524 | 1.842 | 0.532 | 0.549 | 0.692 | 0.279 |
| GAT | one-hot encoding | 1.708 | 2.091 | 0.296 | 0.313 | 0.606 | 0.070 |
| GraphSAGE | one-hot encoding | 1.127 | 1.417 | 0.758 | 0.745 | 0.778 | 0.573 |
Table 3.
Performance comparison of GraphSAGE with different feature representations.
| Feature representation | MAE | RMSE | PCC | Spearman | CI | R2 |
|---|---|---|---|---|---|---|
| one-hot encoding | 1.127 | 1.417 | 0.758 | 0.745 | 0.778 | 0.573 |
| physical-chemical properties | 1.444 | 1.770 | 0.583 | 0.585 | 0.706 | 0.334 |
| PSSM | 1.236 | 1.526 | 0.722 | 0.713 | 0.761 | 0.505 |
| HMM | 1.342 | 1.664 | 0.644 | 0.639 | 0.729 | 0.411 |
| semantic feature (Protbert) | 1.139 | 1.485 | 0.734 | 0.720 | 0.768 | 0.531 |
| semantic feature (CNN) | 1.158 | 1.477 | 0..733 | 0.723 | 0.769 | 0.536 |
| semantic feature (Word2Vec) | 1.136 | 1.411 | 0.760 | 0.746 | 0.777 | 0.577 |
Table 4.
Performance comparison of GraphSAGE with targets or combining the knowledge of pockets.
| Name | MAE | RMSE | PCC | Spearman | CI | R2 |
|---|---|---|---|---|---|---|
| Targets | 1.127 | 1.417 | 0.758 | 0.745 | 0.778 | 0.573 |
| Pockets | 1.101 | 1.420 | 0.759 | 0.755 | 0.782 | 0.571 |
| Targets+Pockets | 1.080 | 1.377 | 0.776 | 0.773 | 0.791 | 0.597 |
Table 5.
Performance comparison of heterogeneous models with fused sequence and structural knowledge.
Table 5.
Performance comparison of heterogeneous models with fused sequence and structural knowledge.
| Sequence processing model | Structural model | MAE | RMSE | PCC | Spearman | CI | R2 |
|---|---|---|---|---|---|---|---|
| LSTM | GraphSAGE | 1.084 | 1.397 | 0.766 | 0.749 | 0.781 | 0.585 |
| BiLSTM | 1.100 | 1.399 | 0.764 | 0.765 | 0.785 | 0.584 | |
| CNN+LSTM | 1.075 | 1.370 | 0.776 | 0.771 | 0.789 | 0.601 | |
| CNN | 0.990 | 1.299 | 0.801 | 0.800 | 0.804 | 0.641 |
Table 6.
Performance comparison of S2DTA with three state-of-the-art methods.
| Model | MAE | RMSE | PCC | Spearman | CI | R2 |
|---|---|---|---|---|---|---|
| DeepDTA | 1.323 | 1.641 | 0.667 | 0.681 | 0.744 | 0.428 |
| GraphDTA | 1.367 | 1.715 | 0.618 | 0.612 | 0.717 | 0.374 |
| DeepDTAF | 1.327 | 1.625 | 0.670 | 0.654 | 0.734 | 0.429 |
| S2DTA | 0.990 | 1.299 | 0.801 | 0.800 | 0.804 | 0.641 |
Table 7.
Performance comparison of S2DTA based on the real and predictive structures of targets.
| Model | Structures of targets | MAE | RMSE | PCC | Spearman | CI | R2 |
|---|---|---|---|---|---|---|---|
| S2DTA | Real structures | 1.046 | 1.316 | 0.792 | 0.787 | 0.799 | 0.627 |
| Predictive structures | 1.133 | 1.432 | 0.748 | 0.749 | 0.780 | 0.558 |
Table 8.
Data statistics for interpretability analysis of S2DTA.
| Atoms of drugs | Amino acids of targets | ||||
|---|---|---|---|---|---|
| Top 5 | Top 10 | Top 20 | Top 3 | Top 5 | Top 8 |
| 13.7% | 12.8% | 12.4% | 48.6% | 56% | 64.8% |
Disclaimer/Publisher’s Note: The statements, opinions and data contained in all publications are solely those of the individual author(s) and contributor(s) and not of MDPI and/or the editor(s). MDPI and/or the editor(s) disclaim responsibility for any injury to people or property resulting from any ideas, methods, instructions or products referred to in the content. |
© 2023 by the authors. Licensee MDPI, Basel, Switzerland. This article is an open access article distributed under the terms and conditions of the Creative Commons Attribution (CC BY) license (https://creativecommons.org/licenses/by/4.0/).
Copyright: This open access article is published under a Creative Commons CC BY 4.0 license, which permit the free download, distribution, and reuse, provided that the author and preprint are cited in any reuse.


